Period ended June 30, 2023
Cautionary Statement Regarding Forward-Looking Statements This presentation may contain forward-looking statements (including within the meaning of the Private Securities Litigation Reform Act of 1995) concerning International Game Technology PLC and its consolidated subsidiaries (the “Company”) and other matters. These statements may discuss goals, intentions, and expectations as to future plans, transactions, trends, events, dividends, results of operations, and/or financial condition and measures, or otherwise, based on current beliefs of the management of the Company as well as assumptions made by, and information currently available to, such management. Forward-looking statements may be accompanied by words such as “aim,” “anticipate,” “believe,” “plan,” “could,” “would,” “should,” “shall”, “continue,” “estimate,” “expect,” “forecast,” “future,” “guidance,” “intend,” “may,” “will,” “possible,” “potential,” “predict,” “project” or the negative or other variations of them. These forward-looking statements speak only as of the date on which such statements are made and are subject to various risks and uncertainties, many of which are outside the Company’s control. Should one or more of these risks or uncertainties materialize, or should any of the underlying assumptions prove incorrect, actual results may differ materially from those predicted in the forward-looking statements and from past results, performance, or achievements. Therefore, you should not place undue reliance on such statements. Factors that could cause actual results to differ materially from those in the forward-looking statements include (but are not limited to) the various factors and risks described in the Company’s annual report on Form 20-F for the financial year ended December 31, 2022 and other documents filed or furnished from time to time with the SEC, which are available on the SEC’s website at www.sec.gov and on the investor relations section of the Company’s website at www.IGT.com. Except as required under applicable law, the Company does not assume any obligation to update these forward-looking statements. You should carefully consider these factors and other risks and uncertainties that affect the Company’s business. Nothing in this presentation is intended, or is to be construed, as a profit forecast or to be interpreted to mean that the financial performance of International Game Technology PLC for the current or any future financial years will necessarily match or exceed the historical published financial performance of International Game Technology PLC, as applicable. All forward- looking statements contained in this presentation are qualified in their entirety by this cautionary statement. All subsequent written or oral forward-looking statements attributable to International Game Technology PLC, or persons acting on its behalf, are expressly qualified in their entirety by this cautionary statement. Comparability of Results All figures presented in this presentation are prepared under U.S. GAAP, unless noted otherwise. Non-GAAP Financial Measures Management supplements the reporting of financial information, determined under GAAP, with certain non-GAAP financial information. Management believes the non-GAAP information presented provides investors with additional useful information, but it is not intended to nor should it be considered in isolation or as a substitute for the related GAAP measures. Moreover, other companies may define non-GAAP measures differently, which limits the usefulness of these measures for comparisons with such other companies. The Company encourages investors to review its financial statements and publicly-filed reports in their entirety and not to rely on any single financial measure. Adjusted EBITDA represents net income (loss) (a GAAP measure) before income taxes, interest expense, net, foreign exchange gain (loss), net, other non-operating expenses (e.g., DDI / Benson Matter provision, gains/losses on extinguishment and modifications of debt, etc.), net, depreciation, impairment losses, amortization (service revenue, purchase accounting and non-purchase accounting), restructuring expenses, stock-based compensation, litigation expense (income), and certain other non- recurring items. Other non-recurring items are infrequent in nature and are not reflective of ongoing operational activities. For the business segments, Adjusted EBITDA represents segment operating income (loss) before depreciation, amortization (service revenue, purchase accounting, and non-purchase accounting), restructuring expenses, stock-based compensation, litigation expense (income), and certain other non-recurring items. Management believes that Adjusted EBITDA is useful in providing period- to-period comparisons of the results of the Company's ongoing operational performance. Adjusted EPS represents diluted earnings per share (a GAAP measure), excluding the effects of foreign exchange, impairments, amortization from purchase accounting, discrete tax items, and other significant non-recurring adjustments that are not reflective of on-going operational activities (e.g., DDI / Benson Matter provision, gains/losses on sale of business, gains/losses on extinguishment and modifications of debt, etc.). Adjusted EPS is calculated using diluted weighted-average number of shares outstanding, including the impact of any potentially dilutive common stock equivalents that are anti-dilutive to GAAP net income (loss) per share but dilutive to Adjusted EPS. Management believes that Adjusted EPS is useful in providing period-to-period comparisons of the results of the Company's ongoing operational performance. Net debt is a non-GAAP financial measure that represents debt (a GAAP measure, calculated as long-term obligations plus short-term borrowings) minus capitalized debt issuance costs and cash and cash equivalents, including cash and cash equivalents held for sale. Cash and cash equivalents, including cash and cash equivalents classified as held for sale, are subtracted from the GAAP measure because they could be used to reduce the Company’s debt obligations. Management believes that net debt is a useful measure to monitor leverage and evaluate the balance sheet. Net debt leverage is a non-GAAP financial measure that represents the ratio of Net debt as of a particular balance sheet date to Adjusted EBITDA for the last twelve months (“LTM”) prior to such date. Management believes that Net debt leverage is a useful measure to assess IGT's financial strength and ability to incur incremental indebtedness when making key investment decisions. Free cash flow is a non-GAAP financial measure that represents cash flow from operations (a GAAP measure) less capital expenditures (a component of investing cash flows) and payments on license obligations (a component of financing cash flows). Management believes free cash flow is a useful measure of liquidity and an additional basis for assessing IGT’s ability to fund its activities, including debt service and distribution of earnings to shareholders. Adjusted free cash flow is a non-GAAP financial measure that represents free cash flow excluding the net of tax cash payments in connection with material litigation (e.g. DDI / Benson Matter. To enhance investor understanding of the Company’s performance in comparison with the prior year, the Company excluded the net of cash impacts related to the settlement of the DDI / Benson Matter. Management believes adjusted free cash flow is a useful measure of liquidity and an additional basis for assessing IGT’s performance. Constant currency or constant FX is a non-GAAP financial measure that expresses the current financial data using the prior-year/period exchange rate (i.e., the month end exchange rates used in preparing the financial statements for the prior year). Management believes that constant currency is a useful measure to compare period-to-period results without regard to the impact of fluctuating foreign currency exchange rates. A reconciliation of the non-GAAP measures to the corresponding amounts prepared in accordance with GAAP appears in the tables in this release. The tables provide additional information as to the items and amounts that have been excluded from the adjusted measures. 2

3 Remembering Fabio Cairoli
4
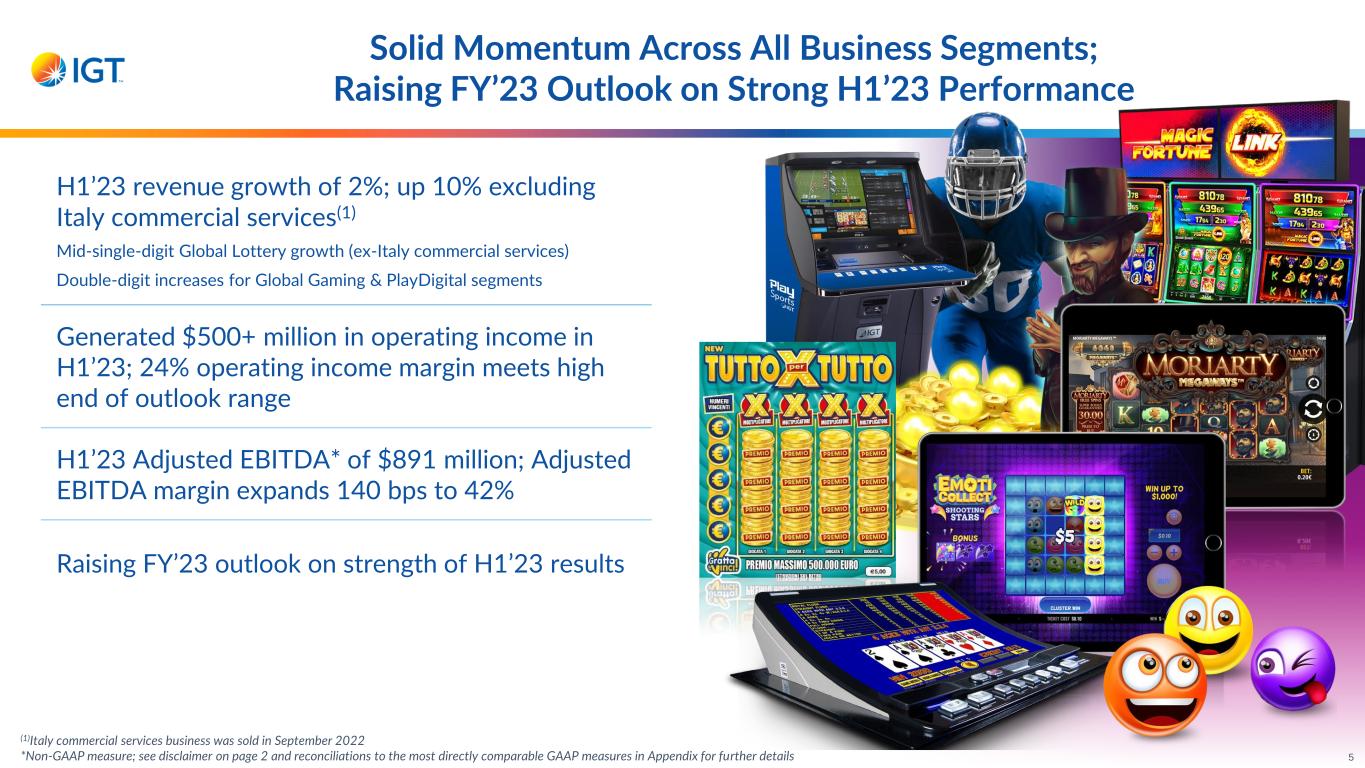
Solid Momentum Across All Business Segments; Raising FY’23 Outlook on Strong H1’23 Performance H1’23 revenue growth of 2%; up 10% excluding Italy commercial services(1) Mid-single-digit Global Lottery growth (ex-Italy commercial services) Double-digit increases for Global Gaming & PlayDigital segments Generated $500+ million in operating income in H1’23; 24% operating income margin meets high end of outlook range H1’23 Adjusted EBITDA* of $891 million; Adjusted EBITDA margin expands 140 bps to 42% Raising FY’23 outlook on strength of H1’23 results 5 (1)Italy commercial services business was sold in September 2022 *Non-GAAP measure; see disclaimer on page 2 and reconciliations to the most directly comparable GAAP measures in Appendix for further details
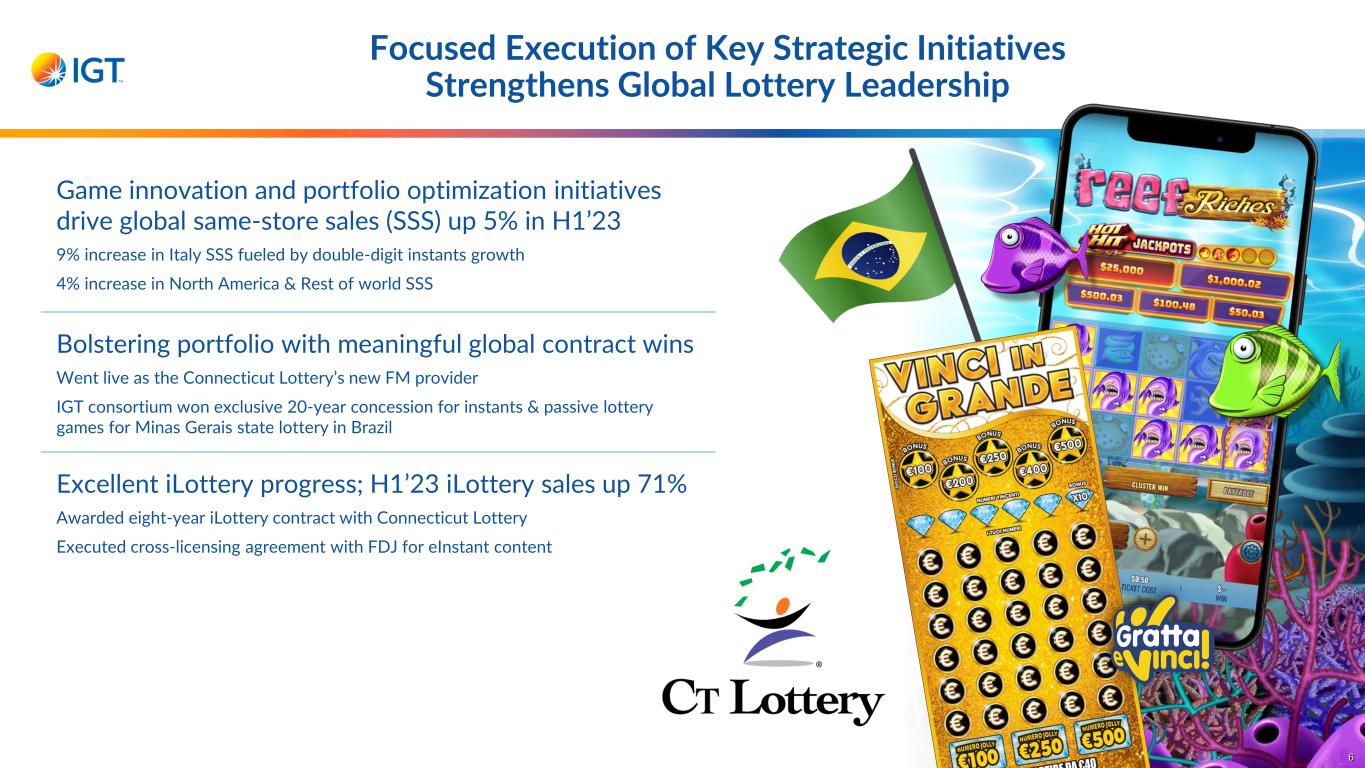
Focused Execution of Key Strategic Initiatives Strengthens Global Lottery Leadership Game innovation and portfolio optimization initiatives drive global same-store sales (SSS) up 5% in H1’23 9% increase in Italy SSS fueled by double-digit instants growth 4% increase in North America & Rest of world SSS Bolstering portfolio with meaningful global contract wins Went live as the Connecticut Lottery’s new FM provider IGT consortium won exclusive 20-year concession for instants & passive lottery games for Minas Gerais state lottery in Brazil Excellent iLottery progress; H1’23 iLottery sales up 71% Awarded eight-year iLottery contract with Connecticut Lottery Executed cross-licensing agreement with FDJ for eInstant content 6
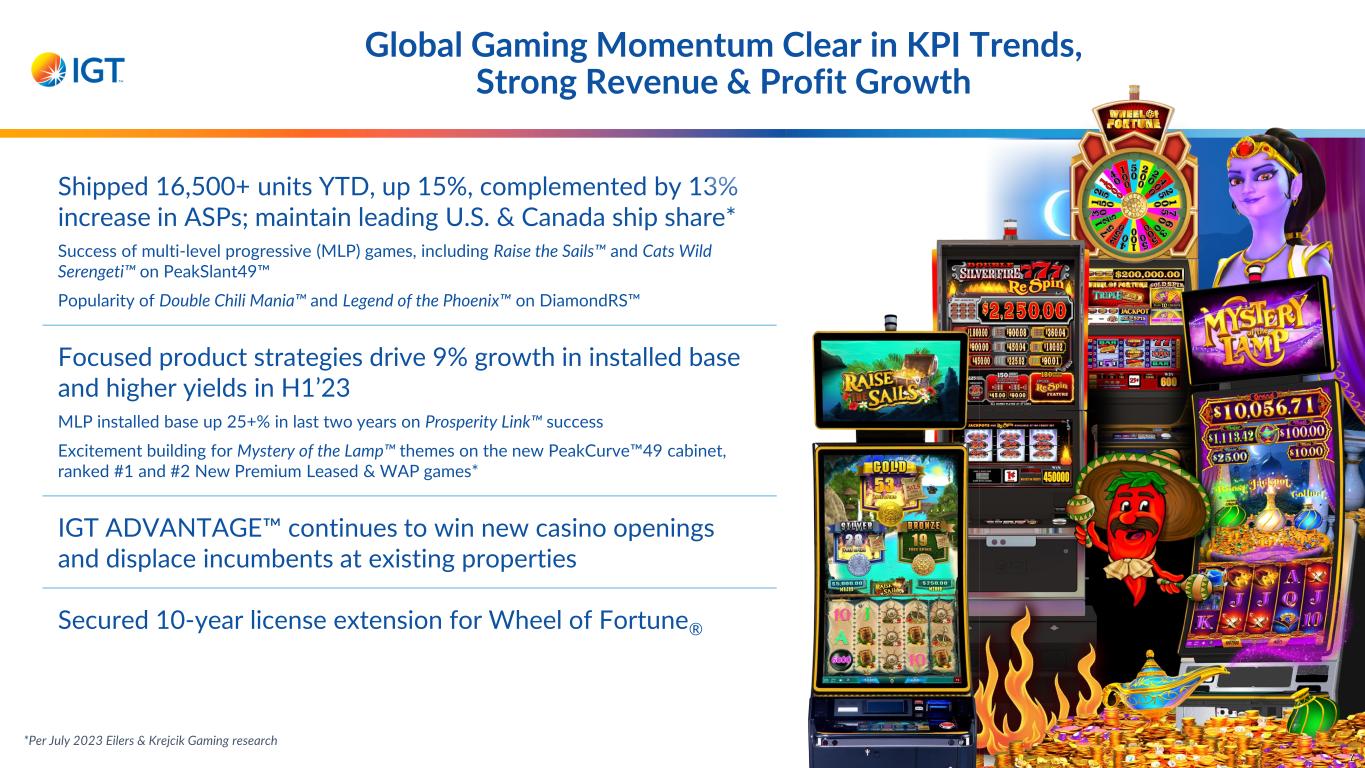
Global Gaming Momentum Clear in KPI Trends, Strong Revenue & Profit Growth on Shipped 16,500+ units YTD, up 15%, complemented by 13% increase in ASPs; maintain leading U.S. & Canada ship share* Success of multi-level progressive (MLP) games, including Raise the Sails™ and Cats Wild Serengeti™ on PeakSlant49™ Popularity of Double Chili Mania™ and Legend of the Phoenix™ on DiamondRS™ Focused product strategies drive 9% growth in installed base and higher yields in H1’23 MLP installed base up 25+% in last two years on Prosperity Link™ success Excitement building for Mystery of the Lamp™ themes on the new PeakCurve™49 cabinet, ranked #1 and #2 New Premium Leased & WAP games* IGT ADVANTAGE™ continues to win new casino openings and displace incumbents at existing properties Secured 10-year license extension for Wheel of Fortune® *Per July 2023 Eilers & Krejcik Gaming research 7

Accelerated PlayDigital Growth Fueled by Expanding Portfolio of Compelling Games & Solutions Core franchises, progressive jackpot & unique omnichannel WAP games, drive strong iGaming results Fortune Coin™, Cash Eruption™, and Cleopatra™ secure top three spots on EGR North America’s June 2023 U.S. slot rankings Launched Wheel of Fortune Triple Gold™ Gold Spin™ in NJ, the first-ever omnichannel WAP game in the U.S. Introduced popular Powerbucks™ and MegaJackpots™ games to Alberta, building on success in other Canadian provinces Expanding long-term relationship with Rhode Island Lottery iGaming joint venture with Bally’s Extended sports betting contract for three years Won “Sportsbook Supplier of the Year” at 2023 SBC Awards North America 8
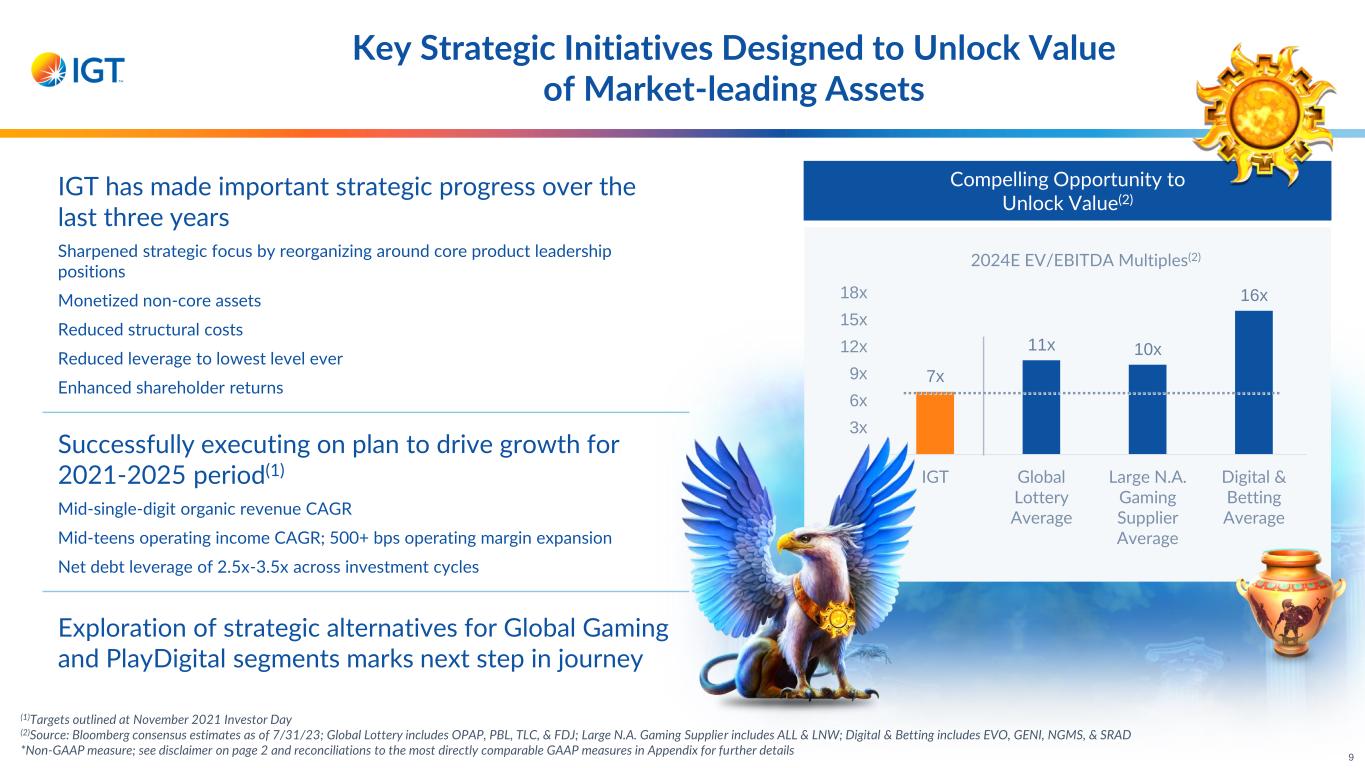
Key Strategic Initiatives Designed to Unlock Value of Market-leading Assets 9 (1)Targets outlined at November 2021 Investor Day (2)Source: Bloomberg consensus estimates as of 7/31/23; Global Lottery includes OPAP, PBL, TLC, & FDJ; Large N.A. Gaming Supplier includes ALL & LNW; Digital & Betting includes EVO, GENI, NGMS, & SRAD *Non-GAAP measure; see disclaimer on page 2 and reconciliations to the most directly comparable GAAP measures in Appendix for further details 7x 11x 10x 16x x 3x 6x 9x 12x 15x 18x IGT Global Lottery Average Large N.A. Gaming Supplier Average Digital & Betting Average 2024E EV/EBITDA Multiples(2) Compelling Opportunity to Unlock Value(2) IGT has made important strategic progress over the last three years Sharpened strategic focus by reorganizing around core product leadership positions Monetized non-core assets Reduced structural costs Reduced leverage to lowest level ever Enhanced shareholder returns Successfully executing on plan to drive growth for 2021-2025 period(1) Mid-single-digit organic revenue CAGR Mid-teens operating income CAGR; 500+ bps operating margin expansion Net debt leverage of 2.5x-3.5x across investment cycles Exploration of strategic alternatives for Global Gaming and PlayDigital segments marks next step in journey
10
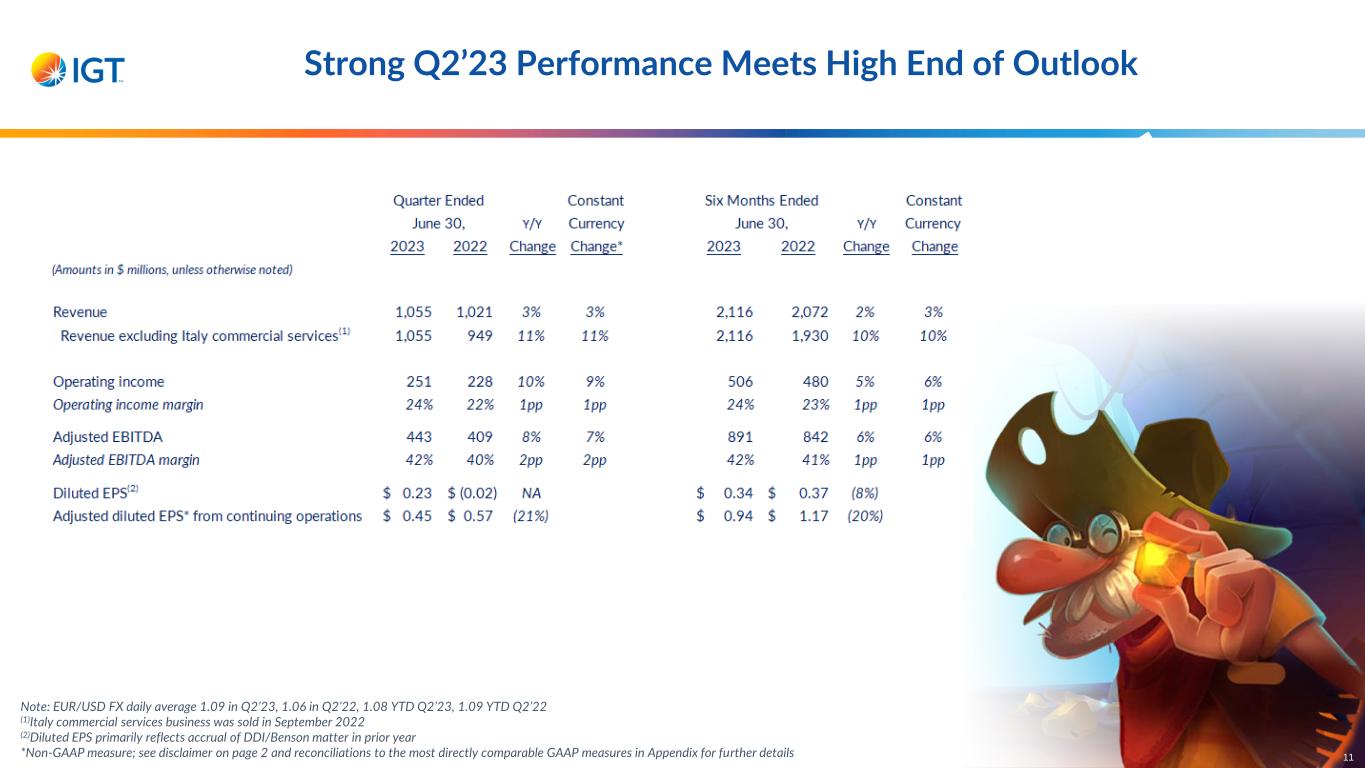
Strong Q2’23 Performance Meets High End of Outlook 11 Note: EUR/USD FX daily average 1.09 in Q2’23, 1.06 in Q2’22, 1.08 YTD Q2’23, 1.09 YTD Q2’22 (1)Italy commercial services business was sold in September 2022 (2)Diluted EPS primarily reflects accrual of DDI/Benson matter in prior year *Non-GAAP measure; see disclaimer on page 2 and reconciliations to the most directly comparable GAAP measures in Appendix for further details
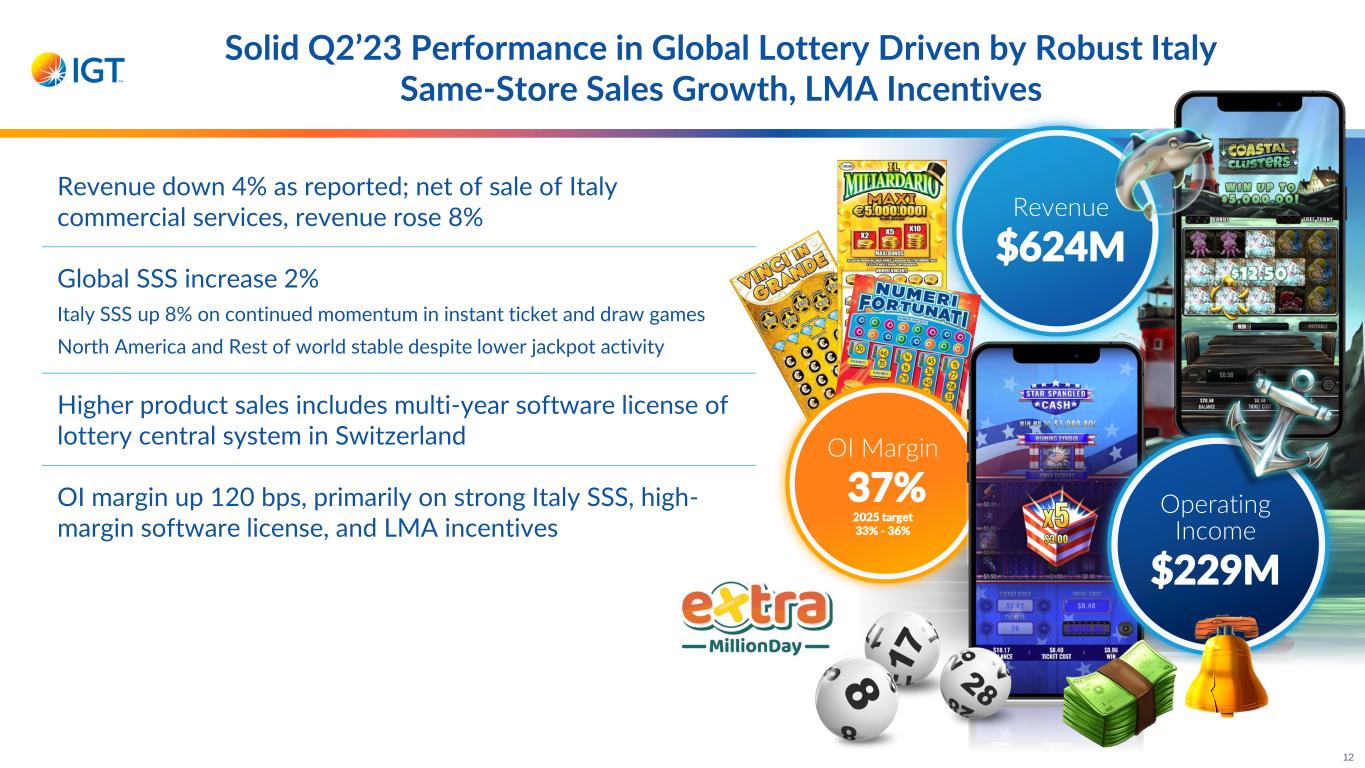
Revenue $624M OI Margin 37% 2025 target 33% - 36% Operating Income $229M Solid Q2’23 Performance in Global Lottery Driven by Robust Italy Same-Store Sales Growth, LMA Incentives Revenue down 4% as reported; net of sale of Italy commercial services, revenue rose 8% Global SSS increase 2% Italy SSS up 8% on continued momentum in instant ticket and draw games North America and Rest of world stable despite lower jackpot activity Higher product sales includes multi-year software license of lottery central system in Switzerland OI margin up 120 bps, primarily on strong Italy SSS, high- margin software license, and LMA incentives 12
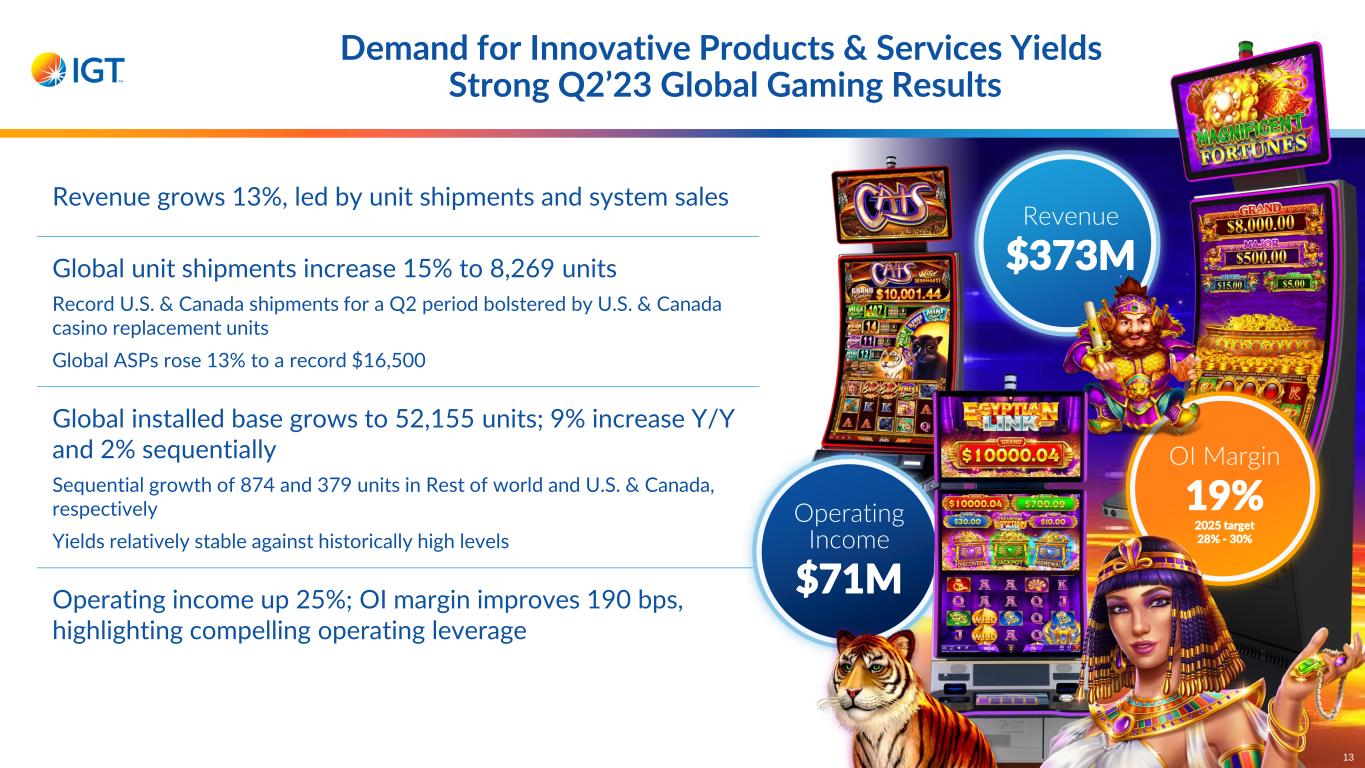
Demand for Innovative Products & Services Yields Strong Q2’23 Global Gaming Results Revenue grows 13%, led by unit shipments and system sales Global unit shipments increase 15% to 8,269 units Record U.S. & Canada shipments for a Q2 period bolstered by U.S. & Canada casino replacement units Global ASPs rose 13% to a record $16,500 Global installed base grows to 52,155 units; 9% increase Y/Y and 2% sequentially Sequential growth of 874 and 379 units in Rest of world and U.S. & Canada, respectively Yields relatively stable against historically high levels Operating income up 25%; OI margin improves 190 bps, highlighting compelling operating leverage Revenue $373M OI Margin 19% 2025 target 28% - 30% Operating Income $71M 13
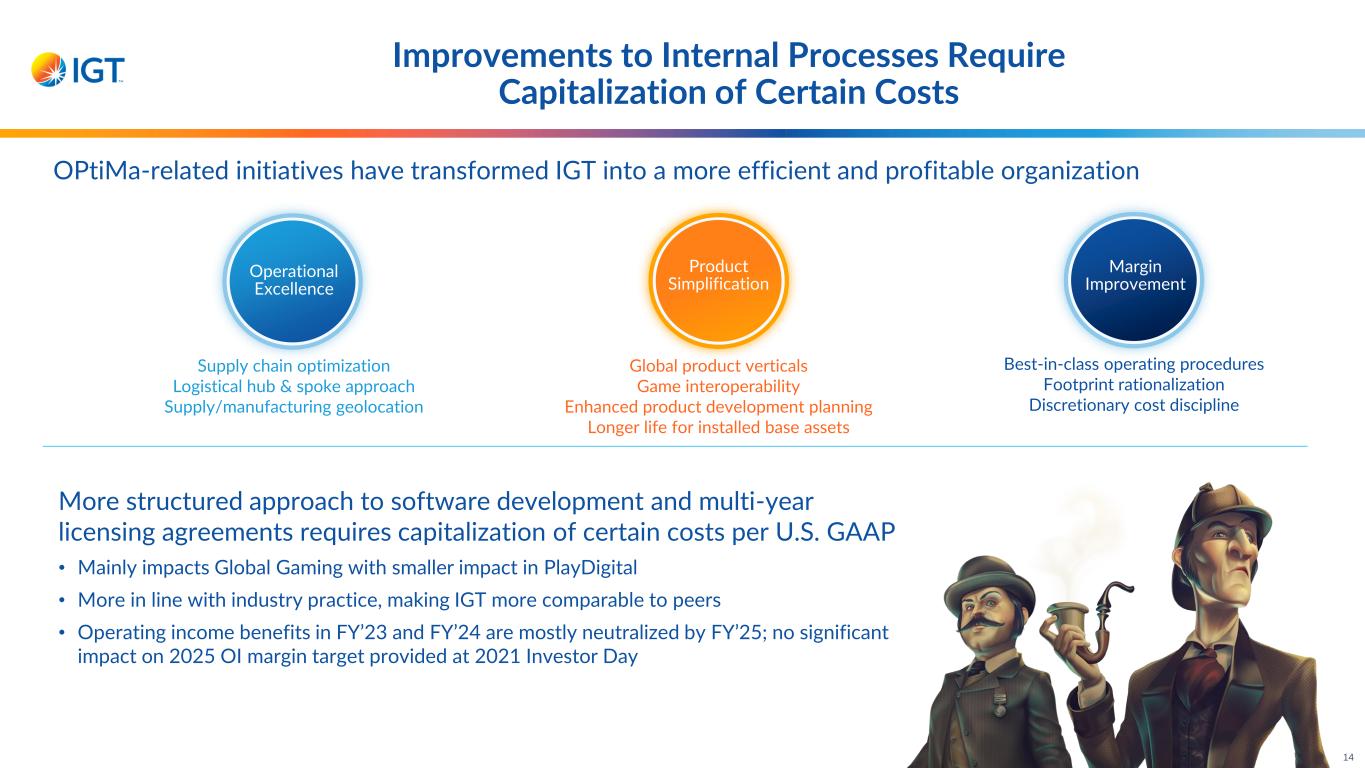
Improvements to Internal Processes Require Capitalization of Certain Costs 14 Operational Excellence Product Simplification Margin Improvement Supply chain optimization Logistical hub & spoke approach Supply/manufacturing geolocation Global product verticals Game interoperability Enhanced product development planning Longer life for installed base assets Best-in-class operating procedures Footprint rationalization Discretionary cost discipline OPtiMa-related initiatives have transformed IGT into a more efficient and profitable organization More structured approach to software development and multi-year licensing agreements requires capitalization of certain costs per U.S. GAAP • Mainly impacts Global Gaming with smaller impact in PlayDigital • More in line with industry practice, making IGT more comparable to peers • Operating income benefits in FY’23 and FY’24 are mostly neutralized by FY’25; no significant impact on 2025 OI margin target provided at 2021 Investor Day
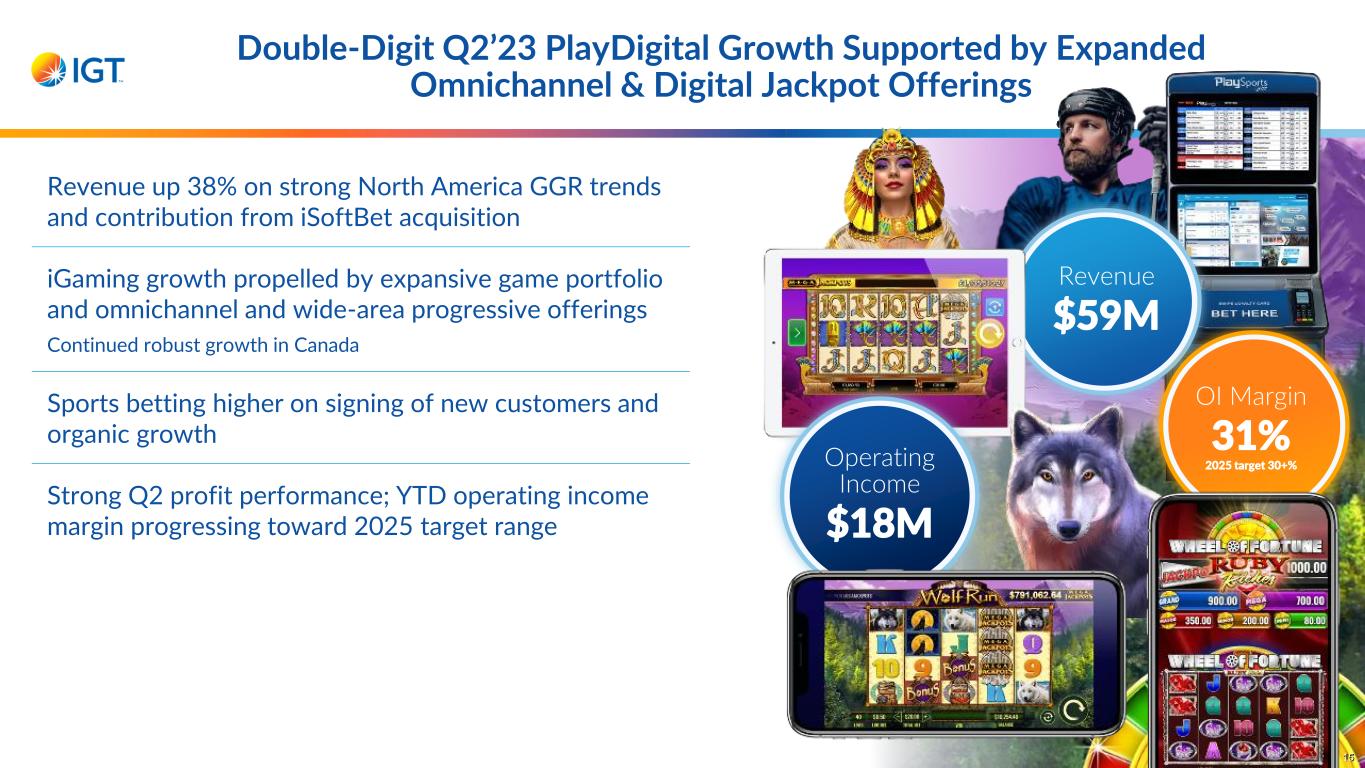
Revenue $59M OI Margin 31% 2025 target 30+%Operating Income $18M Revenue up 38% on strong North America GGR trends and contribution from iSoftBet acquisition iGaming growth propelled by expansive game portfolio and omnichannel and wide-area progressive offerings Continued robust growth in Canada Sports betting higher on signing of new customers and organic growth Strong Q2 profit performance; YTD operating income margin progressing toward 2025 target range Double-Digit Q2’23 PlayDigital Growth Supported by Expanded Omnichannel & Digital Jackpot Offerings 15
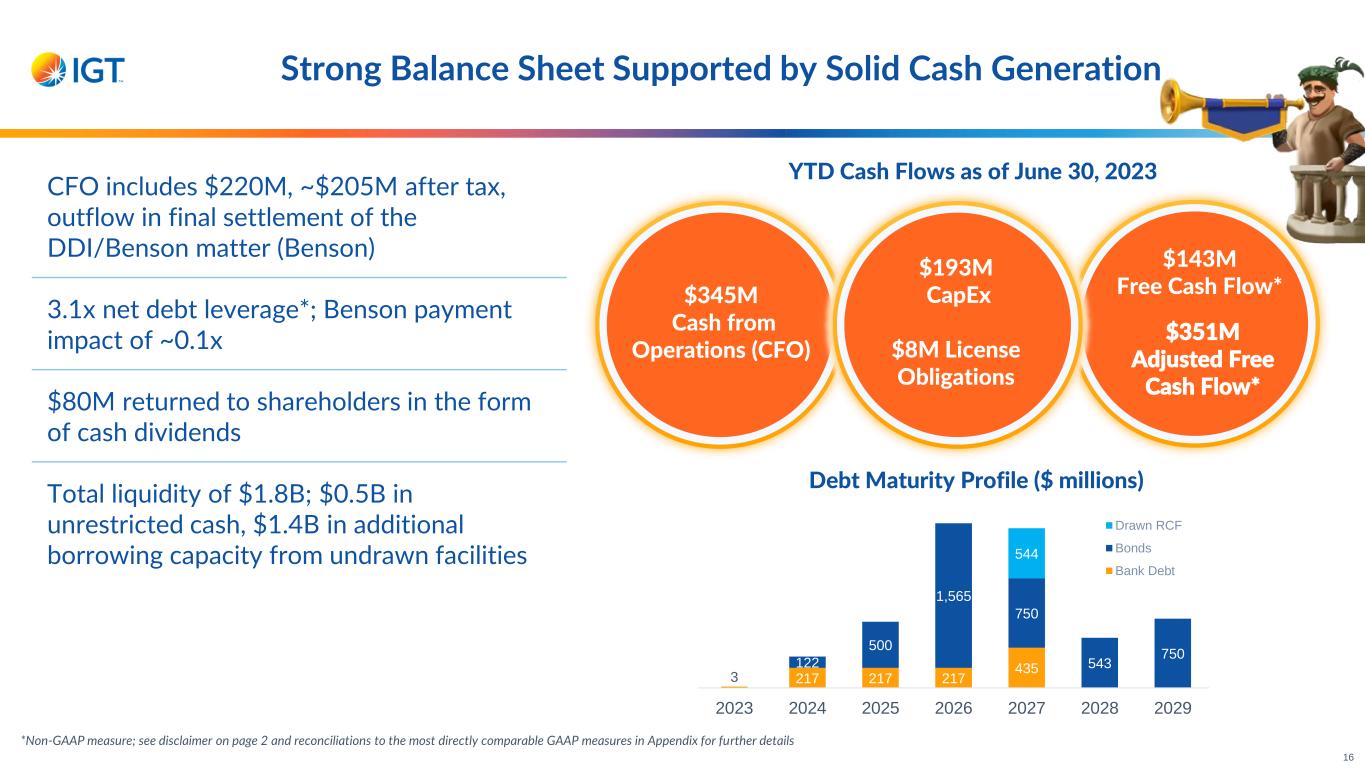
*Non-GAAP measure; see disclaimer on page 2 and reconciliations to the most directly comparable GAAP measures in Appendix for further details Strong Balance Sheet Supported by Solid Cash Generation 16 CFO includes $220M, ~$205M after tax, outflow in final settlement of the DDI/Benson matter (Benson) 3.1x net debt leverage*; Benson payment impact of ~0.1x $80M returned to shareholders in the form of cash dividends Total liquidity of $1.8B; $0.5B in unrestricted cash, $1.4B in additional borrowing capacity from undrawn facilities 3 217 217 217 435122 500 1,565 750 543 750 544 2023 2024 2025 2026 2027 2028 2029 Drawn RCF Bonds Bank Debt Debt Maturity Profile ($ millions) $345M Cash from Operations (CFO) $143M Free Cash Flow* $193M CapEx $8M License Obligations YTD Cash Flows as of June 30, 2023 $351M Adjusted Free Cash Flow*
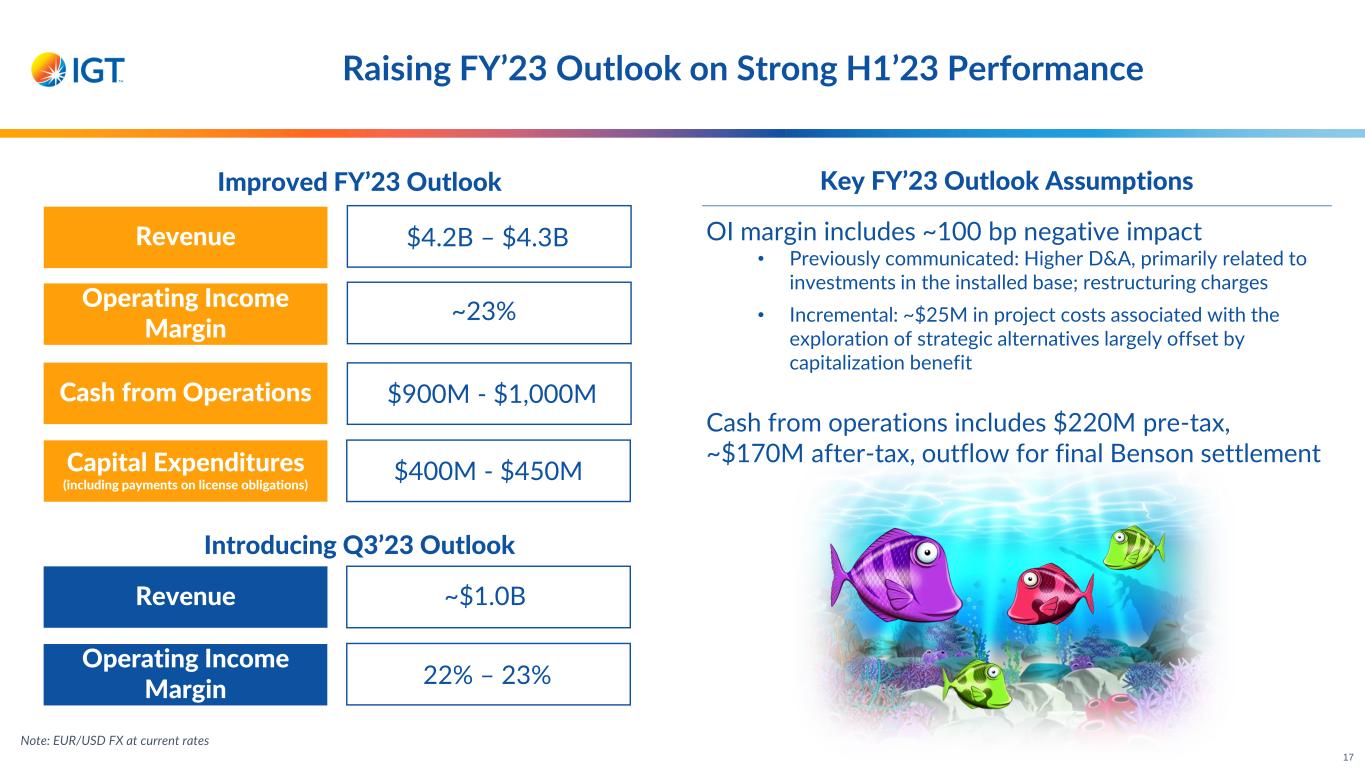
Revenue Operating Income Margin Cash from Operations Capital Expenditures (including payments on license obligations) Raising FY’23 Outlook on Strong H1’23 Performance Improved FY’23 Outlook Introducing Q3’23 Outlook ~$1.0BRevenue Operating Income Margin 22% – 23% $4.2B – $4.3B ~23% $900M - $1,000M $400M - $450M Key FY’23 Outlook Assumptions OI margin includes ~100 bp negative impact • Previously communicated: Higher D&A, primarily related to investments in the installed base; restructuring charges • Incremental: ~$25M in project costs associated with the exploration of strategic alternatives largely offset by capitalization benefit Cash from operations includes $220M pre-tax, ~$170M after-tax, outflow for final Benson settlement 17 Note: EUR/USD FX at current rates
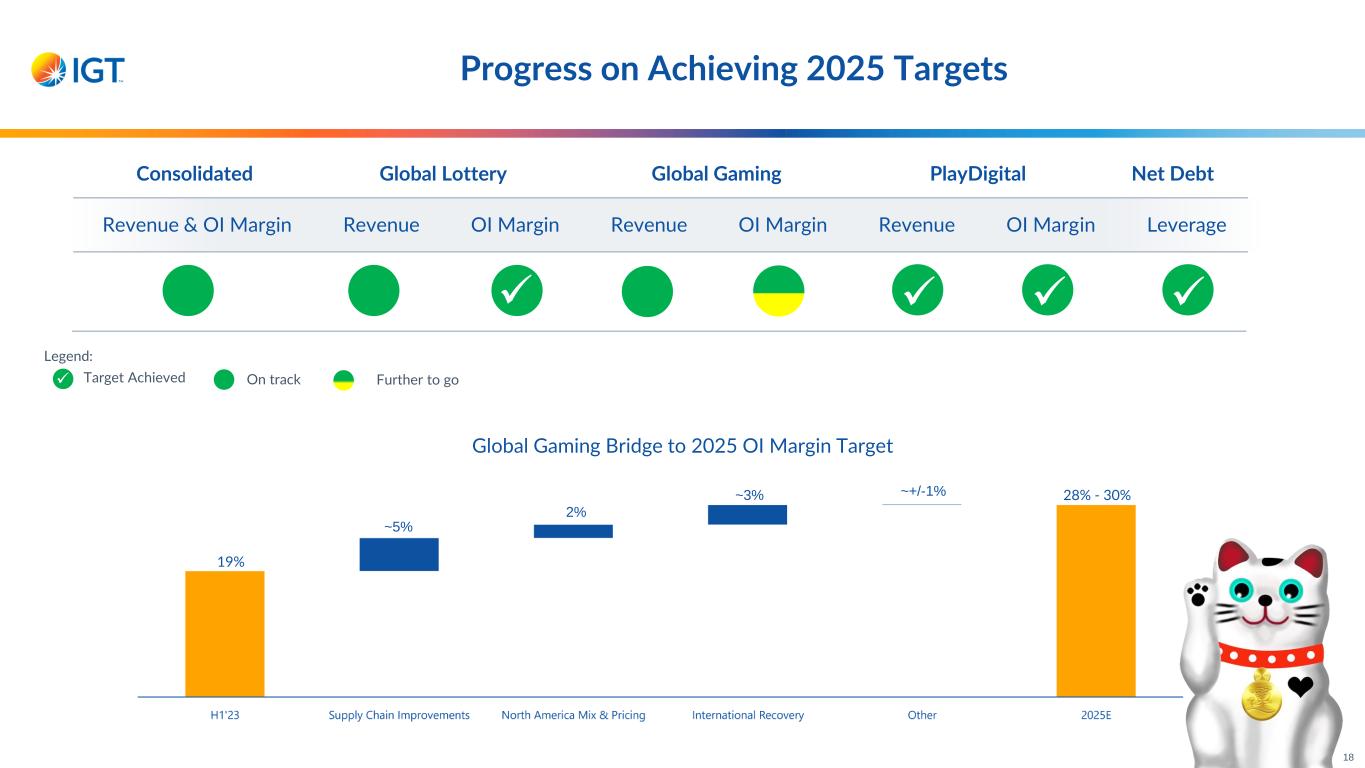
Progress on Achieving 2025 Targets 18 Global Gaming Bridge to 2025 OI Margin Target 19% 28% - 30% ✓ ✓ Consolidated Global Lottery Global Gaming PlayDigital Net Debt Revenue & OI Margin Revenue OI Margin Revenue OI Margin Revenue OI Margin Leverage Target Achieved ~5% 2% ~3% ~+/-1% ✓✓ On track Further to go Legend: ✓
Strong H1’23 Performance & Balance Sheet Provide Solid Foundation for Growth 19 Robust Revenue Growth & OI Margin Expansion Raising FY’23 Outlook Improved Leverage Profile Strong Cash Flow Generation
20

21
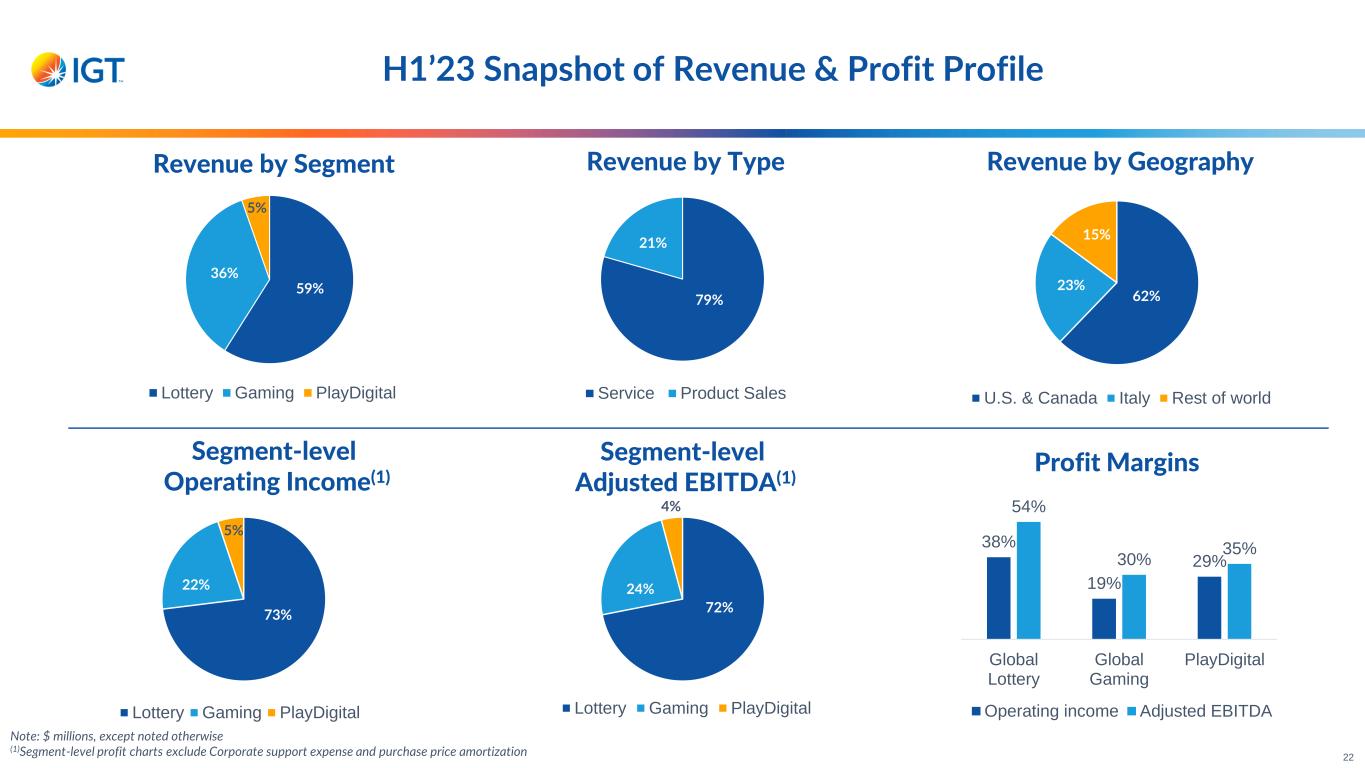
22 41% Note: $ millions, except noted otherwise (1)Segment-level profit charts exclude Corporate support expense and purchase price amortization 59% 36% 5% Lottery Gaming PlayDigital 79% 21% Service Product Sales 62% 23% 15% U.S. & Canada Italy Rest of world 73% 22% 5% Lottery Gaming PlayDigital 72% 24% 4% Lottery Gaming PlayDigital 38% 19% 29% 54% 30% 35% Global Lottery Global Gaming PlayDigital Operating income Adjusted EBITDA Revenue by Segment Revenue by Type Revenue by Geography Segment-level Operating Income(1) Segment-level Adjusted EBITDA(1) Profit Margins H1’23 Snapshot of Revenue & Profit Profile
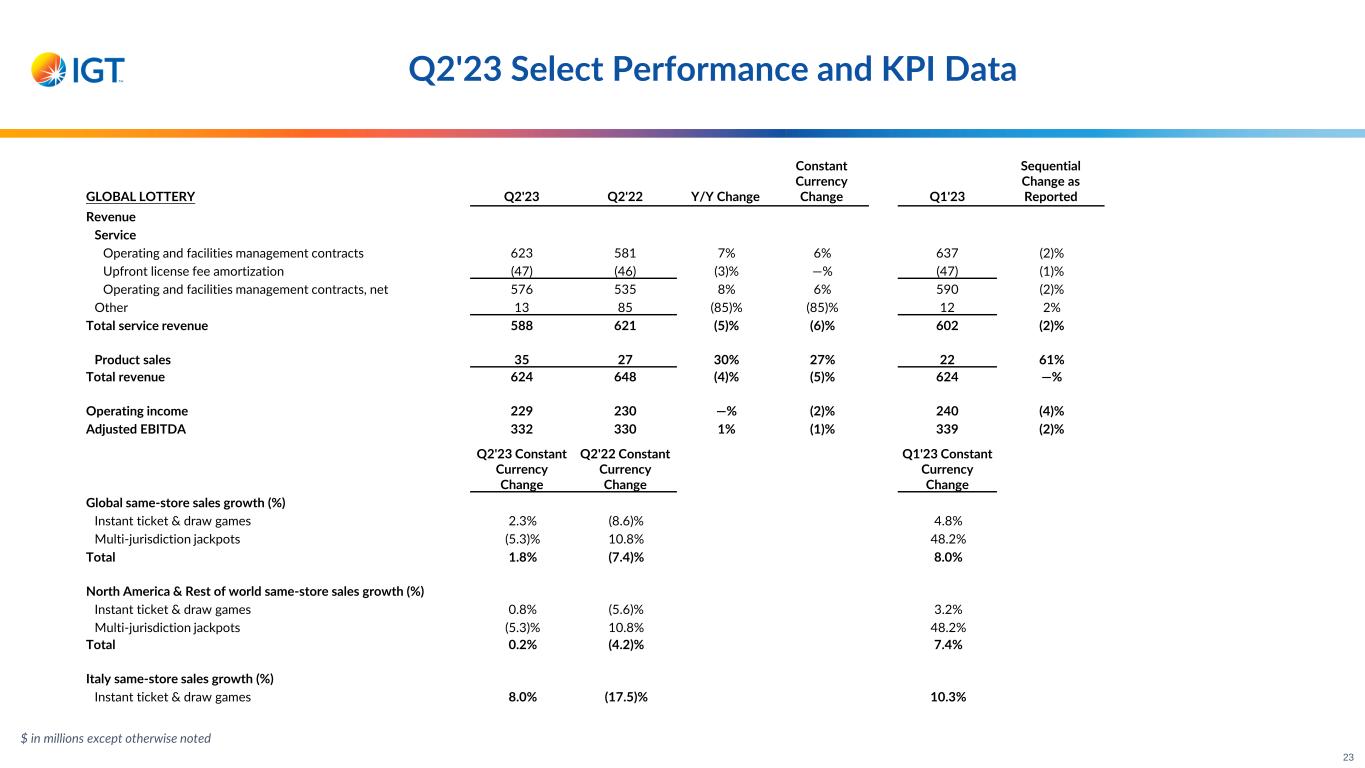
$ in millions except otherwise noted Q2'23 Select Performance and KPI Data GLOBAL LOTTERY Q2'23 Q2'22 Y/Y Change Constant Currency Change Q1'23 Sequential Change as Reported Revenue Service Operating and facilities management contracts 623 581 7% 6% 637 (2)% Upfront license fee amortization (47) (46) (3)% —% (47) (1)% Operating and facilities management contracts, net 576 535 8% 6% 590 (2)% Other 13 85 (85)% (85)% 12 2% Total service revenue 588 621 (5)% (6)% 602 (2)% Product sales 35 27 30% 27% 22 61% Total revenue 624 648 (4)% (5)% 624 —% Operating income 229 230 —% (2)% 240 (4)% Adjusted EBITDA 332 330 1% (1)% 339 (2)% Q2'23 Constant Currency Change Q2'22 Constant Currency Change Q1'23 Constant Currency Change Global same-store sales growth (%) Instant ticket & draw games 2.3% (8.6)% 4.8% Multi-jurisdiction jackpots (5.3)% 10.8% 48.2% Total 1.8% (7.4)% 8.0% North America & Rest of world same-store sales growth (%) Instant ticket & draw games 0.8% (5.6)% 3.2% Multi-jurisdiction jackpots (5.3)% 10.8% 48.2% Total 0.2% (4.2)% 7.4% Italy same-store sales growth (%) Instant ticket & draw games 8.0% (17.5)% 10.3% 23
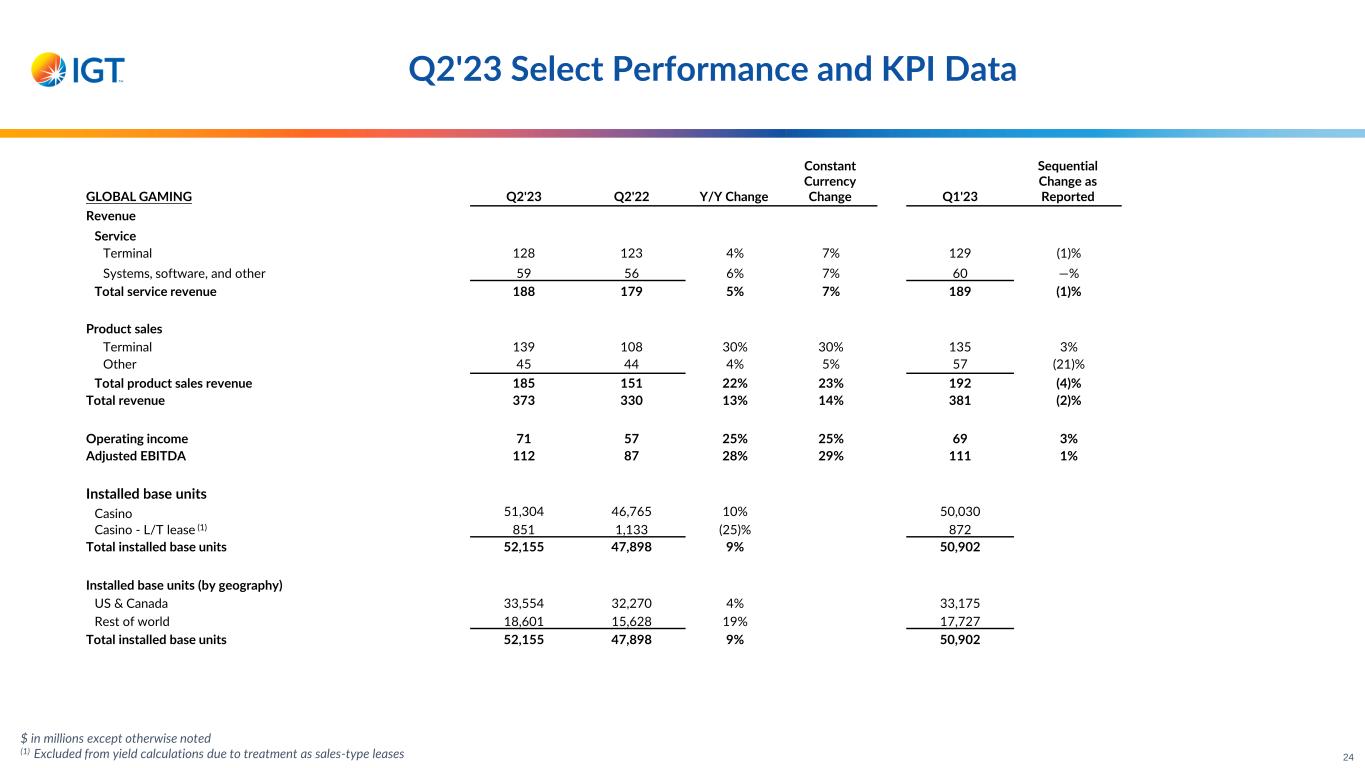
$ in millions except otherwise noted (1) Excluded from yield calculations due to treatment as sales-type leases Q2'23 Select Performance and KPI Data GLOBAL GAMING Q2'23 Q2'22 Y/Y Change Constant Currency Change Q1'23 Sequential Change as Reported Revenue Service Terminal 128 123 4% 7% 129 (1)% Systems, software, and other 59 56 6% 7% 60 —% Total service revenue 188 179 5% 7% 189 (1)% Product sales Terminal 139 108 30% 30% 135 3% Other 45 44 4% 5% 57 (21)% Total product sales revenue 185 151 22% 23% 192 (4)% Total revenue 373 330 13% 14% 381 (2)% Operating income 71 57 25% 25% 69 3% Adjusted EBITDA 112 87 28% 29% 111 1% Installed base units Casino 51,304 46,765 10% 50,030 Casino - L/T lease (1) 851 1,133 (25)% 872 Total installed base units 52,155 47,898 9% 50,902 Installed base units (by geography) US & Canada 33,554 32,270 4% 33,175 Rest of world 18,601 15,628 19% 17,727 Total installed base units 52,155 47,898 9% 50,902 24

$ in millions except otherwise noted (1) Excludes Casino L/T lease units due to treatment as sales-type lease Q2'23 Select Performance and KPI Data GLOBAL GAMING (Continued) Q2'23 Q2'22 Y/Y Change Q1'23 Yields (by geography)(1), in absolute $ US & Canada $41.89 $42.64 (2)% $42.36 Rest of world $7.44 $6.20 20% $7.41 Total yields $29.56 $30.55 (3)% $30.13 Global machine units sold New/expansion 1,061 818 30% 1,012 Replacement 7,208 6,378 13% 7,260 Total machine units sold 8,269 7,196 15% 8,272 US & Canada machine units sold New/expansion 1,046 469 123% 892 Replacement 5,278 4,580 15% 5,642 Total machine units sold 6,324 5,049 25% 6,534 Rest of world machine units sold New/expansion 15 349 (96)% 120 Replacement 1,930 1,798 7% 1,618 Total machine units sold 1,945 2,147 (9)% 1,738 Average Selling Price (ASP), in absolute $ US & Canada $16,700 $15,200 10% $16,000 Rest of world $16,000 $13,400 19% $15,400 Total ASP $16,500 $14,600 13% $15,900 25
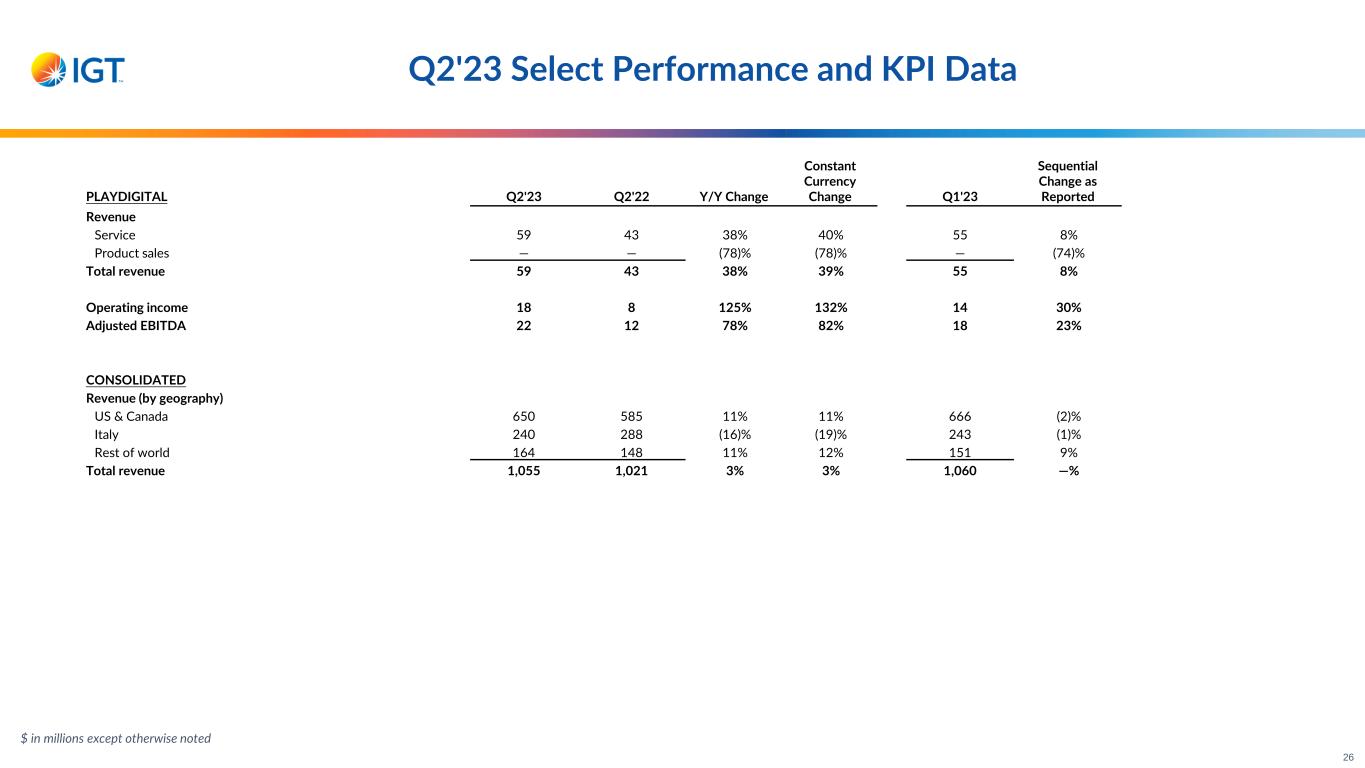
Q2'23 Select Performance and KPI Data PLAYDIGITAL Q2'23 Q2'22 Y/Y Change Constant Currency Change Q1'23 Sequential Change as Reported Revenue Service 59 43 38% 40% 55 8% Product sales — — (78)% (78)% — (74)% Total revenue 59 43 38% 39% 55 8% Operating income 18 8 125% 132% 14 30% Adjusted EBITDA 22 12 78% 82% 18 23% CONSOLIDATED Revenue (by geography) US & Canada 650 585 11% 11% 666 (2)% Italy 240 288 (16)% (19)% 243 (1)% Rest of world 164 148 11% 12% 151 9% Total revenue 1,055 1,021 3% 3% 1,060 —% $ in millions except otherwise noted 26
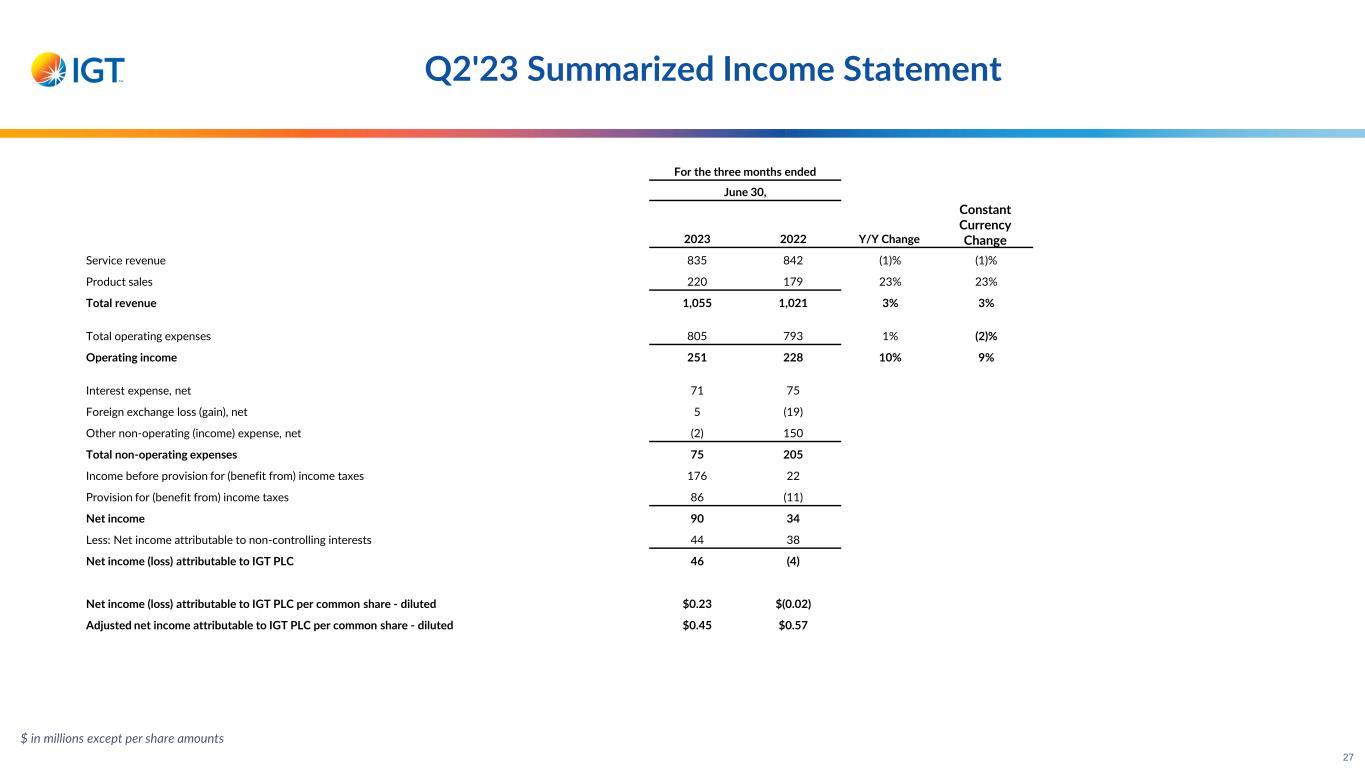
Q2'23 Summarized Income Statement For the three months ended June 30, 2023 2022 Y/Y Change Constant Currency Change Service revenue 835 842 (1)% (1)% Product sales 220 179 23% 23% Total revenue 1,055 1,021 3% 3% Total operating expenses 805 793 1% (2)% Operating income 251 228 10% 9% Interest expense, net 71 75 Foreign exchange loss (gain), net 5 (19) Other non-operating (income) expense, net (2) 150 Total non-operating expenses 75 205 Income before provision for (benefit from) income taxes 176 22 Provision for (benefit from) income taxes 86 (11) Net income 90 34 Less: Net income attributable to non-controlling interests 44 38 Net income (loss) attributable to IGT PLC 46 (4) Net income (loss) attributable to IGT PLC per common share - diluted $0.23 $(0.02) Adjusted net income attributable to IGT PLC per common share - diluted $0.45 $0.57 $ in millions except per share amounts 27
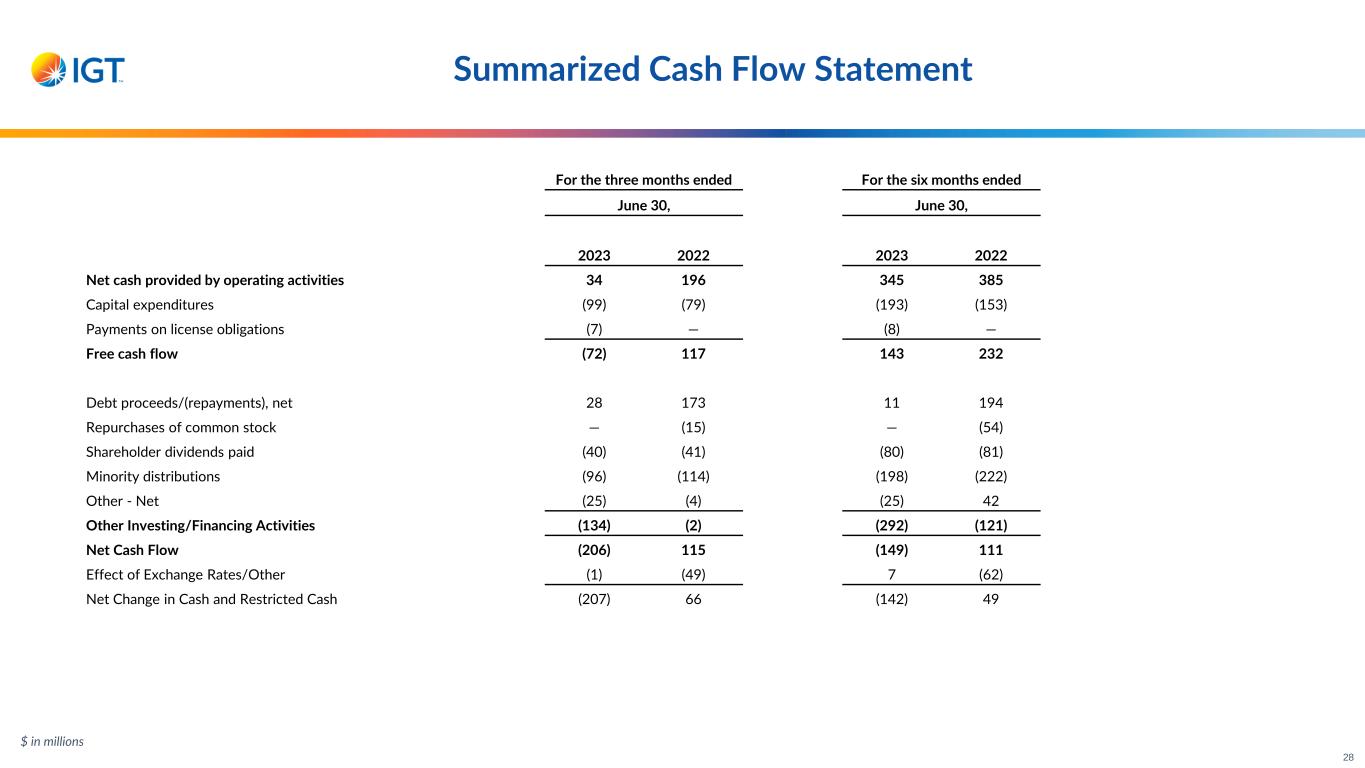
Summarized Cash Flow Statement For the three months ended For the six months ended June 30, June 30, 2023 2022 2023 2022 Net cash provided by operating activities 34 196 345 385 Capital expenditures (99) (79) (193) (153) Payments on license obligations (7) — (8) — Free cash flow (72) 117 143 232 Debt proceeds/(repayments), net 28 173 11 194 Repurchases of common stock — (15) — (54) Shareholder dividends paid (40) (41) (80) (81) Minority distributions (96) (114) (198) (222) Other - Net (25) (4) (25) 42 Other Investing/Financing Activities (134) (2) (292) (121) Net Cash Flow (206) 115 (149) 111 Effect of Exchange Rates/Other (1) (49) 7 (62) Net Change in Cash and Restricted Cash (207) 66 (142) 49 $ in millions 28
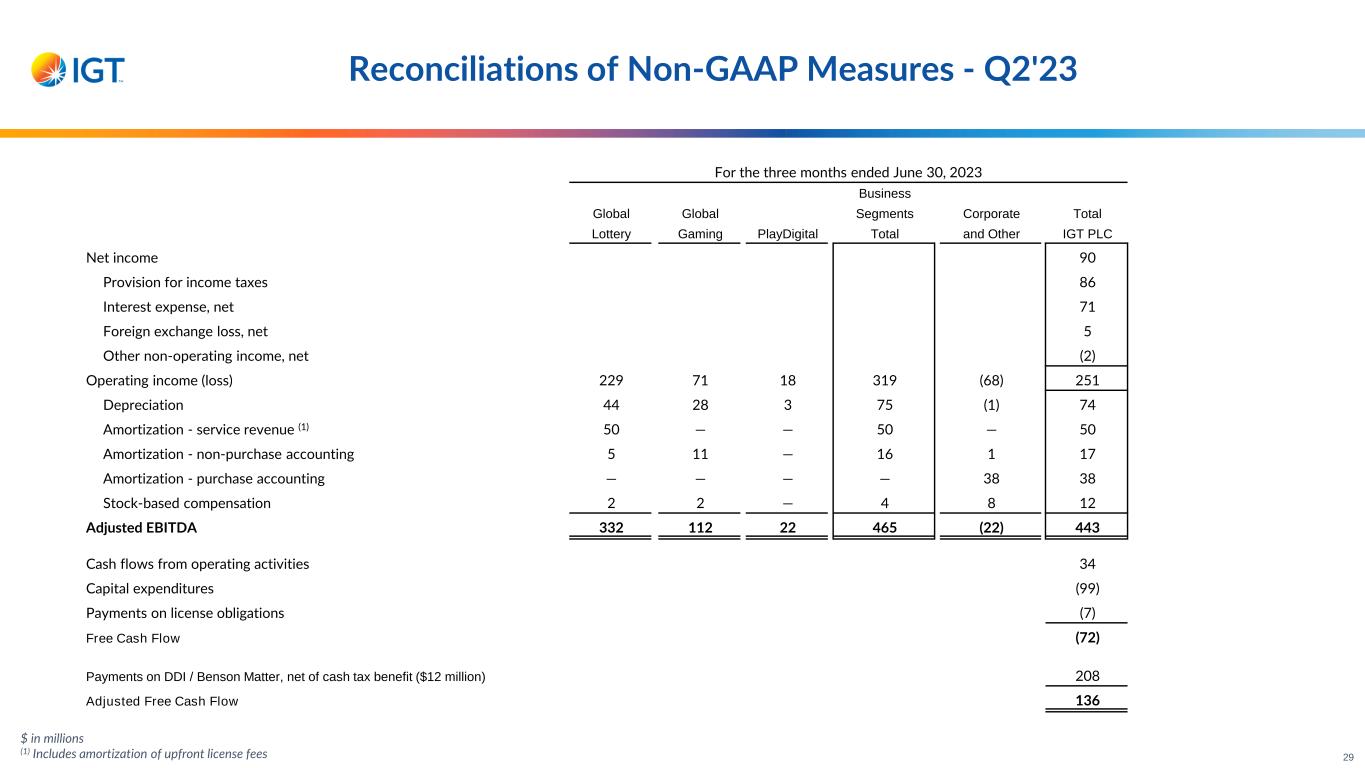
For the three months ended June 30, 2023 Business Global Global Segments Corporate Total Lottery Gaming PlayDigital Total and Other IGT PLC Net income 90 Provision for income taxes 86 Interest expense, net 71 Foreign exchange loss, net 5 Other non-operating income, net (2) Operating income (loss) 229 71 18 319 (68) 251 Depreciation 44 28 3 75 (1) 74 Amortization - service revenue (1) 50 — — 50 — 50 Amortization - non-purchase accounting 5 11 — 16 1 17 Amortization - purchase accounting — — — — 38 38 Stock-based compensation 2 2 — 4 8 12 Adjusted EBITDA 332 112 22 465 (22) 443 Cash flows from operating activities 34 Capital expenditures (99) Payments on license obligations (7) Free Cash Flow (72) Payments on DDI / Benson Matter, net of cash tax benefit ($12 million) 208 Adjusted Free Cash Flow 136 $ in millions (1) Includes amortization of upfront license fees Reconciliations of Non-GAAP Measures - Q2'23 29
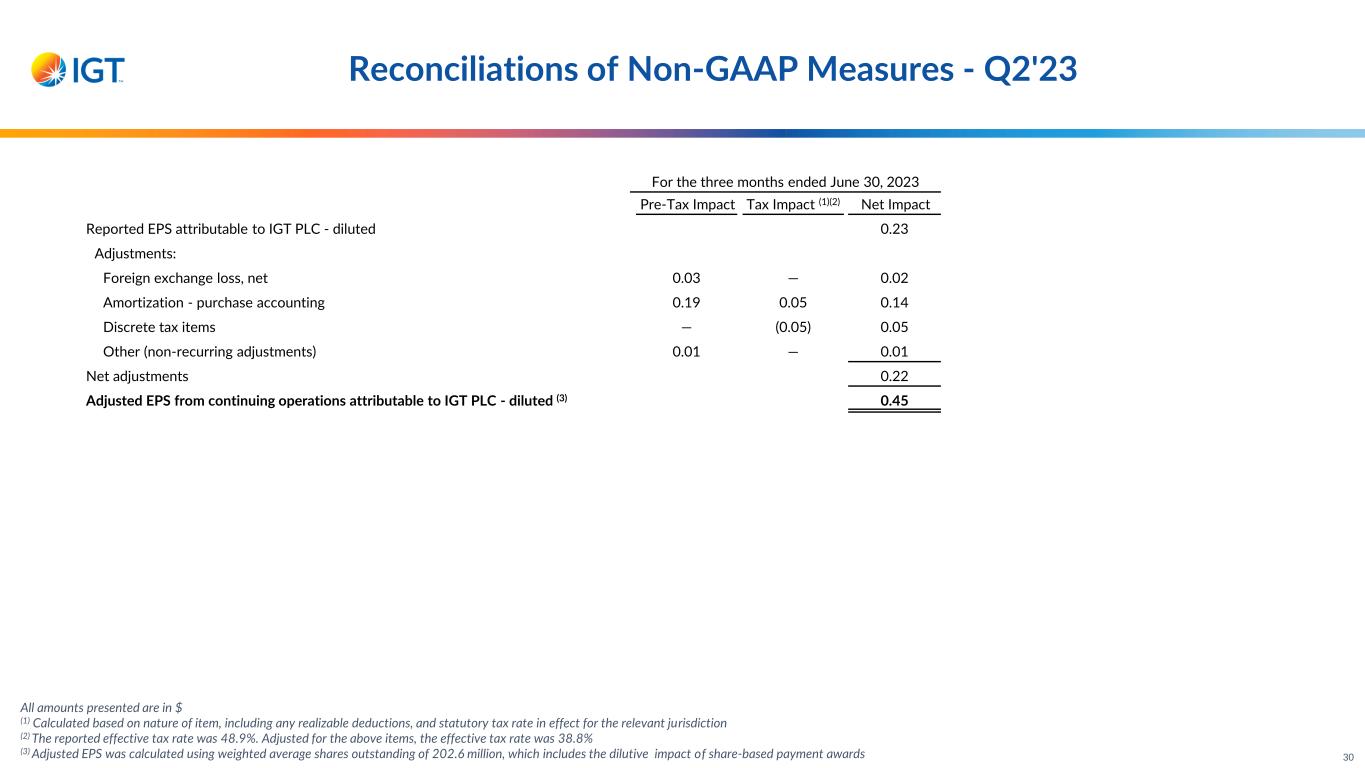
For the three months ended June 30, 2023 Pre-Tax Impact Tax Impact (1)(2) Net Impact Reported EPS attributable to IGT PLC - diluted 0.23 Adjustments: Foreign exchange loss, net 0.03 — 0.02 Amortization - purchase accounting 0.19 0.05 0.14 Discrete tax items — (0.05) 0.05 Other (non-recurring adjustments) 0.01 — 0.01 Net adjustments 0.22 Adjusted EPS from continuing operations attributable to IGT PLC - diluted (3) 0.45 Reconciliations of Non-GAAP Measures - Q2'23 All amounts presented are in $ (1) Calculated based on nature of item, including any realizable deductions, and statutory tax rate in effect for the relevant jurisdiction (2) The reported effective tax rate was 48.9%. Adjusted for the above items, the effective tax rate was 38.8% (3) Adjusted EPS was calculated using weighted average shares outstanding of 202.6 million, which includes the dilutive impact of share-based payment awards 30
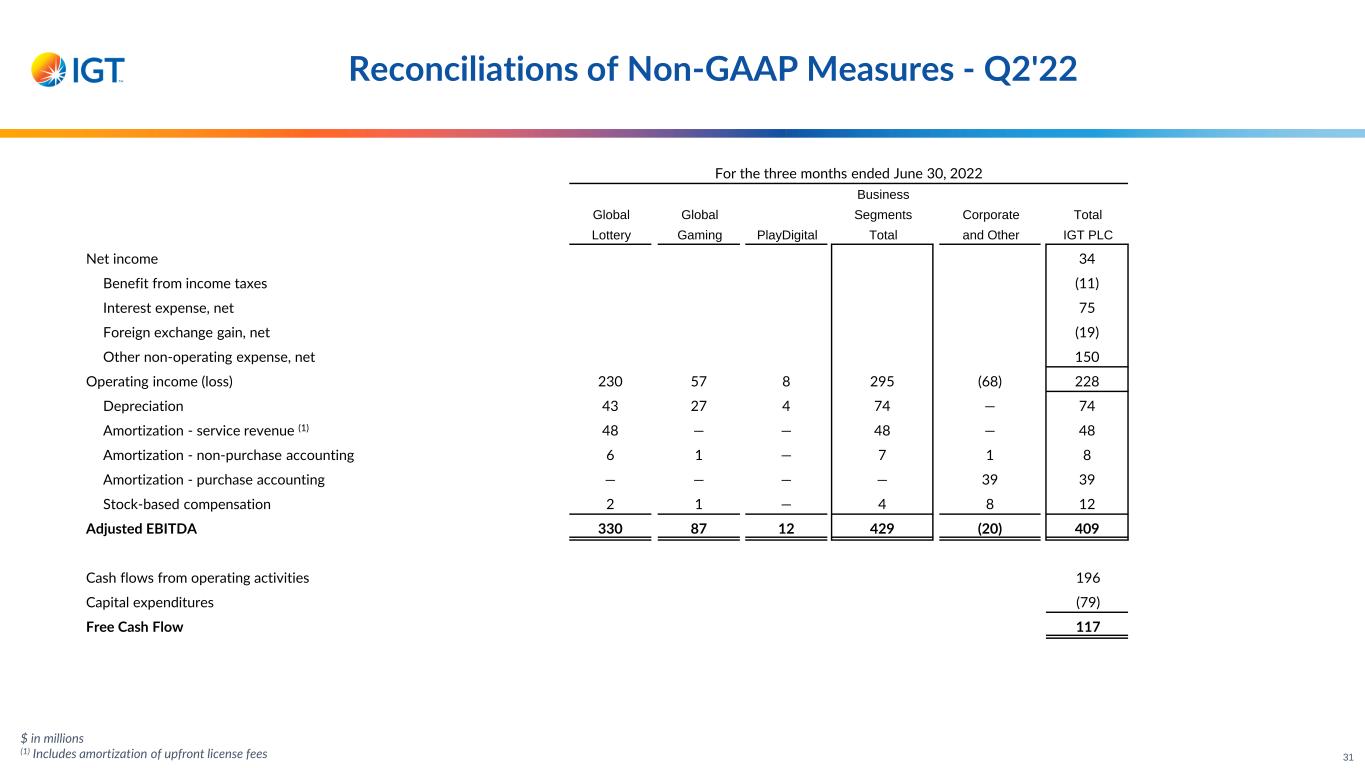
$ in millions (1) Includes amortization of upfront license fees For the three months ended June 30, 2022 Business Global Global Segments Corporate Total Lottery Gaming PlayDigital Total and Other IGT PLC Net income 34 Benefit from income taxes (11) Interest expense, net 75 Foreign exchange gain, net (19) Other non-operating expense, net 150 Operating income (loss) 230 57 8 295 (68) 228 Depreciation 43 27 4 74 — 74 Amortization - service revenue (1) 48 — — 48 — 48 Amortization - non-purchase accounting 6 1 — 7 1 8 Amortization - purchase accounting — — — — 39 39 Stock-based compensation 2 1 — 4 8 12 Adjusted EBITDA 330 87 12 429 (20) 409 Cash flows from operating activities 196 Capital expenditures (79) Free Cash Flow 117 Reconciliations of Non-GAAP Measures - Q2'22 31
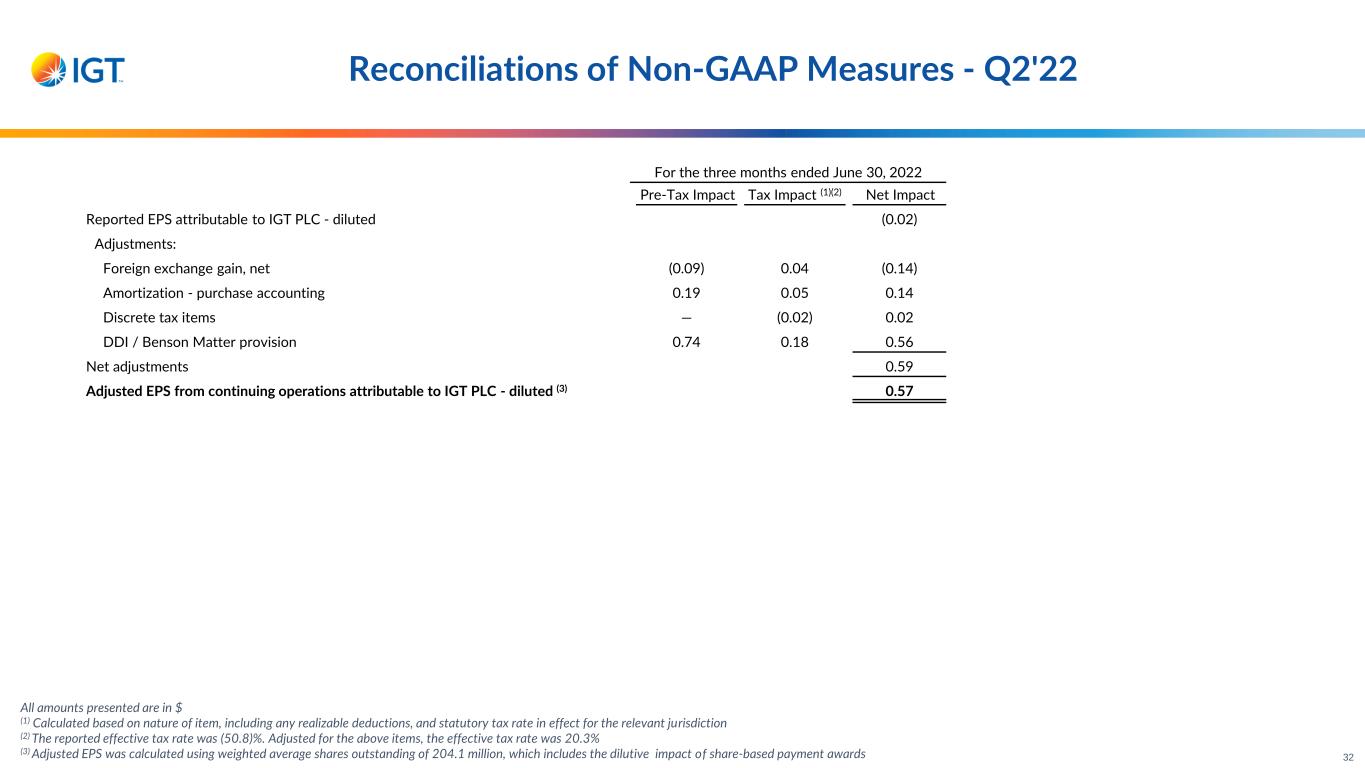
For the three months ended June 30, 2022 Pre-Tax Impact Tax Impact (1)(2) Net Impact Reported EPS attributable to IGT PLC - diluted (0.02) Adjustments: Foreign exchange gain, net (0.09) 0.04 (0.14) Amortization - purchase accounting 0.19 0.05 0.14 Discrete tax items — (0.02) 0.02 DDI / Benson Matter provision 0.74 0.18 0.56 Net adjustments 0.59 Adjusted EPS from continuing operations attributable to IGT PLC - diluted (3) 0.57 All amounts presented are in $ (1) Calculated based on nature of item, including any realizable deductions, and statutory tax rate in effect for the relevant jurisdiction (2) The reported effective tax rate was (50.8)%. Adjusted for the above items, the effective tax rate was 20.3% (3) Adjusted EPS was calculated using weighted average shares outstanding of 204.1 million, which includes the dilutive impact of share-based payment awards Reconciliations of Non-GAAP Measures - Q2'22 32
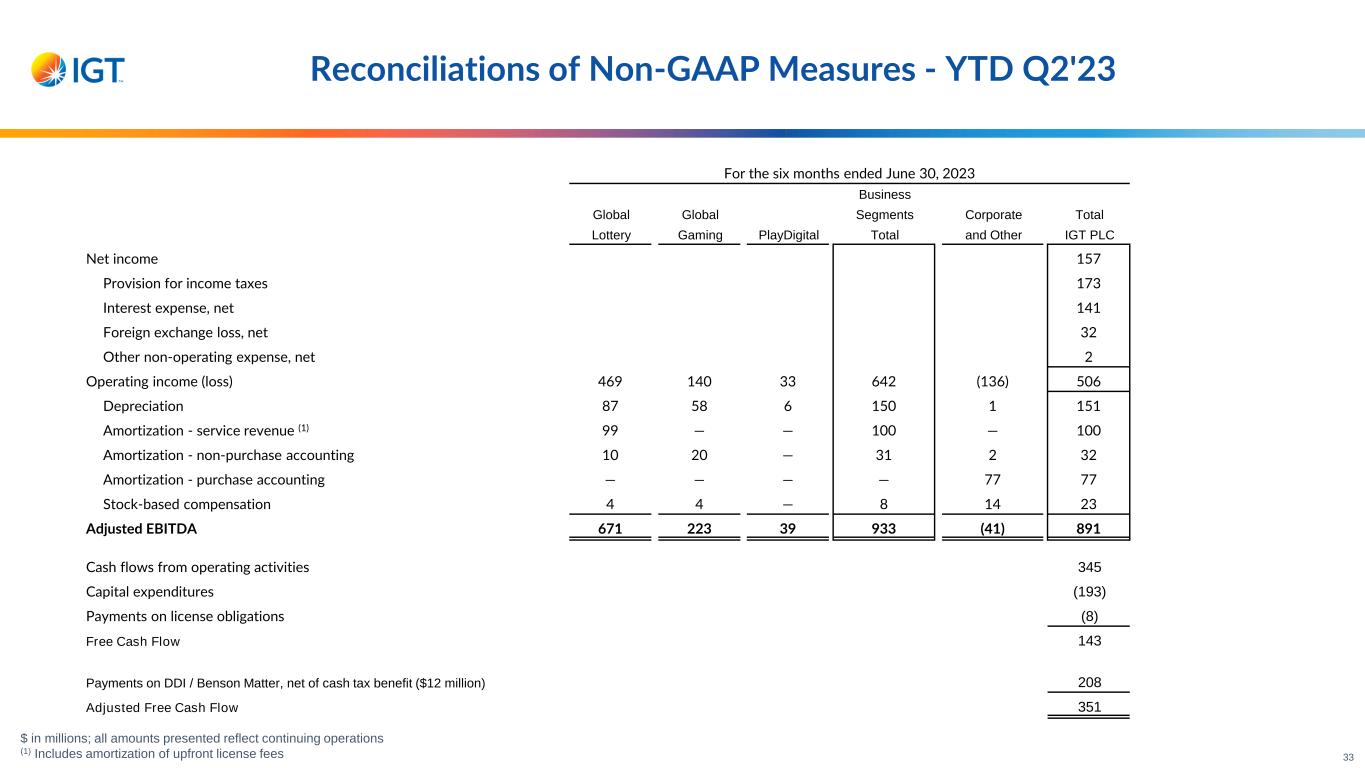
Reconciliations of Non-GAAP Measures - YTD Q2'23 For the six months ended June 30, 2023 Business Global Global Segments Corporate Total Lottery Gaming PlayDigital Total and Other IGT PLC Net income 157 Provision for income taxes 173 Interest expense, net 141 Foreign exchange loss, net 32 Other non-operating expense, net 2 Operating income (loss) 469 140 33 642 (136) 506 Depreciation 87 58 6 150 1 151 Amortization - service revenue (1) 99 — — 100 — 100 Amortization - non-purchase accounting 10 20 — 31 2 32 Amortization - purchase accounting — — — — 77 77 Stock-based compensation 4 4 — 8 14 23 Adjusted EBITDA 671 223 39 933 (41) 891 Cash flows from operating activities 345 Capital expenditures (193) Payments on license obligations (8) Free Cash Flow 143 Payments on DDI / Benson Matter, net of cash tax benefit ($12 million) 208 Adjusted Free Cash Flow 351 $ in millions; all amounts presented reflect continuing operations (1) Includes amortization of upfront license fees 33
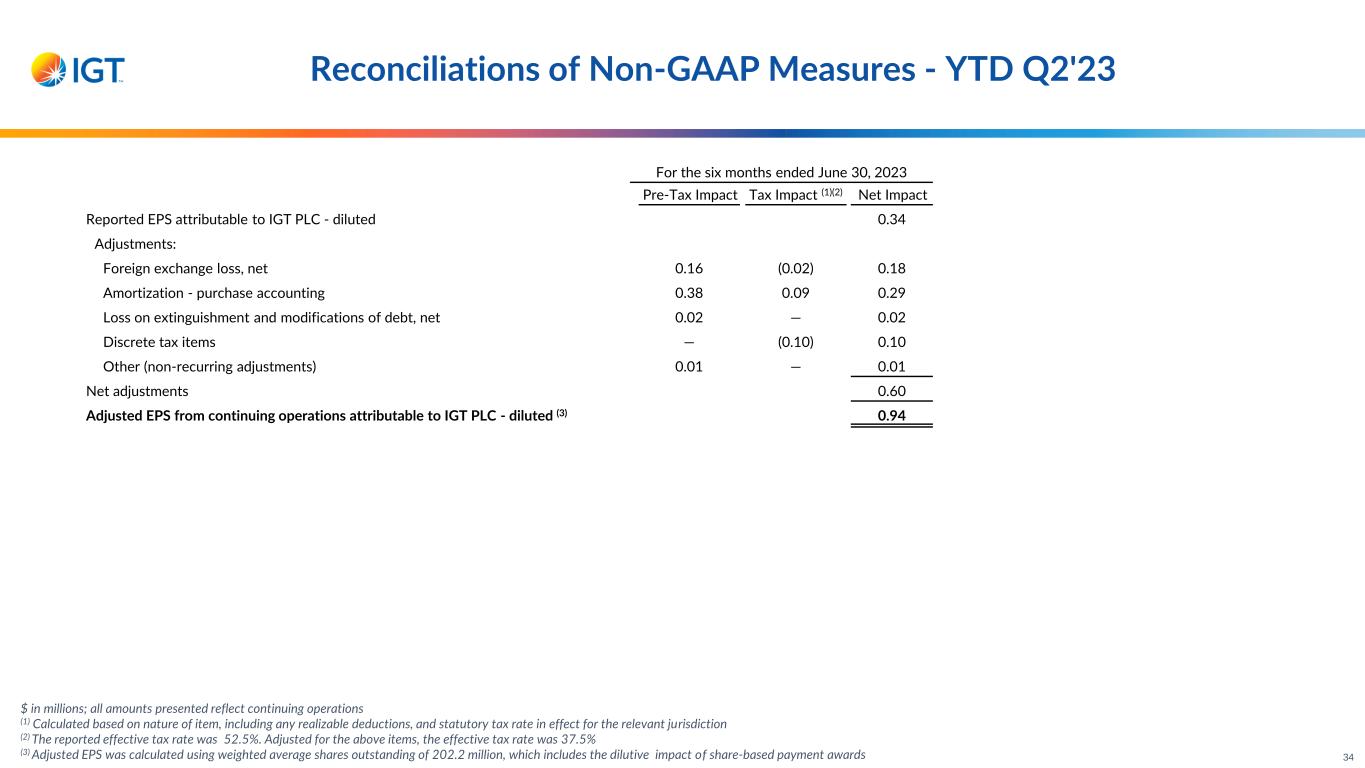
For the six months ended June 30, 2023 Pre-Tax Impact Tax Impact (1)(2) Net Impact Reported EPS attributable to IGT PLC - diluted 0.34 Adjustments: Foreign exchange loss, net 0.16 (0.02) 0.18 Amortization - purchase accounting 0.38 0.09 0.29 Loss on extinguishment and modifications of debt, net 0.02 — 0.02 Discrete tax items — (0.10) 0.10 Other (non-recurring adjustments) 0.01 — 0.01 Net adjustments 0.60 Adjusted EPS from continuing operations attributable to IGT PLC - diluted (3) 0.94 Reconciliations of Non-GAAP Measures - YTD Q2'23 $ in millions; all amounts presented reflect continuing operations (1) Calculated based on nature of item, including any realizable deductions, and statutory tax rate in effect for the relevant jurisdiction (2) The reported effective tax rate was 52.5%. Adjusted for the above items, the effective tax rate was 37.5% (3) Adjusted EPS was calculated using weighted average shares outstanding of 202.2 million, which includes the dilutive impact of share-based payment awards 34
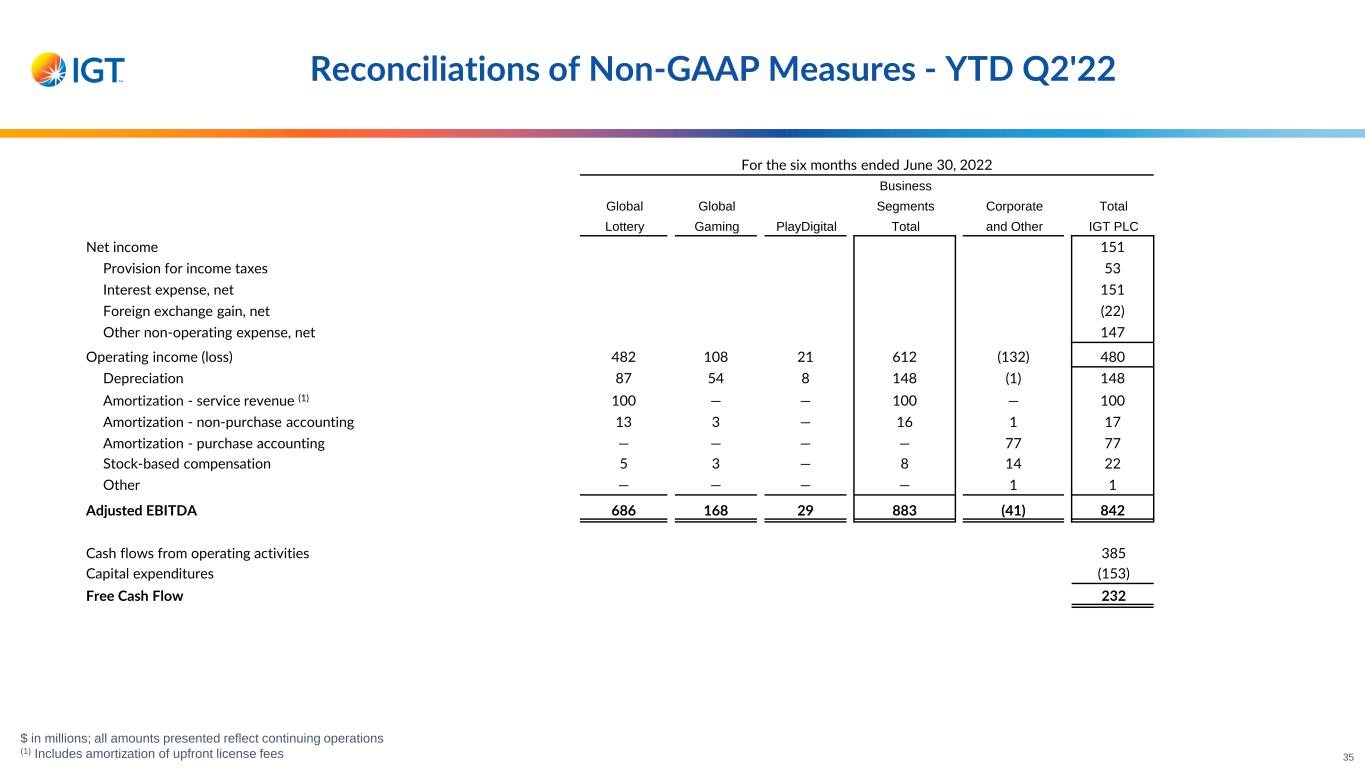
Reconciliations of Non-GAAP Measures - YTD Q2'22 $ in millions; all amounts presented reflect continuing operations (1) Includes amortization of upfront license fees For the six months ended June 30, 2022 Business Global Global Segments Corporate Total Lottery Gaming PlayDigital Total and Other IGT PLC Net income 151 Provision for income taxes 53 Interest expense, net 151 Foreign exchange gain, net (22) Other non-operating expense, net 147 Operating income (loss) 482 108 21 612 (132) 480 Depreciation 87 54 8 148 (1) 148 Amortization - service revenue (1) 100 — — 100 — 100 Amortization - non-purchase accounting 13 3 — 16 1 17 Amortization - purchase accounting — — — — 77 77 Stock-based compensation 5 3 — 8 14 22 Other — — — — 1 1 Adjusted EBITDA 686 168 29 883 (41) 842 Cash flows from operating activities 385 Capital expenditures (153) Free Cash Flow 232 35
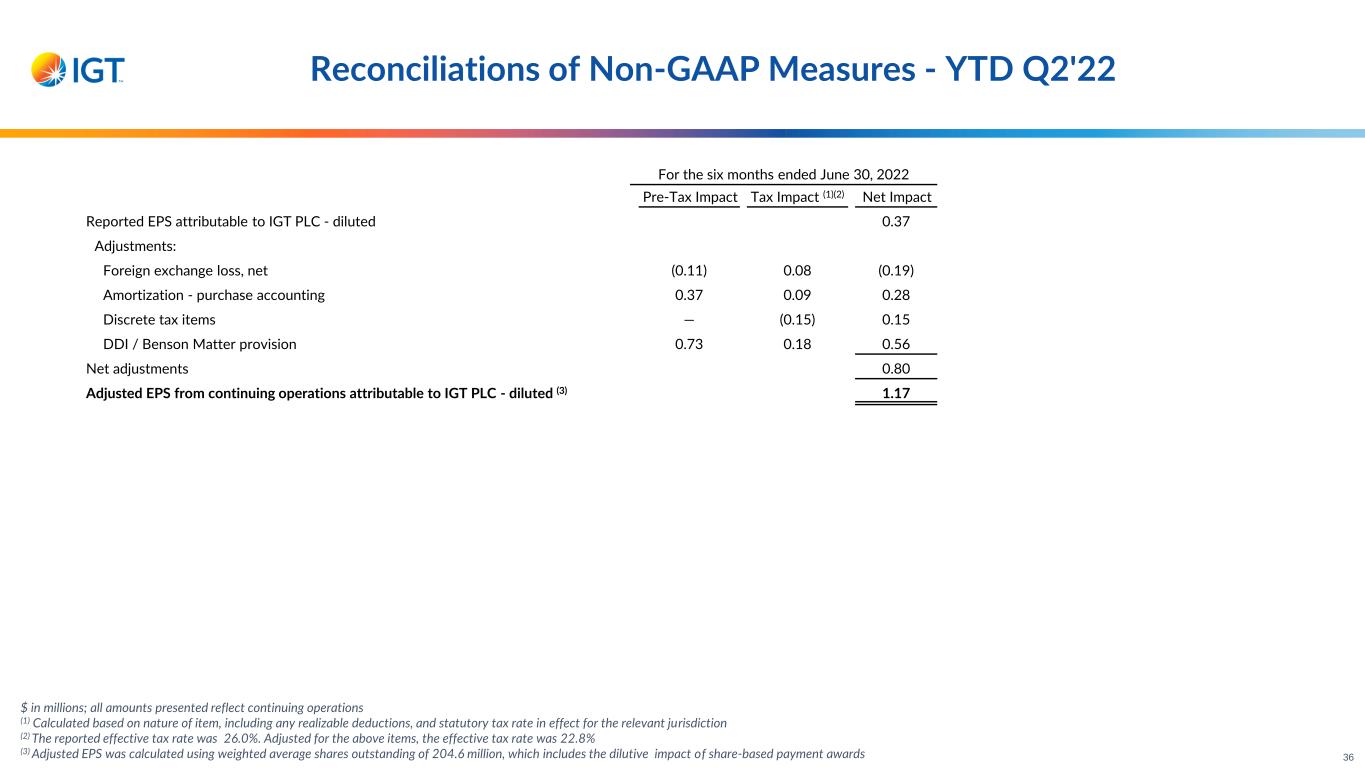
For the six months ended June 30, 2022 Pre-Tax Impact Tax Impact (1)(2) Net Impact Reported EPS attributable to IGT PLC - diluted 0.37 Adjustments: Foreign exchange loss, net (0.11) 0.08 (0.19) Amortization - purchase accounting 0.37 0.09 0.28 Discrete tax items — (0.15) 0.15 DDI / Benson Matter provision 0.73 0.18 0.56 Net adjustments 0.80 Adjusted EPS from continuing operations attributable to IGT PLC - diluted (3) 1.17 Reconciliations of Non-GAAP Measures - YTD Q2'22 $ in millions; all amounts presented reflect continuing operations (1) Calculated based on nature of item, including any realizable deductions, and statutory tax rate in effect for the relevant jurisdiction (2) The reported effective tax rate was 26.0%. Adjusted for the above items, the effective tax rate was 22.8% (3) Adjusted EPS was calculated using weighted average shares outstanding of 204.6 million, which includes the dilutive impact of share-based payment awards 36


