Exhibit 99.1
24 Sensitivity: Confidential Supplemental Financial Information |
25 Sensitivity: Confidential Supplemental Financial Information WINDSTREAM HOLDINGS II, LLC UNAUDITED PRO FORMA ADJUSTED RESULTS OF OPERATIONS (NON-GAAP) QUARTERLY SUPPLEMENTAL INFORMATION for the quarterly periods in the years 2021 and 2020 (In millions) ADJUSTED RESULTS OF OPERATIONS: Total 3rd Qtr. 2nd Qtr. 1st Qtr. Total 4th Qtr. 3rd Qtr. 2nd Qtr. 1st Qtr. Revenues and sales: Service revenues 3,283.1 $ 1,078.4 $ 1,101.5 $ 1,103.2 $ 4,591.3 $ 1,118.6 $ 1,143.6 $ 1,157.4 $ 1,171.7 $ Product and fiber sales 46.8 12.5 19.7 14.6 73.7 15.4 17.5 19.5 21.3 Total revenues and sales 3,329.9 1,090.9 1,121.2 1,117.8 4,665.0 1,134.0 1,161.1 1,176.9 1,193.0 Costs and expenses: Cost of services 1,598.9 533.4 531.1 534.4 2,304.9 560.4 585.7 578.2 580.6 Cost of sales 45.8 12.8 15.8 17.2 78.3 15.6 19.5 21.7 21.5 Selling, general and administrative 456.0 155.8 150.8 149.4 660.3 154.1 169.2 161.1 175.9 Costs and expenses 2,100.7 702.0 697.7 701.0 3,043.5 730.1 774.4 761.0 778.0 Adjusted EBITDAR (A) 1,229.2 388.9 423.5 416.8 1,621.5 403.9 386.7 415.9 415.0 Cash payment under master leases with Uniti (498.9) (166.7) (166.4) (165.8) (662.3) (165.9) (165.8) (165.6) (165.0) Cash received from Uniti per settlement agreement 73.5 24.5 24.5 24.5 24.5 24.5 - - - Adjusted EBITDA (B) 803.8 $ 246.7 $ 281.6 $ 275.5 $ 983.7 $ 262.5 $ 220.9 $ 250.3 $ 250.0 $ Margins (C): Adjusted EBITDAR margin 36.9% 35.6% 37.8% 37.3% 34.8% 35.6% 33.3% 35.3% 34.8% Adjusted EBITDA margin 24.1% 22.6% 25.1% 24.6% 21.1% 23.1% 19.0% 21.3% 21.0% Adjusted Capital Expenditures 730.5 $ 221.1 $ 251.4 $ 258.0 $ 1,001.1 $ 274.9 $ 246.1 $ 247.7 $ 232.4 $ Adjusted Free Cash Flow (D) 74.7 $ 14.8 $ 58.7 $ 1.2 $ (157.8) $ 29.1 $ (59.9) $ (68.5) $ (58.5) $ 2020 2021 |
26 Sensitivity: Confidential Supplemental Financial Information WINDSTREAM HOLDINGS II, LLC UNAUDITED PRO FORMA ADJUSTED RESULTS OF OPERATIONS (NON-GAAP) QUARTERLY SUPPLEMENTAL INFORMATION for the quarterly periods in the years 2021 and 2020 (In millions) As of Debt Leverage Ratio: 9/30/2021 Long-term debt, including current maturities (E) 2,128.4 $ Add: Capital lease obligations 37.0 Less: Cash and cash equivalents (140.4) Net debt 2,025.0 $ Twelve Months Ended 9/30/2021 Adjusted EBITDA 1,066.3 $ Net leverage ratio (F) - computed as (1)/(2) 1.90x Available liquidity as of September 30, 2021: Cash and cash equivalents 140.4 $ Available capacity under credit facility (G) 469.2 Available liquidity 609.6 $ |
27 Sensitivity: Confidential Supplemental Financial Information WINDSTREAM HOLDINGS II, LLC UNAUDITED PRO FORMA ADJUSTED RESULTS OF OPERATIONS (NON-GAAP) QUARTERLY SUPPLEMENTAL INFORMATION - REVENUE SUPPLEMENT for the quarterly periods in the years 2021 and 2020 (In millions) Service revenues: Total 3rd Qtr. 2nd Qtr. 1st Qtr. Total 4th Qtr. 3rd Qtr. 2nd Qtr. 1st Qtr. Kinetic: High-speed Internet bundles 832.1 $ 279.9 $ 279.0 $ 273.2 $ 1,047.2 $ 269.3 $ 264.8 $ 258.1 $ 255.0 $ Voice only 58.7 19.1 19.4 20.2 89.6 21.4 22.2 22.7 23.3 Video and miscellaneous 11.3 3.7 3.7 3.9 23.0 3.9 4.6 6.6 7.9 Consumer 902.1 302.7 302.1 297.3 1,159.8 294.6 291.6 287.4 286.2 Small business 203.5 67.6 68.2 67.7 275.5 67.2 68.3 69.0 71.0 Large business 124.1 42.1 40.4 41.6 177.6 41.9 43.4 45.4 46.9 Wholesale 188.4 66.1 61.9 60.4 251.1 62.2 61.9 62.7 64.3 Switched access 15.8 5.2 5.3 5.3 22.4 5.6 5.6 5.8 5.4 CAF Phase II funding 131.5 43.8 43.8 43.9 175.5 43.9 43.9 43.8 43.9 State USF 29.4 9.9 10.2 9.3 75.1 15.3 20.0 19.9 19.9 End user surcharges 64.3 20.8 22.6 20.9 70.7 18.7 18.7 16.2 17.1 Kinetic 1,659.1 558.2 554.5 546.4 2,207.7 549.4 553.4 550.2 554.7 Enterprise: Advanced IP/TDM (A) 870.7 276.3 295.5 298.9 1,346.1 311.2 325.5 348.1 361.3 Strategic (B) 290.7 100.1 97.6 93.0 346.0 91.4 87.7 84.7 82.2 Other (C) 145.5 41.0 47.5 57.0 275.1 61.9 69.3 73.3 70.6 Switched access 11.9 4.0 4.0 3.9 20.0 4.5 5.1 4.8 5.6 End user surcharges 76.0 21.5 26.1 28.4 101.4 27.3 28.0 21.7 24.4 Enterprise 1,394.8 442.9 470.7 481.2 2,088.6 496.3 515.6 532.6 544.1 Wholesale: Core wholesale (D) 228.9 77.2 76.2 75.5 294.6 72.8 74.5 74.5 72.8 End user surcharges 0.3 0.1 0.1 0.1 0.4 0.1 0.1 0.1 0.1 Wholesale 229.2 77.3 76.3 75.6 295.0 72.9 74.6 74.6 72.9 Total service revenues 3,283.1 1,078.4 1,101.5 1,103.2 4,591.3 1,118.6 1,143.6 1,157.4 1,171.7 Product sales: Kinetic product sales 30.9 8.8 10.4 11.7 49.8 10.5 11.3 14.3 13.7 Enterprise product sales 6.3 2.1 1.3 2.9 23.9 4.9 6.2 5.2 7.6 Wholesale fiber sales 9.6 1.6 8.0 - - - - - - Total product and fiber sales 46.8 12.5 19.7 14.6 73.7 15.4 17.5 19.5 21.3 Total revenues and sales 3,329.9 $ 1,090.9 $ 1,121.2 $ 1,117.8 $ 4,665.0 $ 1,134.0 $ 1,161.1 $ 1,176.9 $ 1,193.0 $ (A) (B) (C) (D) Other revenues primarily consist of usage-based long-distance revenues and resale revenues. Core wholesale revenues primarily include revenues from providing fiber connections, data transport and wireless backhaul services. 2021 2020 Advance IP/TDM revenues consist of dynamic Internet protocol, dedicated Internet access, multi-protocol label switching services, integrated voice and data, long distance, managed services, and time- division multiplexing ("TDM") voice and data services. Strategic revenues consist of Software Defined Wide Area Network ("SD-WAN"), Unified Communications as a Service ("UCaaS"), OfficeSuite, and associated network access products and services. |
28 Sensitivity: Confidential Supplemental Financial Information WINDSTREAM HOLDINGS II, LLC UNAUDITED PRO FORMA ADJUSTED RESULTS OF OPERATIONS (NON-GAAP) QUARTERLY SUPPLEMENTAL INFORMATION for the quarterly periods in the years 2021 and 2020 (In millions) Total 3rd Qtr. 2nd Qtr. 1st Qtr. Total 4th Qtr. 3rd Qtr. 2nd Qtr. 1st Qtr. Kinetic Revenues and sales: Service revenues 902.1 $ 302.7 $ 302.1 $ 297.3 $ 1,159.8 $ 294.6 $ 291.6 $ 287.4 $ 286.2 $ Product sales 30.9 8.8 10.4 11.7 49.8 10.5 11.3 14.3 13.7 Total Consumer 933.0 311.5 312.5 309.0 1,209.6 305.1 302.9 301.7 299.9 Small business 203.5 67.6 68.2 67.7 275.5 67.2 68.3 69.0 71.0 Large business 124.1 42.1 40.4 41.6 177.6 41.9 43.4 45.4 46.9 Wholesale 188.4 66.1 61.9 60.4 251.1 62.2 61.9 62.7 64.3 Switched access 15.8 5.2 5.3 5.3 22.4 5.6 5.6 5.8 5.4 CAF Phase II funding 131.5 43.8 43.8 43.9 175.5 43.9 43.9 43.8 43.9 State USF 29.4 9.9 10.2 9.3 75.1 15.3 20.0 19.9 19.9 End user surcharges 64.3 20.8 22.6 20.9 70.7 18.7 18.7 16.2 17.1 Total revenues and sales 1,690.0 567.0 564.9 558.1 2,257.5 559.9 564.7 564.5 568.4 Costs and expenses 766.8 269.9 252.7 244.2 1,009.0 249.1 262.9 250.5 246.5 Kinetic contribution margin 923.2 $ 297.1 $ 312.2 $ 313.9 $ 1,248.5 $ 310.8 $ 301.8 $ 314.0 $ 321.9 $ Kinetic contribution margin % 54.6% 52.4% 55.3% 56.2% 55.3% 55.5% 53.4% 55.6% 56.6% Kinetic retail contribution margin (A) 791.7 $ 253.3 $ 268.4 $ 270.0 $ 1,073.0 $ 266.9 $ 257.9 $ 270.2 $ 278.0 $ Kinetic retail contribution margin % 50.8% 48.4% 51.5% 52.5% 51.5% 51.7% 49.5% 51.9% 53.0% Enterprise Revenues and sales: Service revenues 1,394.8 $ 442.9 $ 470.7 $ 481.2 $ 2,088.6 $ 496.3 $ 515.6 $ 532.6 $ 544.1 $ Product sales 6.3 2.1 1.3 2.9 23.9 4.9 6.2 5.2 7.6 Total revenues and sales 1,401.1 445.0 472.0 484.1 2,112.5 501.2 521.8 537.8 551.7 Costs and expenses 1,143.7 368.5 382.3 392.9 1,751.7 416.9 437.1 437.6 460.1 Enterprise contribution margin 257.4 $ 76.5 $ 89.7 $ 91.2 $ 360.8 $ 84.3 $ 84.7 $ 100.2 $ 91.6 $ Enterprise contribution margin % 18.4% 17.2% 19.0% 18.8% 17.1% 16.8% 16.2% 18.6% 16.6% Wholesale Revenues and sales: Service revenues 229.2 $ 77.3 $ 76.3 $ 75.6 $ 295.0 $ 72.9 $ 74.6 $ 74.6 $ 72.9 $ Fiber sales 9.6 1.6 8.0 - - - - - - Total revenues and sales 238.8 78.9 84.3 75.6 295.0 72.9 74.6 74.6 72.9 Costs and expenses 115.8 38.3 38.8 38.7 165.2 38.2 43.2 43.6 40.2 Wholesale contribution margin 123.0 $ 40.6 $ 45.5 $ 36.9 $ 129.8 $ 34.7 $ 31.4 $ 31.0 $ 32.7 $ Wholesale contribution margin % 51.5% 51.5% 54.0% 48.8% 44.0% 47.6% 42.1% 41.6% 44.9% (A) 2020 2021 Excludes CAF Phase II funding. |
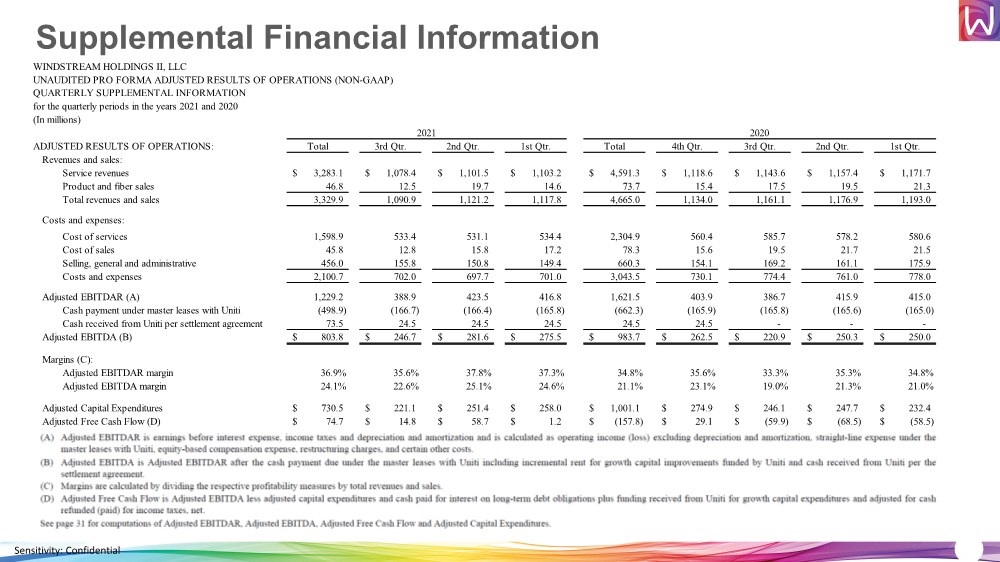
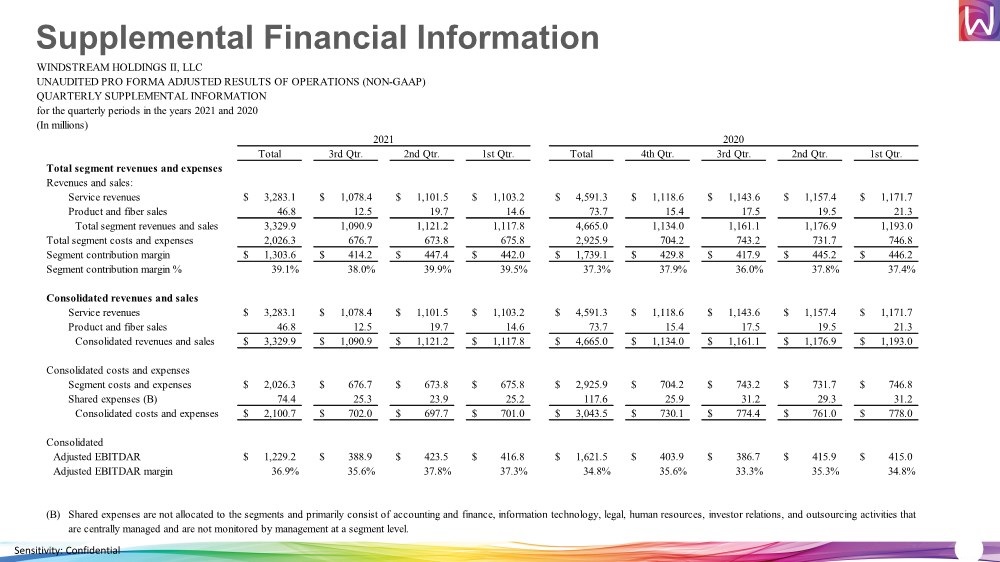
29 Sensitivity: Confidential Supplemental Financial Information WINDSTREAM HOLDINGS II, LLC UNAUDITED PRO FORMA ADJUSTED RESULTS OF OPERATIONS (NON-GAAP) QUARTERLY SUPPLEMENTAL INFORMATION for the quarterly periods in the years 2021 and 2020 (In millions) Total 3rd Qtr. 2nd Qtr. 1st Qtr. Total 4th Qtr. 3rd Qtr. 2nd Qtr. 1st Qtr. Total segment revenues and expenses Revenues and sales: Service revenues 3,283.1 $ 1,078.4 $ 1,101.5 $ 1,103.2 $ 4,591.3 $ 1,118.6 $ 1,143.6 $ 1,157.4 $ 1,171.7 $ Product and fiber sales 46.8 12.5 19.7 14.6 73.7 15.4 17.5 19.5 21.3 Total segment revenues and sales 3,329.9 1,090.9 1,121.2 1,117.8 4,665.0 1,134.0 1,161.1 1,176.9 1,193.0 Total segment costs and expenses 2,026.3 676.7 673.8 675.8 2,925.9 704.2 743.2 731.7 746.8 Segment contribution margin 1,303.6 $ 414.2 $ 447.4 $ 442.0 $ 1,739.1 $ 429.8 $ 417.9 $ 445.2 $ 446.2 $ Segment contribution margin % 39.1% 38.0% 39.9% 39.5% 37.3% 37.9% 36.0% 37.8% 37.4% Consolidated revenues and sales Service revenues 3,283.1 $ 1,078.4 $ 1,101.5 $ 1,103.2 $ 4,591.3 $ 1,118.6 $ 1,143.6 $ 1,157.4 $ 1,171.7 $ Product and fiber sales 46.8 12.5 19.7 14.6 73.7 15.4 17.5 19.5 21.3 Consolidated revenues and sales 3,329.9 $ 1,090.9 $ 1,121.2 $ 1,117.8 $ 4,665.0 $ 1,134.0 $ 1,161.1 $ 1,176.9 $ 1,193.0 $ Consolidated costs and expenses Segment costs and expenses 2,026.3 $ 676.7 $ 673.8 $ 675.8 $ 2,925.9 $ 704.2 $ 743.2 $ 731.7 $ 746.8 $ Shared expenses (B) 74.4 25.3 23.9 25.2 117.6 25.9 31.2 29.3 31.2 Consolidated costs and expenses 2,100.7 $ 702.0 $ 697.7 $ 701.0 $ 3,043.5 $ 730.1 $ 774.4 $ 761.0 $ 778.0 $ Consolidated Adjusted EBITDAR 1,229.2 $ 388.9 $ 423.5 $ 416.8 $ 1,621.5 $ 403.9 $ 386.7 $ 415.9 $ 415.0 $ Adjusted EBITDAR margin 36.9% 35.6% 37.8% 37.3% 34.8% 35.6% 33.3% 35.3% 34.8% (B) 2020 2021 Shared expenses are not allocated to the segments and primarily consist of accounting and finance, information technology, legal, human resources, investor relations, and outsourcing activities that are centrally managed and are not monitored by management at a segment level. |
30 Sensitivity: Confidential Supplemental Financial Information WINDSTREAM HOLDINGS II, LLC QUARTERLY SUPPLEMENTAL INFORMATION for the quarterly periods in the years 2021 and 2020 (Units in thousands, Dollars in millions, except per unit amounts) Total 3rd Qtr. 2nd Qtr. 1st Qtr. Total 4th Qtr. 3rd Qtr. 2nd Qtr. 1st Qtr. Kinetic Operating Metrics: Households served 1,282.7 1,282.7 1,276.1 1,272.7 1,268.0 1,268.0 1,269.3 1,262.7 1,247.2 Net household additions (losses) 14.7 6.6 3.4 4.7 29.1 (1.3) 6.6 15.5 8.3 YOY change in households served 1.1% 1.1% 1.1% 2.0% 2.3% 2.3% 2.5% 1.5% -0.3% Average revenue per household served per month $ 78.59 $ 78.87 $ 79.02 $ 78.01 $ 77.11 $ 77.41 $ 76.78 $ 76.34 $ 76.75 High-speed Internet customers 1,147.1 1,147.1 1,131.9 1,122.4 1,109.3 1,109.3 1,102.3 1,089.4 1,067.3 Net customer additions 37.8 15.2 9.5 13.1 60.0 7.0 12.9 22.1 18.0 YOY change in high-speed Internet 4.1% 4.1% 3.9% 5.2% 5.7% 5.7% 6.0% 5.3% 3.4% Average revenue per high-speed Internet customer per month $ 81.95 $ 81.88 $ 82.51 $ 81.61 $ 80.85 $ 81.18 $ 80.55 $ 79.78 $ 80.32 Service Revenues Used in Average Revenue Per Month Computations Above (per page 3): Kinetic consumer service revenues $ 902.1 $ 302.7 $ 302.1 $ 297.3 $ 1,159.8 $ 294.6 $ 291.6 $ 287.4 $ 286.2 High-speed Internet bundle revenues $ 832.1 $ 279.9 $ 279.0 $ 273.2 $ 1,047.2 $ 269.3 $ 264.8 $ 258.1 $ 255.0 Enterprise: Strategic sales as a percentage of total Enterprise sales (A) 66.4% 57.3% 61.9% 78.3% 62.7% 62.1% 57.0% 62.7% 68.5% Total Capital Expenditures: 734.4 $ $ 224.6 $ 251.8 $ 258.0 $ 1,021.4 $ 274.9 $ 266.4 $ 247.7 $ 232.4 Claims settlements at emergence - - - - (20.3) - (20.3) - - Incremental construction equipment capital expenditures (3.9) (3.5) (0.4) - - - - - - Adjusted Capital Expenditures $ 730.5 $ 221.1 $ 251.4 $ 258.0 $ 1,001.1 $ 274.9 $ 246.1 $ 247.7 $ 232.4 Adjusted Capital Expenditures by Segment: Kinetic 484.2 $ 145.3 $ 165.2 $ 173.7 $ 674.6 $ 183.4 $ 160.9 $ 173.5 $ 156.8 $ Enterprise 154.1 49.1 52.0 53.0 201.9 55.7 46.6 49.8 49.8 Wholesale 92.2 26.7 34.2 31.3 124.6 35.8 38.6 24.4 25.8 Adjusted Capital Expenditures $ 730.5 $ 221.1 $ 251.4 $ 258.0 $ 1,001.1 $ 274.9 $ 246.1 $ 247.7 $ 232.4 (A) 2021 2020 Enterprise strategic sales consist of SD-WAN, UCaaS, OfficeSuite and associated network access products and services. |
31 Sensitivity: Confidential Supplemental Financial Information WINDSTREAM HOLDINGS II, LLC UNAUDITED PRO FORMA ADJUSTED CONSOLIDATED RESULTS (NON-GAAP) QUARTERLY SUPPLEMENTAL INFORMATION for the quarterly periods in the years 2021 and 2020 (In millions) Total 3rd Qtr. 2nd Qtr. 1st Qtr. Total 4th Qtr. 3rd Qtr. 2nd Qtr. 1st Qtr. ADJUSTED FREE CASH FLOW: Operating income (loss) 175.0 $ 26.3 $ 75.0 $ 73.7 $ 87.4 $ 71.9 $ (23.4) $ 24.8 $ 14.1 $ Depreciation and amortization 554.4 195.8 181.5 177.1 829.4 164.5 212.4 219.9 232.6 EBITDA 729.4 222.1 256.5 250.8 916.8 236.4 189.0 244.7 246.7 Adjustments: Straight-line expense under master leases with Uniti 477.8 160.3 158.8 158.7 662.4 158.0 167.3 168.3 168.8 Cash payment under master leases with Uniti (498.9) (166.7) (166.4) (165.8) (662.3) (165.9) (165.8) (165.6) (165.0) Cash received from Uniti per settlement agreement 73.5 24.5 24.5 24.5 24.5 24.5 - - - Revenues related to customer contracts and fiber assets sold to Uniti - - - - (23.9) - (7.6) (8.4) (7.9) Restructuring charges 5.5 1.1 2.4 2.0 19.0 2.6 4.4 5.6 6.4 Other costs (A) 11.6 3.8 4.1 3.7 44.1 5.2 33.2 5.3 0.4 Equity-based compensation 4.9 1.6 1.7 1.6 3.1 1.7 0.4 0.4 0.6 Adjusted EBITDA 803.8 246.7 281.6 275.5 983.7 262.5 220.9 250.3 250.0 Adjusted Capital Expenditures (730.5) (221.1) (251.4) (258.0) (1,001.1) (274.9) (246.1) (247.7) (232.4) Uniti funding of growth capital expenditures 152.2 60.1 49.4 42.7 84.7 55.6 29.1 - - Cash paid for interest on long-term debt obligations (152.7) (68.5) (15.9) (68.3) (224.1) (14.1) (63.7) (70.3) (76.0) Cash refunded (paid) for income taxes, net 1.9 (2.4) (5.0) 9.3 (1.0) - (0.1) (0.8) (0.1) Adjusted Free Cash Flow 74.7 $ 14.8 $ 58.7 $ 1.2 $ (157.8) $ 29.1 $ (59.9) $ (68.5) $ (58.5) $ COMPUTATION OF ADJUSTED EBITDA: Operating income (loss) 175.0 $ 26.3 $ 75.0 $ 73.7 $ 87.4 $ 71.9 $ (23.4) $ 24.8 $ 14.1 $ Depreciation and amortization expense 554.4 195.8 181.5 177.1 829.4 164.5 212.4 219.9 232.6 Straight-line expense under master leases with Uniti 477.8 160.3 158.8 158.7 662.4 158.0 167.3 168.3 168.8 Revenues related to customer contracts and fiber assets sold to Uniti - - - - (23.9) - (7.6) (8.4) (7.9) Restructuring charges 5.5 1.1 2.4 2.0 19.0 2.6 4.4 5.6 6.4 Other costs (A) 11.6 3.8 4.1 3.7 44.1 5.2 33.2 5.3 0.4 Equity-based compensation 4.9 1.6 1.7 1.6 3.1 1.7 0.4 0.4 0.6 Adjusted EBITDAR 1,229.2 388.9 423.5 416.8 1,621.5 403.9 386.7 415.9 415.0 Cash payment under master leases with Uniti (498.9) (166.7) (166.4) (165.8) (662.3) (165.9) (165.8) (165.6) (165.0) Cash received from Uniti per settlement agreement 73.5 24.5 24.5 24.5 24.5 24.5 - - - Adjusted EBITDA 803.8 $ 246.7 $ 281.6 $ 275.5 $ 983.7 $ 262.5 $ 220.9 $ 250.3 $ 250.0 $ 2020 2021 (A) Total 3rd Qtr. 2nd Qtr. 1st Qtr. Total 4th Qtr. 3rd Qtr. 2nd Qtr. 1st Qtr. Spend commitment penalties (1) - $ - - $ - $ 24.0 $ - $ 22.8 $ 0.8 $ 0.4 $ Professional, legal and consulting fees - post-bankruptcy (2) 11.3 2.4 4.6 4.3 10.1 10.1 - - - Start-up costs (3) 2.3 2.3 - - - - - - - COVID-19 incremental expenses (4) (2.0) (0.9) (0.5) (0.6) 10.0 (4.9) 10.4 4.5 - Other costs 11.6 $ 3.8 $ 4.1 $ 3.7 $ 44.1 $ 5.2 $ 33.2 $ 5.3 $ 0.4 $ (1) (2) (3) (4) COVID-19 related costs primarily consist of non-cash accrued vacation pay (inclusive of fourth quarter 2020 true-up) attributable to a one-time benefit permitting employees to carry over up to 40 hours of unused vacation to 2021 and pay premiums for Kinetic field technicians. Amounts in 2021 primarily reflect the amortization of the 2020 carryover accrued vacation pay. Other costs for the periods presented consist of the following: 2020 Reserve for penalties attributable to not meeting certain spend commitments under discount plans with other carriers. 2021 Post-emergence costs associated with the Chapter 11 Cases, as well as consulting fees incurred on certain cost optimization projects. Start-up costs primarily consist of incremental wages incurred in expanding the Company’s workforce to support its internal engineering and fiber construction organization. |