Exhibit 99.1
25 October 2022 | NYSE: NXRT
EARNINGS SUPPLEMENT: THIRD QUARTER 2022

NEXPOINT RESIDENTIAL TRUST, INC.
300 CRESCENT COURT, SUITE 700
DALLAS, TX 75201
INVESTOR RELATIONS:
KRISTEN THOMAS
NEXPOINT RESIDENTIAL TRUST, INC. [NYSE:NXRT]
TABLE OF CONTENTS
Earnings Release | 1 |
Cautionary Statement Regarding Forward-Looking Statements | 3 |
Balance Sheet Improvements | 4 |
Overview | 6 |
Highlights of Recent Activity | 7 |
Financial Summary | 8 |
2022 Full Year Guidance | 9 |
Components of Net Asset Value | 10 |
Consolidated Balance Sheets | 11 |
Consolidated Statements of Operations | 12 |
NOI and Same Store NOI | 13 |
Q3 Same Store Results | 14 |
Q3 Same Store Properties Operating Metrics | 16 |
QoQ Same Store Properties Operating Metrics | 17 |
YTD Same Store Results | 18 |
FFO, Core FFO and AFFO | 20 |
Historical Capital Expenditures | 21 |
Value-Add Program Details | 22 |
Outstanding Debt Details | 25 |
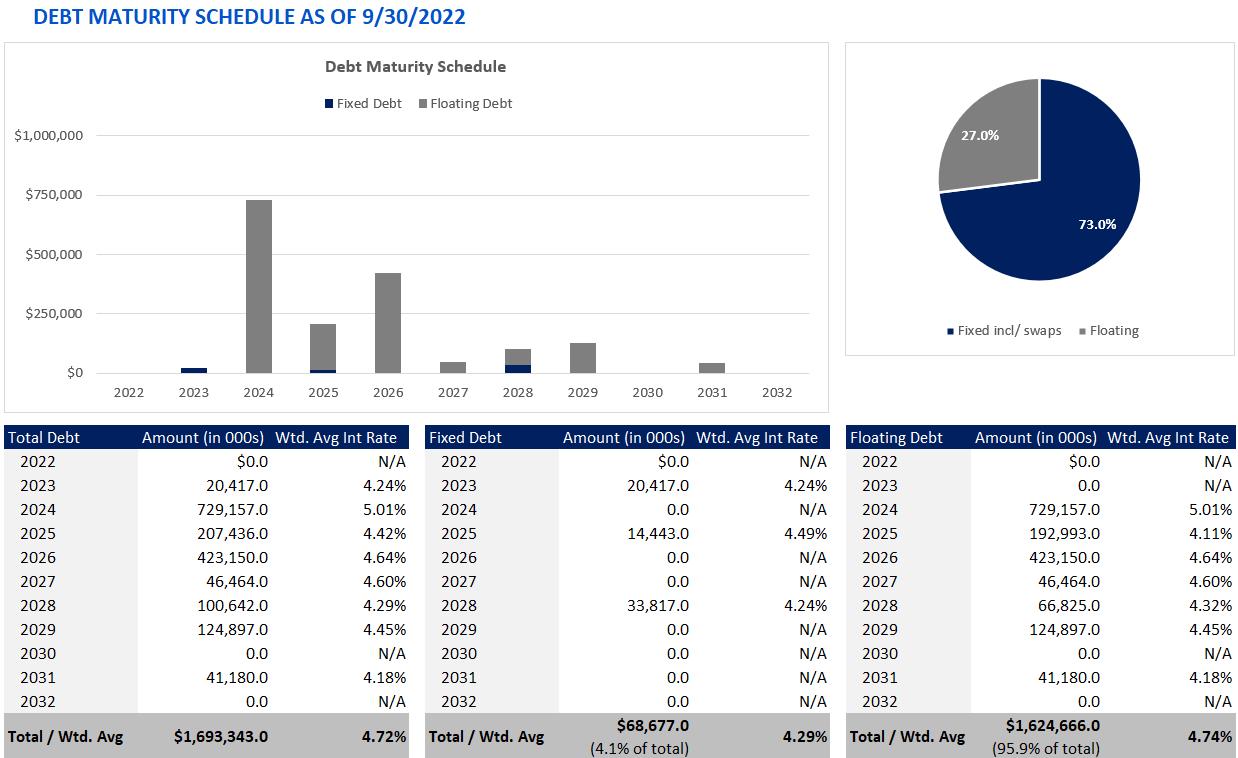
Debt Maturity Schedule | 27 |
Historical Acquisition Details | 28 |
Historical Disposition Details | 29 |
Definitions and Reconciliations of Non-GAAP Measures | 30 |

|
SEASONS 704 APARTMENTS: WEST PALM BEACH, FL |
|
Q3 LEASED UPGRADES AVERAGED +24.3% ROI |

|
ENHANCED POOL AMENITY FOR RESIDENTS
NEXPOINT RESIDENTIAL TRUST, INC. [NYSE:NXRT]

FOR IMMEDIATE RELEASE
Contact:
Investor Relations
Kristen Thomas
IR@nexpoint.com
Media inquiries: Pro-Nexpoint@prosek.com
NEXPOINT RESIDENTIAL TRUST, INC. REPORTS THIRD QUARTER 2022 RESULTS
NXRT Reports Continued Strength in Operations, Boosts Quarterly Dividend by 10.5% and Announces Accretive
19-Property Refinancing Transaction, Extending Average Maturity to ~6.4 years
Dallas, TX, October 25, 2022 – NexPoint Residential Trust, Inc. (NYSE:NXRT) reported financial results for the third quarter ended September 30, 2022.
Highlights
• | NXRT1 reported Net Loss, FFO2, Core FFO2 and AFFO2 of $(0.6)M, $24.5M, $21.8M and $24.3M, respectively, attributable to common stockholders for the quarter ended September 30, 2022, compared to Net Loss, FFO, Core FFO, and AFFO of $(5.4)M, $16.1M, $16.4M and $18.6M, respectively, attributable to common stockholders for the quarter ended September 30, 2021. |
• | NXRT reported Net Loss, FFO, Core FFO and AFFO of $(13.0)M, $61.2M, $62.3M and $69.4M, respectively, attributable to common stockholders for the nine months ended September 30, 2022, compared to Net Loss, FFO, Core FFO, and AFFO of $(15.7)M, $46.5M, $44.7M and $51.0M, respectively, attributable to common stockholders for the nine months ended September 30, 2021. |
• | For the three months ended September 30, 2022, Q3 Same Store properties3 average effective rent, total revenue and NOI2 increased 19.4%, 15.0% and 13.1%, respectively, and occupancy decreased 130 bps over the prior year period. |
• | For the nine months ended September 30, 2022, YTD Same Store properties3 average effective rent, total revenue and NOI2 increased 19.9%, 13.6% and 15.8%, respectively, and occupancy decreased 140 bps over the prior year period. |
• | NXRT paid a third quarter dividend of $0.38 per share of common stock on September 30, 2022. |
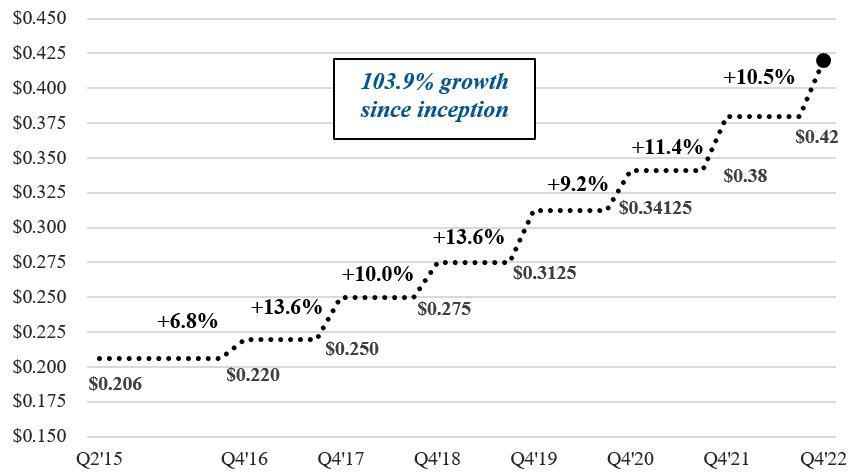
• | On October 24, 2022, the Company’s board approved a quarterly dividend of $0.42 per share, an 10.5% increase from the previous dividend per share. Since inception, NXRT has increased the dividend per share by 103.9%. |
• | On October 24, 2022, the Company’s board of directors increased the share repurchase authorization to $100.0 million and extended the authorization to October 24, 2024. |
• | During the three months ended September 30, 2022, NXRT repurchased and retired 98,906 shares at a weighted average price of $60.57 per share. Since inception, NXRT has repurchased 2,550,628 shares at a weighted average price of $28.37 per share. |
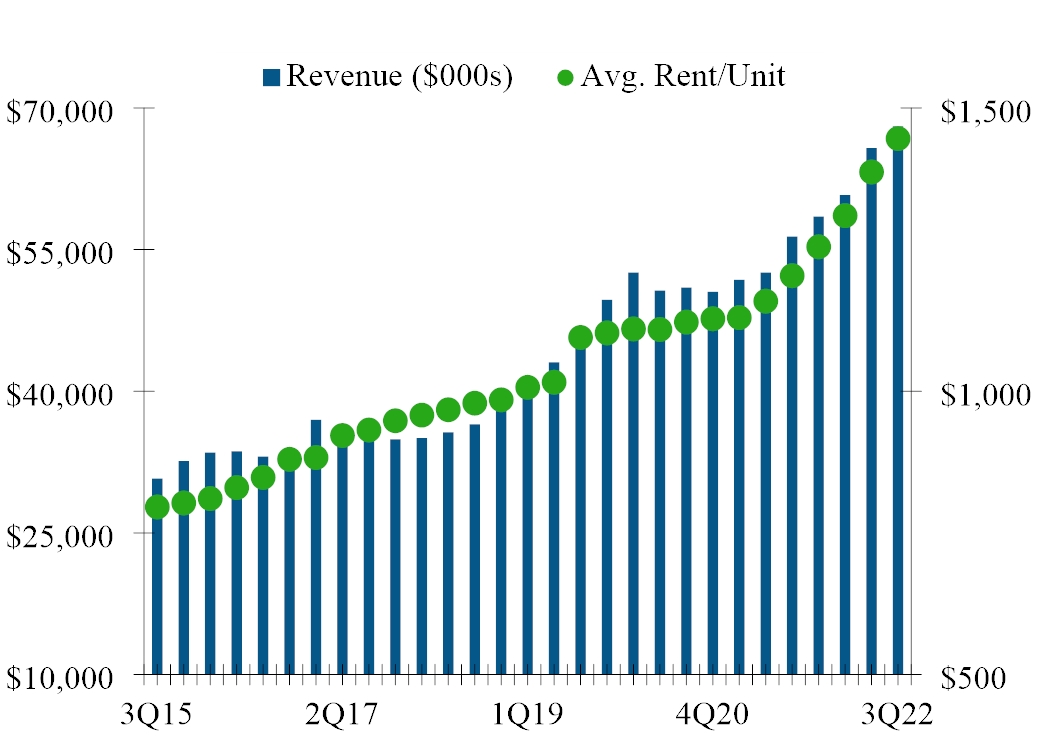
• | The weighted average effective monthly rent per unit across all 41 properties held as of September 30, 2022 (the “Portfolio”), consisting of 15,3874 units, was $1,446, while physical occupancy was 94.1%. |
• | During the third quarter 2022, for the properties in our Portfolio, we completed 649 full and partial upgrades and leased 592 upgraded units, achieving an average monthly rent premium of $163 and a 24.3% ROI5. |
• | Since inception, for the properties currently in our Portfolio, we have completed 7,354 full and partial upgrades, 4,853 kitchen and laundry appliances, and 10,451 technology packages, resulting in a $146, $49, and $44 average monthly rental increase per unit and a 22.0%, 69.3%, and 37.3% ROI, respectively. |
1) | In this release, “we,” “us,” “our,” the “Company,” “NexPoint Residential Trust,” and “NXRT” each refer to NexPoint Residential Trust, Inc., a Maryland corporation. |
2) | FFO, Core FFO, AFFO and NOI are non-GAAP measures. For a discussion of why we consider these non-GAAP measures useful and reconciliations of FFO, Core FFO, AFFO and NOI to net loss, see the “Definitions and Reconciliations of Non-GAAP Measures,” “FFO, Core FFO and AFFO” and “NOI and Same Store NOI” sections of this release. |
3) | We define “Same Store” properties as properties that were in our Portfolio for the entirety of the periods being compared. There are 36 properties encompassing 13,930 units of apartment space in our Same Store pool for the three months ended September 30, 2022 (our “Q3 Same Store” properties) and 34 properties encompassing 13,426 units of apartment space in our Same Store pool for the nine months ended September 30, 2022 (our “YTD Same Store” properties). The same store unit count excludes 74 units that are currently down due to casualty events (Silverbrook: 16 units, Timber Creek: 16 units, Arbors of Brentwood: 16 units, Venue at 8651: 8 units, Hollister Place: 8 units, Versailles: 5 units, The Preserve at Terrell Mill: 3 units, and Parc500: 2 units). |
NEXPOINT RESIDENTIAL TRUST, INC. [NYSE:NXRT]
4) | Total units owned in our Portfolio is 15,387, however 81 units are currently down due to casualty events (Silverbrook: 16 units, Timber Creek: 16 units, Arbors of Brentwood: 16 units, Venue at 8651: 8 units, Hollister Place: 8 units, Six Forks: 6 units, Versailles: 5 units, The Preserve at Terrell Mill: 3 units, Parc500: 2 units, and High House at Cary: 1 unit). |
5) | We define Return on Investment (“ROI”) as the sum of the actual rent premium divided by the sum of the total cost. |
Third Quarter 2022 Financial Results
• | Total revenues were $68.1 million for the third quarter of 2022, compared to $56.4 million for the third quarter of 2021. |
• | Net loss for the third quarter of 2022 totaled $(0.6) million, or loss of $(0.02) per diluted share, which included $25.2 million of depreciation and amortization expense. This compared to a net loss of $(5.4) million, or loss of $(0.21) per diluted share, for the third quarter of 2021, which included $21.6 million of depreciation and amortization expense. |
• | The change in our net loss of $(0.6) million for the three months ended September 30, 2022 as compared to our net loss of $(5.4) million for the three months ended September 30, 2021 primarily relates to an increase in total revenues, partially offset by an increase in depreciation expense. |
• | For the third quarter of 2022, NOI was $39.9 million on 41 properties, compared to $33.6 million for the third quarter of 2021 on 40 properties. |
• | For the third quarter of 2022, Q3 Same Store NOI increased 13.1% to $36.1 million, compared to $31.9 million for the third quarter of 2021. |
• | For the third quarter of 2022, FFO totaled $24.5 million, or $0.96 per diluted share, compared to $16.1 million, or $0.64 per diluted share, for the third quarter of 2021. |
• | For the third quarter of 2022, Core FFO totaled $21.8 million, or $0.85 per diluted share, compared to $16.4 million, or $0.65 per diluted share, for the third quarter of 2021. |
• | For the third quarter of 2022, AFFO totaled $24.3 million, or $0.95 per diluted share, compared to $18.6 million, or $0.74 per diluted share, for the third quarter of 2021. |
2022 Year to Date Financial Results
• | Total revenues were $194.6 million for the nine months ended September 30, 2022, compared to $160.7 million for the nine months ended September 30, 2021. |
• | Net loss for the nine months ended September 30, 2022 totaled $(13.0) million, or loss of $(0.51) per diluted share, which included $74.5 million of depreciation and amortization expense. This compared to net loss of $(15.7) million, or loss of $(0.62) per diluted share, for the nine months ended September 30, 2021, which included $62.3 million of depreciation and amortization expense. |
• | The change in our net loss of $(13.0) million for the nine months ended September 30, 2022 as compared to our net loss of $(15.7) million for the nine months ended September 30, 2021 primarily relates to an increase in total revenues, partially offset by a decrease in casualty gains and an increase in depreciation expense. |
• | For the nine months ended September 30, 2022, NOI was $115.3 million on 41 properties, compared to $93.6 million for the nine months ended September 30, 2021 on 40 properties. |
• | For the nine months ended September 30, 2022, Same Store NOI increased 15.8% to $101.5 million, compared to $87.7 million for the nine months ended September 30, 2021. |
• | For the nine months ended September 30, 2022, FFO totaled $61.2 million, or $2.39 per diluted share, compared to $46.5 million, or $1.85 per diluted share, for the nine months ended September 30, 2021. |
• | For the nine months ended September 30, 2022, Core FFO totaled $62.3 million, or $2.43 per diluted share, compared to $44.7 million, or $1.78 per diluted share, for the nine months ended September 30, 2021. |
• | For the nine months ended September 30, 2022, AFFO totaled $69.4 million, or $2.71 per diluted share, compared to $51.0 million, or $2.03 per diluted share, for the nine months ended September 30, 2021. |
NEXPOINT RESIDENTIAL TRUST, INC. [NYSE:NXRT]
Third Quarter Earnings Conference Call
NXRT will host a conference call on Tuesday, October 25, 2022 at 11:00 a.m. ET (10:00 am CT), to discuss third quarter financial results. The conference call can be accessed live over the phone by dialing 888-882-4478 or, for international callers, +1 646-828-8193 and using passcode Conference ID: 7733315. A live audio webcast of the call will be available online at the Company's website, https://nxrt.nexpoint.com (under "Resources"). An online replay will be available shortly after the call on the Company's website and continue to be available for 60 days.
A replay of the conference call will also be available through Tuesday, November 1, 2022, by dialing 888-203-1112 or, for international callers, +1 719-457-0820 and entering passcode 7733315.
About NXRT
NexPoint Residential Trust is a publicly traded REIT, with its shares listed on the New York Stock Exchange under the symbol “NXRT,” primarily focused on acquiring, owning and operating well-located, middle-income multifamily properties with “value-add” potential in large cities and suburban submarkets of large cities, primarily in the Southeastern and Southwestern United States. NXRT is externally advised by NexPoint Real Estate Advisors, L.P., an affiliate of NexPoint Advisors, L.P., an SEC-registered investment advisor, which has extensive real estate experience. Our filings with the Securities and Exchange Commission (the “SEC”) are available on our website, nxrt.nexpoint.com, under the “Financials” tab.
Cautionary Statement Regarding Forward-Looking Statements
This release contains forward-looking statements within the meaning of the Private Securities Litigation Reform Act of 1995 that are based on management’s current expectations, assumptions and beliefs. Forward-looking statements can often be identified by words such as “believe,” “assume,” “expect,” “anticipate,” “estimate,” “may,” “should,” “could,” “plan” and similar expressions and variations or negatives of these words. These forward-looking statements include, but are not limited to, statements regarding NXRT’s business and industry in general, the expected refinancing and related timing of 19 property-level mortgages, improved pricing on refinancings, expected use of cash out refinancing proceeds to pay down the corporate credit facility, the refinancing is expected to extend the weighted average debt maturity schedule and the debt maturing through 2024 after the expected refinancing, the expected reduction to the weighted average interest rate on total debt before and after interest rate swaps, the results of the refinancing and extension of maturities, the pro forma debt maturity schedule, analysis of the potential impact of rising rates on future years’ growth, including principal debt balances, weighted average notional swap amount, hedged/fixed rate debt percentage, floating rate principal percentage, swap rate, weighted average forward curve, weighted average forward rate, weighted average spread, all in hedge rate, unhedged blended portfolio rate and spread to all in rate for 2023, 2024 and 2025 and the related assumptions, including the 19 property level refinancing, the use of cash out refinancing to pay down debt, the sale of the Houston properties, the expected use of proceeds to pay down debt, the sale and amount of proceeds from the sale, maturing debt balances between 2023 and 2025 remain the same and are refinanced at the same spread achieved on the current 19 assets being refinanced plus the forward SOFR curve, NXRT’s guidance for financial results for the full year 2022, including earnings per diluted share, Core FFO per diluted share, same store rental income, same store total revenue, same store total expenses and same store NOI, and the related assumptions, including expected acquisitions and dispositions, shares outstanding and same store growth projections, NXRT’s net asset value and the related components and assumptions, including anticipated full year and fourth quarter 2022 net income and NOI, acquisitions and dispositions, pro forma adjustments for acquisitions and dispositions, the NOI related to the acquired or disposed of properties, the Cornerstone loan refinancing, estimated value-add expenditures, debt payments, outstanding debt and shares outstanding, NOI guidance for the fourth quarter 2022 and the related assumptions, planned value-add programs, including projected average rent, rent change and return on investment, expected settlement of interest rate swaps and the effect on the debt maturity schedule, rehab budgets and expected acquisitions and dispositions. They are not guarantees of future results and are subject to risks, uncertainties and assumptions that could cause actual results to differ materially from those expressed in any forward-looking statement, including the ultimate duration and severity of the COVID-19 pandemic and the effectiveness of actions taken, or actions that may be taken, by governmental authorities to contain the outbreak or treat its impact, as well as those described in greater detail in our filings with the Securities and Exchange Commission, particularly those described in our Annual Report on Form 10-K. Readers should not place undue reliance on any forward-looking statements and are encouraged to review the Company’s most recent Annual Report on Form 10-K and other filings with the SEC for a more complete discussion of the risks and other factors that could affect any forward-looking statements. The statements made herein speak only as of the date of this release and except as required by law, NXRT does not undertake any obligation to publicly update or revise any forward-looking statements.
NEXPOINT RESIDENTIAL TRUST, INC. [NYSE:NXRT]
UPDATE TO CAPITAL STRUCTURE & MATURITIES
BALANCE SHEET IMPROVEMENTS:
| • | NXRT has executed a loan application and is in the process of refinancing 19 property level mortgages thru KeyBank and Freddie Mac, which, in aggregate, represent ~46.7% of the company’s total outstanding debt. |
| • | Notably, NXRT was able to reach an agreement to refinance at interest rate pricing improved from prior terms (SOFR + 155 bps) – a favorable outcome for the Company that would likely be more difficult to achieve in a negotiation started today. |
| • | The Company expects to use approximately $217mm of cash from refinancing proceeds to pay down the outstanding principal balance of the Company’s most expensive debt capital, the corporate credit facility. Further, NXRT has executed it’s 12-month extension option on the Revolving Credit Facility, pushing that maturity out to June 30, 2025. |
| • | Further, this refinancing activity is expected to effectively extend the company’s weighted average debt maturity schedule to ~6.4 years (from ~3.33 years) – debt maturing through ’24 now equates to ~6.8% of total debt (down from ~44% previously). |
| • | Holistically, this refinancing is expected to reduce NXRT’s weighted average interest rate on total debt by 39 bps to 4.33%, before the impact of interest rate swap contracts. Accounting for the hedging impact of the swap, NXRT’s adjusted weighted average interest rate is expected to be reduced from 3.29% to 2.78%. |
| • | With the completion of this refinancing, the Company has no meaningful debt maturities until June 2025. |
| • | Refinancing and extending maturities on a significant portion of the Company’s first mortgage debt at favorable terms provides greater strategic flexibility, increases liquidity and modestly “de-risks” the company’s balance sheet. |

NEXPOINT RESIDENTIAL TRUST, INC. [NYSE:NXRT]
ANALYSIS OF THE POTENTIAL IMPACT OF RISING RATES ON FUTURE YEARS’ GROWTH
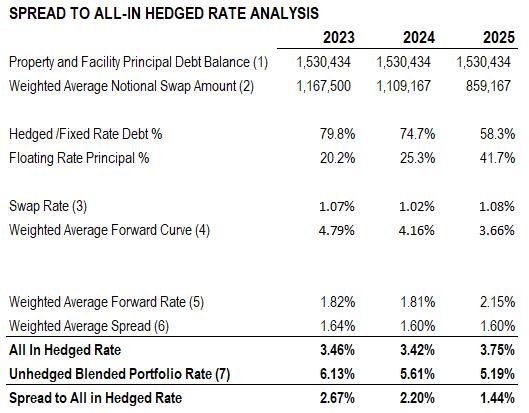
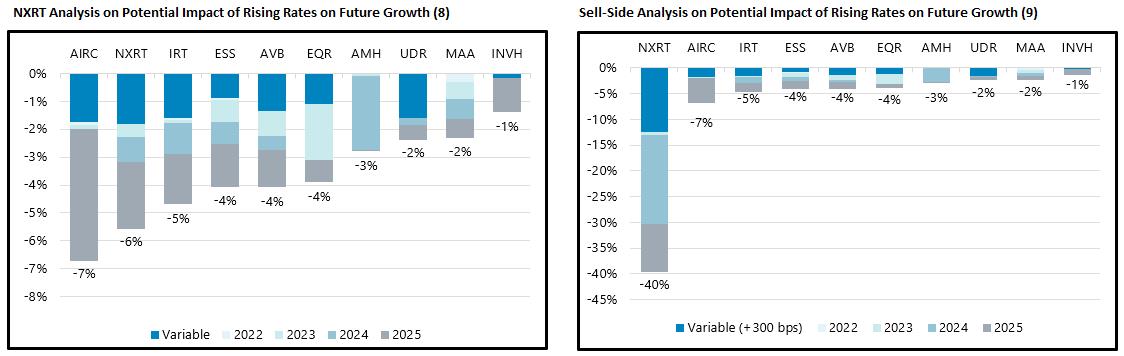
| 1. | Principal debt balances assume the refinancing of 19 property level mortgages, $217mm of facility paydown due to refinancing, and $95mm of facility paydown with Houston net proceeds. Houston net proceeds are assumed to be the midpoint of the Houston Value range on the Components of Q3 2022 Net Asset Value table less existing debt and assumed 5% closing costs. |
| 2. | Weighted average notional Swap amounts take into termination dates. |
| 3. | Yearly swap rate percentage considers all swaps in place in the corresponding year. |
| 4. | Weighted Average Forward Curve considers both SOFR and LIBOR forward curves, all weighted based on asset principal balances over total portfolio debt. |
| 5. | Weighted Average Forward Rate is equal to the Total Property and Principal Facility Debt Balance multiplied by the Hedged /Fixed Rate Debt percentage + Property and Principal Facility Debt Balance multiplied by the Floating Rate Principal percentage. |
| 6. | Weighted Average Spread considers both SOFR and LIBOR forward curves, all weighted based on asset principal balances over total portfolio debt. |
| 7. | Unhedged Blended Portfolio Rate are all-in rates, including asset-specific spreads, SOFR and LIBOR forward curves, fixed rates, and asset-specific rate caps. All are weighted based on asset principal balances over total portfolio debt. |
| 8. | The NXRT Analysis uses Jefferies inputs for all peers of NXRT. NXRT analysis assumes new principal balances for the 19 assets, $217mm of facility paydown due to refinancing, and $95mm of facility paydown with Houston net proceeds. In addition, the analysis assumes all maturing debt balances between 2023 and 2025 remain the same and are refinanced at the same spread achieved on the current 19 assets being refinanced plus the forward SOFR curve. |
| 9. | Jefferies: Seeking Resilience in Multifamily; Downgrade NXRT to Hold; Buy MAA, UDR, IRT (2022). |
NEXPOINT RESIDENTIAL TRUST, INC. [NYSE:NXRT]
NEXPOINT RESIDENTIAL TRUST, INC.: THIRD QUARTER 2022 OVERVIEW
Company Profile
(share counts in thousands) | |
Exchange/Ticker | NYSE: NXRT |
Share Price (1) | $40.87 |
Insider Ownership | 12.76% |
2022 Q4 Dividend Per Share | $0.42 |
Dividend Yield (1) | 4.11% |
Shares Outstanding - basic (2) | 25,598 |
Shares Outstanding - diluted (2) | 25,598 |
(1) | As of the close of market trading on October 24, 2022. |
(2) | Weighted average for the three months ended September 30, 2022. If the Company sustains a net loss for the period presented, unvested restricted stock units are not included in the calculation of diluted shares outstanding. |
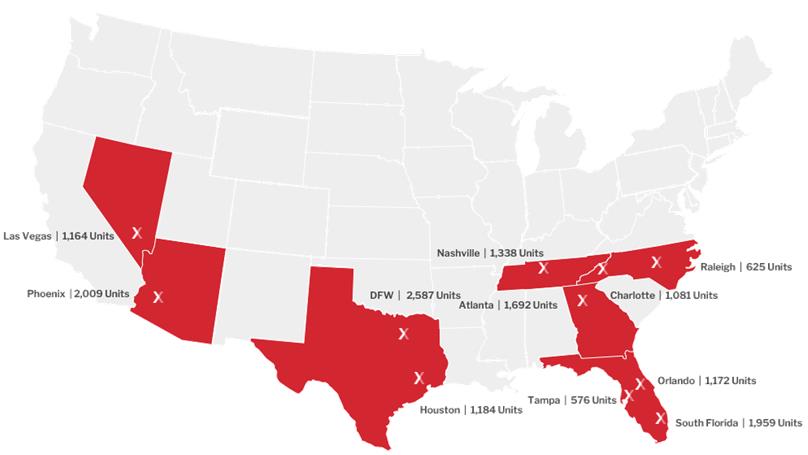
Portfolio Composition by Market |
Market | | % of Units |
Dallas/Fort Worth | | 16.8% |
Phoenix | | 13.1% |
South Florida | | 12.7% |
Atlanta | | 11.0% |
Nashville | | 8.7% |
Houston | | 7.7% |
Orlando | | 7.6% |
Las Vegas | | 7.6% |
Charlotte | | 7.0% |
Raleigh | | 4.1% |
Tampa | | 3.7% |
Total | | 100.0% |
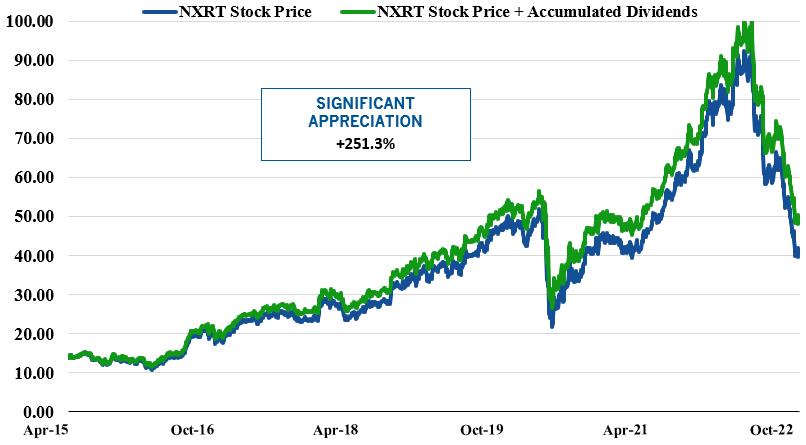
Revenue & Average Rent Per Unit | | Stock Price Performance (Since Inception; 4/1/2015) |
| | |
| | 
|
| | |
NEXPOINT RESIDENTIAL TRUST, INC. [NYSE:NXRT]
Highlights of Recent Activity
DIVIDEND GROWTH
RENT TRADEOUTS
Market | | New Leases | | | % Increase | | | Rent Increase | | | | Renewals | | | % Increase | | | Rent Increase | |
DFW | | | 384 | | | 17.7% | | | $ | 199.14 | | | | | 321 | | | 12.4% | | | $ | 137.07 | |
HOU | | | 202 | | | 5.5% | | | $ | 71.20 | | | | | 126 | | | 9.1% | | | $ | 111.56 | |
CHA | | | 131 | | | 10.2% | | | $ | 125.71 | | | | | 144 | | | 10.1% | | | $ | 119.35 | |
NASH | | | 191 | | | 11.2% | | | $ | 145.17 | | | | | 163 | | | 10.5% | | | $ | 126.22 | |
ATL | | | 180 | | | 13.5% | | | $ | 194.44 | | | | | 276 | | | 11.1% | | | $ | 148.26 | |
ORL | | | 173 | | | 21.9% | | | $ | 298.05 | | | | | 138 | | | 15.7% | | | $ | 207.80 | |
TPA | | | 132 | | | 17.9% | | | $ | 224.64 | | | | | 44 | | | 18.7% | | | $ | 225.70 | |
SFL | | | 241 | | | 22.1% | | | $ | 385.90 | | | | | 307 | | | 16.4% | | | $ | 282.80 | |
PHX | | | 311 | | | 13.8% | | | $ | 180.48 | | | | | 252 | | | 10.4% | | | $ | 137.17 | |
LSV | | | 161 | | | 7.9% | | | $ | 107.32 | | | | | 120 | | | 7.1% | | | $ | 96.65 | |
RDU | | | 74 | | | 10.6% | | | $ | 150.00 | | | | | 99 | | | 9.3% | | | $ | 120.41 | |
TOTAL/AVERAGE | | | 2,180 | | | 14.5% | | | $ | 196.68 | | | | | 1,990 | | | 12.0% | | | $ | 160.93 | |
SAME STORE GROWTH
(In thousands) | | YTD 2022 | | | YTD 2021 | | | % Change | |
Rental income | | $ | 168,628 | | | $ | 148,005 | | | | 13.9 | % |
Other income | | | 4,328 | | | | 4,271 | | | | 1.3 | % |
Total revenue | | | 172,956 | | | | 152,276 | | | | 13.6 | % |
Total expense | | | 71,971 | | | | 65,237 | | | | 10.3 | % |
Miscellaneous income | | | 496 | | | | 633 | | | | -21.6 | % |
NOI | | $ | 101,481 | | | $ | 87,672 | | | | 15.8 | % |
NEXPOINT RESIDENTIAL TRUST, INC. [NYSE:NXRT]
Financial Summary
| | Q3 2022 | | | Q3 2021 | | | YTD 2022 | | | YTD 2021 | |
(in thousands, except for per share and unit data) | | | | | | | | | | | | | | | | |
Company Profile | | | | | | | | | | | | | | | | |
Market Capitalization (as of the last day of the period) | | $ | 1,181,000 | | | $ | 1,563,000 | | | | | | | | | |
Share Price (as of the last day of the period) | | $ | 46.21 | | | $ | 61.88 | | | | | | | | | |
Weighted average common shares outstanding - basic | | | 25,598 | | | | 25,175 | | | | 25,630 | | | | 25,128 | |
Weighted average common shares outstanding - diluted | | | 25,598 | | | | 25,175 | | | | 25,630 | | | | 25,128 | |
| | | | | | | | | | | | | | | | |
Earnings Profile | | | | | | | | | | | | | | | | |
Total revenues | | $ | 68,051 | | | $ | 56,384 | | | $ | 194,603 | | | $ | 160,743 | |
Net loss attributable to common stockholders | | | (597 | ) | | | (5,391 | ) | | | (13,047 | ) | | | (15,678 | ) |
NOI (1) | | | 39,865 | | | | 33,648 | | | | 115,276 | | | | 93,599 | |
Same Store NOI (2) | | | 36,055 | | | | 31,885 | | | | 101,481 | | | | 87,672 | |
Same Store NOI Growth (%) (2) | | | 13.1 | % | | | | | | | 15.8 | % | | | | |
| | | | | | | | | | | | | | | | |
Earnings Metrics Per Common Share (diluted basis) | | | | | | | | | | | | | | | | |
Earnings | | $ | (0.02 | ) | | $ | (0.21 | ) | | $ | (0.51 | ) | | $ | (0.62 | ) |
FFO (1) | | $ | 0.96 | | | $ | 0.64 | | | $ | 2.39 | | | $ | 1.85 | |
Core FFO (1) | | $ | 0.85 | | | $ | 0.65 | | | $ | 2.43 | | | $ | 1.78 | |
AFFO (1) | | $ | 0.95 | | | $ | 0.74 | | | $ | 2.71 | | | $ | 2.03 | |
Dividends declared per common share | | $ | 0.38 | | | $ | 0.34 | | | $ | 1.14 | | | $ | 1.02 | |
FFO Coverage (3) | | 2.52x | | | 1.88x | | | 2.10x | | | 1.81x | |
Core FFO Coverage (3) | | 2.25x | | | 1.91x | | | 2.13x | | | 1.74x | |
AFFO Coverage (3) | | 2.50x | | | 2.16x | | | 2.38x | | | 1.98x | |
| | | | | | | | | | | | | | | | |
Portfolio | | | | | | | | | | | | | | | | |
Total Properties | | | 41 | | | | 40 | | | | | | | | | |
Total Units (4) | | | 15,387 | | | | 15,032 | | | | | | | | | |
Occupancy | | | 94.1 | % | | | 95.3 | % | | | | | | | | |
Average Effective Monthly Rent per Unit | | $ | 1,446 | | | $ | 1,204 | | | | | | | | | |
| | | | | | | | | | | | | | | | |
Same Store Portfolio Metrics (2) | | | | | | | | | | | | | | | | |
Total Same Store Properties | | | 36 | | | | 36 | | | | 34 | | | | 34 | |
Total Same Store Units | | | 13,930 | | | | 13,922 | | | | 13,426 | | | | 13,418 | |
Occupancy | | | 94.0 | % | | | 95.3 | % | | | 94.0 | % | | | 95.4 | % |
Average Effective Monthly Rent per Unit | | $ | 1,445 | | | $ | 1,210 | | | $ | 1,448 | | | $ | 1,208 | |
| | | | | | | | | | | | | | | | |
Value-Add Program | | | | | | | | | | | | | | | | |
Completed Rehab Units | | | 649 | | | | 290 | | | | 1,830 | | | | 911 | |
Cumulative Completed Rehab Units (5) | | | 7,354 | | | | | | | | | | | | | |
Average Increase to Effective Monthly Rent per Unit (Post-Rehab) | | $ | 146 | | | | | | | | | | | | | |
ROI on Post-Rehab Units | | | 22.0 | % | | | | | | | | | | | | |
| | | | | | | | | | | | | | | | |
Outstanding Debt Summary | | | | | | | | | | | | | | | | |
Total Mortgage Debt | | $ | 1,358,343 | | | $ | 1,275,501 | | | | | | | | | |
Credit Facilities | | | 335,000 | | | | 275,000 | | | | | | | | | |
Total Debt Outstanding | | $ | 1,693,343 | | | $ | 1,550,501 | | | | | | | | | |
Leverage Ratio (Net Debt to Enterprise Value) (6) | | | 58 | % | | | 49 | % | | | | | | | | |
(1) | For more information and reconciliations of NOI, FFO, Core FFO and AFFO, see the “FFO, Core FFO and AFFO,” “NOI and Same Store NOI” and “Definitions and Reconciliations of Non-GAAP Measures” sections of this release. |
(2) | We define “Same Store” properties as properties that were in our Portfolio for the entirety of the periods being compared. For additional information regarding our Q3 and YTD Same Store properties, see the “Q3 Same Store Results” and “YTD Same Store Results” section of this release. |
(3) | Indicates coverage ratio of FFO/Core FFO/AFFO per common share (diluted) over dividends declared per common share during the period. |
(4) | Total units owned is 15,387, however 81 units are currently down due to casualty events. |
(5) | Inclusive of all full and partial interior upgrades completed through. Cumulative results exclude rehabs completed for properties sold through September 30, 2022. |
(6) | For more information and a reconciliation of debt to net debt, see the “Definitions and Reconciliations of Non-GAAP Measures” section of this release. |
NEXPOINT RESIDENTIAL TRUST, INC. [NYSE:NXRT]
2022 Full Year Guidance Summary
NXRT is updating 2022 guidance ranges for earnings per diluted share, Core FFO per diluted share, Same Store rental income, Same Store total revenue, Same Store total expenses, Same Store NOI, Acquisitions and Dispositions as follows:
| | Guidance Range (1) | | | | | |
| | Low-End | | | Mid-Point | | | High-End | | | Prior Mid-Point | |
Earnings per diluted share (2) | | $ | 1.30 | | | $ | 1.33 | | | $ | 1.36 | | | $ | 3.10 | |
Core FFO per diluted share (2) (3) | | $ | 3.05 | | | $ | 3.08 | | | $ | 3.11 | | | $ | 3.01 | |
| | | | | | | | | | | | | | | | |
Same Store Growth: (4) | | | | | | | | | | | | | | | | |
Rental Income | | | 13.2 | % | | | 13.4 | % | | | 13.6 | % | | | 12.5 | % |
Total Revenue | | | 12.7 | % | | | 12.9 | % | | | 13.1 | % | | | 12.0 | % |
Total Expenses | | | 9.7 | % | | | 9.4 | % | | | 9.0 | % | | | 6.5 | % |
Same Store NOI (3) | | | 14.9 | % | | | 15.5 | % | | | 16.1 | % | | | 15.8 | % |
| | | | | | | | | | | | | | | | |
Other Considerations: (5) | | | | | | | | | | | | | | | | |
Acquisitions | | $ | 143.4 | | | $ | 143.4 | | | $ | 143.4 | | | $ | 225.0 | |
Dispositions | | $ | — | | | $ | 100.0 | | | $ | 200.0 | | | $ | 225.0 | |
(1) | Full Year 2022 guidance forecast includes Same Store growth projections presented above. |
(2) | Weighted average diluted share count estimate for full year 2022 is approximately 26.2 million. |
(3) | Same Store NOI and Core FFO are non-GAAP measures. For reconciliations of Full Year 2022 Same Store NOI and Core FFO guidance to net income guidance and a discussion of why we consider these non-GAAP measures useful, see the “Definitions and Reconciliations of Non-GAAP Measures” section of this release. |
(4) | Year-over-year growth for the Full Year 2022 pro forma Same Store pool (34 properties). |
(5) | We continue to evaluate our Portfolio for capital recycling opportunities. Transaction volumes presented are incorporated into the EPS and Core FFO guidance above. Actual acquisitions and dispositions could vary significantly from our projections. We undertake no duty to update these assumptions, except as required by law. |
Additional information on 2022 financial and earnings guidance is included in the following sections of this release.
NEXPOINT RESIDENTIAL TRUST, INC. [NYSE:NXRT]
Components of Net Asset Value
(dollar and share amounts in thousands, except per share and per unit data)
| |
REAL ESTATE BY MARKET VALUE | NAV SUMMARY |
Property | | NOI | | | Cap Rate Range (1) | | | Value Range (2) | | | | Component | | Min | | | Max | |
Market | | Contribution | | | Min | | | Max | | | Min | | | Max | | | | Tangible Assets | | | | | | | | |
Texas | | | | | | | | | | | | | | | | | | | | | | | Real Estate (2) | | $ | 3,383,949 | | | $ | 3,734,130 | |
Dallas/Fort Worth | | 12.9% | | | 4.3% | | | 4.7% | | | $ | 438,505 | | | $ | 484,461 | | | | Cash | | 15,771 | |
Houston | | 5.3% | | | 4.5% | | | 4.7% | | | | 178,773 | | | | 188,541 | | | | Restricted Cash - Renovation Reserves (5) | | 15,347 | |
| | | | | | | | | | | | | | | | | | | | | | | Renovation Expenditures (5) | | (15,347) | |
North Carolina | | | | | | | | | | | | | | | | | | | | | | | Cash Adjustments (6) | | (655) | |
Raleigh | | 3.4% | | | 4.3% | | | 4.7% | | | | 116,060 | | | | 128,223 | | | | Fair Market Value of Interest Rate Swaps | | 110,399 | |
Charlotte | | 6.8% | | | 4.3% | | | 4.7% | | | | 231,444 | | | | 255,700 | | | | Other Assets | | 56,885 | |
| | | | | | | | | | | | | | | | | | | | | | | Value of Assets | | $ | 3,566,349 | | | $ | 3,916,530 | |
Georgia | | | | | | | | | | | | | | | | | | | | | | | | | | | | | | | |
Atlanta | | 8.2% | | | 4.3% | | | 4.7% | | | | 279,969 | | | | 309,310 | | | | Tangible Liabilities | | | | | | | | |
| | | | | | | | | | | | | | | | | | | | | | | Credit Facility (7) | | $335,000 | |
Tennessee | | | | | | | | | | | | | | | | | | | | | | | Mortgage Debt | | 1,358,343 | |
Nashville | | 11.2% | | | 4.3% | | | 4.7% | | | | 380,933 | | | | 420,855 | | | | Total Outstanding Debt | | 1,693,343 | |
| | | | | | | | | | | | | | | | | | | | | | | Forward 12-month Principal Payments (6) | | (655) | |
Florida | | | | | | | | | | | | | | | | | | | | | | | Total Outstanding Debt (FY 2022 Est.) | | 1,692,688 | |
Orlando | | 7.7% | | | 4.3% | | | 4.7% | | | | 263,124 | | | | 290,700 | | | | Other Tangible Liabilities (at Book) | | 47,219 | |
Tampa | | 4.1% | | | 4.3% | | | 4.7% | | | | 140,450 | | | | 155,169 | | | | Value of Liabilities | | $1,739,907 | |
South Florida | | 16.2% | | | 4.3% | | | 4.7% | | | | 551,964 | | | | 609,810 | | | | Net Leverage (mid-point) | | 47% | |
| | | | | | | | | | | | | | | | | | | | | | | Net Asset Value | | $ | 1,826,442 | | | $ | 2,176,623 | |
Nevada | | | | | | | | | | | | | | | | | | | | | | | Shares outstanding - diluted (FY 2022 Est.) | | 26,077 | |
Las Vegas | | 8.3% | | | 4.5% | | | 5.0% | | | | 262,672 | | | | 294,708 | | | | Est. NAV / Share | | $ | 70.04 | | | $ | 83.47 | |
| | | | | | | | | | | | | | | | | | | | | | | NAV / Share (mid-point) | | $76.75 | |
Arizona | | | | | | | | | | | | | | | | | | | | | | | | | | | | | | | |
Phoenix | | 15.9% | | | 4.3% | | | 4.7% | | | | 540,055 | | | | 596,653 | | | | | | | | | | | | |
Total / Ave | | 100.0% | | | 4.3% | | | 4.7% | | | $ | 3,383,949 | | | $ | 3,734,130 | | | | | | | | | | | | |
| |
NOI ESTIMATE | IMPLIED VAUE VALUATION METRICS |
Q2 2022 NOI Actual | | 38,846 | | | | | Min | | | Max | |
Q3 2022 NOI Actual | | 39,865 | | | Implied Real Estate Value | | $ | 3,383,949 | | | $ | 3,734,130 | |
| | Low | | | High | | | No. of Units (September 30, 2022) (2) | | 15,387 | |
Estimated Q4 2022 NOI Guidance (3) | | $ | 41,360 | | | $ | 42,906 | | | Implied Value/Apartment Unit | | $ | 219.9 | | | $ | 242.7 | |
2022 Pro Forma NOI Guidance (3)(4) | | $ | 156,634 | | | $ | 158,180 | | | Implied Value/Apartment Unit (mid-point) | | $231.3 | |
(1) | Management estimates based on independent third-party review of our properties. |
(2) | Full Year 2022 NOI Guidance is presented for the existing portfolio (41 properties as of September 30, 2022). |
(3) | The Company anticipates net income will be in the range between approximately $34.1 million and $35.7 million for the full year 2022 and between $47.2 million and $48.7 million for the fourth quarter of 2022. FY 2022 NOI Guidance considers the completed acquisitions of The Adair and Estates on Maryland and assumes no further acquisition or disposition activity for the remainder of the year. |
(4) | 2022 Pro Forma NOI assumes The Adair and Estates on Maryland were owned for the full year 2022, which we estimate would have contributed approximately an additional $800 and $1,000, respectively, to NOI. |
(5) | Includes approximately $15.3 million that is held for value-add upgrades; reduced by $15.3 million for estimated 2022 rehab expenditures. |
(6) | Includes approximately $0.7 million in forward 12-month principal payments (which excludes the repayment of The Cornerstone loan which we expect to refinance in 2023). |
(7) | Includes outstanding balance of September 30, 2022. |
NEXPOINT RESIDENTIAL TRUST, INC. [NYSE:NXRT]
NEXPOINT RESIDENTIAL TRUST, INC. AND SUBSIDIARIES
CONSOLIDATED BALANCE SHEETS
(in thousands, except share and per share amounts)
| | September 30, 2022 | | | December 31, 2021 | |
| | (Unaudited) | | | | | |
ASSETS | | | | | | | | |
Operating Real Estate Investments | | | | | | | | |
Land | | $ | 378,438 | | | $ | 375,857 | |
Buildings and improvements | | | 1,759,301 | | | | 1,743,866 | |
Intangible lease assets | | | — | | | | 2,576 | |
Construction in progress | | | 8,170 | | | | 6,078 | |
Furniture, fixtures, and equipment | | | 141,184 | | | | 120,419 | |
Total Gross Operating Real Estate Investments | | | 2,287,093 | | | | 2,248,796 | |
Accumulated depreciation and amortization | | | (326,738 | ) | | | (287,096 | ) |
Total Net Operating Real Estate Investments | | | 1,960,355 | | | | 1,961,700 | |
Real estate held for sale, net of accumulated depreciation of $28,477 and $0, respectively | | | 110,638 | | | | — | |
Total Net Real Estate Investments | | | 2,070,993 | | | | 1,961,700 | |
Cash and cash equivalents | | | 15,771 | | | | 49,450 | |
Restricted cash | | | 50,844 | | | | 39,246 | |
Accounts receivable, net | | | 11,519 | | | | 4,844 | |
Prepaid and other assets | | | 9,869 | | | | 4,701 | |
Fair market value of interest rate swaps | | | 110,399 | | | | 3,526 | |
TOTAL ASSETS | | $ | 2,269,395 | | | $ | 2,063,467 | |
| | | | | | | | |
LIABILITIES AND STOCKHOLDERS' EQUITY | | | | | | | | |
Liabilities: | | | | | | | | |
Mortgages payable, net | | $ | 1,268,607 | | | $ | 1,276,285 | |
Mortgages payable held for sale, net | | | 82,692 | | | | — | |
Credit facility, net | | | 333,428 | | | | 278,215 | |
Accounts payable and other accrued liabilities | | | 13,866 | | | | 12,590 | |
Accrued real estate taxes payable | | | 22,165 | | | | 13,182 | |
Accrued interest payable | | | 5,981 | | | | 2,491 | |
Security deposit liability | | | 3,168 | | | | 2,945 | |
Prepaid rents | | | 2,039 | | | | 1,775 | |
Total Liabilities | | | 1,731,946 | | | | 1,587,483 | |
| | | | | | | | |
Redeemable noncontrolling interests in the Operating Partnership | | | 5,828 | | | | 6,139 | |
| | | | | | | | |
Stockholders' Equity: | | | | | | | | |
Preferred stock, $0.01 par value: 100,000,000 shares authorized; 0 shares issued | | | — | | | | — | |
Common stock, $0.01 par value: 500,000,000 shares authorized; 25,549,036 and 25,500,567 shares issued and outstanding, respectively | | | 255 | | | | 255 | |
Additional paid-in capital | | | 403,377 | | | | 407,803 | |
Accumulated earnings less dividends | | | 18,902 | | | | 59,209 | |
Accumulated other comprehensive income | | | 109,087 | | | | 2,578 | |
Total Stockholders' Equity | | | 531,621 | | | | 469,845 | |
TOTAL LIABILITIES AND STOCKHOLDERS' EQUITY | | $ | 2,269,395 | | | $ | 2,063,467 | |
NEXPOINT RESIDENTIAL TRUST, INC. [NYSE:NXRT]
NEXPOINT RESIDENTIAL TRUST, INC. AND SUBSIDIARIES
CONSOLIDATED STATEMENTS OF OPERATIONS
AND COMPREHENSIVE LOSS
(in thousands, except per share amounts)
(Unaudited)
| | For the Three Months Ended September 30, | | | For the Nine Months Ended September 30, | |
| | 2022 | | | 2021 | | | 2022 | | | 2021 | |
Revenues | | | | | | | | | | | | | | | | |
Rental income | | $ | 66,500 | | | $ | 54,918 | | | $ | 189,949 | | | $ | 156,305 | |
Other income | | | 1,551 | | | | 1,466 | | | | 4,654 | | | | 4,438 | |
Total revenues | | | 68,051 | | | | 56,384 | | | | 194,603 | | | | 160,743 | |
Expenses | | | | | | | | | | | | | | | | |
Property operating expenses | | | 12,370 | | | | 12,783 | | | | 42,669 | | | | 35,116 | |
Real estate taxes and insurance | | | 9,419 | | | | 7,646 | | | | 27,670 | | | | 24,876 | |
Property management fees (1) | | | 1,960 | | | | 1,639 | | | | 5,629 | | | | 4,640 | |
Advisory and administrative fees (2) | | | 1,904 | | | | 1,938 | | | | 5,615 | | | | 5,706 | |
Corporate general and administrative expenses | | | 3,818 | | | | 3,152 | | | | 11,116 | | | | 9,070 | |
Property general and administrative expenses | | | 2,387 | | | | 2,076 | | | | 6,586 | | | | 5,451 | |
Depreciation and amortization | | | 25,224 | | | | 21,591 | | | | 74,490 | | | | 62,335 | |
Total expenses | | | 57,082 | | | | 50,825 | | | | 173,775 | | | | 147,194 | |
Operating income | | | 10,969 | | | | 5,559 | | | | 20,828 | | | | 13,549 | |
Interest expense | | | (11,766 | ) | | | (11,531 | ) | | | (34,804 | ) | | | (32,830 | ) |
Loss on extinguishment of debt and modification costs | | | — | | | | — | | | | — | | | | (328 | ) |
Casualty gains | | | — | | | | — | | | | 357 | | | | 2,379 | |
Miscellaneous income | | | 198 | | | | 565 | | | | 526 | | | | 1,505 | |
Net loss | | | (599 | ) | | | (5,407 | ) | | | (13,093 | ) | | | (15,725 | ) |
Net loss attributable to redeemable noncontrolling interests in the Operating Partnership | | | (2 | ) | | | (16 | ) | | | (46 | ) | | | (47 | ) |
Net loss attributable to common stockholders | | $ | (597 | ) | | $ | (5,391 | ) | | $ | (13,047 | ) | | $ | (15,678 | ) |
Other comprehensive income | | | | | | | | | | | | | | | | |
Unrealized gains on interest rate derivatives | | | 34,938 | | | | 4,545 | | | | 106,874 | | | | 31,082 | |
Total comprehensive income (loss) | | | 34,339 | | | | (862 | ) | | | 93,781 | | | | 15,357 | |
Comprehensive income (loss) attributable to redeemable noncontrolling interests in the Operating Partnership | | | 132 | | | | (3 | ) | | | 319 | | | | 46 | |
Comprehensive income (loss) attributable to common stockholders | | $ | 34,207 | | | $ | (859 | ) | | $ | 93,462 | | | $ | 15,311 | |
| | | | | | | | | | | | | | | | |
Weighted average common stock outstanding - basic | | | 25,598 | | | | 25,175 | | | | 25,630 | | | | 25,128 | |
Weighted average common stock outstanding - diluted | | | 25,598 | | | | 25,175 | | | | 25,630 | | | | 25,128 | |
| | | | | | | | | | | | | | | | |
Loss per share - basic | | $ | (0.02 | ) | | $ | (0.21 | ) | | $ | (0.51 | ) | | $ | (0.62 | ) |
Loss per share - diluted | | $ | (0.02 | ) | | $ | (0.21 | ) | | $ | (0.51 | ) | | $ | (0.62 | ) |
(1) | Fees incurred to an unaffiliated third party that is an affiliate of the noncontrolling limited partner of the Operating Partnership (the “OP”). |
(2) | Fees incurred to the Company’s adviser. |
NEXPOINT RESIDENTIAL TRUST, INC. [NYSE:NXRT]
NOI and Same Store NOI
The following table, which has not been adjusted for the effects of noncontrolling interests, reconciles NOI and our Same Store NOI for the three and nine months ended September 30, 2022 and 2021 to net loss, the most directly comparable GAAP financial measure (in thousands):
| | For the Three Months Ended September 30, | | | For the Nine Months Ended September 30, | |
| | 2022 | | | 2021 | | | 2022 | | | 2021 | |
Net loss | | $ | (599 | ) | | $ | (5,407 | ) | | $ | (13,093 | ) | | $ | (15,725 | ) |
Adjustments to reconcile net loss to NOI: | | | | | | | | | | | | | | | | |
Advisory and administrative fees | | | 1,904 | | | | 1,938 | | | | 5,615 | | | | 5,706 | |
Corporate general and administrative expenses | | | 3,818 | | | | 3,152 | | | | 11,116 | | | | 9,070 | |
Casualty-related expenses/(recoveries) | (1) | | (2,976 | ) | | | 120 | | | | 666 | | | | (272 | ) |
Casualty gain | | | — | | | | — | | | | (357 | ) | | | (2,379 | ) |
Pandemic expense | | | — | | | | 11 | | | | — | | | | 46 | |
Property general and administrative expenses | (2) | | 728 | | | | 712 | | | | 2,035 | | | | 1,660 | |
Depreciation and amortization | | | 25,224 | | | | 21,591 | | | | 74,490 | | | | 62,335 | |
Interest expense | | | 11,766 | | | | 11,531 | | | | 34,804 | | | | 32,830 | |
Loss on extinguishment of debt and modification costs | | | — | | | | — | | | | — | | | | 328 | |
NOI | | $ | 39,865 | | | $ | 33,648 | | | $ | 115,276 | | | $ | 93,599 | |
Less Non-Same Store | | | | | | | | | | | | | | | | |
Revenues | | | (6,155 | ) | | | (2,570 | ) | | | (21,647 | ) | | | (8,467 | ) |
Operating expenses | | | 2,361 | | | | 1,033 | | | | 7,882 | | | | 3,412 | |
Operating income | | | (16 | ) | | | (226 | ) | | | (30 | ) | | | (872 | ) |
Same Store NOI | | $ | 36,055 | | | $ | 31,885 | | | $ | 101,481 | | | $ | 87,672 | |
(1) | Adjustment to net loss to exclude certain property operating expenses that are casualty-related expenses/(recoveries). |
(2) | Adjustment to net loss to exclude certain property general and administrative expenses that are not reflective of the continuing operations of the properties or are incurred on our behalf at the property for expenses such as legal, professional, centralized leasing service and franchise tax fees. |
NEXPOINT RESIDENTIAL TRUST, INC. [NYSE:NXRT]
Q3 Same Store Results of Operations for the Three Months Ended September 30, 2022 and 2021
There are 36 properties encompassing 13,930 units of apartment space, or approximately 91% of our Portfolio, in our same store pool for the three months ended September 30, 2022 and 2021 (our “Q3 Same Store” properties). Our Q3 Same Store properties exclude the following 5 properties in our Portfolio as of September 30, 2022: Cutter’s Point, Six Forks Station, High House at Cary, The Adair, and Estates on Maryland, as well as the 74 units mentioned on page 2 that are currently down.
As of September 30, 2022, our Q3 Same Store properties were approximately 94.0% leased with a weighted average monthly effective rent per occupied apartment unit of $1,445, a year-over-year decrease of 130 bps and an increase of $235, respectively.
The following table reflects the revenues, property operating expenses and NOI for the three months ended September 30, 2022 and 2021 for our Q3 Same Store and Non-Same Store properties (dollars in thousands):
| | For the Three Months Ended September 30, | | | | | | | | | |
| | 2022 | | | 2021 | | | $ Change | | | % Change | |
Revenues | | | | | | | | | | | | | | | | |
Same Store | | | | | | | | | | | | | | | | |
Rental income | | $ | 60,407 | | | $ | 52,441 | | | $ | 7,966 | | | | 15.2 | % |
Other income | | | 1,489 | | | | 1,373 | | | | 116 | | | | 8.4 | % |
Same Store revenues | | | 61,896 | | | | 53,814 | | | | 8,082 | | | | 15.0 | % |
Non-Same Store | | | | | | | | | | | | | | | | |
Rental income | | | 6,093 | | | | 2,477 | | | | 3,616 | | | N/M | |
Other income | | | 62 | | | | 93 | | | | (31 | ) | | | -33.3 | % |
Non-Same Store revenues | | | 6,155 | | | | 2,570 | | | | 3,585 | | | N/M | |
Total revenues | | | 68,051 | | | | 56,384 | | | | 11,667 | | | | 20.7 | % |
| | | | | | | | | | | | | | | | |
Operating expenses | | | | | | | | | | | | | | | | |
Same Store | | | | | | | | | | | | | | | | |
Property operating expenses (1) | | | 14,037 | | | | 11,982 | | | | 2,055 | | | | 17.2 | % |
Real estate taxes and insurance | | | 8,682 | | | | 7,433 | | | | 1,249 | | | | 16.8 | % |
Property management fees (2) | | | 1,783 | | | | 1,561 | | | | 222 | | | | 14.2 | % |
Property general and administrative expenses (3) | | | 1,521 | | | | 1,292 | | | | 229 | | | | 17.7 | % |
Same Store operating expenses | | | 26,023 | | | | 22,268 | | | | 3,755 | | | | 16.9 | % |
Non-Same Store | | | | | | | | | | | | | | | | |
Property operating expenses (4) | | | 1,309 | | | | 670 | | | | 639 | | | N/M | |
Real estate taxes and insurance | | | 737 | | | | 213 | | | | 524 | | | N/M | |
Property management fees (2) | | | 177 | | | | 78 | | | | 99 | | | N/M | |
Property general and administrative expenses (5) | | | 138 | | | | 72 | | | | 66 | | | N/M | |
Non-Same Store operating expenses | | | 2,361 | | | | 1,033 | | | | 1,328 | | | N/M | |
Total operating expenses | | | 28,384 | | | | 23,301 | | | | 5,083 | | | | 21.8 | % |
| | | | | | | | | | | | | | | | |
Operating income | | | | | | | | | | | | | | | | |
Same Store | | | | | | | | | | | | | | | | |
Miscellaneous income | | | 182 | | | | 339 | | | | (157 | ) | | | -46.3 | % |
Non-Same Store | | | | | | | | | | | | | | | | |
Miscellaneous income | | | 16 | | | | 226 | | | | (210 | ) | | N/M | |
Total operating income | | | 198 | | | | 565 | | | | (367 | ) | | | -65.0 | % |
| | | | | | | | | | | | | | | | |
NOI | | | | | | | | | | | | | | | | |
Same Store | | | 36,055 | | | | 31,885 | | | | 4,170 | | | | 13.1 | % |
Non-Same Store | | | 3,810 | | | | 1,763 | | | | 2,047 | | | N/M | |
Total NOI (6) | | $ | 39,865 | | | $ | 33,648 | | | $ | 6,217 | | | | 18.5 | % |
(1) | For the three months ended September 30, 2022 and 2021, excludes approximately $(1,822,000) and $136,000, respectively, of casualty-related expenses/(recoveries). |
(2) | Fees incurred to an unaffiliated third party that is an affiliate of the noncontrolling limited partner of the OP. |
(3) | For the three months ended September 30, 2022 and 2021, excludes approximately $634,000 and $599,000, respectively, of expenses that are not reflective of the continuing operations of the properties or are incurred on our behalf at the property for expenses such as legal, professional, centralized leasing service and franchise tax fees. |
NEXPOINT RESIDENTIAL TRUST, INC. [NYSE:NXRT]
(4) | For the three months ended September 30, 2022 and 2021, excludes approximately $1,154,000 and $5,000, respectively, of casualty-related recoveries. |
(5) | For the three months ended September 30, 2022 and 2021, excludes approximately $94,000 and $113,000, respectively, of expenses that are not reflective of the continuing operations of the properties or are incurred on our behalf at the property for expenses such as legal, professional, centralized leasing service and franchise tax fees. |
(6) | For additional information regarding NOI, see the “Definitions and Reconciliations of Non-GAAP Measures” and “NOI and Same Store NOI” sections of this release. |
The following table contains additional information about our Q3 Same Store properties rent and occupancy metrics, revenues, operating expenses and NOI for the three months ended September 30, 2022 and 2021 (dollars in thousands, except for per unit data):
| | Q3 2022 | | | Q3 2021 | | | % Change | |
Same Store Total Units | | | 13,930 | | | | 13,922 | | | | | |
Same Store Occupied Units | | | 13,096 | | | | 13,274 | | | | | |
Same Store Ending Occupancy | | | 94.0 | % | | | 95.3 | % | | | -1.3 | % |
Same Store Average Rent per Unit | | $ | 1,445 | | | $ | 1,210 | | | | 19.4 | % |
| | | | | | | | | | | | |
Same Store Revenues | | | | | | | | | | | | |
Same Store Rental Income | | $ | 60,407 | | | $ | 52,441 | | | | 15.2 | % |
Same Store Other Income | | | 1,489 | | | | 1,373 | | | | 8.4 | % |
Total Same Store Revenues | | | 61,896 | | | | 53,814 | | | | 15.0 | % |
| | | | | | | | | | | | |
Same Store Operating Expenses | | | | | | | | | | | | |
Payroll | | | 5,242 | | | | 4,720 | | | | 11.1 | % |
Repairs & Maintenance | | | 5,669 | | | | 4,480 | | | | 26.5 | % |
Utilities | | | 3,126 | | | | 2,782 | | | | 12.4 | % |
Real Estate Taxes | | | 7,230 | | | | 6,170 | | | | 17.2 | % |
Insurance | | | 1,452 | | | | 1,263 | | | | 15.0 | % |
Property Management Fees | | | 1,783 | | | | 1,561 | | | | 14.2 | % |
Office Operations | | | 997 | | | | 865 | | | | 15.3 | % |
Marketing | | | 524 | | | | 427 | | | | 22.7 | % |
Total Same Store Operating Expenses | | | 26,023 | | | | 22,268 | | | | 16.9 | % |
| | | | | | | | | | | | |
Same Store Operating Income | | | | | | | | | | | | |
Miscellaneous income | | | 182 | | | | 339 | | | | -46.3 | % |
Total Same Store Operating Income | | | 182 | | | | 339 | | | | -46.3 | % |
| | | | | | | | | | | | |
Q3 Same Store NOI | | $ | 36,055 | | | $ | 31,885 | | | | 13.1 | % |
NEXPOINT RESIDENTIAL TRUST, INC. [NYSE:NXRT]
Q3 Same Store Properties Operating Metrics
(dollars in thousands, except for per unit data)
| | | | | | | | | | | | | |
Properties by Market (1) | | Unit Count | | Average Effective Rent | Occupancy | Total Rental Income | |
| | | | | | | | | | | | | |
| | Total | | Q3 2022 | Q3 2021 | % Change | Q3 2022 | Q3 2021 | bps ∆ | Q3 2022 | Q3 2021 | % Change | |
Texas | | | | | | | | | | | | | |
Dallas | | 2,362 | | $1,215 | $1,023 | 18.8% | 94.2% | 94.9% | -70 | $8,828 | $7,928 | 11.4% | |
Houston | | 1,176 | | 1,284 | 1,142 | 12.4% | 94.6% | 96.0% | -140 | 4,494 | 4,214 | 6.6% | |
Average/Total | | 3,538 | | 1,238 | 1,062 | 16.6% | 94.3% | 95.2% | -90 | 13,322 | 12,142 | 9.7% | |
| | | | | | | | | | | | | |
North Carolina | | | | | | | | | | | | | |
Charlotte | | 1,065 | | 1,316 | 1,159 | 13.5% | 94.6% | 95.1% | -50 | 4,198 | 3,788 | 10.8% | |
Average/Total | | 1,065 | | 1,316 | 1,159 | 13.5% | 94.6% | 95.1% | -50 | 4,198 | 3,788 | 10.8% | |
| | | | | | | | | | | | | |
Georgia | | | | | | | | | | | | | |
Atlanta | | 1,457 | | 1,410 | 1,214 | 16.1% | 93.0% | 94.2% | -120 | 5,933 | 5,084 | 16.7% | |
Average/Total | | 1,457 | | 1,410 | 1,214 | 16.1% | 93.0% | 94.2% | -120 | 5,933 | 5,084 | 16.7% | |
| | | | | | | | | | | | | |
Tennessee | | | | | | | | | | | | | |
Nashville | | 1,322 | | 1,294 | 1,073 | 20.6% | 95.0% | 95.7% | -70 | 5,412 | 4,632 | 16.8% | |
Average/Total | | 1,322 | | 1,294 | 1,073 | 20.6% | 95.0% | 95.7% | -70 | 5,412 | 4,632 | 16.8% | |
| | | | | | | | | | | | | |
Florida | | | | | | | | | | | | | |
Orlando | | 1,172 | | 1,540 | 1,232 | 25.0% | 93.8% | 96.2% | -240 | 5,136 | 4,450 | 15.4% | |
Tampa | | 576 | | 1,384 | 1,097 | 26.2% | 91.5% | 95.8% | -430 | 2,295 | 1,949 | 17.8% | |
South Florida | | 1,957 | | 1,938 | 1,580 | 22.7% | 95.2% | 95.8% | -60 | 11,345 | 9,532 | 19.0% | |
Average/Total | | 3,705 | | 1,726 | 1,395 | 23.7% | 94.2% | 95.9% | -170 | 18,776 | 15,931 | 17.9% | |
| | | | | | | | | | | | | |
Arizona | | | | | | | | | | | | | |
Phoenix | | 1,679 | | 1,488 | 1,230 | 21.0% | 94.1% | 96.8% | -270 | 7,898 | 6,745 | 17.1% | |
Average/Total | | 1,679 | | 1,488 | 1,230 | 21.0% | 94.1% | 96.8% | -270 | 7,898 | 6,745 | 17.1% | |
| | | | | | | | | | | | | |
Nevada | | | | | | | | | | | | | |
Las Vegas | | 1,164 | | 1,445 | 1,236 | 16.9% | 91.8% | 92.9% | -110 | 4,868 | 4,119 | 18.2% | |
Average/Total | | 1,164 | | 1,445 | 1,236 | 16.9% | 91.8% | 92.9% | -110 | 4,868 | 4,119 | 18.2% | |
| | | | | | | | | | | | | |
Average/Total | | 13,930 | | $1,445 | $1,210 | 19.4% | 94.0% | 95.3% | -130 | $60,407 | $52,441 | 15.2% | |
(1) | This table only includes the 36 properties in our Q3 Same Store pool. |
NEXPOINT RESIDENTIAL TRUST, INC. [NYSE:NXRT]
QoQ Same Store Properties Operating Metrics
(dollars in thousands, except for per unit data)
| | | | | | | | | | | | |
Properties by Market (1) | | Unit Count | | Average Effective Rent | Occupancy | Total Rental Income |
| | | | | | | | | | | | |
| | Total | | Q3 2022 | Q2 2022 | % Change | Q3 2022 | Q2 2022 | bps ∆ | Q3 2022 | Q2 2022 | % Change |
Texas | | | | | | | | | | | | |
Dallas | | 2,362 | | $1,215 | $1,175 | 3.4% | 94.2% | 93.8% | 40 | $8,828 | $8,631 | 2.3% |
Houston | | 1,176 | | 1,284 | 1,245 | 3.1% | 94.6% | 95.1% | -50 | 4,494 | 4,513 | -0.4% |
Average/Total | | 3,538 | | 1,238 | 1,198 | 3.3% | 94.3% | 94.2% | 10 | 13,322 | 13,144 | 1.4% |
| | | | | | | | | | | | |
North Carolina | | | | | | | | | | | | |
Charlotte | | 1,065 | | 1,316 | 1,273 | 3.4% | 94.6% | 95.3% | -70 | 4,198 | 4,013 | 4.6% |
Average/Total | | 1,065 | | 1,316 | 1,273 | 3.4% | 94.6% | 95.3% | -70 | 4,198 | 4,013 | 4.6% |
| | | | | | | | | | | | |
Georgia | | | | | | | | | | | | |
Atlanta | | 1,457 | | 1,410 | 1,367 | 3.1% | 93.0% | 94.2% | -120 | 5,933 | 5,791 | 2.5% |
Average/Total | | 1,457 | | 1,410 | 1,367 | 3.1% | 93.0% | 94.2% | -120 | 5,933 | 5,791 | 2.5% |
| | | | | | | | | | | | |
Tennessee | | | | | | | | | | | | |
Nashville | | 1,322 | | 1,294 | 1,215 | 6.5% | 95.0% | 96.7% | -170 | 5,412 | 5,209 | 3.9% |
Average/Total | | 1,322 | | 1,294 | 1,215 | 6.5% | 95.0% | 96.7% | -170 | 5,412 | 5,209 | 3.9% |
| | | | | | | | | | | | |
Florida | | | | | | | | | | | | |
Orlando | | 1,172 | | 1,540 | 1,448 | 6.4% | 93.8% | 95.6% | -180 | 5,136 | 5,096 | 0.8% |
Tampa | | 576 | | 1,384 | 1,297 | 6.7% | 91.5% | 95.0% | -350 | 2,295 | 2,253 | 1.9% |
South Florida | | 1,957 | | 1,938 | 1,842 | 5.2% | 95.2% | 96.0% | -80 | 11,344 | 10,959 | 3.5% |
Average/Total | | 3,705 | | 1,726 | 1,633 | 5.7% | 94.2% | 95.7% | -150 | 18,775 | 18,308 | 2.6% |
| | | | | | | | | | | | |
Arizona | | | | | | | | | | | | |
Phoenix | | 1,679 | | 1,488 | 1,429 | 4.1% | 94.1% | 92.5% | 160 | 7,899 | 7,390 | 6.9% |
Average/Total | | 1,679 | | 1,488 | 1,429 | 4.1% | 94.1% | 92.5% | 160 | 7,899 | 7,390 | 6.9% |
| | | | | | | | | | | | |
Nevada | | | | | | | | | | | | |
Las Vegas | | 1,164 | | 1,445 | 1,390 | 4.0% | 91.8% | 91.8% | 0 | 4,868 | 4,394 | 10.8% |
Average/Total | | 1,164 | | 1,445 | 1,390 | 4.0% | 91.8% | 91.8% | 0 | 4,868 | 4,394 | 10.8% |
| | | | | | | | | | | | |
Average/Total | | 13,930 | | $1,445 | $1,383 | 4.5% | 94.0% | 94.6% | -60 | $60,407 | $58,249 | 3.7% |
(1) | This table only includes the 36 properties in our Q3 Same Store pool. |
NEXPOINT RESIDENTIAL TRUST, INC. [NYSE:NXRT]
YTD Same Store Results of Operations for the Nine Months Ended September 30, 2022 and 2021
There are 34 properties encompassing 13,426 units of apartment space, or approximately 87% of our Portfolio, in our same store pool for the nine months ended September 30, 2022 and 2021 (our “YTD Same Store” properties). Our YTD Same Store properties exclude the following 7 properties in our Portfolio as of September 30, 2022: Cutter’s Point, The Verandas at Lake Norman, Creekside at Matthews, Six Forks Station, High House at Cary, The Adair, and Estates on Maryland, as well as the 74 units mentioned on page 2 that are currently down.
As of September 30, 2022, our YTD Same Store properties were approximately 94.0% leased with a weighted average monthly effective rent per occupied apartment unit of $1,448, a year-over-year decrease of 140 bps and an increase of $240, respectively.
The following table reflects the revenues, property operating expenses and NOI for the nine months ended September 30, 2022 and 2021 for our YTD Same Store and Non-Same Store properties (dollars in thousands):
| | For the Nine Months Ended September 30, | | | | | | | | | |
| | 2022 | | | 2021 | | | $ Change | | | % Change | |
Revenues | | | | | | | | | | | | | | | | |
Same Store | | | | | | | | | | | | | | | | |
Rental income | | $ | 168,628 | | | $ | 148,005 | | | $ | 20,623 | | | | 13.9 | % |
Other income | | | 4,328 | | | | 4,271 | | | | 57 | | | | 1.3 | % |
Same Store revenues | | | 172,956 | | | | 152,276 | | | | 20,680 | | | | 13.6 | % |
Non-Same Store | | | | | | | | | | | | | | | | |
Rental income | | | 21,321 | | | | 8,300 | | | | 13,021 | | | N/M | |
Other income | | | 326 | | | | 167 | | | | 159 | | | N/M | |
Non-Same Store revenues | | | 21,647 | | | | 8,467 | | | | 13,180 | | | N/M | |
Total revenues | | | 194,603 | | | | 160,743 | | | | 33,860 | | | | 21.1 | % |
| | | | | | | | | | | | | | | | |
Operating expenses | | | | | | | | | | | | | | | | |
Same Store | | | | | | | | | | | | | | | | |
Property operating expenses (1) | | | 37,783 | | | | 33,180 | | | | 4,603 | | | | 13.9 | % |
Real estate taxes and insurance | | | 25,152 | | | | 24,129 | | | | 1,023 | | | | 4.2 | % |
Property management fees (2) | | | 5,011 | | | | 4,382 | | | | 629 | | | | 14.4 | % |
Property general and administrative expenses (3) | | | 4,025 | | | | 3,546 | | | | 479 | | | | 13.5 | % |
Same Store operating expenses | | | 71,971 | | | | 65,237 | | | | 6,734 | | | | 10.3 | % |
Non-Same Store | | | | | | | | | | | | | | | | |
Property operating expenses (4) | | | 4,220 | | | | 2,162 | | | | 2,058 | | | N/M | |
Real estate taxes and insurance | | | 2,518 | | | | 747 | | | | 1,771 | | | N/M | |
Property management fees (2) | | | 618 | | | | 258 | | | | 360 | | | N/M | |
Property general and administrative expenses (5) | | | 526 | | | | 245 | | | | 281 | | | N/M | |
Non-Same Store operating expenses | | | 7,882 | | | | 3,412 | | | | 4,470 | | | N/M | |
Total operating expenses | | | 79,853 | | | | 68,649 | | | | 11,204 | | | | 16.3 | % |
| | | | | | | | | | | | | | | | |
Operating income | | | | | | | | | | | | | | | | |
Same Store | | | | | | | | | | | | | | | | |
Miscellaneous income | | | 496 | | | | 633 | | | | (137 | ) | | | -21.6 | % |
Non-Same Store | | | | | | | | | | | | | | | | |
Miscellaneous income | | | 30 | | | | 872 | | | | (842 | ) | | N/M | |
Total operating income | | | 526 | | | | 1,505 | | | | (979 | ) | | | -65.0 | % |
| | | | | | | | | | | | | | | | |
NOI | | | | | | | | | | | | | | | | |
Same Store | | | 101,481 | | | | 87,672 | | | | 13,809 | | | | 15.8 | % |
Non-Same Store | | | 13,795 | | | | 5,927 | | | | 7,868 | | | N/M | |
Total NOI (6) | | $ | 115,276 | | | $ | 93,599 | | | $ | 21,677 | | | | 23.2 | % |
(1) | For the nine months ended September 30, 2022 and 2021, excludes approximately $3,137,000 and $232,000, respectively, of casualty-related recoveries. |
(2) | Fees incurred to an unaffiliated third party that is an affiliate of the noncontrolling limited partner of the OP. |
NEXPOINT RESIDENTIAL TRUST, INC. [NYSE:NXRT]
(3) | For the nine months ended September 30, 2022 and 2021, excludes approximately $1,811,000 and $1,399,000, respectively, of expenses that are not reflective of the continuing operations of the properties or are incurred on our behalf at the property for expenses such as legal, professional, centralized leasing service and franchise tax fees. |
(4) | For the nine months ended September 30, 2022 and 2021, excludes approximately $(66,000) and $6,000, respectively, of casualty-related expenses/(recoveries). |
(5) | For the nine months ended September 30, 2022 and 2021, excludes approximately $224,000 and $261,000, respectively, of expenses that are not reflective of the continuing operations of the properties or are incurred on our behalf at the property for expenses such as legal, professional, centralized leasing service and franchise tax fees. |
(6) | For additional information regarding NOI, see the “Definitions and Reconciliations of Non-GAAP Measures” and “NOI and Same Store NOI” sections of this release. |
The following table contains additional information about our YTD Same Store properties rent and occupancy metrics, revenues, operating expenses and NOI for the nine months ended September 30, 2022 and 2021 (dollars in thousands, except for per unit data):
| | YTD 2022 | | | YTD 2021 | | | % Change | |
Same Store Total Units | | | 13,426 | | | | 13,418 | | | | | |
Same Store Occupied Units | | | 12,623 | | | | 12,796 | | | | | |
Same Store Ending Occupancy | | | 94.0 | % | | | 95.4 | % | | | -1.4 | % |
Same Store Average Rent per Unit | | $ | 1,448 | | | $ | 1,208 | | | | 19.9 | % |
| | | | | | �� | | | | | | |
Same Store Revenues | | | | | | | | | | | | |
Same Store Rental Income | | $ | 168,628 | | | $ | 148,005 | | | | 13.9 | % |
Same Store Other Income | | | 4,328 | | | | 4,271 | | | | 1.3 | % |
Total Same Store Revenues | | | 172,956 | | | | 152,276 | | | | 13.6 | % |
| | | | | | | | | | | | |
Same Store Operating Expenses | | | | | | | | | | | | |
Payroll | | | 14,435 | | | | 13,240 | | | | 9.0 | % |
Repairs & Maintenance | | | 15,086 | | | | 12,647 | | | | 19.3 | % |
Utilities | | | 8,262 | | | | 7,293 | | | | 13.3 | % |
Real Estate Taxes | | | 21,112 | | | | 20,520 | | | | 2.9 | % |
Insurance | | | 4,040 | | | | 3,609 | | | | 11.9 | % |
Property Management Fees | | | 5,011 | | | | 4,382 | | | | 14.4 | % |
Office Operations | | | 2,614 | | | | 2,339 | | | | 11.8 | % |
Marketing | | | 1,411 | | | | 1,207 | | | | 16.9 | % |
Total Same Store Operating Expenses | | | 71,971 | | | | 65,237 | | | | 10.3 | % |
| | | | | | | | | | | | |
Same Store Operating Income | | | | | | | | | | | | |
Miscellaneous income | | | 496 | | | | 633 | | | | -21.6 | % |
Total Same Store Operating Income | | | 496 | | | | 633 | | | | -21.6 | % |
| | | | | | | | | | | | |
YTD Same Store NOI | | $ | 101,481 | | | $ | 87,672 | | | | 15.8 | % |
NEXPOINT RESIDENTIAL TRUST, INC. [NYSE:NXRT]
FFO, Core FFO and AFFO
The following table reconciles our calculations of FFO, Core FFO and AFFO to net loss, the most directly comparable GAAP financial measure, for the three and nine months ended September 30, 2022 and 2021 (in thousands, except per share amounts):
| | For the Three Months Ended September 30, | | | For the Nine Months Ended September 30, | | | | | | |
| | 2022 | | | 2021 | | | 2022 | | | 2021 | | | % Change (1) | | |
Net loss | | $ | (599 | ) | | $ | (5,407 | ) | | $ | (13,093 | ) | | $ | (15,725 | ) | | | -16.7 | % | |
Depreciation and amortization | | | 25,224 | | | | 21,591 | | | | 74,490 | | | | 62,335 | | | | 19.5 | % | |
Adjustment for noncontrolling interests | | | (99 | ) | | | (49 | ) | | | (228 | ) | | | (140 | ) | | N/M | | |
FFO attributable to common stockholders | | | 24,526 | | | | 16,135 | | | | 61,169 | | | | 46,470 | | | | 31.6 | % | |
| | | | | | | | | | | | | | | | | | | | | |
FFO per share - basic | | $ | 0.96 | | | $ | 0.64 | | | $ | 2.39 | | | $ | 1.85 | | | | 29.2 | % | |
FFO per share - diluted | | $ | 0.96 | | | $ | 0.64 | | | $ | 2.39 | | | $ | 1.85 | | | | 29.2 | % | |
| | | | | | | | | | | | | | | | | | | | | |
Loss on extinguishment of debt and modification costs | | | — | | | | — | | | | — | | | | 328 | | | N/M | | |
Casualty-related expenses/(recoveries) | | | (2,976 | ) | | | 120 | | | | 666 | | | | (272 | ) | | N/M | | |
Casualty gains | | | — | | | | — | | | | (357 | ) | | | (2,379 | ) | | N/M | | |
Pandemic expense | | | — | | | | 11 | | | | — | | | | 46 | | | N/M | | |
Amortization of deferred financing costs - acquisition term notes | | | 281 | | | | 150 | | | | 786 | | | | 499 | | | N/M | | |
Adjustment for noncontrolling interests | | | 11 | | | | — | | | | (3 | ) | | | 6 | | | N/M | | |
Core FFO attributable to common stockholders | | | 21,842 | | | | 16,416 | | | | 62,261 | | | | 44,698 | | | | 39.3 | % | |
| | | | | | | | | | | | | | | | | | | | | |
Core FFO per share - basic | | $ | 0.85 | | | $ | 0.65 | | | $ | 2.43 | | | $ | 1.78 | | | | 36.5 | % | |
Core FFO per share - diluted | | $ | 0.85 | | | $ | 0.65 | | | $ | 2.43 | | | $ | 1.78 | | | | 36.5 | % | |
| | | | | | | | | | | | | | | | | | | | | |
Amortization of deferred financing costs - long term debt | | | 453 | | | | 375 | | | | 1,247 | | | | 1,082 | | | | 15.2 | % | |
Equity-based compensation expense | | | 2,025 | | | | 1,807 | | | | 5,906 | | | | 5,211 | | | | 13.3 | % | |
Adjustment for noncontrolling interests | | | (10 | ) | | | (7 | ) | | | (27 | ) | | | (19 | ) | | | 42.1 | % | |
AFFO attributable to common stockholders | | | 24,310 | | | | 18,591 | | | | 69,387 | | | | 50,972 | | | | 36.1 | % | |
| | | | | | | | | | | | | | | | | | | | | |
AFFO per share - basic | | $ | 0.95 | | | $ | 0.74 | | | $ | 2.71 | | | $ | 2.03 | | | | 33.5 | % | |
AFFO per share - diluted | | $ | 0.95 | | | $ | 0.74 | | | $ | 2.71 | | | $ | 2.03 | | | | 33.5 | % | |
| | | | | | | | | | | | | | | | | | | | | |
Weighted average common stock outstanding - basic | | | 25,598 | | | | 25,175 | | | | 25,630 | | | | 25,128 | | | | 2.0 | % | |
Weighted average common stock outstanding - diluted | | | 25,598 | | | | 25,175 | | | | 25,630 | | | | 25,128 | | | | 2.0 | % | |
| | | | | | | | | | | | | | | | | | | | | |
Dividends declared per common share | | $ | 0.38 | | | $ | 0.34 | | | $ | 1.14 | | | $ | 1.02 | | | | 11.4 | % | |
| | | | | | | | | | | | | | | | | | | | | |
FFO Coverage - diluted | (2) | 2.52x | | | 1.88x | | | 2.10x | | | 1.81x | | | | 16.02 | % | |
Core FFO Coverage - diluted | (2) | 2.25x | | | 1.91x | | | 2.13x | | | 1.74x | | | | 22.60 | % | |
AFFO Coverage - diluted | (2) | 2.50x | | | 2.16x | | | 2.38x | | | 1.98x | | | | 19.88 | % | |
(1) | Represents the percentage change for the nine months ended September 30, 2022 compared to the nine months ended September 30, 2021. |
(2) | Indicates coverage ratio of FFO/Core FFO/AFFO per common share (diluted) over dividends declared per common share during the period. |
NEXPOINT RESIDENTIAL TRUST, INC. [NYSE:NXRT]
Historical Capital Expenditures
| | Q3 2022 | | | Q3 2021 | | | % Change | | | YTD 2022 | | | YTD 2021 | | | % Change | |
($ in thousands) | | | | | | | | | | | | | | | | | | | | | | | | |
Capital Expenditures | | | | | | | | | | | | | | | | | | | | | | | | |
Acquisition Capital Expenditures | | $ | — | | | $ | 74,760 | | | | -100.0 | % | | $ | 143,400 | | | $ | 196,260 | | | | -26.9 | % |
| | | | | | | | | | | | | | | | | | | | | | | | |
Capitalized Rehab Expenditures | | | | | | | | | | | | | | | | | | | | | | | | |
Interior | | | 6,946 | | | | 2,739 | | | | 153.6 | % | | | 17,584 | | | | 8,097 | | | | 117.2 | % |
Exterior and common area | | | 3,519 | | | | 1,498 | | | | 134.9 | % | | | 6,874 | | | | 6,780 | | | | 1.4 | % |
| | | | | | | | | | | | | | | | | | | | | | | | |
Capitalized Maintenance Expenditures | | | | | | | | | | | | | | | | | | | | | | | | |
Recurring | | | 3,943 | | | | 2,573 | | | | 53.3 | % | | | 8,979 | | | | 5,843 | | | | 53.7 | % |
Non-Recurring | | | 2,012 | | | | 2,014 | | | | -0.1 | % | | | 5,378 | | | | 3,888 | | | | 38.3 | % |
| | | | | | | | | | | | | | | | | | | | | | | | |
Total Capital Expenditures | | $ | 16,420 | | | $ | 83,584 | | | | -80.4 | % | | $ | 182,214 | | | $ | 220,868 | | | | -17.5 | % |

NEXPOINT RESIDENTIAL TRUST, INC. [NYSE:NXRT]
Value-Add Program Details: Interiors (Full & Partials)
Property Name (1) | | Units | | | Rehab Units Completed (2) | | | Average Rent Pre-Rehab | | | Average Rent Post-Rehab | | | Avg. Rehab Cost Per Unit (3) | | | Post-Rehab Rent Change % | | | ROI (3) | |
Value-Add Programs In Progress | | | | | | | | | | | | | | | | | | | | | | | | | | | | |
Arbors of Brentwood | | | 346 | | | | 98 | | | $ | 1,232 | | | $ | 1,407 | | | $ | 8,867 | | | | 14.2 | % | | | 23.6 | % |
Arbors on Forest Ridge | | | 210 | | | | 171 | | | | 797 | | | | 899 | | | | 4,404 | | | | 12.7 | % | | | 27.6 | % |
Atera Apartments | | | 380 | | | | 208 | | | | 1,166 | | | | 1,315 | | | | 3,286 | | | | 12.7 | % | | | 54.2 | % |
Avant at Pembroke Pines | | | 1,520 | | | | 425 | | | | 1,715 | | | | 1,973 | | | | 14,579 | | | | 15.1 | % | | | 21.3 | % |
Bella Solara | | | 320 | | | | 103 | | | | 1,288 | | | | 1,448 | | | | 10,401 | | | | 12.5 | % | | | 18.6 | % |
Bella Vista | | | 248 | | | | 169 | | | | 1,440 | | | | 1,592 | | | | 10,425 | | | | 10.5 | % | | | 17.5 | % |
Bloom | | | 528 | | | | 91 | | | | 1,259 | | | | 1,415 | | | | 12,439 | | | | 12.4 | % | | | 15.1 | % |
Brandywine I & II | | | 632 | | | | 354 | | | | 1,038 | | | | 1,192 | | | | 8,704 | | | | 14.9 | % | | | 21.3 | % |
Courtney Cove | | | 324 | | | | 232 | | | | 913 | | | | 1,017 | | | | 4,922 | | | | 11.3 | % | | | 25.3 | % |
Creekside at Matthews | | | 240 | | | | 39 | | | | 1,367 | | | | 1,539 | | | | 10,981 | | | | 12.6 | % | | | 18.8 | % |
Cutter's Point | | | 196 | | | | 141 | | | | 962 | | | | 1,082 | | | | 5,844 | | | | 12.4 | % | | | 24.6 | % |
Estates on Maryland | | | 330 | | | | 28 | | | | 1,304 | | | | 1,491 | | | | 9,864 | | | | 14.4 | % | | | 22.8 | % |
Fairways of San Marcos | | | 352 | | | | 103 | | | | 1,531 | | | | 1,716 | | | | 10,512 | | | | 12.1 | % | | | 21.2 | % |
High House at Cary | | | 302 | | | | 30 | | | | 1,343 | | | | 1,588 | | | | 10,030 | | | | 18.3 | % | | | 29.4 | % |
Hollister Place | | | 260 | | | | 202 | | | | 904 | | | | 1,055 | | | | 7,413 | | | | 16.7 | % | | | 24.4 | % |
Madera Point | | | 256 | | | | 244 | | | | 858 | | | | 967 | | | | 4,269 | | | | 12.7 | % | | | 30.6 | % |
Parc500 | | | 217 | | | | 197 | | | | 1,263 | | | | 1,451 | | | | 13,797 | | | | 14.9 | % | | | 16.3 | % |
Radbourne Lake | | | 225 | | | | 328 | | | | 1,039 | | | | 1,089 | | | | 1,495 | | | | 4.8 | % | | | 40.3 | % |
Residences at Glenview Reserve | | | 360 | | | | 161 | | | | 1,136 | | | | 1,315 | | | | 11,687 | | | | 15.8 | % | | | 18.4 | % |
Residences at West Place | | | 342 | | | | 94 | | | | 1,442 | | | | 1,625 | | | | 9,871 | | | | 12.7 | % | | | 22.3 | % |
Rockledge Apartments | | | 708 | | | | 367 | | | | 1,182 | | | | 1,382 | | | | 10,293 | | | | 16.9 | % | | | 23.3 | % |
Sabal Palm at Lake Buena Vista | | | 400 | | | | 48 | | | | 1,578 | | | | 1,778 | | | | 8,181 | | | | 12.7 | % | | | 29.3 | % |
Seasons 704 Apartments | | | 222 | | | | 213 | | | | 1,166 | | | | 1,290 | | | | 6,315 | | | | 10.7 | % | | | 23.6 | % |
Silverbrook | | | 642 | | | | 480 | | | | 802 | | | | 888 | | | | 4,085 | | | | 10.8 | % | | | 25.4 | % |
Six Forks Station | | | 323 | | | | 60 | | | | 1,168 | | | | 1,402 | | | | 11,943 | | | | 20.0 | % | | | 23.5 | % |
Summers Landing | | | 196 | | | | 25 | | | | 989 | | | | 1,167 | | | | 7,269 | | | | 18.0 | % | | | 29.5 | % |
Summit at Sabal Park | | | 252 | | | | 224 | | | | 969 | | | | 1,071 | | | | 5,727 | | | | 10.5 | % | | | 21.3 | % |
The Adair | | | 232 | | | | 42 | | | | 1,707 | | | | 1,985 | | | | 12,825 | | | | 16.3 | % | | | 26.0 | % |
The Cornerstone | | | 430 | | | | 400 | | | | 988 | | | | 1,077 | | | | 5,183 | | | | 9.1 | % | | | 20.8 | % |
The Enclave | | | 204 | | | | 142 | | | | 1,428 | | | | 1,610 | | | | 9,603 | | | | 12.8 | % | | | 22.8 | % |
The Heritage | | | 204 | | | | 146 | | | | 1,376 | | | | 1,523 | | | | 10,171 | | | | 10.6 | % | | | 17.3 | % |
The Preserve at Terrell Mill | | | 752 | | | | 616 | | | | 836 | | | | 991 | | | | 10,144 | | | | 18.6 | % | | | 18.4 | % |
The Verandas at Lake Norman | | | 264 | | | | 33 | | | | 1,434 | | | | 1,620 | | | | 10,632 | | | | 13.0 | % | | | 21.0 | % |
The Venue on Camelback | | | 415 | | | | 224 | | | | 753 | | | | 1,007 | | | | 9,779 | | | | 33.6 | % | | | 31.1 | % |
Timber Creek | | | 352 | | | | 240 | | | | 889 | | | | 1,032 | | | | 7,464 | | | | 16.1 | % | | | 23.0 | % |
Torreyana Apartments | | | 316 | | | | 36 | | | | 1,500 | | | | 1,620 | | | | 12,206 | | | | 8.0 | % | | | 11.8 | % |
Venue at 8651 | | | 333 | | | | 276 | | | | 808 | | | | 916 | | | | 6,735 | | | | 13.4 | % | | | 19.4 | % |
Versailles | | | 388 | | | | 299 | | | | 802 | | | | 900 | | | | 6,103 | | | | 12.2 | % | | | 19.3 | % |
Versailles II | | | 242 | | | | 65 | | | | 953 | | | | 1,079 | | | | 4,648 | | | | 13.2 | % | | | 32.6 | % |
Total/Weighted Average | | | 14,463 | | | | 7,354 | | | $ | 1,063 | | | $ | 1,208 | | | $ | 7,942 | | | | 13.7 | % | | | 22.0 | % |
(1) | We do not plan to upgrade 100% of the units at each of our properties. |
(2) | Inclusive of all full and partial interior upgrades completed through September 30, 2022. |
(3) | Inclusive of all full and partial interior upgrades completed and leased through September 30, 2022. |
NEXPOINT RESIDENTIAL TRUST, INC. [NYSE:NXRT]
Value-Add Program Details: Kitchen & Laundry Appliances
Property Name (1) | | Units | | | Rehab Units Completed (2) | | | Avg. Rehab Cost Per Unit (3) | | | Post-Rehab Rent Change $ | | | ROI (3) | |
Value-Add Programs In Progress | | | | | | | | | | | | | | | | | | | | |
Arbors of Brentwood | | | 346 | | | | 297 | | | $ | 844 | | | $ | 50 | | | | 70.8 | % |
Arbors on Forest Ridge | | | 210 | | | | 121 | | | | 749 | | | | 41 | | | | 65.6 | % |
Atera Apartments | | | 380 | | | | 363 | | | | 813 | | | | 40 | | | | 59.7 | % |
Avant at Pembroke Pines | | | 1,520 | | | | 50 | | | | 789 | | | | 39 | | | | 58.9 | % |
Brandywine I & II | | | 632 | | | | 143 | | | | 1,070 | | | | 79 | | | | 88.9 | % |
Creekside at Matthews | | | 240 | | | | 103 | | | | 1,088 | | | | 55 | | | | 60.7 | % |
Cutter's Point | | | 196 | | | | 136 | | | | 750 | | | | 46 | | | | 73.4 | % |
Estates on Maryland | | | 330 | | | | 24 | | | | 1,100 | | | | 35 | | | | 38.2 | % |
Hollister Place | | | 260 | | | | 233 | | | | 966 | | | | 50 | | | | 62.1 | % |
Madera Point | | | 256 | | | | 156 | | | | 885 | | | | 30 | | | | 40.2 | % |
Radbourne Lake | | | 225 | | | | 224 | | | | 717 | | | | 40 | | | | 66.9 | % |
Rockledge Apartments | | | 708 | | | | 597 | | | | 812 | | | | 40 | | | | 59.1 | % |
Sabal Palm at Lake Buena Vista | | | 400 | | | | 634 | | | | 599 | | | | 86 | | | | 171.8 | % |
Silverbrook | | | 642 | | | | 376 | | | | 735 | | | | 49 | | | | 79.5 | % |
Six Forks Station | | | 323 | | | | 169 | | | | 1,100 | | | | 55 | | | | 60.0 | % |
Summers Landing | | | 196 | | | | 79 | | | | 819 | | | | 50 | | | | 73.3 | % |
Summit at Sabal Park | | | 252 | | | | 241 | | | | 994 | | | | 40 | | | | 48.3 | % |
The Adair | | | 232 | | | | 11 | | | | 1,100 | | | | 45 | | | | 49.1 | % |
The Cornerstone | | | 430 | | | | 17 | | | | 809 | | | | 50 | | | | 74.2 | % |
The Verandas at Lake Norman | | | 264 | | | | 90 | | | | 1,092 | | | | 45 | | | | 49.4 | % |
Timber Creek | | | 352 | | | | 135 | | | | 758 | | | | 45 | | | | 71.3 | % |
Venue at 8651 | | | 333 | | | | 234 | | | | 744 | | | | 46 | | | | 74.7 | % |
Versailles | | | 388 | | | | 297 | | | | 866 | | | | 50 | | | | 68.9 | % |
Versailles II | | | 242 | | | | 123 | | | | 880 | | | | 28 | | | | 37.9 | % |
Total/Weighted Average | | | 9,357 | | | | 4,853 | | | $ | 843 | | | $ | 49 | | | | 69.3 | % |
(1) | We do not plan to upgrade 100% of the units at each of our properties. |
(2) | Inclusive of all kitchen and laundry appliance upgrades completed through September 30, 2022. |
(3) | Inclusive of all kitchen and laundry appliance upgrades completed and leased through September 30, 2022. |
NEXPOINT RESIDENTIAL TRUST, INC. [NYSE:NXRT]
Value-Add Program Details: Smart Home Technology Packages
Property Name (1) | | Units | | | Rehab Units Completed (2) | | | Avg. Rehab Cost Per Unit (3) | | | Post-Rehab Rent Change $ | | | ROI (3) | |
Value-Add Programs In Progress | | | | | | | | | | | | | | | | | | | | |
Arbors of Brentwood | | | 346 | | | | 346 | | | $ | 1,419 | | | $ | 45 | | | | 30.9 | % |
Arbors on Forest Ridge | | | 210 | | | | 210 | | | | 1,416 | | | | 45 | | | | 30.9 | % |
Atera Apartments | | | 380 | | | | 380 | | | | 1,339 | | | | 50 | | | | 37.0 | % |
Avant at Pembroke Pines | | | 1,520 | | | | 1,520 | | | | 1,350 | | | | 45 | | | | 32.4 | % |
Bella Vista | | | 248 | | | | 248 | | | | 970 | | | | 40 | | | | 39.3 | % |
Brandywine I & II | | | 632 | | | | 632 | | | | 1,234 | | | | 45 | | | | 35.5 | % |
Courtney Cove | | | 324 | | | | 324 | | | | 1,238 | | | | 35 | | | | 26.2 | % |
Creekside at Matthews | | | 240 | | | | 240 | | | | 913 | | | | 65 | | | | 72.9 | % |
Cutter's Point | | | 196 | | | | 196 | | | | 1,400 | | | | 45 | | | | 31.3 | % |
Fairways of San Marcos | | | 352 | | | | 352 | | | | 901 | | | | 40 | | | | 42.3 | % |
Hollister Place | | | 260 | | | | 260 | | | | 843 | | | | 35 | | | | 38.4 | % |
Madera Point | | | 256 | | | | 256 | | | | 1,283 | | | | 45 | | | | 34.1 | % |
Old Farm | | | 734 | | | | 734 | | | | 928 | | | | 45 | | | | 47.2 | % |
Radbourne Lake | | | 225 | | | | 225 | | | | 630 | | | | 35 | | | | 51.4 | % |
Residences at Glenview Reserve | | | 360 | | | | 360 | | | | 1,017 | | | | 45 | | | | 43.1 | % |
Sabal Palm at Lake Buena Vista | | | 400 | | | | 400 | | | | 1,237 | | | | 45 | | | | 35.4 | % |
Silverbrook | | | 642 | | | | 642 | | | | 1,308 | | | | 45 | | | | 33.5 | % |
Six Forks Station | | | 323 | | | | 323 | | | | 844 | | | | 35 | | | | 38.4 | % |
Stone Creek at Old Farm | | | 190 | | | | 190 | | | | 909 | | | | 45 | | | | 48.2 | % |
Summers Landing | | | 196 | | | | 196 | | | | 1,449 | | | | 45 | | | | 30.2 | % |
The Cornerstone | | | 430 | | | | 430 | | | | 1,236 | | | | 45 | | | | 35.4 | % |
The Enclave | | | 204 | | | | 204 | | | | 966 | | | | 40 | | | | 39.4 | % |
The Heritage | | | 204 | | | | 204 | | | | 997 | | | | 40 | | | | 38.2 | % |
The Verandas at Lake Norman | | | 264 | | | | 264 | | | | 954 | | | | 65 | | | | 69.8 | % |
Timber Creek | | | 352 | | | | 352 | | | | 1,299 | | | | 45 | | | | 33.7 | % |
Venue at 8651 | | | 333 | | | | 333 | | | | 1,229 | | | | 45 | | | | 35.6 | % |
Versailles | | | 388 | | | | 388 | | | | 1,080 | | | | 45 | | | | 40.6 | % |
Versailles II | | | 242 | | | | 242 | | | | 1,241 | | | | 45 | | | | 35.3 | % |
Total/Weighted Average | | | 10,451 | | | | 10,451 | | | $ | 1,163 | | | $ | 44 | | | | 37.3 | % |
| | | | | | | | | | | | | | | | | | | | |
Planned Value-Add Programs | | | | | | | | | | | | | | Rent Change & ROI (Projections) | |
Bella Solara | | | 320 | | | | — | | | TBD | | | TBD | | | TBD | |
Bloom | | | 528 | | | | — | | | TBD | | | TBD | | | TBD | |
Residences at West Place | | | 342 | | | | — | | | TBD | | | TBD | | | TBD | |
Rockledge Apartments | | | 708 | | | | — | | | TBD | | | TBD | | | TBD | |
Seasons 704 Apartments | | | 222 | | | | — | | | TBD | | | TBD | | | TBD | |
Summit at Sabal Park | | | 252 | | | | — | | | TBD | | | TBD | | | TBD | |
The Adair | | | 232 | | | | — | | | TBD | | | TBD | | | TBD | |
The Preserve at Terrell Mill | | | 752 | | | | — | | | TBD | | | TBD | | | TBD | |
The Venue on Camelback | | | 415 | | | | — | | | TBD | | | TBD | | | TBD | |
Torreyana Apartments | | | 316 | | | | — | | | TBD | | | TBD | | | TBD | |
Total/Weighted Average Planned | | | 4,087 | | | | — | | | TBD | | | TBD | | | TBD | |
(1) | We do not plan to upgrade 100% of the units at each of our properties. |
(2) | Inclusive of all smart home technology package upgrades completed through September 30, 2022. |
(3) | Inclusive of all smart home technology package upgrades completed and leased through September 30, 2022. |
NEXPOINT RESIDENTIAL TRUST, INC. [NYSE:NXRT]
Outstanding Debt Details
Mortgage Debt
The following table contains summary information concerning the mortgage debt of the Company as of September 30, 2022 (dollars in thousands):
Operating Properties | | Type | | Term (months) | | | Outstanding Principal (1) | | | Interest Rate (2) | | | Maturity Date | |
Arbors on Forest Ridge | | Floating | | | 84 | | | $ | 13,130 | | | 4.82% | | | 7/1/2024 | (3) |
Cutter's Point | | Floating | | | 84 | | | | 16,640 | | | 4.82% | | | 7/1/2024 | (3) |
Silverbrook | | Floating | | | 84 | | | | 30,590 | | | 4.82% | | | 7/1/2024 | (3) |
The Summit at Sabal Park | | Floating | | | 84 | | | | 13,560 | | | 4.76% | | | 7/1/2024 | (3) |
Courtney Cove | | Floating | | | 84 | | | | 13,680 | | | 4.76% | | | 7/1/2024 | (3) |
The Preserve at Terrell Mill | | Floating | | | 84 | | | | 42,480 | | | 4.76% | | | 7/1/2024 | (3) |
Versailles | | Floating | | | 84 | | | | 23,880 | | | 4.76% | | | 7/1/2024 | (3) |
Seasons 704 Apartments | | Floating | | | 84 | | | | 17,460 | | | 4.76% | | | 7/1/2024 | (3) |
Madera Point | | Floating | | | 84 | | | | 15,150 | | | 4.76% | | | 7/1/2024 | (3) |
Venue at 8651 | | Floating | | | 84 | | | | 13,734 | | | 4.92% | | | 7/1/2024 | (3) |
The Venue on Camelback | | Floating | | | 84 | | | | 28,093 | | | 4.82% | | | 7/1/2024 | |
Timber Creek | | Floating | | | 84 | | | | 24,100 | | | 4.40% | | | 10/1/2025 | |
Radbourne Lake | | Floating | | | 84 | | | | 20,000 | | | 4.43% | | | 10/1/2025 | |
Sabal Palm at Lake Buena Vista | | Floating | | | 84 | | | | 42,100 | | | 4.44% | | | 9/1/2025 | |
Cornerstone | | Fixed | | | 120 | | | | 20,417 | | | 4.24% | | | 3/1/2023 | |
Parc500 | | Fixed | | | 120 | | | | 14,443 | | | 4.49% | | | 8/1/2025 | (3) |
Rockledge Apartments | | Floating | | | 84 | | | | 68,100 | | | 4.71% | | | 7/1/2024 | (3) |
Atera Apartments | | Floating | | | 84 | | | | 29,500 | | | 4.62% | | | 11/1/2024 | (3) |
Crestmont Reserve | | Floating | | | 84 | | | | 12,061 | | | 4.32% | | | 10/1/2025 | |
Brandywine I & II | | Floating | | | 84 | | | | 43,835 | | | 4.32% | | | 10/1/2025 | |
Bella Vista | | Floating | | | 84 | | | | 29,040 | | | 4.46% | | | 2/1/2026 | |
The Enclave | | Floating | | | 84 | | | | 25,322 | | | 4.46% | | | 2/1/2026 | |
The Heritage | | Floating | | | 84 | | | | 24,625 | | | 4.46% | | | 2/1/2026 | |
Summers Landing | | Floating | | | 84 | | | | 10,109 | | | 4.32% | | | 10/1/2025 | |
Residences at Glenview Reserve | | Floating | | | 84 | | | | 25,977 | | | 4.58% | | | 10/1/2025 | |
Residences at West Place | | Fixed | | | 120 | | | | 33,817 | | | 4.24% | | | 10/1/2028 | |
Avant at Pembroke Pines | | Floating | | | 84 | | | | 177,101 | | | 4.57% | | | 9/1/2026 | |
Arbors of Brentwood | | Floating | | | 84 | | | | 34,237 | | | 4.57% | | | 10/1/2026 | |
Torreyana Apartments | | Floating | | | 84 | | | | 37,400 | | | 4.84% | | | 12/1/2026 | (3) |
Bloom | | Floating | | | 84 | | | | 58,850 | | | 4.84% | | | 12/1/2026 | (3) |
Bella Solara | | Floating | | | 84 | | | | 36,575 | | | 4.84% | | | 12/1/2026 | (3) |
Fairways at San Marcos | | Floating | | | 84 | | | | 46,464 | | | 4.60% | | | 12/1/2027 | (3) |
The Verandas at Lake Norman | | Floating | | | 84 | | | | 34,925 | | | 4.32% | | | 7/1/2028 | (3) |
Creekside at Matthews | | Floating | | | 84 | | | | 31,900 | | | 4.32% | | | 7/1/2028 | (3) |
Six Forks Station | | Floating | | | 120 | | | | 41,180 | | | 4.18% | | | 10/1/2031 | |
High House at Cary | | Floating | | | 84 | | | | 46,625 | | | 4.48% | | | 1/1/2029 | |
The Adair | | Floating | | | 84 | | | | 35,115 | | | 4.44% | | | 4/1/2029 | |
Estates on Maryland | | Floating | | | 84 | | | | 43,157 | | | 4.44% | | | 4/1/2029 | |
| | | | | | | | | 1,275,372 | | | | | | | | |
Fair market value adjustment | | | | | | | | | 908 | | | | | | | | |
Deferred financing costs, net of accumulated amortization of $5,800 | | | | | | | | | (7,673 | ) | | | | | | | |
| | | | | | | | | 1,268,607 | | | | | | | | |
| | | | | | | | | | | | | | | | | |
Held For Sale Property | | | | | | | | | | | | | | | | | |
Hollister Place | | Floating | | | 84 | | | | 14,811 | | | 4.48% | | | 10/1/2025 | |
Old Farm | | Floating | | | 84 | | | | 52,886 | | | 4.82% | | | 7/1/2024 | |
Stone Creek at Old Farm | | Floating | | | 84 | | | | 15,274 | | | 4.82% | | | 7/1/2024 | |
| | | | | | | | | 82,971 | | | | | | | | |
Deferred financing costs, net of accumulated amortization of $652 | | | | | | | | | (279 | ) | | | | | | | |
| | | | | | | | $ | 82,692 | | | | | | | | |
(1) | Mortgage debt that is non-recourse to the Company and encumbers the multifamily properties. |
(2) | Interest rate is based on a reference rate plus an applicable margin, except for fixed rate mortgage debt. One-month LIBOR was 3.14% and 30-Day Average SOFR was 2.47% as of September 30, 2022. |
(3) | The Company is finalizing a 10-year term refinance on 19 properties at SOFR plus a 1.55% margin. The refinance is expected to close on November 30, 2022. |
NEXPOINT RESIDENTIAL TRUST, INC. [NYSE:NXRT]
Credit Facility
The following table contains summary information concerning the Company’s credit facility as of September 30, 2022 (dollars in thousands):
| | Type | | Term (months) | | | Outstanding Principal | | | Interest Rate (1) | | | Maturity Date (2) |
| | | | | | | | | | | | | | | | |
Corporate Credit Facility | | Floating | | | 36 | | | $ | 335,000 | | | 5.29% | | | 6/30/2024 |
Deferred financing costs, net of accumulated amortization of $910 | | | | | | | | | (1,572 | ) | | | | | | |
| | | | | | | | $ | 333,428 | | | | | | | |
(1) | Interest rate is based on Term SOFR plus an applicable margin. Term SOFR as of September 30, 2022 was 3.04%. |
(2) | The Company has executed it’s 12-month extension option on the Revolving Credit Facility, resulting in a maturity date of June 30, 2025. |
Interest Rate Swap Agreements
As of September 30, 2022, the Company had the following outstanding interest rate swaps that were designated as cash flow hedges of interest rate risk (dollars in thousands):
Effective Date | | Termination Date | | Counterparty | | Notional Amount | | | Fixed Rate (1) | | |
June 1, 2019 | | June 1, 2024 | | KeyBank | | | 50,000 | | | | 2.0020 | % | |
June 1, 2019 | | June 1, 2024 | | Truist | | | 50,000 | | | | 2.0020 | % | |
September 1, 2019 | | September 1, 2026 | | KeyBank | | | 100,000 | | | | 1.4620 | % | |
September 1, 2019 | | September 1, 2026 | | KeyBank | | | 125,000 | | | | 1.3020 | % | |
January 3, 2020 | | September 1, 2026 | | KeyBank | | | 92,500 | | | | 1.6090 | % | |
March 4, 2020 | | June 1, 2026 | | Truist | | | 100,000 | | | | 0.8200 | % | |
June 1, 2021 | | September 1, 2026 | | KeyBank | | | 200,000 | | | | 0.8450 | % | |
June 1, 2021 | | September 1, 2026 | | KeyBank | | | 200,000 | | | | 0.9530 | % | |
March 1, 2022 | | March 1, 2025 | | Truist | | | 145,000 | | | | 0.5730 | % | |
March 1, 2022 | | March 1, 2025 | | Truist | | | 105,000 | | | | 0.6140 | % | |
| | | | | | | 1,167,500 | | | | 1.0682 | % | (2) |
(1) | The floating rate option for the interest rate swaps is one-month LIBOR. As of September 30, 2022, one-month LIBOR was 3.14%. |
(2) | Represents the weighted average fixed rate of the interest rate swaps. |
The following table contains summary information regarding our forward interest rate swap (dollars in thousands):
Effective Date | | Termination Date | | Counterparty | | Notional Amount | | | Fixed Rate (1) | | |
September 1, 2026 | | January 1, 2027 | | KeyBank | | $ | 92,500 | | | | 1.7980 | % | |
(1) | The floating rate option for the interest rate swap is one-month LIBOR. As of September 30, 2022, one-month LIBOR was 3.14%. |
NEXPOINT RESIDENTIAL TRUST, INC. [NYSE:NXRT]
Debt Maturity Schedule
The following table summarizes our contractual obligations and commitments as of September 30, 2022 for the next five calendar years subsequent to September 30, 2022 and thereafter. We used the applicable reference rates as of September 30, 2022 to calculate interest expense due by period on our floating rate debt and net interest expense due by period on our interest rate swaps.
| | | Payments Due by Period (in thousands) | |
| | | Total | | | Remainder of 2022 | | | 2023 | | | 2024 | | | 2025 | | | 2026 | | | Thereafter | |
Operating Properties Mortgage Debt | | | | | | | | | | | | | | | | | | | | | | | | | | | | | |
Principal payments | | | $ | 1,275,372 | | | $ | 313 | | | $ | 20,925 | | | $ | 326,697 | | | $ | 191,105 | | | $ | 423,149 | | | $ | 313,183 | |
Interest expense | (1) | | | 121,328 | | | | 8,699 | | | | 33,758 | | | | 26,951 | | | | 21,989 | | | | 16,182 | | | | 13,750 | |
Total | | | $ | 1,396,700 | | | $ | 9,012 | | | $ | 54,683 | | | $ | 353,648 | | | $ | 213,094 | | | $ | 439,331 | | | $ | 326,933 | |
| | | | | | | | | | | | | | | | | | | | | | | | | | | | | |
| | | | | | | | | | | | | | | | | | | | | | | | | | | | | |
Held For Sale Property Mortgage Debt | | | | | | | | | | | | | | | | | | | | | | | | | | | | | |
Principal payments | | | $ | 82,971 | | | $ | — | | | $ | — | | | $ | 68,160 | | | $ | 14,811 | | | $ | — | | | $ | — | |
Interest expense | | | | 7,856 | | | | 1,010 | | | | 4,006 | | | | 2,337 | | | | 503 | | | | — | | | | — | |
Total | | | $ | 90,827 | | | $ | 1,010 | | | $ | 4,006 | | | $ | 70,497 | | | $ | 15,314 | | | $ | — | | | $ | — | |
| | | | | | | | | | | | | | | | | | | | | | | | | | | | | |
Credit Facility | | | | | | | | | | | | | | | | | | | | | | | | | | | | | |
Principal payments | | | $ | 335,000 | | | $ | — | | | $ | — | | | $ | 335,000 | | | $ | — | | | $ | — | | | $ | — | |
Interest expense | | | | 32,932 | | | | 4,733 | | | | 18,851 | | | | 9,348 | | | | — | | | | — | | | | — | |
Total | | | $ | 367,932 | | | $ | 4,733 | | | $ | 18,851 | | | $ | 344,348 | | | $ | — | | | $ | — | | | $ | — | |
| | | | | | | | | | | | | | | | | | | | | | | | | | | | | |
Total contractual obligations and commitments | (2) | | $ | 1,855,459 | | | $ | 14,755 | | | $ | 77,540 | | | $ | 768,493 | | | $ | 228,408 | | | $ | 439,331 | | | $ | 326,933 | |
(1) | Interest expense obligations includes the impact of expected settlements on interest rate swaps which have been entered into in order to fix the interest rate on the hedged portion of our floating rate debt obligations. As of September 30, 2022, we had entered into 10 interest rate swap transactions with a combined notional amount of $1.2 billion. We have allocated the total impact of expected settlements on the $1.2 billion notional amount of interest rate swaps to ‘Operating Properties Mortgage Debt.’ We used the applicable reference rates as of September 30, 2022 to determine our expected settlements through the terms of the interest rate swaps. |
(2) | See page 6 for pro forma contractual obligations and commitments showing the impact of the Company’s refinance. |
��
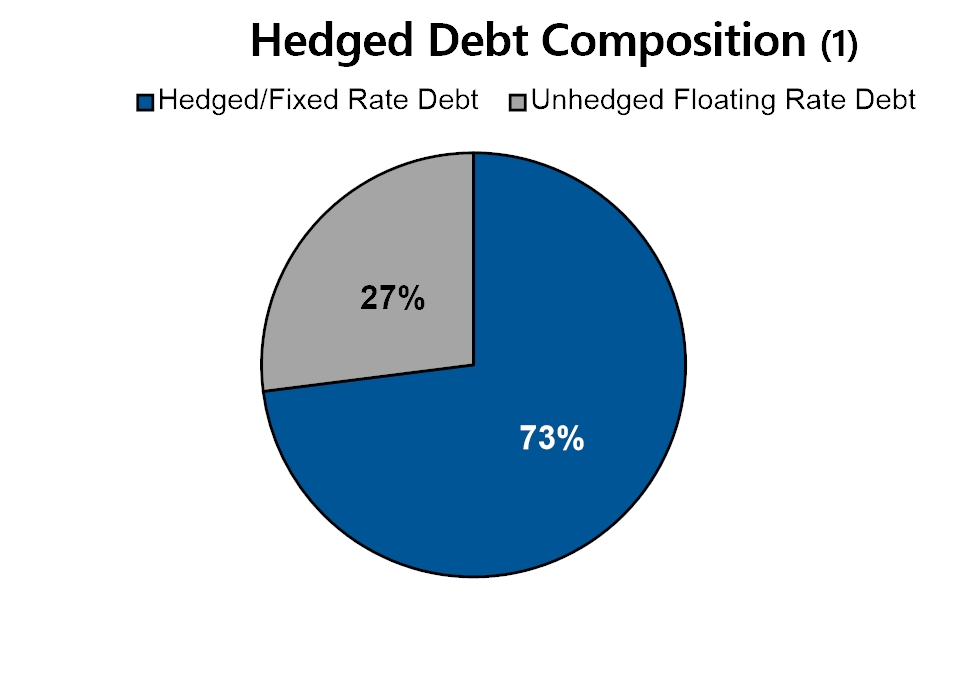
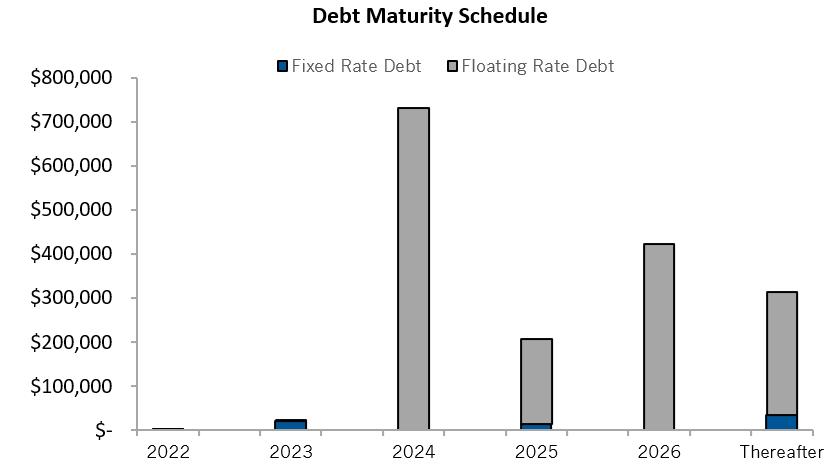
(1) | As of September 30, 2022, we had total indebtedness of $1.7 billion at an adjusted weighted average interest rate of 3.23%, of which $1.6 billion was debt with a floating interest rate. As of September 30, 2022, interest rate swap agreements effectively covered 91% of our $1.3 billion of floating rate mortgage debt outstanding. For purposes of calculating the adjusted weighted average interest rate of the total indebtedness, we have included the weighted average fixed rate of 1.0682% for one-month LIBOR on the $1.2 billion notional amount of interest rate swap agreements that we have entered into as of September 30, 2022. |
NEXPOINT RESIDENTIAL TRUST, INC. [NYSE:NXRT]
Historical Acquisition Details
(in thousands, except for unit and per unit amounts) |
Property Name (1) | | Location | | Units | | Transaction Date | | Purchase Price | | Rehab Budget (2) | | Total Investment | | Per Unit |
Arbors on Forest Ridge | | Bedford, TX | | 210 | | 1/31/2014 | | $12,805 | | $1,449 | | $14,254 | | $67,876 |
Cutter's Point | | Richardson, TX | | 196 | | 1/31/2014 | | 15,845 | | 1,357 | | 17,202 | | 87,765 |
Silverbrook | | Grand Prairie, TX | | 642 | | 1/31/2014 | | 30,400 | | 1,661 | | 32,061 | | 49,939 |
The Summit at Sabal Park | | Tampa, FL | | 252 | | 8/20/2014 | | 19,050 | | 1,656 | | 20,706 | | 82,167 |
Courtney Cove | | Tampa, FL | | 324 | | 8/20/2014 | | 18,950 | | 1,691 | | 20,641 | | 63,707 |
Radbourne Lake | | Charlotte, NC | | 225 | | 9/30/2014 | | 24,250 | | 1,438 | | 25,688 | | 114,169 |
Timber Creek | | Charlotte, NC | | 352 | | 9/30/2014 | | 22,750 | | 4,334 | | 27,084 | | 76,943 |
Sabal Palm at Lake Buena Vista | | Orlando, FL | | 400 | | 11/5/2014 | | 49,500 | | 1,346 | | 50,846 | | 127,115 |
Cornerstone | | Orlando, FL | | 430 | | 1/15/2015 | | 31,550 | | 2,662 | | 34,212 | | 79,563 |
The Preserve at Terrell Mill | | Marietta, GA | | 752 | | 2/6/2015 | | 58,000 | | 6,688 | | 64,688 | | 86,021 |
Versailles | | Dallas, TX | | 388 | | 2/26/2015 | | 26,165 | | 3,917 | | 30,082 | | 77,531 |
Seasons 704 Apartments | | West Palm Beach, FL | | 222 | | 4/15/2015 | | 21,000 | | 1,900 | | 22,900 | | 103,153 |
Madera Point | | Mesa, AZ | | 256 | | 8/5/2015 | | 22,525 | | 1,808 | | 24,333 | | 95,051 |
Venue at 8651 | | Fort Worth, TX | | 333 | | 10/30/2015 | | 19,250 | | 4,592 | | 23,842 | | 71,598 |
Parc500 | | West Palm Beach, FL | | 217 | | 7/27/2016 | | 22,421 | | 5,082 | | 27,503 | | 126,742 |
The Venue on Camelback | | Phoenix, AZ | | 415 | | 10/11/2016 | | 44,600 | | 6,018 | | 50,618 | | 121,971 |
Old Farm | | Houston, TX | | 734 | | 12/29/2016 | | 84,721 | | 1,135 | | 85,856 | | 116,970 |
Stone Creek at Old Farm | | Houston, TX | | 190 | | 12/29/2016 | | 23,332 | | 456 | | 23,788 | | 125,200 |
Hollister Place | | Houston, TX | | 260 | | 2/1/2017 | | 24,500 | | 2,952 | | 27,452 | | 105,585 |
Rockledge Apartments | | Marietta, GA | | 708 | | 6/30/2017 | | 113,500 | | 7,685 | | 121,185 | | 171,165 |
Atera Apartments | | Dallas, TX | | 380 | | 10/25/2017 | | 59,200 | | 3,721 | | 62,921 | | 165,582 |
Crestmont Reserve | | Dallas, TX | | 242 | | 9/26/2018 | | 24,680 | | 2,797 | | 27,477 | | 113,541 |
Brandywine I & II | | Nashville, TN | | 632 | | 9/26/2018 | | 79,800 | | 7,762 | | 87,562 | | 138,547 |
Bella Vista | | Phoenix, AZ | | 248 | | 1/28/2019 | | 48,400 | | 3,414 | | 51,814 | | 208,927 |
The Enclave | | Tempe, AZ | | 204 | | 1/28/2019 | | 41,800 | | 2,608 | | 44,408 | | 217,686 |
The Heritage | | Phoenix, AZ | | 204 | | 1/28/2019 | | 41,900 | | 2,660 | | 44,560 | | 218,431 |
Summers Landing | | Fort Worth, TX | | 196 | | 6/7/2019 | | 19,396 | | 2,980 | | 22,376 | | 114,163 |
Residences at Glenview Reserve | | Nashville, TN | | 360 | | 7/17/2019 | | 45,000 | | 5,695 | | 50,695 | | 140,819 |
Residences at West Place | | Orlando, FL | | 342 | | 7/17/2019 | | 55,000 | | 4,129 | | 59,129 | | 172,892 |
Avant at Pembroke Pines | | Pembroke Pines, FL | | 1,520 | | 8/30/2019 | | 322,000 | | 32,583 | | 354,583 | | 233,278 |
Arbors of Brentwood | | Nashville, TN | | 346 | | 9/10/2019 | | 62,250 | | 4,248 | | 66,498 | | 192,191 |
Torreyana Apartments | | Las Vegas, NV | | 316 | | 11/22/2019 | | 68,000 | | 2,771 | | 70,771 | | 223,959 |
Bloom | | Las Vegas, NV | | 528 | | 11/22/2019 | | 106,500 | | 4,786 | | 111,286 | | 210,769 |
Bella Solara | | Las Vegas, NV | | 320 | | 11/22/2019 | | 66,500 | | 3,642 | | 70,142 | | 219,194 |
Fairways at San Marcos | | Chandler, AZ | | 352 | | 11/2/2020 | | 84,480 | | 4,482 | | 88,962 | | 252,733 |
The Verandas at Lake Norman | | Cornelius, NC | | 264 | | 6/30/2021 | | 63,500 | | 4,628 | | 68,128 | | 258,061 |
Creekside at Matthews | | Matthews, NC | | 240 | | 6/30/2021 | | 58,000 | | 3,943 | | 61,943 | | 258,096 |
Six Forks Station | | Raleigh, NC | | 323 | | 9/10/2021 | | 74,760 | | 6,431 | | 81,191 | | 251,365 |
High House at Cary | | Cary, NC | | 302 | | 12/7/2021 | | 93,250 | | 1,677 | | 94,927 | | 314,328 |
The Adair | | Sandy Springs, GA | | 232 | | 4/1/2022 | | 65,500 | | 5,390 | | 70,890 | | 305,560 |
Estates on Maryland | | Phoenix, AZ | | 330 | | 4/1/2022 | | 77,900 | | 4,636 | | 82,536 | | 250,109 |
Total/Weighted Average | | | | 15,387 | | | | $2,242,930 | | $174,810 | | $2,417,740 | | $157,129 |
(1) | Only includes properties owned as of September 30, 2022. |
(2) | Includes interior and exterior rehab. |
NEXPOINT RESIDENTIAL TRUST, INC. [NYSE:NXRT]
Historical Disposition Details
(in thousands, except unit and per unit amounts) | | | | | | | | | | | | | | | | | | | |
Property Name | | Location | | Units | | | Purchase Price | | | Sale Price | | | Per Unit | | | Sale Date | | Net Cash Proceeds (1) | | | Gain on Sale | |
Meridian | | Austin, TX | | | 200 | | | $ | 12,300 | | | $ | 17,250 | | | $ | 86,250 | | | 5/10/2016 | | $ | 16,981 | | | $ | 4,786 | |
Park at Regency and Mandarin Reserve | | Jacksonville, FL | | | 679 | | | | 34,500 | | | | 47,000 | | | | 69,219 | | | 6/6/2016 | | | 46,239 | | | | 11,584 | |
Park at Blanding and Colonial Forest | | Jacksonville, FL | | | 291 | | | | 12,000 | | | | 14,500 | | | | 49,828 | | | 8/31/2016 | | | 14,259 | | | | 2,007 | |
Willowdale Crossings | | Frederick, MD | | | 432 | | | | 41,000 | | | | 45,200 | | | | 104,630 | | | 9/15/2016 | | | 44,439 | | | | 5,576 | |
Jade Park | | Dayton Beach, FL | | | 144 | | | | 7,800 | | | | 10,000 | | | | 69,444 | | | 9/30/2016 | | | 9,868 | | | | 1,979 | |
The Miramar Apartments | | Dallas, TX | | | 314 | | | | 8,875 | | | | 16,550 | | | | 52,707 | | | 4/3/2017 | | | 16,326 | | | | 6,368 | |
Toscana | | Dallas, TX | | | 192 | | | | 8,875 | | | | 13,250 | | | | 69,010 | | | 4/3/2017 | | | 13,040 | | | | 4,283 | |
The Grove at Alban | | Frederick, MD | | | 290 | | | | 23,050 | | | | 27,500 | | | | 94,828 | | | 4/3/2017 | | | 27,021 | | | | 4,514 | |
Twelve 6 Ten at the Park | | Dallas, TX | | | 402 | | | | 20,984 | | | | 26,600 | | | | 66,169 | | | 4/27/2017 | | | 26,349 | | | | 4,731 | |
Regatta Bay | | Seabrook, TX | | | 240 | | | | 18,200 | | | | 28,200 | | | | 117,500 | | | 7/14/2017 | | | 27,670 | | | | 10,423 | |
NAVA Portfolio (2) | | Atlanta, GA | | | 1,100 | | | | 66,200 | | | | 116,000 | | | | 105,455 | | | 9/27/2017 | | | 114,010 | | | | 48,046 | |
Timberglen | | Dallas, TX | | | 304 | | | | 16,950 | | | | 30,000 | | | | 98,684 | | | 1/31/2018 | | | 29,553 | | | | 13,742 | |
Edgewater at Sandy Springs | | Atlanta, GA | | | 760 | | | | 58,000 | | | | 101,250 | | | | 133,224 | | | 8/28/2019 | | | 100,219 | | | | 47,329 | |
Belmont at Duck Creek | | Garland, TX | | | 240 | | | | 18,525 | | | | 29,500 | | | | 122,917 | | | 8/28/2019 | | | 29,148 | | | | 11,985 | |
The Ashlar | | Dallas, TX | | | 264 | | | | 16,235 | | | | 29,400 | | | | 111,364 | | | 8/28/2019 | | | 29,050 | | | | 13,205 | |
Heatherstone | | Dallas, TX | | | 152 | | | | 9,450 | | | | 16,275 | | | | 107,072 | | | 8/28/2019 | | | 16,054 | | | | 6,368 | |
The Pointe at the Foothills | | Mesa, AZ | | | 528 | | | | 52,275 | | | | 85,400 | | | | 161,742 | | | 8/28/2019 | | | 84,663 | | | | 37,925 | |
Abbington Heights | | Antioch, TN | | | 274 | | | | 17,900 | | | | 28,050 | | | | 102,372 | | | 8/30/2019 | | | 27,630 | | | | 10,888 | |
Southpoint Reserve at Stoney Creek | | Fredericksburg, VA | | | 156 | | | | 17,000 | | | | 23,500 | | | | 150,641 | | | 3/20/2020 | | | 23,176 | | | | 5,469 | |
Willow Grove | | Nashville, TN | | | 244 | | | | 13,750 | | | | 31,300 | | | | 128,279 | | | 3/26/2020 | | | 31,005 | | | | 17,513 | |
Woodbridge | | Nashville, TN | | | 220 | | | | 16,000 | | | | 31,700 | | | | 144,091 | | | 3/26/2020 | | | 31,237 | | | | 15,990 | |
Eagle Crest | | Irving, TX | | | 447 | | | | 27,325 | | | | 55,500 | | | | 124,161 | | | 9/30/2020 | | | 54,779 | | | | 30,160 | |
Beechwood Terrace | | Antioch, TN | | | 300 | | | | 21,400 | | | | 53,600 | | | | 178,667 | | | 11/1/2021 | | | 53,003 | | | | 33,960 | |
Cedar Pointe | | Antioch, TN | | | 210 | | | | 26,500 | | | | 37,650 | | | | 179,286 | | | 11/1/2021 | | | 37,231 | | | | 12,252 | |
Total/Weighted Average | | | | | 8,383 | | | $ | 565,094 | | | $ | 915,175 | | | $ | 109,170 | | | | | $ | 902,950 | | | $ | 361,083 | |
(1) | Represents sales price, net of closing costs. |
(2) | The NAVA Portfolio consists of The Arbors, The Crossings, The Crossings at Holcomb Bridge and The Knolls. |
NEXPOINT RESIDENTIAL TRUST, INC. [NYSE:NXRT]
Definitions and Reconciliations of Non-GAAP Measures
Definitions
This presentation contains non-GAAP financial measures. A “non-GAAP financial measure” is defined as a numerical measure of a company’s financial performance that excludes or includes amounts so as to be different than the most directly comparable measure calculated and presented in accordance with GAAP in the statements of income, balance sheets or statements of cash flows of the Company. The non-GAAP financial measures used within this presentation are net operating income (“NOI”), funds from operations attributable to common stockholders (“FFO”), FFO per diluted share, Core FFO, Core FFO per diluted share, adjusted FFO (“AFFO”), AFFO per diluted share and net debt.
NOI is used by investors and our management to evaluate and compare the performance of our properties to other comparable properties, to determine trends in earnings and to compute the fair value of our properties. NOI is calculated by adjusting net income (loss) to add back (1) interest expense (2) advisory and administrative fees, (3) the impact of depreciation and amortization expenses as well as gains or losses from the sale of operating real estate assets that are included in net income computed in accordance with GAAP, if applicable, (4) corporate general and administrative expenses, (5) other gains and losses that are specific to us including loss on extinguishment of debt and modification costs, if applicable, (6) casualty-related expenses/(recoveries) and casualty gains (losses), (7) pandemic expenses that are not reflective of continuing operations of the properties and (8) property general and administrative expenses that are not reflective of the continuing operations of the properties or are incurred on behalf of the Company at the property for expenses such as legal, professional, centralized leasing service and franchise tax fees. We define “Same Store NOI” as NOI for our properties that are comparable between periods. We view Same Store NOI as an important measure of the operating performance of our properties because it allows us to compare operating results of properties owned for the entirety of the current and comparable periods and therefore eliminates variations caused by acquisitions or dispositions during the periods.
FFO is defined by the National Association of Real Estate Investment Trusts (“NAREIT”), as net income (loss) computed in accordance with GAAP, excluding gains or losses from real estate dispositions, if applicable, plus real estate depreciation and amortization. We compute FFO in accordance with NAREIT’s definition. Our presentation differs slightly in that we begin with net income (loss) before adjusting for amounts attributable to redeemable noncontrolling interests in the OP and we show the amount attributable to such noncontrolling interests as an adjustment to arrive at FFO attributable to common stockholders.
Core FFO makes certain adjustments to FFO, which are either not likely to occur on a regular basis or are otherwise not representative of the ongoing operating performance of our Portfolio. Core FFO adjusts FFO to remove items such as losses on extinguishment of debt and modification costs (includes prepayment penalties and defeasance costs incurred on the early payment of debt, the write-off of unamortized deferred financing costs and fair market value adjustments of assumed debt related to the retirement of debt, costs incurred in connection with a debt modification that are not capitalized as deferred financing costs and other costs incurred in a debt extinguishment that are expensed), if applicable, casualty-related expenses/and recoveries and gains (losses), pandemic expenses, the amortization of deferred financing costs incurred in connection with obtaining short-term debt financing, and the noncontrolling interests (as described above) related to these items.
AFFO makes certain adjustments to Core FFO. There is no industry standard definition of AFFO and practice is divergent across the industry. AFFO adjusts Core FFO to remove items such as equity-based compensation expense and the amortization of deferred financing costs incurred in connection with obtaining long-term debt financing, and the noncontrolling interests related to these items.
Net debt is calculated by subtracting cash and cash equivalents and restricted cash held for value-add upgrades and green improvements from total debt outstanding.
We believe that the use of NOI, FFO, Core FFO, AFFO and net debt, combined with the required GAAP presentations, improves the understanding of operating results and debt levels of real estate investment trusts (“REITs”) among investors and makes comparisons of operating results and debt levels among such companies more meaningful. While NOI, FFO, Core FFO, AFFO and net debt are relevant and widely used measures of operating performance and debt levels of REITs, they do not represent cash flows from operations, net income (loss) or total debt as defined by GAAP and should not be considered an alternative to those measures in evaluating our liquidity, operating performance and debt levels. NOI, FFO, Core FFO and AFFO do not purport to be indicative of cash available to fund our future cash requirements. We present net debt because we believe it provides our investors a better understanding of our leverage ratio. Net debt should not be considered an alternative to total debt, as we may not always be able to use our available cash to repay debt. Our computation of NOI, FFO, Core FFO, AFFO and net debt may not be comparable to NOI, FFO, Core FFO, AFFO and net debt reported by other REITs. For a more complete discussion of NOI, FFO, Core FFO and AFFO, see our most recent Annual Report on Form 10-K and our other filings with the SEC.
NEXPOINT RESIDENTIAL TRUST, INC. [NYSE:NXRT]
Reconciliations
Reconciliation of Debt to Net Debt
(dollar amounts in thousands) | | Q3 2022 | | | Q3 2021 | |
Total mortgage debt | | $ | 1,358,343 | | | $ | 1,275,501 | |
Credit facilities | | | 335,000 | | | | 275,000 | |
Total debt outstanding | | | 1,693,343 | | | | 1,550,501 | |
| | | | | | | | |
Adjustments to arrive at net debt: | | | | | | | | |
Cash and cash equivalents | | | (15,771 | ) | | | (18,413 | ) |
Restricted cash held for value-add upgrades and green improvements | | | (15,347 | ) | | | (14,506 | ) |
Net Debt | | $ | 1,662,225 | | | $ | 1,517,582 | |
Enterprise Value (1) | | $ | 2,843,225 | | | $ | 3,080,582 | |
Leverage Ratio | | | 58 | % | | | 49 | % |
(1) | Enterprise Value is calculated as Market Capitalization plus Net Debt. |
Guidance Reconciliations of NOI, Same Store NOI, FFO, Core FFO and AFFO
The following table, which has not been adjusted for the effects of noncontrolling interests, reconciles NOI to net income (the most directly comparable GAAP financial measure) for the periods presented below (in thousands):
| | For the Year Ended December 31, 2022 | | | For the Three Months Ended December 31, 2022 | |
| | Mid-Point (1) | | | Mid-Point (1) | |
Net income (loss) | | $ | 34,879 | | | $ | 47,974 | |
Adjustments to reconcile net income (loss) to NOI: | | | | | | | | |
Advisory and administrative fees | | | 7,577 | | | | 1,961 | |
Corporate general and administrative expenses | | | 14,587 | | | | 3,471 | |
Property general and administrative expenses | (2) | | 3,351 | | | | 650 | |
Depreciation and amortization | | | 98,651 | | | | 24,161 | |
Interest expense | | | 52,766 | | | | 17,962 | |
Casualty-related recoveries | | | (357 | ) | | | — | |
Loss on extinguishment of debt and modification costs | | | 12,669 | | | | 12,669 | |
Gain on sales of real estate | | | (66,716 | ) | | | (66,716 | ) |
NOI | (3) | $ | 157,407 | | | $ | 42,132 | |
Less Non-Same Store | | | | | | | | |
Revenues | (4) | | (30,228 | ) | | | | |
Operating expenses | (4) | | 10,869 | | | | | |
Same Store NOI | (4) | $ | 138,048 | | | | | |
(1) | Mid-Point estimates shown for full year and fourth quarter 2022 guidance. Assumptions made for full year and fourth quarter 2022 NOI guidance include the Same Store operating growth projections included in the “2022 Full Year Guidance Summary” section of this release and the effect of the acquisition and dispositions throughout the fiscal year. |
(2) | Adjustment to net income (loss) to exclude certain property general and administrative expenses that are not reflective of the continuing operations of the properties or are incurred on our behalf at the property for expenses such as legal, professional, centralized leasing service and franchise tax fees. |
(3) | 2022 Pro Forma NOI assumes The Adair and Estates on Maryland were owned for the full year 2022, which we estimate would have contributed approximately an additional $800 and $1,000, respectively, to NOI. |
(4) | Amounts are derived from the results of operations of our pro forma Full Year 2022 Same Store properties and Non-Same Store properties. There are 31 properties in our pro forma Full Year 2022 Same Store pool. |
NEXPOINT RESIDENTIAL TRUST, INC. [NYSE:NXRT]
The following table reconciles our FFO, Core FFO and AFFO guidance to our net income (the most directly comparable GAAP financial measure) guidance for the year ended December 31, 2022 (in thousands, except per share data):
| | For the Year Ended December 31, 2022 | |
| | Mid-Point | |
Net income | | $ | 34,879 | |
Depreciation and amortization | | | 98,651 | |
Gain on sales of real estate | | | (66,716 | ) |
Adjustment for noncontrolling interests | | | (248 | ) |
FFO attributable to common stockholders | | | 66,566 | |
FFO per share - diluted (1) | | $ | 2.55 | |
| | | | |
Loss on extinguishment of debt and modification costs | | | 12,669 | |
Casualty-related recoveries | | | 305 | |
Amortization of deferred financing costs - acquisition term notes | | | 1,010 | |
Pandemic expense | | | 3 | |
Adjustment for noncontrolling interests | | | (41 | ) |
Core FFO attributable to common stockholders | | | 80,512 | |
Core FFO per share - diluted (1) | | $ | 3.08 | |
| | | | |
Amortization of deferred financing costs - long term debt | | | 1,699 | |
Equity-based compensation expense | | | 7,903 | |
Adjustment for noncontrolling interests | | | (36 | ) |
AFFO attributable to common stockholders | | | 90,078 | |
AFFO per share - diluted (1) | | $ | 3.44 | |
| | | | |
Weighted average common shares outstanding - diluted | | | 26,152 | |
(1) | For purposes of calculating per share data, we assume a weighted average diluted share count of approximately 26.2 million for the full year 2022.
|
NEXPOINT RESIDENTIAL TRUST, INC. [NYSE:NXRT]
NOI and Same Store NOI
The following table, which has not been adjusted for the effects of noncontrolling interests, reconciles NOI and our Same Store NOI for the three months ended June 30, 2022 and the year ended December 31, 2021 to net income (loss), the most directly comparable GAAP financial measure (in thousands):
| | For the Three Months Ended June 30, 2022 | | | For the Year Ended December 31, 2021 | |
Net income (loss) | | $ | (7,827 | ) | | $ | 23,106 | |
Adjustments to reconcile net income (loss) to NOI: | | | | | | | | |
Advisory and administrative fees | | | 1,868 | | | | 7,631 | |
Corporate general and administrative expenses | | | 3,812 | | | | 11,966 | |
Casualty-related expenses/(recoveries) | (1) | | 2,592 | | | | (200 | ) |
Casualty gains | | | (229 | ) | | | (2,595 | ) |
Pandemic expense | | | — | | | | 50 | |
Property general and administrative expenses | (2) | | 680 | | | | 2,232 | |
Depreciation and amortization | | | 25,548 | | | | 86,878 | |
Interest expense | | | 12,402 | | | | 44,623 | |
Loss on extinguishment of debt and modification costs | | | — | | | | 912 | |
Gain on sales of real estate | | | — | | | | (46,214 | ) |
NOI | | $ | 38,846 | | | $ | 128,389 | |
Less Non-Same Store | | | | | | | | |
Revenues | | | (8,053 | ) | | | (19,157 | ) |
Operating expenses | | | 2,920 | | | | 6,971 | |
Operating income | | | (11 | ) | | | (871 | ) |
Same Store NOI | | $ | 33,702 | | | $ | 115,332 | |
(1) | Adjustment to net income (loss) to exclude certain property operating expenses that are casualty-related expenses/(recoveries). |
(2) | Adjustment to net income (loss) to exclude certain property general and administrative expenses that are not reflective of the continuing operations of the properties or are incurred on our behalf at the property for expenses such as legal, professional, centralized leasing service and franchise tax fees. |