Investor Update November 29, 2016 Exhibit 99.2
2 Forward-Looking Statements This communication and our filings with the Securities and Exchange Commission, including without limitation the Form 8-K filed on July 20, 2016, contain forward-looking statements within the meaning of Section 27A of the Securities Act of 1933 and Section 21E of the Securities Exchange Act of 1934. Forward-looking statements can be identified by the fact that they do not relate strictly to historical or current facts. These statements involve estimates, expectations, projections, goals, assumptions, known and unknown risks, and uncertainties and typically include words or variations of words such as “expect,” “anticipate,” “believe,” “intend,” “plan,” “seek,” “estimate,” “predict,” “project,” “goal,” “guidance,” “outlook,” “objective,” “forecast,” “target,” “potential,” “continue,” “would,” “will,” “should,” “could,” or “may” or other comparable terms and phrases. All statements that address operating performance, events, or developments that TerraForm Global expects or anticipates will occur in the future are forward-looking statements. They may include financial metrics such as estimates of expected adjusted EBITDA, cash available for distribution (CAFD), earnings, revenues, capital expenditures, liquidity, capital structure, future growth, financing arrangement and other financial performance items (including future dividends per share), descriptions of management’s plans or objectives for future operations, products, or services, or descriptions of assumptions underlying any of the above. Forward-looking statements are based on TerraForm Global’s current expectations or predictions of future conditions, events, or results and speak only as of the date they are made. Although TerraForm Global, believes its respective expectations and assumptions are reasonable, it can give no assurance that these expectations and assumptions will prove to have been correct and actual results may vary materially. By their nature, forward-looking statements are subject to risks and uncertainties that could cause actual results to differ materially from those suggested by the forward-looking statements. Factors that might cause such differences include, but are not limited to, our relationship with SunEdison, including SunEdison’s bankruptcy filings and our reliance on SunEdison for management, corporate and accounting services, project level operation and maintenance and asset management services, to maintain critical information technology and accounting systems and to provide our employees; risks related to events of default and potential events of default arising under project-level financings and other agreements due to various factors; risks related to our failure to satisfy the requirements of Nasdaq; our ability to sell projects at attractive prices as well as to integrate the projects we acquire from third parties or otherwise realize the anticipated benefits from such acquisitions, including through refinancing or future sales; actions of third parties, including but not limited to the failure of SunEdison to fulfill its obligations and the actions of our bondholders and other creditors; price fluctuations, termination provisions and buyout provisions in offtake agreements; delays or unexpected costs during the completion of projects we intend to acquire; our ability to complete our pending acquisition; regulatory requirements and incentives for production of renewable power; operating and financial restrictions under agreements governing indebtedness; the condition of the debt and equity capital markets and our ability to borrow additional funds and access capital markets; the impact of foreign exchange rate fluctuations; our ability to compete against traditional and renewable energy companies; hazards customary to the power production industry and power generation operations, such as unusual weather conditions and outages or other curtailment of our power plants; departure of some or all of SunEdison’s employees, particularly key employees and operations and maintenance or asset management personnel that we significantly rely upon; pending and future litigation; and our ability to operate our business efficiently, including to manage the transition from SunEdison information technology, technical, accounting and generation monitoring systems, to manage and complete governmental filings on a timely basis, and to manage our capital expenditures, economic, social and political risks and uncertainties inherent in international operations, including operations in emerging markets and the impact of foreign exchange rate fluctuations, the imposition of currency controls and restrictions on repatriation of earnings and cash, protectionist and other adverse public policies, including local content requirements, import/export tariffs, increased regulations or capital investment requirements, conflicting international business practices that may conflict with other customs or legal requirements to which we are subject, inability to obtain, maintain or enforce intellectual property rights, and being subject to the jurisdiction of courts other than those of the United States, including uncertainty of judicial processes and difficulty enforcing contractual agreements or judgments in foreign legal systems or incurring additional costs to do so. Many of these factors are beyond TerraForm Global’s control. TerraForm Global disclaims any obligation to publicly update or revise any forward-looking statement to reflect changes in underlying assumptions, factors, or expectations, new information, data, or methods, future events, or other changes, except as required by law. The foregoing list of factors that might cause results to differ materially from those contemplated in the forward-looking statements should be considered in connection with information regarding risks and uncertainties which are described in TerraForm Global’s Prospectus, dated July 31, 2015, and Forms 10-Q with respect to the second and third quarters of 2015, the risk factors furnished to the Securities and Exchange Commission as part of the Current Report on Form 8-K on July 20, 2016, as well as additional factors it may describe from time to time in other filings with the Securities and Exchange Commission or incorporated herein. You should understand that it is not possible to predict or identify all such factors and, consequently, you should not consider any such list to be a complete set of all potential risks or uncertainties. Exhibit 99.2
3 This presentation provides limited preliminary unaudited cash balances for 3Q 2016 and estimates for financial metrics for 2016. Please review these results together with the risk factors detailed in our 8-K filed on July 20, 2016 and with our subsequent 8-K filings The financial information presented on the following slides is preliminary and unaudited and includes statements which are inherently uncertain. Financial information may change materially as a result of the completion of the audit for fiscal year 2015 and review procedures for 1Q 2016, 2Q 2016 and 3Q 2016. Our estimates are based on various assumptions and are subject to various risks which could cause actual results to differ materially. Further, our preliminary results and estimates should not be viewed as indicative of future results which may differ materially. The information does not represent a complete picture of the financial position, results of operation or cash flows of TerraForm Global (“TerraForm Global” or the “Company”), and is not a replacement for full financial statements prepared in accordance with U.S. GAAP. The Company’s last annual or quarterly report was its Form 10-Q for the period ended September 30, 2015. The Company has not filed its Form 10-K for 2015 or its Form 10-Qs for the periods ending March 31, 2016, June 30, 2016, or September 30, 2016. The circumstances of the Company and the risks it faces have changed substantially since the date of its last filing on Form 10-Q in November 2015. You should review the updated Risk Factors relating to the Company furnished to the SEC as part of our current report on Form 8-K on July 20, 2016, which include a description of important new risks relating to the chapter 11 proceedings of SunEdison, the consequences of the absence of audited financial information, pending litigation and other matters, and the subsequent Form 8-K filings since July 20, 2016. You should refer also to the unaudited financial information for 2H 2015 and for the fiscal quarters 1Q 2016 and 2Q 2016 and the other periodic filings we have made with the SEC. Importance of our Risk Factors Exhibit 99.2
TerraForm Global Remains Focused on Key Areas of Execution 2016 was a year of transition and immense change GLBL team is successfully navigating challenges and is preparing for 2017 as a well-functioning independent company Continuity of operations: GLBL fleet continues to perform well Independence: Solid progress on moving GLBL to a stand-alone entity, expansion of board to 9 members Collaborative sales process with aim of maximizing value for all stockholders Strengthen balance sheet: Repaid revolver Audit progressing; working towards full compliance with all periodic reporting requirements by extended Nasdaq deadline of March 2017 Negotiating consents with bondholders, including with respect to delayed filings of annual and quarterly reports. This process is ongoing and current consent solicitation expires on December 2, 2016. 4 Exhibit 99.2
5 Clear Path Forward as Operationally Independent Company Agenda 2 1 3 Estimates for 2016 Key Financial Metrics High-Quality, Diversified Renewable Power Fleet Exhibit 99.2
High-Quality, Diversified Renewable Power Fleet Exhibit 99.2
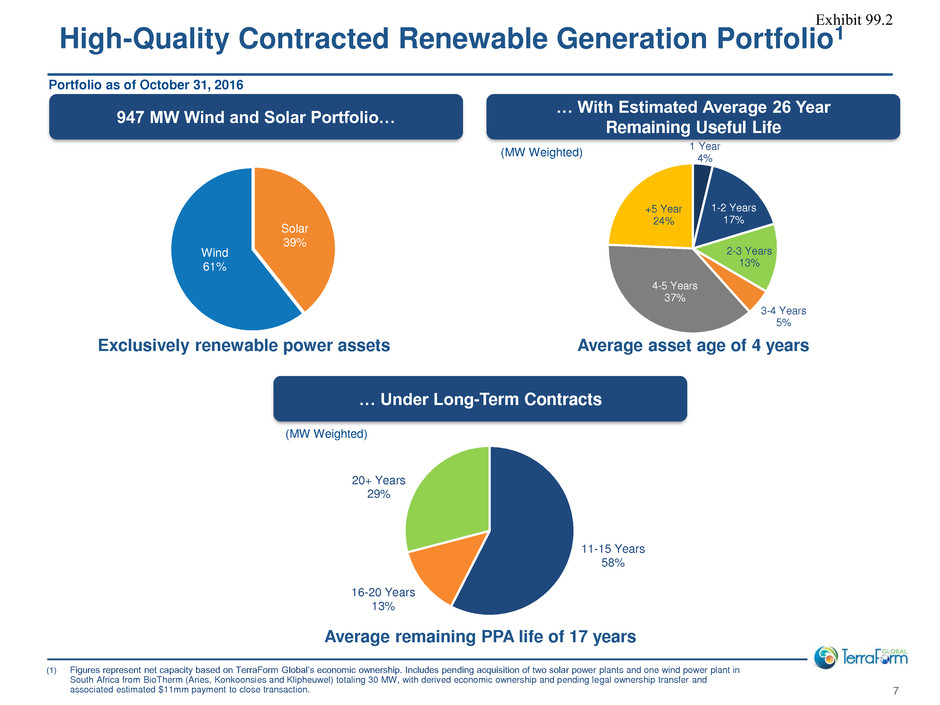
7 947 MW Wind and Solar Portfolio… Exclusively renewable power assets Portfolio as of October 31, 2016 … With Estimated Average 26 Year Remaining Useful Life Average asset age of 4 years … Under Long-Term Contracts Average remaining PPA life of 17 years (MW Weighted) (MW Weighted) High-Quality Contracted Renewable Generation Portfolio1 1 Year 4% 1-2 Years 17% 2-3 Years 13% 3-4 Years 5% 4-5 Years 37% +5 Year 24% 11-15 Years 58% 16-20 Years 13% 20+ Years 29% (1) Figures represent net capacity based on TerraForm Global’s economic ownership. Includes pending acquisition of two solar power plants and one wind power plant in South Africa from BioTherm (Aries, Konkoonsies and Klipheuwel) totaling 30 MW, with derived economic ownership and pending legal ownership transfer and associated estimated $11mm payment to close transaction. Solar 39% Wind 61% Exhibit 99.2

8 Uruguay 26 MW 26 MW Brazil 307 MW 307 MW India 299 MW 101 MW 198 MW China 167 MW 149 MW 18 MW Thailand 39 MW 39 MW Malaysia 12 MW 12 MW South Africa(1) 97 MW 18 MW 79 MW (1) Portfolio as of October 31, 2016. Figures represent net capacity based on TerraForm Global’s economic ownership. Includes pending acquisition of two solar power plants and one wind power plant in South Africa from BioTherm (Aries, Konkoonsies and Klipheuwel) totaling 30 MW, with derived economic ownership and pending legal ownership transfer and associated estimated $11mm payment to close transaction. Total: 947 MW Wind: 575 MW Solar: 372 MW Brazil 32% India 32% China 18% South Africa 10% Thailand 4% Uruguay 3% Malaysia 1% Geographic Mix World’s largest yieldco focused on renewable energy in emerging markets Diverse Contracted Fleet of 947 MW Across Seven Countries Large, Diversified Portfolio1 Exhibit 99.2
Estimates for 2016 Key Financial Metrics 9 Exhibit 99.2
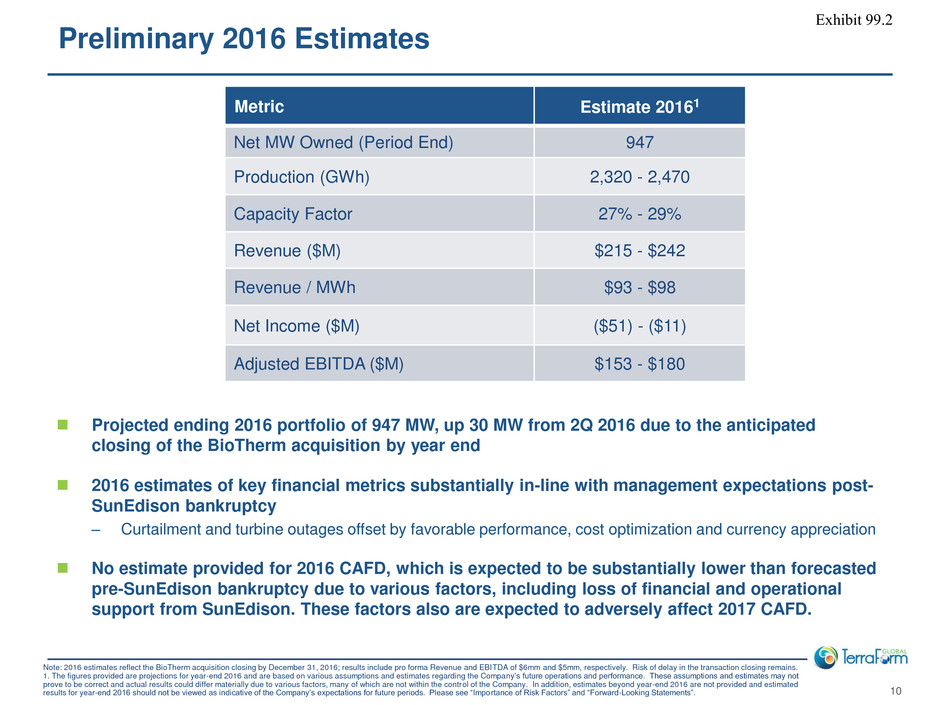
10 Metric Estimate 20161 Net MW Owned (Period End) 947 Production (GWh) 2,320 - 2,470 Capacity Factor 27% - 29% Revenue ($M) $215 - $242 Revenue / MWh $93 - $98 Net Income ($M) ($51) - ($11) Adjusted EBITDA ($M) $153 - $180 Projected ending 2016 portfolio of 947 MW, up 30 MW from 2Q 2016 due to the anticipated closing of the BioTherm acquisition by year end 2016 estimates of key financial metrics substantially in-line with management expectations post- SunEdison bankruptcy – Curtailment and turbine outages offset by favorable performance, cost optimization and currency appreciation No estimate provided for 2016 CAFD, which is expected to be substantially lower than forecasted pre-SunEdison bankruptcy due to various factors, including loss of financial and operational support from SunEdison. These factors also are expected to adversely affect 2017 CAFD. Preliminary 2016 Estimates Note: 2016 estimates reflect the BioTherm acquisition closing by December 31, 2016; results include pro forma Revenue and EBITDA of $6mm and $5mm, respectively. Risk of delay in the transaction closing remains. 1. The figures provided are projections for year-end 2016 and are based on various assumptions and estimates regarding the Company’s future operations and performance. These assumptions and estimates may not prove to be correct and actual results could differ materially due to various factors, many of which are not within the control of the Company. In addition, estimates beyond year-end 2016 are not provided and estimated results for year-end 2016 should not be viewed as indicative of the Company’s expectations for future periods. Please see “Importance of Risk Factors” and “Forward-Looking Statements”. Exhibit 99.2
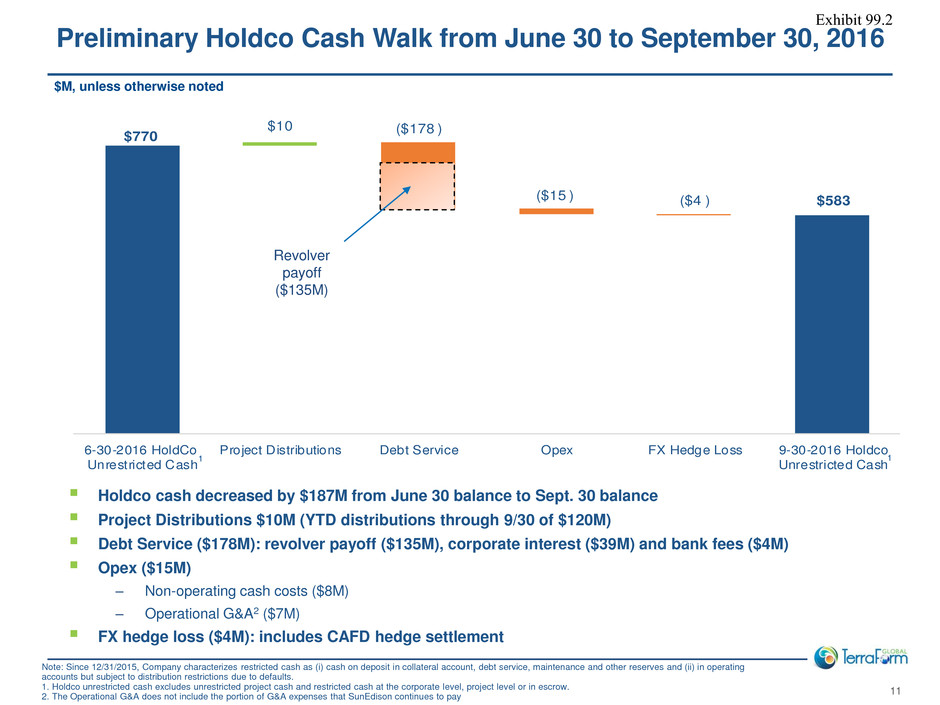
$583 ($178 ) ($15 ) ($4 ) $10 $770 6-30-2016 HoldCo Unrestricted Cash Project Distributions Debt Service Opex FX Hedge Loss 9-30-2016 Holdco Unrestricted Cash Preliminary Holdco Cash Walk from June 30 to September 30, 2016 Holdco cash decreased by $187M from June 30 balance to Sept. 30 balance Project Distributions $10M (YTD distributions through 9/30 of $120M) Debt Service ($178M): revolver payoff ($135M), corporate interest ($39M) and bank fees ($4M) Opex ($15M) ‒ Non-operating cash costs ($8M) ‒ Operational G&A2 ($7M) FX hedge loss ($4M): includes CAFD hedge settlement Note: Since 12/31/2015, Company characterizes restricted cash as (i) cash on deposit in collateral account, debt service, maintenance and other reserves and (ii) in operating accounts but subject to distribution restrictions due to defaults. 1. Holdco unrestricted cash excludes unrestricted project cash and restricted cash at the corporate level, project level or in escrow. 2. The Operational G&A does not include the portion of G&A expenses that SunEdison continues to pay 1 1 Revolver payoff ($135M) $M, unless otherwise noted 11 Exhibit 99.2
Clear Path Forward as Operationally Independent Company Exhibit 99.2

13 Stand-alone Organizational Structure Separation of IT Infrastructure Independent Asset Management and O&M Capabilities Operationally Independent by January 2017 TargetActions In Process TerraForm Global has taken significant actions to ensure business continuity and separation from SunEdison Focused on implementing a stand-alone structure that will allow the company to operate as a fully independent entity Increased authority of the Corporate Governance and Conflicts Committee Added 2 new independent board members in October; 5 / 9 directors now independent1 The organization should be operationally independent by January 2017, with limited tail activities stretching into early 2017 Driving to Operational Independence 1. List of Board Members detailed in Appendix Exhibit 99.2
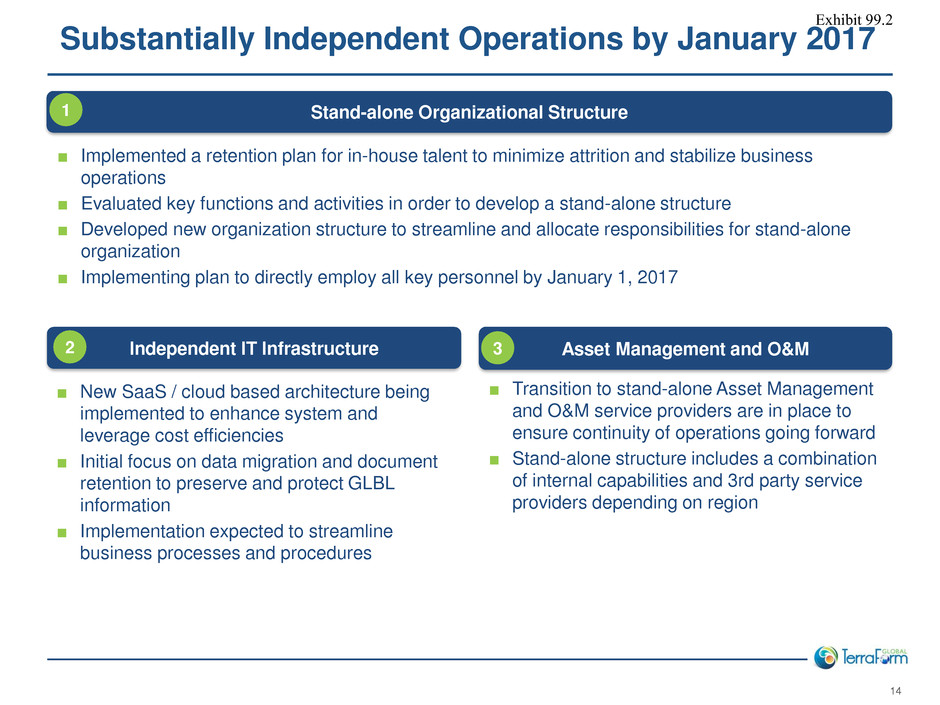
14 Stand-alone Organizational Structure ■ New SaaS / cloud based architecture being implemented to enhance system and leverage cost efficiencies ■ Initial focus on data migration and document retention to preserve and protect GLBL information ■ Implementation expected to streamline business processes and procedures Independent IT Infrastructure Asset Management and O&M ■ Implemented a retention plan for in-house talent to minimize attrition and stabilize business operations ■ Evaluated key functions and activities in order to develop a stand-alone structure ■ Developed new organization structure to streamline and allocate responsibilities for stand-alone organization ■ Implementing plan to directly employ all key personnel by January 1, 2017 ■ Transition to stand-alone Asset Management and O&M service providers are in place to ensure continuity of operations going forward ■ Stand-alone structure includes a combination of internal capabilities and 3rd party service providers depending on region 1 2 3 Substantially Independent Operations by January 2017 Exhibit 99.2
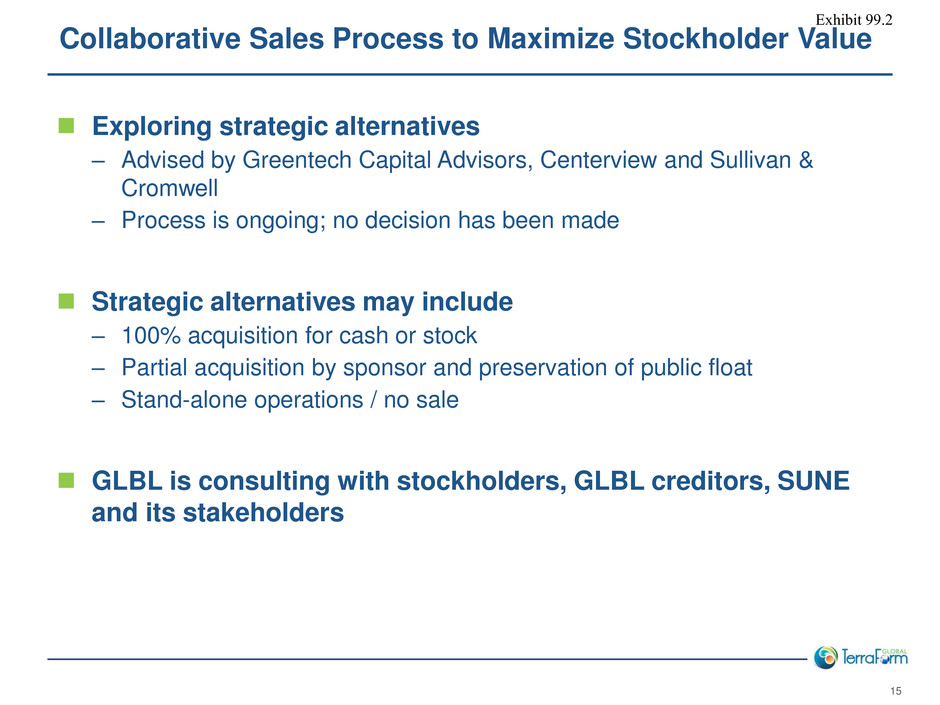
15 Exploring strategic alternatives – Advised by Greentech Capital Advisors, Centerview and Sullivan & Cromwell – Process is ongoing; no decision has been made Strategic alternatives may include – 100% acquisition for cash or stock – Partial acquisition by sponsor and preservation of public float – Stand-alone operations / no sale GLBL is consulting with stockholders, GLBL creditors, SUNE and its stakeholders Collaborative Sales Process to Maximize Stockholder Value Exhibit 99.2
Appendix Exhibit 99.2
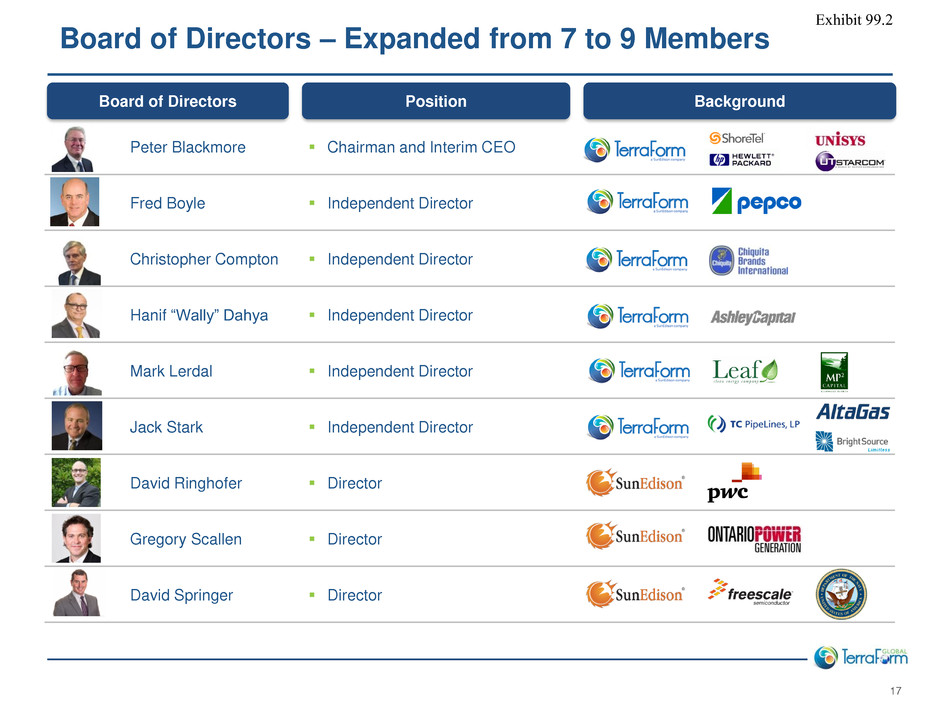
17 Peter Blackmore Chairman and Interim CEO Fred Boyle Independent Director Christopher Compton Independent Director Hanif “Wally” Dahya Independent Director Mark Lerdal Independent Director Jack Stark Independent Director David Ringhofer Director Gregory Scallen Director David Springer Director Board of Directors Position Background Board of Directors – Expanded from 7 to 9 Members Exhibit 99.2
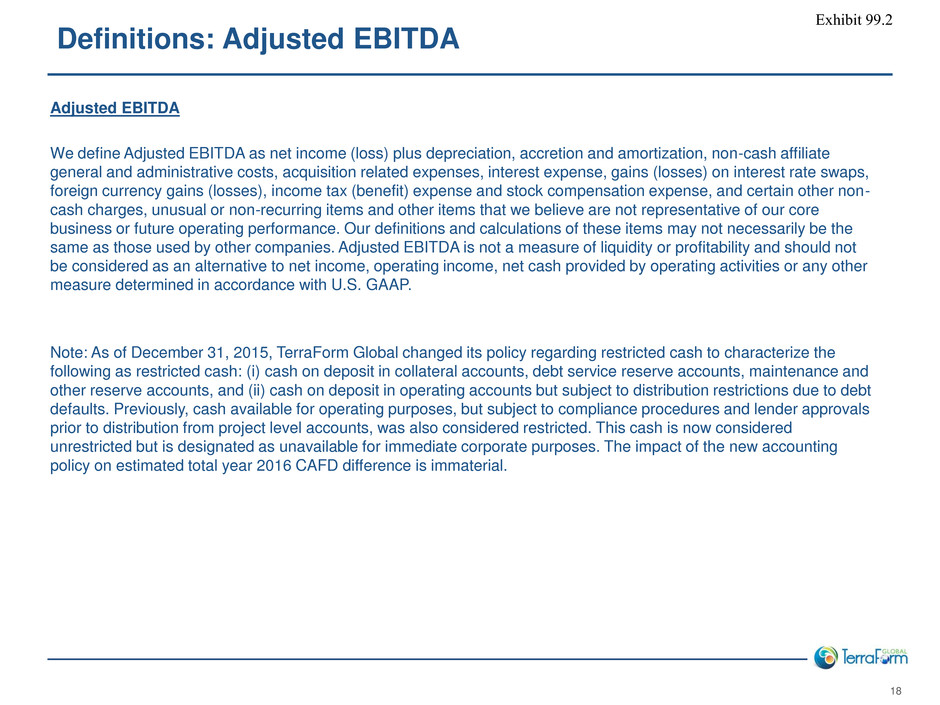
18 Adjusted EBITDA We define Adjusted EBITDA as net income (loss) plus depreciation, accretion and amortization, non-cash affiliate general and administrative costs, acquisition related expenses, interest expense, gains (losses) on interest rate swaps, foreign currency gains (losses), income tax (benefit) expense and stock compensation expense, and certain other non- cash charges, unusual or non-recurring items and other items that we believe are not representative of our core business or future operating performance. Our definitions and calculations of these items may not necessarily be the same as those used by other companies. Adjusted EBITDA is not a measure of liquidity or profitability and should not be considered as an alternative to net income, operating income, net cash provided by operating activities or any other measure determined in accordance with U.S. GAAP. Note: As of December 31, 2015, TerraForm Global changed its policy regarding restricted cash to characterize the following as restricted cash: (i) cash on deposit in collateral accounts, debt service reserve accounts, maintenance and other reserve accounts, and (ii) cash on deposit in operating accounts but subject to distribution restrictions due to debt defaults. Previously, cash available for operating purposes, but subject to compliance procedures and lender approvals prior to distribution from project level accounts, was also considered restricted. This cash is now considered unrestricted but is designated as unavailable for immediate corporate purposes. The impact of the new accounting policy on estimated total year 2016 CAFD difference is immaterial. Definitions: Adjusted EBITDA Exhibit 99.2
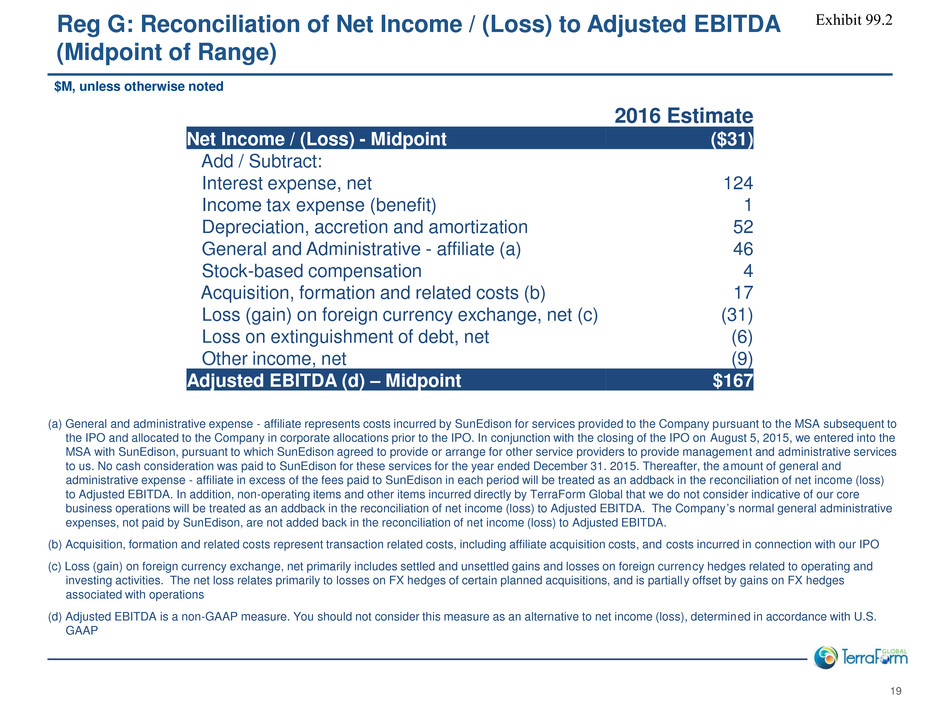
19 2016 Estimate Net Income / (Loss) - Midpoint ($31) Add / Subtract: Interest expense, net 124 Income tax expense (benefit) 1 Depreciation, accretion and amortization 52 General and Administrative - affiliate (a) 46 Stock-based compensation 4 Acquisition, formation and related costs (b) 17 Loss (gain) on foreign currency exchange, net (c) (31) Loss on extinguishment of debt, net (6) Other income, net (9) Adjusted EBITDA (d) – Midpoint $167 Reg G: Reconciliation of Net Income / (Loss) to Adjusted EBITDA (Midpoint of Range) $M, unless otherwise noted (a) General and administrative expense - affiliate represents costs incurred by SunEdison for services provided to the Company pursuant to the MSA subsequent to the IPO and allocated to the Company in corporate allocations prior to the IPO. In conjunction with the closing of the IPO on August 5, 2015, we entered into the MSA with SunEdison, pursuant to which SunEdison agreed to provide or arrange for other service providers to provide management and administrative services to us. No cash consideration was paid to SunEdison for these services for the year ended December 31. 2015. Thereafter, the amount of general and administrative expense - affiliate in excess of the fees paid to SunEdison in each period will be treated as an addback in the reconciliation of net income (loss) to Adjusted EBITDA. In addition, non-operating items and other items incurred directly by TerraForm Global that we do not consider indicative of our core business operations will be treated as an addback in the reconciliation of net income (loss) to Adjusted EBITDA. The Company ’s normal general administrative expenses, not paid by SunEdison, are not added back in the reconciliation of net income (loss) to Adjusted EBITDA. (b) Acquisition, formation and related costs represent transaction related costs, including affiliate acquisition costs, and costs incurred in connection with our IPO (c) Loss (gain) on foreign currency exchange, net primarily includes settled and unsettled gains and losses on foreign currency hedges related to operating and investing activities. The net loss relates primarily to losses on FX hedges of certain planned acquisitions, and is partially offset by gains on FX hedges associated with operations (d) Adjusted EBITDA is a non-GAAP measure. You should not consider this measure as an alternative to net income (loss), determined in accordance with U.S. GAAP Exhibit 99.2
20 Exhibit 99.2


