INTRODUCTION
This Management's Discussion and Analysis dated April 11, 2021 (this "MD&A"), should be read in conjunction with the condensed consolidated interim financial statements (the "Interim Financial Statements") of Organigram Holdings Inc. (the "Company" or "Organigram") for the three and six months ended February 28, 2021 ("Q2 Fiscal 2021") and the audited consolidated financial statements for the year ended August 31, 2020 (the "Annual Financial Statements"), including the accompanying notes thereto.
Financial data in this MD&A is based on the Interim Financial Statements of the Company for the three and six months ended February 28, 2021 and has been prepared in accordance with International Accounting Standard 34 Interim Financial Reporting as issued by the International Accounting Standards Board ("IASB"), unless otherwise stated. All financial information in this MD&A is expressed in thousands of Canadian dollars ("$"), except for share and per share calculations, references to $ millions, per gram ("g") or kilogram ("kg") of dried flower and per milliliter ("mL") or liter ("L") of cannabis oil calculations.
The financial data in this MD&A contains certain financial and operational performance measures that are not defined by and do not have any standardized meaning under International Financial Reporting Standards ("IFRS") but are used by management to assess the financial and operational performance of the Company. These include, but are not limited to, the following:
• Yield per plant (in grams);
• Plants per room;
• Target production capacity;
• Adjusted Gross Margin; and
• Adjusted EBITDA.
The Company believes that these non-IFRS financial measures and operational performance measures, in addition to conventional measures prepared in accordance with IFRS, enable investors to evaluate the Company's operating results, underlying performance and prospects in a similar manner to the Company's management. The non-IFRS financial performance measures are defined in the sections in which they appear. Adjusted Gross Margin and Adjusted EBITDA are reconciled to IFRS in the "Financial Review and Discussion of Operations" section of this MD&A.
As there are no standardized methods of calculating these non-IFRS measures, the Company's approaches may differ from those used by others, and the use of these measures may not be directly comparable. Accordingly, these non-IFRS measures are intended to provide additional information and should not be considered in isolation or as a substitute for measures of performance prepared in accordance with IFRS.
The Company has decided to discontinue reporting cost-of-cultivation as a non-IFRS financial measure, on the basis that due to the absence of standardized methods for calculating non-IFRS financial measures, and widely varying inputs and methodologies used in the industry for metrics of this nature, the information is difficult to compare and potentially confusing.
The Company's wholly-owned subsidiary, Organigram Inc., is a licensed producer of cannabis and cannabis derived products (a "Licensed Producer" or "LP") under the Cannabis Act (Canada) and the Cannabis Regulations (Canada) (together, the "Cannabis Act") and regulated by Health Canada.
The Company's head and registered office is located at 35 English Drive, Moncton, New Brunswick, E1E 3X3. The Company's common shares ("Common Shares") are listed under the ticker symbol "OGI" on both the Nasdaq Global Select Market ("NASDAQ") and on the Toronto Stock Exchange ("TSX"). Any inquiries regarding the Company may be directed to its Vice President, Investor Relations, Amy Schwalm, at (416) 704-9057 or by email to investorrelations@organigram.ca.
Additional information relating to the Company, including the Company's most recent annual information form (the "AIF") is available under the Company's issuer profile on the Canadian Securities Administrators' System for Electronic Document Analysis and Retrieval ("SEDAR") at www.sedar.com. The Company's reports and other information filed with or furnished to the United States Securities and Exchange Commission ("SEC") are available on the SEC's Electronic Document Gathering and Retrieval System ("EDGAR") at www.sec.gov.
CAUTIONARY STATEMENT REGARDING FORWARD-LOOKING INFORMATION
Certain information herein contains or incorporates comments that constitute forward-looking information within the meaning of applicable securities legislation ("forward-looking information"). Forward-looking information, in general, can be identified by the use of forward-looking terminology such as "outlook", "objective", "may", "will", "could", "would", "might", "expect", "intend", "estimate", "anticipate", "believe", "plan", "continue", "budget", "schedule" or "forecast" or similar expressions suggesting future outcomes or events. They include, but are not limited to, statements with respect to expectations, forecasts or other characterizations of future events or circumstances, and the Company's objectives, goals, strategies, beliefs, intentions, plans, estimates, projections and outlook, including statements relating to the Company's plans and objectives, or estimates or predictions of actions of customers, suppliers, partners, distributors, competitors or regulatory authorities; and, statements regarding the Company's future economic performance. These statements are not historical facts but instead represent management beliefs regarding future events, many of which, by their nature are inherently uncertain and beyond management control. Forward-looking information has been based on the Company's current expectations about future events.
Certain forward-looking information in this MD&A includes, but is not limited to the following:
• Moncton Campus (as defined herein) licensing and target production capacity and timing thereof;
• Expectations regarding production capacity, facility size, THC (as defined herein) content, costs and yields;
• Expectations regarding the prospects of the Company's collaboration with BAT (as defined below);
• Expectations regarding the prospects for the Company's newly acquired subsidiary EIC (as defined below);
• The impact of the current global health crisis caused by COVID-19 (as defined below);
• Expectations around demand for cannabis and related products, future opportunities and sales including the relative mix of medical versus adult-use recreational products, the relative mix of products within the adult-use recreational category including wholesale, the Company's financial position, future liquidity and other financial results;
• Legislation of additional cannabis types and forms for adult-use in Canada including regulations relating thereto and the implementation thereof and our future product forms;
• Expectations around branded products and derivative-based products with respect to timing, launch, product attributes, composition and consumer demand;
• Strategic investments and capital expenditures, and expected related benefits;
• Expectations regarding the resolution of litigation and other legal proceedings;
• The general continuance of current, or where applicable, assumed industry conditions;
• Changes in laws, regulations and guidelines, including those relating to the recreational and/or medical cannabis markets;
• Price of cannabis and derivative cannabis products;
• Impact of the Company's cash flow and financial performance on third parties, including its supply partners;
• Fluctuations in the price of Common Shares and the market for the Common Shares;
• Treatment of the Company's business under governmental regulatory regimes and tax laws, including the Excise Act (as defined herein) and the renewal of the Company's license thereunder and the Company's ability to obtain export licenses from time to time;
• The Company's growth strategy, targets for future growth and forecasts of the results of such growth;
• Expectations concerning access to capital and liquidity and the Company's ability to access the public markets to fund operational activities and growth;
• The Company's ability to remain listed on the TSX and NASDAQ and the impact of any actions it may be required to take to remain listed;
• The ability of the Company to generate cash flow from operations and from financing activities; and
• The competitive conditions of the industry, including the Company's ability to maintain or grow its market share.
Forward-looking information is provided for the purposes of assisting the reader in understanding the Company and its business, operations, risks, financial performance, financial position and cash flows as at and for the periods ended on certain dates, and to present information about management's current expectations and plans relating to the future, and the reader is cautioned that such statements may not be appropriate for other purposes. Forward-looking information does not guarantee future performance and involves known and unknown risks, uncertainties and other factors that may cause actual results or events to differ materially from those anticipated in the forward-looking information. In addition, this MD&A may contain forward-looking information attributed to third party industry sources. Undue reliance should not be placed on forward-looking information, as there can be no assurance that the plans, intentions or expectations upon which they are based will occur. By its nature, forward-looking information involves numerous assumptions, known and unknown risks and uncertainties, both general and specific, that contribute to the possibility that the expectations, predictions, forecasts, projections and conclusions will not occur or prove accurate, that assumptions may not be correct, and that objectives, strategic goals and priorities will not be achieved.
Factors that could cause actual results to differ materially from those set forth in forward-looking information include, but are not limited to: financial risks; dependence on senior management, the board of directors of the Company (the "Board of Directors"), consultants and advisors; availability and sufficiency of insurance including continued availability and sufficiency of director and officer and other forms of insurance; the Company and its subsidiaries being able to, where applicable, cultivate cannabis pursuant to applicable law and on the currently anticipated timelines; industry competition; general economic conditions and global events including COVID-19 retail store closures or reduced sales at retail stores or otherwise due to COVID-19; heightened economic and industry uncertainty as a result of COVID-19 and governmental action in respect thereto including with respect to impacts on production, operations, product development, new product launches, disclosure controls and procedures or internal control over financial reporting, including as they may be impacted by delays in remediation due to work from home policies and other COVID-19 impacts, demand for products and services, third-party suppliers or service providers, and any existing or new international business partnerships; production facilities running at less than full capacity due to reduced workforce for reasons related to COVID-19 (as described herein) and market demand; potential supply chain and distribution disruptions; product development, facility and technological risks; changes to government laws, regulations or policy, including environmental or tax, or the enforcement thereof; agricultural risks; ability to maintain any required licenses or certifications including the successful completion of the inspection for the Good Agricultural Practice certification by the Control Union Medical Cannabis Standard ("CUMCS"); supply risks; product risks; construction delays or postponements; packaging and shipping logistics; expected number of medical and adult-use recreational cannabis users in Canada and internationally; potential time frame for the implementation of legislation to legalize cannabis internationally; the Company's, its subsidiaries and its investees' ability to, where applicable, obtain and/or maintain their status as Licensed Producers (as defined herein) or other applicable licenses; risk factors affecting its investees; availability of any required financing on commercially attractive terms or at all; non-compliance with debt covenants; the potential size of the regulated adult-use recreational cannabis market in Canada; demand for and changes in the Company's cannabis and related products, including the Company's Rec 2.0 products (as defined herein), and the sufficiency of the retail networks to supply such demand; ability to enter and participate in international market opportunities; general economic, financial market, regulatory, industry and political conditions affecting the Company; the ability of the Company to compete in the cannabis industry and changes in the competitive landscape; a material decline in cannabis prices; the Company's ability to manage anticipated and unanticipated costs; the Company's ability to implement and maintain effective internal controls over financial reporting and disclosure controls and procedures; and, other risks and factors described from time to time in the documents filed by the Company with securities regulators. Material factors and assumptions used in establishing forward-looking information include that construction and production activities will proceed as planned and demand for cannabis and related products will change in the manner expected by management, in each case after taking into account any impacts related to COVID-19 that are currently known or predicted by management based on the limited information available and the fluidity and uncertainty of the crisis. All forward-looking information is provided as of the date of this MD&A.
The Company does not undertake to update any such forward-looking information whether as a result of new information, future events or otherwise, except as required by law.
ADDITIONAL INFORMATION ABOUT THE ASSUMPTIONS, RISKS AND UNCERTAINTIES OF THE COMPANY'S BUSINESS AND MATERIAL FACTORS OR ASSUMPTIONS ON WHICH INFORMATION CONTAINED IN FORWARD-LOOKING INFORMATION IS BASED IS PROVIDED IN THE COMPANY'S DISCLOSURE MATERIALS, INCLUDING IN THIS MD&A UNDER "RISK FACTORS" AND THE COMPANY'S CURRENT AIF UNDER "RISK FACTORS", FILED WITH THE SECURITIES REGULATORY AUTHORITIES IN CANADA AND AVAILABLE UNDER THE COMPANY'S ISSUER PROFILE ON SEDAR AT WWW.SEDAR.COM AND FILED WITH OR FURNISHED TO THE SEC AND AVAILABLE ON EDGAR AT WWW.SEC.GOV. ALL FORWARD-LOOKING INFORMATION IN THIS MD&A IS QUALIFIED BY THESE CAUTIONARY STATEMENTS.
BUSINESS OVERVIEW
NATURE AND HISTORY OF THE COMPANY'S BUSINESS
The Company's wholly-owned subsidiary Organigram Inc. is a Licensed Producer of cannabis under the Cannabis Act.
The Company conducts its operations at its facility located in Moncton, New Brunswick. The Company has expanded its main facility over time to create additional production capabilities by strategically acquiring land and buildings adjacent to the main facility (together, the "Moncton Campus"). While the Company has substantially completed its expansion at the Moncton Campus with respect to cannabis production capacity, it is in the final phases of completing its refurbishment with respect to derivative products allowed for legal sale by Licensed Producers such as the Company under amendments to the Cannabis Act ("Rec 2.0").
Patients order medical cannabis dried flower and cannabis derivative products from the Company primarily through the Company's online store or by phone. Medical cannabis dried flower and cannabis derivative products are and will continue to be delivered by secure courier or other methods permitted by the Cannabis Act. The Company's prices vary based on grow time, strain yield and market conditions.
The Company is also authorized for wholesale shipping of cannabis plant cuttings, dried flower, blends, pre-rolls and cannabis derivative-based products to approved retailers and wholesalers for adult-use recreational cannabis under the individual provincial and territorial regulations as per the Cannabis Act.
On April 6, 2021, the Company expanded its manufacturing and production footprint with the purchase of The Edibles and Infusions Corporation ("EIC") located in Winnipeg, Manitoba. EIC holds a research license and standard processing license under the Cannabis Act, and is in the process of completing its application to add the activity of sale of Cannabis 2.0 products, including cannabis edibles, to its standard processing license.
BUSINESS ENVIRONMENT
The Company's business and activities are heavily regulated. The Company's AIF contains a more detailed description of the regulatory framework of the Company's business as of the date of the AIF. The following provides a description of recent regulatory developments that have the potential to impact the Company's performance, however there have been no significant changes since the date of the AIF.
Current Regulatory Landscape
Medical cannabis has been legal in Canada since 2001 under various regulatory regimes. On June 20, 2018, the Government of Canada passed the Cannabis Act to allow regulated and restricted access to cannabis for adult-recreational users. The Cannabis Act came into force on October 17, 2018.
The Cannabis Act creates a strict legal framework for controlling the production, distribution, sale and possession of cannabis in Canada. The Cannabis Act allows adults to legally possess and use cannabis and therefore the possession of small amounts of cannabis is no longer a criminal offence. It also made it a specific criminal offence to sell cannabis to a minor and created significant penalties for those who engage young Canadians in cannabis-related offences.
On November 9, 2018, Health Canada issued a license to the Company under the Cannabis Act for standard cultivation, standard processing and sale for medical purposes (the "License"). On October 21, 2019, Health Canada amended the License to expand the classes of cannabis products that may be sold to adult-use recreational sales channels or sold for medical purposes, to include cannabis topicals, cannabis extracts and edible cannabis. The License has also been amended to add additional growing, processing, drying and storage rooms. The Company received Health Canada's approval for the renewal of the License effective March 20, 2020. The License is valid until March 20, 2023 and is subject to customary terms and conditions.
The Company also holds a cannabis license under the Excise Act, 2001 (the "Excise Act") which was renewed on October 17, 2020 and expires on October 16, 2022. All Licensed Producers who are authorized to cultivate, produce and package cannabis products are also required to hold a cannabis license under the Excise Act from the Canada Revenue Agency. The Company intends to renew its licenses prior to expiry.
The Company received its research and development license (the "Research License") from Health Canada on October 23, 2019 to conduct further in-house research. The activities authorized under the Research License have and will continue to support the Company's plans to commercialize cannabis products for Rec 2.0.
Edibles and Derivative Products Regulation
The Cannabis Act was amended in 2019 to include provisions that came into force on October 17, 2019 relating to the legal sale by Licensed Producers, such as the Company, of a range of new cannabis product forms such as: "edible cannabis", "cannabis extracts" and "cannabis topicals".
Certain provinces have announced restrictions on the launch and sale of edible and vaporizable products in their markets, including Quebec and Newfoundland and Labrador. Alberta lifted its previously announced ban on vaporizable cannabis products on February 14, 2020. As the market and regulations are rapidly developing the impact of these announcements is not readily determinable at this time.
A limited selection of Rec 2.0 products began to appear gradually in physical or online stores in the latter half of December 2019. Licensed Producers are required to provide 60-days prior notice to Health Canada of their intent to sell any new products and such notices could not be given until the new product forms were legalized on October 17, 2019.
See "Canadian Adult-Use Recreational Market 2.0" in this MD&A.
KEY QUARTERLY FINANCIAL AND OPERATING RESULTS
| Q2-2021 | Q2-2020 | CHANGE | % CHANGE | |||||||||
| Financial Results | ||||||||||||
| Gross revenue | $ | 19,292 | $ | 27,309 | $ | (8,017 | ) | (29)% | ||||
| Net revenue | $ | 14,643 | $ | 23,221 | $ | (8,578 | ) | (37)% | ||||
| Cost of sales | $ | 31,146 | $ | 15,811 | $ | 15,335 | 97% | |||||
| Gross margin before fair value adjustments and other charges | $ | (16,503 | ) | $ | 7,410 | $ | (23,913 | ) | (323)% | |||
| Gross margin % before fair value adjustments and other charges(1) | (113)% | 32% | (145)% | (453)% | ||||||||
| Operating expenses | $ | 12,077 | $ | 15,314 | $ | (3,237 | ) | (21)% | ||||
| Adjusted EBITDA (2) | $ | (8,642 | ) | $ | (59 | ) | $ | (8,583 | ) | 14,547% | ||
| Net loss | $ | (66,389 | ) | $ | (6,833 | ) | $ | (59,556 | ) | 872% | ||
| Net cash used in operating activities (3) | $ | (10,430 | ) | $ | (10,894 | ) | $ | 464 | (4)% | |||
| Adjusted Gross Margin (4) | $ | (680 | ) | $ | 8,449 | $ | (9,129 | ) | (108)% | |||
| Adjusted Gross Margin % (4) | (5)% | 36% | (41)% | (114)% | ||||||||
| Financial Position | ||||||||||||
| Working capital | $ | 112,398 | $ | 96,752 | $ | 15,646 | 16% | |||||
| Inventories and biological assets | $ | 43,374 | $ | 140,831 | $ | (97,457 | ) | (69)% | ||||
| Total assets | $ | 392,764 | $ | 502,276 | $ | (109,512 | ) | (22)% | ||||
| Operating Results | ||||||||||||
| Kilograms harvested | 5,028 | 13,711 | (8,683 | ) | (63)% | |||||||
| Kilograms sold - dried flower | 3,688 | 4,080 | (392 | ) | (10)% |
Note 1: Equals gross margin before fair value adjustments (as reflected in the Interim Financial Statements) divided by net revenue.
Note 2: Adjusted EBITDA is a non-IFRS measure that the Company defines as net income (loss) before: interest expense, net of investment income; income tax expense (recovery); depreciation, amortization, impairment, and gain (loss) on disposal of PP&E (per the statement of cash flows); share-based compensation (per the statement of cash flows); share of loss and impairment loss from loan receivable and investments in associates; unrealized loss (gain) on changes in fair value of contingent consideration; expenditures incurred in connection with the NASDAQ cross-listing; the fair value adjustment to biological assets, inventories sold, and other charges; write-offs and impairment of inventories and biological assets; write-downs of inventory to net realizable value; COVID-19 related charges, net of any government subsidies; legal provisions; and share issuance costs allocated to derivative warrant liabilities and the change in fair value of derivative warrant liabilities. See the cautionary statement regarding non-IFRS financial measures in the "Introduction" section at the beginning of this MD&A and the reconciliation to IFRS measures in the Financial Results and Review of Operations section of this MD&A.
Note 3: Q2 Fiscal 2020 net cash used in operating activities has been calculated based on a correction of a presentation error of net cash used in operating activities (refer to Note 24 of the Interim Financial Statements). Fiscal 2021 year-to-date net cash used in operating activities is correctly stated as per the Interim Financial Statements.
Note 4: Adjusted Gross Margin is a non-IFRS measure that the Company defines as net revenue less: (i) cost of sales, before the effects of fair value changes to biological assets, inventories sold, and other charges; excluding (ii) write-offs and impairment of inventories and biological assets; (iii) write-downs to net realizable value; (iv) COVID-19 related charges; and (v) unabsorbed overhead relating to underutilization of the production facility, most of which is related to non-cash depreciation expense. See the cautionary statement regarding non-IFRS financial measures in the "Introduction" section at the beginning of this MD&A and the reconciliation to IFRS measures in the Financial Results and Review of Operations section of this MD&A. Adjusted Gross Margin % equals Adjusted Gross Margin divided by net revenue.
REVENUE
For the three months ended February 28, 2021, the Company reported $14,643 in net revenue. Of this amount $11,988 (82%) was sold to the adult-use recreational market, $2,061 (14%) to the medical market, $520 (3%) to the wholesale market and other revenues, and the balance of $74 (1%) to the international market. Q2 Fiscal 2021 net revenue decreased 37%, or $8,578, from the prior year comparative period's net revenue of $23,221, primarily due to a decrease of $4,359 in wholesale and international revenue to Licensed Producers and a lower average net selling price ("ASP") compared to the prior year comparative period. The higher wholesale revenues during Q2 Fiscal 2020 were opportunistic in nature, and primarily consisted of sales to a single Licensed Producer. These wholesale revenues were not necessarily expected to recur in future quarters at those levels, or at all. Net revenue from the adult-use recreational market decreased $3,022, or 20% due to a decrease in volumes, partly as a result of Q2 Fiscal 2020 being the first quarter in which Rec 2.0 products were sold into the pipeline, and a lower ASP from increased competition and a higher proportion of value oriented products being sold during the period. Lower volumes sold into the Canadian adult-use recreational market in Q2 Fiscal 2021 were also due to certain provincial boards managing inventory levels down such as Alberta.
Q2 Fiscal 2021 net revenue was also impacted by missed sales opportunities due to temporary shut-down of the Moncton Campus facility and isolation of certain staff after the identification of three positive COVID-19 cases (see the "COVID-19 Corporate Action Plan" section of this MD&A for further detail). In total, the Company was unable to fulfill approximately $7 million in demand for its products in Q2 Fiscal 2021 due to production and processing constraints.
Dried flower comprised 75% of net revenue in the quarter. The ASP of dried flower decreased to $2.99 per gram on a quarter-over-quarter basis compared to $4.56 per gram for Q2 Fiscal 2020, as both the Company and the Canadian cannabis industry experienced general price compression in the adult-use recreational and medical markets as these markets matured and the customer and product mix evolved to focus more on value offerings. Selling prices are prone to fluctuation and there may be further price compression if the market remains oversupplied. The Company is committed to refining its product mix as customer preferences evolve and continues to revitalize its higher margin Edison branded flower products.
Sales volumes of dried flower in grams decreased 10% to 3,688 kg in Q2 Fiscal 2021 compared to 4,093 kg in the prior year comparative quarter, primarily as a result of the contribution of wholesale dried flower sales in the prior year (1,616 kg). After removing the impact of wholesale dried flower sales in the prior year, sales volumes of dried flower actually increased in the current quarter by 50%.
COST OF SALES
Cost of sales for the three months ended February 28, 2021 increased to $31,146 compared to $15,811 in the prior year comparative period, primarily as a result of inventory write-downs and provisions, and unabsorbed fixed overhead costs. Included in Q2 Fiscal 2021 cost of sales is a write-off of excess and unsaleable inventories of $13,549 related to provisions for unsaleable inventories and to reflect an estimated decline in selling prices. Additionally, $2,274 was incurred with respect to unabsorbed fixed overhead costs as a result of lower production volumes related to market demand and the implementation of social distancing measures related to COVID-19. Inventory write-downs and provisions of $1,039 were incurred in the prior year comparative period.
GROSS MARGIN BEFORE FAIR VALUE ADJUSTMENTS AND ADJUSTED GROSS MARGIN
The Company realized gross margin before fair value adjustments for the three months ended February 28, 2021 of ($16,503), or (113%) as a percentage of net revenue, compared to $7,410, or 32%, in the prior year comparative period. The decrease in gross margin before fair value adjustments as a percentage of net revenue is largely due to: (i) inventory provisions and write-off of excess and obsolete inventories; (ii) inventory write-downs to net realizable value; (iii) unabsorbed overhead as a result of lower production volumes; (iv) higher cost of sales on higher cultivation and post-harvest costs; and (v) a lower ASP from increased competition and the ongoing evolution of the customer and product mix as well as provisions for product returns and pricing adjustments.
Adjusted gross margin1 for the three months ended February 28, 2021 was ($680), or (5%) as a percentage of net revenue, compared to $8,449, or 36%, in the prior year quarter. This decrease was largely due to higher cultivation and post-harvest costs along with decreased average selling prices in Q2 Fiscal 2021. Please refer to the "Financial Review and Discussion of Operations" section of this MD&A for a reconciliation of net revenue to Adjusted Gross Margin.
OPERATING EXPENSES
General and administrative, sales and marketing, and share-based compensation expense were collectively $12,077 for Q2 Fiscal 2021, which was lower than $15,314 in Q2 Fiscal 2020, primarily due to a reduction in share-based compensation expense, lower advertising and promotion, and professional fees, which was partly offset by increased employee costs relating to the growth of the team and insurance costs, as well as cultivation-related research and development costs.
ADJUSTED EBITDA
Negative Adjusted EBITDA2 was $8,642 in Q2 Fiscal 2021 compared to negative Adjusted EBITDA of $59 in Q2 Fiscal 2020. The reduction in Adjusted EBITDA is primarily attributed to the lower Adjusted Gross Margin in Q2 Fiscal 2021, as discussed above. Please refer to the "Financial Review and Discussion of Operations" section of this MD&A for a reconciliation of net loss to Adjusted EBITDA.
____________________________________________
1 Adjusted gross margin is a non-IFRS financial measure. See the cautionary statement regarding non-IFRS financial measures in the "Introduction" section of this MD&A.
2 Adjusted EBITDA is a non-IFRS financial measure. See the cautionary statement regarding non-IFRS financial measures in the "Introduction" section of this MD&A.
NET LOSS
The net loss was $66,389 in Q2 Fiscal 2021 compared to a net loss of $6,833 in Q2 Fiscal 2020. The increase in net loss was primarily attributed to lower gross margin as described above as well as negative change in the fair value of derivative warrant liabilities ($37,659).
FINANCIAL POSITION
Working capital as at February 28, 2021 declined to $112,398 from $141,123 as at August 31, 2020 mainly due to the decrease in inventories of $21,949 Proceeds received from the November 2020 unit offering of $64,839 were largely offset by repayment of long-term debt of $56,520 and cash used in operating activities during the quarter.
KEY DEVELOPMENTS DURING THE QUARTER AND SUBSEQUENT TO FEBRUARY 28, 2021
COVID-19 CORPORATE ACTION PLAN
In March 2020, the World Health Organization declared the outbreak of a novel strain of coronavirus ("COVID-19") a global pandemic. Government measures to limit the spread of COVID-19, including the closure of non-essential businesses for periods of time, continued to disrupt the Company's operations during the three month period ended February 28, 2021 and which disruption is ongoing.
The production and sale of cannabis have been recognized as essential services across Canada and non-essential businesses have had periods of reopening, however COVID-19 pandemic related challenges persist. Due to the ongoing developments and uncertainty, it is not possible to predict the continuing impact that COVID-19 will have on the Company, its financial position, its operating results and/or its cash flows. In addition, it is possible that estimates in the Company's financial statements will change in the near-term as a result of COVID-19 and the effect of any such changes could be material, which could result in, among other things, an impairment of long-lived assets including intangible assets. The Company continues to closely monitor the impact of COVID-19 on all aspects of its business.
On April 6, 2020, Organigram announced the temporary layoff of approximately 45% of its workforce primarily in an effort to help contain COVID-19. The Company offered voluntary layoffs to certain staff and those who accepted made up the majority of the layoffs. In some cases, due to the impacts of COVID-19, some administrative, support and other functions were deemed non-essential to the short-term needs of the business and those employees were temporarily laid off. The temporary layoffs were initiated on March 24, 2020. Lump-sum payments (equating to approximately two weeks of work) were paid to the affected employees to help bridge the gap to available government programs. In addition, the Company absorbed the employee paid portion of health, dental and short-term disability premiums for all employees during this difficult time. The impact of these temporary layoffs resulted in a charge of approximately $0.7 million during the month of April 2020, which is primarily associated with the lump sum payments provided to these employees. The Company also put in place a number of health and safety measures during Q3 and Q4 2020, which continue to be in place, including, but not limited to, the following:
• An emergency response team was established to monitor pandemic updates, review safety protocols, assess public health risk and develop action plans;
• Moved to a work from home environment for any functions not required onsite;
• Implemented travel restrictions for work related travel, restricted visitor access to the Company's facilities and imposed self-isolation for any employees who may have had symptoms of COVID-19 and/or returned from international travel as of March 13, 2020;
• Increased focus on sanitation and social distancing, with additional hand sanitizing stations throughout the Moncton Campus, cleaning and sanitizing of high touch surfaces, and additional cleaning in common areas;
• Imposed restrictions on large meetings and gatherings, opting for web-based meetings and teleconferencing;
• Mandatory reporting of any hourly employee absence to an attendance phone line including specific reporting of any COVID-19 symptoms; and
• Reminders of measures to reduce risk of infection and prevent spread including washing hands and avoiding contact with faces.
Effective May 13, 2020, the Company began to implement a staggered return-to-work plan.
During the quarter, the Company initiated two temporary shutdowns of its Moncton Campus facility in response to positive COVID-19 test results. During these temporary shutdowns, deep cleaning of the Moncton Campus was undertaken consistent with the Company's COVID Response Plan and cooperation with Public Health prior to the Moncton Campus being inspected and cleared to reopen. Each temporary shutdown lasted between two to three days. These temporary shutdowns were coordinated with Public Health and in conjunction with the mobilization of the Company's COVID Response Team. Contact tracing was also conducted, which resulted in a significant number of employees off work and isolating at home. As such, the Company missed sales opportunities during the quarter as certain product orders could not be fulfilled. As of the date of this MD&A, the Company had approximately 633 employees, including three employees at the EIC facility in Winnipeg, Manitoba. The Company is currently adding to its workforce as it increases its cultivation and for the new hires for the Centre of Excellence that are part of the Product Development and Collaboration Agreement with BAT.
LEADERSHIP CHANGES
On January 11, 2021, the Company announced the appointment of Marni Wieshofer, to the Company's Board of Directors. Ms. Wieshofer is Organigram's first U.S. domiciled director and has assumed her board position effective January 12, 2021. Ms. Wieshofer has more than thirty years of diverse experience, including board membership at public and private companies, particularly in the U.S., and international mergers and acquisitions.
On February 2, 2021, the Company announced the departure of Matt Rogers, Senior Vice President, Operations who will be leaving the Company at the end of May 2021 to pursue other interests. Further, Nathalie Batten, was appointed as Organigram's Plant Manager.
On March 11, 2021, the Company announced it had added Mr. Jeyan Heper to the Board of Directors, as one of the two nominees that BAT is entitled to nominate in connection with BAT's strategic investment in the Company and the product development collaboration (described below). Mr. Heper, who is a Group Category Director at BAT, has over 23 years of diverse management, strategic leadership, and mergers and acquisitions experience at global companies including BAT, Procter & Gamble, Danone and LifeStyles Healthcare. His expertise includes growing value and volume share through global brand and equity building and consumer marketing. Both BAT nominees are expected to bring deep R&D, product and strategic expertise to further complement Organigram's existing Board capabilities as well as extend its international presence. Further particulars regarding BAT's second nominee and that nominee's credentials will be provided upon appointment.
OTHER KEY DEVELOPMENTS
On December 16, 2020, the Company announced the launch of Trailblazer Spark, Flicker and Glow 510-thread Torch vape cartridges in a new 1g format. As one of the first companies to launch 510-thread vape cartridges into the legal, adult recreational market in Canada, Trailblazer Torch offers consumers 510 cartridges, high-quality CO2 extract and three unique terpene-infused flavours.
On December 22, 2020, the Company announced the launch of three new Edison Cannabis Co. ("Edison") indica strains namely, high potency Black Cherry Punch and Ice Cream Cake (I.C.C.) and full flavour Slurricane, which offers a distinct flavour and aroma profile as a result of being grown in a strain specific micro-climate.
On March 2, 2021, the Company announced the launch of two new additions to the recreational cannabis product portfolio which are SHRED Tropic Thunder Jar of Joints and Trailblazer SNAX Milk Chocolate Bars. SHRED's Tropic Thunder is a combination of strains with citrus and tropical aromas featuring THC of 18% or more, and is available in a Jar of Joints. Trailblazer SNAX is the only chocolate bar currently in market in which cannabis is infused into a rich, creamy cacao filling in the centre of the bar.
On March 11, 2021, the Company announced a $221 million strategic investment from a wholly-owned subsidiary of BAT, which subscribed for approximately 58.3 million Common Shares of the Company at $3.792 per common share, which represented a 19.9% equity interest in the Company on a post-transaction basis at the time of announcement. Concurrent with the investment, Organigram Inc. and BAT also entered into a Product Development Collaboration Agreement (the "PDC Agreement") pursuant to which a "Center of Excellence" will be established to focus on developing the next generation of cannabis products.
On March 30, 2021, the Company announced the launch of two new recreational product offerings - Indi, one of Canada's only cannabis brands dedicated exclusively to indica cultivars, and Edison indica pre-rolls Black Cherry Punch, Ice Cream Cake (I.C.C.) and Slurricane.
On April 1, 2021, the Company repaid the $58.5 million outstanding balance under the facilities provided under its amended and restated credit agreement dated November 27, 2020 with Bank of Montreal and a syndicate of lenders.
On April 6, 2021, the Company announced it had acquired all of the issued and outstanding shares of EIC (the "EIC Acquisition") for share consideration of $22.0 million, plus up to an additional $13.0 million in shares payable upon the EIC business achieving certain earnout milestones. The EIC Acquisition further broadens Organigram's continuum of product offerings and provides an operational footprint in Western Canada.
OPERATIONS AND PRODUCTION
CULTIVATION
While the vast majority of incremental production capacity between 2017 to 2019 by the Company's competitors was generated from greenhouse (not indoor) production, Organigram focused on a core competency of controlling conditions in precisely built indoor environments (over 100 separate grow rooms) with a commitment to continuous improvement and investment in information technology.
The Company is able to control the critical facets of the lighting and environmental elements in its facilities to drive maximum quality and yield in the plants it produces. The Company has also developed its own in-house proprietary information technology system called OrganiGrow, a database that tracks all grow cycles by harvest period, strain, room, environmental conditions and other factors, which in turn allows the Company to understand and refine the optimal methods to grow cannabis plants. It is the Company's intention to continually improve and refine its cultivation and post-harvesting practices in an effort to achieve a competitive advantage in the space.
The Company's cultivation plans focus on bringing a steady stream of new and sought-after cultivars to the market and increasing both the tetrahydrocannabinol ("THC") and terpene profiles of its dried flower to meet emerging consumer demand. As part of its ongoing genetic exploration program to offer new cultivars, particularly under the higher margin Edison brand, the Company has sourced genetics from a premium cannabis nursery as well as other smaller Licensed Producers. This nursery's processes and technology help eliminate disease and pests from the plants in order to produce a high-quality genetic product. The focus on both the genetics of the plant and the environment in which they are grown results in a unique phenotype expression. This means that even plants grown from the same genetics can be markedly different in terms of physical properties, potency, terpenes and aromas, based on their growing conditions. The Company believes this kind of strategic and creative product development process is a key differentiator for both the Edison portfolio and the Company overall and looks forward to introducing more new strains over the next few quarters.
The Company continued to operate at reduced cultivation, processing and packaging capacity due to its layoff of 25% of its workforce during Fiscal 2020. At the same time that Organigram has been operating with reduced resources and at lower cultivation levels, the Company has also been introducing many new R&D strains as part of its product portfolio revitalization in an effort to increase THC potency and bring new cultivars to market. Some of these strains have been successful and some have not. As a result of strain development efforts and reduced cultivation levels the overall yields and resulting harvests have been lower than the same prior year period.
The Company harvested 5,028 kg of cannabis during Q2 Fiscal 2021 compared to 13,710 kg in Q2 Fiscal 2020. The decrease from the comparative period was primarily related to shake and trim harvested in Q2 Fiscal 2020 (4,813 kg), as well as the impact of the strain exploration program and the lower cultivation levels in Q2 Fiscal 2021. The Company was using approximately 54% of the grow rooms in Q2 Fiscal 2021 and as of the date of this MD&A, the Company is currently using 69% of its grow rooms.
For the foreseeable future, the Company plans to continue to cultivate less than its cultivation capacity in response to less than originally anticipated consumer demand which the Company believes is due to a lack of an adequate retail store network in Canada as well as slower than expected positive regulatory developments in Canada and internationally. The total capacity of the Company's Moncton Campus facility will continue to fluctuate as we further refine growing methods and the actual facility utilization rate will be dependent on the combination of inventory levels, forecasted sales demand and growing methods.
The Company began to ramp up cultivation staffing and production in Q2 Fiscal 2021 to meet the increased demand for many of its new products as part of its portfolio revitalization as well as the increase in industry demand on the back of the ongoing accelerated retail store build out in Ontario. See "Outlook" section of this MD&A for further discussion on staffing.
Subsequent to Q2 Fiscal 2021, the Company successfully commissioned and began operating a new pre-roll machine. Currently, the equipment is producing approximately 25-30 pre-rolls per minute with the potential for ongoing improvement. This machine reduces the reliance on manual labour for pre-roll production, contributing to operating efficiencies and will better support the production of multi-pack pre-rolls which attract higher gross margins than single rolls and have started to comprise a greater proportion of the Company's product portfolio aligned with consumer demand.
PHASE 5 REFURBISHMENT - MONCTON'S EDIBLES AND DERIVATIVE FACILITY
The Company has substantially completed its Phase 5 refurbishment of 56,000 square feet of interior space within its existing facility in Moncton for design under European Union GMP ("EU GMP") standards for additional extraction capacity, a derivatives and edibles facility and additional office space. EU GMP describes the minimum standard that a manufacturer must meet in its production processes. EU GMP certification is subject to inspections coordinated by the European Medicines Agency. The Company has no plans to seek certification in the immediate future but continues to evaluate paths to certification.
Phase 5 houses the high speed, high capacity, fully automated chocolate production line which includes an advanced chocolate molding line and a fully integrated packaging line that includes advanced engineering, robotics, high speed labeling and automated carton packing. Phase 5 also includes expanded vaporizer pen filling and automated packaging, additional extraction by both CO2 and hydrocarbons as well as expanded areas for formulation including short path distillation for edibles and vaporizer pen formulas. The Company is continuing to work on the installation and commissioning of certain equipment in its edibles and extraction area including its hydrocarbon extraction equipment which is expected to begin commissioning in Q4 Fiscal 2021.
Several factors can cause actual capacity to differ from estimates including, but not limited to, timing for receipt of regulatory approvals from Health Canada, construction and commissioning delays or postponements and unforeseen obstacles. See "Risk Factors" in this MD&A and in the Company's current AIF.
NEWLY ACQUIRED WINNIPEG EDIBLES FACILITY
As part of the EIC acquisition announced subsequent to Q2 Fiscal 2021, Organigram now has a purpose-built, highly-automated, 51,000-square-foot manufacturing facility in Winnipeg, Manitoba. The facility design and the equipment specifications were designed under EU GMP standards and were also designed to handle both smaller-batch artisanal manufacturing as well as large-scale nutraceutical-grade high-efficiency manufacturing and produce highly customizable, precise, and scalable cannabis-infused products in various formats and dosages including pectin, gelatin, and sugar-free soft chews (gummies), toffee and caramel with novel capabilities such as infusions, striping and possibility of using fruit purees. EIC currently holds a Research License and a Standard Processing License issued under the Cannabis Act and regulations; it is in the process in of completing its application to add the activity of sale of cannabis 2.0 products to its Standard Processing License. Until EIC receives its Sales License, it is capable of manufacturing products in bulk for further processing, review and sale by Organigram or third-party Licensed Producers, for which it may provide white-label services.
CANADIAN ADULT-USE RECREATIONAL MARKET
Organigram conducts ongoing consumer research and leverages detailed analyses of consumer purchasing behaviors across Canada to help ensure the Company's offerings are aligned with existing and expected evolutions in consumer preferences. The Company has been revitalizing its product portfolio with the launch of 62 new stock keeping units ("SKUs") since July 2020 and expects to launch up to 31 more new SKUs by the end of Q3 Fiscal 2021.
REC 1.0
Dried flower and pre-rolls remain the first and second largest categories, respectively, in the Canadian adult-use recreational market of all product form factors and the Company believes these categories will continue to dominate based on the sales history in mature legal markets in certain U.S. states as well as regulatory restrictions on other form factors (e.g. the 10 mg per package THC limit in the edibles category). Cannabis consumers continue to want both high THC dried flower products and cultivar diversity as supported by available sales data.
Throughout the latter half of Fiscal 2020, the Company successfully launched a number of value segment offerings, particularly value in large format products, to respond to increased demand in this area. The new products have been well-received by the market. The growth and significant contribution of the dried flower value segment has also contributed to an overall decline in margins for Organigram and many of its peers over the last number of quarters. However, Organigram is focused on revitalizing its Edison mainstream brand, which attracts higher product gross margins, by launching new dried flower offerings with unique strains and higher potency THC. The Edison brand was one of the top 12 most searched cannabis brands on the Ontario Cannabis Store (OCS.ca) website in each of November 2020 and January and February 2021.
Higher Margin Edison and Indi Dried Flower Strains
In late December 2020, the Company launched three new Edison Cannabis Co. Indica strains including high potency Black Cherry Punch and Ice Cream Cake (I.C.C.) and Slurricane. Black Cherry Punch and Ice Cream Cake (I.C.C.) strains contain THC ranges of 20%-26% and Slurricane has 17%+ THC. The strains are available in 3.5g formats in certain provincial retail stores. The Company expects to launch additional new high THC strains under the Edison brand in Q3 Fiscal 2021.
Subsequent to quarter-end in late March, Organigram launched these new Edison strains in a package of three 0.5g pre-rolls which are being produced on the Company's new world-class automated pre-roll equipment.
Every Edison strain benefits from being grown in one of over 100 data-backed, strain-specific grow rooms with micro-climates designed to offer a distinct flavour and aroma profile and to ensure consistent quality. Variables including humidity, temperature, light and plant density can be customized to optimize the growth and output of each plant.
The newest Edison strains are a product of the Company's ongoing investment in its genetics program and among the strains developed from genetics that Organigram originally sourced from a premium cannabis nursery. The nursery's processes and technology help eliminate disease and pests from the plants in order to produce a high-quality genetic product.
Also, subsequent to quarter-end in late March, the Company introduced Indi, one of Canada's only cannabis brands dedicated exclusively to indica cultivars, to the market. With the goal of curating a lineup of potent and interesting indica cultivars, Indi has been created for discerning indica consumers. The indica-only product line addresses the number one reason consumers are likely to consume cannabis: to relax and unwind3.
Skyway Kush is the first strain in the Company's Indi portfolio. The strain features a spicy, herbal, and diesel aroma with earthy undertones and top terpenes including Caryophyllene, Limonene, Myrcene, Humulene and Terpineol and currently offers THC in the range of 20% to 23%.
Value Segment Offerings
The Company has noted the significant growth in the dried flower value segment of the market over the last year with intensifying competition including recent entries of lower priced offerings which have caused significant market share shifts within the value segment. Particularly since the onset of the COVID-19 pandemic, value in large format sizes have become an increasing focus of consumers. In Q3 Fiscal 2020, the Company responded with the introduction of Trailer Park Buds ("TPB"), its first value offering of dried flower in a large size format of 28g which the Company believes is a differentiated product that does not compete on price alone because it is indoor-grown, whole dried flower and strain specific. In early Q4 Fiscal 2020, the Company announced that it was proactively making some changes to the TPB brand and logo after reviewing perception around the brand with Health Canada. In the intermediate term, Organigram moved to a modified version of the brand and logo, "Buds", and over time the Company is moving to the permanent revised brand and logo combination of "Bag o' Buds" for its large format value brand.
The Company's value segment strategy also includes dried flower offerings that were launched in larger format sizes of 7g and 15g under the Trailblazer brand in July 2020. The Trailblazer value brand continues to offer increasingly higher THC levels versus what was offered when originally launched (near the start of adult-use cannabis legalization), at a competitive price point.
In Q1 Fiscal 2021, Organigram expanded its strong value portfolio with the launch of SHRED, a high quality, high potency and affordable dried flower that is pre-shredded for consumer convenience. SHRED offers three pre-milled varieties, all with THC of 18% or more. It is made from whole flower, does not contain any shake or trim and is milled to the same specifications as the Company's existing pre-roll products. SHRED is currently Organigram's most affordable option (on a per gram basis).
SHRED was the most searched cannabis brand on the Ontario Cannabis Store (OCS.ca) website for the last five consecutive months (November and December 2020 and January, February and March 2021) and the Company announced in early March that it extended the successful line with the introduction of a Jar of Joints, a convenient jar of 14 x 0.5g pre-rolls in SHRED's Tropic Thunder which features 18% or more THC.
____________________________________________
3 CANNABIS PURCHASE DRIVERS RESEARCH REPORT, June 2020
REC 2.0
Cannabis-Infused Chocolates
At the end of July 2020, the Company announced the launch of Trailblazer SNAX, a value-priced, cannabis-infused chocolate bar which is made with premium quality ingredients including cocoa butter, all-natural flavors and pure distillate, while remaining an affordable cannabis-infused option. It is available in both mint and mocha flavours at 42g with 10mg of THC. In early March 2021, the Company announced it had recently launched Trailblazer SNAX in milk chocolate flavour as well. Organigram's investment in state-of-the art chocolate equipment and manufacturing processes means that each of the five sections of the Trailblazer SNAX bar are filled separately, allowing for higher accuracy of infusion.
The Company's chocolate portfolio also consists of Edison Bytes truffles which are available in both milk and dark chocolate formulations. These products are available as single chocolates containing 10 mg of THC each or sets of two truffles containing 5 mg each.
The Company expects to introduce further Edison Bytes products in the following quarters.
Vape Portfolio
In December 2020, Organigram launched Trailblazer Spark, Flicker and Glow 510-thread Torch vape cartridges in a new 1g format which extended Organigram's line up to a suite of trial-size 0.5 g and full-size 1 g cartridges for the 510 vaporizer. Trailblazer Torch offers customers 510 cartridges, high-quality CO2 extract and three unique terpene-infused flavours.
In addition to the Trailblazer Torch value-segment offerings, the Company's vape portfolio also includes Edison + PAX ERA® distillate cartridges.
Organigram expects to launch new vape products in Q3 Fiscal 2021 with higher THC concentrations including a new Edison + Feather disposable vape pen at a competitive price point as well as a 1g Edison cartridge for the 510 vaporizer, both of which will be based on the Company's popular Limelight strain.
Dissolvable Powdered Beverage
At the end of November 2020, the Company launched Edison RE:MIX dissolvable cannabis powder. The product has listings in eight provinces with the remaining two provinces expected in the near term.
As previously announced, Organigram's researchers developed a proprietary nano-emulsification technology that generates nano-droplets which are very small and uniform; this provides improved absorption compared to traditional solid edibles and beverages, potentially allowing for a more reliable and controlled experience.
With traditional edibles, beverages, and ingestible oil-based extracts, the body spends significant time breaking down fat soluble cannabinoid particles which are then absorbed and metabolized in the body before the effects are felt. This lengthy process can result in accidental overconsumption and undesirable experiences.
The nanoemulsion technology is also anticipated to have increased stability to temperature variations, mechanical disturbance, salinity, pH, and sweeteners. The powdered formulation holds the potential to offer consumers a measured dose of cannabinoids which they can then add to liquid, such as a beverage of their choice, while also offering the discretion, portability and shelf life expected of a dried powder formulation.
Edison RE:MIX is available in three formats: two sachets with 5 mg THC per sachet; two sachets with 5:5 mg THC:CBD per sachet; and five sachets with 10 mg CBD per sachet.
RESEARCH AND PRODUCT DEVELOPMENT
Organigram continues to focus on innovation and research and product development. Examples of this hallmark of the Company include its nanoemulsification technology (described above) as well as the Company's investment in biosynthesis through Hyasynth (see Hyasynth section of this MD&A) and most significantly, its recent March 11, 2021 announcement of the Product Development Collaboration with BAT and the strategic investment of approximately $221 million in Organigram by a subsidiary of BAT for 19.9% equity interest on a nondiluted basis. The Company's management believes the cannabis industry is still in the nascent stages of product development and that product innovation backed by core fundamental R&D is necessary to establish a long-term competitive advantage in the cannabis industry. The strategic collaboration with BAT strengthens Organigram's ability to deliver innovative, differentiated products that appeal to adult consumers. The R&D laboratory at EIC's Winnipeg facility, coupled with EIC's research license, will also allow Organigram to position itself at the forefront of the Cannabis 2.0 product categories, continuously innovating new products and formulations.
Organigram Inc. and BAT entered into the PDC Agreement pursuant to which a "Center of Excellence" (or "CoE") is currently being established to focus on developing the next generation of cannabis products with an initial focus on CBD. The CoE will be located at the Moncton Campus, which holds the Health Canada licenses required to conduct research R&D activities with cannabis products. Both companies will contribute scientists, researchers, and product developers to the CoE which is governed and supervised by a steering committee consisting of an equal number of senior members from both companies. Under the terms of the PDC Agreement, both Organigram and BAT have access to certain of each other's intellectual property ("IP") and, subject to certain limitations, have the right to independently, globally commercialize the products, technologies and IP created by the CoE pursuant to the PDC Agreement.
Pursuant to the terms of the PDC Agreement, approximately $30 million of BAT's investment in Organigram has been reserved for Organigram's portion of its funding obligations under a mutually agreed initial budget. Costs relating to the CoE will be funded equally by Organigram and BAT. Currently, the CoE is hiring staff as part of its ramp up.
Per the PDC Agreement, Organigram and BAT have agreed to jointly develop cannabis vapour products, cannabis oral products and any other products, IP or technologies the parties mutually agree to develop. BAT will own all IP developed under this collaboration and will grant to Organigram a royalty-free, perpetual, global licence to all such IP. Each party has also agreed to grant to the other a non-exclusive, perpetual and irrevocable license to certain existing IP of such party and its affiliates for purposes of conducting the development activities and exploiting the products, technologies and IP created by the CoE per the PDC Agreement, subject to certain restrictions.
OUTLOOK
Organigram remains positive on the cannabis market both in Canada and internationally. The most recent data available from Statistics Canada indicates that total Canadian adult-use recreational market sales reached $282 million in January 2021 which represents an annualized run rate of approximately $3.4 billion as compared to December 2020 sales of $298 million for an annualized run rate of about $3.6 billion. January 2021 adult-use recreational retail sales declined from December 2020 as a result of typical post-holiday season retail trends as well as tighter measures on cannabis physical retail traffic as a result of COVID-19. Statistics Canada sales data is not yet available for February and March 2021, but retail sales appeared to have rebounded in March according to Hifyre, a leading digital retail sales platform which tracks and forecasts retail sales. Hifyre estimates March retail sales reached an all-time high of $305 million nationally, implying an annualized run rate of $3.7 billion.
The Company believes there are a few factors creating tailwinds to further industry growth. First, the legalization in October of 2019 of Rec 2.0 products has attracted consumers who were not interested in smoking or vaporizing dried flower (including pre-rolls). New categories such as vape pens, edibles (soft chews, chocolates), beverages and other ingestible products have significantly expanded the addressable market and proliferation of SKUs continues in these categories offering consumers a wider range of product formulations, flavours and price points. Second, the number of brick-and-mortar retail stores has increased significantly, particularly in Ontario which is expected to have 1,000 retail stores by the end of the summer. Third, the industry as a whole has made a concerted effort to match or beat illicit market pricing - particularly on dried flower - which has helped accelerate the conversion of consumers from illicit to legal consumption.
Notwithstanding the above, the cannabis industry in Canada remains highly competitive and generally oversupplied versus the current market demand considering both regulated Licensed Producers and the still largely unfettered operations of the illicit market including many online delivery platforms. In early July 2020, the Company announced it had reduced its workforce by 25% in order to better align its production capacity to prevailing market conditions. After two years of adult-use recreational legalization in Canada, consumer trends and preferences have continued to solidify, including significant growth in the large format value segment, a desire for higher THC potency particularly in dried flower as well as a penchant for newness including new genetic strains and novel products. Organigram began a product portfolio revitalization in mid-calendar 2020 to address these consumer trends and preferences in order to grow sales and capture market share.
At the same time, the number of retail stores in Canada began to grow meaningfully for the first time since legalization. In December 2020, Ontario's cannabis retail regulator increased the pace of authorizations from 40 to 80 per month with a target of issuing 20 per week and again in February 2021, the regulator increased the number of store authorizations from 80 to up to 120 stores per month. Since July 2020, the number of retail stores in Canada's 10 provinces grew by 87% to about 1,794 retail stores driven by growth in Ontario of 468% to about 579 cannabis retail stores, currently.
With a leaner workforce, the Company continued to operate at a reduced production, cultivation, processing and packaging capacity during the quarter. At certain times, this contributed to delays in the product launches for its portfolio revitalization and hindered consistent order fulfillment, particularly for high velocity or fast-moving items. The Company believes this resulted in some meaningful missed revenue opportunities in Q2 Fiscal 2021.
With increased demand from substantial retail store growth in play as well as demand for the Company's new products, management is evaluating and improving its processes and supply chain and decided to ramp up staffing. As expected and indicated in the Company's Q1 Fiscal 2021 disclosure, the benefit from the ramp-up in staffing and increased cultivation production did not start having an impact until Q3 Fiscal 2021. Organigram expects higher net revenue in Q3 Fiscal 2021 compared to Q2 Fiscal 2021 due to improved demand fulfillment with increased staffing. Further, a number of the Company's new products have just recently gone into market with others still to come such that the Company believes it will still take time for the new products to reach their full potential and gain market share to drive meaningful sales growth.
As noted in the COVID-19 Corporate Action Plan section in this MD&A, the Moncton Campus facility was shut down twice during the quarter for deep cleaning after certain employees tested positive for COVID-19 and a significant number of employees had to isolate. The lost production time resulted in missed revenue opportunities, as the Company was unable to fulfill certain demand. Although the Company expects higher net revenue in Q3 Fiscal 2021 due to greater fulfilment rates with increased cultivation and packaging staff, there is a risk that net revenue could be negatively impacted if positive cases are identified in the future and the Company needs to take similar measures. In addition, the COVID-19 restrictions for retail stores, particularly in the most populous province of Ontario, could suppress demand and negatively impact net revenue in Q3 Fiscal 2021. For most of March 2021, the retail stores in Ontario were operating under the "grey zone" which restricted capacity to 25%. As of April 8, 2021, Ontario cannabis retail stores have been ordered to close to foot traffic and only offer click and collect for a least a month due to the most recent state of emergency declared in the province.
The Company intends to leverage its cultivation facility which it believes can provide a sustainable competitive advantage over its peers as a result of having over 100 three-tiered cultivation rooms each with the ability to deliver bespoke growing environmental conditions (lighting, humidity, fertigation, plant density) tailored individually to a wide variety of genetics. With an improved genetics portfolio (including some genetics which are not widely sold in the legal market) and a higher average THC being grown than the previous year, the Company believes it is well positioned to take advantage of the dried flower and pre-roll categories which collectively represent approximately 73%4 of the Canadian legal market currently.
Opportunities to scale up new genetics require a patient and deliberate process where cultivation protocols are trialed for each cultivar and adjusted through multiple grows before full roll-out to multiple rooms in the facility. The Company has successfully launched new genetics over the past 18 months including high THC Edison Limelight (Ultra Sour) which is now the Company's best-selling strain. Edison Gorilla Grapefruit 4, Ninja Fruit and Chemdog were launched in the late summer and most recently the Company launched Edison Ice Cream Cake (I.C.C.), Slurricane and Black Cherry Punch. These genetics help provide deep bench strength to the Edison portfolio across sativas, hybrids and indicas. Organigram's commitment to invest to expand into new genetics continues and the Company expects to launch new high THC genetics in Q3 Fiscal 2021. This freshness to the flower portfolio bringing cultivars with unique terpene qualities (for example Germacrene B found in Slurricane and I.C.C.) will help Edison fulfill its brand promise of exploration, creation and innovation.
The Company's decision in the spring and summer of 2020 to reduce its cultivation and production throughput and therefore its workforce was based on a series of assumptions which have since evolved. At the time, many of the new genetics were not available for launch and the supply and demand dynamics of the cultivation landscape in Canada looked untenable with many of the larger Licensed Producers producing volumes well in excess of their actual sales. The industry has seen significant public disclosure suggesting that cultivation output has been reduced at some of these larger Licensed Producers including shuttering of entire facilities in certain instances. In addition, the impact of COVID-19 on overall cannabis sales was not predictable, including uncertainty as to whether retail stores would remain open and whether click and collect, curbside pick-up and delivery would be allowed. Ontario's retail store approval roll-out was also less than fully predictable. Organigram is more confident in moving forward with increased cultivation and production volumes as its brand portfolio is more developed with value brands such as Trailblazer, Buds and SHRED as well as a more diversified, refreshed and higher THC Edison portfolio as previously discussed.
_________________________________
4 Source: The Cannabis Quarterly - ATB Capital Markets Inc. January 6, 2021
In addition to Rec 1.0 offerings, Organigram expects to be in a position to generate more revenue growth from the production of soft chews or gummies and other confectionary products with the specialized equipment in the Winnipeg Facility under the direction of EIC leadership who bring significant expertise in confectionary manufacturing. The Company is targeting first sales of EIC manufactured soft chews in Q4 Fiscal 2021 subject to certain achievements including, but not limited to, the timing of receipt of, and commissioning of, certain ancillary equipment, completion of quality assurance documentation, the hiring of requisite staff and obtaining product listings from provincial boards.
A negative non-cash adjustment to cost of sales for unabsorbed fixed overhead costs in Q2 Fiscal 2021 is anticipated to persist as a result of the Company's plans to cultivate less than its cultivation capacity. However, the magnitude of the charge is expected to continue to decline in Q3 Fiscal 2021 from Q2 Fiscal 2021 as the Company begins to ramp up cultivation. As indicated in previous quarters, some production inefficiencies are anticipated to persist in the near to medium term and impact gross margins while Organigram continues to launch new products and optimizes production and staffing.
As a result of optimizing the density of plants per room and decreasing the time spent in vegetation, the average yield per plant increased in Q2 Fiscal 2021 from Q1 Fiscal 2021, which resulted in a lower average cost of cultivation per gram. This lower cultivation cost results in lower cost inventory (compared to Q1 Fiscal 2021) such that when this inventory is sold starting in Q3 Fiscal 2021, it will positively impact gross margins. The overall level of Q3 Fiscal 2021 adjusted gross margins in versus Q2 Fiscal 2021 adjusted gross margins will also depend on other factors including, but not limited to, product category and brand sales mix.
In addition, the Company has identified a number of opportunities which it believes have the potential to further improve adjusted gross margins over time:
• The Company expects to gain economies of scale and efficiencies as it continues to scale up cultivation levels
• The recent launches of new higher margin dried flower strains under the Edison and Indi brands with more to come in the near term have the potential to positively impact gross margins over time as these products gain traction in the market and comprise a greater proportion of the Company's overall revenue.
• International sales have historically attracted higher margins and are expected to comprise a greater proportion of the Company's revenues once the Company resumes shipments to Canndoc (currently expected in Q4 Fiscal 2021 - see International section below).
• The Company is launching more multi-pack pre-rolls and 1g vape cartridges and these higher volume SKUs attract higher margins.
• The Company continues to invest in automation to drive cost efficiencies and reduce dependence on manual labour. For example, the new pre-roll machine was commissioned and began operating in March 2021, which has significantly reduced the reliance on manual labour.
• As a result of a packaging task force project, a number of cost reduction opportunities have been identified for implementation starting in Q4 Fiscal 2021.
Lastly, Q3 Fiscal 2021 SG&A is expected to be higher than Q2 Fiscal 2021 largely due to increasing staffing related to the BAT and EIC transactions.
Outside of Canada, the Company serves international markets (including Israel and Australia) from Canada via export permits and is looking to augment sales channels internationally over time. In early Q1 Fiscal 2021, the Israeli Ministry of Health amended its quality standards for imported medical cannabis. The Company is seeking Good Agricultural Practice certification by the CUMCS to continue its shipments to Israel and is making progress. Subject to successful completion of a required inspection that is likely to be conducted remotely, the Company currently expects to be certified by the CUMCS as early as the end of Q3 Fiscal 2021. Shipments to Canndoc, which are expected to resume in Q4 Fiscal 2021, are also contingent upon regulatory approval from Health Canada, including obtaining export permits, and the availability of the desired product mix from time to time. Recent political changes and cannabis election ballot initiatives for both medical and recreational use in the United States suggest that the potential movements to U.S. federal legalization of cannabis (THC) has increased momentum but the timing and outcome remains difficult to predict. As the Company continues to monitor and develop a potential U.S. THC strategy, it continues to evaluate CBD entry opportunities in the United States.
With the significant capital injection from BAT and the product development collaboration, Organigram is well positioned to expand into the U.S. and further international markets at the appropriate time and subject to applicable law. Under the PDC Agreement, the Company is granted a worldwide, royalty-free, sub-licensable, perpetual license to exploit IP developed under the PDC in any field. This license which is non-exclusive outside of Canada and sole in Canada will also enhance Organigram's ability to enter markets outside of Canada, including through sublicensing arrangements with established operators.
MEDICAL MARKET
Organigram's sales in the medical market in Q2 Fiscal 2021 decreased slightly from Q2 Fiscal 2020 primarily due to lower sales volumes on flower and oil as a result of a decrease in the number patients, which was partly a result of patients having difficulties meeting with physicians due to COVID-19. The Company continues to be focused on ensuring there is no disruption in product availability for its patients.
On August 18, 2020, the Company announced its partnership with Medical Cannabis by Shoppers Inc. and TruTrace Technologies Inc. in an effort to track source and genetics of cannabis used by medical patients in order to provide real-time information about the composition of each cannabis product used by Medical Cannabis by Shoppers customers.
REGISTERED PATIENTS
The Company quantifies the number of patients as those with an active prescription registration. The Company's active patient count was 11,658 at the end of Q2 Fiscal 2021 as compared to 16,781 at the end of Q2 Fiscal 2020.
INTERNATIONAL CANNABIS & CBD MARKETS
The Company continued to monitor its investments during Q2 Fiscal 2021.
ALPHA-CANNABIS GERMANY
On October 10, 2018, the Company, through a wholly-owned subsidiary, executed an investment agreement with alpha-cannabis® Pharma GmbH ("Alpha-Cannabis Germany" or "ACG"), located in Stadthagen, Germany, pursuant to which the Company acquired 8,333 common shares of ACG, representing a 25% interest in the aggregate issued and outstanding capital of ACG, on a fully diluted basis, for an aggregate investment of €1,625,000 (approximately $2.44 million) plus an additional amount of up to €875,000 (approximately $1.35 million) payable to ACG by way of issuance of Common Shares of the Company upon achievement of certain milestones.
Established in 2016, ACG is a privately held company that is strategically positioned to serve the German medical cannabis market. With a team of highly experienced and reputable specialists from the pharmaceutical industry with scientific and business backgrounds, ACG is focused on the development, production and marketing of cannabis-based active pharmaceutical ingredients and pharmaceuticals.
The Company intends to provide ACG with dried cannabis flower as well as sweet leaf for conversion into extracts for the burgeoning German medical cannabis market. Further, the parties also entered into an agreement whereby the Company has an option to purchase pure synthetic CBD isolate from Alpha-Cannabis Germany.
Organigram and ACG jointly submitted a tender for domestic cultivation in Germany in Q1 Fiscal 2019. In April 2019, the Company and ACG learned they were not awarded any lots for domestic cannabis production by Germany's Federal Institute for Drugs and Medical Devices. The Company believes another tender process is likely in the future. With further improvements to ACG facilities underway as well as additional licensing expected, Organigram believes ACG and itself will be better positioned in the next tender process for domestic cultivation.
During Q3 Fiscal 2020, the Company delivered its first shipment of dried flower to ACG for testing purposes as ACG is seeking to obtain certification for EU-GMP certified cannabis oil extracted from the Company's non-certified dried flower.
EVIANA
On October 2, 2018, the Company participated in the debenture offering of Eviana Health Corporation ("Eviana") by way of private placement. Eviana is a Canadian Securities Exchange ("CSE") listed company that was established with the aim of delivering customized consumer health care products using natural hemp strains of cannabis sativa for cannabinoid-based topical creams and products. The Company's investment is in the form of convertible debentures and share purchase warrants, which together provide a potential ownership interest of up to 21.4%, which is capped at 19.9% based on certain contractual obligations. In addition to this ownership interest, the Company also considered various qualitative factors in arriving at the determination that significant influence exists, including representation rights on Eviana's board of directors, and thereby concluding that the equity method of accounting is appropriate.
The convertible debentures have a face value of $5,000, bear interest at 10% per annum, are non-redeemable, and matured on October 2, 2020. The convertible debentures are convertible at the Company's option at any time at a price of $1.15 per share, or into 4,347,826 common shares. Conversion of the debentures may be forced by Eviana in the event that the volume weighted average price of the common shares of Eviana for ten consecutive days is greater than $2.15, subject to a minimum volume of 100,000 shares in each of those 10 days.
The share purchase warrants were acquired for no additional consideration, concurrent with the debenture offering, were transferrable, and were exercisable until October 2, 2020. 2,500 share purchase warrant units were acquired, each of which were convertible into 870 common shares per unit, or 2,175,000 common shares in aggregate, at an exercise price of $1.30 per share. These share purchase warrants were not exercised and have expired as of the date of this MD&A.
Concurrent with the Company's investment in Eviana, the parties entered into a CBD oil supply agreement, whereby the Company has the right, but not obligation, to purchase up to 25% of Eviana's annual CBD oil at 95% of the agreed raw CBD oil wholesale market price for a period of five years from the date on which the CBD oil is first made commercially available by Eviana for wholesale.
On October 28, 2019, Eviana provided a default announcement in accordance with National Policy - 12-203 Management Cease Trade Orders ("NP 12-203"). Eviana made an application to the British Columbia Securities Commission, as its principal regulator, for a management cease trade order under NP 12-203 in respect of an anticipated default regarding its annual filings. On November 1, 2019, a cease trade order (CTO) was issued by the British Columbia Securities Commission and the Ontario Securities Commission. On November 5, 2019, Eviana was suspended from the CSE in accordance with CSE Policy 3 which is considered a regulatory halt as defined in National Instrument 23-101 - Trading Rules.
At February 29, 2020, the Company identified indicators of impairment with respect to its investment in Eviana. The Company determined the recoverable amount of Eviana to approximate $1,400 based on the higher of fair value less costs to sell ("FVLCS") and value-in-use ("VIU"). An impairment loss of $1,600 has been included in the statements of operations and comprehensive loss.
At May 31, 2020, the Company identified additional indicators of impairment with respect to its investment in Eviana. The Company determined the recoverable amount of Eviana to approximate $nil based on the higher of FVLCS and VIU and recorded an impairment loss of $1,400 for the three months ended May 31, 2020. A cumulative impairment loss of $3,000 has been included in the statements of operations and comprehensive loss for the year ended August 31, 2020 and the Company continues to carry this investment at a balance of $nil.
On June 18, 2020, the Company served Eviana with a notice of default and demand letter with respect to the non-payment of interest relating to its convertible debentures as well as other applicable events of default under the debenture agreement. As of the date of this MD&A, the Company has not yet received any of its interest payments since December 31, 2019 on the Eviana convertible debentures.
OTHER STRATEGIC INVESTMENTS AND DEVELOPMENTS
The Company remains committed to the development and acquisition of cannabis or hemp related businesses and production assets in Canada or abroad (subject to compliance with applicable law), intellectual properties, technologies or other assets that are synergistic to the Company's Canadian and international strategies.
HYASYNTH
On September 12, 2018, the Company entered into a strategic investment to purchase an aggregate of $10,000 convertible secured debentures (the "Hyasynth Debentures") of Hyasynth Biologicals Inc. ("Hyasynth"), a biotechnology company based in Montreal and leader in the field of cannabinoid science and biosynthesis, in three separate tranches. Organigram purchased $5,000 in secured convertible 8% Hyasynth Debentures on September 12, 2018 and advanced an additional $2,500 on October 23, 2020 as a result of Hyasynth's achievement of the contractual production-related milestone for the second tranche ("Tranche 2"). The Company has agreed to purchase an additional $2,500 of Hyasynth Debentures in a final tranche based on Hyasynth attaining certain production milestones and the satisfaction of certain other customary closing conditions.
Hyasynth has patent-pending enzymes, yeast cells and processes that make it possible to produce phytocannabinoids and phytocannabinoid analogues in genetically modified strains of yeast. These proprietary enzymes and yeast strains have allowed Hyasynth to produce CBG, CBD and THC for novel and specialized products such as vaporizable cannabis products and cannabis infused beverages for a fraction of the cost of traditional plant-based production. The Company anticipates that its investment in Hyasynth has the potential to provide the Company with access to what it expects to be the future of cannabinoid production. The Company expects that cost-effectiveness and scalability will be necessary to meet the needs of both the Canadian and global cannabis markets.
In addition to the investment, Organigram has the right to purchase potentially all of Hyasynth's cannabinoid or cannabinoid-related production at a 10% discount to the wholesale market price for a period of ten years. In addition to the major cannabinoids such as CBD and THC, Hyasynth is also pursuing the production and scale-up of minor cannabinoids found only in limited quantities in the cannabis plant. One subset of these minor cannabinoids includes propyl-cannabinoids such as cannabigerivarin (CBGV) and tetrahydrocannabivarin (THCV). While the Company expects that there will always be a need for premium indoor grown cannabis flowers, working with Hyasynth offers the potential to more quickly respond to market demand for cannabinoid-based recreational and medical cannabis products.
On October 23, 2020, the Company advanced an additional $2,500 to Hyasynth by way of convertible debentures as a result of Hyasynth's achievement of the contractual production-related milestone for Tranche 2 of the convertible debentures. This brings the Company's total face value of convertible debentures investment in Hyasynth to $7,500, which provides the Company with a potential ownership interest of up to 46.7% on a fully diluted basis.
SUPPLY AGREEMENT FOR HEMP FOR CBD EXTRACTION
On January 18, 2019, the Company entered into an agreement (the "Supply Agreement") with 703454 N.B. Inc. (carrying on business as 1812 Hemp) ("1812 Hemp"), a New Brunswick based industrial hemp research company to secure supply of hemp.
Pursuant to the Supply Agreement, the Company receives a 25% discount on all dried product purchased from 1812 Hemp and has continued access to future 1812 harvests until December 16, 2023, with the option to extend for an additional five-year period. The Company made a payment of $1,500 to 1812 Hemp in connection with the Supply Agreement. Organigram acquired access to approximately 6,000 kg of dried hemp flower harvested in the fall of 2018, which it mostly acquired in Q3 Fiscal 2019.
In addition, pursuant to the Supply Agreement, Organigram has a right-of-first refusal on future procurement of hemp from 1812 Hemp.
On July 26, 2019, the Company entered into an advance payment and support agreement ("Payment Agreement") with 1812 Hemp. Under the terms of the Payment Agreement, the Company advanced $3.0 million to 1812 Hemp in the form of a secured loan. These amounts may be applied against future purchases of hemp under the Supply Agreement. The aggregate amount of advances outstanding under the Payment Agreement as of January 1, 2020 will accrue interest of 9.0% per annum, calculated monthly, until the entire balance of advances is paid.
During the three months ended August 31, 2020, management became aware that 1812 Hemp was facing financial hardship due to a lack of customer demand and a change in market conditions, and as a result had significantly scaled back operations. Separately, the Company's forecasted hemp purchases have decreased significantly as a result of slower than expected progression in Canadian hemp and CBD regulations. Thus, as a result of the aforementioned challenges, management impaired the Supply Agreement intangible asset to its recoverable amount, which was estimated to be $nil, by recording an impairment charge of $1,303 at August 31, 2020.
At February 28, 2021, $2,229 in principal was outstanding under the Payment Agreement, and the Company demanded repayment of the entire amount owing by 1812 Hemp to the Company pursuant to the terms of the Payment Agreement. At February 28, 2021, management reassessed 1812 Hemp's liquidation value and as a result an expected credit loss of $500 was recorded against the loan receivable, bringing the carrying value of the loan receivable to $1,729 at February 28, 2021.
USE OF PROCEEDS OF PRIOR FINANCINGS
The following table sets out the Company's previously disclosed expected uses of prior financings as set out in the prospectus filings of prior financings, which include: i) the proceeds of the offering of the December 2017 units; and ii) the proceeds of the offering of debentures in January 2018.
|
| ESTIMATED FUNDS |
| FUNDS THE |
| ACTUAL |
| EXPECTED |
| EXPECTED |
Moncton Campus |
| $95.0 million |
| $nil |
| $123.8 million |
| December 2019 |
| December 20193 |
Strategic international |
| $5.4 million |
| to be assessed |
| $7.6 million2 |
| Ongoing |
| Ongoing |
Strategic domestic |
| Up to $43.1 million |
| to be assessed |
| $7.6 million |
| Ongoing |
| Ongoing |
Hemp market presence |
| Up to $10.8 million |
| to be assessed |
| $4.5 million |
| Ongoing |
| Ongoing |
(1) Comprised of December 2017 and January 2018 financings
(2) Excludes contingent consideration that is to be settled in Common Shares of the Company
(3) As previously disclosed, the Company had previously decided to indefinitely cease construction completion of Phase 4C, originally scheduled for completion by the end of calendar 2019. The Company completed Phase 4A and 4B prior to December 2019.
As set out in the table above, the majority of the funds raised were allocated for specific purposes, particularly related to the expansion of the Moncton Campus and strategic opportunities (refer to "International Cannabis & CBD Markets" sections in this MD&A). At this stage, potential strategic acquisitions are at various stages of progression and the allocation of funds may change depending on the strategic priorities of the Company and management's assessment of the competitive landscape.
During the year ended August 31, 2020, the Company raised net proceeds of $52.9 million and $47.1 million under its December 2019 and April 2020 at-the-market equity offerings ("ATM Programs"), respectively. The Company has used, and intends to continue to use, the net proceeds from the ATM Programs to fund capital projects, for general corporate purposes, and to repay indebtedness.
On November 12, 2020, the Company closed an underwritten public offering of units for total gross proceeds of $69.1 million. The Company used $55.0 million of the proceeds to repay a portion of the Company's term loan on December 1, 2020 and intends to use the balance of the net proceeds for working capital and other general corporate purposes. Please refer to the "Balance Sheet, Liquidity, and Capital Resources" section of the MD&A for further information.
FINANCIAL REVIEW AND DISCUSSION OF OPERATIONS
CAUTIONARY NOTE REGARDING NON-IFRS FINANCIAL MEASURES
The Company uses certain non-IFRS performance measures such as Adjusted EBITDA (excluding fair value adjustment to inventory and biological assets) and Adjusted Gross Margin in its MD&A or other public documents, which are not measures calculated in accordance with IFRS and have limitations as analytical tools. These performance measures have no prescribed meaning under IFRS and therefore amounts presented may not be comparable to similar data presented by other companies. The data is intended to provide additional information and should not be considered in isolation or as a substitute for measures of performance such as net income or other data prepared in accordance with IFRS. See the cautionary statement in the "Introduction" section at the beginning of this MD&A.
FINANCIAL HIGHLIGHTS
Below is the quarter-over-quarter analysis of the changes that occurred for the three months ended February 28, 2021 and February 29, 2020. Commentary is provided in the pages that follow.
| Q2-2021 | Q2-2020 | $ CHANGE | % CHANGE | |||||||||
| Financial Results | ||||||||||||
| Gross revenue | $ | 19,292 | $ | 27,309 | $ | (8,017 | ) | (29)% | ||||
| Net revenue | $ | 14,643 | $ | 23,221 | $ | (8,578 | ) | (37)% | ||||
| Cost of sales | $ | 31,146 | $ | 15,811 | $ | 15,335 | 97% | |||||
| Gross margin before fair value adjustments | $ | (16,503 | ) | $ | 7,410 | $ | (23,913 | ) | (323)% | |||
| Gross margin % before fair value adjustments | (113)% | 32% | (145)% | (453)% | ||||||||
| Fair value adjustments to biological assets, inventories sold, and other charges | $ | (692 | ) | $ | 3,878 | $ | (4,570 | ) | (118)% | |||
| Gross margin | $ | (17,195 | ) | $ | 11,288 | $ | (28,483 | ) | (252)% | |||
| Operating expenses | $ | 12,077 | $ | 15,314 | $ | (3,237 | ) | (21)% | ||||
| Loss from operations | $ | (29,272 | ) | $ | (4,026 | ) | $ | (25,246 | ) | 627% | ||
| Other expenses | $ | 37,117 | $ | 2,807 | $ | 34,310 | 1,222% | |||||
| Net loss | $ | (66,389 | ) | $ | (6,833 | ) | $ | (59,556 | ) | 872% | ||
| Net loss per common share, basic | $ | (0.285 | ) | $ | (0.041 | ) | $ | (0.244 | ) | 595% | ||
| Net loss per common share, diluted | $ | (0.285 | ) | $ | (0.041 | ) | $ | (0.244 | ) | 595% | ||
| Net cash used in operating activities | $ | (10,430 | ) | $ | (10,894 | ) | $ | 464 | (4)% | |||
| Adjusted Gross Margin1 | $ | (680 | ) | $ | 8,449 | $ | (9,129 | ) | (108)% | |||
| Adjusted Gross Margin % 1 | (5)% | 36% | (41)% | (113)% | ||||||||
| Adjusted EBITDA1 | $ | (8,642 | ) | $ | (59 | ) | $ | (8,583 | ) | 14,547% | ||
| Financial Position | ||||||||||||
| Working capital | $ | 112,398 | $ | 96,752 | $ | 15,646 | 16% | |||||
| Inventory and biological assets | $ | 43,374 | $ | 140,831 | $ | (97,457 | ) | (69)% | ||||
| Total assets | $ | 392,764 | $ | 502,276 | $ | (109,512 | ) | (22)% | ||||
| Non-current financial liabilities | $ | 105,258 | $ | 2,072 | $ | 103,186 | 4,980% |
Note 1: Non-IFRS measures that have been defined and reconciled within their respective sections of the MD&A.
NET REVENUE
For the three months ended February 28, 2021, the Company reported $14,643 in net revenue. Of this amount $11,988 (82%) was sold to the adult-use recreational market, $2,061 (14%) to the medical market, $520 (3%) to the wholesale market and other revenues, and the balance of $74 (1%) to the international market. Q2 Fiscal 2021 net revenue decreased 37%, or $8,578, from the prior year comparative period's net revenue of $23,221, primarily due to a decrease of $4,359 in wholesale and international revenue to Licensed Producers and a lower ASP compared to the prior year comparative period. The higher wholesale revenues during Q2 Fiscal 2020 were opportunistic in nature, and primarily consisted of sales to a single Licensed Producer. These wholesale revenues are not necessarily expected to recur in future quarters at those levels, or at all. Revenue from the adult-use recreational market decreased $3,022, or 20% due to a decrease in volumes, partly as a result of Q2 Fiscal 2020 being the first quarter in which Rec 2.0 products were sold into the pipeline, and a lower ASP from increased competition and a higher proportion of value-oriented products being sold during the period.
Q2 Fiscal 2021 net revenue was also impacted by missed sales opportunities as a result of the inability to fulfill certain product orders due to temporary shut-down of the Moncton Campus facility and isolation of certain staff after the identification of two positive COVID-19 cases (see "COVID-19 Corporate Action Plan" section of this MD&A for further detail).
Dried flower comprised 75% of net revenue in the quarter. The ASP of dried flower decreased to $2.99 per gram on a quarter-over-quarter basis compared to $4.56 per gram for Q2 Fiscal 2020, as both the Company and the Canadian cannabis industry experienced general price compression in the adult-use recreational and medical markets as these markets matured and the customer and product mix evolved to focus more on value offerings. Selling prices are prone to fluctuation and there may be further price compression if the market remains oversupplied. The Company is committed to refining its product mix as customer preferences evolve.
Sales volumes of dried flower in grams decreased 10% to 3,688 kg in Q2 Fiscal 2021 compared to 4,080 kg in the prior year comparative quarter, primarily as a result of the contribution of wholesale dried flower sales in the prior year (1,616 kg). After removing the impact of wholesale dried flower sales in the prior year, sales volumes of dried flower actually increased in the current quarter by 50%.
For the six months ended February 28, 2021, the Company recorded a decrease of 30% in net revenues to $33,974 from $48,374 for the six months ended February 29, 2020. Net revenue decreased on a year-to-date basis primarily due to a decrease in wholesale revenues of $14,314.
For the six months ended February 28, 2021, the ASP of dried flower decreased to $3.13 per gram compared to $4.48 per gram for the six months ended February 29, 2020 due to a shift towards value-oriented large format products and general price compression.
Sales volumes of dried flower in grams decreased 10% to 8,508 kg for the six months ended February 28, 2021 compared to
9,402 kg in the prior year comparative period, primarily as a result of the contribution of wholesale dried flower sales in the prior year (4,216 kg). After removing the impact of wholesale dried flower sales in the prior year, sales volumes of dried flower actually increased during the period by 64%.
REVENUE COMPOSITION
The Company's management reviews revenue composition by product category as follows for three months ended February 28, 2021 and February 29, 2020:
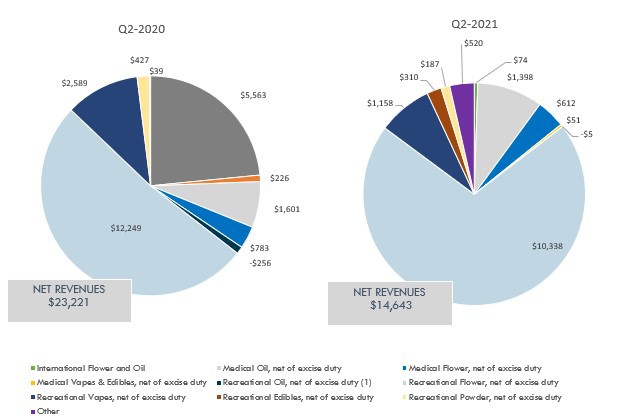
(1) Comprised primarily of sales returns and price allowance provisions for recreational oil.
COST OF SALES AND GROSS MARGIN
The gross margin for the three and six months ended February 28, 2021 was ($17,195) and ($33,869), respectively, compared to $11,288 and $22,481 for the prior year comparative periods. The decrease in gross margin year-over-year was primarily a result of: (i) higher cost of sales on higher cultivation and post-harvest costs; (ii) changes in the fair value of biological assets and inventories sold; (iii) inventory provisions and write-off of excess and unsaleable inventories as well as inventory write-downs to net realizable value ($13,549 and $16,675); (iv) unabsorbed overhead ($2,274 and $4,938) as a result of lower production volumes; (v) a lower ASP from increased competition and the ongoing evolution of the customer and product mix; and (vi) write-downs to net realizable value relating to the fair value component of inventories (fair value loss of $4,752 and $12,857).
Included in gross margin for the three and six months ended February 28, 2021 are ($692) and ($13,524), respectively (February 29, 2020 - $3,878 and $5,729) of fair value adjustments to biological assets, inventories sold, and other charges related to IFRS standard IAS 41 - Agriculture. The net decrease in fair value adjustments for the three and six months ended February 28, 2021 compared to the prior year is primarily due to a decrease in harvested plants and the fair value inputs resulting in a decrease in fair value of biological assets of $6,516 and $6,402, respectively (February 29, 2020 - $33,671 and $59,569). This was offset by a lower realization of the fair value increment for inventory sold of ($2,456) and ($7,069) (February 29, 2020 - ($9,403) and ($23,241)) and adjustments to the net realizable value of inventory of ($4,752) and ($12,857) (February 29, 2020 - ($20,390) and ($30,599)).
Cost of sales primarily consists of the following:
• Costs of sales of cannabis (dried flower, pre-rolls, and wholesale/international bulk flower), cannabis oil, vapes, chocolates, and other wholesale formats such as extract include the direct costs of materials and packaging, labour including any associated share-based compensation, and depreciation of manufacturing related items such as building and equipment related to the production of cannabis and derivatives sold. This includes cultivation costs (growing, harvesting, drying, and processing costs), extraction, vape filling, quality assurance and quality control, as well as packaging and labelling;
• Costs related to other products such as vaporizers and other accessories;
• Shipping expenses to deliver product to the customer;
• The production cost of late-stage biological assets that are disposed of, plants destroyed that do not meet the Company's quality assurance standards, provisions and write-downs for excess and unsaleable inventories and write-downs related to adjustments to net realizable value that reduce the carrying value of inventory below the original production or purchase cost, and other production overhead; and
• Unabsorbed fixed overhead charges, comprised of depreciation, insurance, and property taxes, resulting from the underutilization of cultivation and production capacity.
Illustrative Overview of Composition and Flow of Biological Assets, Inventories, and Cost of Sales

Notes:
1. The above illustration is for informational purposes only and should not be viewed as an exact representation of the actual flow of inputs and outputs. Certain items referenced above may not have a standard meaning under IFRS and therefore should be considered non-IFRS measures. Readers should refer to the notes of the August 31, 2020 year-end financial statements for the official accounting policies.
2. The majority of stock options expense related to the manufacturing and operations groups and most of the Moncton Campus. Depreciation is capitalized as part of cultivation and inventory production costs, however a certain amount of these unallocated amounts relating to underutilization of the facility are expensed directly to cost of sales.
3. Fair value adjustments are made to the cost basis of biological assets which collectively become the cost basis of inventories. Inventories are then carried at the lower of cost and net realizable value. When sold a portion of inventory is charged to cost of sales (actual costs) with the remainder (FV adjustments) to "Fair value changes to biological assets and changes in inventory sold" on statements of income.
4. Excise taxes are excluded from this diagram and are reflected as a netting adjustment against gross revenue to arrive at net revenue for presentation purposes in the statements of operations and comprehensive loss.
GROSS MARGIN BEFORE FAIR VALUE CHANGES TO BIOLOGICAL ASSETS AND INVENTORIES SOLD AND ADJUSTED GROSS MARGIN
The fair value adjustment to biological assets, inventories sold, and other charges is comprised of the non-cash fair value gains (losses) for inventories sold, growth of biological assets, and adjustments to net realizable value.
The increase in gross margin before fair value changes to biological assets and inventories in Q3 Fiscal 2019 was consistent with the Company's low cost of production and ability to sell most of its products at the medium to high end of the product categories. The decline in gross margin before fair value changes to biological assets and inventories sold in Q4 Fiscal 2019 is believed to be an anomaly resulting from an increase in production costs, a temporary decline in production yields during Q3 Fiscal 2019 that resulted in higher cost product being sold through in Q4 Fiscal 2019, year-end inventory adjustments, and write-downs of legacy packaging materials that have been replaced with new, more consumer-friendly packaging. During Q1 Fiscal 2020, the Company's gross margin before fair value changes to biological assets, inventories sold, and other charges was $9,342, which decreased in Q2 to Q4 Fiscal 2020 due to lower sales volumes and costs associated with the launch the new Rec 2.0 products, higher post-harvest costs, and inventory write-downs and provisions. The negative gross margin before fair value changes to biological assets, inventories sold, and other charges in Q1 2021 and Q2 2021 of ($3,842) and ($16,503) is primarily due to lower average selling prices, higher cultivation and post-harvest costs, inventory write-downs and provisions, and unabsorbed overhead as a result of lower production volumes.
Adjusted Gross Margin is a non-IFRS measure that the Company defines as net revenue less: (i) cost of sales, before the effects fair value changes to biological assets, inventories sold, and other charges; excluding (ii) write-offs and impairment of inventories and biological assets; (iii) write-downs to net realizable value; (iv) COVID-19 related charges; and (v) unabsorbed overhead relating to underutilization of the production facility, most of which is related to non-cash depreciation expense. Management believes this measure is useful and relevant as it more fairly represents the gross margin for the revenues generated in the period as it is based on the direct and indirect costs of production related to these revenues and excludes impairments and write-offs related to other inventories resulting from internal or external influences. See the cautionary statement regarding non-IFRS financial measures in the "Introduction" section at the beginning of this MD&A and the reconciliation to IFRS measures in the "Financial Results and Review of Operations" section of this MD&A. The most directly comparable measure to Adjusted Gross Margin calculated in accordance with IFRS is gross margin before fair value changes to biological assets and inventories sold.
Gross margin before fair value changes to biological assets and inventories sold and Adjusted Gross Margin
| Q3-F19 | Q4-F19 | Q1-F20 | Q2-F20 | Q3-F20 | Q4-F20 | Q1-F21 | Q2-F21 | |||||||||||||||||
| Net revenue | 24,750 | 16,290 | 25,153 | 23,221 | 18,021 | 20,400 | 19,331 | 14,643 | ||||||||||||||||
| Cost of sales before adjustments | 12,473 | 14,799 | 14,966 | 14,772 | 13,909 | 14,244 | 17,383 | 15,323 | ||||||||||||||||
| Adjusted Gross Margin | 12,277 | 1,491 | 10,187 | 8,449 | 4,112 | 6,156 | 1,948 | (680 | ) | |||||||||||||||
| Adjusted Gross Margin % | 50% | 9% | 41% | 36% | 23% | 30% | 10% | -5% | ||||||||||||||||
| Less: | ||||||||||||||||||||||||
| Write-offs and impairment of inventories and biological assets | - | 744 | 845 | 1,027 | 19,940 | 11,019 | 3,051 | 10,050 | ||||||||||||||||
| Write-downs to net realizable value | - | - | - | 12 | 2,661 | 80 | 75 | 3,499 | ||||||||||||||||
| COVID-19 related charges | - | - | - | - | 5,901 | 194 | - | - | ||||||||||||||||
| Unabsorbed overhead | - | - | - | - | 1,964 | 3,470 | 2,664 | 2,274 | ||||||||||||||||
| Gross margin before fair value adjustments | 12,277 | 747 | 9,342 | 7,410 | (26,354 | ) | (8,607 | ) | (3,842 | ) | (16,503 | ) | ||||||||||||
| Gross margin % (before fair value adjustments) | 50% | 5% | 37% | 32% | -146% | -42% | -20% | -113% | ||||||||||||||||
| Add/(Deduct): Fair value adjustments to biological assets, inventories sold, and other charges | (12,456 | ) | (11,806 | ) | 1,852 | 3,878 | (23,862 | ) | (20,149 | ) | (12,832 | ) | (692 | ) | ||||||||||
| Gross margin (1) | (179 | ) | (11,059 | ) | 11,194 | 11,288 | (50,216 | ) | (28,756 | ) | (16,674 | ) | (17,195 | ) | ||||||||||
| Gross margin % (1) | -1% | -68% | 45% | 49% | -279% | -141% | -86% | -117% |
Note 1: Gross margin reflects the IFRS measure per the Company's Interim Financial Statements.
GENERAL AND ADMINISTRATIVE
For the three months ended February 28, 2021, general and administrative expenses decreased to $7,990 compared to $8,537 in the prior year comparative period. The decrease mainly relates to lower professional fees and travel expenses, which was partly offset by increased employee costs resulting from more general and administrative full-time employees, general wage increases and cultivation-related research and development costs.
For the six months ended February 28, 2021, the Company incurred general and administrative expenses of $15,438 compared to $14,425 for the prior year comparative period. The increase year-over-year mainly relates to higher employee costs due to more general and administrative full-time employees, general wage increases and higher insurance costs as well as cultivation-related research and development costs.
SALES AND MARKETING
For the three months ended February 28, 2021, the Company incurred sales and marketing expenses of $3,141 compared to $5,481 for the three months ended February 29, 2020. The decrease in expenses in the current quarter was due to the reduction in expenses including client service and sales staff, educational materials, and trade investment, as well as lower advertising and promotion, which is primarily a function of the timing of new product launches and targeted promotional campaigns.
For the six months ended February 28, 2021, the Company incurred sales and marketing expenses from continuing operations of $6,813 compared to $9,011 for the prior year comparative period. The year-over-year decrease is related to the same factors noted above.
General and administrative and sales and marketing expenses, excluding non-cash share-based compensation ("SG&A"), were $11,131 for Q2 Fiscal 2021, a decrease from $14,018 in Q2 Fiscal 2020. As a percentage of net revenue, SG&A expenses increased to 76% in Q2 Fiscal 2021 from 60% in Q2 Fiscal 2020 due lower net revenue in the current quarter.
SHARE-BASED COMPENSATION
For the three and six months ended February 28, 2021, the Company recognized $946 and $1,365, respectively, in share-based compensation in relation to selling, general and administrative employees, compared to $1,296 and $2,917 for the prior year comparative period. The decrease in share-based compensation on a year-over-year basis is due to changes in the granting of equity incentive compensation to employees.
For the three months ended February 28, 2021, 735,000 options were granted to employees of the Company, valued at $985, compared to 920,000 options granted in the prior year comparative period, valued at $1,629. Included in the three months ended February 28, 2021, were 330,000 options granted to key management personnel compared to 250,000 options granted for the three months ended February 29, 2020. The decrease in share-based compensation expense year-over-year is primarily a result of fewer options having been granted during the current period due to a shift in equity compensation practices.
For the six months ended February 28, 2021, 735,000 options were granted, valued at $985, compared to 1,340,000 options granted in the prior year comparative period, valued at $2,716. Included in the six months ended February 28, 2021 were 330,000 options granted to key management personnel compared to 250,000 options granted for the six months ended February 29, 2020.
During the three and six months ended February 28, 2021, 411,599 and 411,599, respectively, restricted share units ("RSUs") were granted to employees (February 29, 2020 - nil and 218,370), of which 349,493 and 349,493 RSUs were issued to key management personnel, which includes members of the Board of Directors, compared to nil and 165,093 issued for the three and six months ended February 29, 2020.
During the three and six months ended February 28, 2021, 427,084 and 427,084, respectively, performance share units ("PSUs") were granted to employees (February 29, 2020 - nil and 142,187), of which 240,740 and 240,740 PSUs were issued to key management personnel compared to nil and 88,910 issued for the prior year comparative periods.
Share-based compensation represents a non-cash expense and was valued using the Black-Scholes valuation model for stock options and using the fair value of the shares on the date of the grant for RSUs. The fair value of PSUs was based on the Company's share price at the grant date, adjusted for an estimate of likelihood of achievement of the defined performance criteria.
FINANCING COSTS AND INVESTMENT INCOME
Financing costs are comprised of cash interest expense, the amortization of transaction costs, the amortization of discount of long-term debt outstanding during the period, and loan modification losses as described below. The decrease in financing costs for the three and six months ended February 28, 2021 to $800 and $2,388, respectively, from $1,966 and 2,830 in the prior year comparative period is mainly attributable to the lower term loan balance outstanding during Q2 Fiscal 2021 ($58,500 at February 28, 2021) a lower loan modification loss of $318 incurred during the three months ended November 30, 2020 compared to $831 incurred during the three months ended February 29, 2020.
On April 1, 2021, the Company repaid the $58.5 million outstanding balance under the facilities provided under its amended and restated credit agreement dated November 27, 2020 with Bank of Montreal and a syndicate of lenders.
Investment income of $131 and $247 was earned for the three and six months ended February 28, 2021, compared to $162 and $89 for the prior year comparative periods. The change in investment income was due to year-over-year changes in interest income, owing to the fluctuation in cash and the maturity of guaranteed investment certificates.
GOVERNMENT SUBSIDIES
On April 1, 2020, Department of Finance Canada announced the Canada Emergency Wage Subsidy, which subsidizes 75% of employee wages, retroactive to March 15, 2020, to Canadian employers whose business had been affected by COVID-19 to enable them to re-hire workers previously laid off as a result of pandemic, help prevent further job losses, and to better position companies to resume normal operations following the crisis. Under this program, the Company recognized a wage subsidy of $2,709 and $4,541 for three and six months ended February 28, 2021, respectively.
INVESTMENTS IN ASSOCIATES AND CONTINGENT CONSIDERATION
During Q1 Fiscal 2019, the Company made three strategic and international investments as described previously in this MD&A, which are being accounted for as investments in associates in the Company's financial statements. During the three and six months ended February 28, 2021, the Company's share of loss from these investments in associates was $344 and $586, respectively, compared to $294 and $550 in the prior year comparative period. Since these investments are effectively in the research and development or early phases of their operations, these losses are generally to be expected.
In connection with the Alpha-Cannabis Germany investment, the Company had committed to contingent consideration to be paid in the form of Common Shares of the Company upon the achievement of certain milestones by Alpha-Cannabis Germany. This contingent consideration liability is carried at fair value in the Company's statement of financial position. For the three and six months ended February 28, 2021, the Company recorded an unrealized loss of $154 and $190, respectively, on the revaluation of this liability compared to an unrealized gain of $193 and $571 in the prior year comparative periods. The loss is primarily attributable to the increase in the market price of the Common Shares during the period.
DERIVATIVE WARRANT LIABILITIES
On November 12, 2020, the Company closed an underwritten public offering of units of the Company (the "Units") for total gross proceeds of $69,144 (the "Offering"). The Company sold 37,375,000 Units at a price of $1.85 per Unit, including 4,875,000 Units sold pursuant to the full exercise of the over-allotment option granted to the underwriters of the Offering. The Offering was underwritten by a syndicate of underwriters led by Canaccord Genuity Corp. Each Unit consisted of one common share of the Company and one half of one common share purchase warrant of the Company (each full common share purchase warrant, a "Warrant"), therefore resulting in 18,687,500 Warrants being issued. Each Warrant is exercisable to acquire one common share of the Company (a "Warrant Share") for a period of three years following the closing date of the Offering (i.e. until November 12, 2023) at an exercise price of $2.50 per Warrant Share, subject to adjustment in certain events. The holders of the Warrants issued pursuant to the Offering may elect, if the Company does not have an effective registration statement under the U.S. Securities Act, or the prospectus contained therein is not available for the offer and sale of the Common Shares to the Warrant holder, in lieu of exercising the Warrants for cash, a cashless exercise option to receive Common Shares equal to the fair value of the gain implied by the Warrants at the time of exercise. The fair value is determined by multiplying the number of Warrants to be exercised by the weighted average market price less the exercise price with the difference being divided by the weighted average market price. If a Warrant holder exercises this option, there will be variability in the number of shares issued per Warrant.
In accordance with IFRS, a contract to issue a variable number of shares fails to meet the definition of equity and must instead be classified as a derivative liability and measured at fair value with changes in fair value recognized in the statements of operations and comprehensive loss at each period-end. The derivative warrant liabilities are expected to ultimately be converted into the Company's equity (common shares) when the Warrants are exercised or will be extinguished on the expiry of the outstanding warrants and will not result in the outlay of any cash by the Company.
At initial recognition on November 12, 2020, the Company recorded derivative warrant liabilities of $12,894 based on the estimated fair value of the Warrants at this date using the Black-Scholes option pricing model. Share issuance costs of $803 were recognized as share issue costs allocated to derivative warrant liabilities based on a pro-rata allocation of total issuance costs based on the relative fair value of the Warrants and the common shares issued as part of the unit offering.
During the three months ended February 28, 2021, certain holders exercised 1,698,200 warrants at $2.50 per share for gross proceeds of $4,246. These warrants had an estimated fair value of $6,972 on the dates of exercise, determined using the Black-Scholes option pricing model. This amount was transferred from derivative warrant liabilities to share capital (Common Shares). As at February 28, 2021, the Company revalued the remaining derivative warrants at an estimated fair value of $48,253 (August 31, 2020 - $nil). The Company recorded an increase in the estimated fair value change of the derivative warrant liability for the three and six months ended February 28, 2021 of $37,659 and $42,331 (February 29, 2020 - $nil and $nil), respectively.
NET LOSS
Net loss for the three months ended February 28, 2021 was $(66,389) or $(0.285) per Common Share (basic and diluted), compared to $(6,833) or $(0.041) per Common Share (basic and diluted) for the prior year comparative period. The increase net loss for the current quarter was a result of lower gross margin due to higher cost of sales, including fair value changes to biological assets and inventories sold, as described previously, and a fair value loss on the derivative warrant liabilities, offset by lower financing costs and operating expenses.
Net loss for the six months ended February 28, 2021 was $(100,725) or $(0.464) per Common Share (basic and diluted), compared to $(7,696) or $(0.048) per Common Share (basic and diluted) for the prior year comparative period. The year-over-year decrease is related to the same factors noted above.
SUMMARY OF QUARTERLY RESULTS
| Q3-F19 | Q4-F19 | Q1-F20 | Q2-F20 | Q3-F20 | Q4-F20 | Q1-F21 | Q2-F21 | |||||||||||||||||
| Financial Results | ||||||||||||||||||||||||
| Adult-use recreational revenue (net of excise) | 21,802 | 13,361 | 12,867 | 15,009 | 15,349 | 15,063 | 16,788 | 11,988 | ||||||||||||||||
| Direct to patient medical revenue (net of excise) | 2,793 | 2,376 | 2,667 | 2,384 | 2,482 | 2,274 | 2,188 | 2,061 | ||||||||||||||||
| International, wholesale and other revenue | 155 | 553 | 9,619 | 5,828 | 190 | 3,063 | 355 | 594 | ||||||||||||||||
| Net revenue | 24,750 | 16,290 | 25,153 | 23,221 | 18,021 | 20,400 | 19,331 | 14,643 | ||||||||||||||||
| Net Loss | (10,180 | ) | (22,456 | ) | (863 | ) | (6,833 | ) | (89,871 | ) | (38,590 | ) | (34,336 | ) | (66,389 | ) | ||||||||
| Net loss per common share, basic | (0.068 | ) | (0.144 | ) | (0.006 | ) | (0.041 | ) | (0.512 | ) | (0.199 | ) | (0.170 | ) | (0.285 | ) | ||||||||
| Net loss per common share, diluted | (0.068 | ) | (0.144 | ) | (0.006 | ) | (0.041 | ) | (0.512 | ) | (0.199 | ) | (0.170 | ) | (0.285 | ) | ||||||||
| Operational Results | ||||||||||||||||||||||||
| Dried yield per plant (grams) (1) | 110 | 148 | 152 | 155 | 132 | 127 | 89 | 129 | ||||||||||||||||
| Harvest (kg) | 6,052 | 7,434 | 12,759 | 13,711 | 6,830 | 11,137 | 4,023 | 5,028 | ||||||||||||||||
| Registered medical patients (#) | 17,000 | 17,200 | 18,125 | 16,781 | 14,312 | 18,934 | 18,342 | 11,658 | ||||||||||||||||
| Employee headcount (#) | 622 | 707 | 766 | 816 | 474 | 552 | 516 | 619 |
(1) The Company significantly reduced the harvesting of trim from the cannabis plant during Q3 Fiscal 2020 and therefore the dried flower yield per plant for Q3 Fiscal 2020 onwards relates primarily to the flower component of the plant.
The legalization of adult-use cannabis for recreational purposes in October 2018 resulted in a significant increase in revenue in Q3 Fiscal 2019, as the recreational market matured.
Net income for Q3 Fiscal 2019 through Q1 Fiscal 2021 declined as the Company recorded net negative changes to Company's fair value adjustments to biological assets and inventories sold and as spend in SG&A increased and cost of goods sold increased. Besides these factors, the increased net loss during Q2 Fiscal 2021 is primarily driven by a lower average selling price, and costs associated with the derivative warrant liabilities. Excluding the aforementioned trends, no seasonality has been historically noted.
Adjusted EBITDA
This is a non-IFRS measure and the Company calculates adjusted EBITDA as net income (loss) before interest expense, net of investment income; income tax expense (recovery); depreciation, amortization, impairment, and gain (loss) on disposal of PP&E (per the statement of cash flows); share-based compensation (per the statement of cash flows); share of loss and impairment loss from loan receivable and investments in associates; unrealized loss (gain) on changes in fair value of contingent consideration; expenditures incurred in connection with the NASDAQ cross-listing; the fair value adjustment to biological assets, inventories sold, and other charges; write-offs and impairment of inventories and biological assets; write-downs of inventory to net realizable value; COVID-19 related charges, net of any government subsidies; legal provisions; and share issuance costs allocated to derivative warrant liabilities and the change in estimated fair value of derivative warrant liabilities. Management believes the exclusion of the fair value adjustment is an alternative representation of performance. The fair value adjustment is a non-cash gain (loss) and is based on the valuation of biological assets and inventory using a fair value less cost to sell model. The most directly comparable measure to Adjusted EBITDA (excluding fair value adjustment to biological assets and inventory) calculated in accordance with IFRS is net loss.
During Q4 2020 management amended the calculation of Adjusted EBITDA and has conformed prior quarters accordingly to include an add-back for write-offs and impairment of inventories and biological assets and write-downs to net realizable value.
Adjusted EBITDA decreased from Q3 Fiscal 2019 to Q4 Fiscal 2019 due to lower gross margins on increased production costs, inventory write-downs, and sales provisions as well as higher SG&A expenditures. In Q1 and Q2 Fiscal 2020, Adjusted EBITDA increased due to increased gross margin and lower operating expenses compared to Q4 of Fiscal 2019. The significant decrease in Adjusted EBITDA during Q3 Fiscal 2020 was due to higher cost of sales mainly attributed to lower revenues. The Q4 Fiscal 2020 Adjusted EBITDA was similar to the Q3 Fiscal 2020 as slightly higher net revenues were offset by higher cost of sales. Included in COVID-19 related charges (net) for Q3 and Q4 Fiscal 2020 are $5,048 and $nil, respectively, of plant waste due to insufficient staff to harvest plants as a result of COVID-19, lump sum payments paid to temporarily laid off employees, a temporary pay premium paid to Moncton employees, and the employee portion of health and dental benefits paid for by the Company, less government subsidies income of $3,237 and $4,646, respectively. The further reduction in Adjusted EBITDA in Q1 and Q2 Fiscal 2021 was primarily due to a lower average selling price and higher cultivation and post-harvest costs resulting in a lower gross margin as well as higher general and administrative expenses compared to prior comparative periods.
| Adjusted EBITDA (Non-IFRS Measure) | ||||||||||||||||||||||||
| Adjusted EBITDA Reconciliation | Q3-F19 | Q4-F19 | Q1-F20 | Q2-F20 | Q3-F20 | Q4-F20 | Q1-F21 | Q2-F21 | ||||||||||||||||
| Net loss as reported | $ | (10,180 | ) | $ | (22,456 | ) | $ | (863 | ) | $ | (6,833 | ) | $ | (89,871 | ) | $ | (38,590 | ) | $ | (34,336 | ) | $ | (66,389 | ) |
| Add/(Deduct): | ||||||||||||||||||||||||
| Interest expense, net of investment income | 362 | 616 | 937 | 1,804 | 2,175 | 784 | 1,472 | 669 | ||||||||||||||||
| Income tax expense (recovery) | (2,248 | ) | (6,289 | ) | 202 | (698 | ) | (9,975 | ) | - | - | - | ||||||||||||
| Depreciation, amortization, and gain (loss) on disposal of PP&E (per statement of cash flows) | 2,220 | 3,955 | 3,760 | 4,406 | 5,033 | 5,537 | 5,262 | 5,222 | ||||||||||||||||
| Impairment of property, plant and equipment | - | - | - | - | 37,740 | 2,031 | - | - | ||||||||||||||||
| Share of loss and impairment loss from loan receivable and investments in associates | 415 | 1,289 | 256 | 1,894 | 1,828 | 210 | 242 | 844 | ||||||||||||||||
| Unrealized loss (gain) on changes in fair value of contingent consideration | 363 | (864 | ) | (378 | ) | (193 | ) | (229 | ) | (85 | ) | 36 | 154 | |||||||||||
| Fair value adjustment to biological assets, inventories sold, and other charges | 12,456 | 11,806 | (1,852 | ) | (3,878 | ) | 23,862 | 20,149 | 12,832 | 692 | ||||||||||||||
| Share-based compensation (per statement of cash flows) | 3,875 | 4,036 | 2,805 | 2,400 | 1,937 | 654 | 606 | 1,167 | ||||||||||||||||
| COVID-19 related charges, net of government subsidies | - | - | - | - | 2,761 | (4,452 | ) | (1,832 | ) | (2,709 | ) | |||||||||||||
| Legal provisions | - | - | - | - | - | - | 730 | 500 | ||||||||||||||||
| Share issuance costs allocated to derivative warrant liabilities and change in fair value of derivative warrant liabilities | - | - | - | - | - | - | 5,475 | 37,659 | ||||||||||||||||
| Nasdaq cross-listing expenditures | 449 | - | - | - | - | - | - | - | ||||||||||||||||
| Adjusted EBITDA as Previously Reported | $ | 7,712 | $ | (7,907 | ) | $ | 4,867 | $ | (1,098 | ) | $ | (24,739 | ) | $ | (13,762 | ) | $ | (9,513 | ) | $ | (22,191 | ) | ||
| Add/(Deduct): | ||||||||||||||||||||||||
| Write-offs and impairment of inventories and biological assets and write-downs of inventory to net realizable value | - | 744 | 845 | 1,039 | 22,601 | 11,099 | 3,126 | 13,549 | ||||||||||||||||
| Adjusted EBITDA (Revised) | $ | 7,712 | $ | (7,163 | ) | $ | 5,712 | $ | (59 | ) | $ | (2,138 | ) | $ | (2,663 | ) | $ | (6,387 | ) | $ | (8,642 | ) | ||
| Divided by: net revenue | 24,750 | 16,290 | 25,153 | 23,221 | 18,021 | 20,400 | 19,331 | 14,643 | ||||||||||||||||
| Adjusted EBITDA Margin % (Revised) (Non-IFRS Measure) | 31% | -44% | 23% | 0% | -12% | -13% | -33% | -59% |
BALANCE SHEET, LIQUIDITY AND CAPITAL RESOURCES
The following represents selected balance sheet highlights of the Company at the end Q2 Fiscal 2021 and Q4 Fiscal 2020:
| FEBRUARY 28, 2021 | AUGUST 31, 2020 | % CHANGE | ||||||
| Cash & short-term investments | $ | 71,123 | $ | 74,728 | (5%) | |||
| Inventories | $ | 37,208 | $ | 66,365 | (44%) | |||
| Working capital | $ | 112,398 | $ | 141,123 | (20%) | |||
| Total assets | $ | 392,764 | $ | 435,127 | (10%) | |||
| Total current and long-term debt | $ | 58,807 | $ | 115,266 | (49%) | |||
| Non-current financial liabilities | $ | 105,258 | $ | 106,288 | (1%) | |||
| Total shareholders' equity | $ | 267,229 | $ | 299,527 | (11%) |
On February 28, 2021, the Company had a cash and short-term investments balance of $71,123 compared to $74,728 at August 31, 2020, a decrease of 5%, which is primarily a result of cash used in operating activities and the purchase of property, plant and equipment offset by the net increase from financing activities.
The sale of inventories as well as write-downs and provisions for excess and unsaleable inventories recorded during Q2 Fiscal 2021, resulted in a decrease in the value of inventories at the end of Q2 Fiscal 2021 as compared to Q4 Fiscal 2020.
Management believes working capital is generally healthy and that since the Company's original Moncton Campus capital expenditure plan has essentially come to a close, there is sufficient liquidity available for the near to medium term. Furthermore, subsequent to the period end, on March 11, 2021, the Company received gross cash proceeds of $221 million as a result of the strategic investment by BAT, as described above. In the event that the Company is unable to finance any new expansionary capital expenditures or acquisitions from cash on hand or operating cash flows, it could, if necessary and subject to prevailing market conditions, obtain liquidity through the capital markets as the Common Shares are actively traded on two senior exchanges and there is good analyst coverage amongst sell-side brokerages.
The following highlights the Company's cash flows during the three and six months ended February 28, 2021 and February 29, 2020:
| THREE MONTHS ENDED | SIX MONTHS ENDED | ||||||||||||||
| FEBRUARY 28, 2021 | FEBRUARY 29, 2020 | FEBRUARY 28, 2021 | FEBRUARY 29, 2020 | ||||||||||||
| Cash provided (used) by: | |||||||||||||||
| Operating activities | $ | (10,430 | ) | $ | (10,894 | ) | $ | (10,136 | ) | $ | (37,762 | ) | |||
| Financing activities | (50,718 | ) | 52,565 | 12,475 | 86,594 | ||||||||||
| Investing activities | 18,371 | (34,541 | ) | 34,184 | (55,301 | ) | |||||||||
| Cash provided (used) | $ | (42,777 | ) | $ | 7,130 | $ | 36,523 | $ | (6,469 | ) | |||||
| Cash position | |||||||||||||||
| Beginning of period | 103,900 | 33,956 | 24,600 | 47,555 | |||||||||||
| End of period | $ | 61,123 | $ | 41,086 | $ | 61,123 | $ | 41,086 | |||||||
| Short-term investments | 10,000 | 153 | 10,000 | 153 | |||||||||||
| Cash and short-term investments | $ | 71,123 | $ | 41,239 | $ | 71,123 | $ | 41,239 | |||||||
Note 1: Net cash used in operating activities for the three and six months ended February 29, 2020 has been calculated based on a correction of a reclassification error to the presentation of prior period net cash used in operating activities as described in Note 24 of the Interim Financial Statements. Fiscal 2021 net cash used in operating activities and investing activities is correctly stated as per the Interim Financial Statements.
Cash used in operating activities for the three and six months ended February 28, 2021 was $10,430 and $10,136, respectively, which was primarily driven by the net loss, which was offset by non-cash items, the realization of accounts receivable, and the impact of non-cash provisions against inventories. This compares to cash used in operating activities of $10,894 and $37,762 for the three and six months ended February 29, 2020, respectively, when the business was mostly focused on the continued development of the adult-use recreational market and investing in working capital.
Cash used in financing activities for the three months ended February 28, 2021 was $50,718, which was mainly driven by the repayment of long-term debt on December 1, 2020 ($55,000) and the first scheduled principal repayment on February 28, 2021 ($1,500 million), which was offset by proceeds received from stock options and warrants exercised during the period. Cash provided by financing activities for the six months ended February 28, 2021 was $12,475, mainly driven by net proceeds from the Offering of Units of $64,839 (as described above) and the proceeds received from the stock options and warrants exercised during the period ($7,009), offset by payment of long-term debt of $56,520, cash interest paid of $2,176 and payments towards lease liabilities, net of sublease receipts, of $677. In comparison, for the three and six months ended February 29, 2020, cash provided by financing activities was $52,565 and $86,594, respectively, which was primarily driven by net proceeds from equity financing of $52,885 in Q2 Fiscal 2020 and proceeds from long-term debt of $34,860 in Q1 Fiscal 2020.
On November 12, 2020, the Company closed an underwritten public offering of 37,375,000 Units at a price of $1.85 per unit, including a full exercise of the over-allotment option, underwritten by a syndicate of underwriters led by Canaccord Genuity Corp., for total gross proceeds of $69,144, as described previously. Each Unit is comprised of one Common Share of the Company and one half of one Warrant, resulting in the issuance of 18,687,500 Warrants. Each Warrant is exercisable to acquire one Common Share of the Company for a period of three years following the closing date of the Offering at an exercise price of $2.50 per Warrant Share, subject to adjustment in certain events. Share issue costs were $4,305 which included a 5% cash commission of $3,457 paid to placement agents with the balance related to filing, legal, and other professional fees directly related to the offering. The Company used $55,000 of the net proceeds from the Offering to repay part of its term loan on December 1, 2020, and expects to use the balance of the net proceeds for working capital and other general corporate purposes.
Following completion of the Offering in November 2020, the Company exhausted its current shelf prospectus. The Company believes it can access the public markets from time to time to raise funds subject to prevailing market conditions.
On April 1, 2021, the Company repaid the $58.5 million outstanding balance under the facilities provided under its amended and restated credit agreement dated November 27, 2020 with Bank of Montreal and a syndicate of lenders.
Cash provided by investing activities for the three and six months ended February 28, 2021 was $18,371 and $34,184, respectively, primarily driven by the proceeds from the proceeds of short-term investments of $20,000 and $40,072, partly offset by the Company's additional investment in associate Hyasynth Biologicals Inc. of $2,538 in Q1 Fiscal 2021, as well as the purchase of property, plant and equipment of $1,817 and $3,630. This compares to cash used in investing activities of $34,541 and $55,301 for the three and six months ended February 29, 2020, respectively, which was primarily due to the purchase of property, plant and equipment for $34,489 and $52,222 as well as the loan advance of $2,071 in Q1 Fiscal 2020.
CORRECTION OF RECLASSIFICATION ERROR TO PRESENTATION OF PRIOR PERIOD CONSOLIDATED STATEMENT OF CASH FLOWS
For the three and six months ended February 29, 2020, net change in accounts payable and accrued liabilities (shown in the operating activities section of the statement of cash flows) and net cash used in operating activities were understated and purchase of property, plant and equipment (shown in the investment activities of the statement of cash flow) and net cash used in investing activities were overstated as outlined below. The amounts relate to timing differences between when construction services were rendered, and equipment was received and ultimately paid for. There was no net impact to the overall change in cash.
This classification error that was corrected for the three and six months ended February 29, 2020 as presented below:
| THREE MONTHS ENDED | |||||||||
| FEBRUARY 29, 2020 | |||||||||
| OPERATING ACTIVITIES | AS REPORTED | ADJUSTMENT | AS CORRECTED | ||||||
| Net change in accounts payable and accrued liabilities | $ | (4,541 | ) | $ | 443 | $ | (4,098 | ) | |
| Net cash used in operating activities | $ | (11,337 | ) | $ | 443 | $ | (10,894 | ) | |
| INVESTING ACTIVITIES | |||||||||
| Purchase of property, plant and equipment | $ | (34,046 | ) | $ | (443 | ) | $ | (34,489 | ) |
| Net cash used in investing activities | $ | (34,098 | ) | $ | (443 | ) | $ | (34,541 | ) |
| SIX MONTHS ENDED | |||||||||
| FEBRUARY 29, 2020 | |||||||||
| OPERATING ACTIVITIES | AS REPORTED | ADJUSTMENT | AS CORRECTED | ||||||
| Net change in accounts payable and accrued liabilities | $ | (15,458 | ) | $ | (12,751 | ) | $ | (28,209 | ) |
| Net cash used in operating activities | $ | (25,011 | ) | $ | (12,751 | ) | $ | (37,762 | ) |
| INVESTING ACTIVITIES | |||||||||
| Purchase of property, plant and equipment | $ | (64,973 | ) | $ | 12,751 | $ | (52,222 | ) | |
| Net cash used in investing activities | $ | (68,052 | ) | $ | 12,751 | $ | (55,301 | ) | |
OFF BALANCE SHEET ARRANGEMENTS
There were no off-balance sheet arrangements during the three and six months ended February 28, 2021.
RELATED PARTY TRANSACTIONS
MANAGEMENT AND BOARD COMPENSATION
Key management personnel are those persons having the authority and responsibility for planning, directing, and controlling activities of the Company, directly or indirectly. The key management personnel of the Company are the members of the Company's executive management team and Board of Directors. The transactions are conducted at arm's length and in the normal course of operations.
Management and Board compensation
For the three and six months ended February 28, 2021 and February 29, 2020, the Company's expenses included the following management and board compensation:
| THREE MONTHS ENDED | SIX MONTHS ENDED | |||||||||||
| FEBRUARY 28, | FEBRUARY 29, | FEBRUARY 28, | FEBRUARY 29, | |||||||||
| Salaries and consulting fees | $ | 802 | $ | 746 | $ | 1,325 | $ | 1,322 | ||||
| Share-based compensation | 670 | 656 | 1,152 | 1,427 | ||||||||
| Total key management compensation | $ | 1,472 | $ | 1,402 | $ | 2,477 | $ | 2,749 | ||||
During the three and six months ended February 28, 2021, 330,000 and 330,000 stock options, respectively (February 29, 2020 - 250,000 and 250,000) were granted to key management personnel with an aggregate fair value of $456 and $456 (February 29, 2020 - $421 and $421). In addition, during the three and six months ended February 28, 2021, 349,493 and 349,493 RSUs, respectively (February 29, 2020 - nil and 165,093), were granted to key management personnel with an aggregate fair value of $637 and $637 (February 29, 2020 - $nil and $708). For the three and six months ended February 28, 2021, 240,740 and 240,740 PSUs, respectively (February 29, 2020 - nil and 88,910) were issued to key management personnel with an aggregate fair value of $259 and $259 (February 29, 2020 - $nil and $191).
SIGNIFICANT TRANSACTIONS WITH ASSOCIATES
On October 23, 2020, the Company advanced an additional $2,500 to Hyasynth by way of convertible debentures as a result of Hyasynth's achievement of the contractual production-related milestone for Tranche 2 of the convertible debentures. This brings the Company's total face value of convertible debentures investment in Hyasynth to $7,500, which provides the Company with a potential ownership interest of up to 46.7% on a fully diluted basis.
SUBSEQUENT EVENTS
i) Organigram and BAT Strategic Investment and Product Development Collaboration
On March 11, 2021, the Company received a $221 million strategic investment from a wholly-owned subsidiary of BAT, which subscribed for approximately 58.3 million common shares of the Company at $3.792 per common share, which represented a 19.9% equity interest in the Company on a post-transaction basis at the time of announcement. Concurrent with the investment, Organigram Inc. and BAT also entered into the PDC Agreement pursuant to which a "Center of Excellence" will be established to focus on developing the next generation of cannabis products. This strategic collaboration will strengthen the Company's ability to deliver innovative, differentiated products that appeal to adult consumers, and is also expected to be transformational for the Company and its shareholders. The Company is still assessing the accounting implications of the PDC Agreement.
ii) BMO Term Loan
On April 1, 2021, the Company repaid the $58.5 million outstanding balance under the Amended and Restated Facilities. The Company currently intends to terminate the Amended and Restated Facilities and discharge the related security.
iii) Acquisition of The Edibles and Infusions Corporation
On April 6, 2021, the Company acquired all of the issued and outstanding shares of The Edibles and Infusions Corporation ("EIC"), a cannabis processor of confectionary goods, for Common Share consideration of $22.0 million, plus up to an additional $13.0 million in Common Shares payable upon the EIC business achieving certain earnout milestones (the "Milestones") as outlined below. EIC constructed a purpose-built, highly-automated, 51,000-square-foot manufacturing facility located in Winnipeg, Manitoba. The facility employs state-of-the-art equipment designed to produce highly customizable, precise, and scalable cannabis-infused products, including edibles. The transaction was structured as an acquisition of EIC's shareholders, Quality Confections Canada Inc. and SUHM Investments Inc.
The purchase price payable on closing was $22.0 million payable in full by the issuance of 5,045,872 Common Shares based on the closing price of Organigram of $4.36 on April 5, 2021. Upon satisfaction of the Milestones, the Company will issue up to an aggregate of $13.0 million of Common Shares, for which the number of Common Shares will be determined upon achievement of the applicable Milestone. The Milestones include:
- $3.5 million to be paid in Common Shares on first listing prior to December 31, 2021 in either the Ontario or Alberta recreational market of EIC or Organigram branded product (which was manufactured at the EIC facility);
$7.0 million to be paid in Common Shares on successful achievement of $15.0 million in net revenue during the 12 months ended December 31, 2022; and
- $2.5 million to be paid in Common Shares on the generation of $7.0 million in adjusted EBITDA for the 12 months ended December 31, 2022.
Milestone payments paid in Common Shares shall be priced based on the five-day volume-weighted average price of the Company's Common Shares on the TSX as of the day prior to settlement.
FAIR VALUE MEASUREMENTS
(i) Financial Instruments
Fair value is the price that would be received to sell an asset or paid to transfer a liability in an orderly fashion between market participants. The Company records certain financial instruments at fair value. The Company's financial instruments include cash, short-term investments (including marketable securities), accounts receivable, loan receivable, restricted investment, accounts payable and accrued liabilities, long-term debt, and contingent share consideration.
Fair value measurements are categorized into Level 1, 2 or 3 based on the degree to which the inputs to the fair value measurements are observable and the significance of the inputs to the fair value measurement in its entirety, which are described as follows:
• Level 1 inputs are quoted prices in active markets for identical assets or liabilities that the entity can access at the measurement date;
• Level 2 inputs, other than quoted prices included within Level 1, that are observable for the asset or liability, either directly or indirectly; and
• Level 3 inputs are unobservable inputs for the asset or liability.
The fair value of cash, short-term investments, accounts receivable, loan receivable, accounts payable and accrued liabilities approximate their carrying amounts due to their short-term nature. The fair value of marketable securities is based on quoted prices in active markets and is reflected in the carrying value of these financial assets. The fair value of long-term debt approximates $58,807 based on the face value of debt outstanding, which carries a floating interest rate.
The fair value of the contingent share consideration is primarily based on Level 3 unobservable inputs. The determination of the fair value of this liability is primarily driven by the Company's expectations of the investment in associate achieving certain milestones. The expected milestones were assigned probabilities and the expected related cash flows were discounted to derive the fair value of the contingent consideration. At February 28, 2021, the probability of achieving the milestones was estimated to be 50% and the discount rate was estimated to be 20%. If the probabilities of achieving the milestones increased or decreased by 10%, the estimated fair value of the contingent share consideration would increase or decrease by approximately $84. If the discount rates increased or decreased by 5%, the estimated fair value of contingent consideration would decrease or increase, respectively, by approximately $16.
The fair value of derivative warrant liabilities is based on Level 1 and 2 inputs utilized in a Black-Scholes option pricing model to estimate the fair value of such warrants. The key assumption used in the model is the expected future volatility in the price of the Company's shares.
During the period, there were no transfers of amounts between Levels 1, 2 and 3.
Derivative Warrant Liabilities
At initial recognition on November 12, 2020, the Company recorded derivative warrant liabilities of $12,894 based on the estimated fair value of the Warrants at this date using the Black-Scholes option pricing model. Share issuance costs of $803 were recognized as share issue costs allocated to derivative warrant liabilities based on a pro-rata allocation of total issuance costs based on the relative fair value of the Warrants and the common shares issued as part of the unit offering.
During the three months ended February 28, 2021, certain holders exercised 1,698,200 warrants at $2.50 per share for gross proceeds of $4,246. These warrants had an estimated fair value of $6,972 on the dates of exercise, determined using the Black-Scholes option pricing model. This amount was transferred from derivative warrant liabilities to share capital (common shares). As at February 28, 2021, the Company revalued the remaining derivative warrants at an estimated fair value of $48,253 (August 31, 2020 - $nil). The Company recorded an increase in the estimated fair value change of the derivative warrant liability for the three and six months ended February 28, 2021 of $37,659 and $42,331 (February 29, 2020 - $nil and $nil), respectively. This increase was largely attributable to the rapid increase in the Company's share price during Q2 Fiscal 2021, which also impacted the expected future volatility assumption.
The Company's derivative warrant liabilities included the following balances and changes in the carrying value of derivative warrants as of February 28, 2021:
| Number of warrants | Amount | |||||
| Balance at November 12, 2020 | 18,687,500 | $ | 12,894 | |||
| Conversion to equity upon exercise of warrants | (1,698,200 | ) | $ | (6,972 | ) | |
| Revaluation of derivative warrant liability | - | 42,331 | ||||
| Balance at February 28, 2021 | 16,989,300 | $ | 48,253 |
The following inputs were used to estimate the fair value of the derivative warrant liabilities at February 28, 2021 and November 12, 2020:
| FEBRUARY 28, 2021 | NOVEMBER 12, 2020 | |
Risk free interest rate | 0.32% | 0.30% | |
Life of Warrants (years) | 2.70 | 3.00 | |
Market price of Common Shares | 3.94 | 1.49 | |
Expected future volatility of Common Shares | 111.90% | 92.00% | |
Fair value per warrant | 2.84 | 0.69 |
As at February 28, 2021, if the implied volatility increased by 10%, then the change in estimated fair value of the derivative warrant liabilities and net loss would increase by $2,131, or if it is decreased by 10%, the change in estimated fair value of the derivative warrant liabilities and net loss would decrease by $2,286.
(ii) Biological Assets
The Company measures biological assets, which consist of cannabis plants, at fair value less costs to sell up to the point of harvest, which then becomes the basis for the cost of finished goods inventories after harvest. Subsequent expenditures incurred on these finished goods inventories after harvest are capitalized based on IAS 2 Inventories.
The changes in the carrying value of biological assets as of February 28, 2021 are as follows:
OTHER BIOLOGICAL ASSETS | CANNABIS ON PLANTS | TOTAL | |||||||
| Carrying amount, August 31, 2020 | $ | 16 | $ | 5,378 | $ | 5,394 | |||
| Add net production costs | - | 14,521 | 14,521 | ||||||
| Net change in fair value less costs to sell due to biological transformation | - | 221 | 221 | ||||||
| Transferred to inventory upon harvest | - | (13,970 | ) | (13,970 | ) | ||||
| Carrying amount, February 28, 2021 | $ | 16 | $ | 6,150 | $ | 6,166 |
The fair value less costs to sell of biological assets is determined using a model which estimates the expected harvest yield in grams for plants currently being cultivated, and then adjusts that amount for the expected selling price per gram and for any additional costs to be incurred, such as post-harvest costs. The following unobservable inputs, all of which are classified as Level 3 within the fair value hierarchy (see Note 18 of the Interim Financial Statements), are used in determining the fair value of biological assets:
i. Average selling price per gram - calculated as the weighted average current selling price of cannabis sold by the Company, adjusted for expectations about future pricing;
ii. Average yield per plant - represents the number of grams of finished cannabis inventory which is expected to be obtained from each harvested cannabis plant;
iii. Wastage of plants based on their various stages of growth - represents the weighted average percentage of biological assets which are expected to fail to mature into cannabis plants that can be harvested;
iv. Post-harvest costs - calculated as the cost per gram of harvested cannabis to complete the sale of cannabis plants post-harvest, consisting of the cost of direct and indirect materials and labour related to drying, labelling, and packaging; and
v. Stage of completion in the cultivation process - calculated by taking the weighted average number of weeks in production over a total average grow cycle of approximately 19 weeks.
The Company estimates the harvest yields for the cannabis on plants at various stages of growth. As of February 28, 2021, it is expected that the Company's biological assets will yield 6,863 kg (August 31, 2020 - 5,096 kg) of cannabis when eventually harvested. The Company's estimates are, by their nature, subject to change, and differences from the anticipated yield will be reflected in the fair value adjustment to biological assets in future periods. The Company accretes fair value on a straight-line basis according to stage of growth. As a result, a cannabis plant that is 50% through its 19-week growing cycle would be ascribed approximately 50% of its harvest date expected fair value less costs to sell (subject to wastage adjustments).
Management believes the most significant unobservable inputs and their impact on fair value are as follows:
| SIGNIFICANT INPUTS & | WEIGHTED AVERAGE INPUT | EFFECT ON FAIR VALUE | |||||||||||||
| ASSUMPTIONS | FEB. 28, 2021 | AUG. 31, 2020 | SENSITIVITY | FEB. 28, 2021 | AUG. 31, 2020 | ||||||||||
| Average net selling price per gram | $ | 3.31 | $ | 3.36 | Increase or decrease by $1.00 per gram | $ | 1,856 | $ | 1,602 | ||||||
| Average yield per plant | 105 grams | 101 grams | Increase or decrease by 10 grams | $ | 583 | $ | 532 | ||||||||
The average yield per plant at February 28, 2021 primarily reflects the average yield of the flower component of the plant (with the exception being cannabidiol ("CBD") dominant strains where trim is also harvested for extraction).
OUTSTANDING SHARE DATA
(i) Outstanding Shares, Warrants and Options and Other Securities
The following table sets out the number of Common Shares, options, warrants, restricted share units and performance share units outstanding of the Company as at February 28, 2021 and April 11, 2021:
| FEBRUARY 28, 2021 | APRIL 11, 2021 | |||||
| Common shares issued and outstanding | 234,811,307 | 298,232,583 | ||||
| Options | 7,980,808 | 7,920,524 | ||||
| Warrants | 16,989,300 | 16,951,150 | ||||
| Restricted share units | 1,191,730 | 1,184,968 | ||||
| Performance share units | 480,859 | 467,250 | ||||
| Total fully diluted shares | 261,454,004 | 324,756,475 |
(ii) Share-based Compensation
On February 25, 2020 (the "Approval Date"), the Company's shareholders approved a new omnibus equity incentive plan (the "New Equity Incentive Plan") that governs grants made on or after the Approval Date. Grants made prior to the Approval Date will continue to be governed under the terms of the plan under which they were granted including the Company's 2011 stock option plan and its 2017 equity incentive plan (the "2017 Equity Incentive Plan"), however, no new grants may be made under such plans.
Stock options
The following table summarizes changes in the Company's outstanding stock options for the three months ended February 28, 2021:
| NUMBER | WEIGHTED AVERAGE EXERCISE PRICE | |||||
| Balance - August 31, 2020 | 9,264,321 | $ | 4.05 | |||
| Exercised | (181,500 | ) | $ | 0.60 | ||
| Cancelled / Forfeited | (594,550 | ) | $ | 6.98 | ||
| Balance - November 30, 2020 | 8,488,271 | $ | 4.23 | |||
| Granted | 735,000 | $ | 2.14 | |||
| Exercised | (968,698 | ) | $ | 2.74 | ||
| Cancelled / Forfeited | (273,765 | ) | $ | 6.60 | ||
| Balance - February 28, 2021 | 7,980,808 | $ | 4.26 |
The following is a summary of the outstanding stock options as at February 28, 2021:
| OPTIONS OUTSTANDING |
| OPTIONS EXERCISABLE |
| Range of Exercise Prices | Quantity Outstanding | Weighted Average Remaining Contractual Life (years) | Quantity Exercisable |
$0.30 - $2.18 | 1,519,468 | 6.7 | 927,769 |
$2.19 - $2.44 | 2,155,000 | 7.2 | 1,527,200 |
$2.45 - $3.61 | 1,335,578 | 7.9 | 979,961 |
$3.62 - $5.08 | 1,512,711 | 7.6 | 1,359,344 |
$5.09 - $11.27 | 1,458,051 | 8.0 | 1,145,951 |
| 7,980,808 | 7.4 | 5,940,225 |
Options outstanding have exercise prices that range from $0.30 to $11.27 with a weighted average remaining life of 7.4 years. Total share-based compensation charges, including related to production employees that are charged to biological assets and inventory and amounts amortized from prepaid expenses and deferred charges, for the three and six months ended February 28, 2021 was $1,167 and $1,773, respectively (February 29, 2020 - $2,400 and $5,205), of which $871 and $1,257 (February 29, 2020 - $1,870 and $3,993) related to the Company's stock option plan. The fair value of options granted during the three and six months ended February 28, 2021 was $985 and $985, respectively (February 29, 2020 - $1,629 and $2,716). These options are measured at fair value at the date of grant and are expensed over the option's vesting period, which typically ranges from two- to three-year terms with options vesting in annual tranches evenly over this time period. In determining the amount of share-based compensation related to the options, the Company used the Black-Scholes option pricing model to establish the fair value of options granted.
The following is the range of assumptions for the three months ended February 28, 2021 and February 29, 2020:
FEBRUARY 28, 2021 | FEBRUARY 29, 2020 | ||
| Risk free interest rate | 0.40%-0.50% | 1.27%-1.65% | |
| Expected life of options | 5.0 -6.5 years | 5.0 -6.5 years | |
| Expected annualized volatility | 79%-98% | 72% -75% | |
| Expected dividend yield | - | - | |
| Forfeiture Rate | 11.0%-11.3% | 8.0% - 8.7% |
Expected volatility was estimated by using the weighted average historical volatility of the Company and other companies that the Company considers comparable. The expected life in years represents the period of time that options granted are expected to be outstanding. The risk-free rate is based on government of Canada bonds with a remaining term equal to the expected life of the options. The forfeiture rate is calculated based on historical experience.
Equity incentive plan
As of February 28, 2021, the Company has granted both RSUs and PSUs under the 2017 Equity Incentive Plan and RSUs under the New Equity Incentive Plan. The grant price of any RSU or PSU was determined based on market price calculated in accordance with TSX rules at the time of grant and with respect to PSUs, adjusted for any non-market and market performance vesting conditions in accordance with IFRS 2.
The following table summarizes the movements in the Company's outstanding RSUs:
| NUMBER | |||
| Balance - August 31, 2020 | 911,840 | ||
| Exercised | (20,658 | ) | |
| Cancelled/Forfeited | (16,579 | ) | |
| Balance - November 30, 2020 | 874,603 | ||
| Granted | 411,599 | ||
| Exercised | (56,190 | ) | |
| Cancelled/Forfeited | (38,282 | ) | |
| Balance - February 28, 2021 | 1,191,730 |
The estimated fair value of the equity settled RSUs granted during the three and six months ended February 28, 2021 was $734 and $734, respectively (February 29, 2020 - $nil and $937), which was based on the Company's share price at the grant date and will be recognized as an expense over the vesting period of the RSUs, which is over a period of one year for most grants. For the three and six months ended February 28, 2021, $398 and $790 (February 29, 2020 - $445 and $944) has been recognized as share-based compensation expense.
The following table summarizes the movements in the Company's outstanding PSUs as at February 28, 2021:
| NUMBER | |||
| Balance - August 31, 2020 | 120,058 | ||
| Cancelled/Forfeited | (63,215 | ) | |
| Balance - November 30, 2020 | 56,843 | ||
| Granted | 427,084 | ||
| Exercised | (3,068 | ) | |
| Balance - February 28, 2021 | 480,859 |
The estimated fair value of the equity settled PSUs granted during the three and six months ended February 28, 2021 was $453 and $453, respectively (February 29, 2020 - $nil and $305), which was based on the Company's share price at the grant date, adjusted for an estimate of likelihood of forfeiture, and will be recognized as an expense over the vesting period of the PSUs, which is during the fiscal year-ended August 31, 2021. For the three and six months ended February 28, 2021, $52 and $48 (February 29, 2020 - $74 and $125) has been recognized as share-based compensation expense.
CRITICAL ACCOUNTING ESTIMATES AND JUDGMENTS
Derivative Warrant Liabilities
Warrants issued pursuant to equity offerings that are potentially exercisable in cash or on a cashless basis resulting in a variable number of shares being issued are considered derivative liabilities and therefore measured at fair value. The Company uses the Black-Scholes pricing model to estimate the fair value of such warrants at inception, on each exercise, and at the period end date. The key assumption used in the model is the expected future volatility in the price of the Company's shares. The impact of changes in this key assumption is described in Note 12 of the Interim Financial Statements.
New Accounting Pronouncements
The following IFRS standards have been recently issued by the IASB. Pronouncements that are irrelevant or not expected to have a significant impact have been excluded.
Amendment to IFRS 3: Definition of a Business
In October 2018, the IASB issued "Definition of a Business (Amendments to IFRS 3)". The amendments clarify the definition of a business, with the objective of assisting entities to determine whether a transaction should be accounted for as a business combination or as an asset acquisition. The amendment provides an assessment framework to determine when a series of integrated activities is not a business. The amendments are effective for business combinations occurring on or after the beginning of the first annual reporting period beginning on or after January 1, 2020. The Company is assessing the impact of this amendment on its Interim Financial Statements.
Amendment to IAS 1: Classification of Liabilities as Current or Non-Current
The amendments to IAS 1 clarify the requirements relating to determining whether a liability should be presented as current or non-current in the statement of financial position. Under the new requirements, the assessment of whether a liability is presented as current or non-current is based on the contractual arrangements in place as at the reporting date and does not impact the amount or timing of recognition. The amendment applies retrospectively for annual reporting periods beginning on or after January 1, 2023. The Company is currently evaluating the potential impact of this amendment on the Company's consolidated financial statements.
CONTINGENT LIABILITIES
The Company recognizes loss contingency provisions for probable losses when management can reasonably estimate the loss. When the estimated loss lies within a range, the Company records a loss contingency provision based on its best estimate of the probable loss. If no particular amount within that range is a better estimate than any other amount, the mid-point of the range is used. As information becomes known a loss contingency provision is recorded when a reasonable estimate can be made. The estimates are reviewed at each reporting date and the estimates are changed when expectations are revised. An outcome that deviates from the Company's estimate may result in an additional expense or release in a future accounting period.
During 2015, the Company was named as a defendant in a lawsuit in New Brunswick for breach of confidence, conversion, breach of contract, conspiracy and breach of trust, breach of fiduciary duty, and negligent misrepresentation. The Company believes the lawsuit to be without merit though it will rigorously defend the action. No amount has been accrued in relation to the Interim Financial Statements for the claim.
On March 3, 2017, a claim in connection with a proposed class-action lawsuit (the "Claim") was filed with the Supreme Court of Nova Scotia (the "Court") seeking to represent a class who purchased medical marijuana that was the subject of the Company's product recalls in December 2016 and January 2017 as it may have contained trace elements of the pesticides myclobutanil and bifenazate which are not approved for use by Licensed Producers. The Claim identifies several causes of action including, among others: (i) negligent design, development and testing, (ii) negligent manufacturing, (iii) negligent distribution, marketing and sale, (iv) breach of contract, and (v) breach of the Competition Act, the Consumer Protection Act, and the Sale of Goods Act, and is seeking remedy in the form of, among other things, the disgorgement of profits accrued to the Company for the sale of contaminated products, exemplary or punitive damages and certain costs.
The Claim was amended on November 16, 2017, to include a claim for alleged adverse health consequences caused as a result of using the recalled product. As at the date hereof, the Company has not received any medical information demonstrating adverse health effects caused as a result of using the recalled product.
The amended Claim also contained a request for an order certifying the proceeding as a class proceeding.
During late June 2018, certification hearings were heard before the Court. On January 18, 2019, the Court issued its decision granting certification. On March 4, 2019, the Company filed a notice for leave to appeal the certification of the class action brought against it. Leave to appeal was granted and the appeal was heard on October 15, 2019 and the decision was reserved. On April 30, 2020, the Nova Scotia Court of Appeal ruled that the plaintiff failed to present any evidence that the cannabis purchased by medical customers in 2016 could cause any particular adverse health effects. As a result, class members would not be able to bring claims for damages for adverse health effects in the class proceeding. On June 26, 2020, the plaintiff filed an application for leave to appeal the Nova Scotia Court of Appeal's decision with the Supreme Court of Canada. On November 5, 2020, the application for leave to appeal was dismissed by the Supreme Court of Canada.
The Company is contesting what remains of the litigation. The Company reported the Claim to its insurance provider which appointed counsel to defend the Claim. Insurance may be available to cover a portion of the fees or damages which may be associated with the Claim although the Company's coverage may be subject to varying limits and exclusions. The litigation process will continue into the foreseeable future unless settled out of court. An amount of $730 is included in the statements of financial position under other long-term liabilities.
On June 16, 2020, a claim in connection with a proposed national consumer protection class-action lawsuit was filed with the Court of Queen's Bench in Alberta (the "Alberta Claim") seeking damages against several Canadian cannabis companies including the Company. The Alberta Claim does not particularize all of the claims against the companies; however it makes allegations with respect to the content of THC and CBD in the companies' products. In order to proceed as a class action, the Court must certify the action as a class action. A certification hearing has not yet been scheduled. The Company has reported the Alberta Claim to its insurers.
DISCLOSURE CONTROLS AND PROCEDURES AND INTERNAL CONTROL OVER FINANCIAL REPORTING
In accordance with National Instrument 52-109 - Certification of Disclosure in Issuers' Annual and Interim Filings ("NI 52-109") and Rule 13a-15 under the United States Securities Exchange Act of 1934, as amended (the "Exchange Act"), the establishment and maintenance of Disclosure Controls and Procedures ("DCP") and Internal Control Over Financial Reporting ("ICFR") is the responsibility of management.
Management has determined that the Company will become a "large accelerated filer", as defined in Rule 12b-2 under the Exchange Act, with effect from August 31, 2021 (being the last day of the Company's current fiscal year). Accordingly, the Company will cease to be an "emerging growth company" as defined in section 3(a) of the Exchange Act, and the Company's "ICFR" as of August 31, 2021 will become subject to audit by KPMG LLP, the Company's independent registered public accounting firm. The Company has engaged KPMG LLP to perform an "integrated audit" which will encompass an opinion on the fairness of presentation of the Company's audited annual consolidated financial statements for the financial year then ended, as well as an opinion on the effectiveness of the Company's ICFR. KPMG LLP's attestation report on the Company's ICFR is required to be incorporated into the Company's annual report on Form 40-F under the Exchange Act for the year ended August 31, 2021.
DISCLOSURE CONTROLS AND PROCEDURES
The Company maintains a set of DCP designed to provide reasonable assurance that information required to be publicly disclosed is recorded, processed, summarized and reported on a timely basis. As required by NI 52-109, an evaluation of the design and operation of our DCP was done as of February 28, 2021 under the supervision and with the participation of management, including our Chief Executive Officer ("CEO") and Chief Financial Officer ("CFO") using the criteria set forth in Internal Control - Integrated Framework, issued by the Committee of Sponsoring Organizations of the Treadway Commission (the "COSO 2013 Framework"). Based upon this evaluation, our CEO and CFO concluded that because of the material weaknesses in our ICFR described below, our DCP were not effective as at such date.
INTERNAL CONTROL OVER FINANCIAL REPORTING
NI 52-109 requires the CEO and CFO to certify that they are responsible for establishing and maintaining ICFR for the Company and that those internal controls have been designed and are effective in providing reasonable assurance regarding the reliability of financial reporting and the preparation of financial statements in accordance with IFRS. The CEO and CFO are also responsible for disclosing any changes to the Company's internal controls during the most recent period that have materially affected, or are reasonably likely to materially affect, its internal control over financial reporting.
MATERIAL CHANGES TO THE CONTROL ENVIRONMENT
There have been no changes to the Company's ICFR during the three and six months ended February 28, 2021 that have materially affected, or are likely to materially affect, the Company's ICFR.
COMPLEX SPREADSHEET CONTROLS
Management concluded that the Company did not implement and maintain effective controls surrounding complex spreadsheets related to the Company's valuation of inventories and property, plant and equipment. Spreadsheets are inherently prone to error due to the manual nature and increased risk of human error. The Company's controls related to complex spreadsheets did not address all identified material risks associated with manual data entry, updating of assumptions and evidence of sufficient levels of review of completed spreadsheets.
Remediation Plan and Activities
Management has taken steps since this material weakness was first identified for the fiscal year ended August 31, 2018, to improve its process including establishing checklists to be completed quarterly with multiple levels of review. Additional process improvements and further refinements continued to be developed during the quarter. Senior management has discussed this material weakness with the Audit Committee and the Board of Directors continues to review progress on these remediation activities on a regular and ongoing basis. The Company had engaged a third party to aid in the identification, assessment and remediation over the design and implementation effectiveness of internal controls over financial reporting. The Company changed service providers during Q2 2020 and a new third party has been working on identification and assessment of internal control over financial reporting with the remediation activities being handled by the Company. The Company continued during the quarter to perform some scoping exercises and planning for an enterprise resource planning ("ERP") implementation. The ERP possesses specific functionality to reduce the manual nature of compiling some of the input data for the complex spreadsheets and this is expected to reduce the risk of error on complex spreadsheets. The ERP system will be implemented over several phases with the first phase expected to be operational on September 1, 2021.
GENERAL INFORMATION TECHNOLOGY CONTROLS (GITC)
The Company did not have effective information technology ("IT") general controls over all operating systems, databases, and IT applications supporting financial reports. Accordingly, process-level automated controls and manual controls that were dependent upon the information derived from IT systems were also determined to be ineffective.
Remediation Plan
The Company has engaged a third party to aid in the identification and assessment of the design and implementation effectiveness of IT related ICFR. The Company is implementing the remediation internally. The Company continued to advance a logical access review to enhance segregation of duties on certain in-scope applications during Q2 2021. The majority of this work is expected to take place in calendar 2021. The Company also continued during the quarter to perform some scoping exercises and planning for an ERP implementation as described above. The ERP system will be implemented over several phases with the first phase expected to be operational on September 1, 2021.
Property, plant and equipment
The Company did not maintain effective controls over the acquisition and disposal of capital assets, including the review of source documentation, authorization for disposal and processing of the related financial transaction(s).
Remediation Plan
To further strengthen controls surrounding property, plant and equipment, management has initiated or intends to initiate during calendar 2021 the following procedures:
• Implement a formalized capitalization policy and provide additional training and guidance to internal teams regarding the communicated processes;
• Enhancements to the quarterly capital budget analysis prepared on major projects; and
• Review the asset register and perform a physical inventory count of all the Company's assets.
The Company made advancements during Fiscal 2020 on formalizing the capitalization policy and providing additional training and guidance on processes, further enhancing the capital budget analysis and reviewing the asset register and performing a physical inventory count of the Company's assets. There remains further work to be done which the Company currently expects will be completed during calendar 2021.
RISK FACTORS
The Company's business is subject to risks inherent in a high growth, heavily regulated enterprise, and the Company has identified certain risks pertinent to its business that may have affected or may affect its business, financial conditions, results of operations and cash flows, as further described throughout this MD&A and under "Risk Factors" in the AIF. For additional risk factors, readers are directed to the Company's most recent AIF available under the Company's issuer profile on SEDAR at www.sedar.com and on EDGAR at www.sec.gov. As a general matter, management of the Company attempts to assess and mitigate any risks and uncertainties by retaining experienced professional staff and assuring that the Board of Directors and senior management of the Company are monitoring the risks impacting or likely to impact the business on a continuous basis.
(i) Credit Risk
Credit risk arises from deposits with banks, short-term investments (excluding investments in equity securities), outstanding trade and loan receivables, and restricted investments. For trade receivables, the Company does not hold any collateral as security but mitigates this risk by dealing only with what management believes to be financially sound counterparties and, accordingly, does not anticipate significant loss for non-performance. For other receivables, out of the normal course of business such as the loan receivable, management generally obtains guarantees and general security agreements. The maximum exposure to credit risk of cash, short-term investments, accounts receivable, loan receivable, and restricted investment on the statement of financial position at February 28, 2021 approximates $91,499 (August 31, 2020 - $99,736).
As of February 28, 2021, the Company's aging of trade receivables was as follows:
| FEBRUARY 28, 2021 | AUGUST 31, 2020 | |||||||
| 0-60 days | $ | 7,980 | $ | 11,023 | ||||
| 61-120 days | 231 | 73 | ||||||
| Gross trade receivables | $ | 8,211 | $ | 11,096 | ||||
| Less: Expected credit losses | (7 | ) | (13 | ) | ||||
| $ | 8,204 | $ | 11,083 | |||||
(ii) Liquidity Risk
The Company's liquidity risk is the risk that the Company will not be able to meet its financial obligations as they become due. The Company manages its liquidity risk by reviewing on an ongoing basis its capital requirements. At February 28, 2021, the Company had $61,123 (August 31, 2020 - $24,600) of cash and working capital of $112,398 (August 31, 2020 - $141,123). Further, the Company may potentially access equity capital through the capital markets if required.
The Company is obligated to the following contractual maturities relating to their undiscounted cash flows as at February 28, 2021:
| Carrying Amount | Contractual Cash | Less than 1 year | 1 to 3 years | 3 to 5 years | More than 5 years | |||||||||||||
| Accounts payable and accrued liabilities | $ | 13,808 | $ | 13,808 | $ | 13,808 | $ | - | $ | - | $ | - | ||||||
| Long-term debt | 58,807 | 58,869 | 6,080 | 52,659 | 130 | - | ||||||||||||
| Interest payments | - | 3,101 | 2,514 | 587 | - | - | ||||||||||||
| $ | 72,615 | $ | 75,778 | $ | 22,402 | $ | 53,246 | $ | 130 | $ | - |
The contractual maturities noted above are based on contractual due dates of the respective financial liabilities.
In connection with the Company's Moncton Campus, the Company is contractually committed to approximately $375 of capital expenditures.
(iii) Market Risk
Market risk is the risk that the fair value or future cash flows of a financial instrument will fluctuate because of changes in market prices. Market risk for the Company is comprised of:
Interest rate risk is the risk that the fair value or future cash flows of a financial instrument will fluctuate because of changes in market interest rates. The Company is exposed to interest rate risk at February 28, 2021 pursuant to the variable rate loans described in Note 11. A 1% change in benchmark interest rates will increase or decrease the Company's interest expense by $585 (August 31, 2020 - $1,150) per year.
(iv) Concentration risk
The Company's accounts receivable are primarily due from provincial government agencies (three of which, individually, represented more than 10% of the Company's revenues during the three months ended February 28, 2021), corporations (none of which represented more than 10% of the Company's revenues during the period), and legal trusts and, thus, the Company believes that the accounts receivable balance is collectible.
