INTRODUCTION
This Management’s Discussion and Analysis dated April 11, 2022 (this “MD&A”), should be read in conjunction with the condensed consolidated interim financial statements (the “Interim Financial Statements”) of Organigram Holdings Inc. (the “Company” or “Organigram”) for the three and six months ended February 28, 2022 (“Q2 Fiscal 2022”) and the audited consolidated financial statements for the year ended August 31, 2021 (the “Annual Financial Statements”), including the accompanying notes thereto, which have been prepared in accordance with International Financial Reporting Standards (“IFRS”) as issued by the International Accounting Standards Board (“IASB”).
Financial data in this MD&A is based on the Interim Financial Statements of the Company for the three and six months ended February 28, 2022, and has been prepared in accordance with International Accounting Standard ("IAS") 34 Interim Financial Reporting as issued by the IASB, unless otherwise stated. All financial information in this MD&A is expressed in thousands of Canadian dollars (“$”), except for share and per share calculations, references to $ millions and $ billions, per gram (“g”) or kilogram (“kg”) of dried flower and per milliliter (“mL”) or liter (“L”) of cannabis oil calculations.
This MD&A contains forward-looking information within the meaning of applicable securities laws, and the use of non-IFRS measures. Refer to “Cautionary Statement Regarding Forward-Looking Information” and “Cautionary Statement Regarding Certain Non-IFRS Measures” included within this MD&A.
The financial data in this MD&A contains certain financial and operational performance measures that are not defined by and do not have any standardized meaning under IFRS but are used by management to assess the financial and operational performance of the Company. These include, but not limited to, the following:
•Yield per plant (in grams);
•Target production capacity;
•Average net selling price per gram and per unit;
•Adjusted gross margin; and
•Adjusted EBITDA.
The Company believes that these non-IFRS financial measures and operational performance measures, in addition to conventional measures prepared in accordance with IFRS, enable investors to evaluate the Company’s operating results, underlying performance and prospects in a similar manner to the Company’s management. The non-IFRS financial performance measures are defined in the sections in which they appear. Adjusted gross margin and adjusted EBITDA are reconciled to IFRS in the “Financial Review and Discussion of Operations” section of this MD&A.
As there are no standardized methods of calculating these non-IFRS measures, the Company’s approaches may differ from those used by others, and the use of these measures may not be directly comparable. Accordingly, these non-IFRS measures are intended to provide additional information and should not be considered in isolation or as a substitute for measures of performance prepared in accordance with IFRS.
The Company’s wholly-owned subsidiary, Organigram Inc., is a licensed producer of cannabis and cannabis derived products (a “Licensed Producer” or “LP”) under the Cannabis Act (Canada) and the Cannabis Regulations (Canada) (together, the “Cannabis Act”) and regulated by Health Canada. The Company’s wholly-owned subsidiaries, The Edibles and Infusions Corporation (“EIC”) and Laurentian Organic Inc. ("Laurentian") are also licensed under the Cannabis Act as described below.
The Company’s head and registered office is located at 35 English Drive, Moncton, New Brunswick, E1E 3X3. The Company’s common shares (“Common Shares”) are listed under the ticker symbol “OGI” on both the Nasdaq Global Select Market (“NASDAQ”) and on the Toronto Stock Exchange (“TSX”). Any inquiries regarding the Company may be directed by email to investors@organigram.ca.
Additional information relating to the Company, including the Company’s most recent annual information form (the “AIF”), is available under the Company’s issuer profile on the Canadian Securities Administrators’ System for Electronic Document Analysis and Retrieval (“SEDAR”) at www.sedar.com. The Company’s reports and other information filed with or furnished to the United States Securities and Exchange Commission (“SEC”) are available on the SEC’s Electronic Document Gathering and Retrieval System (“EDGAR”) at www.sec.gov.
MANAGEMENT’S DISCUSSION AND ANALYSIS | FOR THE THREE AND SIX MONTHS ENDED FEBRUARY 28, 2022 AND 2021 1
CAUTIONARY STATEMENT REGARDING FORWARD-LOOKING INFORMATION
Certain information herein contains or incorporates comments that constitute forward-looking information within the meaning of applicable securities legislation (“forward-looking information”). Forward-looking information, in general, can be identified by the use of forward-looking terminology such as “outlook”, “objective”, “may”, “will”, “could”, “would”, “might”, “expect”, “intend”, “estimate”, “anticipate”, “believe”, “plan”, “continue”, “budget”, “schedule” or “forecast” or similar expressions suggesting future outcomes or events. They include, but are not limited to, statements with respect to expectations, forecasts or other characterizations of future events or circumstances, and the Company’s objectives, goals, strategies, beliefs, intentions, plans, estimates, projections and outlook, including statements relating to the Company’s plans and objectives, or estimates or predictions of actions of customers, suppliers, partners, distributors, competitors or regulatory authorities; and statements regarding the Company’s future economic performance. These statements are not historical facts but instead represent management beliefs regarding future events, many of which by their nature are inherently uncertain and beyond management control. Forward-looking information has been based on the Company’s current expectations about future events.
Certain forward-looking information in this MD&A includes, but is not limited to the following:
•Moncton Campus (as defined herein), Winnipeg facility (as defined herein) and Laurentian Facility (as defined herein) licensing and target production capacity and timing thereof;
•Expectations regarding production capacity, facility size, THC (as defined herein) content, costs and yields;
•Expectations regarding the prospects of the Company’s collaboration with a wholly-owned subsidiary of British American Tobacco plc (together, "BAT");
•Expectations regarding the prospects for the Company’s subsidiary EIC;
•Expectations regarding the prospects for the Company's newly acquired subsidiary Laurentian;
•The ongoing impact of the current global health crisis caused by COVID-19 (as defined below);
•Expectations around demand for cannabis and related products, future opportunities and sales, including the relative mix of medical versus adult-use recreational products, the relative mix of products within the adult-use recreational category including wholesale, the Company’s financial position, future liquidity and other financial results;
•Legislation of additional cannabis types and forms for adult-use in Canada including regulations relating thereto and the implementation thereof and our future product forms;
•Expectations around branded products and derivative-based products with respect to timing, launch, product attributes, composition and consumer demand;
•Strategic investments and capital expenditures, and expected related benefits;
•Expectations regarding the resolution of litigation and other legal proceedings;
•The general continuance of current, or where applicable, assumed industry conditions;
•Changes in laws, regulations and guidelines, including those relating to the recreational and/or medical cannabis markets domestically and internationally;
•The price of cannabis and derivative cannabis products;
•Expectations around the availability and introduction of new genetics including consistency and quality of plants and the characteristics thereof;
•The impact of the Company’s cash flow and financial performance on third parties, including its supply partners;
•Fluctuations in the price of Common Shares and the market for the Common Shares;
•The treatment of the Company’s business under governmental regulatory regimes and tax laws, including the Excise Act (as defined herein) and the renewal of the Company’s licenses thereunder and the Company’s ability to obtain export licenses from time to time;
•The Company’s growth strategy, targets for future growth and forecasts of the results of such growth;
•Expectations concerning access to capital and liquidity and the Company’s ability to access the public markets to fund operational activities and growth;
•The Company’s ability to remain listed on the TSX and NASDAQ and the impact of any actions it may be required to take to remain listed;
•The ability of the Company to generate cash flow from operations and from financing activities;
•The competitive conditions of the industry, including the Company’s ability to maintain or grow its market share;
•Moncton Campus and Laurentian Facility expansion plans, capital expenditures, current and targeted production capacity and timing thereof; and
•Expectations concerning Fiscal 2022 performance including with respect to revenue, adjusted gross margins and SG&A.
Forward-looking information is provided for the purposes of assisting the reader in understanding the Company and its business, operations, risks, financial performance, financial position and cash flows as at and for the periods ended on certain dates, and to present information about management’s current expectations and plans relating to the future, and the reader is cautioned that such statements may not be appropriate for other purposes. In addition, this MD&A may contain forward-looking information attributed to third party industry sources. Undue reliance should not be placed on forward-looking
MANAGEMENT’S DISCUSSION AND ANALYSIS | FOR THE THREE AND SIX MONTHS ENDED FEBRUARY 28, 2022 AND 2021 2
information, as there can be no assurance that the plans, intentions or expectations upon which they are based will occur. Forward-looking information does not guarantee future performance and involves known and unknown risks, uncertainties and other factors that may cause actual results or events to differ materially from those anticipated in the forward-looking information. By its nature, forward-looking information involves numerous assumptions, known and unknown risks and uncertainties, both general and specific, that contribute to the possibility that the expectations, predictions, forecasts, projections and conclusions will not occur or prove accurate, that assumptions may not be correct, and that objectives, strategic goals and priorities will not be achieved. These and other factors that may cause actual results or events to differ materially from those anticipated in the forward-looking information.
Factors that could cause actual results to differ materially from those set forth in forward-looking information include, but are not limited to: financial risks; dependence on senior management, the board of directors of the Company (the “Board of Directors”), consultants and advisors; availability and sufficiency of insurance including continued availability and sufficiency of director and officer and other forms of insurance; the Company and its subsidiaries being able to, where applicable, cultivate cannabis pursuant to applicable law and on the currently anticipated timelines; industry competition; general economic conditions and global events, including COVID-19 retail store closures or reduced sales at retail stores or otherwise due to COVID-19; heightened economic and industry uncertainty as a result of COVID-19 and governmental action in respect thereto, including with respect to impacts on production, operations, product development, new product launches, disclosure controls and procedures or internal control over financial reporting, including as they may be impacted by delays in remediation due to work from home policies and other COVID-19 impacts, demand for products and services, third-party suppliers or service providers, and any existing or new international business partnerships; production facilities running at less than full capacity due to reduced workforce for reasons related to COVID-19 (as described herein) and market demand; potential supply chain and distribution disruptions; product development, facility and technological risks; changes to government laws, regulations or policy, including environmental or tax, or the enforcement thereof; agricultural risks; ability to maintain any required licenses or certifications; supply risks; product risks; construction delays or postponements; packaging and shipping logistics; expected number of medical and adult-use recreational cannabis users in Canada and internationally; potential time frame for the implementation of legislation to legalize cannabis internationally; the Company’s, its subsidiaries' and its investees’ ability to, where applicable, obtain and/or maintain their status as Licensed Producers (as defined herein) or other applicable licenses; risk factors affecting its investees; availability of any required financing on commercially attractive terms or at all; the potential size of the regulated adult-use recreational cannabis market in Canada; demand for and changes in the Company’s cannabis and related products, including the Company’s derivative products (as defined herein), and the sufficiency of the retail networks to supply such demand; ability to enter and participate in international market opportunities; general economic, financial market, regulatory, industry and political conditions affecting the Company; the ability of the Company to compete in the cannabis industry and changes in the competitive landscape; a material decline in cannabis prices; the Company’s ability to manage anticipated and unanticipated costs; the Company’s ability to implement and maintain effective internal control over financial reporting and disclosure controls and procedures; and, other risks and factors described from time to time in the documents filed by the Company with securities regulators in Canada and the United States. Material factors and assumptions used in establishing forward-looking information include that construction and production activities will proceed as planned, and demand for cannabis and related products will change in the manner expected by management, in each case after taking into account any impacts related to COVID-19 that are currently known or predicted by management based on the limited information available and the fluidity and uncertainty of the crisis. All forward-looking information is provided as of the date of this MD&A.
The Company does not undertake to update any such forward-looking information whether as a result of new information, future events or otherwise, except as required by law.
ADDITIONAL INFORMATION ABOUT THE ASSUMPTIONS, RISKS AND UNCERTAINTIES OF THE COMPANY’S BUSINESS AND MATERIAL FACTORS OR ASSUMPTIONS ON WHICH INFORMATION CONTAINED IN FORWARD-LOOKING INFORMATION IS BASED IS PROVIDED IN THE COMPANY’S DISCLOSURE MATERIALS, INCLUDING IN THIS MD&A UNDER “RISK FACTORS” AND THE COMPANY’S CURRENT AIF UNDER “RISK FACTORS”, FILED WITH THE SECURITIES REGULATORY AUTHORITIES IN CANADA AND AVAILABLE UNDER THE COMPANY’S ISSUER PROFILE ON SEDAR AT WWW.SEDAR.COM, AND FILED WITH OR FURNISHED TO THE SEC AND AVAILABLE ON EDGAR AT WWW.SEC.GOV. ALL FORWARD-LOOKING INFORMATION IN THIS MD&A IS QUALIFIED BY THESE CAUTIONARY STATEMENTS.
CAUTIONARY STATEMENT REGARDING CERTAIN NON-IFRS MEASURES
This MD&A contains certain financial and operational performance measures that are not recognized or defined under IFRS (“Non-IFRS Measures”). As there are no standardized methods of calculating these Non-IFRS Measures, the Company's approaches may differ from those used by others, and, this data may not be comparable to similar data presented by other licensed producers of cannabis and cannabis companies. For an explanation of these measures to related comparable financial information presented in the Interim Financial Statements prepared in accordance with IFRS, refer to the discussion below.
MANAGEMENT’S DISCUSSION AND ANALYSIS | FOR THE THREE AND SIX MONTHS ENDED FEBRUARY 28, 2022 AND 2021 3
The Company believes that these Non-IFRS Measures are useful indicators of operating performance and are specifically used by management to assess the financial and operating performance of the Company. These Non-IFRS Measures include, but are not limited, to the following:
•Net revenue represents revenue from the sale of cannabis and non-cannabis products. Net revenue is further broken down as follows:
◦Medical net revenue represents Canadian net revenue for medical cannabis sales direct to patient and to Canadian medical wholesale only.
◦Recreational net revenue represents net revenue for recreational consumer sales only.
◦International and Wholesale net revenue represents cannabis net revenue from international and domestic wholesale bulk cannabis only.
◦Other net revenue represents non-cannabis net revenue for other support functions only.
Management believes the net revenue measures provide more specific information about the net revenue purely generated from its core cannabis business and by market type.
•Average net selling price per gram and per unit are calculated by taking net revenue, which is then divided by total grams or total units sold in the period. Average net selling price per gram and per unit is further broken down as follows:
◦Average net selling price per gram of dried flower represents the average net selling price per gram for dried flower sales only, including medical sales, domestic and international wholesale bulk cannabis sales in the period.
Management believes the average net selling price per gram or per unit provide more specific information about the pricing trends over time by product type.
•Yield per plant in grams is calculated by taking the total amount of grams of dried flower harvested, excluding trim, and dividing it by the total number of plants harvested.
Management believes that yield per plant in grams provides a useful measure about the efficiencies gained through its operating activities.
•Gross margin before fair value adjustments is calculated by subtracting cost of sales, before the effects of unrealized gain (loss) on changes in fair value of biological assets, realized fair value on inventories sold and other inventory charges from total net revenue. Gross margin before fair value adjustments percentage is calculated by dividing gross profit before fair value adjustments (defined above) divided by net revenue.
Management believes that these measures provide useful information to assess the profitability of our cannabis operations as it excludes the effects of non-cash fair value adjustments on inventory and biological assets, which are required by IFRS.
•Adjusted gross margin is calculated by subtracting cost of sales, before the effects of (i) unrealized gain (loss) on changes in fair value of biological assets; (ii) realized fair value on inventories sold and other inventory charges; (iii) provisions and impairment of inventories and biological assets; (iv) provisions to net realizable value; (v) COVID-19 related charges; and (vi) unabsorbed overhead relating to underutilization of the production facility grow rooms and manufacturing equipment, most of which is related to non-cash depreciation expense, from net revenue. Adjusted gross margin percentage is calculated by dividing adjusted gross margin by net revenue. Adjusted gross margin is reconciled to IFRS in the "Financial Review and Discussion of Operations" section of this MD&A.
Management believes that these measures provide useful information to assess the profitability of our operations as it represents the normalized gross margin generated from operations and excludes the effects of non-cash fair value adjustments on inventories and biological assets, which are required by IFRS. The most directly comparable measure to adjusted gross margin calculated in accordance with IFRS is gross margin before fair value changes to biological assets and inventories sold.
•Adjusted EBITDA is calculated as net income (loss) excluding: financing costs, net of investment income; income tax expense (recovery); depreciation, amortization, reversal of/or impairment, gain (loss) on disposal of property, plant and equipment (per the condensed consolidated interim statement of cash flows); share-based compensation (per the condensed consolidated interim statement of cash flows); share of loss and impairment loss from loan receivable and investments in associates; change in fair value of contingent consideration; change in fair value of derivative liabilities; expenditures incurred in connection with research & development activities; unrealized gain (loss) on changes in fair value of biological assets; realized fair value on inventories sold and other inventory charges;
MANAGEMENT’S DISCUSSION AND ANALYSIS | FOR THE THREE AND SIX MONTHS ENDED FEBRUARY 28, 2022 AND 2021 4
provisions to net realizable value of inventories; COVID-19 related charges; government subsidies; legal provisions; incremental fair value component of inventories sold from acquisitions; transaction costs; and share issuance costs. Adjusted EBITDA is reconciled to IFRS in the "Financial Review and Discussion of Operations" section of this MD&A.
Adjusted EBITDA is intended to provide a proxy for the Company’s operating cash flow and derive expectations of future financial performance for the Company, and excludes adjustments that are not reflective of current operating results. The most directly comparable measure to adjusted EBITDA calculated in accordance with IFRS is net income (loss).
Non-IFRS Measures should be considered together with other data prepared in accordance with IFRS to enable investors to evaluate the Company’s operating results, underlying performance and prospects in a manner similar to the Company’s management. Accordingly, these non-IFRS measures are intended to provide additional information and should not be considered in isolation or as a substitute for measures of performance prepared in accordance with IFRS.
BUSINESS OVERVIEW
NATURE AND HISTORY OF THE COMPANY’S BUSINESS
The Company’s wholly-owned subsidiary Organigram Inc. is a Licensed Producer of cannabis under the Cannabis Act.
The Company conducts most of its operations at its facility located in Moncton, New Brunswick. The Company has expanded its main facility over time to create additional production capabilities by strategically acquiring land and buildings adjacent to the main facility (together, the “Moncton Campus”), including to add capacity for the manufacture of derivative products allowed for legal sale by Licensed Producers under amendments to the Cannabis Act.
Patients order medical cannabis dried flower and cannabis derivative-based products from the Company primarily through the Company’s online store or by phone. Medical cannabis dried flower and cannabis derivative-based products are delivered by secure courier or other methods permitted by the Cannabis Act. The Company’s prices may vary based on grow time, strain yield, THC level, terpene profile and market conditions.
The Company is also authorized for wholesale shipping of cannabis plant cuttings, dried flower, blends, pre-rolls and cannabis derivative-based products to approved retailers and wholesalers for adult-use recreational cannabis under the individual provincial and territorial regulations as per the Cannabis Act.
In March 2021, the Company formed a Product Development Collaboration ("PDC") with BAT, a leading, multi-category consumer goods business, and established a "Centre of Excellence" (the "CoE") to focus on the next generation of cannabis products with an initial focus on CBD. The CoE is established at the Company's Moncton Campus, which holds the Health Canada licenses required to conduct research and development activities with cannabis products. Both companies contributed scientists, researchers, and product developers to the CoE which is governed and supervised by a steering committee consisting of an equal number of senior members from both companies. Under the terms of the PDC Agreement, both Organigram and BAT have access to certain of each other’s intellectual property (“IP”) and, subject to certain limitations, have the right to independently, globally commercialize the products, technologies and IP created by the CoE pursuant to the PDC Agreement.
During April 2021, the Company expanded its manufacturing and production footprint with the acquisition of EIC (the "Winnipeg Facility"), located in Winnipeg, Manitoba. The Winnipeg Facility holds a research license and standard processing license under the Cannabis Act and is in the process of completing its application to add the sale of derivative products, including cannabis edibles, to its standard processing license. As a wholly-owned subsidiary, EIC enables the Company to penetrate a new product category and gain access to its leadership's expertise in the confectionary space. The Winnipeg Facility also provides the Company with a share of the cannabis infused gummies market.
The Company has additional cannabis production capacity at its new wholly-owned subsidiary, Laurentian, located in Lac-Supérieur, Quebec (the "Laurentian Facility"), acquired on December 21, 2021. The Laurentian Facility has a cultivation focus on artisanal craft flower and on the production of hash, a cannabis derivative. Laurentian provides the Company with a foothold in the important Quebec market, and also adds to the Company's premium product portfolio, providing further opportunities for margin expansion. Laurentian holds a standard processing and cultivation license under the Cannabis Act.
STRATEGY
Organigram’s strategy is to leverage its broad brand and product portfolio and culture of innovation to increase market share, drive profitability and grow into an industry leader that delivers long-term shareholder value.
MANAGEMENT’S DISCUSSION AND ANALYSIS | FOR THE THREE AND SIX MONTHS ENDED FEBRUARY 28, 2022 AND 2021 5
The pillars of the Company’s strategy are:
1.Innovation
2.Consumer Focus
3.Efficiency
4.Market Expansion
1. Innovation
Meeting the demands of a fast-growing industry with changing consumer preferences requires the ability to innovate and create breakthrough products that are embraced by the market and establish a long-term competitive advantage.
The Company is committed to maintaining a culture of innovation and has established a track record of introducing differentiated products that are able to quickly capture market share, specifically:
•SHRED X Kief-Infused Blends: an innovative milled flower product with a 50%/50% kief and flower combination that delivers convenience and flavour with high potency;
•SHRED: the first milled flower product, blended to create curated flavour profiles; and
•Edison JOLTS: Canada’s first flavoured high-potency lozenge with 100 mg of THC per package.
Consistent with its innovation culture, in Fiscal 2021, the Company announced the launch of its CoE as part of its PDC with BAT, a leading multi-category consumer goods business. The CoE focuses on research and development to develop the next generation of cannabis products, with an initial focus on CBD.
The Company has also made a strategic investment in Hyasynth Biologicals Inc. ("Hyasynth"), a biotechnology company that is deploying proprietary technology to develop cannabinoids using biosynthesis. During the quarter, the Company made an additional investment in Hyasynth as described herein.
2. Consumer Focus
The Company seeks to address the changing needs of the adult cannabis consumer through its broad product portfolio with offerings in the most popular categories and price points. Based on ongoing consumer research, the portfolio is refreshed frequently with different flower strains, new package formats and new product introductions. The Company’s alignment with consumers is evidenced by its growing market share and category leadership:
•SHRED Tropic Thunder and Funk Master: #1 and #2 top selling flower products1;
•Edison JOLTS: #1 position for ingestible extracts2; and
•SHRED’ems gummies: among the top-selling gummies in Canada and provide the Company with a #3 share in the gummies category1.
In addition to third-party and direct consumer research, the Company maintains close contact with consumers through an active social presence and has established the Cannabis Innovators Panel. This online panel engages with up to 2,500 cannabis consumers across Canada on a regular basis and helps to inform the Company on product development and brand initiatives.
3. Efficiency
From its inception, the Company has remained committed to being an efficient operator.
The Company’s growing facility in Moncton, New Brunswick utilizes three-tier cultivation technology to maximize square footage. The facility has a proprietary information technology in place to track all aspects of the cannabis cultivation and harvest process. The Company maintains a continuous improvement program to maximize harvest yield while reducing operating costs. This is complemented by the introduction of automation in post-harvest production, including two pre-roll machines.
The Company’s Winnipeg Facility is highly-automated and able to efficiently handle both small-batch artisanal manufacture of edibles as well as large-scale nutraceutical-grade production. The facility provides the Company with the unique ability to produce a wide range of high-quality edible products at attractive price points.
The Company's Laurentian Facility, houses a cultivation and derivatives processing facility. The Company has committed $11 million in growth capital expenditures based on current expectations for the cost of expanding the facility to increase capacity, processing and storage space and deliver on automation.
1 Hifyre data extract from March 25, 2022
2 Edison JOLTS was recorded as the most sold item in the capsules and mints category, Hifyre data extract from March 25, 2022
MANAGEMENT’S DISCUSSION AND ANALYSIS | FOR THE THREE AND SIX MONTHS ENDED FEBRUARY 28, 2022 AND 2021 6
Key efficiency milestones achieved or planned in Fiscal 2022 include:
•Significant reduction in cultivation costs, to achieve a 25% cost decrease from Fiscal 2021's average amount (Q2 2022 year to date was a 42% reduction from the prior years comparison six month period);
•Doubling the harvest volume exceeding THC levels of 22% compared to Fiscal 2021;
•Adding two pre-roll machines at the Moncton Campus; and
•Commissioning high-speed pouch packing lines for SHRED and Big Bag O' Buds products.
4. Market Expansion
The Company is committed to expanding its market presence by adding to its product offering and enhancing its geographical presence. This strategy is enabled by strategic merger and acquisition opportunities and assessing expansion into international markets.
Recent examples of market expansion include:
•December 2021 acquisition of Laurentian which adds craft cultivation and hash to the Company's product portfolio and increases its presence in Quebec;
•Shipments to Canndoc in Israel and Cannatrek in Australia to supply bulk cannabis into these markets generating $4.4 million in net revenue during Q2 2022;
KEY QUARTERLY FINANCIAL AND OPERATING RESULTS
| Q2-2022 | Q2-2021 | CHANGE | % CHANGE | ||||||||||||||||||||
| Financial Results | |||||||||||||||||||||||
| Gross revenue | $ | 43,934 | $ | 19,292 | $ | 24,642 | 128 | % | |||||||||||||||
| Net revenue | $ | 31,836 | $ | 14,643 | $ | 17,193 | 117 | % | |||||||||||||||
| Cost of sales | $ | 24,955 | $ | 31,146 | $ | (6,191) | (20) | % | |||||||||||||||
| Gross margin before fair value adjustments and other charges | $ | 6,881 | $ | (16,503) | $ | 23,384 | nm | ||||||||||||||||
Gross margin % before fair value adjustments and other charges(1) | 22 | % | (113) | % | 135 | % | nm | ||||||||||||||||
| Operating expenses | $ | 18,019 | $ | 12,077 | $ | 5,942 | 49 | % | |||||||||||||||
Adjusted EBITDA(2) | $ | 1,556 | $ | (7,840) | $ | 9,396 | (120) | % | |||||||||||||||
| Net loss | $ | (4,047) | $ | (66,389) | $ | 62,342 | nm | ||||||||||||||||
| Net cash used in operating activities | $ | (803) | $ | (10,430) | $ | 9,627 | nm | ||||||||||||||||
Adjusted Gross Margin(3) | $ | 8,255 | $ | (680) | $ | 8,935 | nm | ||||||||||||||||
Adjusted Gross Margin %(3) | 26 | % | (5) | % | 31 | % | (620) | % | |||||||||||||||
| Financial Position | |||||||||||||||||||||||
Working capital(4) | $ | 189,597 | $ | 112,398 | $ | 77,199 | 69 | % | |||||||||||||||
| Inventories and biological assets | $ | 56,187 | $ | 43,374 | $ | 12,813 | 30 | % | |||||||||||||||
| Total assets | $ | 585,102 | $ | 392,764 | $ | 192,338 | 49 | % | |||||||||||||||
| Operating Results | |||||||||||||||||||||||
| Kilograms harvested - dried flower | 10,037 | 4,467 | 5,570 | 125 | % | ||||||||||||||||||
| Kilograms sold - dried flower | 11,785 | 3,688 | 8,097 | 220 | % | ||||||||||||||||||
Note 1: Equals gross margin before fair value adjustments (as reflected in the Interim Financial Statements) divided by net revenue.
Note 2: Adjusted EBITDA is a non-IFRS measure that the Company defines as net income (loss) before: financing costs, net of investment income; income tax expense (recovery); depreciation, amortization, reversal of/or impairment, gain (loss) on disposal of property, plant and equipment (per the statement of cash flows); share-based compensation (per the statement of cash flows); share of loss and impairment loss from loan receivable and investments in associates; change in fair value of contingent consideration; change in fair value of derivative liabilities; expenditures incurred in connection with research & development activities; unrealized gain (loss) on changes in fair value of biological assets; realized fair value on inventories sold and other inventory charges; provisions to net realizable value of inventories; impairment of biological assets; COVID-19 related charges; government subsidies; legal provisions; incremental fair value component of inventories sold from acquisitions; transaction costs; and share issuance costs. See the cautionary statement regarding non-IFRS financial measures in the “Introduction” section at the beginning of this MD&A and the reconciliation to IFRS measures in the "Financial Results and Review of Operations" section of this MD&A.
Note 3: Adjusted gross margin is a non-IFRS measure that the Company defines as net revenue less: (i) cost of sales, before the effects of unrealized gain (loss) on changes in fair value of biological assets, realized fair value on inventories sold and other inventory charges; excluding (ii) provisions and impairment of inventories and biological assets; (iii) provisions to net realizable value; (iv) COVID-19 related charges; and (v) unabsorbed overhead relating to underutilization of the production facility and equipment, most of which is related to non-cash depreciation expense. See the cautionary statement regarding non-IFRS financial measures in the “Introduction” section at the beginning of this MD&A and the reconciliation to IFRS measures in the "Financial Results and Review of Operations section of this MD&A. Adjusted gross margin % equals adjusted gross margin divided by net revenue.
Note 4: Equals current assets less current liabilities (as reflected in the Interim Financial Statements).
MANAGEMENT’S DISCUSSION AND ANALYSIS | FOR THE THREE AND SIX MONTHS ENDED FEBRUARY 28, 2022 AND 2021 7
REVENUE
For the three months ended February 28, 2022, the Company reported $31,836 in net revenue. Of this amount $24,887 (78%) was attributable to sales to the adult-use recreational market, $4,437 (14%) to the international market, $1,920 (6%) to the medical market and $592 (2%) to other revenues. Q2 Fiscal 2022 net revenue increased 117%, or $17,193, from the prior year comparative period’s net revenue of $14,643, primarily due to an increase of $12,899 in adult-use recreational revenue, an increase in international revenue by $4,363, partly offset by the $(141) decrease in medical revenue. Net revenue from the adult-use recreational market was higher by $12,899 (108%), generated from a significant increase in sales volumes from value oriented product sold in Q2 2022, which also carry a lower average selling price.
Sale of flower from all product categories and distribution channels comprised 77% of net revenue in the quarter. The average net selling price ("ASP") of flower decreased to $2.08 per gram than as compared to $2.99 per gram for Q2 Fiscal 2021, as both the Company and the Canadian cannabis industry continued to experience general price compression in the adult-use recreational and medical markets as these markets matured, and the customer and product mix evolved to focus more on value offerings. Selling prices are prone to fluctuation and there may be further price compression if the market remains oversupplied. The Company is committed to refining its product mix as customer preferences evolve and it continues to revitalize its higher margin Edison branded flower products.
The volume of flower sales in grams increased 220% to 11,785 kg in Q2 Fiscal 2022 compared to 3,688 kg in the prior year comparative quarter, primarily as a result of the market shift towards large format value products and the success of the Company's products in these brands and formats.
COST OF SALES
Cost of sales for the three months ended February 28, 2022 decreased to $24,955 compared to $31,146 in the prior year comparative period, primarily as a result of $12,838 reduction in inventory provisions and net realizable adjustments to cost of inventory in the current period, compared to the prior period comparative, offset by an increase in sales volume in the adult-use recreational market. Included in Q2 Fiscal 2022 cost of sales are $711 of inventory provisions related to provisions for unsaleable inventories and to reflect an estimated decline in selling prices. Additionally, $nil was incurred with respect to unabsorbed fixed overhead costs as a result of improved operating production volumes at the Moncton Campus. The prior fiscal year’s comparative period had inventory provisions and net realizable value adjustments of $13,549, as well as unabsorbed fixed overhead costs of $2,274.
GROSS MARGIN BEFORE FAIR VALUE ADJUSTMENTS AND ADJUSTED GROSS MARGIN
The Company realized gross margin before fair value adjustments for the three months ended February 28, 2022 of $6,881, or 22% as a percentage of net revenue, compared to $(16,503), or (113)%, in the prior year comparative period. The increase in gross margin before fair value adjustments as a percentage of net revenue is largely due to higher net revenue, reduction in both inventory provisions and unabsorbed overhead costs and lower cost of sales per unit sold in Q2 Fiscal 2022.
Adjusted gross margin3 for the three months ended February 28, 2022 was $8,255, or 26% as a percentage of net revenue, compared to $(680), or (5)%, in the prior year comparable quarter. This was largely due to the current period's lower cost of sales combined with a higher overall sales volumes, net of the impact of the lower ASP from the shift in the sales mix to value priced products and brands. Please refer to the “Financial Review and Discussion of Operations” section of this MD&A for a reconciliation of adjusted gross margin to net revenue.
OPERATING EXPENSES
Operating expenses include: General and administrative; sales and marketing; research and development; share-based compensation expenses; along with impairment on property, plant and equipment and intangible assets. During Q2 Fiscal 2022, the operating expenses were $18,019, which is an increase from the prior year comparative amount to $12,077, primarily due to the higher employee costs from the growth of the team, higher trade and marketing spend, an increase in technology spend, research and development costs as well as a $2,000 impairment charge relating to the decommissioned Moncton chocolate line (as part of the Company's review of efficiencies between sites, chocolate will now be produced from the Winnipeg Facility).
General and administrative expenses of $10,581 increased from the prior year's comparison quarter of $7,188, primarily due to an increase in general office expenses as a result of the Company's growth, an increase in employee costs, an increase to technology costs, and also for one-time transaction and on-going costs from the acquisition of Laurentian.
Sales and marketing expenses of $3,417 increased from the prior year's comparative quarter of $3,141, primarily due to higher advertising and promotion costs, and marketing initiatives related to the launch of the Company's new products.
3 Adjusted gross margin is a non-IFRS financial measure. See the cautionary statement regarding non-IFRS financial measures in the “Introduction” section of this MD&A, and the discussion under the heading “Adjusted EBITDA” and the reconciliation to IFRS measures in the "Financial Results and Review of Operations" section of this MD&A.
MANAGEMENT’S DISCUSSION AND ANALYSIS | FOR THE THREE AND SIX MONTHS ENDED FEBRUARY 28, 2022 AND 2021 8
Research and development costs of $1,184 increased from the prior year's comparative quarter of $802, primarily due to the current periods' cost for the CoE.
ADJUSTED EBITDA
Positive adjusted EBITDA4 was $1,556 in Q2 Fiscal 2022 compared to negative adjusted EBITDA of $7,840 in Q2 Fiscal 2021. The $9,396 increase in adjusted EBITDA is primarily attributed to the increase in adjusted gross margins due to the higher volume of products sold, the impact of lower production costs that decreased cost of sales per unit sold, offset by the impact of lower ASP from higher quantities of value brands sold and by the increase in general and administrative expenses during Q2 Fiscal 2022. Please refer to the “Financial Review and Discussion of Operations” section of this MD&A for a reconciliation of adjusted EBITDA to net gain.
NET LOSS
The net loss was $4,047 in Q2 Fiscal 2022 compared to a net loss of $66,389 in Q2 Fiscal 2021. The decrease in net loss was primarily attributed to higher gross margin as described above and the $10,633 impact of the change in the fair value of derivative liabilities compared to Q2 Fiscal 2021.
FINANCIAL POSITION
Working capital as at February 28, 2022 decreased to $189,597 from $234,349 as at August 31, 2021 mainly due to the purchase of property, plant and equipment of $15,708, the acquisition of Laurentian for cash consideration of $7,000, increased investment in Hyasynth of $2,595 and cash used in operating activities of $10,144.
KEY DEVELOPMENTS DURING THE QUARTER AND SUBSEQUENT TO FEBRUARY 28, 2022
On December 21, 2021, the Company announced the acquisition of Laurentian, a Quebec-based licensed producer of artisanal craft cannabis and hash for $36 million, net of working capital adjustments, plus earnout share consideration, if any. The acquisition is expected to be accretive, adds more premium products to the Company's portfolio and strengthens its presence in the province of Quebec.
On December 22, 2021, the Company announced that it had made an additional $2.5 million investment in Hyasynth. The Company has to date invested $10 million in Hyasynth, a pioneer in the field of cannabinoid science and biosynthesis. The investment positions the Company to benefit from advances in cannabinoid technology and deploy new active ingredients for consumer products in the health and wellness and recreational spaces.
On February 24, 2022, the Company announced the election of its Board of Directors, and the appointment of BAT's nominee Simon Ashton to the Board.
On March 1, 2022, the Company announced that BAT had invested $6.3 million to exercise its rights pursuant to an Investor Rights Agreement to enhance its equity ownership position in the Company to 19.4% (as at December 31, 2021) from 18.8%. The Investor Rights Agreement was entered into between the Company and BAT in connection with the formation of the PDC between the two companies and the strategic investment of $221 million made by BAT in March 2021.
On March 17, 2022, the Company launched its social impact strategy, Organigram Operating for Good, joining the Pledge 1% movement by donating up to 1% of employee time towards causes aimed at "Building Healthy Communities Where We Live and Work."
OPERATIONS AND PRODUCTION
Moncton Cultivation Campus
While the vast majority of incremental production capacity in the initial period of recreational legalization by the Company’s competitors was generated from greenhouse (not indoor) production, Organigram focused on a core competency of controlling conditions in precisely built indoor environments with a commitment to continuous improvement and investment in information technology.
4 Adjusted EBITDA is a non-IFRS financial measure. See the cautionary statement regarding non-IFRS financial measures in the “Introduction” section of this MD&A, and the discussion under the heading “Adjusted EBITDA” and the reconciliation to IFRS measures in the "Financial Results and Review of Operations" section of this MD&A.
MANAGEMENT’S DISCUSSION AND ANALYSIS | FOR THE THREE AND SIX MONTHS ENDED FEBRUARY 28, 2022 AND 2021 9
The Company continually assesses the critical facets of the lighting and environmental elements in its facilities in an effort to drive maximum quality and yield in the plants it cultivates. It is the Company’s intention to continually improve and refine its cultivation and post-harvesting practices in an effort to achieve a competitive advantage in the space.
In Fiscal 2021, as part of its continuous improvement program, the Company implemented various new initiatives at the Moncton Campus such that the average THC content per plant and average yield per plant both increased in the second half of Fiscal 2021. "THC" refers to tetrahydrocannabinol, the principal psychoactive compound in cannabis. Higher THC content continues to be desired by consumers and the higher yield per plant combined with greater economies of scale on ramping up cultivation capacity has resulted in lower cultivation costs per gram and ultimately benefits adjusted gross margins when the product is sold. The Company continues to believe it is well-positioned and supported by the flexibility of the facility at the Moncton Campus to continue to see improvement in these areas. As the Company works with a number of different genetics and cultivars this process of improvement may not be linear or consistent across plants.
As part of its review of the continually expanding Canadian cannabis markets, its long-term demand forecast model and its cultural commitment to continuous improvement, management is reviewing its production capacity and methodologies with a focus on cost reductions which will further improve margins over time. Management obtained approval from the Board of Directors to complete the Phase 4C expansion of its Moncton Campus which will significantly increase capacity, enabling the Company to meet the increased consumer demand for its products. The Company has also identified additional changes to its growing and harvesting methodologies, including facility design improvements that should assist the operating conditions of the Moncton Campus resulting in higher quality flower and a reduction to production costs. The current approximate annual capacity is 55,000 kg of flower as of the date of this MD&A and the increase to the number of growing rooms and yield improvements are targeted when complete to result in an approximate annual production capacity of 80,000 kg of flower. The total capacity of the Moncton Campus will continue to fluctuate as the Company further refines its growing methods and room utilization.
The Company harvested 10,037 kg of dried flower during Q2 Fiscal 2022 compared to 4,467 kg of flower in Q2 Fiscal 2021. The increase of 5,570 kg (125%) from the comparative period was primarily related to increased cultivation planting and staffing during Q4 Fiscal 2021 and Q1 Fiscal 2022, that was done in order to meet the increased demand for many of its new products as part of its product portfolio revitalization as well as the increase in industry demand on the back of the ongoing accelerated retail store build out particularly in Ontario.
Moncton Edibles and Derivatives Facility
Contained in the 56,000 square foot expansion referred to as Phase 5 of the Moncton Campus is the Company's edibles and derivative facility. This space includes, among other things, additional extraction capacity and, office space and was designed under European Union GMP (“EU GMP”) standards. EU GMP describes the minimum standard that a manufacturer must meet in its production processes. EU GMP certification is subject to inspections coordinated by the European Medicines Agency. The Company has no plans to seek certification in the immediate future but continues to evaluate paths to certification. The facility includes CO2 and Hydrocarbon Extraction equipment, as well as expanded areas for formulation including short path distillation for edibles and vape pen formulas, high speed cart filling and automated packaging. Some of this equipment remains in the commissioning and research and development phase.
Winnipeg Edibles Facility
As part of the EIC acquisition completed in Q3 Fiscal 2021, the Company now has a purpose-built, highly-automated, 51,000 square-foot manufacturing facility in Winnipeg, Manitoba which was also designed under EU GMP standards. The Company has no plans to seek certification in the immediate future but continues to evaluate paths to certification. The facility design and the equipment specifications were also designed to handle both smaller-batch artisanal manufacturing as well as large-scale nutraceutical-grade high-efficiency manufacturing and to produce highly customizable, precise, and scalable cannabis-infused products in various formats and dosages including pectin, gelatin, and sugar-free soft chews (gummies), chocolates, toffee and caramel with novel capabilities such as infusions, striping and the possibility of using fruit purees.
The Winnipeg Facility currently holds a research license and a standard processing license issued under the Cannabis Act; it is in the process of completing its application to add the activity of sale of derivative cannabis products to its Standard Processing License. Until the Winnipeg Facility receives its sales license, it is capable of manufacturing products in bulk for further processing, review and sale by Organigram or third-party Licensed Producers, for which it may provide white-label services in future. The Company commenced commercial operations during Fiscal 2021 and at this time the Winnipeg facility has 51 employees.
The Company has been reviewing the capabilities and efficiencies of the Moncton Campus and Winnipeg Facility to determine how best to allocate its resources and functions across the two sites. As part of these operational efficiency initiatives, during February the Company ceased the production of chocolates from Moncton, and has now decommissioned the Moncton Chocolate line with the intention to manufacture and sell chocolates from its Winnipeg Facility.
MANAGEMENT’S DISCUSSION AND ANALYSIS | FOR THE THREE AND SIX MONTHS ENDED FEBRUARY 28, 2022 AND 2021 10
Laurentian Facility
The Company acquired Laurentian in December 2021. The Laurentian Facility has 6,800 square feet of cultivation area, which is currently being expanded to 33,000 square feet. The Laurentian Facility is equipped to produce approximately 600 kilograms of flower and 1 million packaged units of hash annually. The expansion program currently underway is expected to increase annual capacity to 2,400 kilograms of flower and 2 million packaged units of hash. The Company has committed $10 million towards completing the expansion and management believes that there are opportunities for costs savings from further investments in automation.
CANADIAN ADULT-USE RECREATIONAL MARKET
Organigram continues to increase its focus on generating meaningful consumer insights and applying these insights to the ongoing optimization of its brand and product portfolio with a goal of ensuring that they are geared towards meeting consumer preferences. The Company aggressively and successfully revitalized its product portfolio to meet rapidly evolving consumer preferences in Fiscal 2021, and through its increased focus on insights in Fiscal 2022, will continue its expansion of brands and products aimed at driving continued momentum in the marketplace.
DRIED FLOWER AND PRE-ROLLS
Dried flower and pre-rolls remain the first and second largest product categories, respectively, in the Canadian adult-use recreational market and the Company believes that these categories will continue to dominate based on the sales history in mature legal markets in certain U.S. states as well as regulatory restrictions on other form factors (e.g. the 10 mg per package THC limit in the edibles category). While we expect consumer preferences will slowly evolve away from THC and price being the key purchase drivers, today they appear to be the most important attributes to consumers for flower products. Over time, genetic diversity and other quality related attributes such as terpene profile, bud density, and aroma, are expected to become increasingly important. While the Company’s efforts are focused on delivering on consumer expectations today, it is concurrently planning for the eventual evolution towards a more nuanced approach to cannabis appreciation through its ongoing work in genetic breeding and pheno-hunting with the goal of offering a unique and relevant assortment to consumers. Additionally, the strategic acquisition of Laurentian in December 2021 provides the Company with the opportunity to participate in the growing craft cannabis segment, through its craft facility located in the province of Quebec.
The Company's portfolio of brands continues to show strong momentum within the flower segment in Canada and as of February 2022 maintains its #1 share in the flower category5. The SHRED varieties Tropic Thunder and Funk Master were the top two flower products sold in Canada, with Gnarberry holding the #4 position5, and Big Bag O' Buds continues to see continued month over month market share momentum in the large format category. The growth and significant contribution of these dried flower value segment brands, however, has also contributed to an overall decline in margins for Organigram and many of its peers over the last number of quarters. To counteract this phenomenon, Organigram is dedicated to revitalizing the Edison brand and product portfolio, by launching new dried flower offerings with unique genetics and higher potency THC. In Q2 2022, two new strains were launched under the Edison brand to appeal to the cannabis enthusiast. The successful completion of these initiatives is expected to increase Edison sales, that have a higher ASP than value brands and therefore attract higher margins. To address the growing demand for strain differentiation in the value segment, post quarter-end, the Company introduced a new strain to its Big Bag O' Buds line to increase the SKUs in market for this product to five.
CANNABIS DERIVATIVES
While dried flower and pre-rolls are currently the largest categories in Canada, derivative cannabis products, including vapes, concentrates and edibles, are projected to continue to increase in market share over the next several years at the expense of flower.
Organigram is committed to these growing categories. The strategic acquisition of EIC in April 2021 provides the Company with the opportunity to produce high quality, edible products such as soft chews (gummies) and chocolates, at scale, positioning the Company to effectively compete in this segment. The acquisition of Laurentian in December 2021 also provides the Company with the ability to produce high-quality hash products in the growing hash segment.
In March 2022, Organigram launched SHRED X Kief-Infused Blends. This is another innovative product that combines milled flower with the cannabis derivative, kief, in a 50-50 ratio. The Company expects that providing the convenience of milled flower with the THC potency of kief will gain popularity with consumers.
SHRED'ems, the Company's cannabis-infused gummies, an extension of the popular, value-priced SHRED brand, were introduced in Q1 Fiscal 2022 and quickly gained momentum within the gummy segment. As of February 2022, all SHRED'ems SKUs were among the top 15 gummies in Canada4. Subsequent to quarter-end, the Company added two flavours to the
5 Source: Data extracted from Hifyre, March 25, 2022
MANAGEMENT’S DISCUSSION AND ANALYSIS | FOR THE THREE AND SIX MONTHS ENDED FEBRUARY 28, 2022 AND 2021 11
SHRED'ems line and also introduced SHRED'ems POP! – gummies formulated in three soft drink flavours: Cola, Root Beer and Cream Soda. Monjour, a CBD-forward wellness brand was launched in Q1 of Fiscal 2022 with four SKUs. As of February 2022, Monjour's Berry Good Day product is among the top 20 of gummies sold in Canada. Overall, Organigram holds the #3 market share position in the gummy category5.
Edison JOLTS, mint flavoured, high potency THC lozenges that combine the benefits of sublingual oil with the convenience and portability of soft gels reached the #1 position in terms of number of items sold in the capsules and mints category6. The Company intends to build on the positive momentum of Jolts with further line extensions in the near future.
Organigram intends to leverage the capabilities of the Winnipeg Facility beyond soft chews and is working to offer new and novel chocolate and confectionary product offerings into the Canadian market during Fiscal 2022.
Organigram has renewed its focus on building share within the vape category through unique formulations, premium hardware, and high-quality inputs. Fiscal 2022 will see numerous innovative offerings in the vape segment, all geared towards building our share in this category. In March 2022, the Company launched three new vape SKUs under the SHRED X brand in the popular 510 cartridge format. These have been formulated in the flavour profiles of the SHRED milled flower products.
RESEARCH AND PRODUCT DEVELOPMENT
The Company’s management believes the cannabis industry is still in the nascent stages of product development and that product innovation backed by core fundamental research and development is necessary to establish a long-term competitive advantage in the industry. Research and development and innovation remain a hallmark of Organigram. In fact, there have been many recent efforts and investments made in Fiscal 2021 and early Fiscal 2022 which we anticipate will continue in the remainder of Fiscal 2022 and strengthen the Company's focus in this area and are expected to allow Organigram to continue to position itself to be at the forefront of launching new, innovative, differentiated products and formulations that appeal to adult consumers.
BAT Product Development Collaboration and Centre of Excellence
In early Q4 Fiscal 2021, the Company announced the successful launch of the CoE outlined in the PDC Agreement with BAT which was established to focus on research and product development activities for the next generation of cannabis products, as well as cannabinoid fundamental science, with an initial focus on CBD. The CoE is located at the Moncton Campus, which holds the Health Canada licenses required to conduct research and development activities with cannabis products. The Company and BAT have already created a number of new full-time product development, analytical science and innovation related roles which is expected to ramp up in the second phase of the CoE expansion in Fiscal 2022 when further full time employees will be added. The CoE is governed and supervised by a steering committee consisting of an equal number of senior members from each of the Company and BAT. To date, the CoE remains on schedule for staffing and project planning, and the remaining core construction projects will be completed in Q3 Fiscal 2022. The CoE includes state of the art shared research and development, Good Production Practices ("GPP") food preparation, sensory testing and bio-lab research spaces, and the strategic collaboration has already begun moving from planning to implementation.
As previously disclosed, under the terms of the PDC Agreement, both Organigram and BAT have access to certain of each other’s IP and, subject to certain limitations, have the right to independently, globally commercialize the products, technologies and IP created pursuant to the PDC Agreement. Approximately $31 million of BAT’s investment in Organigram has been reserved for Organigram’s portion of its funding obligations under a mutually agreed initial budget. Costs relating to the CoE are being funded equally by Organigram and BAT. BAT will own all IP developed under this collaboration and will grant to Organigram a royalty-free, perpetual, global license to all such IP. Each party has also agreed to grant to the other a non-exclusive, perpetual and irrevocable license to certain existing IP of such party and its affiliates for purposes of conducting the development activities and exploiting the products, technologies and IP created per the PDC Agreement, subject to certain restrictions.
Plant Science, Breeding and Genomics Research and Development in Moncton
The Company’s cultivation plans focus on developing a pipeline of unique and sought-after genetics, maximizing flower quality in terms of THC yield, terpene profiles and general plant health to meet evolving consumer demand. The Company plans to pursue the expansion of its in-house breeding program dedicating significant research and development space for breeding, phenotyping, screening and various plant science trials while prioritizing commercial cultivation capacity.
Organigram also works with a range of nurseries with different competencies and genetic portfolios in order to screen and identify the latest genetics that will resonate with consumers and grow in the Company's unique environment. The Company believes this kind of strategic and creative product development process is a key differentiator for both the Edison portfolio and the Company overall, and looks forward to introducing more new genetics over the next few quarters.
6 Source: Data extracted from Hifyre, March 25, 2022
MANAGEMENT’S DISCUSSION AND ANALYSIS | FOR THE THREE AND SIX MONTHS ENDED FEBRUARY 28, 2022 AND 2021 12
OUTLOOK
The Company's outlook remains positive on the cannabis market both in Canada and internationally. Canada-wide recreational retail sales are expected to total $5.9 billion in calendar 2022.7
The Company believes there are a few factors creating tailwinds to facilitate further industry growth. First, the legalization in October of 2019 of cannabis derivative products has attracted consumers who were not interested in smoking or vaporizing dried flower (including pre-rolls). Newer categories such as vape pens, edibles (soft chews, chocolates), beverages and other ingestible products have significantly expanded the addressable market and proliferation of SKUs continues in these categories offering consumers a wider range of product formulations, flavours and price points. Second, the number of brick-and-mortar retail stores has increased significantly, particularly in Ontario where the number of stores surpassed 1,479 with the national count now surpassing 3,100 stores. Third, the industry as a whole has made a concerted effort to match or beat illicit market pricing, particularly on dried flower, which has helped to accelerate the conversion of consumers from illicit to legal consumption.
Notwithstanding the above, the cannabis industry in Canada remains highly competitive and generally oversupplied versus the current market demand considering both regulated Licensed Producers and the still largely unfettered operations of the illicit market including many online delivery platforms. Since adult-use recreational legalization in Canada, consumer trends and preferences have continued to evolve, including significant growth in the large format value segment, a desire for higher THC potency particularly in dried flower, as well as a penchant for newness, including new genetic strains and novel products. Organigram continues to revitalize its product portfolio to address these changing consumer trends and preferences in order to grow sales and capture market share. We have also seen supply and demand dynamics brought into a more equilibrated state as many of the larger LPs have shuttered surplus cultivation capacity including as a direct result of M&A activities. At the same time, the number of retail stores in Canada began to grow meaningfully for the first time since legalization.
Against this backdrop of strong industry growth, increased demand for the Company's products is evidenced by Organigram's growing national adult-use recreational retail market share ("market share") in Canada. The Company's market share grew from 7.6% in September 2021 to 8.4% in March 2022, ranking Organigram as the #3 licensed producer (LP) in Canada by market share8. Management believes that the Company is better equipped to fulfill demand in Q3 Fiscal 2022 with larger harvests expected as compared to Q2 Fiscal 2022. In addition to the domestic sales growth, during Q2 Fiscal 2022, Organigram completed two shipments to Canndoc Ltd. in Israel and one shipment to Cannatrek in Australia. With a full year of revenues from its Winnipeg Facility, and additional revenues from Laurentian, management expects that the Company will generate higher revenue in Fiscal 2022 as compared to Fiscal 2021.
The Company intends to continue to leverage its Moncton Campus which it believes can provide a sustainable competitive advantage over its peers as a result of having over 100 three-tiered cultivation rooms each with the ability to deliver bespoke growing environmental conditions (lighting, humidity, fertigation, plant density) tailored individually to a wide variety of genetics. With an improved genetics portfolio (including some genetics which are not widely sold in the legal market) and a higher average THC being grown than the previous year, the Company believes it is well positioned to take advantage of the dried flower and pre-roll categories which collectively represents approximately 70%8 of the Canadian legal market.
Opportunities to scale up new genetics require a patient and deliberate process where cultivation protocols are trialed for each strain and adjusted through multiple growth cycles before full roll-out to multiple rooms in the facility. The Company has successfully launched several new genetics under the Edison brand. Organigram’s commitment to invest in new genetics continues and the Company expects to launch more new high THC genetics in the near term.
In addition to traditional dried flower and pre-roll offerings, Organigram expects to be in a position to generate more revenue growth from the production of soft chews and other confectionary products with the specialized equipment in the Winnipeg Facility under the direction of leadership that brings significant expertise in confectionary manufacturing. The Company completed its first sales of Winnipeg Facility manufactured soft chews during Q4 Fiscal 2021, and with several line extensions planned for Fiscal 2022, management expects meaningful growth in this product category.
Laurentian was acquired in December 2021 and adds hash and artisanal craft cannabis to the Company's offering. The application of the Company's direct sales force and national distribution, along with the increased capacity from the completion of Laurentian's expansion program, is expected to generate additional revenue in Fiscal 2022.
Unabsorbed overhead costs were $nil in Q2 Fiscal 2022, a reduction from $709 in Q1 Fiscal 2022, and a significant reduction from the $2,274 in Q2 Fiscal 2021 the prior year's comparison period. The prior periods had significant unabsorbed fixed overhead costs as a consequence of the unused or idled grow rooms. With the Company's cultivation operating at capacity
7 BDSA Canada Market Forecast, January 7, 2022
8 Source: Hifyre data extract from March 25, 2022
MANAGEMENT’S DISCUSSION AND ANALYSIS | FOR THE THREE AND SIX MONTHS ENDED FEBRUARY 28, 2022 AND 2021 13
there was no current period charge for idled or unused rooms and for the six months ended February 28, 2022, $709 of cost related to underutilization of certain derivative products manufacturing equipment. This Company does not expect to incur further expenses for unabsorbed overheads for the rest of Fiscal 2022.
The Company expects to begin to see a sequential improvement in adjusted gross margins in Q3 Fiscal 2022 largely due to lower cultivation costs from higher plant yields, and realize the benefit of several ongoing cost efficiency improvements including increased automation such as the second pre-roll machine which reduces the reliance on manual labour. The extra capacity from the phase 4c expansion, and lower production costs from operating at a larger scale are expected to start occurring during Q4 Fiscal 2022.
The overall level of Q3 Fiscal 2022 adjusted gross margins versus Q3 Fiscal 2021 adjusted gross margins will also be dependent on other factors including, but not limited to, product category and brand sales mix.
Organigram has identified the following opportunities which it believes have the potential to further improve adjusted gross margins over time:
•Economies of scale and efficiencies gained as it continues to scale up cultivation, including the grow rooms that will be available after completing the construction of Phase 4C of the Moncton Campus;
•The Company has planned for additional changes to its cultivation and harvesting methodologies and design improvements that should enhance the operating conditions of the Moncton Campus and result in higher quality flower and improved yields (which reduces production costs). See “Balance Sheet, Liquidity and Capital Resources” section of this MD&A for more detail;
•International sales have historically attracted higher margins and are expected to represent a greater proportion of the Company’s revenue. (see “International” section below);
•More sales in the vape category, that generally attract higher margins;
•Continued investment in automation is expected to drive cost efficiencies and reduce dependence on manual labour;
•The recent launches of new products such as SHRED X Kief-Infused Blends and SHRED X vapes represent new potential avenues of growth with expected attractive long-term margin profiles for the Company;
•The launch of additional products across different derivative categories;
•The margin contribution from the addition of the Laurentian portfolio of products; and
•The margin improvement to chocolates from the relocation of the production from the Moncton Campus to the Winnipeg Facility.
In Fiscal 2022, research and development activities have been shown separately from general and administrative expenses in the Interim Financial Statements, but are still be grouped with operating expenses.
Outside of Canada, the Company serves international markets (including Israel and Australia) from Canada via export permits and is looking to augment sales channels internationally over time. In early Q1 Fiscal 2021, the Israeli Ministry of Health amended its quality standards for imported medical cannabis. In June 2021, the Company received its Good Agricultural Practice certification from Control Union Certifications under the Control Union Medical Cannabis Standard (“CUMCS”) in order to permit it to continue its shipments to Israel under the amended Israeli quality standards. The Company has sought an updated certification for IMC-GMP by CUMCS to demonstrate it continues to meet the evolving Israeli quality standards. Shipments to Canndoc Ltd., resumed during Q1 Fiscal 2022 and Q2 Fiscal 2022 with expectations to continue in Fiscal 2022 subject to regulatory conditions. Future shipments are contingent upon the timing and receipt of regulatory approval from Health Canada, including obtaining an export permit, as well as timing and receipt of regulatory approval from the Israeli regulatory authority, including obtaining an import permit. Recent political changes and cannabis election ballot initiatives for both medical and recreational use in the United States suggest that the potential movements to U.S. federal legalization of cannabis (THC) have increased momentum but the timing and outcome remains difficult to predict. As the Company continues to monitor and develop a potential U.S. THC strategy, it continues to evaluate CBD entry opportunities in the United States.
With the significant capital injection from BAT and the PDC Agreement, the Company is well positioned to expand into the U.S. and further international markets at the appropriate time and subject to applicable laws. Under the PDC Agreement, the Company is granted a worldwide, royalty-free, sub-licensable, perpetual license to exploit IP developed under the PDC Agreement in any field. This license, which is non-exclusive outside of Canada and sole in Canada will also enhance Organigram’s ability to enter markets outside of Canada, including through sublicensing arrangements with established operators.
Without limiting the generality of risk factor disclosures referenced in the “Risk Factors” section of this MD&A, the expectations concerning revenue, adjusted gross margins and SG&A are based on the following general assumptions: consistency of revenue experience with indications of third quarter 2022 performance to date, consistency of ordering and return patterns or other factors with prior periods and no material change in legal regulation, market factors or general economic conditions.
MANAGEMENT’S DISCUSSION AND ANALYSIS | FOR THE THREE AND SIX MONTHS ENDED FEBRUARY 28, 2022 AND 2021 14
The Company disclaims any obligation to update any of the forward looking information except as required by applicable law. See cautionary statement in the “Introduction” section at the beginning of this MD&A.
MEDICAL MARKET
BDSA estimates the Canadian medical market value for calendar 2022 at $407M, an 18% year-over-year decline9. Also, the number of medical patients are projected to further decrease within the year. With this projected decline, largely due to migration to the recreational channel, Organigram has shifted its medical strategy and will focus on the important veteran community all while continuing to serve its civilian patient base with superior patient care and an ongoing portfolio optimization. The main change to the Company's strategy is the termination of its existing agreements with the majority of cannabis clinics aimed at patient acquisition.
STRATEGIC INVESTMENTS AND DEVELOPMENTS
The Company remains committed to the development and acquisition of cannabis or hemp related businesses and production assets in Canada and abroad (subject to compliance with applicable laws), intellectual properties, technologies or other assets that are synergistic to the Company’s Canadian and international strategies.
Hyasynth Strategic Investment
On September 12, 2018, the Company entered into a strategic investment to purchase an aggregate of $10,000 convertible secured debentures (the “Hyasynth Debentures”) of Hyasynth, a biotechnology company based in Montreal and pioneer in the field of cannabinoid science and biosynthesis, in three separate tranches. Organigram purchased $5,000 in secured convertible 8% Hyasynth Debentures on September 12, 2018 and advanced an additional $2,500 on October 23, 2020, as a result of Hyasynth’s achievement of the contractual production-related milestone for the second tranche (“Tranche 2”). On December 22, 2021, following the waiver of the remaining milestone, the Company acquired an additional $2,500 of Hyasynth Debentures. Additionally, the parties have amended certain terms of the Debenture Purchase Agreement governing the Debentures’ purchased by Organigram from Hyasynth in previous tranches. The Company has instituted a series of detailed milestones for Hyasynth to achieve by specified target dates. The failure to achieve any such milestone constitutes an Event of Default under the Debentures. In addition, the Company has a veto right over future financings conducted by Hyasynth. This brings the Company’s total face value of convertible debentures investment in Hyasynth to $10,000, which provides the Company with a potential ownership interest of up to 48.9% on a fully diluted basis. The Company has appointed two nominee directors to the board of Hyasynth, which currently has seven members.
Hyasynth has patent-pending enzymes, yeast strains and processes that make it possible to produce phytocannabinoids and phytocannabinoid analogues in genetically modified strains of yeast. These proprietary enzymes and yeast strains have allowed Hyasynth to produce CBG, CBD and THC for novel and specialized products such as vaporizable cannabis products and cannabis infused beverages for a fraction of the cost of traditional plant-based production. The Company anticipates that its investment in Hyasynth has the potential to provide the Company with access to what it expects to be the future of cannabinoid production. The Company expects that cost-effectiveness and scalability will be necessary to meet the needs of both the Canadian and global cannabis markets.
In addition to the investment, Organigram has the right to purchase all of Hyasynth’s cannabinoid or cannabinoid-related production at a 10% discount to the wholesale market price for a period of ten years. In addition to the major cannabinoids such as CBD and THC, Hyasynth is also pursuing the production and scale-up of minor cannabinoids found only in limited quantities in the cannabis plant. One subset of these minor cannabinoids includes propyl-cannabinoids such as cannabigerivarin (CBGV) and tetrahydrocannabivarin (THCV). While the Company expects that there will always be a need for premium indoor grown cannabis flowers, working with Hyasynth offers the potential to more quickly respond to market demand for pure and consistent cannabinoid-based ingredients.
USE OF PROCEEDS OF PRIOR FINANCINGS
On November 12, 2020, the Company closed an underwritten public offering of units for net proceeds of $64.8 million. The Company used $55.0 million of the proceeds to repay a portion of the Company’s term loan on December 1, 2020 and used the balance of the net proceeds for working capital and other general corporate purposes. Please refer to the “Balance Sheet, Liquidity, and Capital Resources” section of the MD&A for further information.
FINANCIAL REVIEW AND DISCUSSION OF OPERATIONS
CAUTIONARY NOTE REGARDING NON-IFRS FINANCIAL MEASURES
The Company uses certain non-IFRS performance measures such as adjusted EBITDA (excluding fair value adjustment to inventory and biological assets) and adjusted gross margin in its MD&A or other public documents, which are not measures
9 BDSA Market Forecast, September 2021
MANAGEMENT’S DISCUSSION AND ANALYSIS | FOR THE THREE AND SIX MONTHS ENDED FEBRUARY 28, 2022 AND 2021 15
calculated in accordance with IFRS and have limitations as analytical tools. These performance measures have no prescribed meaning under IFRS and therefore amounts presented may not be comparable to similar data presented by other companies. The data is intended to provide additional information and should not be considered in isolation or as a substitute for measures of performance such as net income or other data prepared in accordance with IFRS. See the cautionary statement in the “Introduction” section at the beginning of this MD&A.
FINANCIAL HIGHLIGHTS
Below is the quarter-over-quarter analysis of the changes that occurred for the three months ended February 28, 2022 and February 28, 2021. Commentary is provided in the pages that follow.
| Q2-2022 | Q2-2021 | $ CHANGE | % CHANGE | ||||||||||||||||||||||||||
| Financial Results | |||||||||||||||||||||||||||||
| Gross revenue | $ | 43,934 | $ | 19,292 | $ | 24,642 | 128 | % | |||||||||||||||||||||
| Net revenue | $ | 31,836 | $ | 14,643 | $ | 17,193 | 117 | % | |||||||||||||||||||||
| Cost of sales | $ | 24,955 | $ | 31,146 | $ | (6,191) | (20) | % | |||||||||||||||||||||
| Gross margin before fair value adjustments | $ | 6,881 | $ | (16,503) | $ | 23,384 | (142) | % | |||||||||||||||||||||
| Gross margin % before fair value adjustments | 22 | % | (113) | % | 135 | % | (119) | % | |||||||||||||||||||||
| Realized fair value on inventories sold and other inventory charges | $ | (5,314) | $ | (7,208) | $ | 1,894 | (100) | % | |||||||||||||||||||||
| Unrealized gain on changes in fair value of biological assets | $ | 7,502 | $ | 6,516 | $ | 986 | 15 | % | |||||||||||||||||||||
| Gross margin | $ | 9,069 | $ | (17,195) | $ | 24,370 | (153) | % | |||||||||||||||||||||
| Operating expenses | $ | 18,019 | $ | 12,077 | $ | 5,942 | 49 | % | |||||||||||||||||||||
| Loss from operations | $ | (8,950) | $ | (29,272) | $ | 18,428 | (69) | % | |||||||||||||||||||||
Other (income) expenses(3) | $ | (4,903) | $ | 37,117 | $ | (42,020) | (113) | % | |||||||||||||||||||||
| Net loss | $ | (4,047) | $ | (66,389) | $ | 60,448 | (94) | % | |||||||||||||||||||||
| Net loss per common share, basic | $ | (0.013) | $ | (0.285) | $ | 0.272 | (95) | % | |||||||||||||||||||||
| Net loss per common share, diluted | $ | (0.013) | $ | (0.285) | $ | 0.272 | (95) | % | |||||||||||||||||||||
| Net cash used in operating activities | $ | (803) | $ | (10,430) | $ | 9,627 | (92) | % | |||||||||||||||||||||
Adjusted Gross Margin(1) | $ | 8,255 | $ | (680) | $ | 8,935 | (1,314) | % | |||||||||||||||||||||
Adjusted Gross Margin %(1) | 26 | % | (5) | % | 31 | % | (620) | % | |||||||||||||||||||||
Adjusted EBITDA(1) | $ | 1,556 | $ | (7,840) | $ | 9,396 | (120) | % | |||||||||||||||||||||
| Financial Position | |||||||||||||||||||||||||||||
| Working capital | $ | 189,597 | $ | 112,398 | $ | 77,199 | 69 | % | |||||||||||||||||||||
| Inventory and biological assets | $ | 56,187 | $ | 43,374 | $ | 12,813 | 30 | % | |||||||||||||||||||||
| Total assets | $ | 585,102 | $ | 392,764 | $ | 192,338 | 49 | % | |||||||||||||||||||||
Non-current financial liabilities(2) | $ | 2,872 | $ | 105,258 | $ | (102,386) | (97) | % | |||||||||||||||||||||
Note 1: Non-IFRS measures that have been defined and reconciled within their respective sections of the MD&A.
Note 2: Non-current financial liabilities excludes non-monetary balances related to contingent share consideration, derivative liabilities and deferred income taxes.
Note 3: Other (income) expenses included: financing costs; investment income; government subsidies; share of loss from investments in associates; impairment of loan receivable; loss on disposal of property, plant and equipment; change in fair value of contingent consideration; share issue costs allocated to derivative liabilities; change in fair value of derivative liabilities; legal provisions; current income taxes; and deferred income taxes as per the Interim Financial Statements
NET REVENUE
Net revenue for the Company is defined as gross revenue, net of customer fees, discounts, rebates, and sales returns and recoveries, less excise taxes. Revenue consists primarily of dried flower and cannabis derivative products sold to the adult-use recreational, medical, wholesale, and international marketplaces.
For the three months ended February 28, 2022, the Company reported $31,836 in net revenue. Of this amount $24,887 (78%) was attributable to sales to the adult-use recreational market, $4,437 (14%) to the international market, $1,920 (6%) to the medical market and $592 (2%) to other revenues. Q2 Fiscal 2022 net revenue increased 117%, or $17,193, from the prior year comparative period’s net revenue of $14,643, primarily due to an increase of $12,899 in adult-use recreational revenue, an increase in international revenue by $4,363, partly offset by the $(141) decrease in medical revenue. Net revenue from the adult-use recreational market was higher by $12,899 (108%), generated from a significant increase in sales volumes from value oriented product sold in Q2 2022, which also carry a lower average selling price.
Sale of flower from all product categories and distribution channels comprised 77% of net revenue in the quarter. The average net selling price ("ASP") of flower decreased to $2.08 per gram than as compared to $2.99 per gram for Q2 Fiscal 2021, as
MANAGEMENT’S DISCUSSION AND ANALYSIS | FOR THE THREE AND SIX MONTHS ENDED FEBRUARY 28, 2022 AND 2021 16
both the Company and the Canadian cannabis industry continued to experience general price compression in the adult-use recreational and medical markets as these markets matured, and the customer and product mix evolved to focus more on value offerings. Selling prices are prone to fluctuation and there may be further price compression if the market remains oversupplied. The Company is committed to refining its product mix as customer preferences evolve and it continues to revitalize its higher margin Edison branded flower products.
The volume of flower sales in grams increased 220% to 11,785 kg in Q2 Fiscal 2022 compared to 3,688 kg in the prior year comparative quarter, primarily as a result of the market shift towards large format value products and the success of the Company's products in these brands and formats.
For the six months ended February 28, 2022, the Company recorded an increase of 83% in net revenues to $62,214 from $33,974 for the six months ended February 28, 2021. Net revenue increased on a year-over-year basis primarily due to an increase in recreational revenue of $21,130 and wholesale and other revenues of $7,970, offset by a decrease in medical sales and the impact from lower average selling prices.
For the six months ended February 28, 2022, the net ASP of dried flower decreased to $1.98 per gram compared to $3.13 per gram for the six months ended February 28, 2021, due to a shift towards value-oriented large format products and general price compression.
Sales volumes of dried flower in grams increased 195% to 25,121 kg for the six months ended February 28, 2022 compared to 8,508 kg in the prior year comparative period, primarily due to an increase to sales volume, and new format products that are well-received by the market.
REVENUE COMPOSITION
The Company’s revenue composition by product category was as follows for three months ended February 28, 2022 and 2021:
| Q2-2022 | Q2-2021 | ||||||||||
| International and Domestic Flower and Oil | 4,993 | 98 | |||||||||
| Medical, net of excise duty | 1,920 | 2,438 | |||||||||
| Recreational Flower, net of excise duty | 18,973 | 10,338 | |||||||||
| Recreational Vapes, net of excise duty | 791 | 1,158 | |||||||||
| Recreational Hash, net of excise duty | 1,524 | — | |||||||||
| Recreational Edibles, net of excise duty | 2,587 | 310 | |||||||||
| Recreational Ingestible Extracts, net of excise duty | 1,014 | — | |||||||||
| Wholesale and Other | 34 | 301 | |||||||||
| Total Net Revenue | 31,836 | 14,643 | |||||||||
COST OF SALES AND GROSS MARGIN
The gross margin for the three and six months ended February 28, 2022 was $9,069 and $9,679, respectively, compared to $(17,195) and $(33,869) for the prior year comparative periods. The increase in gross margin year-over-year was primarily a result of: (i) lower cultivation and post-harvest costs; (ii) higher unrealized gains on changes in the fair value of biological assets; (iii) lower inventory provisions of excess and unsaleable inventories as well as inventory provisions to net realizable value; (iv) lower unabsorbed overhead as a result of increased production volumes; net of the impact of lower net ASP from increased competition and the ongoing evolution of the customer and product mix.
Included in gross margin for the three and six months ended February 28, 2022 are $7,502 and $17,971, respectively (February 28, 2021 - $6,516 and $6,402) for unrealized gain on changes in fair value of biological assets related to IFRS standard IAS 41 – Agriculture and $5,314 and $17,627 (February 28, 2021 - $7,208 and $19,926) for realized fair value on inventories sold and other charges. The net increase in fair value adjustments for the three and six months ended February 28, 2022 compared to the prior year is primarily due to the current quarter's decrease in cultivation costs and the increase to the overall number of plants (due to increased planting from higher room usage).
Cost of sales primarily consists of the following:
•Costs of sales of cannabis (dried flower, pre-rolls, and wholesale/international bulk flower), cannabis oil, vapes, chocolates, and other wholesale formats such as extract include the direct costs of materials and packaging, labour, including any associated share-based compensation, and depreciation of manufacturing related items such as building and equipment related to the production of cannabis and derivatives sold. This includes cultivation costs (growing, harvesting, drying, and processing costs), extraction, vape filling, quality assurance and quality control, as well as packaging and labelling;
MANAGEMENT’S DISCUSSION AND ANALYSIS | FOR THE THREE AND SIX MONTHS ENDED FEBRUARY 28, 2022 AND 2021 17
•Costs related to other products, such as vaporizers and other accessories;
•Shipping expenses to deliver product to the customer;
•The production cost of late-stage biological assets that are disposed of, plants destroyed that do not meet the Company’s quality assurance standards, provisions for excess and unsaleable inventories and provisions related to adjustments to net realizable value that reduce the carrying value of inventory below the original production or purchase cost, and other production overhead; and
•Unabsorbed fixed overhead charges, comprised of depreciation, insurance, and property taxes, resulting from the underutilization of cultivation and production capacity.
Illustrative Overview of Composition and Flow of Biological Assets, Inventories, and Cost of Sales
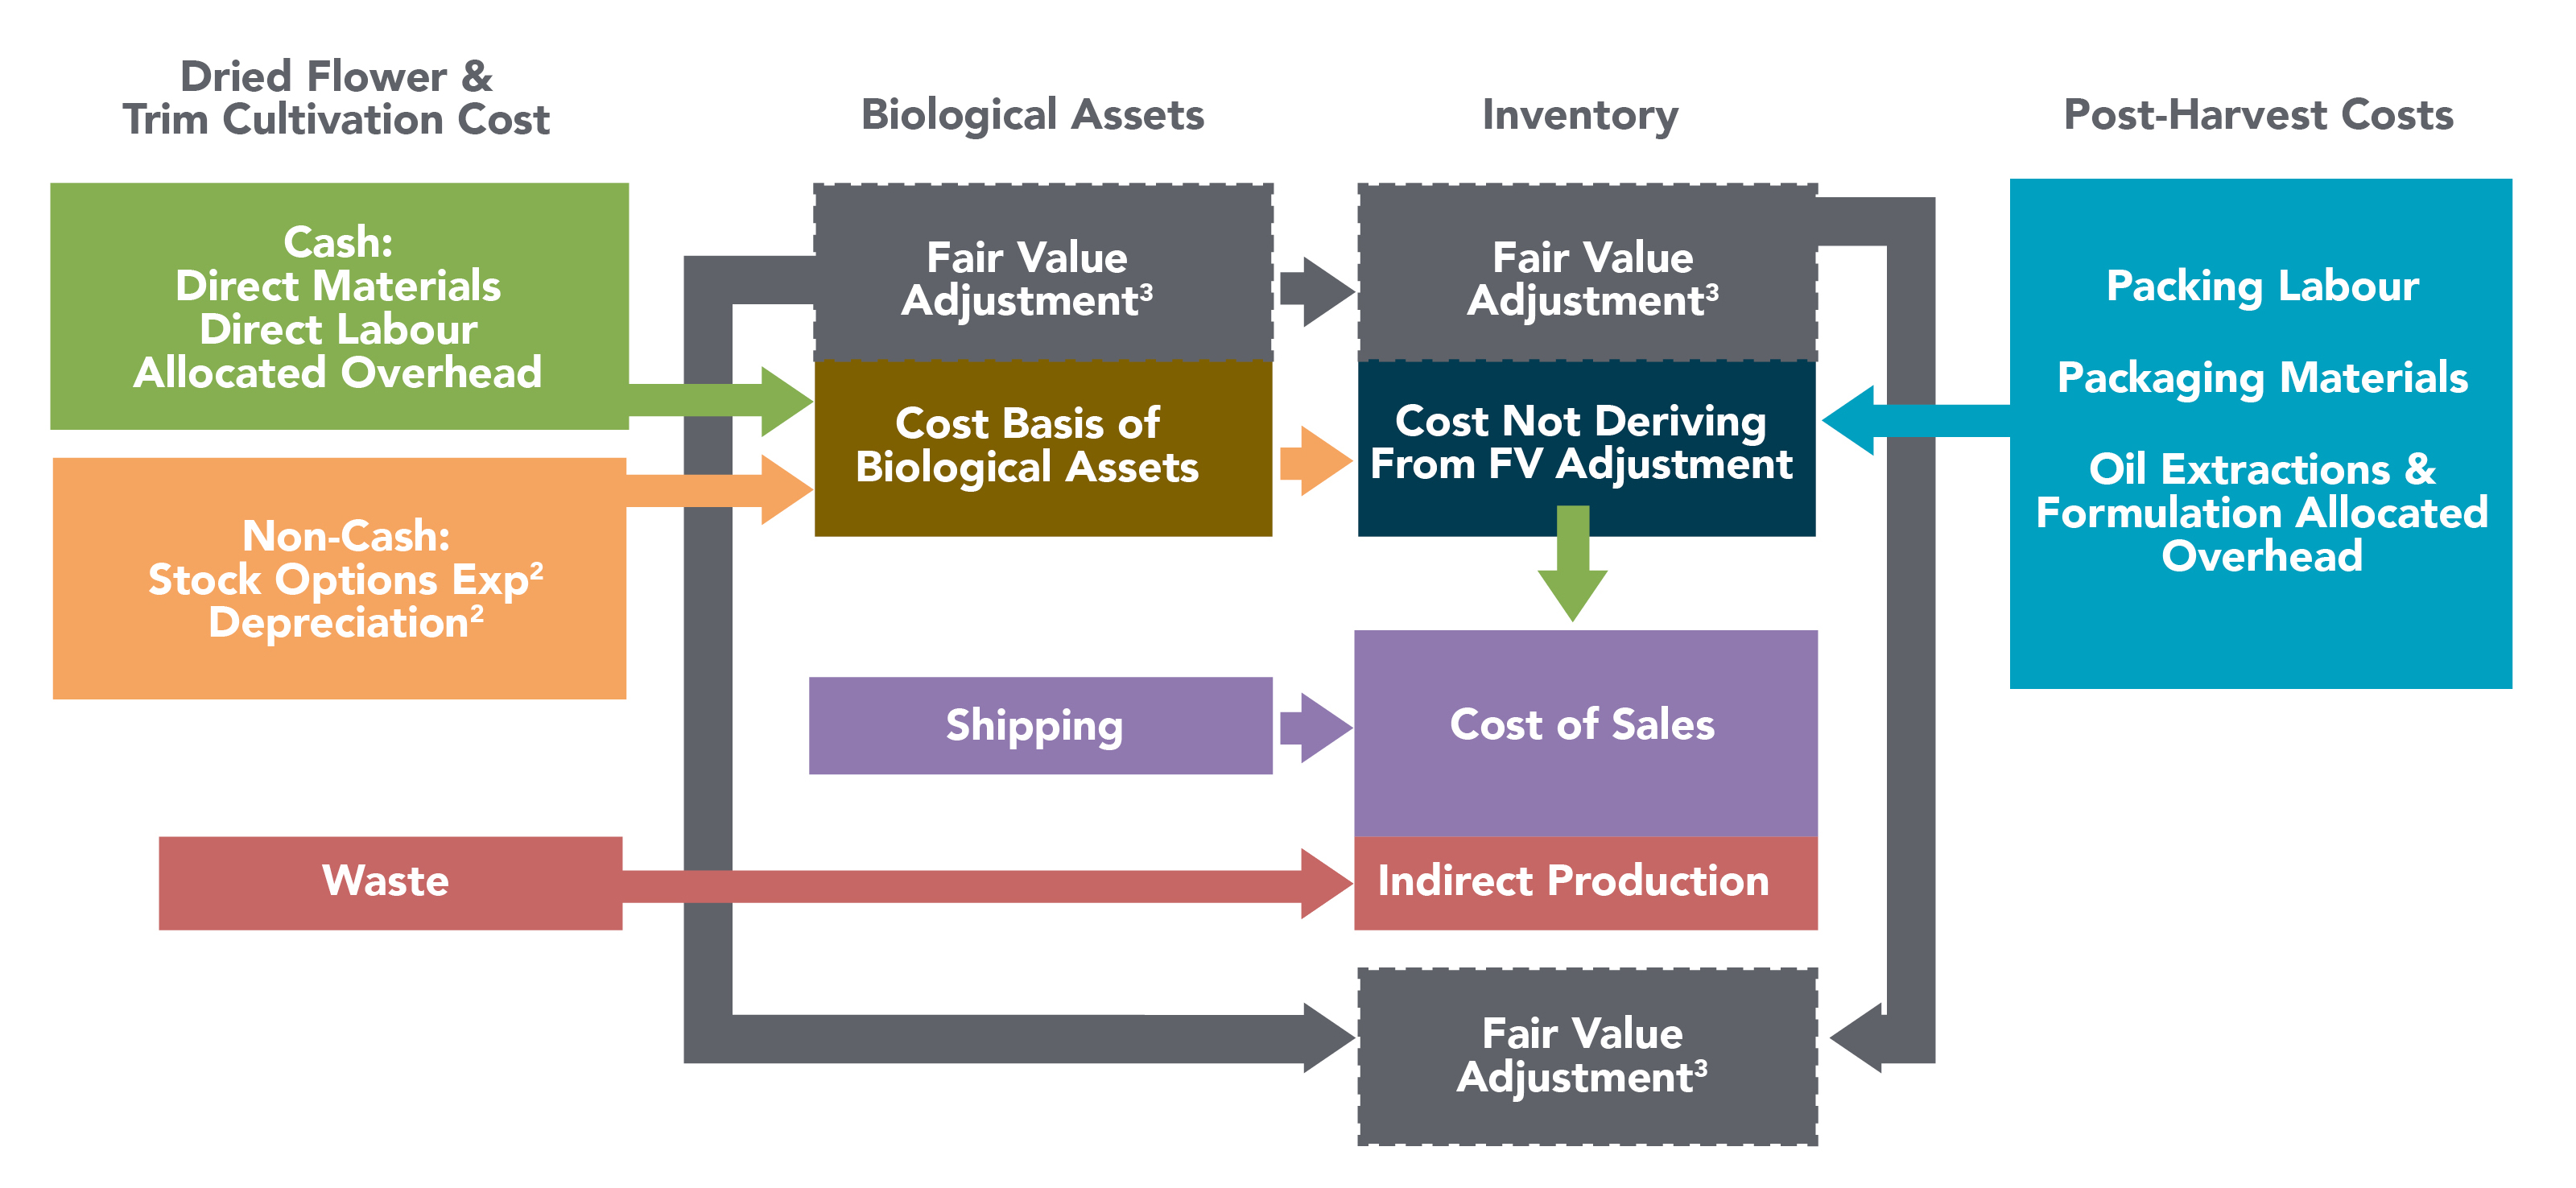
Note 1: The above illustration is for informational purposes only and should not be viewed as an exact representation of the actual flow of inputs and outputs. Certain items referenced above may not have a standard meaning under IFRS and therefore should be considered non-IFRS measures. Readers should refer to the notes of the Interim Financial Statements for the official accounting policies.
Note 2: The majority of stock options and depreciation expense related to the manufacturing and operations departments are capitalized as part of cultivation and inventory production costs; however, a certain amount of these expenses that relate to overhead departments and underutilization of the Moncton Campus are expensed directly to cost of sales.
Note 3: Fair value adjustments are made to the cost basis of biological assets which collectively become the cost basis of inventories. Inventories are then carried at the lower of cost and net realizable value. When sold a portion of inventory is charged to cost of sales (actual costs) with the remainder (fair value adjustments) to “Realized fair value on inventories sold and other inventory charges” on statements of operations and comprehensive loss.
Note 4: Excise taxes are excluded from this diagram and are reflected as a netting adjustment against gross revenue to arrive at net revenue for presentation purposes in the statements of operations and comprehensive loss.
GROSS MARGIN BEFORE REALIZED FAIR VALUE ON INVENTORIES SOLD AND OTHER INVENTORY CHARGES AND UNREALIZED GAIN (LOSS) ON CHANGES IN FAIR VALUE OF BIOLOGICAL ASSETS AND ADJUSTED GROSS MARGIN
The fair value adjustment to biological assets, inventories sold, and other charges is comprised of the non-cash fair value gains (losses) for inventories sold, growth of biological assets, and adjustments to net realizable value.
The increase in gross margin before fair value changes to biological assets and inventories in Q3 and Q4 Fiscal 2021 and in Q1 and Q2 Fiscal 2022 are due to the combination of higher net revenue, lower cultivation and post-harvest costs, lower inventory provisions, and lower unabsorbed overhead.
Adjusted gross margin is a non-IFRS measure that the Company defines as net revenue less: (i) unrealized gain (loss) on changes in fair value of biological assets; (ii) realized fair value on inventories sold and other inventory charges; (iii) provisions and impairment of inventories and biological assets; (iv) provisions to net realizable value; (v) COVID-19 related charges; and (vi) unabsorbed overhead relating to underutilization of the production facility grow rooms and manufacturing equipment, most of which is related to non-cash depreciation expense. Management believes this measure is useful and relevant as it more fairly represents the gross margin for the revenues generated in the period as it is based on the direct and indirect costs of production related to these revenues and excludes impairments and provisions related to other inventories resulting from
MANAGEMENT’S DISCUSSION AND ANALYSIS | FOR THE THREE AND SIX MONTHS ENDED FEBRUARY 28, 2022 AND 2021 18
internal or external influences. See the cautionary statement regarding non-IFRS financial measures in the “Introduction” section at the beginning of this MD&A and the reconciliation to IFRS measures in the “Financial Results and Review of Operations” section of this MD&A. The most directly comparable measure to adjusted gross margin calculated in accordance with IFRS is gross margin before fair value changes to biological assets and inventories sold.
Gross margin before realized fair value on inventories sold and other inventory charges and unrealized gain (loss) on changes in fair value of biological assets and Adjusted Gross Margin
| Q3-F20 | Q4-F20 | Q1-F21 | Q2-F21 | Q3-F21 | Q4-F21 | Q1-F22 | Q2-F22 | |||||||||||||||||||
| Net revenue | $ | 18,021 | $ | 20,400 | $ | 19,331 | $ | 14,643 | $ | 20,324 | $ | 24,865 | $ | 30,378 | $ | 31,836 | ||||||||||
| Cost of sales before adjustments | 13,909 | 14,244 | 17,383 | 15,323 | 21,046 | 21,848 | 24,903 | 23,581 | ||||||||||||||||||
| Adjusted Gross margin | 4,112 | 6,156 | 1,948 | (680) | (722) | 3,017 | 5,475 | 8,255 | ||||||||||||||||||
| Adjusted Gross margin % | 23 | % | 30 | % | 10 | % | (5) | % | (4) | % | 12 | % | 18 | % | 26 | % | ||||||||||
| Less: | ||||||||||||||||||||||||||
| Provisions (recoveries) and impairment of inventories and biological assets | 19,940 | 11,019 | 3,051 | 10,050 | (59) | 1,997 | 1,845 | 686 | ||||||||||||||||||
| Provisions to net realizable value | 2,661 | 80 | 75 | 3,499 | 669 | 622 | 467 | 25 | ||||||||||||||||||
| Realized fair value on inventories sold from acquisitions | — | — | — | — | — | — | — | 663 | ||||||||||||||||||
| COVID-19 related charges | 5,901 | 194 | — | — | — | — | — | — | ||||||||||||||||||
| Unabsorbed overhead | 1,964 | 3,470 | 2,664 | 2,274 | 1,725 | 1,400 | 709 | — | ||||||||||||||||||
| Gross margin before fair value adjustments | $ | (26,354) | $ | (8,607) | $ | (3,842) | $ | (16,503) | $ | (3,057) | $ | (1,002) | $ | 2,454 | $ | 6,881 | ||||||||||
| Gross margin % (before fair value adjustments) | (146) | % | (42) | % | (20) | % | (113) | % | (15) | % | (4) | % | 8 | % | 22 | % | ||||||||||
Add/(Deduct): Realized fair value on inventories sold and other inventory charges | $ | (33,489) | $ | (24,928) | $ | (12,718) | $ | (7,208) | $ | (8,509) | $ | (7,286) | $ | (12,313) | $ | (5,314) | ||||||||||
| Unrealized gain (loss) on changes in fair value of biological assets | $ | 9,627 | $ | 4,779 | $ | (114) | $ | 6,516 | $ | 13,685 | $ | 11,639 | $ | 10,469 | $ | 7,502 | ||||||||||
Gross margin(1) | $ | (50,216) | $ | (28,756) | $ | (16,674) | $ | (17,195) | $ | 2,119 | $ | 3,351 | $ | 610 | $ | 9,069 | ||||||||||
Gross margin %(1) | (279) | % | (141) | % | (86) | % | (117) | % | 10 | % | 13 | % | 2 | % | 28 | % | ||||||||||
Note 1: Gross margin reflects the IFRS measure per the Company’s Financial Statements.
GENERAL AND ADMINISTRATIVE
For the three months ended February 28, 2022, general and administrative expenses increased to $10,581 compared to $7,188 in the prior year comparative period. The increase mainly relates to higher employee costs due to more general and administrative full-time employees driven by the acquisitions of EIC and Laurentian, general wage increases and higher professional and technology fees.
For the six months ended February 28, 2022, the Company incurred general and administrative expenses of $18,565 compared to $13,990 for the prior year comparative period. The increase year-over-year mainly relates to higher employee costs due to more general and administrative full-time employees driven by the acquisitions of EIC and Laurentian, general wage increases and higher professional fees, technology fees and insurance costs.
SALES AND MARKETING
For the three months ended February 28, 2022, the Company incurred sales and marketing expenses of $3,417 compared to $3,141 for the three months ended February 28, 2021. The increase in expenses in the current quarter was due to the continued development by the Company of the adult-use recreational market. These expenses include advertising and promotion, client service and sales staff, educational materials, as well as trade investment.
For the six months ended February 28, 2022, the Company incurred sales and marketing expenses from operations of $8,077 compared to $6,813 for the prior year comparative period. The year-over-year increase is related to lower than planned spend in Q1 and Q2 Fiscal 2021 as the recovery from COVID-19 was still on going.
Sales and marketing and general and administrative expenses, excluding non-cash share-based compensation (“SG&A”), were $13,998 for Q2 Fiscal 2022, an increase from $10,329 in Q2 Fiscal 2021. As a percentage of net revenue, SG&A expenses decreased to 44% in Q2 Fiscal 2022 from 71% in Q2 Fiscal 2021 due primarily to the significant increase to net revenues.
SHARE-BASED COMPENSATION
For the three and six months ended February 28, 2022, the Company recognized $837 and $1,511, respectively, in share-based compensation in relation to selling, marketing, general and administrative, and research and development employees. These amounts are comparable to the $946 and $1,365 for the prior year comparative period.
MANAGEMENT’S DISCUSSION AND ANALYSIS | FOR THE THREE AND SIX MONTHS ENDED FEBRUARY 28, 2022 AND 2021 19
Total share-based compensation charges, including those related to production employees that are charged to biological assets and inventory and amounts amortized from prepaid expenses and deferred charges, for the three and six months ended February 28, 2022 were $877 and $1,557 compared to $1,167 and $1,773 for the comparable period, the changes being consistent with those noted above.
For the three months ended February 28, 2022, nil options were granted to employees of the Company, valued at $nil, compared to 735,000 options granted in the prior year comparative period, valued at $985. Included in the three months ended February 28, 2022, were nil options granted to key management personnel compared to 330,000 options granted for the three months ended February 28, 2021. The decrease in share-based compensation expense period-over-period is primarily a result of fewer options having been granted during the current period due to a shift in equity compensation practices.
For the six months ended February 28, 2022, 520,000 options were granted, valued at $934, compared to 735,000 options granted in the prior year comparative period, valued at $985. Included in the six months ended February 28, 2022 were 500,000 options granted to key management personnel compared to 330,000 options granted for the six months ended February 28, 2021.
During the three and six months ended February 28, 2022, nil and 391,248, respectively, restricted share units (“RSUs”) were granted to employees (February 28, 2021 – 411,599 and 411,599), of which nil and 361,942 RSUs were issued to key management personnel, which includes members of the Board of Directors, compared to 349,493 and 349,493 issued for the three and six months ended February 28, 2021.
During the three and six months ended February 28, 2022, nil and 169,843, respectively, performance share units (“PSUs”) were granted to employees (February 28, 2021 – 427,084 and 427,084), of which nil and 140,537 PSUs were issued to key management personnel compared to 240,740 and 240,740 issued for the prior year comparative periods.
Share-based compensation represents a non-cash expense and was valued using the Black-Scholes valuation model for stock options and using the fair value of the shares on the date of the grant for RSUs. The fair value of PSUs was based on the Company’s share price at the grant date, adjusted for an estimate of likelihood of achievement of the defined performance criteria.
FINANCING COSTS AND INVESTMENT INCOME
Financing costs are comprised of cash interest expense, the amortization of related transaction costs, the amortization of discount of long-term debt outstanding during the period, and loan modification losses as described below. The decrease in financing costs for the three and six months ended February 28, 2022 to $90 and $173, respectively, from $800 and $2,388 in the prior year comparative periods is mainly attributable to the repayment of the term loan balance outstanding during Fiscal 2021 and a lower loan modification loss of $318 incurred during the three months ended November 30, 2020.
Investment income of $307 and $633 was earned for the three and six months ended February 28, 2022, compared to $131 and $247 for the prior year comparative periods. The change in investment income was due to year-over-year changes in interest income, owing to the increase in cash and short-term investments that are earning interest income.
GOVERNMENT SUBSIDIES
On April 1, 2020, Department of Finance Canada announced the Canada Emergency Wage Subsidy (“CEWS”), which would subsidize 75% of employee wages, retroactive to March 15, 2020, to Canadian employers whose business had been affected by COVID-19 to enable them to re-hire workers previously laid off as a result of the pandemic, help prevent further job losses, and to better position companies to resume normal operations following the crisis. Also, on October 9, 2020, the creation of the Canada Emergency Rent Subsidy ("CERS") program was announced to provide support to qualifying tenants and property owners in the form of rent subsidy that is made available to organizations that continue to endure declining revenues, and the lockdown support, which provides an additional top-up to those entities that must either close or significantly restrict their activities due to a public health order. Under these programs, the Company applied for subsidies for the three and six months ended February 28, 2022 of $nil and $nil, respectively (February 28, 2021 - $2,709 and $4,541).
MANAGEMENT’S DISCUSSION AND ANALYSIS | FOR THE THREE AND SIX MONTHS ENDED FEBRUARY 28, 2022 AND 2021 20
INVESTMENTS IN ASSOCIATES AND CONTINGENT CONSIDERATION
During Q1 Fiscal 2019, the Company made three strategic and international investments as described previously in this MD&A, which are being accounted for as investments in associates in the Company’s financial statements. During the three and six months ended February 28, 2022, the Company’s share of loss from these investments in associates was $499 and $643, respectively, compared to a loss of $344 and $586 in the prior year comparative period.
In connection with the Alpha-Cannabis Germany investment ("ACG"), the Company had committed to contingent share consideration to be paid in the form of Common Shares of the Company upon the achievement of certain milestones by Alpha-Cannabis Germany. This contingent share consideration liability is carried at fair value in the Company’s consolidated financial statements. The Company determined the recoverable amount to approximate $nil based on the higher of fair value less cost of disposal and value in use, as a result of the current financial difficulties including negligible projected revenues for future years; expected cash flow deficits; the lack of GMP certified inventory; and a significant decline in ACG's market share, and as such had recorded an impairment loss of $3,266 in the consolidated statement of operations and comprehensive loss for the year ended August 31, 2021. Concurrently the probability of ACG achieving the milestone was adjusted to 0% resulting in the related contingent share consideration adjusted to nil.
In connection with the Company's subsidiary EIC as described in Note 28 of the Interim Financial Statements, the Company has commitments to deliver additional consideration. At February 28, 2022, the Company revalued the remaining contingent liability and recorded a corresponding change in fair value in the condensed consolidated interim statement of operations and comprehensive loss of $944 and $762 for the three and six months ended (February 28, 2021 - $nil and $nil). At February 28, 2022, the outstanding balance is $6,300, all of which is included in current liabilities.
In connection with the Company's subsidiary Laurentian as described in Note 28 of the Interim Financial Statements, the Company has commitments to deliver additional consideration. At February 28, 2022, the Company revalued the contingent liability at an estimated fair value of $6,718, resulting in a gain in fair value recorded in the condensed consolidated interim statement of operations and comprehensive loss of $278 for the three months ended. At February 28, 2022, $2,913 of the balance is included in current liabilities.
DERIVATIVE WARRANT LIABILITIES
On November 12, 2020, the Company closed an underwritten public offering of units of the Company (the “Units”) for total gross proceeds of $69,143 (the “Offering”). The Company sold 37,375,000 Units at a price of $1.85 per Unit, including 4,875,000 Units sold pursuant to the full exercise of the over-allotment option granted to the underwriters. The offering was underwritten by a syndicate of underwriters led by Canaccord Genuity Corp. Each Unit consisted of one Common Share of the Company and one half of one Common Share purchase warrant of the Company (each full common share purchase warrant, a “Warrant”), therefore resulting in 18,687,500 Warrants being issued. Each Warrant is exercisable to acquire one Common Share of the Company (a “Warrant Share”) for a period of three years following the closing date of the Offering (i.e. until November 12, 2023) at an exercise price of $2.50 per Warrant Share, subject to adjustment in certain events. The holders of the Warrants issued pursuant to the Offering may elect, if the Company does not have an effective registration statement under the U.S. Securities Act, or the prospectus contained therein is not available for the offer and sale of the Common Shares to the Warrant holder, in lieu of exercising the Warrants for cash, a cashless exercise option to receive Common Shares equal to the fair value of the gain implied by the Warrants at the time of exercise. The fair value is determined by multiplying the number of Warrants to be exercised by the weighted average market price less the exercise price with the difference being divided by the weighted average market price. If a Warrant holder exercises this option, there will be variability in the number of shares issued per Warrant.
In accordance with IAS 32 Financial Instruments: Presentation, a contract to issue a variable number of shares fails to meet the definition of equity and must instead be classified as a derivative liability and measured at fair value with changes in fair value recognized in the condensed consolidated interim statement of operations and comprehensive loss at each reporting period. The derivative warrant liabilities are expected to ultimately be converted into the Company’s equity (Common Shares) when the Warrants are exercised or will be extinguished on the expiry of the outstanding Warrants and will not result in the outlay of any cash by the Company.
At initial recognition on November 12, 2020, the Company recorded derivative liabilities of $12,894 based on the estimated fair value of the Warrants at this date using the Black-Scholes option pricing model. Share issuance costs of $803 were recognized and allocated to derivative liabilities, such amount represents on a pro-rata allocation of total issuance costs attributable to the Units sold in the Offering based on the relative fair value of the underlying Common Shares and Warrants.
During the three and six months ended February 28, 2022, there were no warrants exercised (February 28, 2021 - 1,698,200 and 1,698,200 warrants exercised, for gross proceeds of $4,246 and $4,246). As at February 28, 2022, the Company revalued the remaining derivative warrant liabilities at an estimated fair value of $12,996 (August 31, 2021 – $35,019) using the Black-Scholes option pricing model. The Company recorded a decrease in the estimated fair value change of the derivative warrant
MANAGEMENT’S DISCUSSION AND ANALYSIS | FOR THE THREE AND SIX MONTHS ENDED FEBRUARY 28, 2022 AND 2021 21
liabilities for the three and six months ended February 28, 2022 of $9,971 and $22,023 (February 28, 2021 - increase of $37,659 and $42,331), respectively.
DERIVATIVE TOP-UP RIGHTS LIABILITIES
On March 10, 2021, through the strategic investment from BAT, the Company issued 58,336,392 Common Shares, resulting in BAT's beneficial ownership in the Company at approximately 19.9%, as described in Note 14 of the Interim Financial Statements.
Pursuant to the investor rights agreement (the "IRA") between the Company and BAT, the Company granted BAT certain rights, including pre-emptive rights, to participate in distributions of Common Shares to maintain its proportionate ownership in certain circumstances, as well as other rights ("Top-up Rights") to subscribe for additional Common Shares in specified circumstances where the pre-emptive rights are not applicable (referred to in the IRA as "Exempt Distributions") and in specified circumstances where pre-emptive rights were not exercised (referred to in the IRA as “bought deal Distributions”).
The price per Common Share to be paid by BAT pursuant to the exercise of its Top-Up Rights will equal the price paid by other participants in the Exempt Distribution or bought deal Distribution, subject to certain restrictions (including, if such price is not permitted pursuant to stock exchange requirements, at the lowest price permitted thereunder).
The Company has classified the Top-up Rights as a derivative liability and pursuant to the exercise of stock options, restricted share units, performance share units and warrants that were outstanding at initial recognition on March 10, 2021 (the date of the IRA), the Company recorded a derivative liability of $2,740 based on the estimated fair value of the Top-up Rights at this date using a Monte Carlo pricing model.
During the three and six months ended February 28, 2022, 2,659,716 and 2,659,716 Top-up Rights were exercised (February 28, 2021 - Nil and Nil), for gross proceeds of $6,348 and $6,348, respectively, (February 28, 2021 - $nil and $nil). The Top-up Rights exercised had an estimated fair value of $4, on the date of exercise, namely, February 28, 2022 (February 28, 2021 - $nil), using the Monte Carlo Pricing model. This amount was transferred from derivative liabilities to share capital (Common Shares).
As at February 28, 2022, the Company revalued the Top-up Rights at an estimated fair value of $1,196 (August 31, 2021 – $2,508). The Company recorded a decrease in the estimated fair value change of the Top-up Rights for the three and six months ended February 28, 2022 of $666 and $1,312 (February 28, 2021 - $nil and $nil), respectively.
OTHER
During the three and six months ended February 28, 2022, the Company recorded an impairment charge on its loan receivable with 1812 Hemp of $nil and $250 (February 28, 2021 - $500 and $500). These adjustments were made as management reassessed the liquidation value of 1812 Hemp’s assets over which the Company has security.
During the three and six months ended February 28, 2022, the Company recorded legal provisions for claims and other contingencies in the amount of $nil and $nil, compared to $500 and $1,230 for the prior year periods.
NET LOSS
Net loss for the three months ended February 28, 2022 was $(4,047) or $(0.013) per Common Share (basic and diluted), compared to $(66,389) or $(0.285) per Common Share (basic and diluted) for the prior year comparative period. The decrease in net loss for the current quarter compared to the prior year comparative period was a result of higher gross margin from higher revenues, lower inventory provisions for obsolete items, higher unrealized gain on changes in fair value of biological assets, lower financing costs, higher fair value gain on the derivative warrant liabilities, and partly offset by increased operating expenses and impairment of property, plant and equipment.
Net loss for the six months ended February 28, 2022 was $(5,352) or $(0.018) per Common Share (basic and diluted), compared to $(100,725) or $(0.464) per Common Share (basic and diluted) for the prior year comparative period. The year-over-year decrease is related to the same factors noted above.
MANAGEMENT’S DISCUSSION AND ANALYSIS | FOR THE THREE AND SIX MONTHS ENDED FEBRUARY 28, 2022 AND 2021 22
SUMMARY OF QUARTERLY RESULTS
| Q3-F20 | Q4-F20 | Q1-F21 | Q2-F21 | Q3-F21 | Q4-F21 | Q1-F22 | Q2-F22 | |||||||||||||||||||
| Financial Results | ||||||||||||||||||||||||||
| Adult-use recreational revenue (net of excise) | $ | 15,349 | $ | 15,063 | $ | 16,788 | $ | 11,988 | $ | 16,839 | $ | 22,898 | $ | 25,020 | $ | 24,887 | ||||||||||
| Direct to patient medical revenue (net of excise) | $ | 2,482 | $ | 2,403 | $ | 2,251 | $ | 2,438 | $ | 2,015 | $ | 1,968 | $ | 1,908 | $ | 1,920 | ||||||||||
| International, wholesale and other revenue | $ | 190 | $ | 2,934 | $ | 292 | $ | 217 | $ | 1,470 | $ | (1) | $ | 3,450 | $ | 5,029 | ||||||||||
| Net revenue | $ | 18,021 | $ | 20,400 | $ | 19,331 | $ | 14,643 | $ | 20,324 | $ | 24,865 | $ | 30,378 | $ | 31,836 | ||||||||||
| Net loss | $ | (89,871) | $ | (38,590) | $ | (34,336) | $ | (66,389) | $ | (4,008) | $ | (25,971) | $ | (1,305) | $ | (4,047) | ||||||||||
| Net loss per common share, basic | $ | (0.512) | $ | (0.199) | $ | (0.170) | $ | (0.285) | $ | (0.014) | $ | (0.090) | $ | (0.004) | $ | (0.013) | ||||||||||
| Net loss per common share, diluted | $ | (0.512) | $ | (0.199) | $ | (0.170) | $ | (0.285) | $ | (0.014) | $ | (0.090) | $ | (0.004) | $ | (0.013) | ||||||||||
| Operational Results | ||||||||||||||||||||||||||
Dried flower yield per plant (grams)(1) | 92 | 101 | 86 | 115 | 117 | 127 | 129 | 122 | ||||||||||||||||||
| Harvest (kg) - dried flower | 4,741 | 8,751 | 3,901 | 4,467 | 8,379 | 12,085 | 11,603 | 10,037 | ||||||||||||||||||
| Employee headcount (#) | 474 | 552 | 516 | 619 | 647 | 727 | 738 | 841 | ||||||||||||||||||
Note 1: The Company significantly reduced the harvesting of trim from the cannabis plant during Q3 Fiscal 2020. The yield is therefore measured to only include the yield from the flower portion of the cannabis plant.
The net losses during Q3 and Q4 Fiscal 2021 decreased from Q2 Fiscal 2021 largely due to higher gross margin and gains on the fair value adjustment of the derivative liabilities. Q4 Fiscal 2021 net loss increased from Q3 Fiscal 2021 mainly due to impairment charges recorded on intangible assets, property, plant and equipment, investments in associates, decreased government subsidies and loss on fair value change in contingent consideration. The net loss decreased during Q1 Fiscal 2022 due to improvements in net revenues. The net loss increased in Q2 Fiscal 2022 from Q1 Fiscal 2022 mainly due to impairment charges and costs related to the Laurentian acquisition.
Adjusted EBITDA
This is a non-IFRS measure and the Company calculates adjusted EBITDA as net income (loss) before financing costs, net of investment income; income tax expense (recovery); depreciation; amortization; reversal of/or impairment; (gain) loss on disposal of property, plant and equipment (per the condensed consolidated interim statement of cash flows); share-based compensation (per the condensed consolidated interim statement of cash flows); share of loss and impairment loss from loan receivable and investments in associates; change in fair value of contingent consideration; change in fair value of derivative liabilities; expenditures incurred in connection with research and development activities; realized fair value on inventories sold and other inventory charges; unrealized (gain) loss on changes in fair value of biological assets; provisions and impairment of inventories and biological assets; provisions of inventory to net realizable value; COVID-19 related charges, net of any government subsidies; legal provisions; incremental fair value component of inventories sold from acquisitions; transaction costs; and share issuance costs recorded in the condensed consolidated interim statement of operations and comprehensive loss. Management believes the exclusion of the fair value adjustment is an alternative representation of performance. The fair value adjustment is a non-cash gain (loss) and is based on the valuation of biological assets and inventory using a fair value less cost to sell model. The most directly comparable measure to adjusted EBITDA calculated in accordance with IFRS is net income (loss).
Management changed the calculation of adjusted EBITDA during Q4 Fiscal 2020 and has conformed prior quarters accordingly to include an add-back for provisions and impairment of inventories and biological assets and provisions to net realizable value. During Q4 Fiscal 2021, management further amended the calculation of adjusted EBITDA and has conformed prior quarters accordingly to include an add-back for the Company's research and development expenditures, including its share of the expense from the CoE. During Q2 Fiscal 2022, management changed the calculation of adjusted EBITDA to exclude both transaction costs and the fair value component of inventories sold from acquisitions.
The Fiscal 2021 adjusted EBITDA was lower than Fiscal 2020 as a consequence of both lower revenues and a higher cost of production. At the end of Fiscal 2021, during Q4 Fiscal 2021, the Company had decreased its cost of production and with increased revenues this reduced the quarter's adjusted EBITDA loss to $4.8M, a 48% decrease from Q3 2021 loss of $9.2M. During Q1 2022, with further reductions to the cost of production combined with 22% increase to net revenues, the adjusted EBITDA loss was reduced to $1.9M. The Q2 2022 adjusted EBITDA was a positive $1.6M which was a $3.5M increase from the most recent quarter and is as a result of increased revenues and margins.
For Fiscal 2022, the Company plans to operate at increased levels of production, with improved yields that together are expected to result in lower cost of production, which is expected to improve margins while providing more product available for sale. As a consequence of these key factors, management forecasted that the Company would be Adjusted EBITDA positive during Fiscal Q4 2022, and this guidance was accelerated to Fiscal Q3 2022 with the accretive acquisition of Laurentian. The Company's high sales volume and low cost of sales for the Q2 Fiscal 2022 period, has resulted in a positive adjusted EBITDA in the amount of $1,556.
MANAGEMENT’S DISCUSSION AND ANALYSIS | FOR THE THREE AND SIX MONTHS ENDED FEBRUARY 28, 2022 AND 2021 23
| Adjusted EBITDA (Non-IFRS Measure) | ||||||||||||||||||||||||||
| Adjusted EBITDA Reconciliation | Q3-F20 | Q4-F20 | Q1-F21 | Q2-F21 | Q3-F21 | Q4-F21 | Q1-F22 | Q2-F22 | ||||||||||||||||||
| Net loss as reported | $ | (89,871) | $ | (38,590) | $ | (34,336) | $ | (66,389) | $ | (4,008) | $ | (25,971) | $ | (1,305) | $ | (4,047) | ||||||||||
| Add/(Deduct): | ||||||||||||||||||||||||||
| Financing costs, net of investment income | 2,175 | 784 | 1,472 | 669 | 251 | (286) | (243) | (217) | ||||||||||||||||||
| Income tax recovery | (9,975) | — | — | — | — | — | — | (97) | ||||||||||||||||||
| Depreciation, amortization, and gain (loss) on disposal of property, plant and equipment (per condensed consolidated interim statement of cash flows) | 5,033 | 5,537 | 5,262 | 5,222 | 5,626 | 17,349 | 6,378 | 11,024 | ||||||||||||||||||
| Impairment of intangible assets | — | — | — | — | — | 1,701 | — | — | ||||||||||||||||||
| Impairment of property, plant and equipment | 37,740 | 2,031 | — | — | — | — | — | 2,000 | ||||||||||||||||||
| Share of loss and impairment loss from loan receivable and investments in associates | 1,828 | 210 | 242 | 844 | 1,115 | 4,162 | 394 | 499 | ||||||||||||||||||
| Unrealized (gain) loss on changes in fair value of contingent consideration | (229) | (85) | 36 | 154 | (24) | 3,392 | (182) | 666 | ||||||||||||||||||
| Realized fair value on inventories sold and other inventory charges | 33,489 | 24,927 | 12,718 | 7,208 | 8,509 | 7,286 | 12,313 | 5,314 | ||||||||||||||||||
| Unrealized gain (loss) on changes in fair value of biological assets | (9,627) | (4,778) | 114 | (6,516) | (13,685) | (11,639) | (10,469) | (7,502) | ||||||||||||||||||
| Share-based compensation (per statement of cash flows) | 1,937 | 654 | 606 | 1,167 | 973 | 1,150 | 680 | 877 | ||||||||||||||||||
| COVID-19 related charges, net of government subsidies | 2,761 | (4,452) | (1,832) | (2,709) | (2,714) | (892) | — | — | ||||||||||||||||||
| Legal provisions | — | — | 730 | 500 | 470 | 1,050 | — | — | ||||||||||||||||||
| Share issuance costs allocated to derivative warrant liabilities and change in fair value of derivative liabilities | — | — | 5,475 | 37,659 | (7,305) | (6,001) | (12,698) | (10,633) | ||||||||||||||||||
| Incremental fair value component on inventories sold from acquisitions | — | — | — | — | — | — | — | 663 | ||||||||||||||||||
| Acquisition transaction costs | — | — | — | — | — | — | — | 1,148 | ||||||||||||||||||
| Provisions and impairment of inventories and biological assets and provisions of inventory to net realizable value | 22,601 | 11,099 | 3,126 | 13,549 | 610 | 2,619 | 2,312 | 711 | ||||||||||||||||||
| Adjusted EBITDA as Previously Reported | $ | (2,138) | $ | (2,663) | $ | (6,387) | $ | (8,642) | $ | (10,182) | $ | (6,080) | $ | (2,820) | $ | 406 | ||||||||||
Add: Research and development expenditures, net of depreciation | 159 | 343 | 646 | 802 | 938 | 1,262 | 933 | 1,150 | ||||||||||||||||||
| Adjusted EBITDA (Revised) | $ | (1,979) | $ | (2,320) | $ | (5,741) | $ | (7,840) | $ | (9,244) | $ | (4,818) | $ | (1,887) | $ | 1,556 | ||||||||||
| Divided by: net revenue | 18,021 | 20,400 | 19,331 | 14,643 | 20,324 | 24,865 | 30,378 | 31,836 | ||||||||||||||||||
| Adjusted EBITDA Margin % (Revised) (Non-IFRS Measure) | (11) | % | (11) | % | (30) | % | (54) | % | (45) | % | (19) | % | (6) | % | 5 | % | ||||||||||
BALANCE SHEET, LIQUIDITY AND CAPITAL RESOURCES
The following represents selected balance sheet highlights of the Company at the end Q2 Fiscal 2022 and Q4 Fiscal 2021:
| FEBRUARY 28, 2022 | AUGUST 31, 2021 | % CHANGE | |||||||||||||||
| Cash & short-term investments | $ | 150,745 | $ | 183,555 | (18) | % | |||||||||||
| Inventories | $ | 42,892 | $ | 36,696 | 17 | % | |||||||||||
| Working capital | $ | 189,597 | $ | 234,349 | (19) | % | |||||||||||
| Total assets | $ | 585,102 | $ | 554,017 | 6 | % | |||||||||||
| Total current and long-term debt | $ | 272 | $ | 310 | (12) | % | |||||||||||
Non-current financial liabilities(1) | $ | 2,872 | $ | 4,881 | (41) | % | |||||||||||
| Total shareholders' equity | $ | 513,386 | $ | 479,805 | 7 | % | |||||||||||
Note 1: Non-current financial liabilities excludes non-monetary balances related to contingent share consideration, derivative liabilities and deferred income taxes.
On February 28, 2022, the Company had a cash and short-term investments balance of $150,745 compared to $183,555 at August 31, 2021, the decrease of 18%, which is primarily a result of cash used in operating activities of $10,144, capital expenditures of $15,708, additional investment in Debentures of Hyasynth $2,595 and the cash paid for the acquisition of Laurentian of $7,000.
The acquisition of Laurentian, increased inventories and receivables during Q2 Fiscal 2022 compared to Q4 Fiscal 2021.
Management believes its capital position is healthy and that there is sufficient liquidity available for the near to medium term. In the event that the Company is unable to finance any new expansionary capital expenditures or acquisitions from cash on
MANAGEMENT’S DISCUSSION AND ANALYSIS | FOR THE THREE AND SIX MONTHS ENDED FEBRUARY 28, 2022 AND 2021 24
hand or operating cash flows, it could, if necessary and subject to prevailing market conditions, obtain liquidity through the capital markets as the Common Shares are actively traded on both the NASDAQ and TSX and there is broad analyst coverage amongst sell-side brokerages.
The Company's decision in Q4 Fiscal 2021 to complete Phase 4C will, upon completion, significantly increase capacity enabling the Company to better meet the increased consumer demand for its products. The expenditures for this work are budgeted at $16 million and are expected to be incurred over a period of time commenced during Q4 Fiscal 2021 with the completion now targeted to be substantially complete Fiscal 2022. The Company has sufficient cash and short-term investments to support these expenditures, while also supporting the corresponding growth to its working capital assets while maintaining sufficient liquidity and financial flexibility.
The following highlights the Company’s cash flows during the three and six months ended February 28, 2022 and February 28, 2021:
| THREE MONTHS ENDED | SIX MONTHS ENDED | ||||||||||||||||||||||
| FEBRUARY 28, 2022 | FEBRUARY 28, 2021(1) | FEBRUARY 28, 2022 | FEBRUARY 28, 2021 | ||||||||||||||||||||
| Cash provided (used) by: | |||||||||||||||||||||||
| Operating activities | $ | (803) | $ | (10,430) | $ | (10,144) | $ | (10,136) | |||||||||||||||
| Financing activities | 6,023 | (50,718) | 5,753 | 12,475 | |||||||||||||||||||
| Investing activities | (22,643) | 18,371 | 31,313 | 34,184 | |||||||||||||||||||
| Cash provided (used) | $ | (17,423) | $ | (42,777) | $ | 26,922 | $ | 36,523 | |||||||||||||||
| Cash position | |||||||||||||||||||||||
| Beginning of period | 99,710 | 103,900 | 55,365 | 24,600 | |||||||||||||||||||
| End of period | $ | 82,287 | $ | 61,123 | $ | 82,287 | $ | 61,123 | |||||||||||||||
| Short-term investments | 68,458 | 10,000 | 68,458 | 10,000 | |||||||||||||||||||
| Cash and short-term investments | $ | 150,745 | $ | 71,123 | $ | 150,745 | $ | 71,123 | |||||||||||||||
Cash used in operating activities for the three and six months ended February 28, 2022 were $803 and $10,144, respectively, which was primarily driven by the adjusted EBITDA10 net of the investment in working capital assets. This compares to cash used in operating activities $10,430 and $10,136 from the comparable three and six months ended February 28, 2021 periods, respectively.
Cash provided by financing activities for the three and six months ended February 28, 2022 was $6,023 and $5,753, respectively, with the year's amount driven by the $6,348 in net equity proceeds from the issuance of common shares to BAT as they exercised their top-up rights. In comparison, for the three and six months ended February 28, 2021, cash (used) provided by financing activities was $(50,718) and $12,475, respectively, which was primarily driven by net proceeds from long-term debt and equity issued from the two registered at-the-market offering (ATM) facilities.
Cash (used) provided in investing activities for the three and six months ended February 28, 2022 was $(22,643) and $31,313, respectively, primarily driven by the acquisition of Laurentian for $7,000 and $7,000, purchases of capital assets for $8,704, deposits into restricted funds of $4,518 and $3,831, and $15,708, additional investment in Hyasynth of $2,595 and $2,595 offset by proceeds from redemption of short-term investments of $nil and $60,000. This compares to cash provided in investing activities of $18,371 and $34,184 for the three and six months ended February 28, 2021, respectively, which was primarily driven by the proceeds of short-term investments of $20,000 and $40,072, respectively, and purchase of capital assets of $1,817 and $3,630 for the Company's Moncton Campus respectively.
OFF BALANCE SHEET ARRANGEMENTS
There were no off-balance sheet arrangements during the three and six months ended February 28, 2022.
10 Adjusted EBITDA is a non-IFRS measure that the Company defines as net income (loss) before: financing costs, net of investment income; income tax expense (recovery); depreciation, amortization, impairment, gain (loss) on disposal of property, plant and equipment (per the condensed consolidated interim statement of cash flows); share-based compensation (per the condensed consolidated interim statement of cash flows); share of loss and impairment loss from loan receivable and investments in associates; change in fair value of contingent consideration; change in fair value of derivative liabilities; expenditures incurred in connection with research & development activities; unrealized gain (loss) on changes in fair value of biological assets; realized fair value on inventories sold and other inventory charges; provisions to net realizable value of inventories; COVID-19 related charges; government subsidies; legal provisions; incremental fair value component of inventories sold from acquisitions; transaction costs; and share issuance costs. See the cautionary statement regarding non-IFRS financial measures in the “Introduction” section at the beginning of this MD&A and the reconciliation to IFRS measures in the "Financial Results and Review of Operations" section of this MD&A.
MANAGEMENT’S DISCUSSION AND ANALYSIS | FOR THE THREE AND SIX MONTHS ENDED FEBRUARY 28, 2022 AND 2021 25
RELATED PARTY TRANSACTIONS
MANAGEMENT AND BOARD COMPENSATION
Key management personnel are those persons having the authority and responsibility for planning, directing, and controlling activities of the Company, directly or indirectly. The key management personnel of the Company are the members of the Company’s executive management team and Board of Directors. The transactions are conducted at arm’s length and in the normal course of operations.
For the three and six months ended February 28, 2022 and February 28, 2021, the Company’s expenses included the following management and Board of Directors compensation:
| THREE MONTHS ENDED | SIX MONTHS ENDED | ||||||||||||||||||||||
| FEBRUARY 28, 2022 | FEBRUARY 28, 2021 | FEBRUARY 28, 2022 | FEBRUARY 28, 2021 | ||||||||||||||||||||
| Salaries and consulting fees | $ | 897 | $ | 802 | $ | 1,866 | $ | 1,325 | |||||||||||||||
| Share-based compensation | 739 | 670 | 1,633 | 1,152 | |||||||||||||||||||
| Total key management compensation | $ | 1,636 | $ | 1,472 | $ | 3,499 | $ | 2,477 | |||||||||||||||
During the three and six months ended February 28, 2022, nil and 500,000 stock options, respectively (February 28, 2021 – 330,000 and 330,000) were granted to key management personnel with an aggregate fair value of $nil and $898 (February 28, 2021 – $456 and $456). In addition, during the three and six months ended February 28, 2022, nil and 361,942 RSUs, respectively (February 28, 2021 – 349,493 and 349,493), were granted to key management personnel with an aggregate fair value of $nil and $995, respectively (February 28, 2021 – $637 and $637). For the three and six months ended February 28, 2022, nil and 140,537 PSUs, respectively (February 28, 2021 – 240,740 and 240,740) were issued to key management personnel with an aggregate fair value of $nil and $164, respectively (February 28, 2021 – $259 and $259).
SIGNIFICANT TRANSACTIONS WITH ASSOCIATES AND JOINT OPERATIONS
The Company has transactions with related parties, as defined in IAS 24 Related Party Disclosures, all of which are undertaken in the normal course of business.
For the three and six months ended February 28, 2022, under the PDC Agreement, BAT incurred $506 and $1,212 (February 28, 2021 - $nil and $nil) for direct expenses and the Company incurred $1,339 and $2,514 (February 28, 2021 - $nil and $nil) of direct expenses and capital expenditures for a total of $1,845 and $3,726 related to the Center of Excellence ("CoE"), respectively. The Company recorded $620 and $1,295 of these expenditures in the condensed consolidated interim statement of operations and comprehensive loss. For the three and six months ended February 28, 2022, the Company recorded $302 and $606 of capital expenditures in the condensed consolidated interim statement of financial position.
During the three months ended February 28, 2022, BAT exercised 2,659,716 Top-up Rights at an average exercise price of $2.39, as described in Note 14 of the Interim Financial Statements, for cash proceeds of $6,348. At February 28, 2022, there are no balances owing to or from BAT.
FAIR VALUE MEASUREMENTS
(i) Financial Instruments
Fair value is the price that would be received to sell an asset or paid to transfer a liability in an orderly fashion between market participants. The Company records certain financial instruments at fair value. The Company’s financial instruments include cash, short-term investments (including marketable securities), accounts receivable, loan receivable, restricted funds, accounts payable and accrued liabilities, long-term debt, other current and long-term liabilities and derivative liabilities.
Fair value measurements are categorized into Level 1, 2 or 3 based on the degree to which the inputs to the fair value measurements are observable and the significance of the inputs to the fair value measurement in its entirety, which are described as follows:
•Level 1 inputs are quoted prices in active markets for identical assets or liabilities that the entity can access at the measurement date;
•Level 2 inputs, other than quoted prices included within Level 1, that are observable for the asset or liability, either directly or indirectly; and
MANAGEMENT’S DISCUSSION AND ANALYSIS | FOR THE THREE AND SIX MONTHS ENDED FEBRUARY 28, 2022 AND 2021 26
•Level 3 inputs are unobservable inputs for the asset or liability.
The fair values of cash, short-term investments, accounts receivable, loan receivable, accounts payable and accrued liabilities and restricted funds approximate their carrying amounts due to their short-term nature. The fair value of long-term debt approximates $272.
The fair value of the EIC contingent share consideration is primarily based on Level 3 unobservable inputs. The determination of the fair value of this liability is primarily driven by the Company’s expectations of EIC achieving its milestones. The expected milestones were assigned probabilities and the expected related cash flows were discounted to derive the fair value of the contingent consideration.
At February 28, 2022, the probabilities of EIC achieving the remaining two milestones, as discussed in Note 28 to the Interim Financial Statements, were estimated to be 90%, and 0%respectively. If the probabilities of achieving the milestones increased or decreased by 10%, the estimated fair value of the contingent share consideration would increase or decrease by approximately $950 or $700.
The fair value of the Laurentian contingent share consideration is primarily based on Level 3 unobservable inputs in a Monte Carlo pricing model. The determination of the fair value of this liability is primarily driven by the Company’s expectations of Laurentian achieving its business objectives. The key assumptions used in the model are the expected future volatility in the price of the Company's Common Shares, sales volumes and expected selling price per unit.
At February 28, 2022, the fair value of the Laurentian contingent share consideration was revalued to $6,718. As at February 28, 2022, if the weighted average cost of capital increased by 1%, then the change in estimated fair value of the contingent share consideration and net income would increase by $139, or if it is decreased by 1%, the change in estimated fair value of the Warrants and net income would decrease by $131.
The fair value of derivative warrant liabilities is based on Level 1 and 2 inputs utilized in a Black-Scholes option pricing model to estimate the fair value of such Warrants. The key assumption used in the model is the expected future volatility in the price of the Company’s Common Shares.
The fair value of the Top-up Rights is based on Level 3 inputs utilized in a Monte Carlo pricing model to estimate the fair value of such Top-up Rights. The key assumptions used in the model are the expected future price of the Company’s Common Shares, the weighted average expected life of the instruments and the expected future volatility of Common Shares.
During the period, there were no transfers of amounts between Levels 1, 2 and 3.
Derivative Warrant Liabilities
At initial recognition on November 12, 2020, the Company recorded derivative liabilities of $12,894 based on the estimated fair value of the Warrants at that date using the Black-Scholes option pricing model. Share issuance costs of $803 were recognized as costs allocated to derivative liabilities based on a pro-rata allocation of total issuance costs based on the relative fair value of the Warrants and the Common Shares issued as part of the unit offering.
During the three and six months ended February 28, 2022, there were no warrants exercised (February 28, 2021 - 1,698,200 and 1,698,200 warrants exercised, for gross proceeds of $4,246 and $4,246). As at February 28, 2022, the Company revalued the remaining derivative warrant liabilities at an estimated fair value of $12,996 (August 31, 2021 – $35,019) using the Black-Scholes option pricing model. The Company recorded a decrease in the estimated fair value change of the derivative warrant liabilities for the three and six months ended February 28, 2022 of $9,971 and $22,023 (February 28, 2021 - increase of $37,659 and $42,331), respectively.
The Company’s derivative liabilities included the following balances and changes in the carrying value of Warrants as of February 28, 2022:
| NUMBER OF WARRANTS | AMOUNT | ||||||||||
| Balance - August 31, 2021 | 16,943,650 | $ | 35,019 | ||||||||
| Revaluation of Warrants | — | (12,052) | |||||||||
| Balance - November 30, 2021 | 16,943,650 | 22,967 | |||||||||
| Revaluation of Warrants | — | (9,971) | |||||||||
| Balance - February 28, 2022 | 16,943,650 | 12,996 | |||||||||
MANAGEMENT’S DISCUSSION AND ANALYSIS | FOR THE THREE AND SIX MONTHS ENDED FEBRUARY 28, 2022 AND 2021 27
The following inputs were used to estimate the fair value of the Warrants at February 28, 2022 and August 31, 2021:
| FEBRUARY 28, 2022 | AUGUST 31, 2021 | ||||||||||
| Risk free interest rate | 1.57 | % | 0.45 | % | |||||||
| Life of Warrants (years) | 1.70 | 2.20 | |||||||||
| Market price of Common Shares | 1.91 | 3.38 | |||||||||
| Expected future volatility of Common Shares | 95.30 | % | 100.00 | % | |||||||
| Fair value per warrant | 0.77 | 2.07 | |||||||||
As at February 28, 2022, if the implied volatility increased by 10%, then the change in estimated fair value of the Warrants and net income would increase by $1,509, or if it is decreased by 10%, the change in estimated fair value of the Warrants and net income would decrease by $1,565.
Top-up Rights
On March 10, 2021, through the strategic investment from BAT, the Company issued 58,336,392 Common Shares, resulting in BAT's beneficial ownership in the Company at approximately 19.9%.
Pursuant to the IRA between the Company and BAT, the Company granted BAT certain top-up rights (the "Top-up Rights") to subscribe for additional Common Shares in specified circumstances where the pre-emptive rights are not applicable (referred to in the IRA as "Exempt Distributions") and in specified circumstances where pre-emptive rights were not exercised (referred to in the IRA as “bought deal Distributions”).
The price per Common Share to be paid by BAT pursuant to the exercise of its Top-up Rights will equal the price paid by other participants in the Exempt Distribution or bought deal Distribution, subject to certain restrictions (including, if such price is not permitted pursuant to Securities Laws, at the lowest price permitted thereunder).
The Company has classified the Top-up Rights as a derivative liability, and pursuant to the exercise of stock options, restricted share units, performance share units and warrants that were outstanding at initial recognition on March 10, 2021 (the date of the IRA), the Company recorded a derivative liability of $2,740 based on the estimated fair value of the Top-up Rights at this date using a Monte Carlo pricing model.
During the three and six months ended February 28, 2022, 2,659,716 and 2,659,716 Top-up Rights were exercised (February 28, 2021 - Nil and Nil), for gross proceeds of $6,348 and $6,348 (February 28, 2021 - $nil and $nil), respectively. The Top-up Rights exercised had an estimated fair value of $4 and $4, respectively, on the date of exercise (February 28, 2021 - $nil and $nil), using the Monte Carlo Pricing model. This amount was transferred from derivative liabilities to share capital (Common Shares).
As at February 28, 2022, the Company revalued the Top-up Rights at an estimated fair value of $1,196 (August 31, 2021 – $2,508). The Company recorded a decrease in the estimated fair value change of the Top-up Rights for the three and six months ended February 28, 2022 of $662 and $1,308 (February 28, 2021 - $nil and $nil).
| NUMBER OF TOP-UP RIGHTS | AMOUNT | ||||||||||
| Balance - August 31, 2021 | 6,558,539 | $ | 2,508 | ||||||||
| Granted | 136,467 | — | |||||||||
| Revaluation of Top-up Rights | — | $ | (646) | ||||||||
| Balance - November 30, 2021 | 6,695,006 | $ | 1,862 | ||||||||
| Granted | 2,639,511 | $ | — | ||||||||
| Exercised | (2,659,716) | $ | (4) | ||||||||
| Cancelled / Forfeited | (292,475) | $ | — | ||||||||
| Revaluation of Top-up Rights | — | $ | (662) | ||||||||
| Balance - February 28, 2022 | 6,382,326 | $ | 1,196 | ||||||||
MANAGEMENT’S DISCUSSION AND ANALYSIS | FOR THE THREE AND SIX MONTHS ENDED FEBRUARY 28, 2022 AND 2021 28
The following inputs were used to estimate the fair value of the Top-up Rights at February 28, 2022, and August 31, 2021:
| FEBRUARY 28, 2022 | |||||||||||||||||||||||
| STOCK OPTIONS | WARRANTS | PSUs | RSUs | ||||||||||||||||||||
Average exercise price(1) | $0.59 - $9.65 | $2.50 | $— | $— | |||||||||||||||||||
| Risk free interest rate | 1.37% - 1.59% | 1.39% | 1.63% | 1.63% | |||||||||||||||||||
| Expected future volatility of Common Shares | 90.00% - 105.00% | 100.00% | 85.00% | 85.00% | |||||||||||||||||||
Expected life(1) | 1.60 - 4.08 | 1.70 | 5.17 | 5.02 | |||||||||||||||||||
| Forfeiture rate | 10% | —% | 25% | —% | |||||||||||||||||||
| AUGUST 31, 2021 | |||||||||||||||||||||||
| STOCK OPTIONS | WARRANTS | PSUs | RSUs | ||||||||||||||||||||
Average exercise price(1) | $0.59 - $9.64 | $2.50 | — | — | |||||||||||||||||||
| Risk free interest rate | 0.40% - 0.76% | 0.46% | 0.92% | 0.88% | |||||||||||||||||||
| Expected future volatility of Common Shares | 90.00% - 110.00% | 105.00% | 85.00% | 90.00% | |||||||||||||||||||
Expected life(1) | 1.85 - 4.16 | 2.2 | 5.61 | 5.18 | |||||||||||||||||||
| Forfeiture rate | 10% | —% | 25% | —% | |||||||||||||||||||
| (1)Exercise price and expected life for stock options were determined using the range of exercise prices disclosed in Note 15(iv). | |||||||||||||||||||||||
(ii) Biological Assets
The Company measures biological assets, which consist of cannabis plants, at fair value less costs to sell up to the point of harvest, which then becomes the basis for the cost of finished goods inventories after harvest. Subsequent expenditures incurred on these finished goods inventories after harvest are capitalized based on IAS 2 Inventories.
The changes in the carrying value of biological assets as of February 28, 2022 are as follows:
| CAPITALIZED COST | BIOLOGICAL ASSET FAIR VALUE ADJUSTMENT | AMOUNT | |||||||||||||||
| Balance, August 31, 2021 | $ | 5,765 | $ | 6,357 | $ | 12,122 | |||||||||||
| Acquisition through business combination | 37 | 146 | 183 | ||||||||||||||
| Unrealized gain on change in fair value of biological assets | — | 17,971 | 17,971 | ||||||||||||||
| Production costs capitalized | 23,107 | — | 23,107 | ||||||||||||||
| Transfer to inventory upon harvest | (21,503) | (18,585) | (40,088) | ||||||||||||||
| Carrying amount, February 28, 2022 | $ | 7,406 | $ | 5,889 | $ | 13,295 | |||||||||||
The fair value less costs to sell of biological assets is determined using a model which estimates the expected harvest yield in grams for plants currently being cultivated, then adjusts that amount for the expected selling price per gram, and for any additional costs to be incurred, such as post-harvest costs. The following unobservable inputs, all of which are classified as Level 3 within the fair value hierarchy (see Note 20 of the Interim Financial Statements), are used in determining the fair value of biological assets:
i.average net selling price per gram – calculated as the weighted average current selling price of cannabis sold by the Company, adjusted for expectations about future pricing;
ii.expected yield per plant – represents the number of grams of finished cannabis inventory which is expected to be obtained from each harvested cannabis plant currently under cultivation;
iii.wastage of plants based on their various stages of growth – represents the weighted average percentage of biological assets which are expected to fail to mature into cannabis plants that can be harvested;
iv.post-harvest costs – calculated as the cost per gram of harvested cannabis to complete the sale of cannabis plants post-harvest, consisting of the cost of direct and indirect materials and labour related to drying, labelling, and packaging; and
v.stage of completion in the cultivation process – calculated by taking the weighted average number of weeks in production over a total average grow cycle of approximately 14 weeks.
MANAGEMENT’S DISCUSSION AND ANALYSIS | FOR THE THREE AND SIX MONTHS ENDED FEBRUARY 28, 2022 AND 2021 29
The Company estimates the harvest yields for the cannabis on plants at various stages of growth, based on expected yield of mature plants. As of February 28, 2022, it is expected that the Company’s biological assets will yield 14,506 kg (August 31, 2021 – 11,368 kg) of cannabis when eventually harvested. The Company’s estimates are, by their nature, subject to change, and differences from the anticipated yield will be reflected in the fair value adjustment to biological assets in future periods. The Company accretes fair value on a straight-line basis according to stage of growth. As a result, a cannabis plant that is 50% through its 14-week growing cycle would be ascribed approximately 50% of its harvest date expected fair value less costs to sell (subject to wastage adjustments).
Management believes the most significant unobservable inputs and their impact on fair value are as follows:
| SIGNIFICANT INPUTS & | WEIGHTED AVERAGE INPUT | EFFECT ON FAIR VALUE | |||||||||||||||||||||||||||
| ASSUMPTIONS | FEBRUARY 28, 2022 | AUGUST 31, 2021 | SENSITIVITY | FEBRUARY 28, 2022 | AUGUST 31, 2021 | ||||||||||||||||||||||||
| Average net selling price per gram | $ | 1.62 | $ | 2.54 | Increase or decrease by 10% per gram | $ | 1,248 | $ | 4,764 | ||||||||||||||||||||
| Average yield per plant | 133 | grams | 129 | grams | Increase or decrease by 10 grams | $ | 936 | $ | 937 | ||||||||||||||||||||
The average yield per plant at February 28, 2022 primarily reflects the average yield of the flower component of the plant (with the exception being cannabidiol (“CBD”) dominant strains where trim is also harvested for extraction).
OUTSTANDING SHARE DATA
(i) Outstanding Shares, Warrants and Options and Other Securities
The following table sets out the number of Common Shares, options, warrants, top-up rights, restricted share units and performance share units outstanding of the Company as at February 28, 2022 and April 11, 2022:
| FEBRUARY 28, 2022 | APRIL 11, 2022 | ||||||||||
| Common shares issued and outstanding | 313,689,815 | 313,689,815 | |||||||||
| Options | 7,782,874 | 7,763,724 | |||||||||
| Warrants | 16,943,650 | 16,943,650 | |||||||||
| Top-up rights | 6,382,326 | 6,541,014 | |||||||||
| Restricted share units | 1,351,694 | 1,351,694 | |||||||||
| Performance share units | 269,334 | 269,334 | |||||||||
| Total fully diluted shares | 346,419,693 | 346,559,231 | |||||||||
(ii) Share-based Compensation
On February 25, 2020 (the “Approval Date”), the Company’s shareholders approved a new omnibus equity incentive plan (the “New Equity Incentive Plan”) that governs grants made on or after the Approval Date. Grants made prior to the Approval Date will continue to be governed under the terms of the plan under which they were granted including the Company’s 2011 stock option plan and its 2017 equity incentive plan (the “2017 Equity Incentive Plan”), however, no new grants may be made under such plans.
Total share-based compensation charges, including those related to production employees that are charged to biological assets and inventory and amounts amortized from prepaid expenses and deferred charges, for the three and six months ended February 28, 2022 were $877 and $1,557, respectively (February 28, 2021 – $1,167 and $1,773).
MANAGEMENT’S DISCUSSION AND ANALYSIS | FOR THE THREE AND SIX MONTHS ENDED FEBRUARY 28, 2022 AND 2021 30
Stock options
The following table summarizes changes in the Company’s outstanding stock options for the three and six months ended February 28, 2022:
| NUMBER | WEIGHTED AVERAGE EXERCISE PRICE | ||||||||||
| Balance - August 31, 2021 | 7,797,273 | $ | 3.84 | ||||||||
| Granted | 520,000 | $ | 2.85 | ||||||||
| Exercised | (22,584) | $ | 0.75 | ||||||||
| Cancelled / Forfeited | (188,414) | $ | 5.63 | ||||||||
| Balance - November 30, 2021 | 8,106,275 | $ | 3.74 | ||||||||
| Exercised | (18,215) | $ | 1.33 | ||||||||
| Cancelled / Forfeited | (142,965) | $ | 5.38 | ||||||||
| Expired | (162,221) | $ | 4.51 | ||||||||
| Balance - February 28, 2022 | 7,782,874 | $ | 3.70 | ||||||||
The following is a summary of the outstanding stock options as at February 28, 2022:
| OPTIONS OUTSTANDING | OPTIONS EXERCISABLE | |||||||||||||
| Range of Exercise Prices | Quantity Outstanding | Weighted Average Remaining Contractual Life (years) | Quantity Exercisable | |||||||||||
| $0.30 - $1.10 | 574,183 | 2.9 | 574,183 | |||||||||||
| $1.11 - $2.18 | 858,041 | 7.4 | 527,407 | |||||||||||
| $2.19 - $2.44 | 1,570,990 | 6.4 | 1,329,207 | |||||||||||
| $2.45 - $3.61 | 1,792,365 | 7.6 | 1,317,299 | |||||||||||
| $3.62 - $5.08 | 1,811,044 | 7.0 | 1,583,244 | |||||||||||
| $5.09 - $8.02 | 466,251 | 6.6 | 466,251 | |||||||||||
| $8.03 - $11.27 | 710,000 | 7.2 | 701,784 | |||||||||||
| 7,782,874 | 6.8 | 6,499,375 | ||||||||||||
Options outstanding have exercise prices that range from $0.30 to $11.27 with a weighted average remaining life of 6.8 years. Total share-based compensation charges, including costs related to production employees that are charged to biological assets and inventory and amounts amortized from prepaid expenses and deferred charges, for the three and six months ended February 28, 2022 was $877 and $1,557, respectively (February 28, 2021 – $1,167 and $1,773) were $453 and $1,022 (February 28, 2021 – $871 and $1,257) related to the Company’s stock option plan. The fair value of options granted during the three and six months ended February 28, 2022 was $nil and $934, respectively (February 28, 2021 - $985 and $985). These options are measured at fair value at the date of grant and are expensed over the option’s vesting period, which typically ranges from two- to three-year terms with options vesting in annual tranches evenly over this time period. In determining the amount of share-based compensation related to the options, the Company used the Black-Scholes option pricing model to establish the fair value of options granted.
The following inputs were used for the three months ended February 28, 2022 and February 28, 2021:
| FEBRUARY 28, 2022 | FEBRUARY 28, 2021 | ||||||||||
| Risk free interest rate | no issuances | 0.40% - 0.50% | |||||||||
| Expected life of options | no issuances | 5.0 - 6.5 years | |||||||||
| Expected annualized volatility | no issuances | 79% - 98% | |||||||||
| Expected dividend yield | no issuances | - | |||||||||
| Forfeiture rate | no issuances | 11.0% - 11.3% | |||||||||
Expected volatility was estimated by using the weighted average historical volatility of the Company. The expected life in years represents the period of time that options granted are expected to be outstanding. The risk free rate is based on Government of Canada bonds with a remaining term equal to the expected life of the options. The forfeiture rate is calculated based on historical experience.
Equity incentive plan
As of February 28, 2022, the Company has granted both RSUs and PSUs under the 2017 Equity Incentive Plan and under the New Equity Incentive Plan. The grant price of any RSU or PSU was determined based on market price calculated in accordance
MANAGEMENT’S DISCUSSION AND ANALYSIS | FOR THE THREE AND SIX MONTHS ENDED FEBRUARY 28, 2022 AND 2021 31
with TSX rules at the time of grant and with respect to PSUs, adjusted for any non-market and market performance vesting conditions in accordance with IFRS 2.
The following table summarizes the movements in the Company’s outstanding RSUs:
| NUMBER | |||||
| Balance - August 31, 2021 | 1,186,172 | ||||
| Granted | 391,248 | ||||
| Exercised | (1,483) | ||||
| Cancelled / Forfeited | (9,922) | ||||
| Balance - November 30, 2021 | 1,566,015 | ||||
| Exercised | (208,149) | ||||
| Cancelled / Forfeited | (6,172) | ||||
| Balance - February 28, 2022 | 1,351,694 | ||||
The estimated fair value of the equity settled RSUs granted during the three and six months ended February 28, 2022 was $nil and $1,066, respectively (February 28, 2021 - $734 and $734), which was based on the Company’s share price at the grant date and will be recognized as an expense over the vesting period of the RSUs, which is over a period of three years for most grants. For the three and six months ended February 28, 2022, $319 and $653 (February 28, 2021 - $398 and $790) has been recognized as share-based compensation expense.
The following table summarizes the movements in the Company’s outstanding PSUs:
| NUMBER | |||||
| Balance - August 31, 2021 | 471,847 | ||||
| Granted | 169,843 | ||||
| Exercised | (978) | ||||
| Cancelled / Forfeited | (308,413) | ||||
| Balance - November 30, 2021 | 332,299 | ||||
| Exercised | (57,939) | ||||
| Cancelled / Forfeited | (5,026) | ||||
| Balance - February 28, 2022 | 269,334 | ||||
The estimated fair value of the equity settled PSUs granted during the three and six months ended February 28, 2022 was $nil and $194, respectively (February 28, 2021 - $453 and $453), which was based on the Company’s share price at the grant date, adjusted for an estimate of likelihood of forfeiture, and will be recognized as an expense over the vesting period of the PSUs, which is during the fiscal year-ended August 31, 2022. For the three and six months ended February 28, 2022, $105 and $(118) (February 28, 2021 - $52 and $48) has been recognized as share-based compensation expense.
CRITICAL ACCOUNTING ESTIMATES AND JUDGMENTS
Future changes to accounting standards
Amendments to IAS 12: Deferred Tax related to Assets and Liabilities arising from a Single Transaction
The amendments narrowed the scope of certain recognition exemptions so that it no longer applies to transactions that, on initial recognition, give rise to equal taxable and deductible temporary differences. The Company applies the amendments to transactions that occur on or after the beginning of the earliest comparative period presented. It also, at the beginning of the earliest comparative period presented, recognizes deferred tax for all temporary differences related to leases and decommissioning obligations and recognizes the cumulative effect of initially applying the amendments as an adjustment to the opening balance of retained earnings (or other component of equity, as appropriate) at that date. The amendments will be effective for the annual period beginning on or after January 1, 2023 and the Company has chosen not to early adopt the amendments. The Company is currently evaluating the potential impact of these amendments on the condensed consolidated interim financial statements.
Amendments to IAS 37: Onerous Contracts and the Cost of Fulfilling a Contract
The amendments specify that the ‘cost of fulfilling’ a contract comprises the ‘costs that relate directly to the contract’. Costs that relate directly to a contract can either be incremental costs of fulfilling that contract or an allocation of other costs that relate directly to fulfilling contracts. The amendments apply retrospectively for annual reporting periods beginning on or after January 1, 2022 and the Company has chosen not to early adopt. The Company is currently evaluating the potential impact of these amendments on the condensed consolidated interim financial statements.
Amendments to IAS 16: Property Plant and Equipment: Proceeds before intended use
MANAGEMENT’S DISCUSSION AND ANALYSIS | FOR THE THREE AND SIX MONTHS ENDED FEBRUARY 28, 2022 AND 2021 32
The amendments clarify the accounting for the net proceeds from selling any items produced while bringing an item of property plant and equipment into use. The amendments prohibit a company from deducting from the cost of property plant and equipment proceeds from selling items produced while the company is preparing that asset for its intended use. The company will recognize such sales proceeds and related costs in profit and loss. The amendments apply retrospectively for annual reporting periods beginning on or after January 1, 2022 and the Company has chosen not to early adopt. The Company is currently evaluating the potential impact of these amendments on the condensed consolidated interim financial statements.
Amendments to IFRS 9: Financial Instruments
As part of its 2018-2020 annual improvements to IFRS standards process, the IASB issued amendments to IFRS 9. The amendments clarify the fees that an entity includes when assessing whether the terms of a new or modified financial liability are substantially different from the terms of the original financial liability. These fees include only those paid or received between the borrower and the lender, including fees paid or received by either the borrower or lender on the other’s behalf. The Company applies the amendments to financial liabilities that are modified or exchanged on or after the beginning of the annual reporting period in which the entity first applies the amendments. The amendments are effective for annual reporting periods beginning on or after January 1, 2022 with earlier adoption permitted. The Company is currently evaluating the potential impact of these amendments on the condensed consolidated interim financial statements.
Amendments to IAS 41: Agriculture
As part of its 2018-2020 annual improvements to IFRS standards process, the IASB issued amendments to IAS 41. The amendments remove the requirement in paragraph 22 of IAS 41 for entities to exclude taxation cash flow when measuring the fair value of a biological asset using a present value technique. This will ensure consistency with the requirements in IFRS 13 Fair Value Measurement. The amendments are effective for annual reporting periods beginning on or after January 1, 2022. The amendments will have no impact on the Company's condensed consolidated interim financial statements, due to the short life cycle of its biological assets.
PRODUCT DEVELOPMENT COLLABORATION
On March 10, 2021, in conjunction with the strategic investment received as described herein, the Company and BAT entered into the PDC Agreement pursuant to which the CoE was established to focus on developing the next generation of cannabis products with an initial focus on CBD. The CoE is located at the Company’s indoor Moncton Campus, which holds the Health Canada licenses required to conduct research and product development activities with cannabis products. Both companies are contributing scientists, researchers, and product developers to the CoE and it is governed and supervised by a steering committee consisting of an equal number of senior members from both companies. Under the terms of the PDC Agreement, both Organigram and BAT have access to certain of each other’s IP and, subject to certain limitations, have the right to independently, globally commercialize the products, technologies and IP created by the CoE pursuant to the PDC Agreement.
Pursuant to the terms of the PDC Agreement, $31,109 of the Investment Proceeds was reserved as restricted funds in order to satisfy certain of the Company’s future obligations under the PDC Agreement, including the Company’s portion of its funding obligations under a mutually agreed initial budget for the CoE. Costs relating to the CoE are funded equally by the Company and BAT. Balances are transferred from restricted funds to the Company's general operating account as CoE related expenditures are periodically reconciled and approved. The balance in restricted funds at February 28, 2022 is $34,940 (August 31, 2021 - $31,109).
The CoE is accounted for as a joint operation, in which the Company and BAT contribute 50%. The Company recognized its share of the expenses incurred by the CoE in the condensed consolidated interim statement of operations and comprehensive loss. For the three and six months ended February 28, 2022, $620 and $1,295 of expenses have been recorded in the statement of operations and comprehensive loss.
MANAGEMENT’S DISCUSSION AND ANALYSIS | FOR THE THREE AND SIX MONTHS ENDED FEBRUARY 28, 2022 AND 2021 33
ACQUISITION OF SUBSIDIARIES
i.Laurentian Organic Inc.
On December 21, 2021, the Company acquired 100% of the shares and voting interests of the non-listed LAU for $36,000, consisting of $10,000 in cash consideration, $7,000 on closing and $3,000 held back, with the remaining $26,000 in share consideration at the acquisition date. The Company has agreed to provide the seller additional share consideration based on LAU's future adjusted EBITDA over a period of two years.
Taking control of LAU is expected to enable the Company to penetrate a new product category and provides the Company with access to Laurentian's expertise in the hash manufacturing space. The acquisition is also expected to provide the Company with an increased share of the craft flower and hash market.
For the two months ended February 28, 2022, LAU contributed $2,502 of gross revenue and net income of $536 to the consolidated results. If the acquisition had occurred on September 1, 2021, management estimates consolidated gross revenue would have been $94,824 and consolidated net loss would have been approximately $4,434 for the six months ended February 28, 2022.
Equity Instruments Issued
The fair value of the 10,896,442 Common Shares issued was $27,568, based on the TSX listed share price of the Company on closing of December 21, 2021 of $2.53 per share. The number of Common Shares issued was calculated by dividing the total share consideration of $26,000, per the share purchase agreement, by the 5-day volume-weighted average TSX listed share price of the Company preceding the closing date of $2.39.
Acquisition Costs
The Company incurred acquisition-related costs of $1,039 on legal fees and due diligence costs. Of these costs $984 have been included in the statement of operations and comprehensive loss and $55 have been capitalized to share issuance costs.
Contingent Share Consideration
The acquisition includes contingent share consideration as follows (all capitalized terms used below not otherwise defined herein have the respective meanings ascribed to them in the Company’s agreement to acquire LAU):
a) First Year Earnout calculated for the period January 1, 2022 to December 31, 2022, as the greater of (i) zero and (ii) the difference obtained when the sum of $2,000 and 50% of the agreed capital expenditures is subtracted from 30% of the First Year adjusted EBITDA Multiple, payable in Common Shares, provided that, the sum of the Initial Consideration and the First Year Earnout Amount shall not exceed the First Year adjusted EBITDA Multiple; and
b) Second Year Earnout calculated for the period January 1, 2023 to December 31, 2023, as 19% of the Second Year adjusted EBITDA Multiple less the remaining balance of the agreed capital expenditures less, payable in Common Shares, provided that, the sum of the Initial Consideration, the First Year Earnout Amount and the Second Year Earnout Amount shall not exceed the Second Year EBITDA Multiple.
Earnout payments paid in Common Shares shall be priced based on the five-day volume-weighted average price of the Company’s Common Shares on the TSX as of the day prior to settlement. As at the acquisition date, the fair value of the contingent consideration was estimated to be $6,996.
As at February 28, 2022, the contingent share consideration has been adjusted to $6,718 to reflect changes in estimates, of which $2,913 is included in current liabilities.
Assets acquired and liabilities assumed
The Company has not yet finalized the purchase accounting including determination of any final working capital adjustment. The following table summarizes management's provisional recognition of assets acquired and liabilities assumed at the date of acquisition:
MANAGEMENT’S DISCUSSION AND ANALYSIS | FOR THE THREE AND SIX MONTHS ENDED FEBRUARY 28, 2022 AND 2021 34
| FAIR VALUE ON ACQUISITION | ||||||||||||||
| Assets | ||||||||||||||
| Accounts receivable | $ | 1,317 | ||||||||||||
| Biological assets | $ | 183 | ||||||||||||
| Inventories | $ | 1,767 | ||||||||||||
| Property, plant and equipment | $ | 4,481 | ||||||||||||
| Right-of-use assets | $ | 41 | ||||||||||||
| Intangible assets | $ | 14,217 | ||||||||||||
| Other | $ | 10 | ||||||||||||
| Total assets | $ | 22,016 | ||||||||||||
| Liabilities | ||||||||||||||
| Bank indebtedness | $ | 616 | ||||||||||||
| Accounts payable and accrued liabilities | $ | 3,615 | ||||||||||||
| Lease liability | $ | 41 | ||||||||||||
| Deferred income taxes | $ | 4,105 | ||||||||||||
| Total liabilities | $ | 8,377 | ||||||||||||
| Total identifiable net assets at fair value | $ | 13,639 | ||||||||||||
| Consideration transferred | ||||||||||||||
| Cash consideration | $ | 10,000 | ||||||||||||
| Equity instruments (10,896,442 Common Shares) | $ | 27,568 | ||||||||||||
| Contingent share consideration | $ | 6,996 | ||||||||||||
| Working capital adjustments | $ | (1,960) | ||||||||||||
| $ | 42,604 | |||||||||||||
| Goodwill arising on acquisition | $ | 28,965 | ||||||||||||
Goodwill
Goodwill arising from the acquisition represents the expected synergies, future income and growth and other intangibles that do not qualify for separate recognition. None of the goodwill recognized is expected to be deductible for tax purposes.
ii.The Edibles and Infusions Corporation
On April 6, 2021, the Company acquired 100% of the shares and voting interests of EIC, including intermediate holding companies SUHM Investments Inc. and Quality Confections Corporation who collectively owned 100% of EIC, for $22,000 of share consideration at the acquisition date. The Company has agreed to provide the seller additional share consideration of $13,000 if EIC achieves various milestones. On August 26, 2021, SUHM Investments Inc, Quality Confections Corporation and EIC amalgamated with the continuing entity being EIC. The fair value of the Common Shares issued was based on the TSX listed share price of the Company on closing of April 5, 2021 of $4.36 per share. The Company incurred acquisition-related costs of $620 on legal fees and due diligence costs. Of these costs $555 had been included in the condensed consolidated interim statement of operations and comprehensive loss and $65 were been capitalized to share issuance costs.
The Company elected not to apply the optional concentration test and, as such, carried out a detailed analysis of inputs, outputs and substantive processes. Included in the identifiable assets acquired and liabilities assumed at the date of acquisition of EIC are inputs (production equipment, manufacturing facility and a standard research and processing license), production processes and an organized workforce. The Company has determined that together the acquired inputs and processes significantly contribute to the ability to create revenue. The Company has concluded that the acquired set is a business.
Contingent share consideration
The acquisition includes contingent share consideration based on various milestones as follows:
a) $3,500 to be paid in Common Shares upon the first listing of EIC or Organigram branded product (which was manufactured at the EIC facility) prior to December 31, 2021 in either the Ontario or Alberta recreational market. This was achieved prior to August 31, 2021 and settled subsequently on September 8, 2021;
b) $7,000 to be paid in Common Shares on the generation of $15 million in net revenue during the 12 months ended December 31, 2022; and
c) $2,500 to be paid in Common Shares on the generation of $7 million in adjusted EBITDA for the 12 months ended December 31, 2022.
MANAGEMENT’S DISCUSSION AND ANALYSIS | FOR THE THREE AND SIX MONTHS ENDED FEBRUARY 28, 2022 AND 2021 35
Milestone payments paid in Common Shares shall be priced based on the five-day volume-weighted average price of the Company’s Common Shares on the TSX as of the day prior to settlement.
As at the acquisition date, the fair value of the contingent consideration was estimated to be $5,249. At August 31, 2021, the contingent consideration was adjusted to $9,038 to reflect changes in estimates, of which $3,500 was included in other liabilities on EIC's achievement of the first milestone. On September 8, 2021, the Company issued 1,039,192 Common Shares as consideration for the first milestone earnout, which the fair value of the Common Shares issued was based on the 5-day volume-weighted average TSX listed share price of the Company of $3.37 per share. As at February 28, 2022, the remaining contingent consideration was adjusted to $6,300 to reflect changes in estimates and recorded in the condensed consolidated interim statement of operations and comprehensive loss for the three and six months ended is a change in fair value of $944 and $762, respectively.
During the three and six months ended February 28, 2022, the Company finalized the acquisition accounting, which resulted in an increase to the ROU asset of $1,718, increase to lease liabilities of $411 and a decrease to goodwill of $1,307.
Assets acquired and liabilities assumed
The Company has not yet finalized the purchase accounting including determination of any final working capital adjustment. The following table summarizes management's preliminary recognition of assets acquired and liabilities assumed at the date of acquisition:
| FAIR VALUE ON ACQUISITION | |||||||||||
| Assets | |||||||||||
| Property, plant and equipment | $ | 13,546 | |||||||||
| Intangibles | $ | 2,685 | |||||||||
| Deposits on equipment | $ | 2,157 | |||||||||
| Other assets | $ | 28 | |||||||||
| Total assets | $ | 18,416 | |||||||||
| Liabilities | |||||||||||
| Accounts payable and accrued liabilities | $ | 2,047 | |||||||||
| Lease liability | $ | 2,153 | |||||||||
| Total liabilities | $ | 4,200 | |||||||||
| Total identifiable net assets at fair value | $ | 14,216 | |||||||||
| Consideration transferred | |||||||||||
| Equity instruments (5,045,873 common shares) | $ | 22,000 | |||||||||
| Contingent consideration | $ | 5,249 | |||||||||
| Working capital adjustment | $ | (19) | |||||||||
| $ | 27,230 | ||||||||||
| Goodwill arising on acquisition | $ | 13,014 | |||||||||
Lease liability
The Company measured the acquired lease liabilities using the present value of the remaining lease payments at the date of acquisition. The right-of-use asset was measured at an amount equal to the lease liabilities.
Goodwill
The goodwill is attributable to the skills and technical talent of EIC's work force and the synergies expected to be achieved from integrating EIC into the Company’s existing business. None of the goodwill recognized is expected to be deductible for tax purposes.
The goodwill is attributable to the skills and technical talent of EIC's work force and the synergies expected to be achieved from integrating EIC into the Company’s existing business. None of the goodwill recognized is expected to be deductible for tax purposes.
CONTINGENT LIABILITIES
The Company recognizes loss contingency provisions for probable losses when management can reasonably estimate the loss. When the estimated loss lies within a range, the Company records a loss contingency provision based on its best estimate of the probable loss. If no particular amount within that range is a better estimate than any other amount, the mid-point of the range is used. As information becomes known a loss contingency provision is recorded when a reasonable estimate can be made. The estimates are reviewed at each reporting date and the estimates are changed when expectations are revised. An outcome that deviates from the Company’s estimate may result in an additional expense or release in a future accounting period.
MANAGEMENT’S DISCUSSION AND ANALYSIS | FOR THE THREE AND SIX MONTHS ENDED FEBRUARY 28, 2022 AND 2021 36
On March 3, 2017, a claim in connection with a proposed class-action lawsuit (the “Claim”) was filed with the Supreme Court of Nova Scotia (the “NS Court”) seeking to represent a class who purchased medical marijuana that was the subject of the Company’s product recalls in December 2016 and January 2017 as it may have contained trace elements of the pesticides myclobutanil and bifenazate which are not approved for use by licensed producers. The Claim identifies several causes of action including, among others: (i) negligent design, development and testing, (ii) negligent manufacturing, (iii) negligent distribution, marketing and sale, (iv) breach of contract, and (v) breach of the Competition Act, the Consumer Protection Act, and the Sale of Goods Act, and is seeking remedy in the form of, among other things, the disgorgement of profits accrued to the Company for the sale of contaminated products, exemplary or punitive damages and certain costs.
The Claim was amended on November 16, 2017, to include a claim for alleged adverse health consequences caused as a result of using the recalled product. As at the date hereof, the Company has not received any medical information demonstrating adverse health effects caused as a result of using the recalled product.
The amended Claim also contained a request for an order certifying the proceeding as a class proceeding.
During late June 2018, certification hearings were heard before the NS Court. On January 18, 2019, the NS Court issued its decision granting certification. On March 4, 2019, the Company filed a notice for leave to appeal the certification of the class action brought against it. Leave to appeal was granted and the appeal was heard on October 15, 2019 and the decision was reserved. On April 30, 2020, the Nova Scotia Court of Appeal ruled that the plaintiff failed to present any evidence that the cannabis purchased by medical customers in 2016 could cause any particular adverse health effects. As a result, class members would not be able to bring claims for damages for adverse health effects in the class proceeding. On June 26, 2020, the plaintiff filed an application for leave to appeal the Nova Scotia Court of Appeal’s decision with the Supreme Court of Canada. On November 5, 2020, the application for leave to appeal was dismissed by the Supreme Court of Canada.
The Company is working to settle what remains of the litigation. The Company reported the Claim to its insurance provider which appointed counsel to defend the Claim. Insurance may be available to cover a portion of the fees or damages which may be associated with the Claim although the Company’s coverage may be subject to varying limits and exclusions. The litigation process will continue into the foreseeable future unless settled out of court.
On June 16, 2020, a claim in connection with a proposed national consumer protection class-action lawsuit (the "Alberta Claim") was filed with the Court of Queen’s Bench in Alberta (the “AB Court”) seeking damages against several Canadian cannabis companies including the Company. The Alberta Claim does not particularize all of the claims against the companies; however, it makes allegations with respect to the content of THC and CBD in the companies’ products. In order to proceed as a class action, the AB Court must certify the action as a class action. A certification hearing has not yet been scheduled. The Company has reported the Alberta Claim to its insurers.
At February 28, 2022, an amount of $2,338 in regards to claims and other contingencies was included in the condensed consolidated interim statement of financial position under provisions. For the three and six months ended February 28, 2022, payments of $412 were made and no additional provisions (February 28, 2021 - $500 and $500) have been recorded in the condensed consolidated interim statements of operations and comprehensive loss.
DISCLOSURE CONTROLS AND PROCEDURES AND INTERNAL CONTROL OVER FINANCIAL REPORTING
In accordance with National Instrument 52-109 - Certification of Disclosure in Issuers’ Annual and Interim Filings (“NI 52-109”) and Rule 13a-15 under the United States Securities Exchange Act of 1934, as amended (the “Exchange Act”), the establishment and maintenance of Disclosure Controls and Procedures (“DCP”) and Internal Control Over Financial Reporting (“ICFR”) is the responsibility of management.
Management has determined that the Company became a “large accelerated filer”, as defined in Rule 12b–2 under the Exchange Act, effective August 31, 2021 (being the last day of the Company’s most recently completed fiscal year). Accordingly, the Company ceased to be an “emerging growth company” as defined in Exchange Act Rule 12b-2, and the Company’s ICFR as of August 31, 2021, became subject to audit by KPMG LLP, the Company’s independent registered public accounting firm. The Company engaged KPMG LLP to perform an “integrated audit” which encompassed an opinion on the fairness of presentation of the Company’s audited annual consolidated financial statements for the financial year then ended, as well as an opinion on the effectiveness of the Company’s ICFR. KPMG LLP‘s attestation report on the Company’s ICFR is incorporated by reference into the Company’s annual report on Form 40-F under the Exchange Act for the year ended August 31, 2021.
MANAGEMENT’S DISCUSSION AND ANALYSIS | FOR THE THREE AND SIX MONTHS ENDED FEBRUARY 28, 2022 AND 2021 37
DISCLOSURE CONTROLS AND PROCEDURES
The Company maintains a set of DCP designed to provide reasonable assurance that information required to be publicly disclosed is recorded, processed, summarized and reported on a timely basis. As required by NI 52-109 and Exchange Act Rule 13a-15(b), an evaluation of the design and operation of our DCP was completed as of February 28, 2022 under the supervision and with the participation of management, including our Chief Executive Officer (“CEO”) and Chief Financial Officer (“CFO”) using the criteria set forth in Internal Control - Integrated Framework, issued by the Committee of Sponsoring Organizations of the Treadway Commission (the “COSO 2013 Framework”). Based upon this evaluation, our CEO and CFO concluded that because of the material weaknesses in our ICFR described below, our DCP were not effective as at such date.
INTERNAL CONTROL OVER FINANCIAL REPORTING
NI 52-109 requires the CEO and CFO to certify that they are responsible for establishing and maintaining ICFR for the Company and that those internal controls have been designed and are effective in providing reasonable assurance regarding the reliability of financial reporting and the preparation of financial statements in accordance with IFRS. Similarly, Exchange Act Rule 13a-15(c) requires the Company's management, with the participation of the CEO and CFO, to evaluate ICFR as at the end of the fiscal year. The CEO and CFO are also responsible for disclosing any changes to the Company’s internal controls during the most recent period that have materially affected, or are reasonably likely to materially affect, its internal control over financial reporting.
MATERIAL CHANGES TO THE CONTROL ENVIRONMENT
There have been no changes to the Company’s ICFR during the three months ended February 28, 2022 that have materially affected, or are likely to materially affect, the Company’s ICFR.
LIMITATIONS ON SCOPE OF DESIGN
The Company has limited the scope of its evaluation of DCP and ICFR to exclude controls, policies and procedures over entities that were acquired by the Company not more than 365 days before the end of the financial period. The only entities controlled by the Company but that were scoped out of the evaluation of DCP and ICFR was EIC (acquired on April 6, 2021) and Laurentian (acquired on December 21, 2021).
Excluding goodwill and intangible assets, EIC constitutes approximately 2% of the Company’s current assets, 4% of total assets, 10% of current liabilities and 7% of total liabilities, as well as 7% of net revenue and 17% of net loss as at and for the six months ended February 28, 2022.
Excluding goodwill and intangible assets, Laurentian constitutes approximately 1% of the Company’s current assets, 1% of total assets, 6% of current liabilities and 4% of total liabilities, as well as 3% of net revenue and (10)% of net loss as at and for the six months ended February 28, 2022.
MANAGEMENT’S DISCUSSION AND ANALYSIS | FOR THE THREE AND SIX MONTHS ENDED FEBRUARY 28, 2022 AND 2021 38
MANAGEMENT’S EVALUATION OF INTERNAL CONTROL OVER FINANCIAL REPORTING
The Company’s management, under the supervision and with the participation of its CEO and CFO, conducted an evaluation of the effectiveness of the Company’s ICFR as of August 31, 2021, using the criteria set forth by the COSO 2013 Framework. Based on this evaluation, management concluded that internal control over financial reporting was not effective as of August 31, 2021, due to material weaknesses in internal control over ICFR.
A material weakness is a deficiency, or a combination of deficiencies, in internal control over financial reporting, such that there is a reasonable possibility that a material misstatement of the Company’s annual or interim financial statements will not be prevented or detected on a timely basis. Management has identified the following material weaknesses:
•An ineffective control environment resulting from an insufficient number of trained financial reporting and accounting, information technology (IT) and operational personnel with the appropriate skills and knowledge and with assigned responsibility and accountability related to the design, implementation and operation of ICFR.
•The insufficient number of personnel described above contributed to an ineffective risk assessment process necessary to identify all relevant risks of material misstatement and to evaluate the implications of relevant risks on its ICFR.
•An ineffective information and communication process resulting from: (i) insufficient communication of internal control information, including objectives and responsibilities, such as delegation of authority; and (ii) ineffective general IT controls, ineffective controls related to complex spreadsheets, and ineffective controls over information from service organizations, resulting in insufficient controls to ensure the relevance, timeliness and quality of information used in control activities.
•As a consequence of the above, the Company had ineffective control activities related to the design, implementation and operations of process level and financial statement close controls which had a pervasive impact on the Company's ICFR.
REMEDIATION
The Company continued during the quarter to consider the full extent of the procedures to implement in order to remediate the material weaknesses described above. The current remediation plan includes:
•Identifying key positions necessary to support the Company’s initiatives related to ICFR, and expanding its hiring efforts accordingly.
•Hiring consultants to assist with process improvements and control remediation efforts in targeted accounting, IT and operations processes.
•Formalizing its entity-wide risk assessment process, and documenting internal ownership of risk monitoring and mitigation efforts, with improved risk monitoring activities and regular reporting to those charged with governance at an appropriate frequency.
•Finalize a delegation of authority matrix to enforce desired limits of authority for key transactions, events, and commitments, and communicating these limits of authority to relevant personnel throughout the Company.
•Further simplify and streamline its complex spreadsheet models to reduce the risk of errors in mathematical formulas and improve the ability to verify the logic of complex spreadsheets.
•Hiring a consultant to assist management with process improvements and control remediation for general IT controls.
•Continuing to perform scoping exercises and planning for an ERP implementation to streamline the number of applications used for financial reporting activities.
MANAGEMENT’S DISCUSSION AND ANALYSIS | FOR THE THREE AND SIX MONTHS ENDED FEBRUARY 28, 2022 AND 2021 39
RISK FACTORS
The Company’s business is subject to risks inherent in a high growth, heavily regulated enterprise, and the Company has identified certain risks pertinent to its business that may have affected or may affect its business, financial conditions, results of operations and cash flows, as further described throughout this MD&A and under “Risk Factors” in the AIF. For additional risk factors, readers are directed to the Company’s most recent AIF, which is (a) available under the Company’s issuer profile on SEDAR at www.sedar.com, and (b) incorporated into and forms part of the Company's annual report on Form-40F filed on EDGAR at www.sec.gov. As a general matter, management of the Company attempts to assess and mitigate any risks and uncertainties by retaining experienced professional staff and assuring that the Board of Directors and senior management of the Company are monitoring the risks impacting or likely to impact the business on a continuous basis.
(i) Credit Risk
Credit risk arises from deposits with banks, short-term investments (excluding investments in equity securities), outstanding trade and loan receivables, and restricted funds. For trade receivables, the Company does not hold any collateral as security but mitigates this risk by dealing only with what management believes to be financially sound counterparties and, accordingly, does not anticipate significant loss for non-performance. For other receivables, out of the normal course of business such as the loan receivable, management generally obtains guarantees and general security agreements. The maximum exposure to credit risk of cash, short-term investments, accounts receivable, loan receivable, and restricted funds on the condensed consolidated interim statement of financial position at February 28, 2022 approximates $209,003 (August 31, 2021 - $235,949).
As of February 28, 2022 and August 31, 2021, the Company’s aging of trade receivables was as follows:
| FEBRUARY 28, 2022 | AUGUST 31, 2021 | ||||||||||
| 0-60 days | $ | 23,395 | $ | 20,029 | |||||||
| 61-120 days | 278 | 886 | |||||||||
| Gross trade receivables | $ | 23,673 | $ | 20,915 | |||||||
| Less: Expected credit losses and reserve for product returns and price adjustments | (1,433) | (710) | |||||||||
| $ | 22,240 | $ | 20,205 | ||||||||
(ii) Liquidity Risk
The Company’s liquidity risk is the risk that the Company will not be able to meet its financial obligations as they become due. The Company manages its liquidity risk by reviewing on an ongoing basis its capital requirements. At February 28, 2022, the Company had $82,287 (August 31, 2021 – $55,365) of cash and working capital of $189,597 (August 31, 2021 - $234,349). Further, the Company may potentially access equity capital through the capital markets if required.
The Company is obligated to the following contractual maturities relating to their undiscounted cash flows as at February 28, 2022:
| Carrying Amount | Contractual Cash Flows | Less than 1 year | 1 to 3 years | 3 to 5 years | More than 5 years | |||||||||||||||
| Accounts payable and accrued liabilities | $ | 25,551 | $ | 25,551 | $ | 25,551 | $ | — | $ | — | $ | — | ||||||||
| Long-term debt | 272 | 288 | 80 | 208 | — | — | ||||||||||||||
| $ | 25,823 | $ | 25,839 | $ | 25,631 | $ | 208 | $ | — | $ | — | |||||||||
The contractual maturities noted above are based on contractual due dates of the respective financial liabilities.
In connection with the Company’s facilities, the Company is contractually committed to approximately $28,626 of capital expenditures, mostly related to its Moncton Campus.
(iii) Market Risk
Market risk is the risk that the fair value or future cash flows of a financial instrument will fluctuate because of changes in market prices. Market risk for the Company is comprised of interest rate risk, which is the risk that the fair value or future cash flows of a financial instrument will fluctuate because of changes in market interest rates. Towards the end of fiscal 2021, the Company no longer had any exposure as a significant portion of debt was repaid, as a result a 1% change in benchmark interest rates will have no impact on the Company's interest expense.
(iv) Concentration risk
The Company’s accounts receivable are primarily due from provincial government agencies (three of which, individually, represented more than 10% of the Company’s revenues during the three months ended February 28, 2022), corporations
MANAGEMENT’S DISCUSSION AND ANALYSIS | FOR THE THREE AND SIX MONTHS ENDED FEBRUARY 28, 2022 AND 2021 40
(one of which represented more than 10% of the Company’s revenues during the period), and legal trusts and, thus, the Company believes that the accounts receivable balance is collectible.
COVID-19 CORPORATE ACTION PLAN
In March 2020, the World Health Organization declared the outbreak of a novel strain of coronavirus (“COVID-19”) a global pandemic. Government measures to limit the spread of COVID-19, including the closure of non-essential businesses for periods of time, continued to disrupt the Company’s operations during the three-month period ended February 28, 2022, which disruption remains ongoing.
COVID-19 pandemic related challenges may persist. Due to the ongoing developments and uncertainty, it is not possible to predict the continuing impact that COVID-19 will have on the Company, its financial position, its operating results and/or its cash flows. In addition, it is possible that estimates in the Company’s financial statements will change in the near-term as a result of COVID-19 and the effect of any such changes could be material, which could result in, among other things, an impairment of long-lived assets, including intangible assets. The Company continues to closely monitor the impact of COVID-19 on all aspects of its business.
The Company has continued to implement its COVID response plan including testing protocols on site. The Company expects there may be temporary disruptions in staffing from time to time as a result of self-isolation requirements. As of the date of this MD&A, the Company has approximately 847 active employees, with approximately 694 working out of the Moncton Campus.
MANAGEMENT’S DISCUSSION AND ANALYSIS | FOR THE THREE AND SIX MONTHS ENDED FEBRUARY 28, 2022 AND 2021 41