INTRODUCTION
This Management’s Discussion and Analysis dated January 11, 2023 (this “MD&A”), should be read in conjunction with the unaudited condensed consolidated interim financial statements (the “Interim Financial Statements”) of Organigram Holdings Inc. (the “Company” or “Organigram”) for the three months ended November 30, 2022 (“Q1 Fiscal 2023”) and the audited annual consolidated financial statements for the year ended August 31, 2022 (the "Annual Financial Statements"), including the accompanying notes thereto.
Financial information in this MD&A is based on the Interim Financial Statements of the Company for the three months ended November 30, 2022, and has been prepared in accordance with International Accounting Standard 34 Interim Financial Reporting as issued by the International Accounting Standards Board (“IASB”), unless otherwise stated. All financial information in this MD&A is expressed in thousands of Canadian dollars (“$”), except for share and per share calculations, references to $ millions and $ billions, per gram (“g”) or kilogram (“kg”) of dried flower and per milliliter (“mL”) or liter (“L”) of cannabis extracts calculations.
This MD&A contains forward-looking information within the meaning of applicable securities laws. Refer to “Cautionary Statement Regarding Forward-Looking Information” included within this MD&A.
The financial information in this MD&A also contains certain financial and operational performance measures that are not defined by and do not have any standardized meaning under IFRS but are used by management to assess the financial and operational performance of the Company. These include, but not limited to, the following:
•Yield per plant (in grams);
•Average net selling price per gram and per unit;
•Target production capacity;
•Gross margin before fair value adjustments;
•Adjusted gross margin; and
•Adjusted earnings before interest, taxes, depreciation and amortization ("Adjusted EBITDA").
The Company believes that these non-IFRS financial measures and operational performance measures, in addition to conventional measures prepared in accordance with IFRS, enable investors to evaluate the Company’s operating results, underlying performance and prospects in a similar manner to the Company’s management. The non-IFRS financial performance measures are defined in the sections in which they appear. Adjusted gross margin and Adjusted EBITDA are reconciled to IFRS in the “Financial Review and Discussion of Operations” section of this MD&A.
As there are no standardized methods of calculating these non-IFRS measures, the Company’s approaches may differ from those used by others, and the use of these measures may not be directly comparable. Accordingly, these non-IFRS measures are intended to provide additional information and should not be considered in isolation or as a substitute for measures of performance prepared in accordance with IFRS. Refer to "Cautionary Statement Regarding Certain Non-IFRS Measures" included within this MD&A.
The Company’s wholly-owned subsidiary, Organigram Inc., is a licensed producer of cannabis and cannabis derived products (a “Licensed Producer” or “LP”) under the Cannabis Act (Canada) and the Cannabis Regulations (Canada) (together, the “Cannabis Act”) and regulated by Health Canada. The Company’s wholly-owned subsidiaries, The Edibles and Infusions Corporation (“EIC”) and Laurentian Organic Inc. ("Laurentian") are also licensed under the Cannabis Act.
The Company’s head office is located at 1250-333 Bay Street, Toronto, Ontario, M5H 2R2. The Company's registered office is located at 35 English Drive, Moncton, New Brunswick, E1E 3X3. The Company’s common shares (“Common Shares”) are listed under the ticker symbol “OGI” on both the Nasdaq Global Select Market (“NASDAQ”) and on the Toronto Stock Exchange (“TSX”). Any inquiries regarding the Company may be directed by email to investors@organigram.ca.
Additional information relating to the Company, including the Company’s most recent annual information form (the “AIF”), is available under the Company’s issuer profile on the Canadian Securities Administrators’ System for Electronic Document Analysis and Retrieval (“SEDAR”) at www.sedar.com. The Company’s reports and other information filed with or furnished to the United States Securities and Exchange Commission (“SEC”) are available on the SEC’s Electronic Document Gathering and Retrieval System (“EDGAR”) at www.sec.gov.
MANAGEMENT’S DISCUSSION AND ANALYSIS | FOR THE THREE MONTHS ENDED NOVEMBER 30, 2022 AND 2021 1
CAUTIONARY STATEMENT REGARDING FORWARD-LOOKING INFORMATION
Certain information herein contains or incorporates comments that constitute forward-looking information within the meaning of applicable securities legislation (“forward-looking information”). Forward-looking information, in general, can be identified by the use of forward-looking terminology such as “outlook”, “objective”, “may”, “will”, “could”, “would”, “might”, “expect”, “intend”, “estimate”, “anticipate”, “believe”, “plan”, “continue”, “budget”, “schedule” or “forecast” or similar expressions suggesting future outcomes or events. They include, but are not limited to, statements with respect to expectations, forecasts or other characterizations of future events or circumstances, and the Company’s objectives, goals, strategies, beliefs, intentions, plans, estimates, projections and outlook, including statements relating to the Company’s plans and objectives, or estimates or predictions of actions of customers, suppliers, partners, distributors, competitors or regulatory authorities; and statements regarding the Company’s future economic performance. These statements are not historical facts but instead represent management beliefs regarding future events, many of which by their nature are inherently uncertain and beyond management control. Forward-looking information has been based on the Company’s current expectations about future events.
Certain forward-looking information in this MD&A includes, but is not limited to the following:
•Moncton Campus (as defined herein), Winnipeg Facility (as defined herein) and Lac-Supérieur Facility (as defined herein) licensing and target production capacity and timing thereof;
•Expectations regarding production capacity, facility size, THC (as defined herein) content, costs and yields;
•Expectations regarding the prospects of the Company’s collaboration with a wholly-owned subsidiary of British American Tobacco p.l.c. ("BAT");
•Expectations regarding the prospects for the Company’s subsidiaries EIC and Laurentian;
•The ongoing impact of the current global health crisis caused by COVID-19 (as defined below);
•Expectations around demand for cannabis and related products, future opportunities and sales, including the relative mix of medical versus adult-use recreational cannabis products, the relative mix of products within the adult-use recreational category including wholesale, the Company’s financial position, future liquidity and other financial results;
•Legislation of additional cannabis types and forms for adult-use recreational cannabis in Canada including regulations relating thereto, the timing and the implementation thereof and our future product forms;
•Expectations around branded products and derivative-based products with respect to timing, launch, product attributes, composition and consumer demand;
•Strategic investments and capital expenditures, and expected related benefits;
•Expectations regarding the resolution of litigation and other legal proceedings;
•The general continuance of current, or where applicable, assumed industry conditions;
•Changes in laws, regulations and guidelines, including those relating to the recreational and/or medical cannabis markets domestically and internationally;
•The price of cannabis and derivative cannabis products;
•Expectations around the availability and introduction of new genetics including consistency and quality of plants and the characteristics thereof;
•The impact of the Company’s cash flow and financial performance on third parties, including its supply partners;
•Fluctuations in the price of Common Shares and the market for Common Shares;
•The treatment of the Company’s business under governmental regulatory regimes and tax laws, including the Excise Act (as defined herein) and the renewal of the Company’s licenses thereunder and the Company’s ability to obtain export licenses from time to time;
•The Company’s growth strategy, targets for future growth and forecasts of the results of such growth;
•Expectations concerning access to capital and liquidity and the Company’s ability to access the public markets to fund operational activities and growth;
•The Company’s ability to remain listed on the TSX and NASDAQ and the impact of any actions it may be required to take to remain listed;
•The ability of the Company to generate cash flow from operations and from financing activities;
•The competitive conditions of the industry, including the Company’s ability to maintain or grow its market share;
•Lac-Supérieur Facility expansion plans, capital expenditures, current and targeted production capacity and timing thereof; and
•Expectations concerning Fiscal 2023 performance including with respect to revenue, adjusted gross margin, selling, general and administrative expenses ("SG&A") and Adjusted EBITDA.
Forward-looking information is provided for the purposes of assisting the reader in understanding the Company and its business, operations, risks, financial performance, financial position and cash flows as at and for the periods ended on certain dates, and to present information about management’s current expectations and plans relating to the future, and the reader is cautioned that such statements may not be appropriate for other purposes. In addition, this MD&A may contain forward-looking information attributed to third party industry sources. Undue reliance should not be placed on forward-looking
MANAGEMENT’S DISCUSSION AND ANALYSIS | FOR THE THREE MONTHS ENDED NOVEMBER 30, 2022 AND 2021 2
information, as there can be no assurance that the plans, intentions or expectations upon which they are based will occur. Forward-looking information does not guarantee future performance and involves known and unknown risks, uncertainties and other factors that may cause actual results or events to differ materially from those anticipated in the forward-looking information. By its nature, forward-looking information involves numerous assumptions, known and unknown risks and uncertainties, both general and specific, that contribute to the possibility that the expectations, predictions, forecasts, projections and conclusions will not occur or prove accurate, that assumptions may not be correct, and that objectives, strategic goals and priorities will not be achieved. These and other factors that may cause actual results or events to differ materially from those anticipated in the forward-looking information.
This MD&A contains information concerning our industry and the markets in which we operate, including our market position and market share, which is based on information from independent third-party sources. Although we believe these sources to be generally reliable, market and industry data is inherently imprecise, subject to interpretation and cannot be verified with complete certainty due to limits on the availability and reliability of raw data, the voluntary nature of the data gathering process, and other limitations and uncertainties inherent in any statistical survey or data collection process. We have not independently verified any third-party information contained herein.
Factors that could cause actual results to differ materially from those set forth in forward-looking information include, but are not limited to: financial risks; dependence on senior management and other key personnel, the board of directors of the Company (the “Board of Directors”), consultants and advisors; availability and sufficiency of insurance including continued availability and sufficiency of director and officer and other forms of insurance; the Company and its subsidiaries being able to, where applicable, cultivate cannabis pursuant to applicable law and on the currently anticipated timelines and in anticipated volumes; industry competition; general economic conditions and global events, including heightened economic and industry uncertainty as a result of COVID-19 and governmental action in respect thereto, including with respect to impacts on production, operations, disclosure controls and procedures or internal control over financial reporting, supply chain and distribution disruptions; facility and technological risks; changes to government laws, regulations or policy, including environmental or tax, or the enforcement thereof; agricultural risks; ability to maintain any required licenses or certifications; supply risks; product risks; construction delays or postponements; packaging and shipping logistics; inflationary risk, expected number of medical and adult-use recreational cannabis users in Canada and internationally; potential time frame for the implementation of legislation to legalize cannabis internationally; the Company’s, its subsidiaries' and its investees’ ability to, where applicable, obtain and/or maintain their status as Licensed Producers (as defined herein) or other applicable licenses; risk factors affecting its investees; availability of any required financing on commercially attractive terms or at all; the potential size of the regulated adult-use recreational cannabis market in Canada; demand for and changes in the Company’s cannabis and related products, including the Company’s derivative products (as defined herein), and the sufficiency of the retail networks to supply such demand; ability to enter and participate in international market opportunities; general economic, financial market, regulatory, industry and political conditions affecting the Company; the ability of the Company to compete in the cannabis industry and changes in the competitive landscape; a material decline in cannabis prices; the Company’s ability to manage anticipated and unanticipated costs; the Company’s ability to implement and maintain effective internal control over financial reporting and disclosure controls and procedures; the timing for the implementation of the Company's ERP system (as hereinafter defined) and, other risks and factors described from time to time in the documents filed by the Company with securities regulators in Canada and the United States. Material factors and assumptions used in establishing forward-looking information include that construction and production activities will proceed as planned, and demand for cannabis and related products will change in the manner expected by management. All forward-looking information is provided as of the date of this MD&A.
The Company does not undertake to update any such forward-looking information whether as a result of new information, future events or otherwise, except as required by law.
ADDITIONAL INFORMATION ABOUT THE ASSUMPTIONS, RISKS AND UNCERTAINTIES OF THE COMPANY’S BUSINESS AND MATERIAL FACTORS OR ASSUMPTIONS ON WHICH INFORMATION CONTAINED IN FORWARD-LOOKING INFORMATION IS BASED IS PROVIDED IN THE COMPANY’S DISCLOSURE MATERIALS, INCLUDING IN THIS MD&A UNDER “RISK FACTORS” AND THE COMPANY’S CURRENT AIF UNDER “RISK FACTORS”, FILED WITH THE SECURITIES REGULATORY AUTHORITIES IN CANADA AND AVAILABLE UNDER THE COMPANY’S ISSUER PROFILE ON SEDAR AT WWW.SEDAR.COM, AND FILED WITH OR FURNISHED TO THE SEC AND AVAILABLE ON EDGAR AT WWW.SEC.GOV. ALL FORWARD-LOOKING INFORMATION IN THIS MD&A IS QUALIFIED BY THESE CAUTIONARY STATEMENTS.
CAUTIONARY STATEMENT REGARDING CERTAIN NON-IFRS MEASURES
This MD&A contains certain financial and operational performance measures that are not recognized or defined under IFRS (“Non-IFRS Measures”). As there are no standardized methods of calculating these Non-IFRS Measures, the Company's approaches may differ from those used by others, and, this data may not be comparable to similar data presented by other
MANAGEMENT’S DISCUSSION AND ANALYSIS | FOR THE THREE MONTHS ENDED NOVEMBER 30, 2022 AND 2021 3
Licensed Producers of cannabis and cannabis companies. For an explanation of these measures to related comparable financial information presented in the Financial Statements prepared in accordance with IFRS, refer to the discussion below.
The Company believes that these Non-IFRS Measures are useful indicators of operating performance and are specifically used by management to assess the financial and operating performance of the Company. These Non-IFRS Measures include, but are not limited, to the following:
•Yield per plant in grams is calculated by taking the total amount of grams of dried flower harvested, excluding trim, and dividing it by the total number of plants harvested.
Management believes that yield per plant in grams provides a useful measure about the efficiencies gained through its operating activities.
•Average net selling price per gram and per unit are calculated by taking net revenue, which is then divided by total grams or total units sold in the period.
Management believes the average net selling price per gram or per unit measures provide more specific information about the pricing trends over time by product type.
•Gross margin before fair value adjustments is calculated by subtracting cost of sales, before the effects of unrealized gain on changes in fair value of biological assets, realized fair value on inventories sold and other inventory charges from total net revenue. Gross margin before fair value adjustments percentage is calculated by dividing gross margin before fair value adjustments (defined above) divided by net revenue.
Management believes that these measures provide useful information to assess the profitability of our cannabis operations as it excludes the effects of non-cash fair value adjustments on inventory and biological assets, which are required by IFRS.
•Adjusted gross margin is calculated by subtracting cost of sales, before the effects of: (i) unrealized gain on changes in fair value of biological assets; (ii) realized fair value on inventories sold and other inventory charges; (iii) provisions (recoveries) and impairment of inventories and biological assets; (iv) provisions to net realizable value; (v) COVID-19 related charges; and (vi) unabsorbed overhead relating to underutilization of the production facility grow rooms and manufacturing equipment, most of which is related to non-cash depreciation expense, from net revenue. Adjusted gross margin percentage is calculated by dividing adjusted gross margin by net revenue. Adjusted gross margin is reconciled to IFRS in the "Financial Review and Discussion of Operations" section of this MD&A.
Management believes that these measures provide useful information to assess the profitability of our operations as they represent the normalized gross margin generated from operations and exclude the effects of non-cash fair value adjustments on inventories and biological assets, which are required by IFRS. The most directly comparable measure to adjusted gross margin calculated in accordance with IFRS is gross margin before fair value.
•Adjusted EBITDA is calculated as net income (loss) excluding: financing costs, net of investment income; income tax expense (recovery); depreciation, amortization, reversal of/or impairment, (gain) loss on disposal of property, plant and equipment (per the consolidated statement of cash flows); share-based compensation (per the consolidated statement of cash flows); share of loss from investments in associates and impairment loss from loan receivable; unrealized loss (gain) on changes in fair value of contingent consideration; change in fair value of derivative liabilities; expenditures incurred in connection with research and development activities (net of depreciation); unrealized (gain) loss on changes in fair value of biological assets; realized fair value on inventories sold and other inventory charges; provisions and impairment of inventories and biological assets; provisions to net realizable value of inventories; COVID-19 related charges, net of government subsidies and insurance recoveries; legal provisions (recoveries); incremental fair value component of inventories sold from acquisitions; ERP implementation costs; transaction costs; and share issuance costs. Adjusted EBITDA is reconciled to IFRS in the "Financial Review and Discussion of Operations" section of this MD&A.
Adjusted EBITDA is intended to provide a proxy for the Company’s operating cash flow and derives expectations of future financial performance for the Company, and excludes adjustments that are not reflective of current operating results. The most directly comparable measure to Adjusted EBITDA calculated in accordance with IFRS is net income (loss).
Non-IFRS Measures should be considered together with other data prepared in accordance with IFRS to enable investors to evaluate the Company’s operating results, underlying performance and prospects in a manner similar to the Company’s
MANAGEMENT’S DISCUSSION AND ANALYSIS | FOR THE THREE MONTHS ENDED NOVEMBER 30, 2022 AND 2021 4
management. Accordingly, these non-IFRS measures are intended to provide additional information and should not be considered in isolation or as a substitute for measures of performance prepared in accordance with IFRS.
BUSINESS OVERVIEW
NATURE AND HISTORY OF THE COMPANY’S BUSINESS
The Company’s wholly-owned subsidiary Organigram Inc. is a Licensed Producer of cannabis under the Cannabis Act.
The Company is authorized for wholesale shipping of cannabis plant cuttings, dried flower, blends, pre-rolls and cannabis derivative-based products to approved retailers and wholesalers for adult-use recreational cannabis under the individual provincial and territorial regulations as per the Cannabis Act.
The Company is also authorized to distribute cannabis for medical use. In Fiscal 2022, Organigram made a strategic decision to shift its medical distribution fulfillment approach from direct shipment to patients from the Company to fulfillment via Medical Cannabis by Shoppers Drug Mart. The Company continues to be committed to medical patients via its Shoppers Drug Mart relationship and will also continue to bring new innovations to this channel. In Q1 of Fiscal 2023, the company introduced 26 new SKUs to Medical Cannabis by Shoppers Drug Mart.
The Company conducts its operations at its facilities located in Moncton, New B
runswick, Winnipeg, Manitoba and Lac-Supérieur, Quebec. The Company has expanded its main facility in Moncton over time to create additional production capabilities by strategically acquiring land and buildings adjacent to the main facility (together, the “Moncton Campus”), including to add capacity for the manufacture of derivative product forms. In Fiscal 2022, the Phase 4C expansion at Moncton was completed which increased the grow rooms available for flowering to 115 and the approximate annual capacity to 85,000 kg of flower. The total capacity of the Moncton Campus will continue to fluctuate as the Company further refines its growing methods and room utilization.
In March 2021, the Company formed a Product Development Collaboration ("PDC") with BAT, a leading, multi-category consumer goods business, and established a "Centre of Excellence" (the "CoE") to focus on the next generation of cannabis products with an initial focus on cannabidiol ("CBD"). The CoE is established at the Company's Moncton Campus, which holds the Health Canada licenses required to conduct research and development activities with cannabis products. Both companies contributed scientists, researchers, and product developers to the CoE which is governed and supervised by a steering committee consisting of an equal number of senior members from both companies. Under the terms of the PDC Agreement (as defined herein), both Organigram and BAT have access to certain of each other’s intellectual property (“IP”) and, subject to certain limitations, have the right to independently, globally commercialize the products, technologies and IP created by the CoE pursuant to the PDC Agreement.
During April 2021, the Company expanded its manufacturing and production footprint with the acquisition of Edibles and Infusion Corporation ("EIC"), located in Winnipeg, Manitoba (the "Winnipeg Facility"). The Winnipeg Facility holds a research license and standard sale and processing license under the Cannabis Act. As a wholly-owned subsidiary, EIC has enabled the Company to penetrate a new product category and gain access to its expertise in the confectionary space. The Winnipeg Facility also provides the Company with a share of the cannabis infused gummies market and other derivative products.
The Company has additional cannabis production capacity at its wholly-owned subsidiary, Laurentian, located in Lac-Supérieur, Quebec, acquired on December 21, 2021 (the "Lac-Supérieur Facility"). The Lac-Supérieur Facility has a cultivation focus on artisanal craft flower and on the production of hash, a cannabis derivative. The Lac-Supérieur Facility provides the Company with a foothold in the important Quebec market, and also adds to the Company's premium product portfolio, providing further opportunities for margin expansion. The facility holds a standard processing and cultivation license under the Cannabis Act.
STRATEGY
Organigram’s strategy is to leverage its broad brand and product portfolio and culture of innovation to increase market share, drive profitability and grow into an industry leader that delivers long-term shareholder value.
The pillars of the Company’s strategy are:
1.Innovation;
2.Consumer Focus;
3.Efficiency; and
4.Market Expansion.
1. Innovation
Meeting the demands of a fast-growing industry with changing consumer preferences requires the ability to innovate and create breakthrough products that are embraced by the market and establish a long-term competitive advantage.
MANAGEMENT’S DISCUSSION AND ANALYSIS | FOR THE THREE MONTHS ENDED NOVEMBER 30, 2022 AND 2021 5
The Company is committed to maintaining a culture of innovation and has established a track record of introducing differentiated products that are able to quickly capture market share, specifically:
•SHRED: the first milled flower product blended to create curated flavour profiles;
•Edison JOLTS: Canada’s first flavoured high-potency lozenge with 100 mg of tetrahydrocannabinol ("THC") per package; and
•Monjour Wellness gummies: The CBD-focused wellness brand available in a large format and providing multiple flavours in one package.
Consistent with its innovation culture, in Fiscal 2021, the Company announced the launch of its CoE as part of its PDC with BAT, a leading multi-category consumer goods business. The CoE focuses on research and development to develop the next generation of cannabis products, with an initial focus on CBD.
2. Consumer Focus
The Company seeks to address the changing needs of the adult cannabis consumer through its broad product portfolio with offerings in the most popular categories and price points. Based on ongoing consumer research, the portfolio is refreshed frequently with different flower strains, new package formats and new product introductions. The Company’s alignment with consumers is evidenced by its #3 market position and category leadership:
•SHRED products have been introduced in multiple categories with the brand surpassing $150 million in retail sales and achieving a net promoter score of 77 percent1;
•HOLY MOUNTAIN: a new offering in the value sector consisting of unique flower strains and pressed hash;
•Edison JOLTS: #1 position for capsules2; and
•SHRED’ems gummies and Monjour soft chews: among the top-selling gummies in Canada which combined held the #3 market position in the gummy category2 with Monjour being the best-selling CBD only gummy.
In addition to third-party and direct consumer research, the Company maintains close contact with consumers through an active social presence and has established the Cannabis Innovators Panel. This online panel engages with up to 2,500 cannabis consumers across Canada on a regular basis and helps to inform the Company on product development and brand initiatives.
3. Efficiency
From its inception, the Company has remained committed to being an efficient operator.
The Company’s growing facility in Moncton, New Brunswick utilizes three-tier cultivation technology to maximize square footage. The facility has proprietary information technology in place to track all aspects of the cannabis cultivation and harvest process. The Company maintains a continuous improvement program to maximize harvest yield while reducing operating costs. This is complemented by the introduction of automation in post-harvest production, including high-speed pouch packing, pre-roll machines and automated excise stamping.
The Winnipeg Facility is highly-automated and is able to efficiently handle both small-batch artisanal manufacture of edibles as well as large-scale nutraceutical-grade production. The facility provides the Company with the ability to produce a wide range of high-quality edible products at attractive price points.
The Lac-Supérieur Facility houses a cultivation and derivatives processing facility. The Company has committed $13 million in growth capital expenditures based on current expectations for the cost of expanding the facility to increase capacity, processing and storage space and deliver on automation.
4. Market Expansion
The Company is committed to expanding its market presence by adding to its product offering and enhancing its geographical presence. This strategy is enabled by strategic merger and acquisition opportunities and assessing expansion into international markets.
Examples of market expansion include:
•The strategic acquisitions of EIC which added a purpose-built, highly-automated, 51,000-square-foot cannabis edibles manufacturing facility, and Laurentian, whose Lac-Supérieur Facility added craft cultivation and hash to Organigram's product portfolio and increased our presence in Quebec;
•Shipments to Canndoc Ltd. ("Canndoc") in Israel and Cannatrek Medical Pty Ltd. ("Cannatrek") and MedCan Australia Pty Ltd. ("MedCan") in Australia to supply bulk cannabis into these markets.
1 Brightfield Group
2 Hifyre data extract from December 21, 2022
MANAGEMENT’S DISCUSSION AND ANALYSIS | FOR THE THREE MONTHS ENDED NOVEMBER 30, 2022 AND 2021 6
KEY DEVELOPMENTS DURING THE QUARTER AND SUBSEQUENT TO NOVEMBER 30, 2022
In November 2022, the Company announced HOLY MOUNTAIN, the Company’s newest value "brand", featuring an initial lineup of legendary dried flower strains entering the market with value pressed hash. With the introduction of HOLY MOUNTAIN, Organigram now offers value-priced flower in an expanded range of sizes, starting with 3.5 gram offerings at launch.
In November 2022, the Company introduced Monjour Twilight Tranquility, sugar-free soft chews in pear, plum and lavender flavours. Each soft chew contains the cannabinoids CBD, CBN and CBG. Sold in packs of 25.
In November 2022, the Company announced that it has entered into a new multi-year agreement to supply dried flower to Canndoc, a subsidiary of InterCure Ltd. ("InterCure"), Israel's largest and most established pharmaceutical cannabis producer. The agreement provides for a commitment to supply 10,000 kg of dried flower with an option for InterCure to elect to purchase up to an additional 10,000 kg of dried flower for InterCure's international supply chain.
In November 2022, the Company introduced a number of pre-rolls infused with hash. Two examples are Edison Grape Crescendo, infused with bubble hash, and Tremblant Sweet Cherry, infused with hash.
In December 2022, the Company was awarded "Cannabis Company of the Year" by KIND Magazine.
OPERATIONS AND PRODUCTION
Moncton Cultivation Campus
At the Moncton Campus, the Company continues to make progress on its ongoing improvement program. This includes implementation of various new initiatives which have resulted in an increase in an average THC content per plant and the average yield per plant. The Phase 4C expansion at Moncton was completed in Fiscal 2022 which increased the approximate annual capacity to 85,000 kg of flower. The Company has also identified additional changes to its growing and harvesting methodologies, that should assist the operating conditions of the Moncton Campus resulting in higher quality flower and a reduction in production costs. The total capacity of the Moncton Campus will continue to fluctuate as the Company further refines its growing methods and room utilization.
The Company harvested 22,138 kg of dried flower during Q1 Fiscal 2023 compared to 11,603 kg of dried flower in Q1 Fiscal 2022. The increase of 10,693 kg (92%) from the comparative period was primarily related to increased cultivation planting, staffing and environmental upgrades along with additional rooms being available that occurred over the period from Q1 Fiscal 2022 to Q1 Fiscal 2023, that was done in order to meet the increased demand for many of the Company's products.
Moncton Derivatives Facility
Contained in the 56,000 square foot expansion referred to as Phase 5 of the Moncton Campus is the Company's derivatives facility. Phase 5 includes Supercritical CO2, dry sift and cold water extraction laboratories, as well as in-house formulation and finishing of ingestibles, extracts, vape oils and concentrates, in addition to high speed cart filling, bottling and automated packaging. Some of this equipment remains in the commissioning and research and development phase.
Winnipeg Facility
The Company has a purpose-built, highly-automated, 51,000 square-foot manufacturing facility in Winnipeg, Manitoba which was also designed with reference to EU GMP (European Union good manufacturing practice) standards. The Company has no plans to seek certification in the immediate future but continues to evaluate paths to certification. The facility design and the equipment specifications were also designed to handle both smaller-batch artisanal manufacturing as well as large-scale nutraceutical-grade high-efficiency manufacturing and to produce highly customizable, precise, and scalable cannabis-infused products in various formats and dosages including pectin, gelatin, sugar-free soft chews (gummies) and lozenges with novel capabilities such as infusions, striping and the possibility of using fruit purees. Automation and efficiency investments in the facility has resulted in an increase in production. In September, 2021, the facility shipped 339,000 gummies, which increased to 2.8 million gummies in November, 2022.
The Winnipeg Facility currently holds a research license and a standard sale and processing license issued under the Cannabis Act. The Company commenced commercial operations during Fiscal 2021 and as of the date of this MD&A, the Winnipeg Facility has over 90 employees.
Lac-Supérieur Concentrates and Craft Flower Facility
The Company acquired the Lac-Supérieur Facility in December 2021. The Lac-Supérieur Facility has 6,800 square feet of cultivation area, which is currently being expanded to 33,000 square feet. The Lac-Supérieur Facility is currently equipped to
MANAGEMENT’S DISCUSSION AND ANALYSIS | FOR THE THREE MONTHS ENDED NOVEMBER 30, 2022 AND 2021 7
produce approximately 600 kilograms of flower and 1 million packaged units of hash annually. The expansion program currently underway is expected to increase annual capacity to 2,400 kilograms of flower and 2 million packaged units of hash once completed. The Company has committed $13 million towards completing the expansion and management believes that there may be future opportunities for cost savings from further investments in automation and increased capacity from adding staff to the packaging shifts.
CANADIAN ADULT-USE RECREATIONAL CANNABIS MARKET
Organigram continues to increase its focus on generating meaningful consumer insights and applying these insights to the ongoing optimization of its brand and product portfolio with a goal of ensuring that they are geared towards meeting consumer preferences. The Company aggressively and successfully revitalized its product portfolio to meet rapidly evolving consumer preferences and through its increased focus on insights, has continued its expansion of brands and products aimed at driving continued momentum in the marketplace.
DRIED FLOWER AND PRE-ROLLS
Dried flower and pre-rolls remain the first and second largest product categories, respectively, in the Canadian adult-use recreational cannabis market2 and the Company believes that these categories will continue to dominate based on the sales history in mature legal markets in certain U.S. states as well as regulatory restrictions on other form factors (e.g. the 10 mg per package THC limit in the edibles category). While the Company expects consumer preferences will slowly evolve away from THC and price being the key purchase drivers, today they appear to be the most important attributes to consumers for flower products. Over time, genetic diversity and other quality related attributes such as terpene profile, bud density, and aroma, are expected to become increasingly important. While the Company’s efforts are focused on delivering on consumer expectations today, it is concurrently planning for the eventual evolution towards a more nuanced approach to cannabis appreciation through its ongoing work in genetic breeding and pheno-hunting with the goal of offering a unique and relevant assortment to consumers. Additionally, the strategic acquisition of Laurentian in December 2021 allows the Company the opportunity to participate in the growing craft cannabis segment, through its craft facility located in the province of Quebec.
The Company's portfolio of brands continues to show strong momentum within the flower segment in Canada and as of November 2022 maintains a #2 share in the flower category2. The growth and significant contribution of these dried flower value segment brands, however, has contributed to overall margin pressure for Organigram and many of its peers over the last number of quarters. To counteract this phenomenon, Organigram is dedicated to revitalizing its Edison brand and product portfolio, by launching new dried flower offerings with unique genetics and higher potency THC. The completion of these initiatives is expected to increase Edison sales, that have a higher average sales price ("ASP") than value brands and therefore attract higher margins. To address the growing demand for strain differentiation in the value segment, the Company expanded the strains available in its Big Bag O' Buds line and also introduced HOLY MOUNTAIN, a value-sector brand offering hash and dry flower strains in the 3.5 gram format.
CANNABIS DERIVATIVES
While dried flower and pre-rolls are currently the largest categories in Canada, derivative cannabis products, including vapes, concentrates and edibles, are projected to continue to increase in market share over the next several years at the expense of flower.
Organigram is committed to these growing categories. The strategic acquisition of the Winnipeg Facility enabled the Company to produce high quality, edible products such as soft chews (gummies) and lozenges, at scale, positioning the Company to effectively compete in this segment. The acquisition of the Lac-Supérieur Facility provided the Company with the ability to produce high-quality products in the growing hash segment. Since the acquisition, the Company has leveraged its industry-leading national distribution and field sales network to accelerate the distribution and sale of Tremblant Cannabis, its flagship hash brand, to all provinces in Canada.
Overall, Organigram holds the number #3 position in the gummy category2.
SHRED'ems, the Company's cannabis-infused gummies, an extension of the popular, value-priced SHRED brand, were introduced in Q4 Fiscal 2021 and quickly gained momentum within the gummy segment. In Q3 Fiscal 2022, two new sour flavours were added to the product line, as well as SHRED'ems POP! – gummies formulated in three soft drink flavours: Cola, Root Beer and Cream Soda. In Q1 Fiscal 2023, SHRED'ems held the #3 market share position for net sales and #2 position by volume2.
In Q1 of Fiscal 2022, the Company launched Monjour, a CBD-focused wellness brand with four SKUs. The large format and assorted flavours proved to be disruptive to the sector and, as of November 2022, Monjour's Berry Good Day CBD gummy was in the top five of gummies sold in Canada and the leading pure CBD-infused gummy2. The Monjour product line was
MANAGEMENT’S DISCUSSION AND ANALYSIS | FOR THE THREE MONTHS ENDED NOVEMBER 30, 2022 AND 2021 8
further expanded in May 2022 with the introduction of CBN Bedtime Blueberry Lemon gummies, which combine the cannabinoid cannabinol ("CBN") with CBD and THC.
Edison JOLTS, high potency THC lozenges that were developed using proprietary IP, combine the benefits of sublingual oil with the convenience and portability of soft gels. JOLTS held the #1 position in net sales in the capsules and mints category in Q1 Fiscal 20232.
Organigram continues to focus on building share within the vape category through unique formulations, premium hardware, and high-quality inputs. In Fiscal 2022, the Company launched new vape SKUs under the SHRED X brand in the popular 510 cartridge format and formulated in the flavour profiles of the SHRED milled flower products.
RESEARCH AND PRODUCT DEVELOPMENT
The Company’s management believes the cannabis industry is still in the nascent stages of product development and that product innovation backed by core fundamental research and development is necessary to establish a long-term competitive advantage in the industry. Research and development and innovation remain a hallmark of Organigram. The Company has made several investments in Fiscal 2021 and Fiscal 2022 that we anticipate will continue in Fiscal 2023 and strengthen the Company's focus in this area. These efforts are expected to allow Organigram to continue to position itself to be at the forefront of launching new, innovative, differentiated products and formulations that appeal to adult consumers.
BAT Product Development Collaboration and Centre of Excellence
In early Q4 Fiscal 2021, the Company announced the successful launch of the CoE outlined in the PDC Agreement with BAT which was established to focus on research and product development activities for the next generation of cannabis products, as well as cannabinoid fundamental science, with an initial focus on CBD. The CoE is located at the Moncton Campus, which holds the Health Canada licenses required to conduct research and development activities with cannabis products.
Under the PDC Agreement, both Organigram and BAT have access to certain of each other’s IP and have the right to independently and globally commercialize the products, technologies, and IP created. Costs relating to the CoE are being funded equally by Organigram and BAT. Approximately $31 million of BAT’s investment in Organigram has been reserved for Organigram’s portion of its funding obligations.
The CoE development and scientific process is supporting discovery and development efforts on novel vapour ingredients, substrates and will guide the optimization of the existing traditional extract and distillate ingredients. The supporting scientific data also provides an industry leading vapour data set that will serve as part of a foundation for future development activities, including consumer safety, product quality and performance.The state-of-the-art biological experiment laboratory ("BioLab") has been operational since June 2022 and is conducting work for the CoE. It is hoped that the work being undertaken, including development of genetic toolboxes for research of key cannabis traits, will accelerate R&D activities and has already been used to support several plant science discoveries that will eventually benefit Organigram’s existing own plant portfolio and long term growing strategies.
Plant Science, Breeding and Genomics Research and Development in Moncton
Organigram’s cultivation program; a key strategic advantage for the Company has continued its expansion with the addition of a dedicated cultivation R&D space. The new space has accelerated rapid assessment and screening, delivering 20 to 30 unique cultivars every two months while freeing up rooms for commercial grow operations. The Plant Science team continues to move the garden towards unique, high terpene and high THC, in-house grown cultivars, while also leveraging the newly commissioned BioLab for ongoing plant science innovation focusing on quality, potency and disease-resistance marker discovery to enrich the future flower pipeline.
OUTLOOK
The Company's outlook remains positive on the cannabis market both in Canada and internationally. Canada-wide recreational retail sales are expected to total $5.3 billion in calendar 20263.
The cannabis industry in Canada is highly competitive and has been oversupplied versus the current market demand considering both regulated Licensed Producers and the still largely unfettered operations of the illicit market including many online delivery platforms. Consumer trends and preferences continue to evolve, including strong demand in the large format value segment, a desire for higher THC potency particularly in dried flower, as well as a penchant for newness, including new genetic strains and novel products. Organigram continues to revitalize its product portfolio to address these changing consumer trends and preferences in order to grow sales and capture market share. The Company has also seen supply and
3 BDSA Canada Market Forecast, September 2022
MANAGEMENT’S DISCUSSION AND ANALYSIS | FOR THE THREE MONTHS ENDED NOVEMBER 30, 2022 AND 2021 9
demand dynamics brought into a more equilibrated state as many LPs have shuttered surplus cultivation capacity including as a direct result of M&A and liquidation activities.
Against this backdrop of strong industry growth, increased demand for the Company's products is evidenced by Organigram's national adult-use recreational cannabis retail market share ("market share") in Canada. In Q1 Fiscal 2023, the Company held at the #3 position in market share with Organigram holding the #1 position in milled flower, #1 in capsules, the #3 position in gummies and the #3 position in hash nationally. Management believes that the Company is better equipped to fulfill demand in Fiscal 2023 with larger harvests, driven by stronger yields and harvests from the Moncton Phase 4C expansion coming online, compared to Fiscal 2022. With a full year of revenues from the Company's Lac-Supérieur Facility, management expects that the Company will generate higher revenue in Fiscal 2023 as compared to Fiscal 2022. In addition to the domestic sales growth, the Company expects higher international revenue under its new multi-year supply agreement with Canndoc in Israel and continued shipments to Medcan and Cannatrek in Australia.
The Company intends to continue to leverage its Moncton Campus which it believes can provide a sustainable competitive advantage over its peers as a result of having over 131 three-tiered cultivation rooms each with the ability to deliver bespoke growing environmental conditions (lighting, humidity, fertigation, plant density) tailored individually to a wide variety of genetics (115 of these rooms are used for the flowering period). With an improved genetics portfolio (including contributions from the dedicated cultivation R&D space at the newly-commissioned BioLab) and a higher average THC being grown than the previous year, the Company believes it is well positioned to take advantage of the dried flower and pre-roll categories which collectively represents approximately 70%2 of the Canadian legal market.
Opportunities to scale up new genetics require a patient and deliberate process where cultivation protocols are trialed for each strain and adjusted through multiple growth cycles before full roll-out to multiple rooms in the facility. The Company has launched several new genetics under the Edison brand. Organigram’s commitment to invest in new genetics continues and the Company expects to launch more new high THC and high terpene genetics in the near term.
In addition to traditional dried flower and pre-roll offerings, Organigram expects to be in a position to generate more revenue growth from the production of soft chews and other confectionary products with the specialized equipment at the Winnipeg Facility. The Company completed its first sales of Winnipeg Facility manufactured soft chews during Q4 Fiscal 2021, and launched several line extensions during Fiscal 2022. In Fiscal 2023, management expects continued meaningful growth in this product category.
The Lac-Supérieur Facility was acquired in December 2021 and adds hash and artisanal craft cannabis to the Company's product offerings. The application of the Company's direct sales force and national distribution has been successful at achieving national distribution for the hash products and is expected to generate additional revenues from these operations in Fiscal 2023.
Unabsorbed overhead costs were $nil in Q2, Q3 and Q4 of Fiscal 2022, a significant reduction from $1,400 in Q4 Fiscal 2021 (entire Fiscal 2021 was $8,063). The prior periods had significant unabsorbed overhead costs as a consequence of the unused or idled grow rooms. With the Company's cultivation operating at capacity, there was no current period charge for idled or unused rooms and for costs related to underutilization of certain derivative products manufacturing equipment. The Company does not expect to incur expenses for unabsorbed overheads for Fiscal 2023.
The Company's adjusted gross margin4 increased from Q4 2022's 23% to Q1 2023's 30%. This improvement was primarily due to lower cultivation costs that was the result of higher plant yields, ongoing cost efficiency improvements and the benefit of lowered per units costs that were achieved due to increased scale of operations at the Moncton facility (Phase 4C expansion was completed at the end of Q3 2022, with planting and harvests occurring over Q4 2022 and Q1 2023).
The Company expects to achieve similar adjusted gross margin rates throughout Fiscal 2023 with further cost saving initiatives being put into place to help offset anticipated price compression.
The overall level of Q2 to Q4 Fiscal 2023 adjusted gross margins will also be dependent on other factors including, but not limited to product category and brand sales mix. Organigram has identified the following sales mix opportunities which it believes have the potential to further improve adjusted gross margins over time:
•International sales, which have historically attracted higher margins and are expected to represent a greater proportion of the Company’s revenue;
•Sales from the Holy Mountain brand, which will include several product categories, in a number of higher margin formats with national distribution on most SKUs
•The launch of new products across different derivative categories with expected attractive long-term margin profiles; and
4 Adjusted gross margin is a non-IFRS financial measure. See "Cautionary Statement Regarding Certain Non-IFRS Measures".
MANAGEMENT’S DISCUSSION AND ANALYSIS | FOR THE THREE MONTHS ENDED NOVEMBER 30, 2022 AND 2021 10
•The larger volume of higher margin sales expected from the Lac-Supérieur Facility, achievable from the increased capacity post construction.
Outside of Canada, the Company serves international markets (mainly Israel and Australia) from Canada via export permits and is looking to augment sales channels internationally over time in other markets. The Company continues to monitor regulatory developments in other jurisdictions. In early Q1 Fiscal 2021, the Israeli Ministry of Health amended its quality standards for imported medical cannabis. In June 2021, the Company received its Good Agricultural Practice certification from Control Union Certifications under the Control Union Medical Cannabis Standard (“CUMCS”) in order to permit it to continue its shipments to Israel under the amended Israeli quality standards. The Company has sought and during May 2022 received an updated certification for IMC-GAP by CUMCS to demonstrate it continues to meet the evolving Israeli quality standards. This certification is subject to ongoing audit requirements.
Shipments to Canndoc resumed during Fiscal 2022 and on November 17, 2022, the Company entered into a multi-year agreement with Canndoc that contemplates shipping up to 20,000 kilograms of dried flower. Future shipments to Australia and Israel are contingent upon the timing and receipt of regulatory approval from Health Canada, including obtaining an export permit, as well as timing and receipt of regulatory approval from the purchaser's regulatory authority, including obtaining an import permit.
Recent political changes and cannabis election ballot initiatives for both medical and recreational use in the United States suggest that the potential movements to U.S. federal legalization of cannabis (THC) remain difficult to predict. The Company continues to monitor and develop a potential U.S. entry strategy that could include THC, CBD and other minor cannabinoids. The Company continues to monitor recreational legalization opportunities in European jurisdictions with a particular focus on German opportunities based on the size of the addressable market and recent regulatory changes.
With the significant capital injection from BAT and the PDC Agreement, the Company is well positioned to expand into the U.S. and further international markets at the appropriate time and subject to applicable laws. Under the PDC Agreement, the Company is granted a worldwide, royalty-free, sub-licensable, perpetual license to exploit IP developed under the PDC Agreement in any field. This license, which is non-exclusive outside of Canada and sole in Canada will also enhance Organigram’s ability to enter markets outside of Canada, including through sublicensing arrangements with established operators.
Without limiting the generality of risk factor disclosures referenced in the “Risk Factors” section of this MD&A, the expectations concerning revenue, adjusted gross margin and SG&A (comprises of general and administrative and selling and marketing expense) are based on the following general assumptions: consistency of revenue experience with indications of performance to date, consistency of ordering and return patterns or other factors with prior periods and no material change in legal regulation, market factors or general economic conditions. The Company disclaims any obligation to update any of the forward looking information except as required by applicable law. See cautionary statement in the “Introduction” section at the beginning of this MD&A.
MEDICAL MARKET
The cannabis data company BDSA estimates that the Canadian medical market value for calendar 2022 at $320M, a 13% year-over-year decline5. Also, the number of medical patients is projected to further decrease within the year, largely due to migration to the recreational channel. In Fiscal 2022, Organigram shifted its medical strategy from direct shipment to patients to fulfillment through the Medical Cannabis by Shoppers platform offered by Shoppers Drug Mart. The Company has transitioned its patient base to the platform and continues to be committed to patients through its partnership with Shoppers Drug Mart.
5 BDSA Market Forecast, September 2022
MANAGEMENT’S DISCUSSION AND ANALYSIS | FOR THE THREE MONTHS ENDED NOVEMBER 30, 2022 AND 2021 11
FINANCIAL RESULTS AND REVIEW OF OPERATIONS
CAUTIONARY NOTE REGARDING NON-IFRS FINANCIAL MEASURES
The Company uses certain non-IFRS performance measures such as Adjusted EBITDA and adjusted gross margin in its MD&A and other public documents, which are not measures calculated in accordance with IFRS and have limitations as analytical tools. These performance measures have no prescribed meaning under IFRS and therefore amounts presented may not be comparable to similar data presented by other companies. The data is intended to provide additional information and should not be considered in isolation or as a substitute for measures of performance such as net income or other data prepared in accordance with IFRS. See the cautionary statement in the “Introduction” section at the beginning of this MD&A, and the following discussion.
FINANCIAL HIGHLIGHTS
Below is the quarter-over-quarter analysis of the changes that occurred for the three months ended November 30, 2022 and November 30, 2021. Commentary is provided in the pages that follow.
| Q1-2023 | Q1-2022 | $ CHANGE | % CHANGE | ||||||||||||||||||||||||||||||||
| Financial Results | |||||||||||||||||||||||||||||||||||
| Gross revenue | $ | 60,882 | $ | 44,345 | $ | 16,537 | 37 | % | |||||||||||||||||||||||||||
| Net revenue | $ | 43,321 | $ | 30,378 | $ | 12,943 | 43 | % | |||||||||||||||||||||||||||
| Cost of sales | $ | 31,621 | $ | 27,924 | $ | 3,697 | 13 | % | |||||||||||||||||||||||||||
| Gross margin before fair value adjustments | $ | 11,700 | $ | 2,454 | $ | 9,246 | 377 | % | |||||||||||||||||||||||||||
| Gross margin % before fair value adjustments | 27 | % | 8 | % | 19 | % | 238 | % | |||||||||||||||||||||||||||
| Realized fair value on inventories sold and other inventory charges | $ | (12,528) | $ | (12,313) | $ | 215 | 2 | % | |||||||||||||||||||||||||||
| Unrealized gain on changes in fair value of biological assets | $ | 24,714 | $ | 10,469 | $ | 14,245 | 136 | % | |||||||||||||||||||||||||||
| Gross margin | $ | 23,886 | $ | 610 | $ | 23,276 | 3,816 | % | |||||||||||||||||||||||||||
| Operating expenses | $ | 19,828 | $ | 14,333 | $ | 5,495 | 38 | % | |||||||||||||||||||||||||||
| Income (loss) from operations | $ | 4,058 | $ | (13,723) | $ | 17,781 | 130 | % | |||||||||||||||||||||||||||
| Other income, net | $ | (1,271) | $ | (12,418) | $ | (11,147) | (90) | % | |||||||||||||||||||||||||||
| Net income (loss) | $ | 5,329�� | $ | (1,305) | $ | 6,634 | 508 | % | |||||||||||||||||||||||||||
| Net income (loss) per common share, basic | $ | 0.017 | $ | (0.004) | $ | 0.021 | 525 | % | |||||||||||||||||||||||||||
| Net income (loss) per common share, diluted | $ | 0.017 | $ | (0.004) | $ | 0.021 | 525 | % | |||||||||||||||||||||||||||
| Net cash provided by (used in) operating activities | $ | 3,465 | $ | (9,341) | $ | 12,806 | 137 | % | |||||||||||||||||||||||||||
Adjusted Gross Margin(1) | $ | 12,829 | $ | 5,475 | $ | 7,354 | 134 | % | |||||||||||||||||||||||||||
Adjusted Gross Margin %(1) | 30 | % | 18 | % | 12% | 67 | % | ||||||||||||||||||||||||||||
Adjusted EBITDA(1) | $ | 5,577 | $ | (1,887) | $ | 7,464 | 396 | % | |||||||||||||||||||||||||||
| Financial Position | |||||||||||||||||||||||||||||||||||
| Working capital | $ | 172,920 | $ | 217,834 | $ | (44,914) | (21) | % | |||||||||||||||||||||||||||
| Inventory and biological assets | $ | 87,210 | $ | 46,420 | $ | 40,790 | 88 | % | |||||||||||||||||||||||||||
| Total assets | $ | 573,227 | $ | 545,365 | $ | 27,862 | 5 | % | |||||||||||||||||||||||||||
Non-current financial liabilities(2) | $ | 4,379 | $ | 3,074 | $ | 1,305 | 42 | % | |||||||||||||||||||||||||||
Note 1: Non-IFRS measures that have been defined and reconciled within their respective subsections in this section of the MD&A.
Note 2: Non-current financial liabilities excludes non-monetary balances related to contingent share consideration, derivative liabilities and deferred income taxes.
NET REVENUE
Net revenue for the Company is defined as gross revenue, net of customer fees, discounts, rebates, and sales returns and recoveries, less excise taxes. Revenue consists primarily of dried flower and cannabis derivative products sold to the adult-use recreational cannabis, medical cannabis, wholesale, and international cannabis marketplaces.
For the three months ended November 30, 2022, the Company recorded an increase of 43% in net revenues to $43,321 from $30,378 for the three months ended November 30, 2021. Net revenue increased in the current period primarily due to an increase in recreational revenue of $10,839 and international revenue of $2,440, partially offset by a decrease in medical sales.
For the three months ended November 30, 2022, the net ASP of recreational flower decreased to $1.82 per gram compared to $1.89 per gram for the three months ended November 30, 2021, due to a shift towards value-oriented large format products.
MANAGEMENT’S DISCUSSION AND ANALYSIS | FOR THE THREE MONTHS ENDED NOVEMBER 30, 2022 AND 2021 12
Sales volumes of all flower in grams increased 21% to 16,148 kg for the three months ended November 30, 2022 compared to 13,336 kg in the comparative period, primarily due to an increase to sales volume, and new large-format products that have been well-received by the market.
REVENUE COMPOSITION
The Company’s revenue composition by product category was as follows for the three months ended November 30, 2022 and 2021:
| Q1-2023 | Q1-2022 | ||||||||||||||||||||||
| Recreational Flower, net of excise duty | 25,353 | 21,315 | |||||||||||||||||||||
| Recreational Vapes, net of excise duty | 875 | 1,148 | |||||||||||||||||||||
| Recreational Hash, net of excise duty | 2,165 | — | |||||||||||||||||||||
| Recreational Infused Pre-rolls, net of excise duty | 365 | — | |||||||||||||||||||||
| Recreational Edibles, net of excise duty | 4,821 | 1,888 | |||||||||||||||||||||
| Recreational Ingestible Extracts and Oil, net of excise duty | 2,280 | 669 | |||||||||||||||||||||
| Medical, net of excise duty | 1,486 | 1,908 | |||||||||||||||||||||
| International Flower and Oil | 5,869 | 3,429 | |||||||||||||||||||||
| Wholesale and Other | 107 | 21 | |||||||||||||||||||||
| Total Net Revenue | $43,321 | $30,378 | |||||||||||||||||||||
COST OF SALES AND GROSS MARGIN
The gross margin for the three months ended November 30, 2022 was $23,886, compared to $610 for the prior period. The change and significant items impacting the three months ended November 30, 2022 were primarily as a result of: (i) lower cultivation and post-harvest costs on a per unit basis; (ii) inventory provisions of excess and unsaleable inventories as well as inventory provisions to net realizable value of $1,129 compared to $2,312 in the prior period; (iii) unabsorbed overhead of $nil compared to $709 in the prior period as a result of lower production volumes in the prior period; (iv) a lower ASP from increased competition and the ongoing evolution of the customer and product mix; and (v) provisions to net realizable value relating to the fair value component of inventories (fair value loss of $1,871, compared to $3,230 in the prior period).
Included in gross margin are the changes in the fair value of biological assets related to IFRS standard IAS 41 Agriculture. The net increase in fair value adjustments on period-over-period basis is due to an increase in harvested and in-progress plants, combined with higher yields, resulting in an increase in fair value of biological assets of $24,714 compared to $10,469 in the prior period, which was offset by the realization of the fair value increment for inventory sold of $10,657 (November 30, 2021 – $9,083) and adjustments to the net realizable value of inventory of $1,871 (November 30, 2021 – $3,230).
Cost of sales primarily consists of the following:
•Costs of sales of cannabis (dried flower, pre-rolls, and wholesale/international bulk flower, cannabis extracts, vapes, edibles, and other wholesale formats such as extract) include the direct costs of materials and packaging, labour, including any associated share-based compensation, and depreciation of manufacturing building and equipment. This includes cultivation costs (growing, harvesting, drying, and processing costs), extraction, vape filling, quality assurance and quality control, as well as packaging and labelling;
•Costs related to other products, such as vaporizers and other accessories;
•Shipping expenses to deliver product to the customer;
•The production costs of late-stage biological assets that are disposed of, plants destroyed that do not meet the Company’s quality assurance standards, provisions for excess and unsaleable inventories and provisions related to adjustments to net realizable value that reduce the carrying value of inventory below the original production or purchase cost, and other production overhead; and
•Unabsorbed fixed overhead charges, comprised of depreciation, insurance and property taxes, resulting from the underutilization of cultivation and production capacity.
MANAGEMENT’S DISCUSSION AND ANALYSIS | FOR THE THREE MONTHS ENDED NOVEMBER 30, 2022 AND 2021 13
Illustrative Overview of Composition and Flow of Biological Assets, Inventories, and Cost of Sales
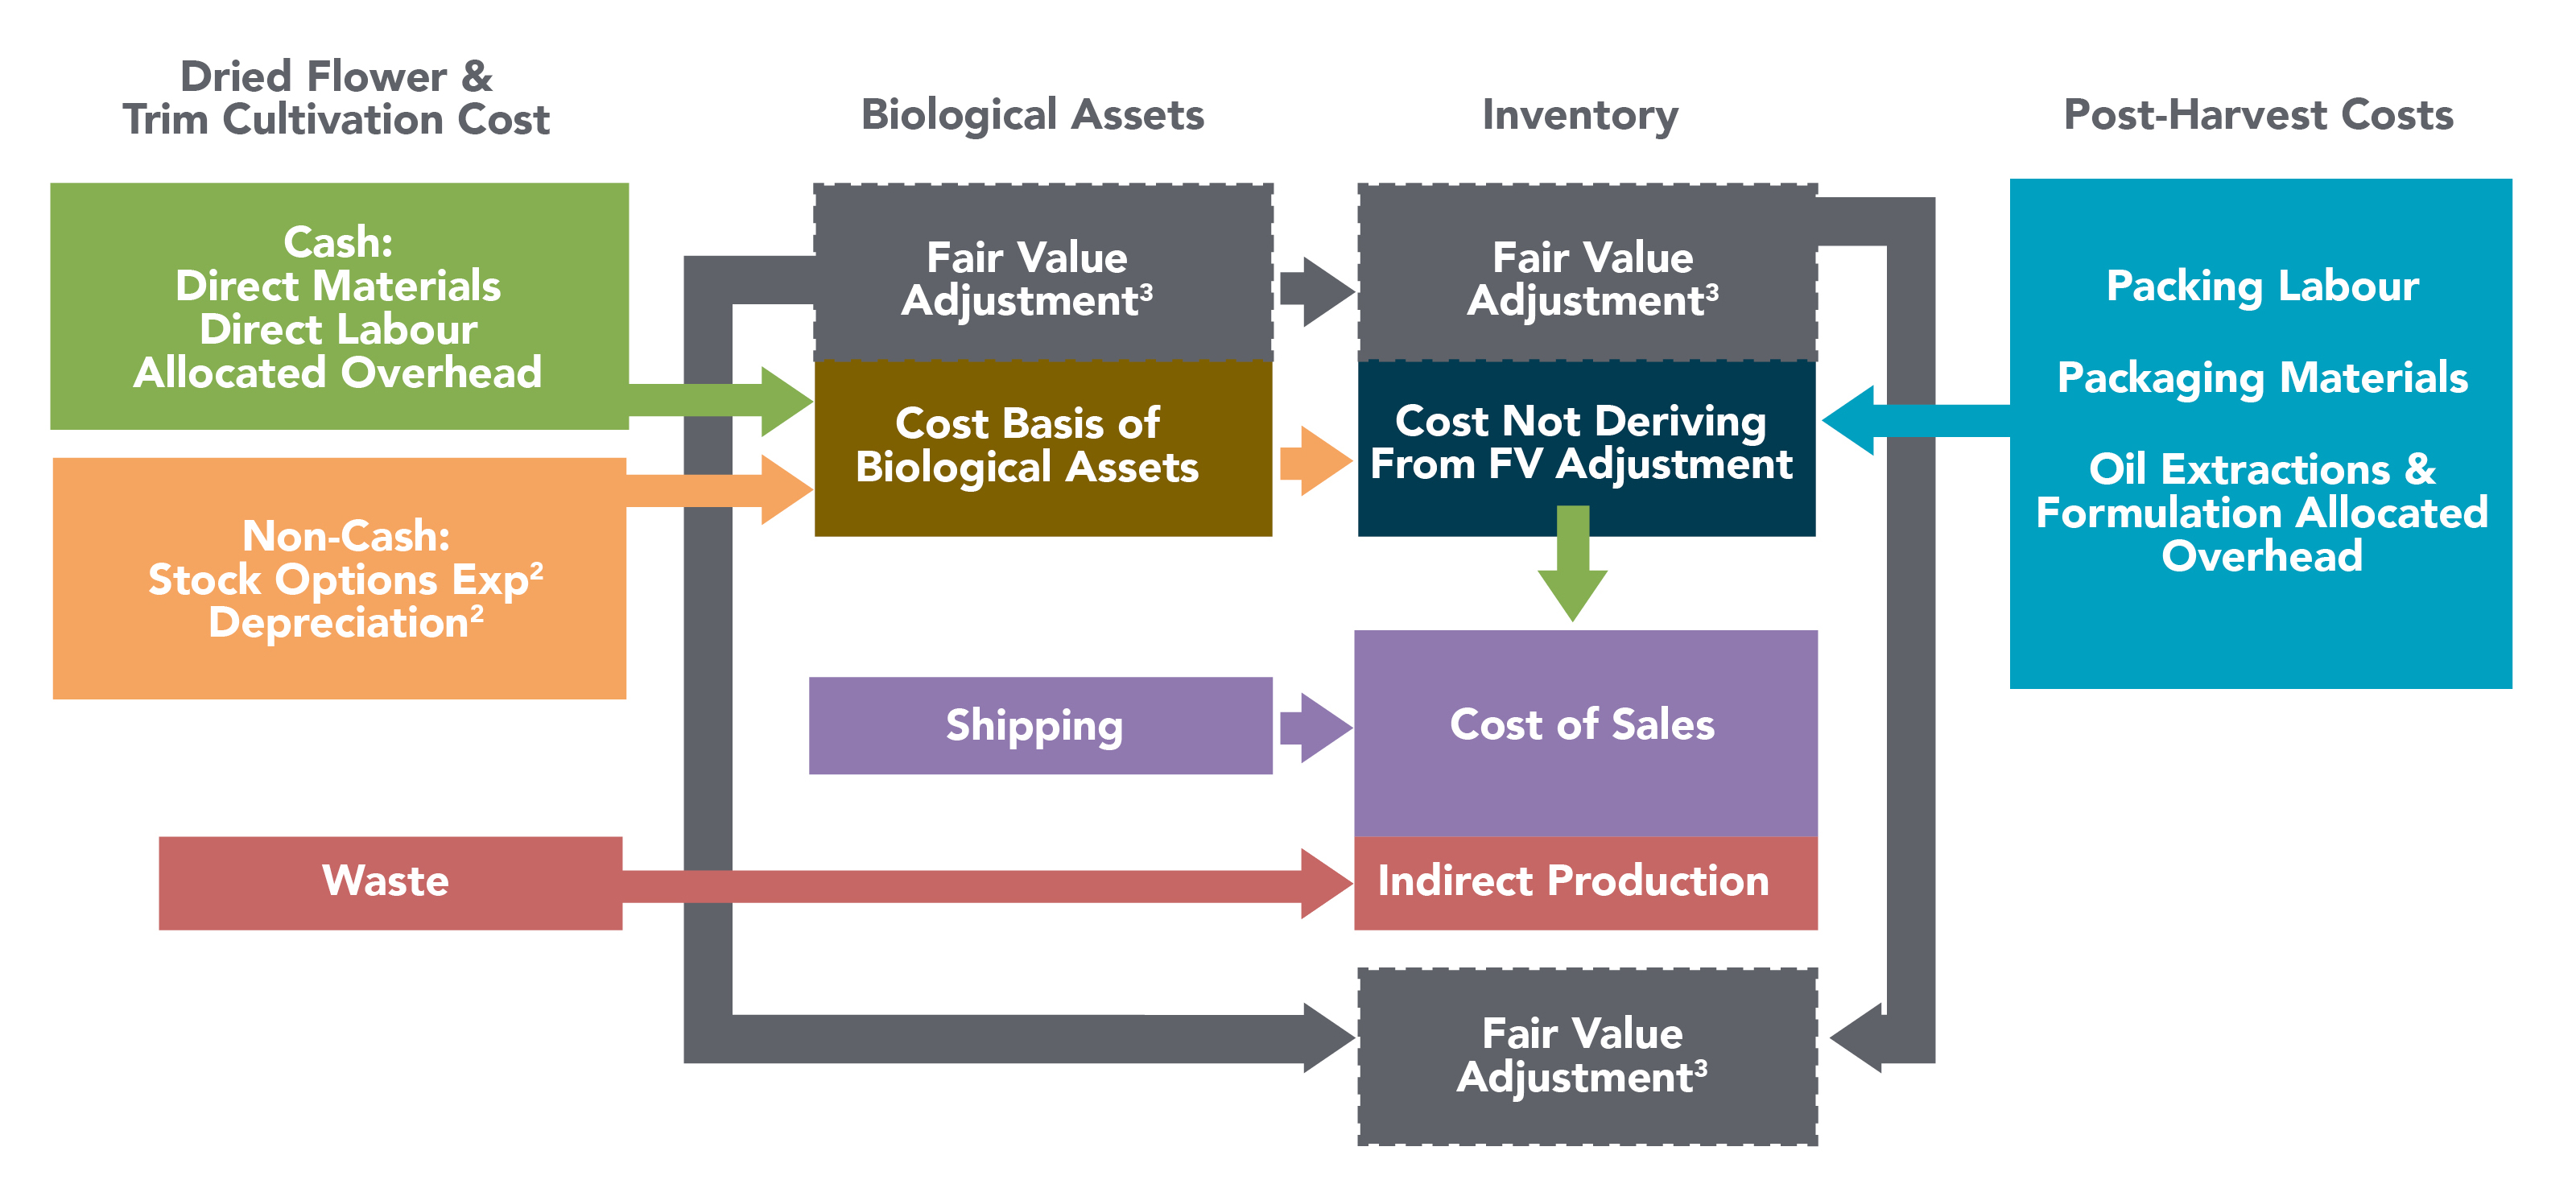
Note 1: The above illustration is for informational purposes only and should not be viewed as an exact representation of the actual flow of inputs and outputs. Certain items referenced above may not have a standard meaning under IFRS and therefore should be considered non-IFRS measures. Readers should refer to the notes to the Financial Statements for the official accounting policies.
Note 2: The majority of stock options and depreciation expense related to the manufacturing and operations departments are capitalized as part of cultivation and inventory production costs; however, a certain amount of these expenses that relate to overhead departments and underutilization of the Moncton Campus are expensed directly to cost of sales.
Note 3: Fair value adjustments are made to the cost basis of biological assets which collectively become the cost basis of inventories. Inventories are then carried at the lower of cost and net realizable value. When sold a portion of inventory is charged to cost of sales (actual costs) with the remainder (fair value adjustments) to “Realized fair value on inventories sold and other inventory charges” on the consolidated statements of operations and comprehensive income (loss).
Note 4: Excise taxes are excluded from this diagram and are reflected as a netting adjustment against gross revenue to arrive at net revenue for presentation purposes in the consolidated statements of operations and comprehensive income (loss).
ADJUSTED GROSS MARGIN
Adjusted gross margin is a non-IFRS measure that the Company defines as net revenue less: (i) unrealized gain on changes in fair value of biological assets; (ii) realized fair value on inventories sold and other inventory charges; (iii) provisions (recoveries) and impairment of inventories and biological assets; (iv) provisions to net realizable value; (v) COVID-19 related charges; and (vi) unabsorbed overhead relating to underutilization of the production facility grow rooms and manufacturing equipment, most of which is related to non-cash depreciation expense. Management believes that these measures provide useful information to assess the profitability of our operations as it represents the normalized gross margin generated from operations and excludes the effects of non-cash fair value adjustments on inventories and biological assets, which are required by IFRS. See the cautionary statement regarding non-IFRS financial measures in the “Introduction” section at the beginning of this MD&A and the reconciliation to IFRS measures in the “Financial Results and Review of Operations” section of this MD&A. The most directly comparable measure to adjusted gross margin calculated in accordance with IFRS is gross margin before fair value adjustments.
MANAGEMENT’S DISCUSSION AND ANALYSIS | FOR THE THREE MONTHS ENDED NOVEMBER 30, 2022 AND 2021 14
| Q2-F21 | Q3-F21 | Q4-F21 | Q1-F22 | Q2-F22 | Q3-F22 | Q4-F22 | Q1-F23 | ||||||||||||||||||||||
| Net revenue | $ | 14,643 | $ | 20,324 | $ | 24,865 | $ | 30,378 | $ | 31,836 | $ | 38,115 | $ | 45,480 | $ | 43,321 | |||||||||||||
| Cost of sales before adjustments | 15,323 | 21,046 | 21,848 | 24,903 | 23,581 | 28,817 | 35,118 | 30,492 | |||||||||||||||||||||
| Adjusted Gross margin | (680) | (722) | 3,017 | 5,475 | 8,255 | 9,298 | 10,362 | 12,829 | |||||||||||||||||||||
| Adjusted Gross margin % | (5) | % | (4) | % | 12 | % | 18 | % | 26 | % | 24 | % | 23 | % | 30 | % | |||||||||||||
| Less: | |||||||||||||||||||||||||||||
| Provisions (recoveries) and impairment of inventories and biological assets | 10,050 | (59) | 1,997 | 1,845 | 686 | (83) | 1,600 | 1,067 | |||||||||||||||||||||
| Provisions to net realizable value | 3,499 | 669 | 622 | 467 | 25 | 6 | — | 62 | |||||||||||||||||||||
| Realized fair value on inventories sold from acquisitions | — | — | — | — | 663 | 700 | — | — | |||||||||||||||||||||
| Unabsorbed overhead | 2,274 | 1,725 | 1,400 | 709 | — | — | — | — | |||||||||||||||||||||
| Gross margin before fair value adjustments | $ | (16,503) | $ | (3,057) | $ | (1,002) | $ | 2,454 | $ | 6,881 | $ | 8,675 | $ | 8,762 | $ | 11,700 | |||||||||||||
| Gross margin % (before fair value adjustments) | (113) | % | (15) | % | (4) | % | 8 | % | 22 | % | 23 | % | 19 | % | 27 | % | |||||||||||||
Add: Realized fair value on inventories sold and other inventory charges | $ | (7,208) | $ | (8,509) | $ | (7,286) | $ | (12,313) | $ | (5,314) | $ | (7,386) | $ | (10,191) | $ | (12,528) | |||||||||||||
| Unrealized gain (loss) on changes in fair value of biological assets | $ | 6,516 | $ | 13,685 | $ | 11,639 | $ | 10,469 | $ | 7,502 | $ | 6,353 | $ | 15,677 | $ | 24,714 | |||||||||||||
Gross margin(1) | $ | (17,195) | $ | 2,119 | $ | 3,351 | $ | 610 | $ | 9,069 | $ | 7,642 | $ | 14,248 | $ | 23,886 | |||||||||||||
Gross margin %(1) | (117) | % | 10 | % | 13 | % | 2 | % | 28 | % | 20 | % | 31 | % | 55 | % | |||||||||||||
Note 1: Gross margin reflects the IFRS measure per the Company’s Financial Statements.
The adjusted gross margin and gross margin before fair value adjustments have steadily improved over the last eight quarters. Compared to Fiscal 2021, the increase to margin has been due to the combination of higher net revenue, lower cultivation and post-harvest costs, lower inventory provisions, and lower unabsorbed overheads.
OPERATING EXPENSES
| Q1-2023 | Q1-2022 | CHANGE | % CHANGE | ||||||||||||||||||||
| General and administrative | $ | 11,211 | $ | 7,984 | $ | 3,227 | 40 | % | |||||||||||||||
| Sales and marketing | 4,491 | 4,660 | (169) | (4) | % | ||||||||||||||||||
| Research and development | 2,383 | 1,015 | 1,368 | 135 | % | ||||||||||||||||||
| Share-based compensation | 1,743 | 674 | 1,069 | 159 | % | ||||||||||||||||||
| Total operating expenses | $ | 19,828 | $ | 14,333 | $ | 5,495 | 38 | % | |||||||||||||||
GENERAL AND ADMINISTRATIVE
For the three months ended November 30, 2022, the Company incurred general and administrative expenses of $11,211 compared to $7,984 for the prior year comparative period. The increase in the current period mainly relates to higher employee costs due to more general and administrative full-time employees to support the Company's growth, higher depreciation and amortization, general wage increases, and higher technology costs which includes $1,334 (November 30, 2021: $Nil) in ERP installation costs.
SALES AND MARKETING
For the three months ended November 30, 2022, the Company incurred sales and marketing expenses of $4,491 or 10% of net revenues as compared to $4,660 or 15% of net revenues for the prior period.
RESEARCH AND DEVELOPMENT
Research and development costs of $2,383 increased from the comparative period cost of $1,015, as the Company ramps up activity under the PDC Agreement and other internal product innovation projects.
SHARE-BASED COMPENSATION
For the three months ended November 30, 2022, the Company recognized $1,743 in share-based compensation in relation to selling, marketing, general and administrative, and research and development employees, compared to $674 for the comparative period due to a greater number of equity awards issued and outstanding during Q1 Fiscal 2023 as compared to Q1 Fiscal 2022.
Total share-based compensation charges, including those related to production employees that are charged to biological assets and inventory and amounts amortized for the three months ended November 30, 2022, were $1,852, compared to $680 for the comparable period, the changes being consistent with those noted above.
MANAGEMENT’S DISCUSSION AND ANALYSIS | FOR THE THREE MONTHS ENDED NOVEMBER 30, 2022 AND 2021 15
For the three months ended November 30, 2022, 1,104,000 options were granted, valued at $996, compared to 520,000 options granted in the comparative period, valued at $934. Included in the three months ended November 30, 2022 were 800,000 options granted to key management personnel compared to 500,000 options granted for the three months ended November 30, 2021.
During the three months ended November 30, 2022, 1,485,239 restricted share units (“RSUs”) were granted to employees (November 30, 2021 – 391,248), of which 1,140,765 RSUs were issued to key management personnel, which includes members of the Board of Directors, compared to 361,942 issued for the three months ended November 30, 2021.
During the three months ended November 30, 2022, 846,154 performance share units (“PSUs”) were granted to employees (November 30, 2021 – 169,843), of which 547,680 PSUs were issued to key management personnel, compared to 270,877 issued for the prior year.
Share-based compensation represents a non-cash expense and was valued using the Black-Scholes valuation model for stock options and using the fair value of the shares on the date of the grant for RSUs. The fair value of PSUs was based on the Company’s share price at the grant date, adjusted for an estimate of likelihood of achievement of the defined performance criteria.
OTHER (INCOME) EXPENSES
| Q1-2023 | Q1-2022 | CHANGE | % CHANGE | ||||||||||||||||||||
| Financing costs | $ | 41 | $ | 83 | $ | (42) | (51) | % | |||||||||||||||
| Investment income | (856) | (326) | 530 | 163 | % | ||||||||||||||||||
| Share of loss from investments in associates, net | 406 | 144 | 262 | 182 | % | ||||||||||||||||||
| Impairment of loan receivable and investments in associates | — | 250 | (250) | (100) | % | ||||||||||||||||||
| Loss on disposal of property, plant and equipment | 382 | 311 | 71 | 23 | % | ||||||||||||||||||
| Change in fair value of contingent consideration | 18 | (182) | (200) | 110 | % | ||||||||||||||||||
| Change in fair value of derivative liabilities | (1,030) | (12,698) | (11,668) | 92 | % | ||||||||||||||||||
| Total other (income)/expenses | $ | (1,039) | $ | (12,418) | $ | 11,379 | (92) | % | |||||||||||||||
INVESTMENT INCOME
Investment income of $856 was earned for the three months ended November 30, 2022, compared to $326 for the three months ended November 30, 2021. The change in investment income was due to higher interest rates in the current period as compared to prior year comparative period.
INVESTMENTS IN ASSOCIATES AND CONTINGENT CONSIDERATION
During the three months ended November 30, 2022, the Company’s share of loss from investments in associates was $406, compared to a loss of $144 in the prior year comparative period.
In connection with the Company's acquisitions of EIC and Laurentian, the Company has commitments to deliver additional consideration should EIC and Laurentian achieve their milestones. There was an $18 change in the estimated fair value of these contingent liabilities for the three months ended November 30, 2022.
DERIVATIVE WARRANT LIABILITIES
As at November 30, 2022, the Company revalued the derivative warrant liabilities at an estimated fair value of $3,091. The Company recorded a decrease in the fair value of the derivative warrant liabilities of $1,047 for the three months ended November 30, 2022 (November 30, 2021 – a decrease of $(12,052)) in the statements of operations and comprehensive income (loss). There were nil exercises of warrants during the three months ended November 30, 2022, resulting in 16,943,650 warrants outstanding at November 30, 2022 (November 30, 2021 - 18,687,500).
DERIVATIVE TOP-UP RIGHTS LIABILITIES
As at November 30, 2022, the Company revalued the top-up rights at an estimated fair value of $752 (August 31, 2022 – $735). The Company recorded an increase in the estimated fair value change of the top-up rights for the three months ended November 30, 2022 of $17 (November 30, 2021 - $(646)).
MANAGEMENT’S DISCUSSION AND ANALYSIS | FOR THE THREE MONTHS ENDED NOVEMBER 30, 2022 AND 2021 16
OTHER
During the three months ended November 30, 2022, the Company recorded a loss on disposal of property, plant and equipment of $382 (November 30, 2021 - $311). During Q1 Fiscal 2023, the Company continued and completed upgrades to its growing rooms, including the installation of LED light fixtures, which are expected to further improve the operating conditions of the Moncton Campus resulting in higher quality flower and a reduction in production costs. As a result of this work, certain assets that had not yet been fully depreciated were replaced, resulting in a loss on disposal of property, plant and equipment during the current period.
NET INCOME (LOSS)
Net income for the three months ended November 30, 2022 was $5,329 or $0.017 per Common Share (basic and diluted), compared to $(1,305) or $(0.004) per Common Share (basic and diluted) for the prior year comparative period. The increase in net income for the current quarter compared to the prior year comparative period was a result of higher gross margin from higher revenues and lower per-unit production costs, lower inventory provisions for obsolete items, higher unrealized gain on changes in fair value of biological assets, and partly offset by increased operating expenses and lower gain on change in fair value of derivative liabilities.
SUMMARY OF QUARTERLY RESULTS
| Q2-F21 | Q3-F21 | Q4-F21 | Q1-F22 | Q2-F22 | Q3-F22 | Q4-F22 | Q1-F23 | |||||||||||||||||||
| Financial Results | ||||||||||||||||||||||||||
| Adult-use recreational cannabis revenue (net of excise) | $ | 11,988 | $ | 16,839 | $ | 22,898 | $ | 25,020 | $ | 24,887 | $ | 34,521 | $ | 37,521 | $ | 35,859 | ||||||||||
| Medical revenue (net of excise) | $ | 2,438 | $ | 2,015 | $ | 1,968 | $ | 1,908 | $ | 1,920 | $ | 1,793 | $ | 1,688 | $ | 1,486 | ||||||||||
| International, wholesale and other revenue | $ | 217 | $ | 1,470 | $ | (1) | $ | 3,450 | $ | 5,029 | $ | 1,801 | $ | 6,271 | $ | 5,976 | ||||||||||
| Net revenue | $ | 14,643 | $ | 20,324 | $ | 24,865 | $ | 30,378 | $ | 31,836 | $ | 38,115 | $ | 45,480 | $ | 43,321 | ||||||||||
| Net income (loss) | $ | (66,389) | $ | (4,008) | $ | (25,971) | $ | (1,305) | $ | (4,047) | $ | (2,787) | $ | (6,144) | $ | 5,329 | ||||||||||
| Net income (loss) per common share, basic | $ | (0.285) | $ | (0.014) | $ | (0.090) | $ | (0.004) | $ | (0.013) | $ | (0.009) | $ | (0.020) | $ | 0.017 | ||||||||||
| Net income (loss) per common share, diluted | $ | (0.285) | $ | (0.014) | $ | (0.090) | $ | (0.004) | $ | (0.013) | $ | (0.009) | $ | (0.020) | $ | 0.017 | ||||||||||
| Operational Results | ||||||||||||||||||||||||||
| Dried flower yield per plant (grams) | 115 | 117 | 127 | 129 | 122 | 132 | 141 | 168 | ||||||||||||||||||
| Harvest (kg) - dried flower | 4,467 | 8,379 | 12,085 | 11,603 | 10,037 | 13,141 | 16,101 | 22,296 | ||||||||||||||||||
| Employee headcount (#) | 619 | 647 | 727 | 738 | 841 | 865 | 887 | 921 | ||||||||||||||||||
In Q1 Fiscal 2023, continued growth in net revenues, lower cost of production (on a per unit basis) and lower asset impairment charges, resulted in net income as compared to net loss recognized during Fiscal 2022 and Fiscal 2021.
Adjusted EBITDA
This is a non-IFRS measure and the Company calculates Adjusted EBITDA as net income (loss) excluding: financing costs, net of investment income; income tax expense (recovery); depreciation, amortization, reversal of/or impairment, (gain) loss on disposal of property, plant and equipment (per the consolidated statement of cash flows); share-based compensation (per the consolidated statement of cash flows); share of loss from investments in associates and impairment loss from loan receivable; unrealized loss (gain) on changes in fair value of contingent consideration; change in fair value of derivative liabilities; expenditures incurred in connection with research and development activities (net of depreciation); unrealized (gain) loss on changes in fair value of biological assets; realized fair value on inventories sold and other inventory charges; provisions and impairment of inventories and biological assets; provisions to net realizable value of inventories; COVID-19 related charges, net of government subsidies and insurance recoveries; legal provisions (recoveries); incremental fair value component of inventories sold from acquisitions; ERP implementation costs; transaction costs; and share issuance costs. Management believes that Adjusted EBITDA is intended to provide a proxy for the Company’s operating cash flow and derives expectations of future financial performance for the Company, and excludes adjustments that are not reflective of current operating results. The most directly comparable measure to Adjusted EBITDA calculated in accordance with IFRS is net income (loss).
Management changed the calculation of Adjusted EBITDA during Q4 Fiscal 2021 and has conformed prior quarters accordingly to include an add-back for the Company's research and development expenditures, including its share of the expense from the CoE. During Fiscal 2022, management further changed the calculation of Adjusted EBITDA to include ERP implementation costs, transaction costs and the fair value component of inventories sold from acquisitions.
MANAGEMENT’S DISCUSSION AND ANALYSIS | FOR THE THREE MONTHS ENDED NOVEMBER 30, 2022 AND 2021 17
| Adjusted EBITDA (Non-IFRS Measure) | |||||||||||||||||||||||||||||
| Adjusted EBITDA Reconciliation | Q2-F21 | Q3-F21 | Q4-F21 | Q1-F22 | Q2-F22 | Q3-F22 | Q4-F22 | Q1-F23 | |||||||||||||||||||||
| Net (loss) income as reported | $ | (66,389) | $ | (4,008) | $ | (25,971) | $ | (1,305) | $ | (4,047) | $ | (2,787) | $ | (6,144) | $ | 5,329 | |||||||||||||
| Add/(Deduct): | |||||||||||||||||||||||||||||
| Financing costs, net of investment income | 669 | 251 | (286) | (243) | (217) | (234) | (364) | (815) | |||||||||||||||||||||
| Income tax expense (recovery) | — | — | — | — | (97) | 308 | (299) | (232) | |||||||||||||||||||||
| Depreciation, amortization, and (gain) loss on disposal of property, plant and equipment (per statement of cash flows) | 5,222 | 5,626 | 17,349 | 6,378 | 11,024 | 6,515 | 7,570 | 7,183 | |||||||||||||||||||||
| Impairment of intangible assets | — | — | 1,701 | — | — | — | — | — | |||||||||||||||||||||
| Impairment of property, plant and equipment | — | — | — | — | 2,000 | — | 2,245 | — | |||||||||||||||||||||
| Share of loss from investments in associates and impairment loss from loan receivable | 844 | 1,115 | 4,162 | 394 | 499 | 193 | 528 | 406 | |||||||||||||||||||||
| Unrealized loss (gain) on changes in fair value of contingent consideration | 154 | (24) | 3,392 | (182) | 666 | (3,422) | 317 | 18 | |||||||||||||||||||||
| Realized fair value on inventories sold and other inventory charges | 7,208 | 8,509 | 7,286 | 12,313 | 5,314 | 7,386 | 10,191 | 12,528 | |||||||||||||||||||||
| Unrealized (gain) loss on changes in fair value of biological assets | (6,516) | (13,685) | (11,639) | (10,469) | (7,502) | (6,353) | (15,677) | (24,714) | |||||||||||||||||||||
| Share-based compensation (per statement of cash flows) | 1,167 | 973 | 1,150 | 680 | 877 | 761 | 2,809 | 1,852 | |||||||||||||||||||||
| COVID-19 related charges, net of government subsidies and insurance recoveries | (2,709) | (2,714) | (892) | — | — | (335) | — | — | |||||||||||||||||||||
| Legal provisions (recovery) | 500 | 470 | 1,050 | — | — | (310) | — | — | |||||||||||||||||||||
| Share issuance costs and change in fair value of derivative liabilities | 37,659 | (7,305) | (6,001) | (12,698) | (10,633) | (5,904) | (3,415) | (1,030) | |||||||||||||||||||||
| Incremental fair value component on inventories sold from acquisitions | — | — | — | — | 663 | 700 | — | — | |||||||||||||||||||||
| ERP implementation costs | — | — | — | — | — | 1,410 | 1,793 | 1,334 | |||||||||||||||||||||
| Transaction costs | — | — | — | — | 1,148 | 1,424 | (188) | 318 | |||||||||||||||||||||
| Provisions (recoveries) and impairment of inventories and biological assets and provisions of inventory to net realizable value | 13,549 | 610 | 2,619 | 2,312 | 711 | (77) | 1,600 | 1,129 | |||||||||||||||||||||
| Adjusted EBITDA as Previously Reported | $ | (8,642) | $ | (10,182) | $ | (6,080) | $ | (2,820) | $ | 406 | $ | (725) | $ | 966 | $ | 3,306 | |||||||||||||
Add/(Deduct): Research and development expenditures, net of depreciation | 802 | 938 | 1,262 | 933 | 1,150 | 1,308 | 2,266 | 2,271 | |||||||||||||||||||||
| Adjusted EBITDA (Revised) | $ | (7,840) | $ | (9,244) | $ | (4,818) | $ | (1,887) | $ | 1,556 | $ | 583 | $ | 3,232 | 5,577 | ||||||||||||||
| Divided by: net revenue | 14,643 | 20,324 | 24,865 | 30,378 | 31,836 | 38,115 | 45,480 | 43,321 | |||||||||||||||||||||
| Adjusted EBITDA Margin % (Revised) (Non-IFRS Measure) | (54) | % | (45) | % | (19) | % | (6) | % | 5 | % | 2 | % | 7 | % | 13 | % | |||||||||||||
During Q4 Fiscal 2021, the Company had decreased its cost of production and with increased revenues this reduced the quarter's Adjusted EBITDA loss to $4.8 million, a 48% decrease from Q3 Fiscal 2021 loss of $9.2 million.
During Q1 Fiscal 2022, with further reductions to the cost of production combined with 22% increase to net revenues, the Adjusted EBITDA loss was reduced to $1.9 million. The Q2 Fiscal 2022 Adjusted EBITDA was a positive $1.6 million which was a $3.4 million increase from the Q1 Fiscal 2022 and was as a result of increased revenues and margins. The Q3 Fiscal 2022 Adjusted EBITDA was $1.0 million less than the Q2 Fiscal 2022 as a result of the impact from a delayed international shipment. In Q4 Fiscal 2022, the Company achieved Adjusted EBITDA of $3.2 million due to completion of the international shipment scheduled for Q3 Fiscal 2022 and record-high recreational revenues during the quarter.
Due to the higher adjusted gross margin, resulting from lower cultivation and post-harvest costs, Adjusted EBITDA in Q1 Fiscal 2023 increased to $5.6 million and was the highest that the Company has reported in the preceding 8 quarters. The Company expects to continue achieving positive Adjusted EBITDA in Fiscal 2023.
MANAGEMENT’S DISCUSSION AND ANALYSIS | FOR THE THREE MONTHS ENDED NOVEMBER 30, 2022 AND 2021 18
BALANCE SHEET, LIQUIDITY AND CAPITAL RESOURCES
The following represents selected balance sheet highlights of the Company at the end Q1 Fiscal 2023 and Q4 Fiscal 2022:
| NOVEMBER 30, 2022 | AUGUST 31, 2022 | % CHANGE | |||||||||||||||
| Cash & short-term investments | $ | 95,230 | $ | 98,607 | (3) | % | |||||||||||
| Inventories | $ | 66,534 | $ | 50,314 | 32 | % | |||||||||||
| Working capital | $ | 172,920 | $ | 166,338 | 4 | % | |||||||||||
| Total assets | $ | 573,227 | $ | 577,107 | (1) | % | |||||||||||
| Total current and long-term debt | $ | 217 | $ | 235 | (8) | % | |||||||||||
Non-current financial liabilities(1) | $ | 4,379 | $ | 2,361 | 85 | % | |||||||||||
| Total shareholders' equity | $ | 515,244 | $ | 508,058 | 1 | % | |||||||||||
Note 1: Non-current financial liabilities excludes non-monetary balances related to contingent share consideration, derivative liabilities and deferred income taxes.
On November 30, 2022, the Company had a cash and short-term investments balance of $95,230 compared to $98,607 at August 31, 2022. The decrease is primarily a result of capital expenditures of $8,375 which was partly offset by cash generated in operating activities of $3,465.
The Company completed its Phase 4C expansion in Q4 Fiscal 2022 and that has significantly increased the production capacity enabling the Company to better meet the increased consumer demand for its products. The Company began harvesting from the Phase 4C grow rooms and this has resulted in an increase in inventory on November 30, 2022.
For Fiscal 2023, the Company has budgeted $29 million in capital expenditures for the three facilities. This spend would relate to the completion of the expansion at the Lac-Supérieur Facility and also include automation and enhancements' investments at the Winnipeg Facility and Moncton Campus.
Management believes its capital position is healthy and that there is sufficient liquidity available for the near to medium term. In the event that the Company is unable to finance any new expansionary capital expenditures or acquisitions from cash on hand, it could, if necessary and subject to prevailing market conditions, obtain liquidity through the capital markets as the Common Shares are actively traded on both the NASDAQ and TSX and there is broad analyst coverage amongst sell-side brokerages.
The Company generated positive cash flows from operating activities during Q1 Fiscal 2023, which was achieved primarily due to positive Adjusted EBITDA and a reduction to receivables. While the Company expects to continue to generate positive Adjusted EBITDA, periods when the Company achieves significant increases to sales will result in increases to receivables and this will negatively impact cash flows from operating activities. The Company has a $29 million capex budget for Fiscal 2023 and if completed as planned during Fiscal 2023, the Company expects to generate positive free cash flows ("FCF") during Q1 2024 (calendar 2023).
The following highlights the Company’s cash flows during the three months ended November 30, 2022 and November 30, 2021:
| THREE MONTHS ENDED | |||||||||||||||||||||||
| NOVEMBER 30, 2022 | NOVEMBER 30, 2021 | ||||||||||||||||||||||
| Cash provided (used) by: | |||||||||||||||||||||||
| Operating activities | $ | 3,465 | $ | (9,341) | |||||||||||||||||||
| Financing activities | (200) | (270) | |||||||||||||||||||||
| Investing activities | (1,708) | 53,956 | |||||||||||||||||||||
| Cash provided | $ | 1,557 | $ | 44,345 | |||||||||||||||||||
| Cash position | |||||||||||||||||||||||
| Beginning of period | 68,515 | 55,365 | |||||||||||||||||||||
| End of period | $ | 70,072 | $ | 99,710 | |||||||||||||||||||
| Short-term investments | 25,158 | 68,325 | |||||||||||||||||||||
| Cash and short-term investments | $ | 95,230 | $ | 168,035 | |||||||||||||||||||
MANAGEMENT’S DISCUSSION AND ANALYSIS | FOR THE THREE MONTHS ENDED NOVEMBER 30, 2022 AND 2021 19
Cash provided by operating activities was $3,465 for the three months ended November 30, 2022, which was primarily driven by the decrease in accounts receivable and the positive Adjusted EBITDA6. This compares to cash used in operating activities of $9,341 for the prior year comparative period which was primarily driven by the increase in accounts receivables.
Cash used by financing activities for the three months ended November 30, 2022 was $200 as compared to $270 for the prior year comparative period. The decrease was primarily on account of decrease in net payment of the Company's leases.
Cash used by investing activities for the three months ended November 30, 2022 was $1,708, primarily driven by the proceeds from the net redemption of short-term investments of $5,075, partially offset by the purchase of property, plant and equipment of $8,375. This compares to cash provided in investing activities of $53,956 for the prior year comparative period, which was primarily driven by the proceeds from redemption of short-term investments of $60,000, partly offset by the purchase of property, plant and equipment of $7,004.
OFF BALANCE SHEET ARRANGEMENTS
There were no off-balance sheet arrangements during the three months ended November 30, 2022.
RELATED PARTY TRANSACTIONS
MANAGEMENT AND BOARD COMPENSATION
Key management personnel are those persons having the authority and responsibility for planning, directing, and controlling activities of the Company, directly or indirectly. The key management personnel of the Company are the members of the Company’s executive management team and Board of Directors. The transactions are conducted at arm’s length and in the normal course of operations.
For the three months ended November 30, 2022 and November 30, 2021, the Company’s expenses included the following management and Board of Directors compensation:
| THREE MONTHS ENDED | |||||||||||||||||||||||
| NOVEMBER 30, 2022 | NOVEMBER 30, 2021 | ||||||||||||||||||||||
| Salaries and consulting fees | $ | 1,477 | $ | 969 | |||||||||||||||||||
| Share-based compensation | 1,242 | 894 | |||||||||||||||||||||
| Total key management compensation | $ | 2,719 | $ | 1,863 | |||||||||||||||||||
During the three months ended November 30, 2022, 800,000 stock options (November 30, 2021 – 500,000) were granted to key management personnel with an aggregate fair value of $631 (November 30, 2021 – $898). In addition, during the three months ended November 30, 2022, 1,140,765 RSUs, (November 30, 2021 – 361,942), were granted to key management personnel with an aggregate fair value of $1,325 (November 30, 2021 – $995). For the three months ended November 30, 2022, 547,680 PSUs, (November 30, 2021 – 140,537) were issued to key management personnel with an aggregate fair value of $305 (November 30, 2021 – $164).
SIGNIFICANT TRANSACTIONS WITH ASSOCIATES AND JOINT OPERATIONS
The Company has transactions with related parties, as defined in IFRS IAS 24 Related Party Disclosures, all of which are undertaken in the normal course of business.
For the three months ended November 30, 2022, under the PDC Agreement, BAT incurred $418 (November 30, 2021 - $706) for direct expenses and the Company incurred $2,272 (November 30, 2021 - $1,175) of direct expenses and capital expenditures for a total of $2,690 (November 30, 2021 - $1,881) related to the CoE. The Company recorded for the three months ended November 30, 2022, $1,345 (November 30, 2021 - $637) of these expenditures in the condensed consolidated interim statements of operations and comprehensive income (loss). For the three months ended November 30, 2022, the Company recorded $117 (November 30, 2021 - $304), of capital expenditures which are included in the condensed consolidated interim statement of financial position.
At November 30, 2022, there is a balance owing to BAT of $1,433 (November 30, 2021 - $427).
6Adjusted EBITDA is a non-IFRS financial measure. See the cautionary statement regarding non-IFRS financial measures in the “Introduction” section of this MD&A, and the discussion under the heading “Adjusted EBITDA” and the reconciliation to IFRS measures in the "Financial Results and Review of Operations" section of this MD&A.
MANAGEMENT’S DISCUSSION AND ANALYSIS | FOR THE THREE MONTHS ENDED NOVEMBER 30, 2022 AND 2021 20
FAIR VALUE MEASUREMENTS
(i) Financial Instruments
Financial instruments recorded at fair value on the consolidated statement of financial position are classified using a fair value hierarchy that reflects the significance of the inputs used in making the measurements. The Company categorizes its fair value measurements according to a three-level hierarchy. The hierarchy prioritizes the inputs used by the Company’s valuation techniques. A level is assigned to each fair value measurement based on the lowest-level input significant to the fair value measurement in its entirety.
The three levels of the fair value hierarchy are described as follows:
•Level 1 inputs are quoted prices in active markets for identical assets or liabilities that the entity can access at the measurement date;
•Level 2 inputs, other than quoted prices included within Level 1, that are observable for the asset or liability, either directly or indirectly; and
•Level 3 inputs are unobservable inputs for the asset or liability.
The fair values of cash, short-term investments, account and other receivables, accounts payable and accrued liabilities and restricted funds approximate their carrying amounts due to their short-term nature. The fair value of long-term debt approximates $217.
The fair value of the EIC contingent share consideration is primarily based on Level 3 unobservable inputs. The determination of the fair value of this liability is primarily driven by the Company’s expectations of EIC achieving its milestones. The expected milestones were assigned probabilities and the expected related cash flows were discounted to derive the fair value of the contingent consideration.
At November 30, 2022, the probabilities of EIC achieving the remaining two milestones, were estimated to be 100% and 0% respectively. A sensitivity analysis for the probabilities of achieving the milestones was not presented as it was deemed that the impact of reasonable changes in inputs would not be significant.
The fair value of the Laurentian contingent share consideration is primarily based on Level 3 unobservable inputs in a Monte Carlo pricing model. The determination of the fair value of this liability is primarily driven by the Company’s expectations of Laurentian achieving its business objectives. The key assumptions used in the model are the expected future sales volumes and selling prices used in determining Laurentian's future adjusted earnings before interest, taxes, depreciation and amortization ("EBITDA") and the weighted average cost of capital ("WACC").
At November 30, 2022, the fair value of the Laurentian contingent share consideration was $2,931. If the WACC increased by 1%, the estimated fair value of the contingent share consideration and net income would decrease by $8, or if it is decreased by 1%, the estimated fair value of the contingent share consideration and net income would increase by $8.
The fair value of derivative warrant liabilities is based on Level 1 and 2 inputs, but has been classified as level 2 in its entirety; and utilizes a Black-Scholes option pricing model to estimate the fair value of such warrants. The key assumption used in the model is the expected future volatility in the price of the Company’s Common Shares.
The fair value of the top-up rights is based on Level 3 inputs utilized in a Monte Carlo pricing model to estimate the fair value of such top-up rights. The key assumptions used in the model are the expected future price of the Company’s Common Shares, the weighted average expected life of the instruments and the expected future volatility of Common Shares. See "Fair Value Measurements - Top-up Rights" for further details on the Top-up Rights.
During the period, there were no transfers of amounts between Levels 1, 2 and 3.
Derivative Warrant Liabilities
During the three months ended November 30, 2022, nil warrants (November 30, 2021 - nil warrants) were exercised. As at November 30, 2022, the Company revalued the remaining derivative liabilities and recorded a decrease in the estimated fair value of $1,047 (November 30, 2021 - $12,052).
MANAGEMENT’S DISCUSSION AND ANALYSIS | FOR THE THREE MONTHS ENDED NOVEMBER 30, 2022 AND 2021 21
The Company’s derivative liabilities included the following balances and changes in the carrying value of Warrants as of November 30, 2022:
| NUMBER OF WARRANTS | AMOUNT | ||||||||||
| Balance - August 31, 2022 | 16,943,650 | $ | 4,138 | ||||||||
| Revaluation of Warrants | — | (1,047) | |||||||||
| Balance - November 30, 2022 | 16,943,650 | 3,091 | |||||||||
The following inputs were used to estimate the fair value of the warrants at November 30, 2022 and August 31, 2022:
| NOVEMBER 30, 2022 | AUGUST 31, 2022 | ||||||||||
| Risk free interest rate | 3.89 | % | 3.64 | % | |||||||
| Life of warrants (years) | 0.95 | 1.20 | |||||||||
| Market price of common shares | 1.39 | 1.42 | |||||||||
| Expected future volatility of common shares | 77.80 | % | 77.30 | % | |||||||
| Fair value per warrant | 0.18 | 0.24 | |||||||||
As at November 30, 2022, if the volatility increased by 10%, then the estimated fair value of the warrants and net income would decrease by $881, or if it decreased by 10%, the estimated fair value of the warrants and net income would increase by $838.
Top-up Rights
On March 10, 2021, through the strategic investment from BAT, the Company issued 58,336,392 Common Shares, resulting in BAT's beneficial ownership in the Company of approximately 19.9%.
Pursuant to the investor rights agreement between the Company and BAT (the "IRA"), the Company granted BAT certain top-up rights (the "Top-up Rights") to subscribe for additional Common Shares in specified circumstances where the pre-emptive rights are not applicable (referred to in the IRA as "Exempt Distributions") and in specified circumstances where pre-emptive rights were not exercised (referred to in the IRA as “bought deal Distributions”).
The price per Common Share to be paid by BAT pursuant to the exercise of its Top-up Rights will equal the price paid by other participants in the Exempt Distribution or bought deal Distribution, subject to certain restrictions (including, if such price is not permitted pursuant to Securities Laws, at the lowest price permitted thereunder).
The Company has classified the Top-up Rights as a derivative liability, and pursuant to the exercise of stock options, restricted share units, performance share units and warrants that were outstanding at initial recognition on March 10, 2021 (the date of the IRA), the Company recorded a derivative liability of $2,740 based on the estimated fair value of the Top-up Rights at this date using a Monte Carlo pricing model.
As at November 30, 2022, the Company revalued the Top-up Rights at an estimated fair value of $752 (August 31, 2022 – $735). The Company recorded a decrease in the estimated fair value change of the Top-up Rights for the three months ended November 30, 2022 of $17 (November 30, 2021 - $646). The following table summarizes the movement in Top-up Rights:
| NUMBER OF TOP-UP RIGHTS | AMOUNT | ||||||||||
| Balance - August 31, 2022 | 7,590,099 | $ | 735 | ||||||||
| Granted | 851,977 | — | |||||||||
| Exercised | — | — | |||||||||
| Cancelled / Forfeited | (31,944) | — | |||||||||
| Revaluation of Top-up Rights | — | $ | 17 | ||||||||
| Balance - November 30, 2022 | 8,410,132 | $ | 752 | ||||||||
MANAGEMENT’S DISCUSSION AND ANALYSIS | FOR THE THREE MONTHS ENDED NOVEMBER 30, 2022 AND 2021 22
The following inputs were used to estimate the fair value of the Top-up Rights at November 30, 2022, and August 31, 2022:
| NOVEMBER 30, 2022 | |||||||||||||||||||||||
| STOCK OPTIONS | WARRANTS | PSUs | RSUs | ||||||||||||||||||||
| Average exercise price | $0.61 - $9.53 | $2.50 | $— | $— | |||||||||||||||||||
| Risk free interest rate | 3.13% - 4.19% | 4.27% | 2.92% | 3.03% | |||||||||||||||||||
| Expected future volatility of common shares | 65.00% - 95.00% | 70.00% | 85.00% | 85.00% | |||||||||||||||||||
Expected life(1) | 1.22 - 4.99 | 0.95 | 6.65 | 5.77 | |||||||||||||||||||
| Forfeiture rate | 10% | —% | 25% | 5% | |||||||||||||||||||
| August 31, 2022 | |||||||||||||||||||||||
| STOCK OPTIONS | WARRANTS | PSUs | RSUs | ||||||||||||||||||||
| Average exercise price | $0.60 - $9.53 | $2.50 | — | — | |||||||||||||||||||
| Risk free interest rate | 3.15% - 3.71% | 3.75% | 3.16% | 3.13% | |||||||||||||||||||
| Expected future volatility of common shares | 70.00% - 95.00% | 70.00% | 90.00% | 85.00% | |||||||||||||||||||
Expected life(1) | 1.34 - 5.12 | 1.2 | 4.91 | 5.47 | |||||||||||||||||||
| Forfeiture rate | 10% | —% | 25% | 6% | |||||||||||||||||||
(ii) Biological Assets
The Company measures biological assets, which consist of cannabis plants, at fair value less costs to sell up to the point of harvest, which then becomes the basis for the cost of finished goods inventories after harvest.
The changes in the carrying value of biological assets are as follows:
| CAPITALIZED COST | BIOLOGICAL ASSET FAIR VALUE ADJUSTMENT | AMOUNT | |||||||||||||||
| Balance, August 31, 2022 | $ | 8,753 | $ | 9,215 | $ | 17,968 | |||||||||||
| Acquisition through business combination | — | — | — | ||||||||||||||
| Unrealized gain on change in fair value of biological assets | — | 24,714 | 24,714 | ||||||||||||||
| Production costs capitalized | 13,382 | — | 13,382 | ||||||||||||||
| Transfer to inventory upon harvest | (13,444) | (21,944) | (35,388) | ||||||||||||||
| Carrying amount, November 30, 2022 | $ | 8,691 | $ | 11,985 | $ | 20,676 | |||||||||||
The fair value less costs to sell of biological assets is determined using a model which estimates the expected harvest yield in grams for plants currently being cultivated, then adjusts that amount for the average selling price per gram, and for any additional costs to be incurred, such as post-harvest costs. The following unobservable inputs, all of which are classified as Level 3 within the fair value hierarchy (see Note 13 of the Interim Financial Statements), are used in determining the fair value of biological assets:
i.average selling price per gram – calculated as the weighted average current selling price of cannabis sold by the Company, adjusted for expectations about future pricing;
ii.expected average yield per plant – represents the number of grams of finished cannabis inventory which is expected to be obtained from each harvested cannabis plant currently under cultivation;
iii.wastage of plants based on their various stages of growth – represents the weighted average percentage of biological assets which are expected to fail to mature into cannabis plants that can be harvested;
iv.post-harvest costs – calculated as the cost per gram of harvested cannabis to complete the sale of cannabis plants post-harvest, consisting of the cost of direct and indirect materials and labour related to drying, labelling, and packaging; and
v.stage of completion in the cultivation process – calculated by taking the average number of weeks in production over a total average grow cycle of approximately 14 weeks.
The Company estimates the harvest yields for the cannabis on plants at various stages of growth, based on expected yield of mature plants. As of November 30, 2022, it is expected that the Company’s biological assets will yield 32,420 kg (August 31, 2022 – 27,405 kg) of cannabis when eventually harvested. The Company’s estimates are, by their nature, subject to change,
MANAGEMENT’S DISCUSSION AND ANALYSIS | FOR THE THREE MONTHS ENDED NOVEMBER 30, 2022 AND 2021 23
and differences from the expected yield will be reflected in the fair value adjustment to biological assets in future periods. The Company accretes fair value on a straight-line basis according to stage of growth. As a result, a cannabis plant that is 50% through its 14-week growing cycle would be ascribed approximately 50% of its harvest date expected fair value less costs to sell (subject to wastage adjustments).
Management believes the most significant unobservable inputs and their impact on fair value are as follows:
| SIGNIFICANT INPUTS & | WEIGHTED AVERAGE INPUT | EFFECT ON FAIR VALUE | |||||||||||||||||||||||||||
| ASSUMPTIONS | NOVEMBER 30, 2022 | AUGUST 31, 2022 | SENSITIVITY | NOVEMBER 30, 2022 | AUGUST 31, 2022 | ||||||||||||||||||||||||
| Average selling price per gram | $ | 1.47 | $ | 1.49 | Increase or decrease by 10% per gram | $ | 2,028 | $ | 1,766 | ||||||||||||||||||||
| Expected average yield per plant | 162 | grams | 132 | grams | Increase or decrease by 10 grams | $ | 1,249 | $ | 1,339 | ||||||||||||||||||||
The expected average yield per plant at November 30, 2022 and August 31, 2022, primarily reflects the average yield of the flower component of the plant (with the exception being cannabidiol (“CBD”) dominant strains where trim is also harvested for extraction).
OUTSTANDING SHARE DATA
(i) Outstanding Shares, Warrants and Options and Other Securities
The following table sets out the number of Common Shares, options, warrants, top-up rights, restricted share units and performance share units outstanding of the Company as at November 30, 2022 and January 11, 2023:
| NOVEMBER 30, 2022 | January 11, 2023 | ||||||||||
| Common shares issued and outstanding | 313,856,912 | 313,856,912 | |||||||||
| Options | 12,052,539 | 11,982,539 | |||||||||
| Warrants | 16,943,650 | 16,943,650 | |||||||||
| Top-up rights | 8,410,132 | 8,392,403 | |||||||||
| Restricted share units | 3,804,607 | 3,803,119 | |||||||||
| Performance share units | 1,111,025 | 1,111,025 | |||||||||
| Total fully diluted shares | 356,178,865 | 356,089,648 | |||||||||
CRITICAL ACCOUNTING ESTIMATES AND JUDGMENTS
The preparation of the Financial Statements under IFRS requires management to make judgments, estimates, and assumptions about the carrying amounts of assets and liabilities that are not readily apparent from other sources. The estimates and associated assumptions are based on historical experience and other factors that are considered to be relevant. Actual results may differ from these estimates.
The estimates and underlying assumptions are reviewed on an ongoing basis. Revisions to accounting estimates are recognized in the period in which the estimate is revised, if the revision affects only that period, or in the period of the revision and future periods, if the revision affects both current and future periods.
There have been no changes in the Company's critical accounting estimates during the three months ended November 30, 2022. For additional information on the Company’s accounting policies and key estimates, refer to the note disclosures in the Annual Financial Statements and MD&A as at and for the year ended August 31, 2022.
Adoption of New Accounting Pronouncements
Amendments to IAS 37: Onerous Contracts and the Cost of Fulfilling a Contract
The amendments specify that the ‘cost of fulfilling’ a contract comprises the ‘costs that relate directly to the contract’. Costs that relate directly to a contract can either be incremental costs of fulfilling that contract or an allocation of other costs that relate directly to fulfilling contracts. The amendments apply retrospectively for annual reporting periods beginning on or after January 1, 2022 with early adoption permitted.
MANAGEMENT’S DISCUSSION AND ANALYSIS | FOR THE THREE MONTHS ENDED NOVEMBER 30, 2022 AND 2021 24
The Company adopted these amendments to IAS 37 effective September 1, 2022 and determined that none of the contracts existing at September 1, 2022 would be identified as onerous applying the revised accounting policy – i.e. there is no impact on the opening equity balances as at September 1, 2022 as a result of the amendments.
Amendments to IAS 16: Property Plant and Equipment: Proceeds before intended use
The amendments clarify the accounting for the net proceeds from selling any items produced while bringing an item of property plant and equipment into use. The amendments prohibit a company from deducting from the cost of property plant and equipment proceeds from selling items produced while the company is preparing that asset for its intended use. A company will recognize such sales proceeds and related costs in profit and loss. The amendments are applied retrospectively for annual reporting periods beginning on or after January 1, 2022 with early adoption permitted.
The Company adopted these amendments to IAS 16 effective September 1, 2022 and has determined that the amendments had no impact on the interim financial statements of the Company as there were no sales of such items produced by property, plant and equipment made available for use on or after the beginning of the earliest period presented.
Amendments to IFRS 9: Financial Instruments
The amendments clarify the fees that an entity includes when assessing whether the terms of a new or modified financial liability are substantially different from the terms of the original financial liability. These fees include only those paid or received between the borrower and the lender, including fees paid or received by either the borrower or lender on the other’s behalf. The amendments are effective for annual reporting periods beginning on or after January 1, 2022 with earlier adoption permitted.
The Company adopted these amendments to IFRS 9 effective September 1, 2022 and has determined that the amendments had no impact on the interim financial statements of the Company as there were no modifications of the Company’s financial instruments during the period.
Amendments to IFRS 3: Business Combinations
In May 2020, the IASB issued Reference to the Conceptual Framework (Amendments to IFRS 3) with amendments to IFRS 3, which refers to the 2018 Conceptual Framework instead of the 1989 Framework. They also added a requirement that for obligations within the scope of IAS 37, an acquirer applies IAS 37 or IFRIC 21, Levies, instead of the Conceptual Framework to identify the liabilities that have been assumed. Finally, the amendments also state that the acquirer does not recognize contingent assets acquired in a business combination. The amendments apply to business combinations for which the acquisition date is on or after the beginning of the first annual reporting period beginning on or after January 1, 2022.
The Company adopted these amendments effective September 1, 2022 and has determined that the amendments had no impact on the interim financial statements of the Company.
Amendments to IAS 41: Agriculture
The amendments remove the requirement in paragraph 22 of IAS 41 Agriculture that entities exclude cash flows for taxation when measuring the fair value of assets within the scope of IAS 41.
While the Company’s biological assets are within the scope of IAS 41, these amendments had no impact on the Company's interim financial statements as the direct and indirect costs of biological assets are determined using an approach similar to the capitalization criteria outlined in IAS 2 Inventories
Future changes to accounting standards
The following IFRS standards have been recently issued by the IASB with an effective date after November 30, 2022 and have not yet been adopted by the Company. Pronouncements that are irrelevant or not expected to have a significant impact have been excluded:
Amendments to IAS 1: Classification of Liabilities as Current or Non-Current
The amendments to IAS 1 clarify the requirements relating to determining whether a liability should be presented as current or non-current in the statement of financial position. Under the new requirements, the assessment of whether a liability is presented as current or non-current is based on the contractual arrangements in place as at the reporting date and does not impact the amount or timing of recognition. The amendments apply retrospectively for annual reporting periods beginning on or after January 1, 2024. The Company is currently evaluating the potential impact of these amendments on the consolidated financial statements.
Amendments to IAS 8: Definition of Accounting Estimate
The amendments introduced a new definition for accounting estimates, clarifying that the estimates are monetary amounts in the financial statements that are subject to measurement uncertainty which is defined as an uncertainty that arises when monetary amounts in financial reports cannot be observed directly and must instead be estimated. The amendments are
MANAGEMENT’S DISCUSSION AND ANALYSIS | FOR THE THREE MONTHS ENDED NOVEMBER 30, 2022 AND 2021 25
effective for annual reporting periods beginning on or after January 1, 2023. The Company is currently evaluating the potential impact of these amendments on the consolidated financial statements.
Amendments to IAS 1: Disclosure of Accounting Policies
The IASB has issued amendments to IAS 1 and IFRS Practice Statement 2 on the application of materiality to disclosure of accounting policies in deciding which accounting policies to disclose in the financial statements. The key amendments to IAS 1 include requiring companies to disclose their material accounting policies rather than their significant accounting policies; clarifying that accounting policies related to immaterial transactions, other events or conditions are immaterial and need not be disclosed; and clarifying that not all accounting policies that relate to material transactions, other events or conditions are material to a Company’s consolidated financial statements. The amendments are effective for annual reporting periods beginning on or after January 1, 2023. The Company is currently evaluating the potential impact of this amendment on the consolidated financial statements.
PRODUCT DEVELOPMENT COLLABORATION
On March 10, 2021, in conjunction with the strategic investment received as described herein, the Company and BAT entered into a Product Development Collaboration Agreement (the "PDC Agreement") pursuant to which the CoE was established to focus on developing the next generation of cannabis products with an initial focus on CBD. The CoE is located at the Company’s indoor Moncton Campus, which holds the Health Canada licenses required to conduct research and product development activities with cannabis products. Both companies are contributing scientists, researchers, and product developers to the CoE and it is governed and supervised by a steering committee consisting of an equal number of senior members from both companies. Under the terms of the PDC Agreement, both Organigram and BAT have access to certain of each other’s IP and, subject to certain limitations, have the right to independently, globally commercialize the products, technologies and IP created by the CoE pursuant to the PDC Agreement.
Pursuant to the terms of the PDC Agreement, $31,109 of the Investment Proceeds was reserved as restricted funds in order to satisfy certain of the Company’s future obligations under the PDC Agreement, including the Company’s portion of its funding obligations under a mutually agreed initial budget for the CoE. Costs relating to the CoE are funded equally by the Company and BAT. Balances are transferred from restricted funds to the Company's general operating account as CoE related expenditures are periodically reconciled and approved. The balance in restricted funds as at November 30, 2022 is $25,943 (August 31, 2022 - $26,820).
The CoE is accounted for as a joint operation, in which the Company and BAT contribute 50%. The Company recognized its share of the expenses incurred by the CoE in the statement of operations and comprehensive income (loss). For the three months ended November 30, 2022, $1,345 (November 30, 2021 - $494) of expenses have been recorded in the statement of operations and comprehensive income (loss).
CONTINGENT LIABILITIES
The Company recognizes loss contingency provisions for probable losses when management can reasonably estimate the loss. When the estimated loss lies within a range, the Company records a loss contingency provision based on its best estimate of the probable loss. If no particular amount within that range is a better estimate than any other amount, the mid-point of the range is used. As information becomes known a loss contingency provision is recorded when a reasonable estimate can be made. The estimates are reviewed at each reporting date and the estimates are changed when expectations are revised. An outcome that deviates from the Company’s estimate may result in an additional expense or release in a future accounting period.
Nova Scotia Claim
On March 3, 2017, a claim in connection with a proposed class-action lawsuit (the “NS Claim”) was filed with the Supreme Court of Nova Scotia (the “NS Court”) seeking to represent a class who purchased medical marijuana that was the subject of the Company’s product recalls in December 2016 and January 2017 as it may have contained trace elements of the pesticides myclobutanil and bifenazate which are not approved for use by Licensed Producers. Between 2017 and 2021, various proceedings took place and the NS Claim was amended several times.
On April 26, 2022, the Company entered into a Settlement Agreement (the "Settlement") with the representative plaintiff on behalf of the class for an aggregate of $2,310 (the "Settlement Amount"). The Settlement Amount will be used to provide claimants a refund of the amounts paid to purchase the voluntarily recalled product, less any refunds they have already received, as well as the payment of legal fees. On August 31, 2022, the Settlement was approved by the NS Court. Settlement funds of $2,310 were deposited by Organigram with the administrator in October 2022 in accordance with the Settlement Agreement. The administrator has been disbursing funds to the claimants since the Settlement funds were deposited. The Company reported the NS Claim to its insurance provider which appointed counsel to defend the NS Claim. The Company received insurance proceeds of $532 during the year ended August 31, 2022 to cover all remaining costs associated with the NS Claim.
MANAGEMENT’S DISCUSSION AND ANALYSIS | FOR THE THREE MONTHS ENDED NOVEMBER 30, 2022 AND 2021 26
Alberta Claim
On June 16, 2020, a claim in connection with a proposed national consumer protection class-action lawsuit (the "Alberta Claim") was filed with the Court of Queen’s Bench in Alberta (the “AB Court”) seeking damages against several Canadian cannabis companies including the Company (the "Defendants"). The Alberta Claim does not particularize all of the claims against the companies; however, it makes allegations with respect to the content of THC and CBD in the companies’ products. In order to proceed as a class action, the AB Court must certify the action as a class action. A certification hearing has not yet been scheduled. The Company has reported the Alberta Claim to its insurers.
Estimating an amount or range of possible losses resulting from litigation proceedings is inherently difficult, particularly where the matters involve indeterminate claims for monetary damages and are in the stages of the proceedings where key factual and legal issues have not been resolved. For these reasons, the Company is currently unable to predict the ultimate timing or outcome of or reasonably estimate the possible losses or a range of possible losses resulting from the matter described above. No provision for the Alberta Clam has been recognized as at November 30, 2022 (November 30, 2021 - nil).
At November 30, 2022, a provision of $247 (August 31, 2022 - $2,560) was included in the condensed consolidated interim statement of financial position for any remaining legal or administrator costs related to the NS claim and other contingencies. For the three months ended November 30, 2022, payments of $2,313 (August 31, 2021 - $nil) were made in connection with the Settlement Agreement.
DISCLOSURE CONTROLS AND PROCEDURES AND INTERNAL CONTROL OVER FINANCIAL REPORTING
In accordance with National Instrument 52-109 - Certification of Disclosure in Issuers’ Annual and Interim Filings (“NI 52-109”) and Rule 13a-15 under the United States Securities Exchange Act of 1934, as amended (the “Exchange Act”), the establishment and maintenance of Disclosure Controls and Procedures (“DCP”) and Internal Control Over Financial Reporting (“ICFR”) is the responsibility of management.
The Company engaged KPMG LLP to perform an “integrated audit” which encompassed an opinion on the fairness of presentation of the Company’s Annual Financial Statements for the financial year ended August 31, 2022, as well as an opinion on the effectiveness of the Company’s ICFR. KPMG LLP, the Company’s independent registered public accounting firm, has audited the Company's Financial Statements and has issued an adverse report on the effectiveness of ICFR. KPMG LLP‘s attestation report on the Company’s ICFR is incorporated by reference into the Company’s annual report on Form 40-F under the Exchange Act for the year ended August 31, 2022.
DISCLOSURE CONTROLS AND PROCEDURES
The Company maintains a set of DCP designed to provide reasonable assurance that information required to be publicly disclosed is recorded, processed, summarized and reported on a timely basis. As required by NI 52-109 and Exchange Act Rule 13a-15(b), an evaluation of the design and operation of our DCP was completed as of November 30, 2022 under the supervision and with the participation of management, including our Chief Executive Officer (“CEO”) and Chief Financial Officer (“CFO”) using the criteria set forth in Internal Control - Integrated Framework, issued by the Committee of Sponsoring Organizations of the Treadway Commission (the “COSO 2013 Framework”). Based upon this evaluation, our CEO and CFO concluded that because of the material weaknesses in our ICFR described below, our DCP were not effective as at such date.
INTERNAL CONTROL OVER FINANCIAL REPORTING
NI 52-109 requires the CEO and CFO to certify that they are responsible for establishing and maintaining ICFR for the Company and that those internal controls have been designed and are effective in providing reasonable assurance regarding the reliability of financial reporting and the preparation of financial statements in accordance with IFRS. Similarly, Exchange Act Rule 13a-15(c) requires the Company's management, with the participation of the CEO and CFO, to evaluate ICFR as at the end of the fiscal year. The CEO and CFO are also responsible for disclosing any changes to the Company’s internal controls during the most recent period that have materially affected, or are reasonably likely to materially affect, its internal control over financial reporting.
MATERIAL CHANGES TO THE CONTROL ENVIRONMENT
There have been no changes to the Company’s ICFR during the three months ended November 30, 2022 that have materially affected, or are likely to materially affect, the Company’s ICFR.
MANAGEMENT’S DISCUSSION AND ANALYSIS | FOR THE THREE MONTHS ENDED NOVEMBER 30, 2022 AND 2021 27
MANAGEMENT’S EVALUATION OF INTERNAL CONTROL OVER FINANCIAL REPORTING
The Company’s management, under the supervision and with the participation of its CEO and CFO, conducted an evaluation of the effectiveness of the Company’s ICFR as defined by NI 52-109 and Rule 13a-15(f) of the Exchange Act as of August 31, 2022, using the criteria set forth by the COSO 2013 Framework. Based on this evaluation, management concluded that the Company's ICFR was not effective as of November 30, 2022, due to material weaknesses in internal control over ICFR that have been previously identified but continue to exist.
A material weakness is a deficiency, or a combination of deficiencies, in internal control over financial reporting, such that there is a reasonable possibility that a material misstatement of the Company’s annual or interim financial statements will not be prevented or detected on a timely basis. Management has identified the following material weaknesses:
•An ineffective control environment resulting from an insufficient number of trained financial reporting and accounting, information technology (IT) and operational personnel with the appropriate skills and knowledge and with assigned responsibility and accountability related to the design, implementation and operation of ICFR.
•The insufficient number of personnel described above contributed to an ineffective risk assessment process necessary to identify all relevant risks of material misstatement and to evaluate the implications of relevant risks on its ICFR.
•An ineffective information and communication process resulting from: (i) insufficient communication of internal control information, including objectives and responsibilities, such as delegation of authority; and (ii) ineffective general IT controls, ineffective controls related to complex spreadsheets, and ineffective controls over information from service organizations, resulting in insufficient controls to ensure the relevance, timeliness and quality of information used in control activities.
•As a consequence of the above, the Company had ineffective control activities related to the design, implementation and operations of process level and financial statement close controls which had a pervasive impact on the Company's ICFR.
LIMITATIONS ON SCOPE OF DESIGN
The Company has limited the scope of its evaluation of DCP and ICFR to exclude controls, policies and procedures over entities that were acquired by the Company not more than 365 days before the end of the financial period. The only entity controlled by the Company but that was scoped out of the evaluation of DCP and ICFR was Laurentian (acquired on December 21, 2021).
Excluding goodwill, Laurentian constitutes approximately 3% of the Company’s current assets, 6% of total assets, 10% of current liabilities and 14% of total liabilities, as well as 4% of net revenue and (14)% of net income as at and for the three months ended November 30, 2022.
STATUS OF REMEDIATION PLAN
Management, with the assistance of external and internal specialists, has continued reviewing and revising its ICFR. Management remains committed to implementing changes to its ICFR to ensure that the control deficiencies that contributed to the material weaknesses are remediated. The following remedial activities have been implemented or remain in progress as at the date of this MD&A and will continue throughout Fiscal 2023 until remediated:
•We are implementing additional ongoing oversight, training and communication programs for management and personnel to reinforce the Company's control standards and expectations, enhance understanding of assessed risks, and clarify individual responsibility for control activities at various levels within the Company. We have continued to formalize and improve risk assessment and monitoring activities with continued regular reporting to those charged with governance at an appropriate frequency. We are preparing a delegation of authority matrix to enforce desired limits of authority for key transactions, events, and commitments, and are working to revise the matrix to reflect organizational changes with a view to then formally communicating these limits of authority to relevant personnel throughout the Company.
•We have bolstered the financial reporting and accounting department's internal controls and accounting knowledge with a number of new full-time employees including those in more senior roles. The Company has implemented retention efforts to complement its hiring. Roles and responsibilities are continually assessed with a view to meeting the needs of the Company's internal control environment.
•We have hired more senior internal audit specialists and continue to retain external audit specialists to assist management in evaluating internal controls and provide advisory services in designing the remediation plans. These specialists are expected to enhance our continuing efforts in Fiscal 2023 to evaluate significant financial reporting processes to ascertain if there are any new processes that need to be documented, continue to assess risks related to financial reporting, and re-evaluate the design and operating effectiveness of key controls within those processes
•We have hired a Chief Information Officer to oversee the IT department, support the remediation of deficiencies in general IT controls and facilitate the development and implementation of the new enterprise resource planning ("ERP") system. The ERP project is expected to streamline financial data management processes, improve functionality and reduce reliance on manual spreadsheets. The ERP has multiple phases at various stages of
MANAGEMENT’S DISCUSSION AND ANALYSIS | FOR THE THREE MONTHS ENDED NOVEMBER 30, 2022 AND 2021 28
development including design, development and testing. The first phase of the ERP is expected to be implemented by the end of Fiscal 2023.
•We continue to simplify and streamline our complex spreadsheet models to reduce the risk of errors in mathematical formulas and to improve the ability to verify the logic of complex spreadsheets.
Senior management has discussed the material weaknesses described above with the Audit Committee which will continue to review progress on these remediation activities. While we believe these actions will contribute to the remediation of material weaknesses, we have not completed all the corrective processes, procedures and related evaluation or remediation that we believe are necessary. As we continue to evaluate and work to remediate the material weaknesses, we may need to take additional measures to address the deficiencies. Until the remediation steps set forth above, including the efforts to implement any additional control activities identified in the process, are fully implemented and operate for a sufficient period of time that they can be concluded to be operating effectively, the material weaknesses described above will not be considered fully remediated. No assurance can be provided at this time that the actions and remediation efforts will effectively remediate the material weaknesses described above or prevent the incidence of other material weaknesses in the Company’s ICFR in the future. We do not know the specific time frame needed to fully remediate the material weaknesses identified above. See “Risk Factors” in this MD&A and the AIF.
Management, including the CEO and CFO, does not expect that DCP or ICFR will prevent all misstatements, even as the remediation measures are implemented and further improved to address the material weaknesses. The design of any system of internal controls is based in part upon certain assumptions about the likelihood of future events, and there can be no assurance that any design will succeed in achieving the stated goals under all potential future conditions.
RISK FACTORS
The Company’s business is subject to risks inherent in a high growth, heavily regulated enterprise, and the Company has identified certain risks pertinent to its business that may have affected or may affect its business, financial conditions, results of operations and cash flows, as further described throughout this MD&A and under “Risk Factors” in the AIF. For additional risk factors, readers are directed to the Company’s most recent AIF, which is (a) available under the Company’s issuer profile on SEDAR at www.sedar.com, and (b) incorporated into and forms part of the Company's annual report on Form-40F filed on EDGAR at www.sec.gov. As a general matter, management of the Company attempts to assess and mitigate any risks and uncertainties by retaining experienced professional staff and assuring that the Board of Directors and senior management of the Company are monitoring the risks impacting or likely to impact the business on a continuous basis.
(i) Credit Risk
Credit risk arises from deposits with banks, short-term investments, outstanding trade and loan receivables, and restricted funds. For trade receivables, the Company does not hold any collateral as security but mitigates this risk by dealing only with what management believes to be financially sound counterparties and, accordingly, does not anticipate significant loss for non-performance. For other receivables, out of the normal course of business, management generally obtains guarantees and general security agreements. The maximum exposure to credit risk of cash, short-term investments, accounts receivable, loan receivable, and restricted funds on the statement of financial position at November 30, 2022 approximates $152,111 (August 31, 2022 - $171,799).
As of November 30, 2022 and August 31, 2022, the Company’s aging of trade receivables was as follows:
| NOVEMBER 30, 2022 | AUGUST 31, 2022 | ||||||||||
| 0-60 days | $ | 28,363 | $ | 42,961 | |||||||
| 61-120 days | 1,589 | 2,022 | |||||||||
| Gross trade receivables | $ | 29,952 | $ | 44,983 | |||||||
| Less: Expected credit losses and reserve for product returns and price adjustments | (1,150) | (1,121) | |||||||||
| $ | 28,802 | $ | 43,862 | ||||||||
(ii) Liquidity Risk
The Company’s liquidity risk is the risk that the Company will not be able to meet its financial obligations as they become due. The Company manages its liquidity risk by reviewing on an ongoing basis its capital requirements. At November 30, 2022, the Company had $70,072 (August 31, 2022 – $68,515) of cash and working capital of $172,920 (August 31, 2022 - $166,338). Further, the Company may potentially access equity capital through the capital markets if required.
MANAGEMENT’S DISCUSSION AND ANALYSIS | FOR THE THREE MONTHS ENDED NOVEMBER 30, 2022 AND 2021 29
The Company is obligated to the following contractual maturities relating to their undiscounted cash flows as at November 30, 2022:
| Carrying Amount | Contractual Cash Flows | Less than 1 year | 1 to 3 years | 3 to 5 years | More than 5 years | |||||||||||||||
| Accounts payable and accrued liabilities | $ | 33,468 | $ | 33,468 | $ | 33,468 | $ | — | $ | — | $ | — | ||||||||
| Long-term debt | 217 | 228 | 80 | 148 | 0 | 0 | ||||||||||||||
| Lease obligations | 5,166 | 6,585 | 1,056 | 2,292 | 910 | 2,327 | ||||||||||||||
| $ | 38,851 | $ | 40,281 | $ | 34,604 | $ | 2,440 | $ | 910 | $ | 2,327 | |||||||||
The contractual maturities noted above are based on contractual due dates of the respective financial liabilities.
In connection with the Company’s facilities, the Company is contractually committed to approximately $15,475 of capital expenditures, mostly related to its Moncton and Laurentian facilities.
(iii) Market Risk
Market risk is the risk that the fair value or future cash flows of a financial instrument will fluctuate because of changes in market prices. Market risk for the Company is comprised of interest rate risk, which is the risk that the fair value or future cash flows of a financial instrument will fluctuate because of changes in market interest rates. The Company’s exposure to the risk of changes in market interest rates relates primarily to the Company’s debt obligations with floating interest rates. The Company has determined that a 1% change in rates would not have a material impact on the interim financial statements.
(iv) Concentration Risk
The Company’s accounts receivable are primarily due from provincial government agencies (three of which, individually, represented more than 10% of the Company’s revenues during the three months ended November 30, 2022), corporations (none of which represented more than 10% of the Company’s revenues during the period), and legal trusts and, thus, the Company believes that the accounts receivable balance is collectible.
COVID-19
In March 2020, the World Health Organization declared the outbreak of a novel strain of coronavirus (“COVID-19”) and resulted in governments worldwide enacting emergency measures to combat its spread. These measures, which included the implementation of travel restrictions, quarantine periods and physical distancing requirements, affected economies and disrupted business operations for the Company and its customers.
While vaccination programs are maturing and generally restrictions are easing across most countries, there is ongoing concern and uncertainty regarding new and potential variants and continued global spread. The extent to which COVID-19 may impact the Company’s business, including its operations, market for its securities and its financial condition, will depend on future developments which are highly uncertain and cannot be predicted at this time. Furthermore, depending on the duration and severity of the COVID-19 pandemic, it may also have the effect of heightening many of the other business risks such as risks relating to the Company's supply chain (availability and cost of raw materials and components) and the successful on-time completion of business objectives. The Company will continue to monitor and assess the impact of COVID-19 on its judgments, estimates, accounting policies and amounts recognized in the Financial Statements.
MANAGEMENT’S DISCUSSION AND ANALYSIS | FOR THE THREE MONTHS ENDED NOVEMBER 30, 2022 AND 2021 30