| FREE WRITING PROSPECTUS | ||
| FILED PURSUANT TO RULE 433 | ||
| REGISTRATION FILE NO.: 333-190246-09 | ||
| Dated October 1, 2014 | JPMBB 2014-C24 |
Free Writing Prospectus Structural and Collateral Term Sheet | ||||
JPMBB 2014-C24 | ||||
$1,271,315,148 (Approximate Mortgage Pool Balance) | ||||
$1,015,153,000 (Approximate Offered Certificates) | ||||
J.P. Morgan Chase Commercial Mortgage Securities Corp. Depositor | ||||
COMMERCIAL MORTGAGE PASS-THROUGH CERTIFICATES SERIES 2014-C24 | ||||
JPMorgan Chase Bank, National Association Barclays Bank PLC KeyBank National Association RAIT Funding, LLC Column Financial, Inc. General Electric Capital Corporation Mortgage Loan Sellers | ||||
J.P. Morgan Co-Lead Manager and Joint Bookrunner | Barclays Co-Lead Manager and Joint Bookrunner | |||
| KeyBanc Capital Markets | Co-Managers | Credit Suisse | ||
THE INFORMATION IN THIS STRUCTURAL AND COLLATERAL TERM SHEET IS NOT COMPLETE AND MAY BE AMENDED PRIOR TO THE TIME OF SALE. THIS TERM SHEET IS NOT AN OFFER TO SELL THESE SECURITIES AND IT IS NOT A SOLICITATION OF AN OFFER TO BUY THESE SECURITIES IN ANY JURISDICTION WHERE THE OFFER OR SALE IS NOT PERMITTED.
| Dated October 1, 2014 | JPMBB 2014-C24 |
This material is for your information, and none of J.P. Morgan Securities LLC (“JPMS”), Barclays Capital Inc. (“Barclays”), KeyBanc Capital Markets Inc. (“KeyBanc”) or Credit Suisse Securities (USA) LLC (“Credit Suisse”) (each individually, an “Underwriter”, and collectively, the ‘‘Underwriters’’) is soliciting any action based upon it. This material is not to be construed as an offer to sell or the solicitation of any offer to buy any security in any jurisdiction where such an offer or solicitation would be illegal.
The Depositor has filed a registration statement (including a prospectus) with the SEC (SEC File no. 333-190246) for the offering to which this free writing prospectus relates. Before you invest, you should read the prospectus in the registration statement and other documents the Depositor has filed with the SEC for more complete information about the Depositor, the issuing trust and this offering. You may get these documents for free by visiting EDGAR on the SEC Web site at www.sec.gov. Alternatively, the Depositor or any Underwriter or any dealer participating in the offering will arrange to send you the prospectus if you request it by calling 1 (866) 400-7834 or by emailing cmbs-prospectus@jpmorgan.com.
Neither this document nor anything contained in this document shall form the basis for any contract or commitment whatsoever. The information contained in this document is preliminary as of the date of this document, supersedes any previous such information delivered to you and will be superseded by any such information subsequently delivered prior to the time of sale. These materials are subject to change, completion or amendment from time to time.
The attached information contains certain tables and other statistical analyses (the “Computational Materials”) that have been prepared in reliance upon information furnished by the Mortgage Loan Sellers. Numerous assumptions were used in preparing the Computational Materials, which may or may not be reflected in this document. The Computational Materials should not be construed as either projections or predictions or as legal, tax, financial or accounting advice. You should consult your own counsel, accountant and other advisors as to the legal, tax, business, financial and related aspects of a purchase of these certificates. Any weighted average lives, yields and principal payment periods shown in the Computational Materials are based on prepayment and/or loss assumptions, and changes in such prepayment and/or loss assumptions may dramatically affect such weighted average lives, yields and principal payment periods. In addition, it is possible that prepayments or losses on the underlying assets will occur at rates higher or lower than the rates shown in the Computational Materials. The specific characteristics of the certificates may differ from those shown in the Computational Materials due to differences between the final underlying assets and the preliminary underlying assets used in preparing the Computational Materials. The principal amount and designation of any certificate described in the Computational Materials are subject to change prior to issuance. None of the Underwriters nor any of their respective affiliates make any representation or warranty as to the actual rate or timing of payments or losses on any of the underlying assets or the payments or yield on the certificates.
This information is based upon management forecasts and reflects prevailing conditions and management’s views as of this date, all of which are subject to change.
This document contains forward-looking statements. Those statements are subject to certain risks and uncertainties that could cause the success of collections and the actual cash flow generated to differ materially from the information set forth in this document. While such information reflects projections prepared in good faith based upon methods and data that are believed to be reasonable and accurate as of their dates, the issuer undertakes no obligation to revise these forward-looking statements to reflect subsequent events or circumstances. Investors should not place undue reliance on forward-looking statements and are advised to make their own independent analysis and determination with respect to the forecasted periods, which reflect the issuer’s view only as of the date of this document.
J.P. Morgan is the marketing name for the investment banking businesses of JPMorgan Chase & Co. and its subsidiaries worldwide. Securities, syndicated loan arranging, financial advisory and other investment banking activities are performed by JPMS and its securities affiliates, and lending, derivatives and other commercial banking activities are performed by JPMorgan Chase Bank, National Association and its banking affiliates. JPMS is a member of SIPC and the NYSE.
THE CERTIFICATES REFERRED TO IN THESE MATERIALS ARE SUBJECT TO MODIFICATION OR REVISION (INCLUDING THE POSSIBILITY THAT ONE OR MORE CLASSES OF CERTIFICATES MAY BE SPLIT, COMBINED OR ELIMINATED AT ANY TIME PRIOR TO ISSUANCE OR AVAILABILITY OF A FINAL PROSPECTUS) AND ARE OFFERED ON A “WHEN, AS AND IF ISSUED” BASIS. PROSPECTIVE INVESTORS SHOULD UNDERSTAND THAT, WHEN CONSIDERING THE PURCHASE OF THESE CERTIFICATES, A CONTRACT OF SALE WILL COME INTO BEING NO SOONER THAN THE DATE ON WHICH THE RELEVANT CLASS OF CERTIFICATES HAS BEEN PRICED AND THE UNDERWRITERS HAVE CONFIRMED THE ALLOCATION OF CERTIFICATES TO BE MADE TO INVESTORS; ANY “INDICATIONS OF INTEREST” EXPRESSED BY ANY PROSPECTIVE INVESTOR, AND ANY “SOFT CIRCLES” GENERATED BY THE UNDERWRITERS, WILL NOT CREATE BINDING CONTRACTUAL OBLIGATIONS FOR SUCH PROSPECTIVE INVESTORS, ON THE ONE HAND, OR THE UNDERWRITERS, THE DEPOSITOR OR ANY OF THEIR RESPECTIVE AGENTS OR AFFILIATES, ON THE OTHER HAND.
AS A RESULT OF THE FOREGOING, A PROSPECTIVE INVESTOR MAY COMMIT TO PURCHASE CERTIFICATES THAT HAVE CHARACTERISTICS THAT MAY CHANGE, AND EACH PROSPECTIVE INVESTOR IS ADVISED THAT ALL OR A PORTION OF THE CERTIFICATES REFERRED TO IN THESE MATERIALS MAY BE ISSUED WITHOUT ALL OR CERTAIN OF THE CHARACTERISTICS DESCRIBED IN THESE MATERIALS. EACH UNDERWRITER’S OBLIGATION TO SELL CERTIFICATES TO ANY PROSPECTIVE INVESTOR IS CONDITIONED ON THE CERTIFICATES AND THE TRANSACTION HAVING THE CHARACTERISTICS DESCRIBED IN THESE MATERIALS. IF THE UNDERWRITERS DETERMINE THAT A CONDITION IS NOT SATISFIED IN ANY MATERIAL RESPECT, SUCH PROSPECTIVE INVESTOR WILL BE NOTIFIED, AND NEITHER THE DEPOSITOR NOR THE UNDERWRITERS WILL HAVE ANY OBLIGATION TO SUCH PROSPECTIVE INVESTOR TO DELIVER ANY PORTION OF THE CERTIFICATES THAT SUCH PROSPECTIVE INVESTOR HAS COMMITTED TO PURCHASE, AND THERE WILL BE NO LIABILITY OR OBLIGATION BETWEEN THE UNDERWRITERS, THE DEPOSITOR OR ANY OF THEIR RESPECTIVE AGENTS OR AFFILIATES, ON THE ONE HAND, AND SUCH PROSPECTIVE INVESTOR, ON THE OTHER HAND, AS A CONSEQUENCE OF THE NON-DELIVERY.
THE UNDERWRITERS MAY FROM TIME TO TIME PERFORM INVESTMENT BANKING SERVICES FOR, OR SOLICIT INVESTMENT BANKING BUSINESS FROM, ANY COMPANY NAMED IN THESE MATERIALS. THE UNDERWRITERS AND/OR THEIR AFFILIATES OR RESPECTIVE EMPLOYEES MAY FROM TIME TO TIME HAVE A LONG OR SHORT POSITION IN ANY CERTIFICATE OR CONTRACT DISCUSSED IN THESE MATERIALS.
THE INFORMATION IN THIS STRUCTURAL AND COLLATERAL TERM SHEET IS NOT COMPLETE AND MAY BE AMENDED PRIOR TO THE TIME OF SALE. THIS TERM SHEET IS NOT AN OFFER TO SELL THESE SECURITIES AND IT IS NOT A SOLICITATION OF AN OFFER TO BUY THESE SECURITIES IN ANY JURISDICTION WHERE THE OFFER OR SALE IS NOT PERMITTED.
 | 1 of 124 |  |
| Structural and Collateral Term Sheet | JPMBB 2014-C24 |
| Indicative Capital Structure |
Publicly Offered Certificates
| Class | Expected Ratings (Moody’s / Fitch / KBRA) | Approximate Initial Certificate Balance or Notional Amount(1) | Approximate Initial Credit Support(2) | Expected Weighted Avg. Life (years)(3) | Expected Principal Window(3) | Certificate Principal to Value Ratio(4) | Underwritten NOI Debt Yield(5) | |
| A-1 | Aaa(sf) / AAAsf / AAA(sf) | $35,864,000 | 30.000% | 2.97 | 11/14-9/19 | 44.7% | 14.4% | |
| A-2 | Aaa(sf) / AAAsf / AAA(sf) | $184,014,000 | 30.000% | 4.95 | 9/19-11/19 | 44.7% | 14.4% | |
| A-3 | Aaa(sf) / AAAsf / AAA(sf) | $41,040,000 | 30.000% | 6.94 | 7/21-10/21 | 44.7% | 14.4% | |
| A-4A1 | Aaa(sf) / AAAsf / AAA(sf) | $190,000,000 | 30.000% | 9.82 | 7/24-9/24 | 44.7% | 14.4% | |
| A-5 | Aaa(sf) / AAAsf / AAA(sf) | $297,354,000 | 30.000% | 9.93 | 9/24-10/24 | 44.7% | 14.4% | |
| A-SB | Aaa(sf) / AAAsf / AAA(sf) | $66,649,000 | 30.000% | 7.42 | 9/19-7/24 | 44.7% | 14.4% | |
| X-A | Aa1(sf) / AAAsf / AAA(sf) | $966,200,000(6) | N/A | N/A | N/A | N/A | N/A | |
| X-B | NR / BBB-sf / AAA(sf) | $204,999,000(6) | N/A | N/A | N/A | N/A | N/A | |
A-S(7)(8) | Aa1(sf) / AAAsf / AAA(sf) | $76,279,000 | 24.000% | 9.98 | 10/24-10/24 | 48.5% | 13.3% | |
B(7)(8) | Aa3(sf) / AA-sf / AA-(sf) | $76,278,000 | 18.000% | 9.98 | 10/24-10/24 | 52.3% | 12.3% | |
C(7)(8) | A3(sf) / A-sf / A-(sf) | $47,675,000 | 14.250% | 9.98 | 10/24-10/24 | 54.7% | 11.8% | |
EC(7)(8)(9) | A1(sf) / A-sf / A-(sf) | $200,232,000 | 14.250% | 9.98 | 10/24-10/24 | 54.7% | 11.8% | |
Privately Offered Certificates(10)
| Class | Expected Ratings (Moody’s / Fitch / KBRA) | Approximate Initial Certificate Balance or Notional Amount(1) | Approximate Initial Credit Support(2) | Expected Weighted Avg. Life (years)(3) | Expected Principal Window(3) | Certificate Principal to Value Ratio(4) | Underwritten NOI Debt Yield(5) | |
| A-4A2 | Aaa(sf) / AAAsf / AAA(sf) | $75,000,000 | 30.000% | 9.82 | 7/24-9/24 | 44.7% | 14.4% | |
| X-C | NR / BBsf / BB(sf) | $25,426,000(6) | N/A | N/A | N/A | N/A | N/A | |
| X-D | NR / Bsf / B+(sf) | $14,303,000(6) | N/A | N/A | N/A | N/A | N/A | |
| X-E | NR / NR / NR | $60,387,147(6) | N/A | N/A | N/A | N/A | N/A | |
| D | NR / BBB-sf / BBB-(sf) | $81,046,000 | 7.875% | 9.98 | 10/24-10/24 | 58.8% | 11.0% | |
| E | NR / BBsf / BB(sf) | $25,426,000 | 5.875% | 9.98 | 10/24-10/24 | 60.1% | 10.7% | |
| F | NR / Bsf / B+(sf) | $14,303,000 | 4.750% | 9.98 | 10/24-10/24 | 60.8% | 10.6% | |
| NR | NR / NR / NR | $60,387,147 | 0.000% | 10.36 | 10/24-10/25 | 63.8% | 10.1% | |
Privately Offered Loan-Specific Certificates
| Class | Expected Ratings (Moody’s / Fitch / KBRA) | Approximate Initial Certificate Balance(1) | Approximate Initial Credit Support(2) | Expected Weighted Avg. Life (years)(3) | Expected Principal Window(3) | Certificate Principal to Value Ratio(4) | Underwritten NOI Debt Yield(5) |
ESK(11) | NR / NR / NR | $5,000,000 | 0.000% | 4.89 | 11/15-10/19 | N/A | N/A |
| (1) | In the case of each such Class, subject to a permitted variance of plus or minus 5%. |
| (2) | The credit support percentages set forth for Class A-1, Class A-2, Class A-3, Class A-4A1, Class A-4A2, Class A-5 and Class A-SB Certificates represent the approximate initial credit support for the Class A-1, Class A-2, Class A-3, Class A-4A1, Class A-4A2, Class A-5 and Class A-SB Certificates in the aggregate. The Class ESK Certificates will not provide support to any of the certificates. |
| (3) | Assumes 0% CPR / 0% CDR and a October 22, 2014 closing date. Based on modeling assumptions as described in the Free Writing Prospectus dated October 1, 2014 (the “Free Writing Prospectus”). |
| (4) | The “Certificate Principal to Value Ratio” for any Class (other than the Class A-1, Class A-2, Class A-3, Class A-4A1, Class A-4A2, Class A-5 and Class A-SB Certificates) is calculated as the product of (a) the weighted average Cut-off Date LTV Ratio for the mortgage loans, multiplied by (b) a fraction, the numerator of which is the total initial Certificate Balance of such Class of Certificates and all Classes of Principal Balance Certificates senior to such Class of Certificates and the denominator of which is the total initial Certificate Balance of all of the Principal Balance Certificates. The Class A-1, Class A-2, Class A-3, Class A-4A1, Class A-4A2, Class A-5 and Class A-SB Certificate Principal to Value Ratios are calculated in the aggregate for those Classes as if they were a single Class. Investors should note, however, that excess mortgaged property value associated with a mortgage loan will not be available to offset losses on any other mortgage loan. |
| (5) | The “Underwritten NOI Debt Yield” for any Class (other than the Class A-1, Class A-2, Class A-3, Class A-4A1, Class A-4A2, Class A-5 and Class A-SB Certificates) is calculated as the product of (a) the weighted average UW NOI Debt Yield for the mortgage loans and (b) the total initial Certificate Balance of all of the Classes of Principal Balance Certificates divided by the total initial Certificate Balance for such Class and all Classes of Principal Balance Certificates senior to such Class of Certificates. The Underwritten NOI Debt Yield for each of the Class A-1, Class A-2, Class A-3, Class A-4A1, Class A-4A2, Class A-5 and Class A-SB Certificates is calculated in the aggregate for those Classes as if they were a single Class. Investors should note, however, that net operating income from any mortgaged property supports only the related mortgage loan and will not be available to support any other mortgage loan. |
| (6) | The Class X-A, Class X-B, Class X-C, Class X-D and Class X-E Notional Amounts are defined in the Free Writing Prospectus. |
| (7) | A holder of Class A-S, Class B and Class C Certificates (the “Exchangeable Certificates”) may exchange such Classes of Certificates (on an aggregate basis) for a related amount of Class EC Certificates, and Class EC Certificates may be exchanged for a ratable portion of each class of Exchangeable Certificates. |
| (8) | The initial Certificate Balance of a Class of Exchangeable Certificates represents the principal balance of such Class without giving effect to any exchange. The initial Certificate Balance of the Class EC Certificates is equal to the aggregate of the initial Certificate Balances of the Exchangeable Certificates and represents the maximum principal balance of such Class that could be issued in an exchange. See “Exchangeable Certificates and the Class EC Certificates” below. |
| (9) | Although the Class EC Certificates are listed below the Class C Certificates in the chart, the Class EC Certificates’ payment entitlements and subordination priority will be a result of the payment entitlements and subordination priority at each level of the related component classes of Class A-S, Class B and Class C Certificates. For purposes of determining the Approximate Initial Credit Support, Certificate Principal to Value Ratio and Underwritten NOI Debt Yield for Class EC Certificates, the calculation is based on the aggregate initial Certificate Balance of Class A-S, Class B and Class C Certificates as if they were a single class. |
| (10) | The Class R Certificates are not shown above. |
| (11) | The Embassy Suites Kennesaw Mortgage Loan, which has a principal balance of $29,500,000 (the “Embassy Suites Kennesaw Mortgage Loan”), is secured by the same mortgage instrument on the same related mortgaged property as a trust subordinate companion loan with a principal balance of $5,000,000 (the “ESK Companion Loan” and, together with the Embassy Suites Kennesaw Mortgage Loan, the “Embassy Suites Kennesaw Whole Loan”). The Class ESK Certificates will only receive distributions from, and only incur losses with respect to, the ESK Companion Loan. |
THE INFORMATION IN THIS STRUCTURAL AND COLLATERAL TERM SHEET IS NOT COMPLETE AND MAY BE AMENDED PRIOR TO THE TIME OF SALE. THIS TERM SHEET IS NOT AN OFFER TO SELL THESE SECURITIES AND IT IS NOT A SOLICITATION OF AN OFFER TO BUY THESE SECURITIES IN ANY JURISDICTION WHERE THE OFFER OR SALE IS NOT PERMITTED.
| 2 of 124 | |
| Structural and Collateral Term Sheet | JPMBB 2014-C24 |
Summary of Transaction Terms |
| Securities Offered: | $1,015,153,000 monthly pay, multi-class, commercial mortgage REMIC Pass-Through Certificates. | |
| Co-Lead Managers and Joint Bookrunners: | J.P. Morgan Securities LLC and Barclays Capital Inc. | |
| Co-Managers: | Credit Suisse Securities (USA) LLC and KeyBanc Capital Markets Inc. | |
| Mortgage Loan Sellers: | JPMorgan Chase Bank, National Association (“JPMCB”) (36.8%), Barclays Bank PLC (“Barclays”) (27.3%), KeyBank National Association (“KeyBank”) (15.5%), JPMCB/Column Financial, Inc. (“JPMCB/CFI”) (9.0%), RAIT Funding, LLC (“RAIT”) (6.2%), Barclays/RAIT (2.8%), and General Electric Capital Corporation (“GECC”) (2.4%). | |
| Master Servicer: | Wells Fargo Bank, National Association (“Wells Fargo”). | |
| Special Servicer: | LNR Partners, LLC. | |
| Directing Certificateholder: | An entity affiliated with Raith Capital Management, LLC and Alliance Bernstein L.P. | |
| Trustee: | Wilmington Trust, National Association. | |
| Certificate Administrator: | Wells Fargo Bank, National Association. | |
| Senior Trust Advisor: | Pentalpha Surveillance LLC. | |
| Rating Agencies: | Moody’s Investors Service, Inc. (“Moody’s”), Fitch Ratings, Inc. (“Fitch”) and Kroll Bond Rating Agency, Inc. (“KBRA”). | |
| Pricing Date: | On or about October 8, 2014. | |
| Closing Date: | On or about October 22, 2014. | |
| Cut-off Date: | With respect to each mortgage loan, the related due date in October 2014, or with respect to any mortgage loan that has its first due date in November 2014, the date that would otherwise have been the related due date in October 2014. | |
| Distribution Date: | The 4th business day after the Determination Date in each month, commencing in November 2014. | |
| Determination Date: | 11th day of each month, or if the 11th day is not a business day, the next succeeding business day, commencing in November 2014. | |
| Assumed Final Distribution Date: | The Distribution Date in October 2025, which is the latest anticipated repayment date of the Certificates. | |
| Rated Final Distribution Date: | The Distribution Date in November 2047. | |
| Tax Treatment: | The Publicly Offered Certificates are expected to be treated as REMIC regular interests for U.S. federal income tax purposes. | |
| Form of Offering: | The Class A-1, Class A-2, Class A-3, Class A-4A1, Class A-5, Class A-SB, Class X-A, Class X-B, Class A-S, Class B, Class C and Class EC Certificates will be offered publicly (the “Publicly Offered Certificates”). The Class A-4A2, Class X-C, Class X-D, Class X-E, Class D, Class E, Class F, Class NR, Class ESK and Class R Certificates (the “Privately Offered Certificates”) will be offered domestically to Qualified Institutional Buyers (other than with respect to the Class ESK Certificates) and to Institutional Accredited Investors and to institutions that are not U.S. Persons pursuant to Regulation S. | |
| SMMEA Status: | The Certificates will not constitute “mortgage related securities” for purposes of SMMEA. | |
| ERISA: | The Publicly Offered Certificates are expected to be ERISA eligible. | |
| Optional Termination: | 1.0% clean-up call (however, if the Motorola Solutions – Building I & III loan or the related REO loan is part of the trust, 1.81% clean-up call but not earlier than the distribution date in November 2024). | |
| Minimum Denominations: | The Publicly Offered Certificates (other than the Class X-A and Class X-B Certificates) will be issued in minimum denominations of $10,000 and integral multiples of $1 in excess of $10,000. The Class X-A and Class X-B Certificates will be issued in minimum denominations of $1,000,000 and in integral multiples of $1 in excess of $1,000,000. | |
| Settlement Terms: | DTC, Euroclear and Clearstream Banking. | |
| Analytics: | The transaction is expected to be modeled by Intex Solutions, Inc. and Trepp, LLC and is expected to be available on Bloomberg. | |
| Risk Factors: | THE CERTIFICATES INVOLVE CERTAIN RISKS AND MAY NOT BE SUITABLE FOR ALL INVESTORS. SEE THE “RISK FACTORS” SECTION OF THE FREE WRITING PROSPECTUS. |
THE INFORMATION IN THIS STRUCTURAL AND COLLATERAL TERM SHEET IS NOT COMPLETE AND MAY BE AMENDED PRIOR TO THE TIME OF SALE. THIS TERM SHEET IS NOT AN OFFER TO SELL THESE SECURITIES AND IT IS NOT A SOLICITATION OF AN OFFER TO BUY THESE SECURITIES IN ANY JURISDICTION WHERE THE OFFER OR SALE IS NOT PERMITTED.
| 3 of 124 | |
| Structural and Collateral Term Sheet | JPMBB 2014-C24 |
Collateral Characteristics |
| Loan Pool | |||
Initial Pool Balance (“IPB”): | |||
| Number of Mortgage Loans: | |||
| Number of Mortgaged Properties: | |||
| Average Cut-off Date Balance per Mortgage Loan: | $23,542,873 | ||
| Weighted Average Current Mortgage Rate: | 4.44283% | ||
| 10 Largest Mortgage Loans as % of IPB: | 59.8% | ||
Weighted Average Remaining Term to Maturity(1): | 109 months | ||
| Weighted Average Seasoning: | 1 month | ||
| Credit Statistics | |||
Weighted Average UW NCF DSCR(2)(3): | 1.80x | ||
Weighted Average UW NOI Debt Yield(2): | 10.1% | ||
Weighted Average Cut-off Date Loan-to-Value Ratio (“LTV”)(2)(4): | 63.8% | ||
Weighted Average Maturity Date LTV(1)(2)(4): | 58.3% | ||
| Other Statistics | |||
| % of Mortgage Loans with Additional Debt: | 15.3% | ||
| % of Mortgaged Properties with Single Tenants: | 11.7% | ||
| Amortization | |||
Weighted Average Original Amortization Term(5): | 363 months | ||
Weighted Average Remaining Amortization Term(5): | 363 months | ||
| % of Mortgage Loans with Partial Interest-Only followed by Amortizing Balloon: | 49.8% | ||
| % of Mortgage Loans with Interest-Only: | 28.7% | ||
| % of Mortgage Loans with Amortizing Balloon: | 17.9% | ||
| % of Mortgage Loans with Amortizing Balloon followed by ARD-Structure: | 2.7% | ||
| % of Mortgage Loans with Partial Interest-Only followed by Amortizing Balloon followed by ARD-Structure: | 0.6% | ||
| % of Mortgage Loans with Fully Amortizing: | 0.2% | ||
Cash Management(6) | |||
| % of Mortgage Loans with In-Place, CMA Lockboxes: | 54.6% | ||
| % of Mortgage Loans with In-Place, Hard Lockboxes: | 28.6% | ||
| % of Mortgage Loans with Springing Lockboxes: | 16.2% | ||
| % of Mortgage Loans with No Lockbox: | 0.7% | ||
| Reserves | |||
| % of Mortgage Loans Requiring Monthly Tax Reserves: | 70.5% | ||
| % of Mortgage Loans Requiring Monthly Insurance Reserves: | 35.8% | ||
% of Mortgage Loans Requiring Monthly CapEx Reserves(7): | 60.4% | ||
% of Mortgage Loans Requiring Monthly TI/LC Reserves(8): | 39.5% | ||
| (1) | In the case of the four mortgage loans with anticipated repayment dates, as of the related anticipated repayment date. |
| (2) | In the case of Loan Nos. 1, 3, 6, 10 and 13 the UW NCF DSCR, UW NOI Debt Yield, Cut-off Date LTV and Maturity Date LTV calculations include the related Pari Passu Companion Loan(s). In the case of Loan No. 14, the UW NCF DSCR, UW NOI Debt Yield, Cut-off Date LTV and Maturity Date LTV calculations exclude the related ESK Companion Loan. |
| (3) | In the case of Loan No. 14, the UW NCF DSCR is calculated using the average of principal and interest payments over the first 12 months following the initial interest only period based on the principal payment schedule provided on Annex F of the Free Writing Prospectus. |
| (4) | In the case of Loan Nos. 5, 17, 29 and 41, the Cut-off Date LTV and the Maturity Date LTV are calculated based upon a hypothetical appraised value based on certain assumptions. See “Description of the Mortgage Pool – Assessments of Property Value and Condition” in the Free Writing Prospectus for additional details. |
| (5) | Excludes six mortgage loans that are interest-only for the entire term. |
| (6) | For a detailed description of Cash Management, see “Description of the Mortgage Pool – Lockbox Accounts” in the Free Writing Prospectus. |
| (7) | CapEx Reserves include FF&E reserves for hotel properties. |
| (8) | Calculated only with respect to Cut-off Date Balance for retail, industrial, office and mixed use properties. |
THE INFORMATION IN THIS STRUCTURAL AND COLLATERAL TERM SHEET IS NOT COMPLETE AND MAY BE AMENDED PRIOR TO THE TIME OF SALE. THIS TERM SHEET IS NOT AN OFFER TO SELL THESE SECURITIES AND IT IS NOT A SOLICITATION OF AN OFFER TO BUY THESE SECURITIES IN ANY JURISDICTION WHERE THE OFFER OR SALE IS NOT PERMITTED.
| 4 of 124 | |
| Structural and Collateral Term Sheet | JPMBB 2014-C24 |
Collateral Characteristics |
Mortgage Loan Seller | Number of Mortgage Loans | Number of Mortgaged Properties | Aggregate Cut-off Date Balance | % of IPB | ||||
| JPMCB | 12 | 12 | $468,121,365 | 36.8% | ||||
| Barclays | 13 | 14 | 347,165,370 | 27.3 | ||||
| KeyBank | 17 | 19 | 197,032,699 | 15.5 | ||||
JPMCB/CFI(1) | 1 | 1 | 115,000,000 | 9.0 | ||||
| RAIT | 9 | 14 | 78,995,714 | 6.2 | ||||
Barclays/RAIT(2) | 1 | 2 | 35,000,000 | 2.8 | ||||
| GECC | 1 | 2 | 30,000,000 | 2.4 | ||||
| Total: | 54 | 64 | $1,271,315,148 | 100.0% | ||||
| (1) | JPMorgan Chase Bank, National Association and Column Financial, Inc. co-originated one mortgage loan, identified as “Grapevine Mills” on Annex A-1 to the Free Writing Prospectus, and each is selling a note in a principal amount that represents 50% of the outstanding principal amount of the mortgage loan to the trust. All references to “Grapevine Mills” refer to the total mortgage loan sold to the trust. |
| (2) | Barclays Bank PLC and RAIT Funding, LLC co-originated one mortgage loan, identified as “Oakland Square and Oakland Plaza” on Annex A-1 to the Free Writing Prospectus, and each is selling a note in a principal amount that represents 50% of the outstanding principal amount of the mortgage loan to the trust. All references to “Oakland Square and Oakland Plaza” refer to the total mortgage loan sold to the trust. |
| Ten Largest Mortgage Loans |
| No. | Loan Name | Mortgage Loan Seller | No. of Prop. | Cut-off Date Balance | % of IPB | SF/Units/ Rooms | Property Type | UW NCF DSCR(1) | UW NOI Debt Yield(1) | Cut-off Date LTV(1) | Maturity Date LTV(1) |
| 1 | Grapevine Mills | JPMCB / Column | 1 | $115,000,000 | 9.0% | 1,337,751 | Retail | 3.34x | 13.7% | 53.1% | 53.1% |
| 2 | The Mall of Victor Valley | JPMCB | 1 | $115,000,000 | 9.0% | 477,384 | Retail | 2.32x | 9.8% | 62.8% | 62.8% |
| 3 | Columbus Square Portfolio | Barclays | 1 | $96,250,000 | 7.6% | 494,224 | Mixed Use | 1.15x | 6.7% | 72.1% | 66.1% |
| 4 | 635 Madison Avenue | JPMCB | 1 | $90,000,000 | 7.1% | 177,262 | Mixed Use | 1.44x | 9.1% | 46.2% | 42.2% |
| 5 | Hutch Tower Two | KeyBank | 1 | $80,500,000 | 6.3% | 278,133 | Office | 1.53x | 9.4% | 68.8% | 60.3% |
| 6 | 17 State Street | JPMCB | 1 | $75,000,000 | 5.9% | 560,210 | Office | 1.79x | 8.4% | 55.4% | 55.4% |
| 7 | North Riverside Park Mall | Barclays | 1 | $75,000,000 | 5.9% | 429,038 | Retail | 1.47x | 9.9% | 58.1% | 53.6% |
| 8 | NoBu Station | JPMCB | 1 | $42,000,000 | 3.3% | 474 | Multifamily | 1.23x | 7.6% | 77.8% | 71.0% |
| 9 | Meridian Corporate Center I | Barclays | 1 | $36,261,000 | 2.9% | 320,085 | Office | 2.52x | 11.6% | 68.3% | 68.3% |
| 10 | Hilton Houston Post Oak | JPMCB | 1 | $35,000,000 | 2.8% | 448 | Hotel | 1.97x | 11.9% | 63.4% | 55.5% |
| Top 3 Total / Weighted Average | 3 | $326,250,000 | 25.7% | 2.33x | 10.3% | 62.1% | 60.4% | ||||
| Top 5 Total / Weighted Average | 5 | $496,750,000 | 39.1% | 2.04x | 9.9% | 60.3% | 57.1% | ||||
| Top 10 Total / Weighted Average | 10 | $760,011,000 | 59.8% | 1.94x | 9.8% | 61.1% | 57.8% | ||||
| (1) | In the case of Loan Nos. 1, 3, 6 and 10 the UW NCF DSCR, UW NOI Debt Yield, Cut-off Date LTV and Maturity Date LTV calculations include the related Pari Passu Companion Loan(s). |
| Pari Passu Note Loan Summary | |||||||||||||
No. | Loan Name | Trust Cut-off Date Balance | Pari Passu Loan Cut-off Date Balance | Total Mortgage Loan Cut-off Date Balance | Controlling Pooling & Servicing Agreement | Master Servicer | Special Servicer | Voting Rights | |||||
| 1 | Grapevine Mills | $115,000,000 | $153,000,000 | $268,000,000 | JPMBB 2014-C23 | Wells Fargo | CWCapital | JPMBB 2014-C23 | |||||
| 3 | Columbus Square Portfolio | $96,250,000 | $303,750,000 | $400,000,000 | WFRBS 2014-C22 | Wells Fargo | CWCapital | WFRBS 2014-C22 | |||||
| 6 | 17 State Street | $75,000,000 | $105,000,000 | $180,000,000 | JPMBB 2014-C23 | Wells Fargo | CWCapital | JPMBB 2014-C23 | |||||
| 10 | Hilton Houston Post Oak | $35,000,000 | $45,000,000 | $80,000,000 | JPMBB 2014-C24 | Wells Fargo | LNR | JPMBB 2014-C24 | |||||
| 13 | Canyon Ranch Portfolio | $30,000,000 | $120,000,000 | $150,000,000 | COMM 2014-UBS5 | Wells Fargo | Rialto | COMM 2014-UBS5 | |||||
| ESK Companion Loan Summary |
| Trust Subordinate | Mortgage | Mortgage | Whole | Mortgage | ||||||
| Mortgage | Companion | Whole | Loan | Whole | Loan | Loan | Loan | Whole | ||
| Loan | Loan | Loan | UW | Loan | Cut-off | Cut-off | UW NOI | Loan | ||
| Cut-off Date | Cut-off Date | Cut-off Date | NCF | UW NCF | Date | Date | Debt | UW NOI | ||
| No. | Loan Name | Balance | Balance | Balance | DSCR | DSCR | LTV | LTV | Yield | Debt Yield |
| 14 | Embassy Suites Kennesaw(1) | $29,500,000 | $5,000,000 | $34,500,000 | 1.60x | 1.24x | 67.4% | 78.8% | 10.6% | 9.1% |
| (1) | The Class ESK Certificates, which are backed by the ESK Companion Loan of the Embassy Suites Kennesaw Whole Loan, are expected to be sold to a third party investor. |
THE INFORMATION IN THIS STRUCTURAL AND COLLATERAL TERM SHEET IS NOT COMPLETE AND MAY BE AMENDED PRIOR TO THE TIME OF SALE. THIS TERM SHEET IS NOT AN OFFER TO SELL THESE SECURITIES AND IT IS NOT A SOLICITATION OF AN OFFER TO BUY THESE SECURITIES IN ANY JURISDICTION WHERE THE OFFER OR SALE IS NOT PERMITTED.
| 5 of 124 | |
| Structural and Collateral Term Sheet | JPMBB 2014-C24 |
Collateral Characteristics |
Additional Debt Summary(1) |
No. | Loan Name | Trust Cut-off Date Balance | Subordinate Debt Cut-off Date Balance | Total Debt Cut-off Date Balance | Mortgage Loan UW NCF DSCR | Total Debt UW NCF DSCR | Mortgage Loan Cut-off Date LTV | Total Debt Cut-off Date LTV | Mortgage Loan UW NOI Debt Yield | Total Debt UW NOI Debt Yield |
| 4 | 635 Madison Avenue | $90,000,000 | $35,000,000 | $125,000,000 | 1.44x | 0.98x | 46.2% | 64.1% | 9.1% | 6.6% |
| 6 | 17 State Street(2) | $75,000,000 | $40,000,000 | $220,000,000 | 1.79x | 1.24x | 55.4% | 67.7% | 8.4% | 6.9% |
| (1) | In the case of Loan Nos. 4 and 6, subordinate debt represents mezzanine loans. |
| (2) | In the case of Loan No. 6, Mortgage Loan UW NCF DSCR, Mortgage Loan UW NOI Debt Yield and Mortgage Loan Cut-Off Date LTV calculations include the related Pari Passu Companion Loan. |
THE INFORMATION IN THIS STRUCTURAL AND COLLATERAL TERM SHEET IS NOT COMPLETE AND MAY BE AMENDED PRIOR TO THE TIME OF SALE. THIS TERM SHEET IS NOT AN OFFER TO SELL THESE SECURITIES AND IT IS NOT A SOLICITATION OF AN OFFER TO BUY THESE SECURITIES IN ANY JURISDICTION WHERE THE OFFER OR SALE IS NOT PERMITTED.
| 6 of 124 | |
| Structural and Collateral Term Sheet | JPMBB 2014-C24 |
Collateral Characteristics |
Mortgaged Properties by Type(1) |
| Weighted Average | ||||||||||
| Property Type | Property Subtype | Number of Properties | Cut-off Date Principal Balance | % of IPB | Occupancy | UW NCF DSCR(2)(3) | UW NOI DY(3) | Cut-off Date LTV(3)(4) | Maturity Date LTV(3)(4)(5) | |
| Retail | Regional Mall | 3 | $305,000,000 | 24.0% | 91.6% | 2.50x | 11.3% | 58.0% | 56.9% | |
| Anchored | 11 | 108,638,054 | 8.5 | 93.3% | 1.46x | 10.2% | 70.8% | 62.1% | ||
| Single Tenant | 3 | 10,650,000 | 0.8 | 100.0% | 1.77x | 11.1% | 54.6% | 47.6% | ||
| Shadow Anchored | 1 | 10,649,704 | 0.8 | 100.0% | 1.45x | 9.3% | 74.1% | 64.8% | ||
| Freestanding | 5 | 8,345,125 | 0.7 | 100.0% | 1.26x | 10.7% | 68.7% | 43.8% | ||
| Subtotal | 23 | $443,282,882 | 34.9% | 92.6% | 2.18x | 11.0% | 61.6% | 57.9% | ||
| Office | Suburban | 5 | $112,687,000 | 8.9% | 94.2% | 1.96x | 11.0% | 70.2% | 65.0% | |
| CBD | 3 | 104,000,000 | 8.2 | 90.2% | 1.66x | 8.7% | 58.7% | 56.0% | ||
| Medical | 2 | 83,790,000 | 6.6 | 100.0% | 1.53x | 9.4% | 68.6% | 60.3% | ||
| Subtotal | 10 | $300,477,000 | 23.6% | 94.4% | 1.74x | 9.8% | 65.8% | 60.6% | ||
| Mixed Use | Retail/Office/Parking | 1 | $96,250,000 | 7.6% | 95.7% | 1.15x | 6.7% | 72.1% | 66.1% | |
| Office/Retail | 1 | 90,000,000 | 7.1 | 94.4% | 1.44x | 9.1% | 46.2% | 42.2% | ||
| Subtotal | 2 | $186,250,000 | 14.7% | 95.1% | 1.29x | 7.9% | 59.6% | 54.6% | ||
| Hotel | Full Service | 6 | $131,000,000 | 10.3% | 73.9% | 1.95x | 12.2% | 60.8% | 53.7% | |
| Limited Service | 2 | 10,387,282 | 0.8 | 79.8% | 1.74x | 11.8% | 62.1% | 54.8% | ||
| Subtotal | 8 | $141,387,282 | 11.1% | 74.3% | 1.94x | 12.2% | 60.9% | 53.7% | ||
| Multifamily | Garden | 7 | $139,837,751 | 11.0% | 96.8% | 1.36x | 8.5% | 73.1% | 64.8% | |
| Subtotal | 7 | $139,837,751 | 11.0% | 96.8% | 1.36x | 8.5% | 73.1% | 64.8% | ||
| Industrial | Warehouse | 3 | $18,491,557 | 1.5% | 100.0% | 1.52x | 9.4% | 68.8% | 58.2% | |
| Flex | 2 | 10,491,400 | 0.8 | 89.2% | 1.46x | 11.6% | 63.6% | 53.5% | ||
| Subtotal: | 5 | $28,982,957 | 2.3% | 96.1% | 1.50x | 10.2% | 66.9% | 56.5% | ||
| Manufactured Housing | Manufactured Housing | 5 | $16,050,000 | 1.3% | 89.2% | 1.74x | 11.5% | 70.6% | 55.9% | |
| Self Storage | Self Storage | 4 | $15,047,275 | 1.2% | 87.6% | 1.59x | 10.1% | 69.2% | 59.4% | |
| Total/Weighted Average: | 64 | $1,271,315,148 | 100.0% | 91.8% | 1.80x | 10.1% | 63.8% | 58.3% | ||
| (1) | Because this table presents information relating to the mortgaged properties and not mortgage loans, the information for mortgage loans secured by more than one mortgaged property is based on allocated loan amounts. |
| (2) | In the case of Loan No. 14, the UW NCF DSCR is calculated using the average of principal and interest payments over the first 12 months following the initial interest only period based on the assumed principal payment schedule provided on Annex F of the Free Writing Prospectus. |
| (3) | In the case of the Loan Nos. 1, 3, 6, 10 and 13, the UW NCF DSCR, UW NOI DY, Cut-off Date LTV and Maturity Date LTV calculations include the related Pari Passu Companion Loan(s). In the case of Loan No. 14, the UW NCF DSCR, UW NOI DY, Cut-off Date LTV and Maturity Date LTV calculations exclude the ESK Companion Loan. |
| (4) | In the case of Loan Nos. 5, 17, 29 and 41, the Cut-off Date LTV and the Maturity Date LTV are calculated based upon a hypothetical appraised value based on certain assumptions. See “Description of the Mortgage Pool – Assessments of Property Value and Condition” in the Free Writing Prospectus for additional details. |
| (5) | In the case of Loan Nos. 17, 32, 39 and 42, which have anticipated repayment dates, Maturity Date LTV is as of the related anticipated repayment date. |
THE INFORMATION IN THIS STRUCTURAL AND COLLATERAL TERM SHEET IS NOT COMPLETE AND MAY BE AMENDED PRIOR TO THE TIME OF SALE. THIS TERM SHEET IS NOT AN OFFER TO SELL THESE SECURITIES AND IT IS NOT A SOLICITATION OF AN OFFER TO BUY THESE SECURITIES IN ANY JURISDICTION WHERE THE OFFER OR SALE IS NOT PERMITTED.
| 7 of 124 | |
| Structural and Collateral Term Sheet | JPMBB 2014-C24 |
Collateral Characteristics |
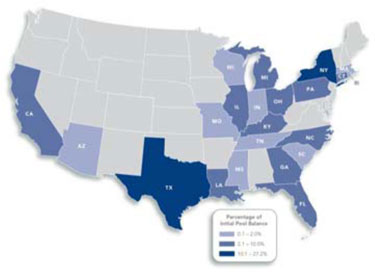
Mortgaged Properties by Location(1) | |||||||||
Weighted Average | |||||||||
State | Number of Properties | Cut-off Date Principal Balance | % of IPB | Occupancy | UW NCF DSCR(2)(3) | UW NOI DY(3) | Cut-off Date LTV(3)(4) | Maturity Date LTV(3)(4)(5) | |
| New York | 5 | $345,341,400 | 27.2% | 95.3% | 1.46x | 8.4% | 61.0% | 56.1% | |
| Texas | 7 | 244,133,168 | 19.2 | 89.7% | 2.37x | 11.4% | 62.9% | 58.7% | |
| California | 3 | 123,189,760 | 9.7 | 96.2% | 2.27x | 9.7% | 63.2% | 62.7% | |
| Illinois | 1 | 75,000,000 | 5.9 | 94.1% | 1.47x | 9.9% | 58.1% | 53.6% | |
| North Carolina | 4 | 69,678,557 | 5.5 | 90.2% | 2.30x | 11.8% | 68.3% | 66.2% | |
| Ohio | 11 | 64,418,022 | 5.1 | 88.8% | 1.50x | 9.9% | 70.9% | 61.5% | |
| Florida | 3 | 50,518,000 | 4.0 | 95.7% | 1.31x | 9.3% | 69.6% | 57.9% | |
| Michigan | 4 | 42,900,000 | 3.4 | 93.6% | 1.59x | 11.2% | 68.2% | 60.9% | |
| Pennsylvania | 3 | 31,961,365 | 2.5 | 89.9% | 1.32x | 10.1% | 66.0% | 52.2% | |
| Georgia | 1 | 29,500,000 | 2.3 | 78.3% | 1.60x | 10.6% | 67.4% | 64.1% | |
| Connecticut | 2 | 28,300,000 | 2.2 | 96.8% | 1.60x | 10.9% | 70.9% | 64.8% | |
| Louisiana | 2 | 26,790,000 | 2.1 | 78.6% | 1.99x | 13.2% | 58.8% | 44.8% | |
| Kentucky | 2 | 26,095,106 | 2.1 | 94.5% | 1.60x | 10.2% | 61.6% | 55.2% | |
| Indiana | 4 | 25,350,000 | 2.0 | 93.8% | 1.48x | 9.8% | 72.2% | 62.6% | |
| Arizona | 2 | 21,490,092 | 1.7 | 63.0% | 2.24x | 13.1% | 54.6% | 49.8% | |
| Rhode Island | 1 | 18,475,505 | 1.5 | 97.9% | 1.32x | 8.2% | 74.5% | 60.3% | |
| Wisconsin | 2 | 15,183,281 | 1.2 | 95.7% | 1.46x | 10.4% | 70.4% | 57.4% | |
| Tennessee | 3 | 14,973,532 | 1.2 | 86.1% | 1.72x | 11.1% | 66.2% | 59.1% | |
| Massachusetts | 1 | 11,059,908 | 0.9 | 58.9% | 2.34x | 13.6% | 53.2% | 48.4% | |
| South Carolina | 1 | 3,621,078 | 0.3 | 97.7% | 1.57x | 10.8% | 71.8% | 58.5% | |
| Mississippi | 1 | 2,040,000 | 0.2 | 100.0% | 1.49x | 9.8% | 64.7% | 60.5% | |
| Missouri | 1 | 1,296,373 | 0.1 | 100.0% | 1.31x | 8.4% | 76.3% | 67.7% | |
| Total/Weighted Average: | 64 | $1,271,315,148 | 100.0% | 91.8% | 1.80x | 10.1% | 63.8% | 58.3% | |
| (1) | Because this table presents information relating to the mortgaged properties and not mortgage loans, the information for mortgage loans secured by more than one mortgaged property is based on allocated loan amounts. |
| (2) | In the case of Loan No. 14, the UW NCF DSCR is calculated using the average of principal and interest payments over the first 12 months following the initial interest only period based on the assumed principal payment schedule provided on Annex F of the Free Writing Prospectus. |
| (3) | In the case of Loan Nos. 1, 3, 6, 10 and 13, the UW NCF DSCR, UW NOI DY, Cut-off Date LTV and Maturity Date LTV calculations include the related Pari Passu Companion Loan(s). In the case of Loan No. 14, the UW NCF DSCR, UW NOI DY, Cut-off Date LTV and Maturity Date LTV calculations exclude the related ESK Companion Loan. |
| (4) | In the case of Loan Nos. 5, 17, 29 and 41 the Cut-off Date LTV and the Maturity Date LTV are calculated based upon a hypothetical appraised value based on certain assumptions. See “Description of the Mortgage Pool – Assessments of Property Value and Condition” in the Free Writing Prospectus for additional details. |
| (5) | In the case of Loan Nos. 17, 32, 39 and 42, which have anticipated repayment dates, the Maturity Date LTV is as of the related anticipated repayment date. |
THE INFORMATION IN THIS STRUCTURAL AND COLLATERAL TERM SHEET IS NOT COMPLETE AND MAY BE AMENDED PRIOR TO THE TIME OF SALE. THIS TERM SHEET IS NOT AN OFFER TO SELL THESE SECURITIES AND IT IS NOT A SOLICITATION OF AN OFFER TO BUY THESE SECURITIES IN ANY JURISDICTION WHERE THE OFFER OR SALE IS NOT PERMITTED.
| 8 of 124 | |
| Structural and Collateral Term Sheet | JPMBB 2014-C24 | |
| Collateral Characteristics | ||
| Cut-off Date Principal Balance |
Weighted Average | |||||||||||
| Range of Principal Balances | Number of Loans | Cut-off Date Principal Balance | % of IPB | Mortgage Rate | Remaining Loan Term(1) | UW NCF DSCR(2)(4) | UW NOI DY(2) | Cut-off Date LTV(2)(3) | Maturity Date LTV(1)(2)(3) | ||
| $2,086,249 | - | $9,999,999 | 27 | $146,359,642 | 11.5% | 4.62805% | 109 | 1.55x | 10.6% | 68.2% | 56.6% |
| $10,000,000 | - | $19,999,999 | 8 | 119,493,505 | 9.4 | 4.56765% | 113 | 1.46x | 9.8% | 69.4% | 60.7% |
| $20,000,000 | - | $24,999,999 | 4 | 90,351,000 | 7.1 | 4.34615% | 105 | 1.88x | 11.4% | 65.3% | 57.5% |
| $25,000,000 | - | $49,999,999 | 8 | 268,361,000 | 21.1 | 4.54859% | 102 | 1.70x | 10.3% | 68.9% | 62.8% |
| $50,000,000 | - | $115,000,000 | 7 | 646,750,000 | 50.9 | 4.34747% | 112 | 1.95x | 9.7% | 59.5% | 56.5% |
| Total / Weighted Average: | 54 | $1,271,315,148 | 100.0% | 4.44283% | 109 | 1.80x | 10.1% | 63.8% | 58.3% | ||
| Mortgage Interest Rates |
Weighted Average | |||||||||||
Range of Mortgage Interest Rates | Number of Loans | Cut-off Date Principal Balance | % of IPB | Mortgage Rate | Remaining Loan Term(1) | UW NCF DSCR(2)(4) | UW NOI DY(2) | Cut-off Date LTV(2)(3) | Maturity Date LTV(1)(2)(3) | ||
| 3.83270% | - | 4.40000% | 10 | $412,545,548 | 32.5% | 4.02223% | 110 | 2.40x | 11.2% | 63.3% | 61.3% |
| 4.40001% | - | 4.60000% | 22 | 567,162,586 | 44.6 | 4.50483% | 119 | 1.53x | 9.2% | 63.3% | 56.7% |
| 4.60001% | - | 4.80000% | 11 | 84,278,608 | 6.6 | 4.65966% | 114 | 1.42x | 9.9% | 68.5% | 57.9% |
| 4.80001% | - | 5.00000% | 8 | 161,328,406 | 12.7 | 4.93270% | 85 | 1.45x | 10.2% | 64.4% | 56.0% |
| 5.00001% | - | 5.49804% | 3 | 46,000,000 | 3.6 | 5.33515% | 60 | 1.63x | 10.8% | 64.5% | 60.6% |
| Total / Weighted Average: | 54 | $1,271,315,148 | 100.0% | 4.44283% | 109 | 1.80x | 10.1% | 63.8% | 58.3% | ||
Original Term to Maturity/ARD in Months(1) |
Weighted Average | |||||||||
Original Term to Maturity/ARD in Months | Number of Loans | Cut-off Date Principal Balance | % of IPB | Mortgage Rate | Remaining Loan Term(1) | UW NCF DSCR(2)(4) | UW NOI DY(2) | Cut-off Date LTV(2)(3) | Maturity Date LTV(1)(2)(3) |
| 60 | 8 | $190,740,532 | 15.0% | 4.68588% | 60 | 1.81x | 10.7% | 63.7% | 60.6% |
| 61 | 1 | 3,500,000 | 0.3 | 5.09000% | 61 | 1.87x | 13.3% | 50.0% | 44.5% |
| 84 | 3 | 44,383,760 | 3.5 | 4.92071% | 84 | 1.53x | 10.3% | 68.8% | 63.5% |
| 120 | 41 | 1,004,690,856 | 79.0 | 4.35974% | 119 | 1.82x | 10.0% | 63.4% | 57.7% |
| 132 | 1 | 28,000,000 | 2.2 | 4.93000% | 132 | 1.21x | 9.2% | 72.1% | 57.4% |
| Total / Weighted Average: | 54 | $1,271,315,148 | 100.0% | 4.44283% | 109 | 1.80x | 10.1% | 63.8% | 58.3% |
Remaining Term to Maturity/ARD in Months(1) | |||||||||
Weighted Average | |||||||||||
Remaining Term to Maturity/ARD in Months | Number of Loans | Cut-off Date Principal Balance | % of IPB | Mortgage Rate | Remaining Loan Term(1) | UW NCF DSCR(2)(4) | UW NOI DY(2) | Cut-off Date LTV(2)(3) | Maturity Date LTV(1)(2)(3) | ||
| 59 | - | 60 | 8 | $190,740,532 | 15.0% | 4.68588% | 60 | 1.81x | 10.7% | 63.7% | 60.6% |
| 61 | - | 120 | 45 | 1,052,574,616 | 82.8 | 4.38582% | 118 | 1.81x | 10.0% | 63.6% | 57.9% |
| 121 | - | 132 | 1 | 28,000,000 | 2.2 | 4.93000% | 132 | 1.21x | 9.2% | 72.1% | 57.4% |
| Total / Weighted Average: | 54 | $1,271,315,148 | 100.0% | 4.44283% | 109 | 1.80x | 10.1% | 63.8% | 58.3% | ||
| (1) | In the case of Loan Nos. 17, 32, 39 and 42, which have anticipated repayment dates, Remaining Loan Term, Original Term To Maturity/ARD, Remaining Term to Maturity/ARD and Maturity Date LTV are as of the related anticipated repayment date. |
| (2) | In the case of Loan Nos. 1, 3, 6, 10 and 13, the UW NCF DSCR, UW NOI DY, Cut-off Date LTV and Maturity Date LTV calculations include the related Pari Passu Companion Loan(s). In the case of Loan No. 14, the UW NCF DSCR, UW NOI DY, Cut-off Date LTV and Maturity Date LTV calculations exclude the related ESK Companion Loan. |
| (3) | In the case of Loan Nos. 5, 17, 29 and 41, the Cut-off Date LTV and the Maturity Date LTV are calculated based upon a hypothetical appraised value based on certain assumptions. See “Description of the Mortgage Pool – Assessments of Property Value and Condition” in the Free Writing Prospectus for additional details. |
| (4) | In the case of Loan No. 14, the UW NCF DSCR is calculated using the average of principal and interest payments over the first 12 months following the initial interest only period based on the assumed principal payment schedule provided on Annex F of the Free Writing Prospectus. |
THE INFORMATION IN THIS STRUCTURAL AND COLLATERAL TERM SHEET IS NOT COMPLETE AND MAY BE AMENDED PRIOR TO THE TIME OF SALE. THIS TERM SHEET IS NOT AN OFFER TO SELL THESE SECURITIES AND IT IS NOT A SOLICITATION OF AN OFFER TO BUY THESE SECURITIES IN ANY JURISDICTION WHERE THE OFFER OR SALE IS NOT PERMITTED.
| 9 of 124 | |
| Structural and Collateral Term Sheet | JPMBB 2014-C24 | |
| Collateral Characteristics | ||
| Original Amortization Term in Months |
Weighted Average | |||||||||
Original Amortization Term in Months | Number of Loans | Cut-off Date Principal Balance | % of IPB | Mortgage Rate | Remaining Loan Term(1) | UW NCF DSCR(2)(4) | UW NOI DY(2) | Cut-off Date LTV(2)(3) | Maturity Date LTV(1)(2)(3) |
| Interest Only | 6 | $365,387,000 | 28.7% | 4.01979% | 109 | 2.56x | 11.1% | 59.1% | 59.1% |
| 120 | 1 | 2,961,365 | 0.2 | 4.84450% | 118 | 1.17x | 15.0% | 54.8% | 0.3% |
| 300 | 4 | 38,787,282 | 3.1 | 4.57690% | 104 | 1.90x | 12.8% | 61.2% | 47.5% |
| 360 | 42 | 767,929,500 | 60.4 | 4.61985% | 108 | 1.52x | 9.9% | 65.2% | 57.7% |
| 420 | 1 | 96,250,000 | 7.6 | 4.57000% | 118 | 1.15x | 6.7% | 72.1% | 66.1% |
| Total / Weighted Average: | 54 | $1,271,315,148 | 100.0% | 4.44283% | 109 | 1.80x | 10.1% | 63.8% | 58.3% |
| Remaining Amortization Term in Months |
Weighted Average | |||||||||||
Remaining Amortization Term in Months | Number of Loans | Cut-off Date Principal Balance | % of IPB | Mortgage Rate | Remaining Loan Term(1) | UW NCF DSCR(2)(4) | UW NOI DY(2) | Cut-off Date LTV(2)(3) | Maturity Date LTV(1)(2)(3) | ||
| Interest Only | 6 | $365,387,000 | 28.7% | 4.01979% | 109 | 2.56x | 11.1% | 59.1% | 59.1% | ||
| 118 | - | 239 | 1 | 2,961,365 | 0.2 | 4.84450% | 118 | 1.17x | 15.0% | 54.8% | 0.3% |
| 240 | - | 299 | 1 | 6,887,282 | 0.5 | 4.37000% | 59 | 1.67x | 11.0% | 68.2% | 60.1% |
| 300 | - | 359 | 15 | 98,815,500 | 7.8 | 4.60889% | 114 | 1.60x | 10.8% | 69.7% | 55.9% |
| 360 | - | 420 | 31 | 797,264,000 | 62.7 | 4.61526% | 109 | 1.48x | 9.5% | 65.2% | 58.4% |
| Total / Weighted Average: | 54 | $1,271,315,148 | 100.0% | 4.44283% | 109 | 1.80x | 10.1% | 63.8% | 58.3% | ||
| Amortization Types |
Weighted Average | |||||||||
| Amortization Types | Number of Loans | Cut-off Date Principal Balance | % of IPB | Mortgage Rate | Remaining Loan Term(1) | UW NCF DSCR(2)(4) | UW NOI DY(2) | Cut-off Date LTV(2)(3) | Maturity Date LTV(1)(2)(3) |
| IO-Balloon | 21 | $632,949,000 | 49.8% | 4.55352% | 115 | 1.48x | 9.4% | 65.7% | 59.3% |
| Interest Only | 6 | 365,387,000 | 28.7 | 4.01979% | 109 | 2.56x | 11.1% | 59.1% | 59.1% |
| Balloon | 22 | 227,194,023 | 17.9 | 4.78658% | 95 | 1.46x | 9.9% | 66.8% | 56.8% |
| ARD-Balloon | 3 | 34,943,760 | 2.7 | 4.55459% | 114 | 1.93x | 12.6% | 58.9% | 45.7% |
| ARD-IO-Balloon | 1 | 7,880,000 | 0.6 | 4.61000% | 60 | 1.49x | 9.8% | 64.7% | 60.5% |
| Fully Amortizing | 1 | 2,961,365 | 0.2 | 4.84450% | 118 | 1.17x | 15.0% | 54.8% | 0.3% |
| Total / Weighted Average: | 54 | $1,271,315,148 | 100.0% | 4.44283% | 109 | 1.80x | 10.1% | 63.8% | 58.3% |
Underwritten Net Cash Flow Debt Service Coverage Ratios(2)(4) |
Weighted Average | |||||||||||
| Underwritten Net Cash Flow Debt Service Coverage Ratios | Number of Loans | Cut-off Date Principal Balance | % of IPB | Mortgage Rate | Remaining Loan Term(1) | UW NCF DSCR(2)(4) | UW NOI DY(2) | Cut-off Date LTV(2)(3) | Maturity Date LTV(1)(2)(3) | ||
| 1.15x | - | 1.35x | 12 | $266,071,639 | 20.9% | 4.55895% | 119 | 1.22x | 7.8% | 73.1% | 64.0% |
| 1.36x | - | 1.45x | 11 | 191,377,064 | 15.1 | 4.49591% | 120 | 1.43x | 9.4% | 59.7% | 52.5% |
| 1.46x | - | 1.55x | 10 | 244,584,547 | 19.2 | 4.74971% | 94 | 1.50x | 9.9% | 65.7% | 58.6% |
| 1.56x | - | 1.65x | 4 | 68,471,078 | 5.4 | 5.03020% | 82 | 1.61x | 10.5% | 64.0% | 59.3% |
| 1.66x | - | 1.80x | 4 | 101,060,450 | 7.9 | 4.44654% | 114 | 1.78x | 9.3% | 59.4% | 57.1% |
| 1.81x | - | 2.00x | 6 | 56,863,370 | 4.5 | 4.53637% | 114 | 1.96x | 12.0% | 61.3% | 53.9% |
| 2.01x | - | 3.34x | 7 | 342,887,000 | 27.0 | 3.97029% | 110 | 2.68x | 12.1% | 59.3% | 57.7% |
| Total / Weighted Average: | 54 | $1,271,315,148 | 100.0% | 4.44283% | 109 | 1.80x | 10.1% | 63.8% | 58.3% | ||
| (1) | In the case of Loan Nos. 17, 32, 39 and 42, which have anticipated repayment dates, Remaining Loan Term and Maturity Date LTV are as of the related anticipated repayment date. |
| (2) | In the case of Loan Nos. 1, 3, 6, 10 and 13, the UW NCF DSCR, UW NOI DY, Cut-off Date LTV and Maturity Date LTV calculations include the related Pari Passu Companion Loan(s). In the Loan No. 14, the UW NCF DSCR, UW NOI DY, Cut-off Date LTV and Maturity Date LTV calculations exclude the related ESK Companion Loan. |
| (3) | In the case of Loan Nos. 5, 17, 29 and 41, the Cut-off Date LTV and the Maturity Date LTV are calculated based upon a hypothetical appraised value based on certain assumptions. See “Description of the Mortgage Pool – Assessments of Property Value and Condition” in the Free Writing Prospectus for additional details. |
| (4) | In the case of Loan No. 14, the UW NCF DSCR is calculated using the average of principal and interest payments over the first 12 months following the initial interest only period based on the assumed principal payment schedule provided on Annex F of the Free Writing Prospectus. |
THE INFORMATION IN THIS STRUCTURAL AND COLLATERAL TERM SHEET IS NOT COMPLETE AND MAY BE AMENDED PRIOR TO THE TIME OF SALE. THIS TERM SHEET IS NOT AN OFFER TO SELL THESE SECURITIES AND IT IS NOT A SOLICITATION OF AN OFFER TO BUY THESE SECURITIES IN ANY JURISDICTION WHERE THE OFFER OR SALE IS NOT PERMITTED.
| 10 of 124 | |
| Structural and Collateral Term Sheet | JPMBB 2014-C24 | |
| Collateral Characteristics | ||
LTV Ratios as of the Cut-off Date(2)(3) |
Weighted Average | |||||||||||
| Range of Cut-off Date LTVs | Number of Loans | Cut-off Date Principal Balance | % of IPB | Mortgage Rate | Remaining Loan Term(1) | UW NCF DSCR(2)(4) | UW NOI DY(2) | Cut-off Date LTV(2)(3) | Maturity Date LTV(1)(2)(3) | ||
| 46.2% | - | 59.9% | 12 | $453,271,365 | 35.7% | 4.37589% | 109 | 2.10x | 11.1% | 53.5% | 49.9% |
| 60.0% | - | 64.9% | 8 | 208,880,000 | 16.4 | 4.25042% | 113 | 2.04x | 10.2% | 62.9% | 59.9% |
| 65.0% | - | 69.9% | 10 | 238,178,532 | 18.7 | 4.59062% | 91 | 1.75x | 10.4% | 68.5% | 62.9% |
| 70.0% | - | 74.9% | 17 | 267,925,565 | 21.1 | 4.57973% | 120 | 1.33x | 8.7% | 72.7% | 63.3% |
| 75.0% | - | 79.4% | 7 | 103,059,686 | 8.1 | 4.42975% | 118 | 1.28x | 8.2% | 77.0% | 68.6% |
| Total / Weighted Average: | 54 | $1,271,315,148 | 100.0% | 4.44283% | 109 | 1.80x | 10.1% | 63.8% | 58.3% | ||
LTV Ratios as of the Maturity Date(1)(2)(3) |
Weighted Average | |||||||||||
Range of Maturity Date/ARD LTVs | Number of Loans | Cut-off Date Principal Balance | % of IPB | Mortgage Rate | Remaining Loan Term(1) | UW NCF DSCR(2)(4) | UW NOI DY(2) | Cut-off Date LTV(2)(3) | Maturity Date LTV(1)(2)(3) | ||
| 0.3% | - | 44.9% | 6 | $129,021,365 | 10.1% | 4.51446% | 118 | 1.61x | 10.5% | 48.9% | 41.2% |
| 45.0% | - | 49.9% | 2 | 36,900,000 | 2.9 | 4.22911% | 119 | 2.18x | 13.4% | 54.0% | 48.6% |
| 50.0% | - | 54.9% | 5 | 239,450,000 | 18.8 | 4.32573% | 101 | 2.37x | 11.7% | 56.6% | 53.5% |
| 55.0% | - | 59.9% | 10 | 194,239,078 | 15.3 | 4.60795% | 117 | 1.66x | 9.6% | 62.4% | 56.3% |
| 60.0% | - | 64.9% | 24 | 422,683,945 | 33.2 | 4.48335% | 109 | 1.73x | 9.9% | 68.6% | 62.2% |
| 65.0% | - | 71.0% | 7 | 249,020,760 | 19.6 | 4.35241% | 105 | 1.51x | 8.4% | 73.0% | 68.1% |
| Total / Weighted Average: | 54 | $1,271,315,148 | 100.0% | 4.44283% | 109 | 1.80x | 10.1% | 63.8% | 58.3% | ||
| Prepayment Protection |
Weighted Average | |||||||||
| Prepayment Protection | Number of Loans | Cut-off Date Principal Balance | % of IPB | Mortgage Rate | Remaining Loan Term(1) | UW NCF DSCR(2)(4) | UW NOI DY(2) | Cut-off Date LTV(2)(3) | Maturity Date LTV(1)(2)(3) |
| Defeasance | 42 | $1,050,105,148 | 82.6% | 4.40712% | 110 | 1.85x | 10.1% | 62.8% | 57.4% |
| Yield Maintenance | 12 | 221,210,000 | 17.4 | 4.61233% | 106 | 1.56x | 9.8% | 68.7% | 62.4% |
| Total / Weighted Average: | 54 | $1,271,315,148 | 100.0% | 4.44283% | 109 | 1.80x | 10.1% | 63.8% | 58.3% |
| Loan Purpose |
Weighted Average | |||||||||
| Loan Purpose | Number of Loans | Cut-off Date Principal Balance | % of IPB | Mortgage Rate | Remaining Loan Term(1) | UW NCF DSCR(2)(4) | UW NOI DY(2) | Cut-off Date LTV(2)(3) | Maturity Date LTV(1)(2)(3) |
| Refinance | 34 | $966,024,127 | 76.0% | 4.45104% | 112 | 1.84x | 10.1% | 61.7% | 56.2% |
| Acquisition | 20 | 305,291,020 | 24.0 | 4.41686% | 100 | 1.65x | 10.0% | 70.7% | 64.8% |
| Total / Weighted Average: | 54 | $1,271,315,148 | 100.0% | 4.44283% | 109 | 1.80x | 10.1% | 63.8% | 58.3% |
| (1) | In the case of Loan Nos. 17, 32, 39 and 42, which have anticipated repayment dates, Remaining Loan Term and Maturity Date LTV are as of the related anticipated repayment date. |
| (2) | In the case of Loan Nos. 1, 3, 6, 10 and 13, the UW NCF DSCR, UW NOI DY, Cut-off Date LTV and Maturity Date LTV calculations include the related Pari Passu Companion Loan(s). In the Loan No. 14, the UW NCF DSCR, UW NOI DY, Cut-off Date LTV and Maturity Date LTV calculations exclude the related ESK Companion Loan. |
| (3) | In the case of Loan Nos. 5, 17, 29 and 41, the Cut-off Date LTV and the Maturity Date LTV are calculated based upon a hypothetical appraised value based on certain assumptions. See “Description of the Mortgage Pool – Assessments of Property Value and Condition” in the Free Writing Prospectus for additional details. |
| (4) | In the case of Loan No. 14, the UW NCF DSCR is calculated using the average of principal and interest payments over the first 12 months following the initial interest only period based on the assumed principal payment schedule provided on Annex F of the Free Writing Prospectus. |
THE INFORMATION IN THIS STRUCTURAL AND COLLATERAL TERM SHEET IS NOT COMPLETE AND MAY BE AMENDED PRIOR TO THE TIME OF SALE. THIS TERM SHEET IS NOT AN OFFER TO SELL THESE SECURITIES AND IT IS NOT A SOLICITATION OF AN OFFER TO BUY THESE SECURITIES IN ANY JURISDICTION WHERE THE OFFER OR SALE IS NOT PERMITTED.
| 11 of 124 | |
| Structural and Collateral Term Sheet | JPMBB 2014-C24 | |
| Collateral Characteristics | ||
Previous Securitization History(1) |
| No. | Loan Name | Location | Property Type | Previous Securitization |
| 4 | 635 Madison Avenue | New York, NY | Mixed Use | WBCMT 2007-C31 |
| 6 | 17 State Street | New York, NY | Office | BACM 2004-3 |
| 7 | North Riverside Park Mall | North Riverside, IL | Retail | WBCMT 2004-C10 |
| 13 | Canyon Ranch Portfolio | Various, Various | Hotel | BACM 2005-2 |
| 14 | Embassy Suites Kennesaw | Kennesaw, GA | Hotel | NRF 2012-1 |
| 17 | Holiday Inn French Quarter-Chateau Lemoyne | New Orleans, LA | Hotel | JPMCC 2005-LDP3 |
| 24 | Water’s Edge | Pensacola, FL | Multifamily | JPMCC 2007-LD11 |
| 29 | Skyview Plaza Shopping Center | East Liverpool, OH | Retail | MLMT 2004-KEY2 |
| 30.01 | Apple Valley Estates | Hebron, IN | Manufactured Housing | CSFB 2004-C5 |
| 31 | Wauwatosa Industrial | Wauwatosa, WI | Industrial | JPMCC 2005-LDP4 |
| 35 | Northridge Business Center | Charlotte, NC | Industrial | COMM 2006-C7 |
| 37 | The Carrier Building | Raleigh, NC | Industrial | BACM 2006-1 |
| 38 | Wichita Square | Wichita Falls, TX | Retail | JPMCC 2004-C3 |
| 40 | Storage Max Self Storage | Johnson City, TN | Self Storage | GECMC 2005-C3 |
| 41 | Westwood Square | Alliance, OH | Retail | JPMCC 2006-CB14 |
| 43 | Marysville Farms | Port Huron, MI | Manufactured Housing | BACM 2006-4 |
| 44 | StaxUp Self Storage | Sun City, CA | Self Storage | GECMC 2005-C1 |
| 51 | Rite Aid | Pittsburgh, PA | Retail | LBUBS 2004-C7 |
| 52 | Trotwood Self Storage | Trotwood, OH | Self Storage | MLMT 2007-C1 |
| (1) | The table above represents the properties for which the previously existing debt was most recently securitized, based on information provided by the related borrower or obtained through searches of a third-party database. |
THE INFORMATION IN THIS STRUCTURAL AND COLLATERAL TERM SHEET IS NOT COMPLETE AND MAY BE AMENDED PRIOR TO THE TIME OF SALE. THIS TERM SHEET IS NOT AN OFFER TO SELL THESE SECURITIES AND IT IS NOT A SOLICITATION OF AN OFFER TO BUY THESE SECURITIES IN ANY JURISDICTION WHERE THE OFFER OR SALE IS NOT PERMITTED.
| 12 of 124 | |
| Structural and Collateral Term Sheet | JPMBB 2014-C24 |
Class A-2(1) |
No. | Loan Name | Location | Cut-off Date Balance | % of IPB | Maturity/ARD Balance | % of Certificate Class(2) | Original Loan Term | Remaining Loan Term | UW NCF DSCR | UW NOI Debt Yield | Cut-off Date LTV Ratio | Maturity Date/ARD LTV Ratio |
| 7 | North Riverside Park Mall | North Riverside, IL | $75,000,000 | 5.9% | $69,100,214 | 37.6% | 60 | 60 | 1.47x | 9.9% | 58.1% | 53.6% |
| 9 | Meridian Corporate Center I | Durham, NC | 36,261,000 | 2.9 | 36,261,000 | 19.7 | 60 | 59 | 2.52x | 11.6% | 68.3% | 68.3% |
| 14 | Embassy Suites Kennesaw | Kennesaw, GA | 29,500,000 | 2.3 | 28,069,419 | 15.3 | 60 | 60 | 1.60x | 10.6% | 67.4% | 64.1% |
| 19 | Meridian Corporate Center II | Durham, NC | 20,126,000 | 1.6 | 20,126,000 | 10.9 | 60 | 59 | 2.47x | 12.6% | 69.7% | 69.7% |
| 25 | Westin Columbus | Columbus, OH | 13,000,000 | 1.0 | 11,994,898 | 6.5 | 60 | 60 | 1.63x | 10.5% | 61.9% | 57.1% |
| 32 | Tractor Supply/Fresenius Medical | Various, Various | 7,880,000 | 0.6 | 7,367,625 | 4.0 | 60 | 60 | 1.49x | 9.8% | 64.7% | 60.5% |
| 36 | Hyatt Place - Nashville | Nashville, TN | 6,887,282 | 0.5 | 6,071,771 | 3.3 | 60 | 59 | 1.67x | 11.0% | 68.2% | 60.1% |
| 49 | Hampton Inn Massillon | Massillon, OH | 3,500,000 | 0.3 | 3,111,702 | 1.7 | 61 | 61 | 1.87x | 13.3% | 50.0% | 44.5% |
| 54 | Storage Pros - Old Hickory | Old Hickory, TN | 2,086,249 | 0.2 | 1,911,570 | 1.0 | 60 | 59 | 1.33x | 8.4% | 67.1% | 61.5% |
| Total / Weighted Average: | $194,240,532 | 15.3% | $184,014,201 | 100.0% | 60 | 60 | 1.81x | 10.7% | 63.4% | 60.5% | ||
| (1) | The table above presents the mortgage loans whose balloon payments would be applied to pay down the principal balance of the Class A-2 Certificates, assuming a 0% CPR and applying the “Modeling Assumptions” described in the Free Writing Prospectus, including the assumptions that (i) none of the mortgage loans in the pool experience prepayments, defaults or losses; (ii) there are no extensions of maturity dates of any mortgage loans in the pool; and (iii) each mortgage loan in the pool is paid in full on its stated maturity date or anticipated repayment date, as applicable. Each class of Certificates, including the Class A-2 Certificates, evidences undivided ownership interests in the entire pool of mortgage loans. Debt service coverage ratio, debt yield and loan-to-value ratio information does not take into account subordinate debt (whether or not secured by the mortgaged property), if any, that is allowed under the terms of any mortgage loan. See Annex A-1 to the Free Writing Prospectus. |
| (2) | Reflects the percentage equal to the Maturity/ARD Balance divided by the initial Class A-2 Certificate Balance. |
Class A-3(1) |
No. | Loan Name | Location | Cut-off Date Balance | % of IPB | Maturity/ARD Balance | % of Certificate Class(2) | Original Loan Term | Remaining Loan Term | UW NCF DSCR | UW NOI Debt Yield | Cut-off Date LTV Ratio | Maturity Date/ARD LTV Ratio |
| 11 | Oakland Square and Oakland Plaza | Troy, MI | $35,000,000 | 2.8% | $32,263,233 | 78.6% | 84 | 84 | 1.51x | 10.7% | 68.5% | 63.1% |
| 42 | Dollar General Portfolio | Various, Various | 5,383,760 | 0.4 | 4,777,320 | 11.6 | 84 | 81 | 1.31x | 8.4% | 76.3% | 67.7% |
| 45 | 740 Kifer Road | Sunnyvale, CA | 4,000,000 | 0.3 | 4,000,000 | 9.7 | 84 | 83 | 1.98x | 9.6% | 61.3% | 61.3% |
| Total / Weighted Average: | $44,383,760 | 3.5% | $41,040,552 | 100.0% | 84 | 84 | 1.53x | 10.3% | 68.8% | 63.5% | ||
| (1) | The table above presents the mortgage loans whose balloon payments would be applied to pay down the principal balance of the Class A-3 Certificates, assuming a 0% CPR and applying the “Modeling Assumptions” described in the Free Writing Prospectus, including the assumptions that (i) none of the mortgage loans in the pool experience prepayments, defaults or losses; (ii) there are no extensions of maturity dates of any mortgage loans in the pool; and (iii) each mortgage loan in the pool is paid in full on its stated maturity date or anticipated repayment date, as applicable. Each class of Certificates, including the Class A-3 Certificates, evidences undivided ownership interests in the entire pool of mortgage loans. Debt service coverage ratio, debt yield and loan-to-value ratio information does not take into account subordinate debt (whether or not secured by the mortgaged property), if any, that is allowed under the terms of any mortgage loan. See Annex A-1 to the Free Writing Prospectus. |
| (2) | Reflects the percentage equal to the Maturity/ARD Balance divided by the initial Class A-3 Certificate Balance. |
THE INFORMATION IN THIS STRUCTURAL AND COLLATERAL TERM SHEET IS NOT COMPLETE AND MAY BE AMENDED PRIOR TO THE TIME OF SALE. THIS TERM SHEET IS NOT AN OFFER TO SELL THESE SECURITIES AND IT IS NOT A SOLICITATION OF AN OFFER TO BUY THESE SECURITIES IN ANY JURISDICTION WHERE THE OFFER OR SALE IS NOT PERMITTED.
| 13 of 124 | |
| Structural and Collateral Term Sheet | JPMBB 2014-C24 | |
| Structural Overview | ||
| ■ | Accrual: | Each Class of Certificates (other than the Class ESK and Class R Certificates) will accrue interest on a 30/360 basis. The Class R Certificates will not accrue interest. On each distribution date, any excess interest collected in respect of any mortgage loan in the trust with an anticipated repayment date during the related due period will be distributed to the holders of the Class NR Certificates. | |
| ■ | Distribution of Interest: | On each Distribution Date, accrued interest for each Class of Certificates (other than the Class ESK and Class R Certificates) at the applicable Pass-Through Rate will be distributed in the following order of priority to the extent of available funds: first, to the Class A-1, Class A-2, Class A-3, Class A-4A1, Class A-4A2, Class A-5, Class A-SB, Class X-A, Class X-B, Class X-C, Class X-D and Class X-E Certificates, on a pro rata basis, based on the interest entitlement for each such Class on such date, and then to the Class A-S, Class B, Class C, Class D, Class E, Class F and Class NR Certificates, in that order, in each case until the interest entitlement for such date payable to each such Class is paid in full. | |
| Payments of interest collected on the Embassy Suites Kennesaw Whole Loan will be allocated first, to the Embassy Suites Kennesaw Mortgage Loan and then to the related ESK Companion Loan (as defined below). Interest allocated to the ESK Companion Loan will only be available to make distributions and pay other amounts to the Class ESK Certificates. | |||
| The Pass-Through Rate applicable to each of the Class A-1, Class A-2, Class A-3, Class A-4A1, Class A-4A2, Class A-5, Class A-SB, Class A-S, Class B, Class C, Class D, Class E, Class F and Class NR Certificates on each Distribution Date will be a per annum rate equal to one of (a) a fixed rate, (b) the WAC Rate, (c) the lesser of a specified fixed rate and the WAC Rate or (d) the WAC Rate less a specified percentage. | |||
The Pass-Through Rate for the Class X-A Certificates for any Distribution Date will equal the excess, if any, of (a) the weighted average of the net mortgage rates on the mortgage loans (in each case adjusted, if necessary, to accrue on the basis of a 360-day year consisting of twelve 30-day months) (the “WAC Rate”) for the related Distribution Date, over (b) the weighted average of the Pass-Through Rates on the Class A-1, Class A-2, Class A-3, Class A-4A1, Class A-4A2, Class A-5, Class A-SB and Class A-S Certificates, weighted on the basis of their respective Certificate Balances immediately prior to that Distribution Date and calculated without giving effect to any exchange of Class A-S Certificates for Class EC Certificates. | |||
| The Pass-Through Rate for the Class X-B Certificates for any Distribution Date will equal the excess, if any, of (a) the WAC Rate for the related Distribution Date, over (b) the weighted average of the Pass-Through Rates on the Class B, Class C and Class D Certificates, weighted on the basis of their respective Certificate Balances immediately prior to that Distribution Date and calculated without giving effect to any exchange of Class B or Class C Certificates for Class EC Certificates. | |||
| The Pass-Through Rate for the Class X-C Certificates for any Distribution Date will equal the excess, if any, of (a) the WAC Rate for the related Distribution Date, over (b) the Pass-Through Rate on the Class E Certificates for that Distribution Date. | |||
| The Pass-Through Rate for the Class X-D Certificates for any Distribution Date will equal the excess, if any, of (a) the WAC Rate for the related Distribution Date, over (b) the Pass-Through Rate on the Class F Certificates for that Distribution Date. | |||
| The Pass-Through Rate for the Class X-E Certificates for any Distribution Date will equal the excess, if any, of (a) the WAC Rate for the related Distribution Date, over (b) the Pass-Through Rate on the Class NR Certificates for that Distribution Date. | |||
| The Class EC Certificates will not have a Pass-Through Rate, but will be entitled to receive the sum of the interest otherwise distributable on the portion of Exchangeable Certificates that have been converted in an exchange for such Class EC Certificates. |
THE INFORMATION IN THIS STRUCTURAL AND COLLATERAL TERM SHEET IS NOT COMPLETE AND MAY BE AMENDED PRIOR TO THE TIME OF SALE. THIS TERM SHEET IS NOT AN OFFER TO SELL THESE SECURITIES AND IT IS NOT A SOLICITATION OF AN OFFER TO BUY THESE SECURITIES IN ANY JURISDICTION WHERE THE OFFER OR SALE IS NOT PERMITTED.
| 14 of 124 | |
| Structural and Collateral Term Sheet | JPMBB 2014-C24 | |
| Structural Overview | ||
| On each distribution date, any excess interest collected in respect of any mortgage loan in the trust with an anticipated repayment date during the related due period will be distributed to the holders of the Class NR Certificates. | |||
See “Description of the Certificates — Distributions” in the Free Writing Prospectus. | |||
| ■ | Distribution of Principal: | On any Distribution Date prior to the Cross-Over Date, payments in respect of principal of the Certificates will be distributed first, to the Class A-SB Certificates until the Certificate Balance of the Class A-SB Certificates is reduced to the planned principal balance for the related distribution date set forth in Annex E to the Free Writing Prospectus, second, to the Class A-1 Certificates, until the Certificate Balance of such Class is reduced to zero, third, to the Class A-2 Certificates, until the Certificate Balance of such Class is reduced to zero, fourth, to the Class A-3 Certificates, until the Certificate Balance of such Class is reduced to zero, fifth, to the Class A-4A1 and Class A-4A2 Certificates, pro rata, based on their respective Certificate Balances, until the Certificate Balances of such Classes are reduced to zero, sixth, to the Class A-5 Certificates, until the Certificate Balance of such Class is reduced to zero, seventh, to the Class A-SB Certificates, until the Certificate Balance of such Class is reduced to zero and then to the Class A-S, Class B, Class C, Class D, Class E, Class F and Class NR Certificates, in that order, until the Certificate Balance of each such Class is reduced to zero. | |
On any Distribution Date on or after the Cross-Over Date, payments in respect of principal of the Certificates will be distributed first, to the Class A-1, Class A-2, Class A-3, Class A-4A1, Class A-4A2, Class A-5 and Class A-SB Certificates, on a pro rata basis, based on the Certificate Balance of each such Class until the Certificate Balance of each such Class is reduced to zero and then, to the Class A-S, Class B, Class C, Class D, Class E, Class F and Class NR Certificates, in that order, until the Certificate Balance of each such Class is reduced to zero. | |||
The “Cross-Over Date” means the Distribution Date on which the aggregate Certificate Balances of the Class A-S, Class B, Class C, Class D, Class E, Class F and Class NR Certificates (without giving effect to any exchange of the Exchangeable Certificates for Class EC Certificates) have been reduced to zero (after taking into account any allocation of realized losses on the mortgage loans (exclusive of any related companion loan and with respect to the Embassy Suites Kennesaw Whole Loan, exclusive of the related ESK Companion Loan) to such Classes on or prior to such date). If Exchangeable Certificates are converted in an exchange for Class EC Certificates, all principal that would otherwise be distributable to such converted Exchangeable Certificates will be distributed to such Class EC Certificates. | |||
The Class X-A, Class X-B, Class X-C, Class X-D and Class X-E Certificates (the “Class X Certificates”) will not be entitled to receive distributions of principal; however, the notional amount of the Class X-A Certificates will be reduced by the aggregate amount of principal distributions, realized losses and trust fund expenses allocated to Certificates that are components of the Class X-A Certificates’ notional amount (the Certificate Balances of the Class A-1, Class A-2, Class A-3, Class A-4A1, Class A-4A2, Class A-5, Class A-SB and Class A-S Certificates (determined without giving effect to any exchange and conversion of any Class A-S Certificates for Class EC Certificates)), the notional amount of the Class X-B Certificates will be reduced by the aggregate amount of principal distributions, realized losses and trust fund expenses allocated to Certificates that are components of the Class X-B Certificates’ notional amount (the Certificate Balances of the Class B, Class C and Class D Certificates (determined without giving effect to any exchange and conversion of any Class B or Class C Certificates for Class EC Certificates)), the notional amount of the Class X-C Certificates will be reduced by the aggregate amount of principal distributions, realized losses and trust fund expenses allocated to the Certificates that are components of the Class X-C Certificates’ notional amount (the Certificate Balance of the Class E Certificates), the notional amount of the Class X-D Certificates will be reduced by the aggregate amount of principal distributions, realized losses and trust fund expenses allocated to the Certificates that are components of the Class X-D Certificates’ notional amount (the Certificate Balance of the Class F Certificates) and the notional amount of the Class X-E Certificates will be reduced by the aggregate amount of principal distributions, |
THE INFORMATION IN THIS STRUCTURAL AND COLLATERAL TERM SHEET IS NOT COMPLETE AND MAY BE AMENDED PRIOR TO THE TIME OF SALE. THIS TERM SHEET IS NOT AN OFFER TO SELL THESE SECURITIES AND IT IS NOT A SOLICITATION OF AN OFFER TO BUY THESE SECURITIES IN ANY JURISDICTION WHERE THE OFFER OR SALE IS NOT PERMITTED.
| 15 of 124 | |
| Structural and Collateral Term Sheet | JPMBB 2014-C24 | |
| Structural Overview | ||
| realized losses and trust fund expenses allocated to the Certificates that are components of the Class X-E Certificates’ notional amount (the Certificate Balance of the Class NR Certificates). | |||
| On each Distribution Date, each of the Class ESK Certificates will be entitled to distributions of principal in reduction of their Certificate Balance to the extent of the amounts distributed to the ESK Companion Loan in respect of principal for such Distribution Date. | |||
| ■ | Exchangeable Certificates and the Class EC Certificates: | A holder of Class A-S, Class B and Class C Certificates (the “Exchangeable Certificates”) may exchange and convert such Classes of Certificates (on an aggregate basis) for a related amount of Class EC Certificates, and Class EC Certificates may be exchanged and converted for a ratable portion of each Class of Exchangeable Certificates. | |
| The initial Certificate Balance of a Class of Exchangeable Certificates represents the principal balance of such Class without giving effect to any exchange and conversion for Class EC Certificates. The initial Certificate Balance of the Class EC Certificates is equal to the aggregate of the initial Certificate Balances of the Exchangeable Certificates and represents the maximum principal balance of such Class that could be issued in an exchange. In the event that no Exchangeable Certificates are exchanged and converted for Class EC Certificates, the Class EC Certificate Balance would be equal to zero. Any exchange of (a) a portion of the Exchangeable Certificates will result in a conversion and reduction, on a dollar-for-dollar basis, of a proportionate share of each related component Class of the Exchangeable Certificates and an increase, on a dollar-for-dollar basis, of the Certificate Balance of the Class EC Certificates, and (b) any amount of the Class EC Certificates will result in a conversion and reduction, on a dollar-for-dollar basis, of the Certificate Balance of the Class EC Certificates and an increase, on a dollar-for-dollar basis, of a proportionate share of the related Certificate Balances of each Class of Certificates that are components of the Exchangeable Certificates. | |||
| The Class EC Certificates will not have a Pass-Through Rate, but will be entitled to receive the sum of the interest otherwise distributable on the portion of Exchangeable Certificates that have been exchanged and converted for such Class EC Certificates. | |||
| If an exchange and conversion has occurred, the Class EC Certificates received in such exchange will be entitled to receive on each Distribution Date distributions equal to the aggregate amount of Interest Distribution Amounts, Accrued Interest From Recoveries, distributions of principal, Yield Maintenance Charges and reimbursements of Collateral Support Deficits that would be distributable to the Exchangeable Certificates that were exchanged and converted for such Class EC Certificates. | |||
| If an exchange and conversion has occurred, the Class EC Certificates received in such exchange and conversion will be allocated the aggregate amount of Collateral Support Deficits, Net Prepayment Interest Shortfalls and other interest shortfalls (including those resulting from Appraisal Reduction Events) that would be allocated to the Exchangeable Certificates that were exchanged and converted for such Class EC Certificates. | |||
| ■ | Yield Maintenance / Fixed Penalty Allocation: | For purposes of the distribution of Yield Maintenance Charges on any Distribution Date (other than as set forth below with respect to the Westin Columbus mortgage loan), Yield Maintenance Charges collected in respect of the mortgage loans (or, in the case of the Embassy Suites Kennesaw Whole Loan, to the extent collected and allocated to the Embassy Suites Kennesaw Mortgage Loan) will first be allocated pro rata between two groups (based on the amount of principal distributed to the Principal Balance Certificates in each group), consisting of the Class A-1, Class A-2, Class A-3, Class A-4A1, Class A-4A2, Class A-5, Class A-SB, Class X-A and Class A-S Certificates (calculated without giving effect to any exchange and conversion of Class A-S Certificates for Class EC Certificates), on the one hand (“YM Group A”) and the Class X-B, Class B, Class C and Class D Certificates (calculated without giving effect to any exchange and conversion of Class B and Class C Certificates for Class EC Certificates), on the other hand (“YM Group B”). As among the Classes of Certificates in each YM Group, each Class of Certificates entitled to distributions of principal will receive an amount calculated generally in accordance with the following formula and as more specifically described in the Free |
THE INFORMATION IN THIS STRUCTURAL AND COLLATERAL TERM SHEET IS NOT COMPLETE AND MAY BE AMENDED PRIOR TO THE TIME OF SALE. THIS TERM SHEET IS NOT AN OFFER TO SELL THESE SECURITIES AND IT IS NOT A SOLICITATION OF AN OFFER TO BUY THESE SECURITIES IN ANY JURISDICTION WHERE THE OFFER OR SALE IS NOT PERMITTED.
| 16 of 124 | |
| Structural and Collateral Term Sheet | JPMBB 2014-C24 | |
| Structural Overview | ||
| Writing Prospectus, with any remaining Yield Maintenance Charges on such Distribution Date being distributed to the class of Class X Certificates in such YM Group. |
| YM Charge | X | Principal Paid to Class | x | (Pass-Through Rate on Class – Discount Rate) | |
| Total Principal Paid | (Mortgage Rate on Loan – Discount Rate) |
| No Yield Maintenance Charges will be distributed to the Class X-C, Class X-D, Class X-E, Class E, Class F, Class NR or Class R Certificates. Once the Certificate Balances of the Class A-1, Class A-2, Class A-3, Class A-4A1, Class A-4A2, Class A-5, Class A-SB, Class A-S, Class B, Class C and Class D Certificates have been reduced to zero, all Yield Maintenance Charges will be distributed to the holders of the Class X-B Certificates, regardless of whether the notional amount of such Class of Certificates has been reduced to zero. | |||
| Notwithstanding the foregoing, with respect to the Westin Columbus mortgage loan, which has a 1.0% fixed penalty fee related to any prepayment of the loan from and including the payment date in November 2017 to and including the payment date in July 2019, any such fee will be paid to Class X-A Certificates or, if the notional amount of the X-A Certificates has previously been reduced to zero, to the Class X-B Certificates. | |||
| Yield Maintenance Charges allocable to the ESK Companion Loan will be distributable to the Class ESK Certificates. | |||
| If Exchangeable Certificates are converted in an exchange for Class EC Certificates, any Yield Maintenance Charges that otherwise would have been distributable to such Exchangeable Certificates had they not been converted will be distributed to the Class EC Certificates. | |||
| ■ | Realized Losses: | Realized losses on the mortgage loans (exclusive of losses on any related companion loan) will be allocated first to the Class NR, Class F, Class E, Class D, Class C, Class B and Class A-S Certificates, in that order, in each case until the Certificate Balance of each such Class has been reduced to zero, and then, to the Class A-1, Class A-2, Class A-3, Class A-4A1, Class A-4A2, Class A-5 and Class A-SB Certificates, on a pro rata basis, based on the Certificate Balance of each such class, until the Certificate Balance of each such class has been reduced to zero. The notional amount of the Class X-A, Class X-B, Class X-C, Class X-D and Class X-E Certificates will be reduced by the aggregate amount of realized losses allocated to Certificates that are components of the notional amounts of the Class X-A, Class X-B, Class X-C, Class X-D and Class X-E Certificates, respectively. | |
Realized losses on each whole loan will be allocated, pro rata, between the related mortgage loan and the related pari passu companion loan(s), if any, based upon their respective Stated Principal Balances. Realized losses on the Embassy Suites Kennesaw Whole Loan will be allocated first, to the related ESK Companion Loan and then, to the related mortgage loan. | |||
| The Class EC Certificates will be allocated the realized losses and other shortfalls otherwise allocable to the Class A-S, Class B and Class C Certificates that are converted in an exchange for such Class EC Certificates. | |||
| ■ | Interest Shortfalls: | A shortfall with respect to the amount of available funds distributable in respect of interest can result from, among other sources: (a) delinquencies and defaults by borrowers; (b) shortfalls resulting from the application of Appraisal Reductions to reduce P&I Advances; (c) shortfalls resulting from interest on Advances made by the Master Servicer, the Special Servicer or the Trustee; (d) shortfalls resulting from the payment of Special Servicing Fees and other additional compensation that the Special Servicer is entitled to receive; (e) shortfalls resulting from extraordinary expenses of the trust, including indemnification payments payable to the Depositor, the Master Servicer, the Special Servicer, the Certificate Administrator, the Trustee or the Senior Trust Advisor; (f) shortfalls resulting from a modification of a mortgage loan’s interest rate or principal balance; and (g) shortfalls resulting from other unanticipated or default-related expenses of the trust. Any such shortfalls that decrease the amount of available funds distributable in respect of interest to the Certificateholders will reduce distributions to the classes of Certificates (other than the Class ESK (unless a loss with respect to the ESK Whole Loan) and Class R Certificates) beginning with those with the lowest payment priorities, in |
THE INFORMATION IN THIS STRUCTURAL AND COLLATERAL TERM SHEET IS NOT COMPLETE AND MAY BE AMENDED PRIOR TO THE TIME OF SALE. THIS TERM SHEET IS NOT AN OFFER TO SELL THESE SECURITIES AND IT IS NOT A SOLICITATION OF AN OFFER TO BUY THESE SECURITIES IN ANY JURISDICTION WHERE THE OFFER OR SALE IS NOT PERMITTED.
| 17 of 124 | |
| Structural and Collateral Term Sheet | JPMBB 2014-C24 | |
| Structural Overview | ||
reverse sequential order. See “Description of the Certificates—Distributions—Priority” in the Free Writing Prospectus. | |||
| ■ | Appraisal Reductions: | Upon the occurrence of certain trigger events with respect to a mortgage loan, which are generally tied to certain events of default under the related mortgage loan documents, the Special Servicer will be obligated to obtain an appraisal of the related mortgaged property and the Master Servicer will calculate the Appraisal Reduction amount. The “Appraisal Reduction” amount is generally the amount by which the current principal balance of the related mortgage loan or whole loan, plus outstanding advances, real estate taxes, unpaid servicing fees and certain similar amounts exceeds 90% of the appraised value of the related mortgaged property, plus the amount of any escrows and letters of credit. | |
| In general, the Appraisal Reduction amounts that are allocated to the pooled mortgage loans (exclusive of amounts allocated to a companion loan) are notionally allocated to reduce, in reverse sequential order, the Certificate Balance of each Class of Certificates (other than the Class A-1, Class A-2, Class A-3, Class A-4A1, Class A-4A2, Class A-5 and Class A-SB Certificates) beginning with the Class NR Certificates for certain purposes, including certain voting rights and the determination of the controlling class. | |||
With respect to each pari passu whole loan, the Appraisal Reduction amount is notionally allocated, pro rata, between the related mortgage loan and the related pari passu companion loan(s), if any, based upon their respective Stated Principal Balances. The Appraisal Reduction Amount with respect to each of the Embassy Suites Kennesaw Whole Loan is notionally allocated first to the related ESK Companion Loan (until the principal balance of such ESK Companion Loan is notionally reduced to zero by such Appraisal Reductions) and then to the related mortgage loan. | |||
| ■ | Appraisal Reduced Interest: | Accrued and unpaid interest at the related Mortgage Rate for a mortgage loan that is not advanced by the Master Servicer or the Trustee as backup master servicer due to the application of Appraisal Reduction amounts to such mortgage loan. | |
| ■ | Master Servicer Advances: | The Master Servicer will be required to advance certain delinquent scheduled mortgage loan payments of principal and interest and certain property protection advances, in each case, to the extent the Master Servicer deems such advances to be recoverable. At any time that an Appraisal Reduction amount exists, the amount that would otherwise be required to be advanced by the Master Servicer in respect of delinquent payments of interest on the mortgage loan will be reduced to equal the product of (x) the interest portion of the amount that would be advanced without regard to any Appraisal Reduction and (y) a fraction, the numerator of which is the then-outstanding principal balance of the mortgage loan minus the Appraisal Reduction amount and the denominator of which is the then-outstanding principal balance of the mortgage loan. The Master Servicer will not make any principal or interest advances with respect to the ESK Companion Loan. | |
| ■ | Whole Loans: | Five mortgage loans are evidenced by a note and one or more additional pari passu companion loans (each a “Companion Loan” and collectively with the related mortgage loan, a “Whole Loan”) that are each secured by a single mortgage on the related mortgaged property and are subject to an intercreditor agreement. None of these Companion Loans will be part of the trust. | |
In the case of these Whole Loans, referred to as the “Grapevine Mills Whole Loan”, the “Columbus Square Portfolio Whole Loan”, the “17 State Street Whole Loan”, the “Hilton Houston Post Oak Whole Loan” and the “Canyon Ranch Portfolio Whole Loan”, one or more related Companion Loans is pari passu with the related mortgage loan (these Companion Loans are referred to as the “Pari Passu Companion Loans”). Prior to the securitization of the related Pari Passu Companion Loan, the Hilton Houston Post Oak Pari Passu Companion Loan, is referred to as the “Serviced Companion Loan” and the related Whole Loan as a “Serviced Whole Loan”. | |||
| Each of the Grapevine Mills Whole Loan, the Columbus Square Portfolio Whole Loan, the 17 State Street Whole Loan and the Canyon Ranch Portfolio Whole Loan, and after securitization of the pari passu companion loan, the Hilton Houston Post Oak Whole Loan will be serviced pursuant to other pooling and servicing agreements as described under |
THE INFORMATION IN THIS STRUCTURAL AND COLLATERAL TERM SHEET IS NOT COMPLETE AND MAY BE AMENDED PRIOR TO THE TIME OF SALE. THIS TERM SHEET IS NOT AN OFFER TO SELL THESE SECURITIES AND IT IS NOT A SOLICITATION OF AN OFFER TO BUY THESE SECURITIES IN ANY JURISDICTION WHERE THE OFFER OR SALE IS NOT PERMITTED.
| 18 of 124 | |
| Structural and Collateral Term Sheet | JPMBB 2014-C24 | |
| Structural Overview | ||
“Description of the Mortgage Pool—The Whole Loans—The Grapevine Mills Whole Loan”, “—The Columbus Square Portfolio Whole Loan”, “—The 17 State Street Whole Loan” and “—The Canyon Ranch Portfolio Whole Loan” in the Free Writing Prospectus. The Hilton Houston Post Oak Whole Loan will be serviced under the Pooling and Servicing Agreement until the related Pari Passu Companion Loan is securitized, and at such time, servicing will shift to the pooling and servicing agreement for that transaction. See “Description of the Mortgage Pool—The Whole Loans—The Hilton Houston Post Oak Whole Loan” in the Free Writing Prospectus. | |||
| ■ | ESK Companion Loan: | In addition to the mortgage loans above, one mortgage loan evidenced by a senior note (the “Embassy Suites Kennesaw Mortgage Loan”) together with a related trust subordinate companion note (the “ESK Companion Loan”), is secured by a single mortgage or deed of trust on the related mortgaged property and is subject to an intercreditor agreement. Together, the Embassy Suites Kennesaw Mortgage Loan and the related ESK Companion Loan are referred to herein as the “Embassy Suites Kennesaw Whole Loan” or “ESK Whole Loan”. The ESK Companion Loan is also part of the trust. The Class ESK Certificates will only receive distributions from, and will only incur losses with respect to, the ESK Companion Loan that are allocable to it pursuant to the related intercreditor agreement. | |
| ■ | Liquidated Loan Waterfall: | On liquidation of any mortgage loan, all net liquidation proceeds (or, with respect to the Embassy Suites Kennesaw Whole Loan, liquidation proceeds allocated to the related Embassy Suites Kennesaw Mortgage Loan) related to the mortgage loan (but not any related Companion Loan) will be applied so that amounts allocated as a recovery of accrued and unpaid interest will not, in the first instance, include any Appraisal Reduced Interest. After the adjusted interest amount is so allocated, any remaining liquidation proceeds will be allocated to offset certain advances and to pay principal on the mortgage loan until the unpaid principal amount of the mortgage loan has been reduced to zero. Any remaining liquidation proceeds will then be allocated to pay Appraisal Reduced Interest. Any liquidation proceeds in respect of each such mortgage loan in excess of the related outstanding balance will first be applied to offset any interest shortfalls allocated to the Certificates (other than the Class X Certificates), in sequential order, and then to offset any realized losses allocated to the Certificates (other than the Class X Certificates), in sequential order. Any liquidation proceeds remaining after such applications will be distributed to the Class R Certificates. | |
| ■ | Sale of Defaulted Mortgage Loans and REO Properties: | The Special Servicer may offer to sell or may offer to purchase any defaulted mortgage loan or REO property, if the Special Servicer determines that no satisfactory arrangements can be made for collection of delinquent payments and the sale would be in the best economic interests of the trust (or in the case of any Whole Loan and the ESK Whole Loan, the trust and the holder of the related Companion Loan(s) or ESK Companion Loan, as a collective whole taking into account the subordinate or pari passu nature of such Companion Loan(s) or ESK Companion Loan), on a net present value basis. The Special Servicer is required to accept the highest offer for any defaulted mortgage loan or REO property in an amount at least equal to par plus accrued interest plus all other outstanding amounts due under such mortgage loan or whole loan and any outstanding expenses of the trust relating to such mortgage loan or whole loan (the “Defaulted Loan Purchase Price”) except as described in the Free Writing Prospectus. | |
| With respect to each Serviced Whole Loan, any such sale of the related defaulted mortgage loan will also include the related Pari Passu Companion Loan(s), if any, and the prices will be adjusted accordingly. | |||
| In connection with such sale and fair value determination, within 30 days of a mortgage loan becoming a specially serviced mortgage loan, the Special Servicer is required to order an appraisal and, within 30 days of receipt of such appraisal, is required to determine the fair value of such defaulted mortgage loan in accordance with the applicable servicing standard. If, however, the Special Servicer is already in the process of obtaining an appraisal with respect to the related mortgaged property, the Special Servicer is required to make its fair value determination as soon as reasonably practicable (but in any event within 30 days) after its receipt of such appraisal. Additionally, with respect to |
THE INFORMATION IN THIS STRUCTURAL AND COLLATERAL TERM SHEET IS NOT COMPLETE AND MAY BE AMENDED PRIOR TO THE TIME OF SALE. THIS TERM SHEET IS NOT AN OFFER TO SELL THESE SECURITIES AND IT IS NOT A SOLICITATION OF AN OFFER TO BUY THESE SECURITIES IN ANY JURISDICTION WHERE THE OFFER OR SALE IS NOT PERMITTED.
| 19 of 124 | |
| Structural and Collateral Term Sheet | JPMBB 2014-C24 | |
| Structural Overview | ||
| the mortgage loans that have mezzanine debt (whether in existence now or permitted in the future) or the ESK Companion Loan, the mezzanine lenders or the holders of the Class ESK Certificates as holders of the beneficial interest in the ESK Companion Loan, may have the option to purchase the related mortgage loan after certain events of default under such mortgage loan. | |||
| The Directing Certificateholder will not have a right of first refusal to purchase a defaulted mortgage loan. | |||
If the Special Servicer does not receive an offer at least equal to the Defaulted Loan Purchase Price, the Special Servicer may purchase the defaulted mortgage loan or REO property at the Defaulted Loan Purchase Price. If the Special Servicer does not elect to purchase the defaulted mortgage loan or REO property at the Defaulted Loan Purchase Price, the Special Servicer is required to accept the highest offer received from any person that is determined to be a fair price (supported by an appraisal required to be obtained by the Special Servicer within 30 days of a mortgage loan becoming a specially serviced mortgage loan) for such defaulted mortgage loan or REO property, if the highest offeror is a person other than the Depositor, the Master Servicer, the Special Servicer, the Certificate Administrator, the Trustee, the Senior Trust Advisor, any borrower, any manager of a mortgaged property, any independent contractor engaged by the Special Servicer, a holder of any related Companion Loan, a holder of the Class ESK Certificates (but only with respect to the related mortgage loan) or mezzanine loan (but only with respect to the related mortgage loan), or any known affiliate of any such person (each, an “Interested Person”). If the highest offer is made by an Interested Person, the Trustee must approve the purchase of the defaulted mortgage loan or REO property based upon its determination of the fair price for the defaulted mortgage loan or REO property (based upon updated appraisals received by the Trustee) and the Trustee may conclusively rely on the opinion of an independent appraiser or other independent expert retained by the Trustee in connection with making such determination. Neither the Trustee nor any of its affiliates may make an offer for or purchase any specially serviced mortgage loan or REO property. | |||
If the Special Servicer does not receive any offers that are at least equal to the Defaulted Loan Purchase Price, the Special Servicer is not required to accept the highest offer and may accept a lower offer for a defaulted mortgage loan or REO property if the Special Servicer determines, in accordance with the servicing standard, that a rejection of such offer would be in the best interests of the Certificateholders and, with respect to a Serviced Whole Loan or ESK Whole Loan, the holder of the related Companion Loan(s) or ESK Companion Loan, as applicable, as a collective whole (taking into account the pari passu or subordinate nature of any such loan), so long as such lower offer was not made by the Special Servicer or any of its affiliates. | |||
| If title to any mortgaged property is acquired by the trust fund, the Special Servicer will be required to sell such mortgaged property prior to the close of the third calendar year beginning after the year of acquisition, unless (a) the IRS grants or has not denied an extension of time to sell such mortgaged property or (b) the Trustee, the Certificate Administrator and the Master Servicer receive an opinion of independent counsel to the effect that the holding of the property by the trust fund longer than the above-referenced three-year period will not result in the imposition of a tax on any REMIC of the trust fund or cause any REMIC of the trust fund to fail to qualify as a REMIC. | |||
| With respect to the Grapevine Mills mortgage loan, the Columbus Square Portfolio mortgage loan, the 17 State Street mortgage loan, the Canyon Ranch Portfolio mortgage loan and, after the securitization of the related Pari Passu Companion Loan, the Hilton Houston Post Oak mortgage loan, if the special servicer under the applicable pooling and servicing agreement determines to sell a related Pari Passu Companion Loan as described above, then the applicable special servicer will be required to sell the related Whole Loan, including the related mortgage loan included in the JPMBB 2014-C24 trust and the related Pari Passu Companion Loan(s), as a single loan. In connection with any such sale, the then-applicable special servicer will be required to follow procedures substantially similar to those set forth above. |
THE INFORMATION IN THIS STRUCTURAL AND COLLATERAL TERM SHEET IS NOT COMPLETE AND MAY BE AMENDED PRIOR TO THE TIME OF SALE. THIS TERM SHEET IS NOT AN OFFER TO SELL THESE SECURITIES AND IT IS NOT A SOLICITATION OF AN OFFER TO BUY THESE SECURITIES IN ANY JURISDICTION WHERE THE OFFER OR SALE IS NOT PERMITTED.
| 20 of 124 | |
| Structural and Collateral Term Sheet | JPMBB 2014-C24 | |
| Structural Overview | ||
| ■ | Control Eligible Certificates: | Classes E, F and NR. | |
| ■ | Control Rights: | The Control Eligible Certificates will have certain control rights attached to them. The “Directing Certificateholder” will be the Controlling Class Certificateholder (or its representative) selected by more than 50% of the Controlling Class Certificateholders; provided, however, that (1) absent that selection, (2) until a Directing Certificateholder is so selected or (3) upon receipt of a notice from a majority of the Controlling Class Certificateholders that a Directing Certificateholder is no longer designated, the Controlling Class Certificateholder that owns the largest aggregate Certificate Balance of the Controlling Class (or its representative) will be the Directing Certificateholder; provided, however, that in the case of this clause (3), in the event no one holder owns the largest aggregate Certificate Balance of the Controlling Class, then there will be no Directing Certificateholder until appointed in accordance with the terms of the Pooling and Servicing Agreement. The Directing Certificateholder will be entitled to direct the Special Servicer to take, or refrain from taking certain actions with respect to a mortgage loan. Furthermore, the Directing Certificateholder will also have the right to receive notice and provide consent with respect to certain material actions that the Master Servicer and the Special Servicer plan on taking with respect to a mortgage loan. With respect to any mortgage loan that has, or may in the future have, mezzanine debt, pursuant to the related intercreditor agreement, the related mezzanine lender may have certain consent rights with respect to certain modifications related to such mortgage loan. In addition, pursuant to the related intercreditor agreement and the pooling and servicing agreement, the ESK Companion Loan holder will have certain direction, consent and consultation rights with respect to the related Mortgage Loan other than during a control appraisal period. The Directing Certificateholder will not be entitled to exercise any rights with respect to the ESK Whole Loan if no control appraisal period with respect to the ESK Companion Loan is continuing. In addition, the holder of the related ESK Companion Loan will have certain rights to cure defaults under the related mortgage loan under certain circumstances, and in certain circumstances, to purchase the related defaulted mortgage loan. | |
| With respect to the Grapevine Mills mortgage loan, the Columbus Square Portfolio mortgage loan, the 17 State Street mortgage loan and the Canyon Ranch Portfolio mortgage loan (and the Hilton Houston Post Oak mortgage loan after securitization of the related Pari Passu Companion Loan as described below), direction, consent and consultation rights with respect to the related Whole Loan will be exercised by the directing certificateholder under the applicable pooling and servicing agreement. | |||
In addition, prior to the securitization of the Hilton Houston Post Oak Pari Passu Companion Loan, direction, consent and consultation rights with respect to the related Whole Loan will be exercised by the Directing Certificateholder. After the securitization of such Pari Passu Companion Loan, the direction, consent and consultation rights referenced in the prior sentence will be exercised by the directing certificateholder under the securitization of the Hilton Houston Post Oak Pari Passu Companion Loan, subject to the consultation rights of the Directing Certificateholder pursuant to the related intercreditor agreement. See “Risk Factors—Potential Conflicts of Interest—Potential Conflicts of Interest of the Directing Certificateholder” in the Free Writing Prospectus. | |||
| ■ | Directing Certificateholder: | Raith Capital Management, LLC and Alliance Bernstein L.P., are expected to be appointed the initial directing certificateholder. | |
| ■ | Controlling Class: | The “Controlling Class” will at any time of determination be the most subordinate Class of Control Eligible Certificates then outstanding that has an aggregate Certificate Balance, as notionally reduced by any Appraisal Reduction amounts allocable to such Class, equal to no less than 25% of the initial Certificate Balance for such Class. | |
| The Controlling Class as of the Closing Date will be the Class NR Certificates. | |||
| ■ | Control Event: | A “Control Event” will occur when (i) the Certificate Balance of the Class E Certificates (taking into account the application of Appraisal Reductions to notionally reduce the Certificate Balance of the Class E Certificates) has been reduced to less than 25% of the initial Certificate Balance of such Class as of the Closing Date or (ii) a holder of the |
THE INFORMATION IN THIS STRUCTURAL AND COLLATERAL TERM SHEET IS NOT COMPLETE AND MAY BE AMENDED PRIOR TO THE TIME OF SALE. THIS TERM SHEET IS NOT AN OFFER TO SELL THESE SECURITIES AND IT IS NOT A SOLICITATION OF AN OFFER TO BUY THESE SECURITIES IN ANY JURISDICTION WHERE THE OFFER OR SALE IS NOT PERMITTED.
| 21 of 124 | |
| Structural and Collateral Term Sheet | JPMBB 2014-C24 | |
| Structural Overview | ||
Class E Certificates becomes the majority holder of the Controlling Class (the “Controlling Class Certificateholder”) and irrevocably waives its right to exercise any rights of the Controlling Class Certificateholder and such rights have not been reinstated to a successor Controlling Class Certificateholder. | |||
| Upon the occurrence and during the continuance of a Control Event, the Controlling Class will no longer have any control rights. After the occurrence and during the continuance of a Control Event, the Directing Certificateholder will relinquish its right to direct certain actions of the Special Servicer and will no longer have consent rights with respect to certain actions that the Master Servicer or the Special Servicer plan on taking with respect to a mortgage loan. Following the occurrence and during the continuance of a Control Event, the Directing Certificateholder will retain consultation rights with the Special Servicer with respect to certain material actions that the Special Servicer plans on taking with respect to a mortgage loan. Such consultation rights will continue until the occurrence of a Consultation Termination Event. | |||
| ■ | Consultation Termination Event: | A Consultation Termination Event will occur (i) when, without regard to the application of any Appraisal Reduction amount (i.e., giving effect to principal reductions through principal payments and realized losses only), there is no Class of Control Eligible Certificates that satisfies the requirement of a Controlling Class or (ii) during such time as the Class E Certificates are the most subordinate class among the Control Eligible Certificates that have a then-outstanding Principal Balance, net of Appraisal Reductions, at least equal to 25% of the initial Certificate Balance of such Class, and the then-Controlling Class Certificateholder has irrevocably waived its right to appoint a Directing Certificateholder and to exercise any of the rights of the Controlling Class Certificateholder and such rights have not been reinstated. | |
| Upon the occurrence of a Consultation Termination Event, there will be no Class of Certificates that will act as the Controlling Class. After the occurrence of a Consultation Termination Event, the Directing Certificateholder will have no rights under the Pooling and Servicing Agreement, other than those rights generally available to all Certificateholders. | |||
| ■ | Appraised-Out Class: | A Class of Control Eligible Certificates that has been determined, as a result of Appraisal Reduction amounts allocable to such Class, to no longer be the Controlling Class. | |
| ■ | Remedies Available to Holders of an Appraised-Out Class: | Holders of the majority of any Class of Control Eligible Certificates that is determined at any date of determination to no longer be the Controlling Class as a result of an Appraisal Reduction allocable to such class will have the right, at their sole expense, to require the Special Servicer to order a second appraisal report from an MAI appraiser (selected by the Special Servicer) for any mortgage loan that results in the Class becoming an Appraised-Out Class. | |
| Upon receipt of that second appraisal, the Special Servicer will be required to determine, in accordance with the Servicing Standard, whether, based on its assessment of the second appraisal, any recalculation of the Appraisal Reduction amount is warranted, and if so warranted, the Special Servicer is required to recalculate the Appraisal Reduction amount based on the second appraisal and if required by such recalculation, the Appraised-Out Class will be reinstated as the Controlling Class. The holders of an Appraised-Out Class requesting a second appraisal are not permitted to exercise any control or consent rights of the Controlling Class until such time, if any, as the Class is reinstated as the Controlling Class. | |||
| The majority holders of the Class ESK Certificates will have similar rights as described above with respect to requesting updated appraisals with respect to the related Mortgaged Property in the event of a control appraisal period with respect to the related ESK Companion Loan and will also have the right to post threshold collateral to avoid a control appraisal period. | |||
| ■ | Senior Trust Advisor: | The Senior Trust Advisor will initially be Pentalpha Surveillance LLC. The Senior Trust Advisor will have certain review and consultation rights relating to the performance of the Special Servicer and with respect to its actions taken in connection with the resolution |
THE INFORMATION IN THIS STRUCTURAL AND COLLATERAL TERM SHEET IS NOT COMPLETE AND MAY BE AMENDED PRIOR TO THE TIME OF SALE. THIS TERM SHEET IS NOT AN OFFER TO SELL THESE SECURITIES AND IT IS NOT A SOLICITATION OF AN OFFER TO BUY THESE SECURITIES IN ANY JURISDICTION WHERE THE OFFER OR SALE IS NOT PERMITTED.
| 22 of 124 | |
| Structural and Collateral Term Sheet | JPMBB 2014-C24 | |
| Structural Overview | ||
| and/or liquidation of specially serviced mortgage loans. The Senior Trust Advisor will generally be responsible for reviewing the Special Servicer’s operational practices with respect to the resolution and liquidation of specially serviced mortgage loans. In addition, after the occurrence and during the continuance of a Control Event, the Senior Trust Advisor will have certain consultation rights with respect to the specially serviced mortgage loans except with respect to the Embassy Suites Kennesaw Whole Loan unless a control appraisal period with respect to the ESK Companion Loan has occurred and is continuing. The Senior Trust Advisor will generally have no obligations or consultation rights under the Pooling and Servicing Agreement with respect to the Grapevine Mills Whole Loan, the Columbus Square Portfolio Whole Loan, the 17 State Street Whole Loan, the Canyon Ranch Portfolio Whole Loan and, after the securitization of the related Pari Passu Companion Loan, the Hilton Houston Post Oak Whole Loan. However, Pentalpha Surveillance LLC is also the senior trust advisor under the JPMBB Commercial Mortgage Securities Trust 2014-C23 pooling and servicing agreement and the WFRBS Commercial Mortgage Trust 2014-C22 pooling and servicing agreement and, in such capacities, will have certain obligations and consultation rights with respect to the Grapevine Mills Whole Loan, the Columbus Square Portfolio Whole Loan and the 17 State Street Whole Loan that are substantially similar to those of the senior trust advisor under the Pooling and Servicing Agreement. In addition, Situs Holdings, LLC is the operating advisor under the COMM 2014-UBS5 Mortgage Trust pooling and servicing agreement and, in such capacity, will have certain obligations and consultation rights with respect to the Canyon Ranch Portfolio Whole Loan that are substantially similar to those of the senior trust advisor under the Pooling and Servicing Agreement. | ||||
| The Senior Trust Advisor will be responsible for: | ||||
| ● | after the occurrence and during the continuance of a Control Event, consulting with the Special Servicer with respect to each asset status report prepared by the Special Servicer and recommending proposed alternative courses of action. | |||
| ● | after the occurrence and during the continuance of a Control Event, preparing an annual report addressing the Senior Trust Advisor’s overall findings and determinations and setting forth its assessment of the Special Servicer’s performance of its duties under the Pooling and Servicing Agreement on a platform-level basis with respect to the resolution and liquidation of specially serviced mortgage loans that the Special Servicer is responsible for servicing under the Pooling and Servicing Agreement. As used above, “platform-level basis” refers to the Special Servicer’s performance of its duties as they relate to the resolution and liquidation of specially serviced mortgage loans, taking into account the Special Servicer’s specific duties under the Pooling and Servicing Agreement as well as the extent to which those duties were performed in accordance with the servicing standard, with due consideration to (and as limited by) the Senior Trust Advisor’s review of any assessment of compliance report, attestation report, asset status report and other information delivered to the Senior Trust Advisor by the Special Servicer with respect to the specially serviced mortgage loans (other than any communications between the Directing Certificateholder and the Special Servicer that would be privileged information). The annual report will be based on the Senior Trust Advisor’s knowledge of the Special Servicer’s actions taken during the applicable calendar year with respect to the resolution or liquidation of specially serviced mortgage loans that the Special Servicer is responsible for servicing under the Pooling and Servicing Agreement, including knowledge obtained in connection with the Senior Trust Advisor’s review of each asset status report prepared by the Special Servicer. | |||
| ● | prior to the occurrence and continuance of a Control Event, the Special Servicer will forward any Appraisal Reduction and net present value calculations used in the Special Servicer’s determination of what course of action to take in connection with the workout or liquidation of a specially serviced mortgage loan to the Senior Trust Advisor after such calculations have been finalized. The Senior Trust Advisor will be required to review such calculations but will not opine on or take any affirmative action with respect to such Appraisal Reduction calculations and/or net present value calculations. | |||
THE INFORMATION IN THIS STRUCTURAL AND COLLATERAL TERM SHEET IS NOT COMPLETE AND MAY BE AMENDED PRIOR TO THE TIME OF SALE. THIS TERM SHEET IS NOT AN OFFER TO SELL THESE SECURITIES AND IT IS NOT A SOLICITATION OF AN OFFER TO BUY THESE SECURITIES IN ANY JURISDICTION WHERE THE OFFER OR SALE IS NOT PERMITTED.
| 23 of 124 | |
| Structural and Collateral Term Sheet | JPMBB 2014-C24 | |
| Structural Overview | ||
| ● | after the occurrence and during the continuance of a Control Event, recalculating and verifying, on a limited basis, the accuracy of mathematical calculations and the corresponding application of the non-discretionary portion of the applicable formulas utilized in connection with any Appraisal Reduction or net present value calculations performed by the Special Servicer. In the event the Senior Trust Advisor does not agree with the mathematical calculations or the application of the non-discretionary portion of the applicable formulas required to be utilized for such calculation, the Senior Trust Advisor and the Special Servicer will consult with each other in order to resolve any disagreement. Any disagreement with respect to such calculations that the Senior Trust Advisor and the Special Servicer are unable to resolve will be determined by the Certificate Administrator. | |||
In addition, the Senior Trust Advisor is required to promptly review all information available to Privileged Persons (as defined in the Free Writing Prospectus) on the Certificate Administrator’s website related to specially serviced mortgage loans and certain information available to Privileged Persons on the Certificate Administrator’s website related to mortgage loans included on the monthly CREFC® servicer watch list report, each final asset status report delivered to the Senior Trust Advisor by the Special Servicer and each assessment of compliance report and attestation report prepared by the Special Servicer in order to maintain its familiarity with the mortgage loans and the performance of the Special Servicer under the Pooling and Servicing Agreement. | ||||
| After the occurrence and during the continuance of a Control Event, the Senior Trust Advisor will also consult with the Special Servicer in connection with certain major decisions and propose possible alternative courses of action. | ||||
| In addition, after the occurrence of a Consultation Termination Event, if the Senior Trust Advisor determines that the Special Servicer is not performing its duties as required under the Pooling and Servicing Agreement or is otherwise not acting in accordance with the Servicing Standard, the Senior Trust Advisor will have the right to recommend the replacement of the Special Servicer and will submit its formal recommendation to the Trustee and the Certificate Administrator (along with its rationale, its proposed replacement special servicer and other relevant information justifying its recommendation). | ||||
| The Senior Trust Advisor’s recommendation to replace the Special Servicer must be confirmed by an affirmative vote of holders of Certificates evidencing at least a majority of the aggregate notional balance of all Classes of Certificates entitled to principal distributions (taking into account the application of any Appraisal Reduction amounts to notionally reduce the Certificate Balances of the Classes to which such Appraisal Reduction amounts are allocable). In the event the holders of such Certificates elect to remove and replace the Special Servicer, the Certificate Administrator will be required to obtain a rating agency confirmation from each of the rating agencies at that time. | ||||
| ■ | Replacement of Senior Trust Advisor: | The Senior Trust Advisor may be terminated or removed under certain circumstances and a replacement Senior Trust Advisor appointed as described in the Free Writing Prospectus. | ||
| Any replacement Senior Trust Advisor (or the personnel responsible for supervising the obligations of the replacement Senior Trust Advisor) must (A) (i) be regularly engaged in the business of analyzing and advising clients in commercial mortgage-backed securities matters and have at least 5 years of experience in collateral analysis and loss projections and (ii) have at least 5 years of experience in commercial real estate asset management and experience in the workout and management of distressed commercial real estate assets or (B) be an institution that is a special servicer, senior trust advisor or operating advisor on a rated CMBS transaction, but has not been a special servicer or a senior trust advisor on a transaction that a rating agency has downgraded, qualified or withdrawn its ratings citing servicing concerns with the special servicer or a senior trust advisor as the sole or a material factor in such rating action. Any Senior Trust Advisor is prohibited from making an investment in any class of certificates in the Trust as described in the Free Writing Prospectus. | ||||
THE INFORMATION IN THIS STRUCTURAL AND COLLATERAL TERM SHEET IS NOT COMPLETE AND MAY BE AMENDED PRIOR TO THE TIME OF SALE. THIS TERM SHEET IS NOT AN OFFER TO SELL THESE SECURITIES AND IT IS NOT A SOLICITATION OF AN OFFER TO BUY THESE SECURITIES IN ANY JURISDICTION WHERE THE OFFER OR SALE IS NOT PERMITTED.
| 24 of 124 | |
| Structural and Collateral Term Sheet | JPMBB 2014-C24 | |
| Structural Overview | ||
| ■ | Appointment and Replacement of Special Servicer: | The Directing Certificateholder will appoint the initial Special Servicer as of the Closing Date. Prior to the occurrence and continuance of a Control Event and the Special Servicer may generally be replaced at any time by the Directing Certificateholder, except with respect to the ESK Whole loan unless a control appraisal period with respect to the ESK Companion Loan is continuing. | |
| Upon the occurrence and during the continuance of a Control Event, the Directing Certificateholder will no longer have the right to replace the Special Servicer and such replacement will occur based on a vote of holders of all voting eligible Classes of Certificates as described below. | |||
| After the occurrence of a Consultation Termination Event, the Senior Trust Advisor may also recommend the replacement of the Special Servicer as described above. The majority holder of the ESK Certificates if no control appraisal period with respect to the ESK Companion Loan is continuing, will have the right to replace the Special Servicer solely with respect to the related Embassy Suites Kennesaw Whole Loan. | |||
| Notwithstanding the foregoing, the Senior Trust Advisor will not be permitted to recommend the replacement of the Special Servicer with respect to the Embassy Suites Kennesaw Whole Loan so long as the holder of the related ESK Companion Loan is not subject to a control appraisal period under the related intercreditor agreement. | |||
| ■ | Replacement of Special Servicer by Vote of Certificateholders: | After the occurrence and during the continuance of a Control Event and upon (a) the written direction of holders of Certificates evidencing not less than 25% of the aggregate notional balance of all Classes of Certificates entitled to principal (taking into account the application of Appraisal Reduction amounts to notionally reduce the Certificate Balances of Classes to which such Appraisal Reduction amounts are allocable) requesting a vote to replace the Special Servicer with a replacement special servicer, (b) payment by such requesting holders to the Certificate Administrator of all reasonable fees and expenses to be incurred by the Certificate Administrator in connection with administering such vote and (c) delivery by such holders to the Certificate Administrator and the Trustee of written confirmations from each Rating Agency that the appointment of such replacement special servicer will not result in a downgrade, withdrawal or qualification of the Certificates (which confirmations will be obtained at the expense of such holders), the Certificate Administrator will be required to promptly post such notice on its Internet website, and by mail conduct the solicitation of votes of all Certificates in such regard, which such vote must occur within 180 days of the posting of such notice. Upon the written direction of holders of at least 75% of a Certificateholder Quorum, the Trustee will immediately replace the Special Servicer with the replacement special servicer. | |
| The holders of the Class ESK Certificates will have the right, if no control appraisal period with respect to the ESK Companion Loan is continuing, to replace the Special Servicer solely with respect to the related Embassy Suites Kennesaw Whole Loan. | |||
A “Certificateholder Quorum” means, in connection with any solicitation of votes in connection with the replacement of the Special Servicer described above, the holders of Certificates evidencing at least 75% of the aggregate voting rights (taking into account the application of realized losses and the application of any Appraisal Reductions to notionally reduce the Certificate Balance of the Certificates) of all Classes of Certificates entitled to principal on an aggregate basis. | |||
With respect to the Hilton Houston Post Oak Whole Loan, prior to the securitization of the Hilton Houston Post Oak Pari Passu Companion Loan (the “Other Securitization”), the holder of the Hilton Houston Post Oak Pari Passu Companion Loan, under certain circumstances following a servicer termination event with respect to the Special Servicer, will be entitled to direct the Trustee to terminate the Special Servicer solely with respect to such Whole Loan. A replacement special servicer will be selected by the Trustee or, prior to a Control Event, by the Directing Certificateholder; provided, however, that any successor special servicer appointed to replace the Special Servicer with respect to such Whole Loan can generally not be the person (or its affiliate) that was terminated at the direction of the holder of the related Pari Passu Companion Loan. |
THE INFORMATION IN THIS STRUCTURAL AND COLLATERAL TERM SHEET IS NOT COMPLETE AND MAY BE AMENDED PRIOR TO THE TIME OF SALE. THIS TERM SHEET IS NOT AN OFFER TO SELL THESE SECURITIES AND IT IS NOT A SOLICITATION OF AN OFFER TO BUY THESE SECURITIES IN ANY JURISDICTION WHERE THE OFFER OR SALE IS NOT PERMITTED.
| 25 of 124 | |
| Structural and Collateral Term Sheet | JPMBB 2014-C24 | |
| Structural Overview | ||
With respect to the Grapevine Mills Whole Loan, the Columbus Square Portfolio Whole Loan, the 17 State Street Whole Loan and the Canyon Ranch Portfolio Whole Loan, the JPMBB 2014-C24 trust as holder of the related mortgage loan has similar termination rights in the event of a servicer termination event with respect to the special servicer under the applicable pooling and servicing agreement as described above, which may be exercised by the Directing Certificateholder prior to a Control Event, however, the successor special servicer will be selected pursuant to the applicable pooling and servicing agreement by the related directing holder prior to a control event under such pooling and servicing agreement. The Master Servicer and Special Servicer are entitled to certain fees in connection with the servicing and administration of the mortgage loans as more fully described in “Transaction Parties–Servicing and Other Compensation and Payment of Expenses” in the Free Writing Prospectus. | |||
| After the Other Securitization, the directing certificateholder with respect to the Hilton Houston Post Oak Whole Loan (unless a control event exists under the Other Securitization) or the applicable certificateholders under the Other Securitization with the requisite percentage of voting rights (after a control event) will have the right, with or without cause, to replace the special servicer then acting with respect to the related Whole Loan and appoint a replacement special servicer in lieu thereof without the consent of the Certificateholders. | |||
| ■ | Master Servicer and Special Servicer Compensation: | The Master Servicer is entitled to a fee (the “Servicing Fee”) payable monthly from interest received in respect of each mortgage loan, REO loan (including specially serviced mortgage loans and Serviced Companion Loans) and ESK Companion Loan that will accrue at the related servicing fee rate described in the Free Writing Prospectus. The Special Servicer is also entitled to a fee (the “Special Servicing Fee”) with respect to each specially serviced mortgage loan and REO loan at the special servicing fee rate described in the Free Writing Prospectus. | |
| In addition to the Servicing Fee, Special Servicing Fee and certain other fees described below, the Master Servicer and Special Servicer are entitled to retain and share certain additional servicing compensation, including assumption application fees, assumption fees, defeasance fees and certain Excess Modification Fees and consent fees with respect to the mortgage loans. The Special Servicer may also be entitled to either a Workout Fee or Liquidation Fee, but not both, from recoveries in respect of any particular mortgage loan. | |||
An “Excess Modification Fee” with respect to any mortgage loan (other than the non-serviced mortgage loans), Serviced Whole Loan or the Embassy Suites Kennesaw Whole Loan is the sum of (A) the excess of (i) any and all Modification Fees with respect to a mortgage loan, Serviced Whole Loan or the Embassy Suites Kennesaw Whole Loan over (ii) all unpaid or unreimbursed additional expenses described in the Free Writing Prospectus (excluding Special Servicing Fees, Workout Fees and Liquidation Fees) outstanding with respect to the related mortgage loan, Serviced Whole Loan or the Embassy Suites Kennesaw Whole Loan, as applicable, and reimbursed from such Modification Fees and (B) expenses previously paid or reimbursed from Modification Fees as described in clause (A), which expenses have subsequently been recovered from the related borrower or otherwise. | |||
With respect to the Master Servicer and Special Servicer, the Excess Modification Fees collected and earned by such servicer from the related borrower (taken in the aggregate with any other Excess Modification Fees collected and earned by such servicer from the related borrower within the prior 12 months of the collection of the current Excess Modification Fees) will be subject to a cap of 1.00% of the outstanding principal balance of the related mortgage loan, Serviced Whole Loan or ESK Whole Loan on the closing date of the related modification, extension, waiver or amendment. A “Modification Fee” with respect to any mortgage loan (other than the non-serviced mortgage loans), Serviced Whole Loan or ESK Whole Loan is generally any fee with respect to a modification, extension, waiver or amendment of any mortgage loan, Serviced Whole Loan or ESK Whole Loan. |
THE INFORMATION IN THIS STRUCTURAL AND COLLATERAL TERM SHEET IS NOT COMPLETE AND MAY BE AMENDED PRIOR TO THE TIME OF SALE. THIS TERM SHEET IS NOT AN OFFER TO SELL THESE SECURITIES AND IT IS NOT A SOLICITATION OF AN OFFER TO BUY THESE SECURITIES IN ANY JURISDICTION WHERE THE OFFER OR SALE IS NOT PERMITTED.
| 26 of 124 | |
| Structural and Collateral Term Sheet | JPMBB 2014-C24 | |
| Structural Overview | ||
A “Workout Fee” will generally be payable with respect to each corrected mortgage loan, Serviced Whole Loan or ESK Whole Loan (as more specifically described in the Free Writing Prospectus) and will be calculated at a rate of 1.00% of payments of principal and interest on the respective mortgage loan or Whole Loan for so long as it remains a corrected mortgage loan. After receipt by the Special Servicer of Workout Fees with respect to a corrected mortgage loan in an amount equal to $25,000, any Workout Fees in excess of such amount will be reduced by the Excess Modification Fee Amount; provided that in the event the Workout Fee, collected over the course of such workout, calculated at the Workout Fee Rate is less than $25,000, then the Special Servicer will be entitled to an amount from the final payment on the related corrected mortgage loan that would result in the total Workout Fees payable to the Special Servicer in respect of that corrected mortgage loan to be $25,000. | |||
The “Excess Modification Fee Amount” for any corrected mortgage loan is an amount equal to any Excess Modification Fees paid by or on behalf of the related borrower with respect to the related mortgage loan (including the related Companion Loan or ESK Companion Loan) and received and retained by the Master Servicer or the Special Servicer, as applicable, as additional servicing compensation within the prior 12 months of the related modification, waiver, extension or amendment resulting in the mortgage loan or REO loan being a corrected mortgage loan, but only to the extent those fees have not previously been deducted from a Workout Fee or Liquidation Fee. | |||
A “Liquidation Fee” will generally be payable with respect to each specially serviced mortgage loan or REO property as to which the Special Servicer obtains a full or partial recovery of the related asset. The Liquidation Fee for each specially serviced mortgage loan will be payable at a rate of 1.00% of the liquidation proceeds; provided, however, that no Liquidation Fee will be less than $25,000. | |||
| The Liquidation Fees will be reduced by the amount of any Excess Modification Fees received by the Special Servicer with respect to the related mortgage loan (including a Companion Loan or the ESK Companion Loan) or REO property as additional compensation within the prior 12 months, but only to the extent those fees have not previously been deducted from a Workout Fee or Liquidation Fee. | |||
| Similar fees to those described above will be payable to the applicable special servicer for the Grapevine Mills Whole Loan, the Columbus Square Portfolio Whole Loan, the 17 State Street Whole Loan and the Canyon Ranch Portfolio Whole Loan (and the Hilton Houston Post Oak Whole Loan after the securitization of the Hilton Houston Post Oak Pari Passu Companion Loan) under the applicable pooling and servicing agreement. | |||
| Subject to certain limited exceptions, in connection with its duties under the Pooling and Servicing Agreement, the Special Servicer and its affiliates are prohibited from receiving or retaining any compensation (other than compensation specifically provided for under the Pooling and Servicing Agreement) from anyone in connection with the disposition, workout or foreclosure of any mortgage loan, the management or disposition of any REO property, or the performance of any other special servicing duties under the Pooling and Servicing Agreement. In the event the Special Servicer does receive any such compensation, it will be required to disclose those fees to the Certificate Administrator who will include it as part of the statement to Certificateholders. | |||
| In addition, no liquidation fee will be payable to the Special Servicer if a mortgage loan becomes a specially serviced mortgage loan only because of a maturity default and the related liquidation proceeds are received within 90 days following the stated maturity date as a result of the related mortgage loan being refinanced or otherwise repaid in full. |
THE INFORMATION IN THIS STRUCTURAL AND COLLATERAL TERM SHEET IS NOT COMPLETE AND MAY BE AMENDED PRIOR TO THE TIME OF SALE. THIS TERM SHEET IS NOT AN OFFER TO SELL THESE SECURITIES AND IT IS NOT A SOLICITATION OF AN OFFER TO BUY THESE SECURITIES IN ANY JURISDICTION WHERE THE OFFER OR SALE IS NOT PERMITTED.
| 27 of 124 | |
| Structural and Collateral Term Sheet | JPMBB 2014-C24 | |
| Structural Overview | ||
| ■ | Deal Website: | The Certificate Administrator will maintain a deal website to which certain persons will have access to certain information including, but not limited to the following, which will be posted: | ||
| § | special notices | |||
| § | summaries of asset status reports | |||
| § | appraisals in connection with Appraisal Reductions plus any second appraisals ordered | |||
| § | an “Investor Q&A Forum” | |||
| § | a voluntary investor registry | |||
| § | SEC EDGAR filings | |||
THE INFORMATION IN THIS STRUCTURAL AND COLLATERAL TERM SHEET IS NOT COMPLETE AND MAY BE AMENDED PRIOR TO THE TIME OF SALE. THIS TERM SHEET IS NOT AN OFFER TO SELL THESE SECURITIES AND IT IS NOT A SOLICITATION OF AN OFFER TO BUY THESE SECURITIES IN ANY JURISDICTION WHERE THE OFFER OR SALE IS NOT PERMITTED.
| 28 of 124 | |
| Structural and Collateral Term Sheet | JPMBB 2014-C24 | |
| Grapevine Mills | ||
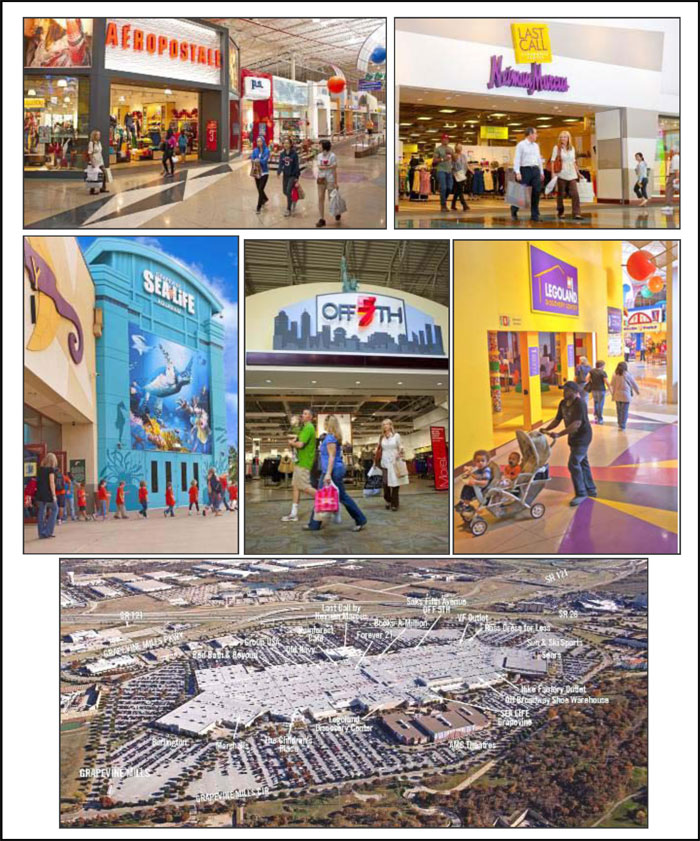
THE INFORMATION IN THIS STRUCTURAL AND COLLATERAL TERM SHEET IS NOT COMPLETE AND MAY BE AMENDED PRIOR TO THE TIME OF SALE. THIS TERM SHEET IS NOT AN OFFER TO SELL THESE SECURITIES AND IT IS NOT A SOLICITATION OF AN OFFER TO BUY THESE SECURITIES IN ANY JURISDICTION WHERE THE OFFER OR SALE IS NOT PERMITTED.
| 29 of 124 | |
| Structural and Collateral Term Sheet | JPMBB 2014-C24 | |
| Grapevine Mills | ||

THE INFORMATION IN THIS STRUCTURAL AND COLLATERAL TERM SHEET IS NOT COMPLETE AND MAY BE AMENDED PRIOR TO THE TIME OF SALE. THIS TERM SHEET IS NOT AN OFFER TO SELL THESE SECURITIES AND IT IS NOT A SOLICITATION OF AN OFFER TO BUY THESE SECURITIES IN ANY JURISDICTION WHERE THE OFFER OR SALE IS NOT PERMITTED.
| 30 of 124 | |
| Structural and Collateral Term Sheet | JPMBB 2014-C24 | |
| Grapevine Mills | ||
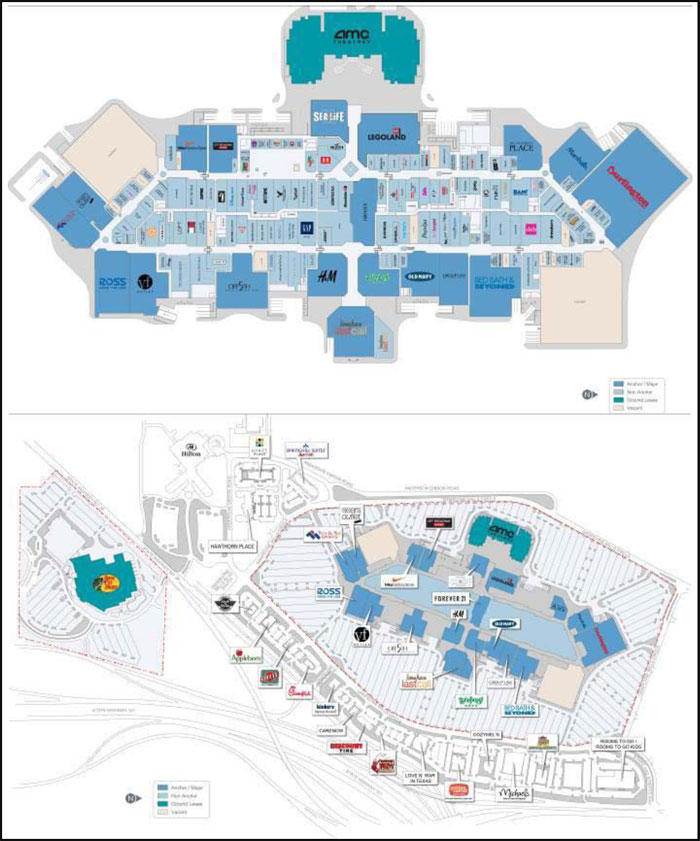
THE INFORMATION IN THIS STRUCTURAL AND COLLATERAL TERM SHEET IS NOT COMPLETE AND MAY BE AMENDED PRIOR TO THE TIME OF SALE. THIS TERM SHEET IS NOT AN OFFER TO SELL THESE SECURITIES AND IT IS NOT A SOLICITATION OF AN OFFER TO BUY THESE SECURITIES IN ANY JURISDICTION WHERE THE OFFER OR SALE IS NOT PERMITTED.
| 31 of 124 | |
| Structural and Collateral Term Sheet | JPMBB 2014-C24 | |
| Grapevine Mills | ||
| Mortgage Loan Information | Property Information | |||
| Mortgage Loan Seller: | JPMCB / Column | Single Asset / Portfolio: | Single Asset | |
Original Principal Balance(1)(2): | $115,000,000 | Title: | Fee | |
Cut-off Date Principal Balance(1): | $115,000,000 | Property Type - Subtype: | Retail - Regional Mall | |
| % of Pool by IPB: | 9.0% | Net Rentable Area (SF): | 1,337,751 | |
| Loan Purpose: | Refinance | Location: | Grapevine, TX | |
| Borrower: | Grapevine Mills Mall Limited | Year Built / Renovated: | 1997 / N/A | |
| Partnership | Occupancy(3): | 85.0% | ||
Sponsor(4): | Simon Property Group, L.P. | Occupancy Date: | 5/30/2014 | |
| Interest Rate: | 3.83270% | Number of Tenants: | 179 | |
| Note Date: | 9/2/2014 | 2011 NOI: | $33,598,088 | |
| Maturity Date: | 10/1/2024 | 2012 NOI: | $34,679,245 | |
| Interest-only Period: | 120 months | 2013 NOI: | $35,941,517 | |
| Original Term: | 120 months | TTM NOI (as of 6/2014): | $36,514,841 | |
| Original Amortization: | None | UW Economic Occupancy: | 92.3% | |
| Amortization Type: | Interest Only | UW Revenues(5): | $50,889,938 | |
Call Protection(6): | L(24),Def(89),O(7) | UW Expenses: | $14,261,393 | |
| Lockbox: | CMA | UW NOI: | $36,628,545 | |
| Additional Debt: | Yes | UW NCF: | $34,796,698 | |
| Additional Debt Balance: | $153,000,000 | Appraised Value / Per SF: | $505,000,000 / $377 | |
| Additional Debt Type: | Pari Passu | Appraisal Date: | 8/12/2014 | |
Escrows and Reserves(7) | Financial Information(1) | |||||||||
| Initial | Monthly | Initial Cap | Cut-off Date Loan / SF: | $200 | ||||||
| Taxes: | $0 | Springing | N/A | Maturity Date Loan / SF: | $200 | |||||
| Insurance: | $0 | Springing | N/A | Cut-off Date LTV: | 53.1% | |||||
| Replacement Reserves: | $0 | Springing | $1,285,200 | Maturity Date LTV: | 53.1% | |||||
| TI/LC: | $0 | Springing | $4,020,000 | UW NCF DSCR: | 3.34x | |||||
| Other: | $0 | $111,667 | N/A | UW NOI Debt Yield: | 13.7% | |||||
| Sources and Uses | ||||||||||
| Sources | Proceeds | % of Total | Uses | Proceeds | % of Total | |||||
Mortgage Loan(1) | $268,000,000 | 99.6% | Payoff Existing Debt | $266,465,442 | 99.1% | |||||
| Sponsor Equity | 978,197 | 0.4 | Closing Costs | 2,512,755 | 0.9 | |||||
| Total Sources | $268,978,197 | 100.0% | Total Uses | $268,978,197 | 100.0% | |||||
| (1) | Grapevine Mills is part of a loan evidenced by six pari passu notes with an aggregate original principal balance of $268.0 million. The Financial Information presented in the chart above reflects the Cut-off Date balance of the $268.0 million Grapevine Mills Whole Loan. |
| (2) | Fitch has confirmed that the mortgage loan has, in the context of its inclusion in the mortgage pool, credit characteristics consistent with an investment grade obligation. |
| (3) | Current Occupancy is as of May 30, 2014 and includes nine tenants totaling 17,048 square feet which have executed leases but are not yet in occupancy as well as two tenants totaling 3,722 square feet with leases out for signature. |
| (4) | The loan sponsor is not a guarantor for the mortgage loan. See “The Sponsor” below for additional information. |
| (5) | UW Revenues includes $548,903 of revenue attributable to nine tenants totaling 17,048 square feet which have executed leases but are not yet in occupancy of their respective spaces as well as $132,710 of revenue attributable to two tenants totaling 3,722 square feet with leases out for signature. |
| (6) | The lockout period will be at least 24 payment dates beginning with and including the first payment date of November 1, 2014. Defeasance of the full $268.0 million Grapevine Mills Whole Loan is permitted after the date that is the earlier to occur of (i) two years from the closing date of the securitization that includes the last pari passu note to be securitized and (ii) November 1, 2018. |
| (7) | For a full description of Escrows and Reserves, please refer to “Escrows and Reserves” below. |
THE INFORMATION IN THIS STRUCTURAL AND COLLATERAL TERM SHEET IS NOT COMPLETE AND MAY BE AMENDED PRIOR TO THE TIME OF SALE. THIS TERM SHEET IS NOT AN OFFER TO SELL THESE SECURITIES AND IT IS NOT A SOLICITATION OF AN OFFER TO BUY THESE SECURITIES IN ANY JURISDICTION WHERE THE OFFER OR SALE IS NOT PERMITTED.
| 32 of 124 | |
| Structural and Collateral Term Sheet | JPMBB 2014-C24 | |
| Grapevine Mills | ||
The Loan. The Grapevine Mills loan is secured by a first mortgage lien on 1,337,751 square feet of an approximately 1,625,000 square foot regional outlet mall located in Grapevine, Texas. The whole loan has an outstanding principal balance of $268.0 million (the “Grapevine Mills Whole Loan”), which is comprised of six pari passu notes, Note A-1, Note A-2, Note A-3, Note A-4, Note A-5 and Note A-6. Note A-3 and Note A-4 each have an outstanding principal balance of $57.5 million and are being contributed to the JPMBB 2014-C24 Trust. Note A-1 and Note A-2 each have an outstanding principal balance as of the Cut-off Date of $40.0 million and were contributed to the JPMBB 2014-C23 trust. Note A-5 and Note A-6 each have an outstanding principal balance of $36.5 million and are expected to be contributed to one or more future securitization trusts. The holder of Note A-1 (the “Controlling Noteholder”) will be the trustee of the JPMBB 2014-C23 trust. The trustee of the JPMBB 2014-C23 trust (or, prior to the occurrence and continuance of a control event under the related pooling and servicing agreement, the directing certificateholder for that securitization) will be entitled to exercise all of the rights of the Controlling Noteholder with respect to the Grapevine Mills Whole Loan; however, the holders of Note A-2, Note A-3, Note A-4, Note A-5 and Note A-6, respectively, will be entitled, under certain circumstances, to consult with respect to certain major decisions. JPMCB is the current holder of the A-5 Note, while Column is the current holder of the A-6 Note. The Grapevine Mills Whole Loan has a 10-year term and is interest-only for the term of the loan. The previously existing debt was held by a syndicate of balance sheet lenders.
The Borrower. The borrowing entity for the Grapevine Mills Whole Loan is Grapevine Mills Mall Limited Partnership, a Delaware limited partnership and special purpose entity.
The Sponsor. The loan sponsor is a joint venture between Simon Property Group, L.P., an affiliate of Simon Property Group, Inc. (“SPG”) and Kan Am USA, an affiliate of KanAm grundinvest fonds, a German real estate investment fund. SPG was founded in 1960 and is headquartered in Indianapolis, Indiana. SPG (NYSE: SPG, rated A3/A by Moody’s and S&P) is S&P 100 company and the largest public real estate company in the world. SPG currently owns or has an interest in 325 retail real estate properties in North America and Asia comprising 243 million square feet. There is no separate carve-out guarantor for the mortgage loan, and the borrower is the sole party responsible for breaches or violations of the non-recourse carve-out provisions in the loan documents.
Grapevine Mills is owned by a joint venture between affiliates of SPG and KanAm USA. SPG came into ownership of the property through a series of acquisitions. In 2007, a joint venture between SPG and Farallon Capital Management, L.L.C. acquired a 59.25% ownership stake in Grapevine Mills through their acquisition of Mills Corp. In 2012, SPG subsequently acquired Farallon’s joint venture stake in 26 properties, one of which was Grapevine Mills. The remaining 50% is owned by affiliates of KanAm USA, which partnered with Mills Corporation when Grapevine Mills was developed. KanAm USA is affiliated with The KanAm Group, a Germany based institutional real estate investment group. The loan sponsor has a current basis of approximately $229 million in the property. The loan sponsor is expected to commence an approximately $21.0 million renovation to the common areas and the entrance at Last Call Neiman Marcus, which renovation is expected to be completed by the end of the year 2015.
The Property. Grapevine Mills is an approximately 1,625,000 square foot one-level regional shopping center located in Grapevine, Texas. The property was constructed in 1997 and is located on approximately 131.9 acres. The property is anchored by Bass Pro Shops Outdoor (177,063 square feet), a 30-screen AMC Theatre (108,733 square feet) and Burlington Coat Factory (100,000 square feet). Bass Pro Shops Outdoor and AMC Theatre own their improvements and ground lease the land from the borrower. The property also includes several smaller anchors including Last Call Neiman Marcus (44,751 square feet), Bed Bath & Beyond (40,340 square feet), Saks Off Fifth (35,000 square feet) and Marshalls (29,539 square feet). Additionally, the property also features a range of restaurants and entertainment related tenants including LegoLand Discovery Centre, Sea Life Centre, Build-A-Bear Workshop and Rainforest Cafe. The property has approximately 8,419 parking spaces which are included in the collateral, resulting in a parking ratio of approximately 6.3 spaces per 1,000 square feet of net rentable area.
As of May 30, 2014, the property was approximately 85.0% leased by 179 tenants. In addition to its anchors, the property’s in-line tenants generally consist of national tenants such as Forever 21, Old Navy, The Children’s Place, Victoria’s Secret, Gap Outlet, Claire’s and Ross Dress for Less. Gross mall sales for all tenants that reported as of the trailing-twelve-month period ending on June 30, 2014 were approximately $300 million. In-line sales per square foot for comparable stores less than 10,000 square feet were approximately $308, $340, $356, $365 and $367 in 2010, 2011, 2012, 2013 and TTM June 2014, respectively. Occupancy costs for comparable in-line tenants occupying less than 10,000 square feet for the same time periods were approximately 15.7%, 15.3%, 14.3%, 14.0% and 14.0% respectively.
The two vacant anchor boxes consisting of 106,207 square feet and 78,344 square feet were previously occupied by JCPenney, which had one of its outlet store concepts at the site, and Polar Ice House, which operated an ice skating rink at the location. JCPenney’s outlet store business was purchased by SB Capital Group in 2011, which in late 2013 elected to close all 15 of its locations due to performance across the format. JCPenney exercised its termination option at the property and closed in January 2014. In 2012, JCPenney reported sales of approximately $13.4 million ($126 per square foot) for this site. Polar Ice House announced its intent to close its store in early September 2014 and is no longer in occupancy at the property. The closure came after Polar Ice House struggled to compete with ice rink facilities in the area operated by another company. The loan sponsor is currently in the process of leasing the JCPenney space to one or more replacement tenants and has received interest from sporting good stores, department stores and other big box tenants and will likely market the space previously occupied by Polar Ice House to additional entertainment or dining tenants. Excluding the two vacant boxes, the property was 98.8% occupied as of May 30, 2014. The loan is structured with an approximately $1.34 million leasing reserve that will be collected monthly throughout the first year of the loan. The reserve can be used
THE INFORMATION IN THIS STRUCTURAL AND COLLATERAL TERM SHEET IS NOT COMPLETE AND MAY BE AMENDED PRIOR TO THE TIME OF SALE. THIS TERM SHEET IS NOT AN OFFER TO SELL THESE SECURITIES AND IT IS NOT A SOLICITATION OF AN OFFER TO BUY THESE SECURITIES IN ANY JURISDICTION WHERE THE OFFER OR SALE IS NOT PERMITTED.
| 33 of 124 | |
| Structural and Collateral Term Sheet | JPMBB 2014-C24 | |
| Grapevine Mills | ||
to cover the re-leasing costs of the former JCPenney Outlet and Polar Ice House. This represents approximately $7.26 per square foot of the aggregate vacant anchor space of 184,551 square feet.
The property is located in Grapevine, Texas, approximately 10 miles north of the Dallas/Fort Worth International Airport and adjacent to the Gaylord Texan Resort and the Great Wolf Lodge. Grapevine is located in the northernmost sector of Tarrant County and includes the affluent cities of Westlake and Trophy Club. Regional access to the area is provided by State Highway 114, State Highway 121, State Highway 26 and US Highway 377. According to the appraisal, the trade area within a 10-mile radius contains approximately 684,000 people, with a median household income of $68,382, as of 2014. The appraisal concluded that market rents were generally in-line with the rents in-place at the property of $20.63 per square foot.
Competitive Set Summary(1) | ||||||
| Property | Year Built / Renovated | Total GLA | Est. Sales PSF | Est. Occ. | Proximity | Anchor Tenants |
| Southlake Town Square | 1999 | 785,000 | N/A | N/A | 6.4 | Harkins Theatre, The Container Store, Barnes & Noble |
| Vista Ridge Mall | 1989 / 2006 | 1,062,312 | $345 | 92% | 6.7 | Dillard’s, Macy’s, JCPenney, Sears |
| Shops at Willow Bend | 2001 / 2004 | 1,262,000 | $350 | 87% | 14.9 | Dillard’s, Macy’s, Neiman Marcus |
Irving Mall(2) | 1971 / 2008 | 1,053,116 | $245 | 90% | 10.3 | AMC Theatres, Burlington Coat Factory, Dillard’s, Macy’s, Sears |
Galleria in Dallas(2) | 1982 / 2005 | 1,398,400 | $685 | 95% | 15.7 | Macy’s, Nordstrom |
| (1) | Per a third party research firm. |
| (2) | The loan sponsor has an interest in the property. |
Historical and Current Occupancy(1) | |||
| 2011 | 2012 | 2013 | Current(2)(3) |
| 95.8% | 96.7% | 97.8% | 85.0% |
| (1) | Historical Occupancies are as of December 31 of each respective year and exclude temporary tenants. |
| (2) | Current Occupancy is as of May 30, 2014 and includes nine tenants totaling 17,048 square feet which have executed leases but are not yet in occupancy as well as two tenants totaling 3,722 square feet with leases out for signature. |
| (3) | The decline in occupancy from 2013 to Current is primarily due to the closure of both JCPenney outlet store concept and Polar Ice House. Please refer to “The Property” section for a full description. |
Historical In-line Sales and Occupancy Costs(1) | |||||
| 2010 | 2011 | 2012 | 2013 | TTM(2) | |
| In-line Sales PSF | $308 | $340 | $356 | $365 | $367 |
| Occupancy Costs | 15.7% | 15.3% | 14.3% | 14.0% | 14.0% |
| (1) | In-line Sales PSF and Occupancy Costs are for comparable tenants less than 10,000 square feet that reported full year sales. |
| (2) | TTM Sales PSF and Occupancy Costs represent the trailing twelve months ending on June 30, 2014. |
Tenant Summary(1) | ||||||||||||
| Tenant | Ratings(2) Moody’s/S&P/Fitch | Net Rentable Area (SF) | % of Total NRA | Base Rent PSF | Sales PSF(3) | Occupancy Costs(3) | Lease Expiration Date | |||||
| Burlington Coat Factory | B3 / NA / NA | 100,000 | 7.5% | $5.76 | $119 | 5.7% | 1/31/2018 | |||||
| Last Call Neiman Marcus | NA / NA / NA | 44,751 | 3.3% | $19.48 | $561 | 4.7% | 4/30/2018 | |||||
| Bed Bath & Beyond | Baa1 / A- / NA | 40,340 | 3.0% | $10.25 | $119 | 10.0% | 1/31/2017 | |||||
| LEGOLAND Discovery Centre | NA / NA / NA | 39,475 | 3.0% | $10.13 | $188 | 8.3% | 12/31/2026 | |||||
| Saks Off Fifth | NA / NA / NA | 35,000 | 2.6% | $7.60 | $176 | 4.7% | 10/31/2017 | |||||
| Ross Dress For Less | NA / A- / NA | 34,670 | 2.6% | $10.24 | N/A | N/A | 1/31/2022 | |||||
| Sun & Ski Sports | NA / NA / NA | 30,127 | 2.3% | $21.90 | $220 | 13.7% | 8/31/2020 | |||||
| V.F. Factory Outlet | NA / NA / NA | 29,968 | 2.2% | $11.70 | $95 | 12.4% | 1/31/2016 | |||||
| Marshalls | A3 / A+ / NA | 29,539 | 2.2% | $9.50 | $200 | 5.6% | 1/31/2018 | |||||
| Forever 21 | NA / NA / NA | 24,203 | 1.8% | $18.00 | $286 | 7.6% | 3/31/2015 | |||||
| (1) | Based on the underwritten rent roll. |
| (2) | Ratings provided are for the parent company of the entity listed in the “Tenant” field whether or not the parent company guarantees the lease. |
| (3) | Sales PSF and Occupancy Costs represent sales for the twelve-month period ending on December 31, 2013 for all tenants. |
THE INFORMATION IN THIS STRUCTURAL AND COLLATERAL TERM SHEET IS NOT COMPLETE AND MAY BE AMENDED PRIOR TO THE TIME OF SALE. THIS TERM SHEET IS NOT AN OFFER TO SELL THESE SECURITIES AND IT IS NOT A SOLICITATION OF AN OFFER TO BUY THESE SECURITIES IN ANY JURISDICTION WHERE THE OFFER OR SALE IS NOT PERMITTED.
| 34 of 124 | |
| Structural and Collateral Term Sheet | JPMBB 2014-C24 | |
| Grapevine Mills | ||
Lease Rollover Schedule(1) | |||||||||||||||||
| Year | Number of Leases Expiring | Net Rentable Area Expiring | % of NRA Expiring | Base Rent Expiring | % of Base Rent Expiring | Cumulative Net Rentable Area Expiring | Cumulative % of NRA Expiring | Cumulative Base Rent Expiring | Cumulative % of Base Rent Expiring | ||||||||
| Vacant | NAP | 200,636 | 15.0 | % | NAP | NAP | 200,636 | 15.0 | % | NAP | NAP | ||||||
| 2014 & MTM | 6 | 23,353 | 1.7 | $606,164 | 2.2 | % | 223,989 | 16.7 | % | $606,164 | 2.2 | % | |||||
| 2015 | 18 | 93,561 | 7.0 | 1,941,545 | 7.0 | 317,550 | 23.7 | % | $2,547,709 | 9.2 | % | ||||||
| 2016 | 15 | 107,898 | 8.1 | 2,040,941 | 7.3 | 425,448 | 31.8 | % | $4,588,650 | 16.5 | % | ||||||
| 2017 | 33 | 215,581 | 16.1 | 6,784,442 | 24.4 | 641,029 | 47.9 | % | $11,373,092 | 40.9 | % | ||||||
| 2018 | 17 | 237,457 | 17.8 | 3,306,456 | 11.9 | 878,486 | 65.7 | % | $14,679,549 | 52.8 | % | ||||||
| 2019 | 20 | 51,926 | 3.9 | 3,593,517 | 12.9 | 930,412 | 69.6 | % | $18,273,066 | 65.7 | % | ||||||
| 2020 | 19 | 129,391 | 9.7 | 3,028,061 | 10.9 | 1,059,803 | 79.2 | % | $21,301,127 | 76.6 | % | ||||||
| 2021 | 9 | 22,928 | 1.7 | 752,936 | 2.7 | 1,082,731 | 80.9 | % | $22,054,063 | 79.3 | % | ||||||
| 2022 | 8 | 57,058 | 4.3 | 1,081,900 | 3.9 | 1,139,789 | 85.2 | % | $23,135,963 | 83.2 | % | ||||||
| 2023 | 11 | 61,647 | 4.6 | 1,880,695 | 6.8 | 1,201,436 | 89.8 | % | $25,016,658 | 90.0 | % | ||||||
| 2024 | 16 | 53,217 | 4.0 | 1,554,969 | 5.6 | 1,254,653 | 93.8 | % | $26,571,626 | 95.6 | % | ||||||
| 2025 & Beyond | 7 | 83,098 | 6.2 | 1,224,696 | 4.4 | 1,337,751 | 100.0 | % | $27,796,322 | 100.0 | % | ||||||
| Total | 179 | 1,337,751 | 100.0 | % | $27,796,322 | 100.0 | % | ||||||||||
| (1) | Based on the underwritten rent roll. |
| Operating History and Underwritten Net Cash Flow | |||||||||||||
| 2011 | 2012 | 2013 | TTM(1) | Underwritten | Per Square Foot | %(2) | |||||||
Rents in Place(3) | $25,252,904 | $26,495,399 | $27,509,488 | $27,896,044 | $27,796,322 | $20.78 | 55.9 | % | |||||
| Vacant Income | 0 | 0 | 0 | 0 | 2,257,388 | 1.69 | 4.5 | ||||||
| Gross Potential Rent | $25,252,904 | $26,495,399 | $27,509,488 | $27,896,044 | $30,053,711 | $22.47 | 60.5 | % | |||||
| Total Reimbursements | 15,981,969 | 16,088,703 | 16,723,213 | 17,583,854 | 19,631,063 | 14.67 | 39.5 | ||||||
| Net Rental Income | $41,234,873 | $42,584,102 | $44,232,701 | $45,479,898 | $49,684,773 | $37.14 | 100.0 | % | |||||
| (Vacancy/Credit Loss) | 0 | 0 | 0 | 0 | (3,804,341) | (2.84) | (7.7) | ||||||
| Other Income | 6,351,960 | 5,784,397 | 5,418,641 | 5,166,908 | 5,009,506 | 3.74 | 10.1 | ||||||
| Effective Gross Income | $47,586,833 | $48,368,499 | $49,651,342 | $50,646,806 | $50,889,938 | $38.04 | 102.4 | % | |||||
| Total Expenses | $13,988,745 | $13,689,254 | $13,709,825 | $14,131,965 | $14,261,393 | $10.66 | 28.0 | % | |||||
| Net Operating Income | $33,598,088 | $34,679,245 | $35,941,517 | $36,514,841 | $36,628,545 | $27.38 | 72.0 | % | |||||
| Total TI/LC, Capex/RR | 0 | 0 | 0 | 0 | 1,831,847 | 1.37 | 3.6 | ||||||
| Net Cash Flow | $33,598,088 | $34,679,245 | $35,941,517 | $36,514,841 | $34,796,698 | $26.01 | 68.4 | % | |||||
| (1) | The TTM column represents the trailing twelve months ending on June 30, 2014. |
| (2) | Percentage column represents percent of Net Rental Income for all revenue lines and represents percent of Effective Gross Income for the remainder of fields. |
| (3) | Underwritten Rents in Place includes $548,903 of rent attributable to nine tenants totaling 17,048 square feet which have executed leases but are not yet in occupancy of their respective spaces as well as $132,710 of rent attributable to two tenants totaling 3,722 square feet with leases out for signature. |
Property Management. The property is managed by Simon Management Associates II, LLC, an affiliate of the loan sponsor.
Escrows and Reserves. No upfront escrows were taken at origination.
Tax Escrows - The requirement for the borrower to make monthly deposits to the tax escrow is waived so long as there is no event of default, no DSCR Reserve Trigger Period exists and the borrower does not become delinquent on taxes or fails to provide the lender with satisfactory evidence that taxes have not become delinquent upon request.
A “DSCR Reserve Trigger Period” means the debt service coverage ratio as calculated in the loan documents based on the trailing four calendar quarters falls below 1.75x for two consecutive calendar quarters.
Insurance Escrows - The requirement for the borrower to make monthly deposits to the insurance escrow is waived so long as no event of default exists. In addition, the borrower is not required to make deposits for insurance premiums so long as the borrower provides satisfactory evidence that the property is insured under an acceptable blanket policy.
Replacement Reserves - The requirement for the borrower to make monthly deposits to the replacement reserve is waived so long as no DSCR Reserve Trigger Period or event of default exists. Following the occurrence and during the continuance of a DSCR Reserve Trigger Period or an event of default, the borrower is required to deposit $35,700 per month (approximately $0.32 per square foot annually) for replacement reserves. The reserve is subject to a cap of $1,285,200 (approximately $0.96 per square foot).
THE INFORMATION IN THIS STRUCTURAL AND COLLATERAL TERM SHEET IS NOT COMPLETE AND MAY BE AMENDED PRIOR TO THE TIME OF SALE. THIS TERM SHEET IS NOT AN OFFER TO SELL THESE SECURITIES AND IT IS NOT A SOLICITATION OF AN OFFER TO BUY THESE SECURITIES IN ANY JURISDICTION WHERE THE OFFER OR SALE IS NOT PERMITTED.
| 35 of 124 | |
| Structural and Collateral Term Sheet | JPMBB 2014-C24 | |
| Grapevine Mills | ||
TI/LC Reserves - The requirement for the borrower to make monthly deposits to the TI/LC reserve is waived so long as no DSCR Reserve Trigger Period or event of default exists. Following the occurrence and during the continuance of a DSCR Reserve Trigger Period or an event of default, the borrower is required to deposit approximately $111,667 per month (approximately $1.00 per square foot annually) for TI/LC reserves. The reserve is subject to a cap of $4,020,000 (approximately $3.01 per square foot).
Year One TI/LC Reserve - On a monthly basis commencing on November 1, 2014 and continuing until October 1, 2015, the borrower is required to escrow approximately $111,667 (approximately $7.26 per square foot for the vacant anchor spaces) for tenant improvements and leasing commissions associated with the spaces vacated by JCPenney and Polar Ice House.
Lockbox / Cash Management. The loan is structured with a CMA lockbox. The borrower was required to send tenant direction letters to all tenants instructing them to deposit all rents and payments into the lockbox account controlled by the lender. The funds are then returned to an account controlled by the borrower until the occurrence of a Lockbox Event. During the continuance of a Lockbox Event, all rents will be swept weekly to a segregated cash management account and held in trust and for the benefit of the lender. The lender will have a first priority security interest in the cash management account. Upon the occurrence and during the continuance of a Lockbox Event, all funds deposited into the cash management account after payment of debt service, required reserves and budgeted operating expenses will be held as additional security for the loan.
A “Lockbox Event” means: (i) the occurrence and continuance of an event of default, (ii) any bankruptcy action of the borrower or manager or (iii) the debt service coverage ratio as calculated in the loan documents based on the trailing four calendar quarters falls below 1.50x for two consecutive calendar quarters.
Release of Outparcels. The borrower is permitted to make transfers of non-income producing portions of the property to third parties or affiliates in accordance with certain terms and conditions set forth in the loan documents.
THE INFORMATION IN THIS STRUCTURAL AND COLLATERAL TERM SHEET IS NOT COMPLETE AND MAY BE AMENDED PRIOR TO THE TIME OF SALE. THIS TERM SHEET IS NOT AN OFFER TO SELL THESE SECURITIES AND IT IS NOT A SOLICITATION OF AN OFFER TO BUY THESE SECURITIES IN ANY JURISDICTION WHERE THE OFFER OR SALE IS NOT PERMITTED.
| 36 of 124 | |
| Structural and Collateral Term Sheet | JPMBB 2014-C24 | |
| The Mall of Victor Valley | ||
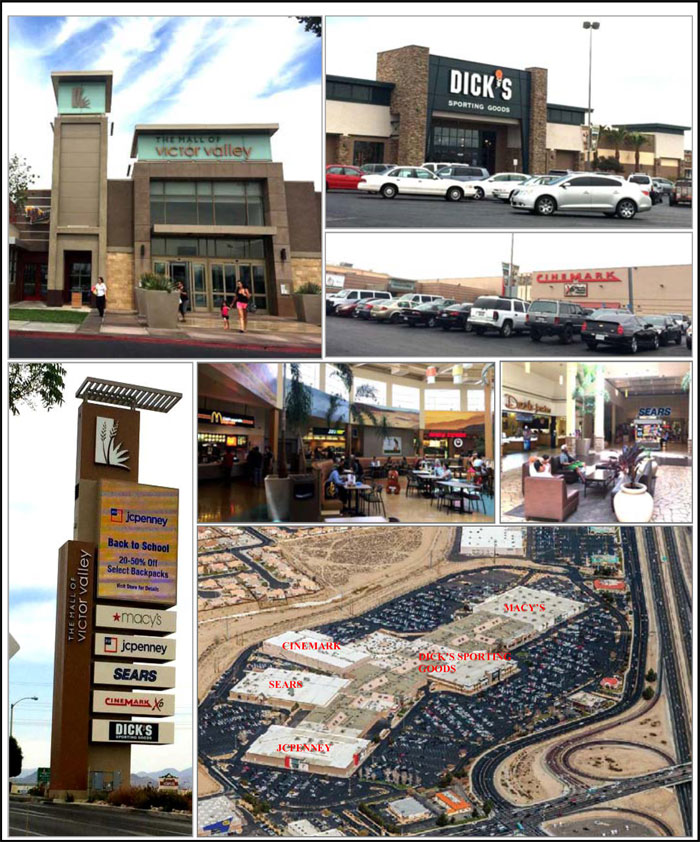
THE INFORMATION IN THIS STRUCTURAL AND COLLATERAL TERM SHEET IS NOT COMPLETE AND MAY BE AMENDED PRIOR TO THE TIME OF SALE. THIS TERM SHEET IS NOT AN OFFER TO SELL THESE SECURITIES AND IT IS NOT A SOLICITATION OF AN OFFER TO BUY THESE SECURITIES IN ANY JURISDICTION WHERE THE OFFER OR SALE IS NOT PERMITTED.
| 37 of 124 | |
| Structural and Collateral Term Sheet | JPMBB 2014-C24 | |
| The Mall of Victor Valley | ||

THE INFORMATION IN THIS STRUCTURAL AND COLLATERAL TERM SHEET IS NOT COMPLETE AND MAY BE AMENDED PRIOR TO THE TIME OF SALE. THIS TERM SHEET IS NOT AN OFFER TO SELL THESE SECURITIES AND IT IS NOT A SOLICITATION OF AN OFFER TO BUY THESE SECURITIES IN ANY JURISDICTION WHERE THE OFFER OR SALE IS NOT PERMITTED.
| 38 of 124 | |
| Structural and Collateral Term Sheet | JPMBB 2014-C24 | |
| The Mall of Victor Valley | ||
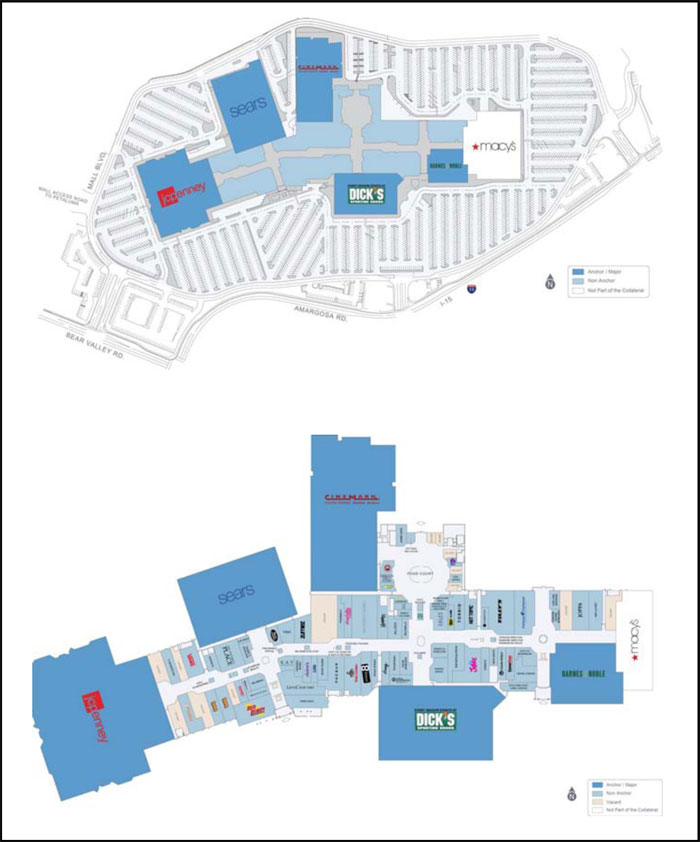
THE INFORMATION IN THIS STRUCTURAL AND COLLATERAL TERM SHEET IS NOT COMPLETE AND MAY BE AMENDED PRIOR TO THE TIME OF SALE. THIS TERM SHEET IS NOT AN OFFER TO SELL THESE SECURITIES AND IT IS NOT A SOLICITATION OF AN OFFER TO BUY THESE SECURITIES IN ANY JURISDICTION WHERE THE OFFER OR SALE IS NOT PERMITTED.
| 39 of 124 | |
| Structural and Collateral Term Sheet | JPMBB 2014-C24 | |
| The Mall of Victor Valley | ||
| Mortgage Loan Information | Property Information | |||
| Mortgage Loan Seller: | JPMCB | Single Asset / Portfolio: | Single Asset | |
| Original Principal Balance: | $115,000,000 | Title: | Fee | |
| Cut-off Date Principal Balance: | $115,000,000 | Property Type - Subtype: | Retail – Regional Mall | |
| % of Pool by IPB: | 9.0% | Net Rentable Area (SF): | 477,384 | |
| Loan Purpose: | Refinance | Location: | Victorville, CA | |
| Borrower: | Macerich Victor Valley LP | Year Built / Renovated: | 1986 / 2013 | |
| Sponsor: | The Macerich Partnership, L.P. | Occupancy(1): | 96.6% | |
| Interest Rate: | 3.96550% | Occupancy Date: | 6/30/2014 | |
| Note Date: | 8/28/2014 | Number of Tenants: | 92 | |
| Maturity Date: | 9/1/2024 | 2011 NOI(2): | $10,250,231 | |
| Interest-only Period: | 120 months | 2012 NOI(2): | $9,569,064 | |
| Original Term: | 120 months | 2013 NOI(3): | $10,062,297 | |
| Original Amortization: | None | TTM NOI (as of 6/2014)(3): | $10,936,789 | |
| Amortization Type: | Interest Only | UW Economic Occupancy: | 94.8% | |
| Call Protection: | L(25),Def(90),O(5) | UW Revenues(4): | $16,108,730 | |
| Lockbox: | CMA | UW Expenses: | $4,853,504 | |
| Additional Debt: | N/A | UW NOI: | $11,255,226 | |
| Additional Debt Balance: | N/A | UW NCF: | $10,724,522 | |
| Additional Debt Type: | N/A | Appraised Value / Per SF: | $183,200,000 / $384 | |
| Appraisal Date: | 7/28/2014 | |||
Escrows and Reserves(5) | Financial Information | ||||||
| Initial | Monthly | Initial Cap | Cut-off Date Loan / SF: | $241 | |||
| Taxes: | $0 | Springing | N/A | Maturity Date Loan / SF: | $241 | ||
| Insurance: | $0 | Springing | N/A | Cut-off Date LTV: | 62.8% | ||
| Replacement Reserves: | $0 | Springing | $96,205 | Maturity Date LTV: | 62.8% | ||
| TI/LC: | $576,610 | Springing | $536,170 | UW NCF DSCR: | 2.32x | ||
| Other: | $0 | $0 | N/A | UW NOI Debt Yield: | 9.8% | ||
| Sources and Uses | ||||||
| Sources | Proceeds | % of Total | Uses | Proceeds | % of Total | |
| Mortgage Loan | $115,000,000 | 100.0% | Payoff Existing Debt | $90,162,604 | 78.4% | |
| Return of Equity | 23,786,638 | 20.7 | ||||
| Upfront Reserves | 576,610 | 0.5 | ||||
| Closing Costs | 474,148 | 0.4 | ||||
| Total Sources | $115,000,000 | 100.0% | Total Uses | $115,000,000 | 100.0% | |
| (1) | Occupancy includes five tenants totaling 16,793 square feet (including Spencer’s, Spaza Shoes, Shoe Palace, V Generation and Charlotte Russe), which have executed leases but are not yet in occupancy of their respective spaces. All tenants are expected to take occupancy between October and December 2014. |
| (2) | The decrease in 2012 NOI from 2011 NOI is primarily a result of the renovation, expansion and relocation of the anchor tenants at the property. |
| (3) | The increase in TTM NOI from 2013 NOI is primarily a result of Dick’s Sporting Goods opening in October 2013, which pays $674,528 in annual rent. |
| (4) | UW Revenues include revenues attributable to five tenants, including Spencer’s, Spaza Shoes, Shoe Palace, V Generation and Charlotte Russe, which have executed leases but are not yet in occupancy of their respective spaces. All tenants are expected to take occupancy between October and December 2014. Approximately $613,198 of UW Revenues are attributable to such tenants. |
| (5) | For a full description of Escrows and Reserves, please refer to “Escrows and Reserves” below. |
The Loan. The Mall of Victor Valley loan has an outstanding principal balance of $115.0 million and is secured by a first mortgage lien on 477,384 square feet of an approximately 574,723 square foot regional mall located in Victorville, California, which is approximately 20 miles north of San Bernardino County. The Mall of Victor Valley loan has a 10-year term and is interest-only for the term of the loan. The previously existing debt consisted of an approximately $90.0 million mortgage loan held on balance sheet by Wells Fargo and PNC.
The Borrower. The borrowing entity for the loan is Macerich Victor Valley LP, a Delaware limited partnership and special purpose entity.
THE INFORMATION IN THIS STRUCTURAL AND COLLATERAL TERM SHEET IS NOT COMPLETE AND MAY BE AMENDED PRIOR TO THE TIME OF SALE. THIS TERM SHEET IS NOT AN OFFER TO SELL THESE SECURITIES AND IT IS NOT A SOLICITATION OF AN OFFER TO BUY THESE SECURITIES IN ANY JURISDICTION WHERE THE OFFER OR SALE IS NOT PERMITTED.
| 40 of 124 | |
| Structural and Collateral Term Sheet | JPMBB 2014-C24 | |
| The Mall of Victor Valley | ||
The Sponsor. The loan sponsor and carve-out guarantor is The Macerich Partnership, L.P. (“Macerich”). Macerich, an S&P 500 company (NYSE: MAC), is a self-managed and self-administered real estate investment trust that focuses on the acquisition, leasing, management, development and redevelopment of regional malls throughout the United States. Macerich currently owns approximately 57.0 million square feet of real estate consisting primarily of interests in 53 regional shopping centers. Macerich acquired the property for approximately $109.0 million in 2004, and subsequently invested approximately $57.8 million to renovate and reposition the mall.
The Property. The Mall of Victor Valley is an approximately 574,723 square foot enclosed regional mall, of which 477,384 square feet serve as collateral for the loan. The property was constructed in 1986 and is located on approximately 75.0 acres. The property is anchored by Macy’s (98,400 square feet), JCPenney (91,776 square feet) and Sears (78,212 square feet). Macy’s owns its land and improvements and is not part of the collateral. The Mall of Victor Valley also includes several smaller anchors including a 16-screen CineMark (62,118 square feet), Dick’s Sporting Goods (49,965 square feet) and Barnes & Noble (25,221 square feet). The property has approximately 2,614 parking spaces, of which 2,027 are included as the collateral, resulting in a parking ratio of approximately 4.25 spaces per 1,000 square feet of gross leasable area.
As of June 30, 2014, the property was approximately 96.6% leased by 92 tenants. In addition to its anchors, the property’s in-line tenants generally consist of national tenants such as Victoria’s Secret, Famous Footwear, LensCrafters, The Children’s Place, PacSun, Foot Locker, and Bath & Body Works. Gross mall sales for all tenants that reported as of the trailing twelve-month period ending on June 30, 2014 were approximately $131.0 million. In-line sales per square foot for comparable stores less than 10,000 square feet were approximately $395, $428, $460, $495 and $491 in 2010, 2011, 2012, 2013 and TTM June 2014, respectively. Occupancy costs for comparable in-line tenants occupying less than 10,000 square feet for the same time periods were approximately 16.8%, 16.8%, 16.3%, 16.1% and 15.5%, respectively.
After Macerich acquired the property in 2004, it spent approximately $37.6 million between 2004 and 2007 to construct a 16-screen CineMark theater, and renovate the interior with new flooring, painting, lighting, ceiling treatments and common area amenities. In 2012 and 2013, the mall was again renovated and expanded for a total cost of $16.7 million. In 2012, JCPenney moved from its previous 49,965 square foot location and expanded into a 91,776 square foot location, which was previously leased by a Forever 21. The new JCPenney location is a modern prototype store that includes boutiques such as Sephora and Disney. JCPenney’s previous 49,965 square foot location was leased to Dick’s Sporting Goods, which took occupancy in October 2013. In March of 2013, Macy’s took occupancy of its newly constructed, 98,400 square foot location, which was built on a parcel acquired by Macy’s.
The property is located in Victorville, California, 20 miles north of San Bernardino County (which is part of the metropolitan Los Angeles area) and about 15 miles south of the city of Barstow. Regional access to the area is provided by Interstate 15, State Highway 18, and US Highway 395. According to the appraisal, the primary trade area within a 25-mile radius contained approximately 771,630 people, with a median household income of $60,117, as of June 2014. The primary trade area has experienced strong population growth since 2000, averaging an approximately 2.5% growth rate versus the national average of approximately 0.9%. The property is the only regional mall in the San Bernardino County’s “high desert” area. This high desert area consists of the cities of Victorville, Hesperia, Adelanto and Apple Valley with the nearest primary competition located at least 33 miles away.
Competitive Set Summary(1) | ||||||||||||
| Property | Year Built / Renovated | Total GLA | Est. Sales PSF | Est. Occ. | Proximity | Anchor Tenants | ||||||
| Primary Competition | ||||||||||||
Inland Center Mall(2)(3) | 1966 / 2001 | 934,542 | $420 | 99% | 35.0 | Macy’s, Sears, Forever 21 | ||||||
| Victoria Gardens | 2004 / 2005 | 1,403,947 | $657 | 91% | 33.0 | Macy’s, Macy’s Men’s, Home & Children, JCPenney, Theaters, Bass Pro, Crate & Barrel | ||||||
| Ontario Mills | 1996 / 2002 | 1,480,446 | $650 | 99% | 36.0 | Theaters, JCPenney, Saks Off Fifth, Nordstrom Rack, Burlington Coat Factory, Marshall’s, Forever 21 | ||||||
| Secondary Competition | ||||||||||||
| Tanger Outlets Barstow | 1994 | 180,929 | $850 | 100% | 32.0 | Old Navy Outlet, Nike Factory Store, Calvin Klein Outlet, Reebok Factory Store | ||||||
| Jess Ranch Marketplace | 2007 | 579,055 | N/A | 99% | 6.0 | Theaters, Burlington Coat Factory, 24 Hour Fitness, Best Buy, Bed Bath & Beyond, Winco Foods, Petsmart | ||||||
| Montclair Plaza | 1970 / 2008 | 1,345,293 | $350 | 92% | 45.0 | JCPenney, Macy’s, Sears, Nordstrom, Barnes & Noble, Gold’s Gym | ||||||
| (1) | Per the appraisal. |
| (2) | Estimated occupancy for Inland Center Mall includes temporary tenants. Excluding temporary tenants, the estimated occupancy is 81.0%. |
| (3) | The loan sponsor has an interest in the property. |
THE INFORMATION IN THIS STRUCTURAL AND COLLATERAL TERM SHEET IS NOT COMPLETE AND MAY BE AMENDED PRIOR TO THE TIME OF SALE. THIS TERM SHEET IS NOT AN OFFER TO SELL THESE SECURITIES AND IT IS NOT A SOLICITATION OF AN OFFER TO BUY THESE SECURITIES IN ANY JURISDICTION WHERE THE OFFER OR SALE IS NOT PERMITTED.
| 41 of 124 | |
| Structural and Collateral Term Sheet | JPMBB 2014-C24 | |
| The Mall of Victor Valley | ||
Historical and Current Occupancy(1) | |||
| 2011 | 2012(2) | 2013 | Current(3) |
| 97.1% | 93.7% | 97.0% | 96.6% |
| (1) | Historical Occupancies are as of December 31 of each respective year and exclude temporary tenants with leases less than 6 months. |
| (2) | The Decrease in 2012 occupancy is primarily due to the renovation, expansion and relocation of the anchors at the property. |
| (3) | Current Occupancy is as of June 30, 2014 and includes five tenants totaling 16,793 square fee (including Spencer’s, Spaza Shoes, Shoe Palace, V Generation and Charlotte Russe), which have executed leases but are not yet in occupancy of their respective spaces. All tenants are expected to take occupancy between October and December 2014. |
Historical In-line Sales and Occupancy Costs(1) | |||||
| 2010 | 2011 | 2012 | 2013 | TTM(2) | |
| In-line Sales PSF | $395 | $428 | $460 | $495 | $491 |
| Occupancy Costs | 16.8% | 16.8% | 16.3% | 16.1% | 15.5% |
| (1) | In-line Sales PSF and Occupancy Costs are for comparable tenants less than 10,000 square feet that reported full year sales. |
| (2) | TTM Sales PSF and Occupancy Costs represent the trailing twelve months ending on June 30, 2014. |
Tenant Summary(1) | ||||||||||||||
| Tenant | Ratings(2) Moody’s/S&P/Fitch | Net Rentable Area (SF) | % of Total NRA | Base Rent PSF | Sales PSF(3) | Occupancy Costs(3) | Lease Expiration Date | |||||||
| Non-Collateral Anchor | ||||||||||||||
| Macy’s | Baa2 / BBB+ / BBB | 98,400 | N/A | N/A | $226 | N/A | N/A | |||||||
| Top 10 Collateral Tenants | ||||||||||||||
| JCPenney | Caa1 / CCC+ / CCC | 91,776 | 19.2% | $1.00 | $132 | 0.8% | 9/30/2032 | |||||||
| Sears | Caa1 / CCC+ / CCC | 78,212 | 16.4% | $5.50 | $195 | 2.8% | 10/24/2019 | |||||||
CineMark(4) | NA / BB- / NA | 62,118 | 13.0% | $18.25 | $405,391 | 17.5% | 11/30/2021 | |||||||
| Dick’s Sporting Goods | NA / NA / NA | 49,965 | 10.5% | $13.50 | $111 | 12.2% | 1/31/2024 | |||||||
| Barnes & Noble | NA / NA / NA | 25,221 | 5.3% | $9.96 | $184 | 5.4% | 1/31/2017 | |||||||
| Victoria’s Secret | Ba1 / BB+ / BB+ | 8,512 | 1.8% | $23.11 | $604 | 3.8% | 1/31/2024 | |||||||
| Tilly’s | NA / NA / NA | 6,973 | 1.5% | $27.03 | $400 | 6.8% | 1/31/2019 | |||||||
| V Generation | NA / NA / NA | 6,158 | 1.3% | $19.49 | $204 | 9.6% | 9/30/2019 | |||||||
| Famous Footwear | NA / NA / NA | 5,149 | 1.1% | $25.64 | $247 | 10.4% | 3/31/2015 | |||||||
| Red Robin Gourmet Burgers | NA / NA / NA | 4,836 | 1.0% | $18.36 | $290 | 6.3% | 9/30/2023 | |||||||
| (1) | Based on the underwritten rent roll. |
| (2) | Ratings provided are for the parent company of the entity listed in the “Tenant” field whether or not the parent company guarantees the lease. |
| (3) | Sales PSF and Occupancy Costs represent sales for the twelve-month period ending on June 30, 2014 for all tenants. |
| (4) | Sales PSF reflects sales per screen for CineMark, which is based on a total of 16 screens. |
THE INFORMATION IN THIS STRUCTURAL AND COLLATERAL TERM SHEET IS NOT COMPLETE AND MAY BE AMENDED PRIOR TO THE TIME OF SALE. THIS TERM SHEET IS NOT AN OFFER TO SELL THESE SECURITIES AND IT IS NOT A SOLICITATION OF AN OFFER TO BUY THESE SECURITIES IN ANY JURISDICTION WHERE THE OFFER OR SALE IS NOT PERMITTED.
| 42 of 124 | |
| Structural and Collateral Term Sheet | JPMBB 2014-C24 | |
| The Mall of Victor Valley | ||
Lease Rollover Schedule(1) | ||||||||||||||||||
| Year | Number of Leases Expiring | Net Rentable Area Expiring | % of NRA Expiring | Base Rent Expiring | % of Base Rent Expiring | Cumulative Net Rentable Area Expiring | Cumulative % of NRA Expiring | Cumulative Base Rent Expiring | Cumulative % of Base Rent Expiring | |||||||||
| Vacant | NAP | 16,074 | 3.4% | NAP | NAP | 16,074 | 3.4% | NAP | NAP | |||||||||
| 2014 & MTM | 6 | 7,802 | 1.6 | $0 | 0.0% | 23,876 | 5.0% | $0 | 0.0% | |||||||||
| 2015 | 15 | 25,947 | 5.4 | 927,674 | 10.2 | 49,823 | 10.4% | $927,674 | 10.2% | |||||||||
| 2016 | 20 | 17,059 | 3.6 | 1,184,342 | 13.0 | 66,882 | 14.0% | $2,112,016 | 23.2% | |||||||||
| 2017 | 10 | 39,039 | 8.2 | 969,390 | 10.7 | 105,921 | 22.2% | $3,081,405 | 33.9% | |||||||||
| 2018 | 6 | 9,490 | 2.0 | 558,242 | 6.1 | 115,411 | 24.2% | $3,639,647 | 40.0% | |||||||||
| 2019 | 12 | 106,304 | 22.3 | 1,555,882 | 17.1 | 221,715 | 46.4% | $5,195,529 | 57.1% | |||||||||
| 2020 | 3 | 7,237 | 1.5 | 315,024 | 3.5 | 228,952 | 48.0% | $5,510,553 | 60.6% | |||||||||
| 2021 | 4 | 68,232 | 14.3 | 1,230,279 | 13.5 | 297,184 | 62.3% | $6,740,832 | 74.1% | |||||||||
| 2022 | 3 | 3,867 | 0.8 | 188,899 | 2.1 | 301,051 | 63.1% | $6,929,731 | 76.2% | |||||||||
| 2023 | 5 | 13,211 | 2.8 | 450,834 | 5.0 | 314,262 | 65.8% | $7,380,565 | 81.1% | |||||||||
| 2024 | 3 | 60,411 | 12.7 | 984,243 | 10.8 | 374,673 | 78.5% | $8,364,808 | 92.0% | |||||||||
| 2025 & Beyond | 5 | 102,711 | 21.5 | 731,493 | 8.0 | 477,384 | 100.0% | $9,096,301 | 100.0% | |||||||||
| Total | 92 | 477,384 | 100.0% | $9,096,301 | 100.0% | |||||||||||||
| (1) | Based on the underwritten rent roll. |
| Operating History and Underwritten Net Cash Flow | ||||||||||||||
| 2011 | 2012 | 2013 | TTM(1) | Underwritten | Per Square Foot | %(2) | ||||||||
Rents in Place(3)(4) | $8,014,379 | $7,501,551 | $7,679,221 | $8,392,935 | $9,096,301 | $19.05 | 54.7% | |||||||
| Vacant Income | 0 | 0 | 0 | 0 | 867,662 | 1.82 | 5.2 | |||||||
| Gross Potential Rent | $8,014,379 | $7,501,551 | $7,679,221 | $8,392,935 | $9,963,963 | $20.87 | 59.9% | |||||||
| Common Area Maintenance | 4,130,958 | 4,253,093 | 4,414,762 | 4,492,446 | 4,509,293 | 9.45 | 27.1 | |||||||
| Percentage Rent | 496,221 | 351,963 | 460,025 | 381,467 | 391,443 | 0.82 | 2.4 | |||||||
Other Rental Income(5) | 1,857,243 | 1,760,105 | 1,886,804 | 1,872,713 | 1,763,275 | 3.69 | 10.6 | |||||||
| Net Rental Income | $14,498,801 | $13,866,712 | $14,440,812 | $15,139,561 | $16,627,974 | $34.83 | 100.0% | |||||||
| (Vacancy/Credit Loss) | 0 | 0 | 0 | 0 | (867,662) | (1.82) | (5.2) | |||||||
Other Income(6) | 56,473 | 8,598 | 170,287 | 364,720 | 348,418 | 0.73 | 2.1 | |||||||
| Effective Gross Income | $14,555,274 | $13,875,309 | $14,611,099 | $15,504,281 | $16,108,730 | $33.74 | 96.9% | |||||||
| Total Expenses | $4,305,042 | $4,306,246 | $4,548,802 | $4,567,492 | $4,853,504 | $10.17 | 30.1% | |||||||
| Net Operating Income | $10,250,231 | $9,569,064 | $10,062,297 | $10,936,789 | $11,255,226 | $23.58 | 69.9% | |||||||
| Total TI/LC, Capex/RR | 0 | 0 | 0 | 0 | 530,704 | 1.11 | 3.3 | |||||||
Net Cash Flow(7) | $10,250,231 | $9,569,064 | $10,062,297 | $10,936,789 | $10,724,522 | $22.47 | 66.6% | |||||||
| (1) | The TTM column represents the trailing twelve months ending on June 30, 2014. |
| (2) | Percentage column represents percent of Net Rental Income for all revenue lines and represents percent of Effective Gross Income for the remainder of fields. |
| (3) | The increase in Underwritten Rents in Place from TTM Rents in Place is primarily a result of Dick’s Sporting Goods opening in October 2013, which pays $674,528 in annual rent. |
| (4) | Underwritten Rents in Place include revenues attributable to five tenants, including Spencer’s, Spaza Shoes, Shoe Palace, V Generation and Charlotte Russe, which have executed leases but are not yet in occupancy of their respective spaces, and account for approximately $613,198 of rent. All tenants are expected to take occupancy between October and December 2014. |
| (5) | Other Rental Income consists of rents related to temporary tenants as well as other miscellaneous income. |
| (6) | The increase in TTM Other Income from 2013 Other Income is primarily a result of an increase in assistance payments from the city of Victorville. In September 2012, the borrower entered into an agreement with the city of Victorville, pursuant to which the borrower receives assistance payments from the city which equal the sales tax (currently 1.0%) at the property for total sales in excess of $100.0 million. The agreement expires in 2039, and the maximum amount the borrower can receive over the term of the agreement is approximately $18.9 million. Total sales at the property as of the TTM ended June 2014 were approximately $131.0 million. |
| (7) | The decrease in 2012 Net Cash Flow from 2011 Net Cash Flow is primarily due to the renovation, expansion and relocation of the anchor tenants at the property. |
Property Management. The property is managed by Macerich Property Management Company LLC, an affiliate of the borrower.
Escrows and Reserves. At origination, the borrower was required to deposit into escrow $576,610 for tenant improvements and leasing commissions.
Tax Escrows - The requirement for the borrower to make monthly deposits to the tax escrow is waived so long as there is no event of default, no Cash Trap Event Period exists and the borrower provides the lender with satisfactory evidence that taxes are timely paid.
THE INFORMATION IN THIS STRUCTURAL AND COLLATERAL TERM SHEET IS NOT COMPLETE AND MAY BE AMENDED PRIOR TO THE TIME OF SALE. THIS TERM SHEET IS NOT AN OFFER TO SELL THESE SECURITIES AND IT IS NOT A SOLICITATION OF AN OFFER TO BUY THESE SECURITIES IN ANY JURISDICTION WHERE THE OFFER OR SALE IS NOT PERMITTED.
| 43 of 124 | |
| Structural and Collateral Term Sheet | JPMBB 2014-C24 | |
| The Mall of Victor Valley | ||
Insurance Escrows - The requirement for the borrower to make monthly deposits to the insurance escrow is waived so long as there is no event of default, the property is insured under a blanket policy in accordance with the loan documents, no Cash Trap Event Period exists and the borrower provides the lender with satisfactory evidence of acceptable renewals upon request.
Replacement Reserves - The requirement for the borrower to make monthly deposits to the replacement reserve is waived so long as no Cash Trap Event Period exists. Following the occurrence and during the continuance of a Cash Trap Event Period, the borrower is required to deposit $8,017 per month (approximately $0.20 per square foot annually) for replacement reserves. The reserve is subject to a cap of $96,205 (approximately $0.20 per square foot).
TI/LC Reserves - The requirement for the borrower to make monthly deposits to the TI/LC reserve is waived so long as no Cash Trap Event Period exists. Following the occurrence and during the continuance of a Cash Trap Event Period, the borrower is required to deposit approximately $29,787 per month (approximately $0.75 per square foot annually) for TI/LC reserves. The reserve is subject to a cap of $536,170 (approximately $1.12 per square foot).
A “Cash Trap Event Period” means: (i) the occurrence and continuance of an event of default or (ii) the debt service coverage ratio as calculated in the loan documents falls below 1.10x as of the last day of the calendar quarter.
Lockbox / Cash Management. The loan is structured with a CMA lockbox. The borrower and the manager are required to have all collected rents deposited into the lockbox account controlled by the lender. The funds are then returned to an account controlled by the borrower until the occurrence of a Cash Trap Event Period. During the continuance of a Cash Trap Event Period, all rents will be swept weekly (and on the second business day preceding each payment date) to a segregated cash management account and held in trust and for the benefit of the lender. The lender will have a first priority security interest in the cash management account. During the continuance of a Cash Trap Event Period, all funds deposited into the cash management account after payment of debt service, required reserves and budgeted operating expenses will be held as additional security for the loan.
Release of Outparcels. The borrower is permitted to release certain non-income producing portions of the property from the lien of the mortgage loan in accordance with certain terms and conditions set forth in the loan documents.
THE INFORMATION IN THIS STRUCTURAL AND COLLATERAL TERM SHEET IS NOT COMPLETE AND MAY BE AMENDED PRIOR TO THE TIME OF SALE. THIS TERM SHEET IS NOT AN OFFER TO SELL THESE SECURITIES AND IT IS NOT A SOLICITATION OF AN OFFER TO BUY THESE SECURITIES IN ANY JURISDICTION WHERE THE OFFER OR SALE IS NOT PERMITTED.
| 44 of 124 | |
| Structural and Collateral Term Sheet | JPMBB 2014-C24 | |
| Columbus Square Portfolio | ||
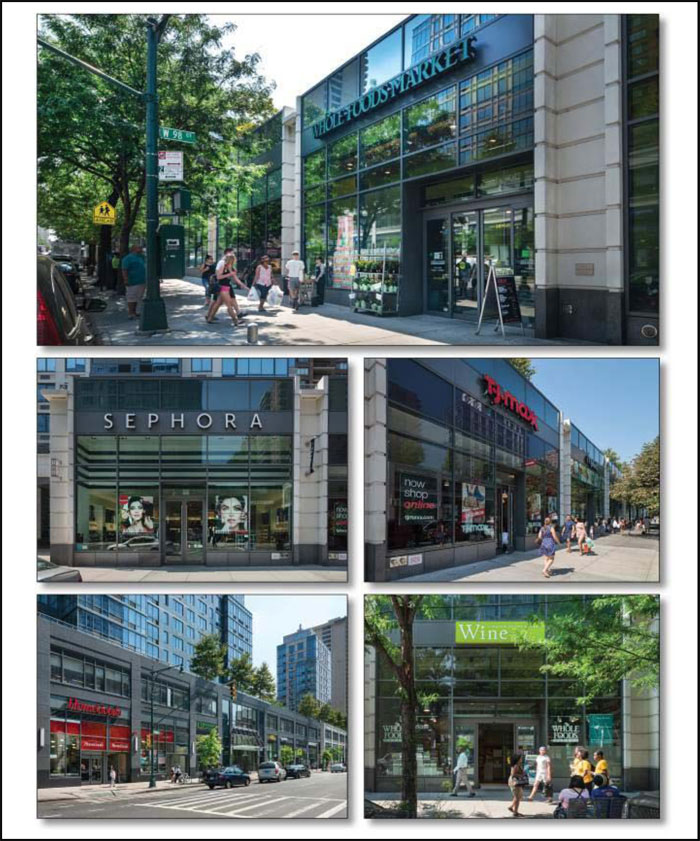
THE INFORMATION IN THIS STRUCTURAL AND COLLATERAL TERM SHEET IS NOT COMPLETE AND MAY BE AMENDED PRIOR TO THE TIME OF SALE. THIS TERM SHEET IS NOT AN OFFER TO SELL THESE SECURITIES AND IT IS NOT A SOLICITATION OF AN OFFER TO BUY THESE SECURITIES IN ANY JURISDICTION WHERE THE OFFER OR SALE IS NOT PERMITTED.
| 45 of 124 | |
| Structural and Collateral Term Sheet | JPMBB 2014-C24 | |
| Columbus Square Portfolio | ||
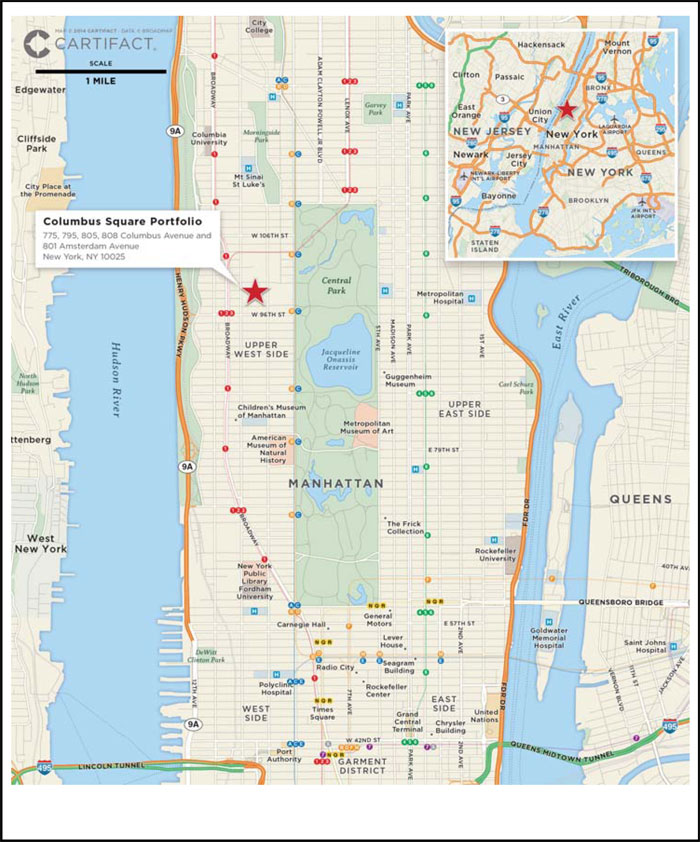
THE INFORMATION IN THIS STRUCTURAL AND COLLATERAL TERM SHEET IS NOT COMPLETE AND MAY BE AMENDED PRIOR TO THE TIME OF SALE. THIS TERM SHEET IS NOT AN OFFER TO SELL THESE SECURITIES AND IT IS NOT A SOLICITATION OF AN OFFER TO BUY THESE SECURITIES IN ANY JURISDICTION WHERE THE OFFER OR SALE IS NOT PERMITTED.
| 46 of 124 | |
| Structural and Collateral Term Sheet | JPMBB 2014-C24 | |
| Columbus Square Portfolio | ||
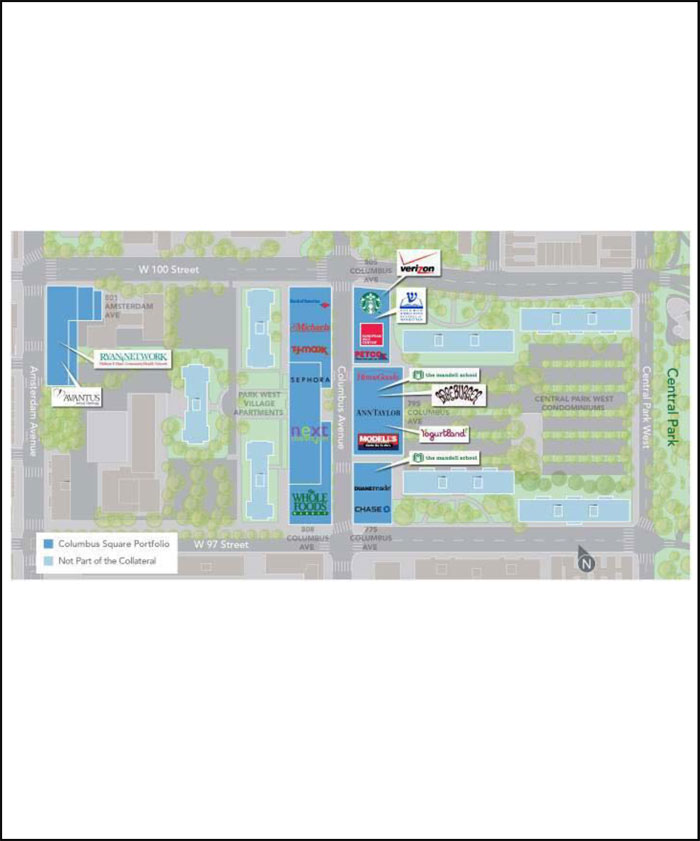
THE INFORMATION IN THIS STRUCTURAL AND COLLATERAL TERM SHEET IS NOT COMPLETE AND MAY BE AMENDED PRIOR TO THE TIME OF SALE. THIS TERM SHEET IS NOT AN OFFER TO SELL THESE SECURITIES AND IT IS NOT A SOLICITATION OF AN OFFER TO BUY THESE SECURITIES IN ANY JURISDICTION WHERE THE OFFER OR SALE IS NOT PERMITTED.
| 47 of 124 | |
| Structural and Collateral Term Sheet | JPMBB 2014-C24 | |
| Columbus Square Portfolio | ||
| Mortgage Loan Information | Property Information | |||
| Mortgage Loan Seller: | Barclays | Single Asset / Portfolio(1): | Single Asset | |
Original Principal Balance(2): | $96,250,000 | Title: | Fee | |
Cut-off Date Principal Balance(2): | $96,250,000 | Property Type - Subtype: | Mixed Use - Retail/Office/Parking | |
| % of Pool by IPB: | 7.6% | Net Rentable Area (SF): | 494,224 | |
| Loan Purpose: | Refinance | Location: | New York, NY | |
Borrowers(3): | Various | Year Built / Renovated: | 2007 - 2008 / N/A | |
Sponsors(4): | Various | Occupancy(5): | 95.7% | |
| Interest Rate: | 4.57000% | Occupancy Date: | 7/31/2014 | |
| Note Date: | 8/8/2014 | Number of Tenants(5): | 23 | |
| Maturity Date: | 8/11/2024 | 2011 NOI(6): | N/A | |
| Interest-only Period: | 42 months | 2012 NOI: | $20,421,271 | |
| Original Term: | 120 months | 2013 NOI(7): | $19,333,826 | |
| Original Amortization: | 420 months | UW Economic Occupancy: | 90.8% | |
| Amortization Type: | IO-Balloon | UW Revenues: | $29,269,650 | |
| Call Protection: | L(26),Def(90),O(4) | UW Expenses: | $2,376,810 | |
| Lockbox: | Hard | UW NOI(7): | $26,892,839 | |
| Additional Debt: | Yes | UW NCF: | $26,393,417 | |
| Additional Debt Balance: | $303,750,000 | Appraised Value / Per SF: | $555,000,000 / $1,123 | |
| Additional Debt Type: | Pari Passu | Appraisal Date: | 7/16/2014 | |
Escrows and Reserves(8) | Financial Information(2) | ||||||
| Initial | Monthly | Initial Cap | Cut-off Date Loan / SF: | $809 | |||
| Taxes: | $249,368 | $77,575 | N/A | Maturity Date Loan / SF: | $742 | ||
| Insurance: | $0 | Springing | N/A | Cut-off Date LTV: | 72.1% | ||
| Replacement Reserves: | $6,177 | $6,177 | $148,267 | Maturity Date LTV: | 66.1% | ||
| TI/LC: | $0 | Springing | $4,500,000 | UW NCF DSCR: | 1.15x | ||
| Other: | $0 | $0 | N/A | UW NOI Debt Yield: | 6.7% | ||
| Sources and Uses | ||||||
| Sources | Proceeds | % of Total | Uses | Proceeds | % of Total | |
Mortgage Loan(2) | $400,000,000 | 100.0% | Payoff Existing Debt | $271,916,460 | 68.0% | |
| Return of Equity | 120,756,773 | 30.2 | ||||
| Closing Costs | 7,071,223 | 1.8 | ||||
| Upfront Reserves | 255,545 | 0.1 | ||||
| Total Sources | $400,000,000 | 100.0% | Total Uses | $400,000,000 | 100.0% | |
| (1) | The single asset consists of five buildings located at 775, 795, 805, 808 Columbus Avenue and 801 Amsterdam Avenue. |
| (2) | Columbus Square Portfolio is part of a loan evidenced by four pari passu notes with an aggregate original principal balance of $400.0 million. The Financial Information presented in the chart above reflects the Cut-off Date balance of the $400.0 million Columbus Square Portfolio Whole Loan. |
| (3) | For a full description of the borrowers, please refer to “The Borrowers” below. |
| (4) | For a full description of the sponsors, please refer to “The Sponsors” below. |
| (5) | Occupancy and Number of Tenants includes two tenants, Avantus Renal Therapy (16,491 square feet) and Bareburger (1,909 square feet), which have executed leases, are in possession of their space and paying rent, but are not yet open for business. Avantus Renal Therapy expects to open in October 2014 and Bareburger expects to open in September/October 2014. |
| (6) | 2011 NOI is not available because historical statements prior to 2012 include the non-collateral apartment and condominium unit performance. |
| (7) | UW NOI is higher than 2013 NOI primarily due to approximately $4.1 million (approximately 134,382 square feet; 27.2% of total square feet) in new leasing activity along with approximately $910,000 in contractual rent increases and $2.1 million rent averaging for investment-grade rated tenants through each tenant’s respective lease term. |
| (8) | For a full description of Escrows and Reserves, please refer to “Escrows and Reserves” below. |
THE INFORMATION IN THIS STRUCTURAL AND COLLATERAL TERM SHEET IS NOT COMPLETE AND MAY BE AMENDED PRIOR TO THE TIME OF SALE. THIS TERM SHEET IS NOT AN OFFER TO SELL THESE SECURITIES AND IT IS NOT A SOLICITATION OF AN OFFER TO BUY THESE SECURITIES IN ANY JURISDICTION WHERE THE OFFER OR SALE IS NOT PERMITTED.
| 48 of 124 | |
| Structural and Collateral Term Sheet | JPMBB 2014-C24 | |
| Columbus Square Portfolio | ||
The Loan. The Columbus Square Portfolio loan is secured by a first mortgage lien on 494,224 square feet of five mixed use buildings located on the Upper West Side of New York, NY. The whole loan was co-originated by Barclays Bank PLC and Wells Fargo Bank, National Association and has an outstanding principal balance of $400.0 million (“Columbus Square Portfolio Whole Loan”), which is comprised of four pari passu notes, Note A-1 through Note A-4. Note A-4 has an outstanding balance as of the Cut-off Date of $96,250,000 and is being contributed to the JPMBB 2014-C24 trust. The controlling holder of Note A-1, which has an outstanding principal balance as of the Cut-off Date of $125,000,000, is the trustee of the WFRBS 2014-C22 trust (or, prior to the occurrence and continuance of a control event under the WFRBS 2014-C22 pooling and servicing agreement, the directing certificate holder for that securitization) and will be entitled to exercise all of the rights of the controlling noteholder with respect to the related Columbus Square Portfolio Whole Loan; however, the holder of the other pari passu notes will be entitled under certain circumstances, to consult with respect to certain major decisions. Note A-2, with an outstanding principal balance as of the Cut-off Date of $103,750,000 was contributed to the JPMBB 2014-C23 trust and Note A-3, with an outstanding principal balance as of the Cut-off Date of $75,000,000, was contributed to the WFRBS 2014-C23 trust. The Columbus Square Portfolio Whole Loan has a 10-year term, and subsequent to a 42-month interest-only period, will amortize on a 35-year schedule.
The Borrowers. The borrowing entities for the Columbus Square Portfolio Whole Loan are 808 Columbus Commercial Owner LLC, 775 Columbus LLC, 795 Columbus LLC, 805 Columbus LLC and 801 Amsterdam Commercial Owner LLC, each a Delaware limited liability company and special purpose entity.
The Sponsors. The loan sponsors and nonrecourse carve-out guarantors are Jacob Chetrit and Laurence Gluck. Jacob Chetrit is among the principals of The Chetrit Group. The Chetrit Group is a privately held real estate investment firm with management and operating experience in New York. Laurence Gluck is the founder of Stellar Management, an owner and operator of New York City residential and commercial real estate. Stellar Management focuses on real estate acquisitions, development and property management. Stellar Management’s portfolio contains over 12,000 apartments in 100 buildings in New York City, Washington D.C. and Miami.
The Property. Columbus Square Portfolio is a 494,224 square foot mixed use property, consisting of 31 condominium units within five buildings located at 775, 795, 805, 808 Columbus Avenue and 801 Amsterdam Avenue. The properties are located on three contiguous blocks stretching from 97th to 100th Streets along the entire eastern and western blockfronts of Columbus Avenue and the southeast corner of West 100th Street and Amsterdam Avenue within the Upper West Side neighborhood of New York City. The Columbus Square Portfolio buildings were constructed by the loan sponsor in 2007 and 2008 and consist predominantly of retail space, as detailed in the table below:
| Columbus Square Portfolio Overview | ||||||||||||||||||||||||||
| Building Name | Year Built | Net Rentable Area (SF) | % of Total NRA | Base Rent | % of Base Rent | Retail NRA | % of Building NRA | Community Facility NRA | % of Building NRA | Parking NRA | % of Building NRA | |||||||||||||||
| 775 Columbus | 2007 | 39,644 | 8.0% | $3,847,641 | 13.5% | 22,664 | 57.2% | 10,715 | 27.0% | 6,265 | 15.8% | |||||||||||||||
| 795 Columbus | 2007 | 104,218 | 21.1 | 6,927,149 | 24.3 | 59,911 | 57.5% | 44,307 | 42.5% | 0 | 0.0% | |||||||||||||||
| 805 Columbus | 2007 | 40,260 | 8.1 | 3,136,876 | 11.0 | 26,531 | 65.9% | 13,729 | 34.1% | 0 | 0.0% | |||||||||||||||
| 808 Columbus | 2007 | 240,852 | 48.7 | 12,385,867 | 43.4 | 157,177 | 65.3% | 0 | 0.0% | 83,675 | 34.7% | |||||||||||||||
| 801 Amsterdam | 2008 | 69,250 | 14.0 | 2,252,890 | 7.9 | 9,674 | 14.0% | 41,072 | 59.3% | 18,504 | 26.7% | |||||||||||||||
| Total/Wtd. Avg. | 494,224 | 100.0% | $28,550,424 | 100.0% | 275,957 | 55.8% | 109,823 | 22.2% | 108,444 | 21.9% | ||||||||||||||||
The retail space is comprised of 275,957 square feet, with approximately 98,000 square feet at grade level and 178,000 square feet of below grade space. The retail portion of the Columbus Square Portfolio is located along Columbus Avenue and is anchored by Whole Foods, which recently expanded with an adjoining 2,775 square foot wine store (the first Whole Foods wine store in New York City), TJ Maxx, which added its HomeGoods concept after experiencing high sales volumes, and Michael’s, which expanded into an additional 10,572 square feet in March 2013. Eight tenants (or their parent companies), accounting for approximately 33.1% of total square feet and 48.9% of the underwritten base rent, are rated investment-grade, and only 33.9% of the total square footage is scheduled to expire during the loan term. The majority of the community facility portion of the Columbus Square Portfolio is leased to the Mandell School, a private co-educational institution founded in 1939 for pre-school through eighth graders. The 775 and 795 Columbus properties house the Mandell School’s elementary and preparatory divisions and its Upper West Side pre-school. Three below-grade parking garages containing 392 parking spaces and 108,444 square feet are leased to Quik Park and comprise the remainder of the Columbus Square Portfolio. The sponsors began to assemble land for this project in the late 1990s, and transformed the site, from condominiums and rent-controlled apartments, into a 24/7 “live, work and play” neighborhood. The Columbus Square Portfolio is situated in the Columbus Square mixed use development, which includes the Columbus Square Luxury Apartments (located above the Columbus Square Portfolio), the Park West Village Apartments and Central Park West Condominiums, which include over 3,200 units and 13,000 residents combined. No portion of the Columbus Square Luxury Apartments, Park West Village Apartments and the Central Park West Condominiums are collateral for the Columbus Square Portfolio Whole Loan. As of July 31, 2014, the property was 95.7% occupied by 23 tenants.
THE INFORMATION IN THIS STRUCTURAL AND COLLATERAL TERM SHEET IS NOT COMPLETE AND MAY BE AMENDED PRIOR TO THE TIME OF SALE. THIS TERM SHEET IS NOT AN OFFER TO SELL THESE SECURITIES AND IT IS NOT A SOLICITATION OF AN OFFER TO BUY THESE SECURITIES IN ANY JURISDICTION WHERE THE OFFER OR SALE IS NOT PERMITTED.
| 49 of 124 | |
| Structural and Collateral Term Sheet | JPMBB 2014-C24 | |
| Columbus Square Portfolio | ||
The Columbus Square Portfolio is situated on two abutting city blocks bounded by 100th Street to the north, 97th Street to the south, Amsterdam Avenue to the west and Columbus Avenue to the east in the Upper West Side neighborhood of Manhattan. The Upper West Side is an upscale, primarily residential area known for its cultural, educational and historical institutions, including Columbia University (1.0 mile north of the Columbus Square Portfolio), Lincoln Center (1.8 miles south) and the American Museum of Natural History (1.0 mile south). The Columbus Square Portfolio is part of the larger Columbus Square development, which contains five buildings, 500,000 square feet of retail and community facility space, over 3,200 units and over 13,000 people combined. Nearby and adjacent uses include a mix of high-rise, luxury and market rate residential buildings with multi-level retail and older pre-war high rise residential buildings, providing significant foot traffic for the Columbus Square Portfolio. According to a third party market research report, within a half mile radius of the property, the median household income is approximately $111,000 and the median home value is approximately $905,000.
The Columbus Square Portfolio neighborhood is serviced by an excellent transportation network via subway and public bus. The Columbus Square Portfolio is located one block northwest of the 96th Street (at Central Park West) subway station, which provides access to the B and C subway lines and two blocks northeast of 96th Street (at Broadway) subway station, which provides access to the 1, 2 and 3 subway lines. Further, the Metropolitan Transit Authority bus system makes this neighborhood accessible from virtually all locations north, south and east. Crosstown buses run along 66th, 79th-81st, 86th, 96th/97th and 110th Streets. Uptown bus service is available along Central Park West, Amsterdam Avenue, Broadway and Riverside Drive, and downtown buses run along Central Park West, Columbus Avenue, Broadway and Riverside Drive.
According to a third party market research report, the Columbus Square Portfolio is located within the Upper West Side submarket. As of the second quarter of 2014, the retail submarket had a total inventory of approximately 4.3 million square feet across 266 buildings. The retail submarket reported a vacancy rate of 1.2%, down from 6.3% as of the fourth quarter of 2007, with an average retail rent of approximately $103.49 per square foot on a gross adjusted basis. The appraisal concluded a market rent per square foot equal to a range between $200.00 and $225.00 for retail-corner space, $250.00 for inline space less than 500 square feet, a range between $150.00 and $185.00 for inline space greater than or equal to 500 square feet, a range between $50.00 and $55.00 for lower-level retail space and a range between $55.00 and $90.00 for multi-level retail space. Additionally, the appraisal concluded a market rent of $55.00 per square foot on a gross basis for the community facility space, and $5,000 per licensed space for the parking garage, which equates to a rent of $18.07 per square foot of parking square footage.
Historical and Current Occupancy(1) | |||
2011(2) | 2012(3) | 2013(3) | Current(4) |
| N/A | 71.9% | 75.0% | 95.7% |
| (1) | Historical Occupancies are as of December 31 of each respective year. |
| (2) | 2011 Historical Occupancy is not available because historical statements prior to 2012 include the non-collateral apartment and condominium unit performance. |
| (3) | 2012 and 2013 Historical Occupancy is lower as the Columbus Square Portfolio was still in lease-up phase. While the buildings were constructed in 2007 and 2008, the final building (805 Columbus Avenue) did not open until August 2010. Approximately 134,382 square feet (27.2% of total square feet) in new leases were signed in 2013 and 2014. |
| (4) | Current Occupancy is as of July 31, 2014. Current Occupancy includes two tenants, Avantus Renal Therapy (16,491 square feet) and Bareburger (1,909 square feet), which have executed leases, are in possession of their space and paying rent, but are not yet open for business. Avantus Renal Therapy expects to open in October 2014 and Bareburger expects to open in September/October 2014. |
Tenant Summary(1) | ||||||||||||||||||
| Tenant | Ratings(2) Moody’s/S&P/Fitch | Net Rentable Area (SF) | % of Total NRA | Base Rent PSF | Sales PSF(3) | Occupancy Costs(3) | Lease Expiration Date | |||||||||||
| Quik Park | NA / NA / NA | 108,444 | 21.9% | $16.65 | N/A | N/A | 4/30/2029 | |||||||||||
| Whole Foods | NA / BBB- / NA | 62,454 | 12.6% | $73.06(4) | N/A | N/A | 8/31/2029 | |||||||||||
Mandell School(5) | NA / NA / NA | 55,022 | 11.1% | $58.79 | N/A | N/A | 6/30/2030 | |||||||||||
| TJ Maxx | A3 / A+ / NA | 40,550 | 8.2% | $47.21(6) | $512 | 8.4% | 10/31/2019 | |||||||||||
| Michael’s | NA / B / NA | 34,424 | 7.0% | $57.37 | N/A | N/A | 3/31/2020 | |||||||||||
| HomeGoods | A3 / A+ / NA | 27,019 | 5.5% | $71.58(7) | $362 | 18.4% | 5/31/2021 | |||||||||||
| Modell’s | NA / NA / NA | 25,215 | 5.1% | $46.32 | N/A | N/A | 1/31/2031 | |||||||||||
| William F Ryan | NA / NA / NA | 24,581 | 5.0% | $47.04 | N/A | N/A | 12/31/2057 | |||||||||||
| Petco | B3 / B / NA | 19,487 | 3.9% | $95.96 | N/A | N/A | 10/31/2020 | |||||||||||
| Duane Reade | Baa1 / BBB / NA | 17,196 | 3.5% | $80.46(8) | N/A | N/A | 10/31/2030 | |||||||||||
| (1) | Based on the underwritten rent roll. |
| (2) | Ratings provided are for the parent company of the entity listed in the “Tenant” field whether or not the parent company guarantees the lease. |
| (3) | Sales PSF and Occupancy Costs are based on current in-place rent and sales for the twelve-month period ending January 31, 2014. |
| (4) | The Base Rent PSF for Whole Foods represents the tenant’s average rent over the lease term. The tenant’s current in-place rent is $59.75 per square foot. |
| (5) | Mandell School has the right to terminate its lease at any time with four months’ written notice and payment of a termination fee equal to three years’ rent (three years’ rent totals approximately $8.4 million through June 2015, $9.7 million through June 2020, $11.2 million through June 2025 and $12.8 million through June 2030). |
| (6) | The Base Rent PSF for TJ Maxx represents the tenant’s average rent over the lease term. The tenant’s current in-place rent is $43.04 per square foot. |
| (7) | The Base Rent PSF for HomeGoods represents the tenant’s average rent over the lease term. The tenant’s current in-place rent is $66.62 per square foot. |
| (8) | The Base Rent PSF for Duane Reade represents the tenant’s average rent over the lease term. The tenant’s current in-place rent is $64.90 per square foot. |
THE INFORMATION IN THIS STRUCTURAL AND COLLATERAL TERM SHEET IS NOT COMPLETE AND MAY BE AMENDED PRIOR TO THE TIME OF SALE. THIS TERM SHEET IS NOT AN OFFER TO SELL THESE SECURITIES AND IT IS NOT A SOLICITATION OF AN OFFER TO BUY THESE SECURITIES IN ANY JURISDICTION WHERE THE OFFER OR SALE IS NOT PERMITTED.
| 50 of 124 | |
| Structural and Collateral Term Sheet | JPMBB 2014-C24 | |
| Columbus Square Portfolio | ||
Lease Rollover Schedule(1) | |||||||||||||||||||||
| Year | Number of Leases Expiring | Net Rentable Area Expiring | % of NRA Expiring | Base Rent Expiring | % of Base Rent Expiring | Cumulative Net Rentable Area Expiring | Cumulative % of NRA Expiring | Cumulative Base Rent Expiring | Cumulative % of Base Rent Expiring | ||||||||||||
| Vacant | NAP | 21,317 | 4.3% | NAP | NAP | 21,317 | 4.3% | NAP | NAP | ||||||||||||
| 2014 & MTM | 0 | 0 | 0.0 | $0 | 0.0% | 21,317 | 4.3% | $0 | 0.0% | ||||||||||||
| 2015 | 0 | 0 | 0.0 | 0 | 0.0 | 21,317 | 4.3% | $0 | 0.0% | ||||||||||||
| 2016 | 0 | 0 | 0.0 | 0 | 0.0 | 21,317 | 4.3% | $0 | 0.0% | ||||||||||||
| 2017 | 0 | 0 | 0.0 | 0 | 0.0 | 21,317 | 4.3% | $0 | 0.0% | ||||||||||||
| 2018 | 0 | 0 | 0.0 | 0 | 0.0 | 21,317 | 4.3% | $0 | 0.0% | ||||||||||||
| 2019 | 1 | 40,550 | 8.2 | 1,914,494 | 6.7 | 61,867 | 12.5% | $1,914,494 | 6.7% | ||||||||||||
| 2020 | 4 | 68,153 | 13.8 | 4,546,123 | 15.9 | 130,020 | 26.3% | $6,460,617 | 22.6% | ||||||||||||
| 2021 | 2 | 28,550 | 5.8 | 2,193,499 | 7.7 | 158,570 | 32.1% | $8,654,116 | 30.3% | ||||||||||||
| 2022 | 2 | 1,512 | 0.3 | 250,813 | 0.9 | 160,082 | 32.4% | $8,904,929 | 31.2% | ||||||||||||
| 2023 | 3 | 19,798 | 4.0 | 1,412,400 | 4.9 | 179,880 | 36.4% | $10,317,329 | 36.1% | ||||||||||||
| 2024 | 2 | 8,966 | 1.8 | 1,788,736 | 6.3 | 188,846 | 38.2% | $12,106,066 | 42.4% | ||||||||||||
| 2025 & Beyond | 9 | 305,378 | 61.8 | 16,444,358 | 57.6 | 494,224 | 100.0% | $28,550,424 | 100.0% | ||||||||||||
| Total | 23 | 494,224 | 100.0% | $28,550,424 | 100.0% | ||||||||||||||||
| (1) | Based on the underwritten rent roll. |
| Operating History and Underwritten Net Cash Flow | ||||||||||
| 2012 | 2013 | Underwritten | Per Square Foot | %(1) | ||||||
Rents in Place(2)(3) | $22,345,979 | $21,411,531 | $28,550,424 | $57.77 | 90.3% | |||||
| Vacant Income | 0 | 0 | 2,917,555 | 5.90 | 9.2 | |||||
| Gross Potential Rent | $22,345,979 | $21,411,531 | $31,467,979 | $63.67 | 99.5% | |||||
| Total Reimbursements | 1,025,172 | 83,728 | 152,226 | 0.31 | 0.5 | |||||
| Net Rental Income | $23,371,151 | $21,495,259 | $31,620,205 | $63.98 | 100.0% | |||||
| (Vacancy/Credit Loss) | 0 | 0 | (2,917,555) | (5.90) | (9.2) | |||||
| Other Income | 265,178 | 326,591 | 567,000 | 1.15 | 1.8 | |||||
| Effective Gross Income | $23,636,329 | $21,821,850 | $29,269,650 | $59.22 | 92.6% | |||||
Total Expenses(4) | $3,215,058 | $2,488,024 | $2,376,810 | $4.81 | 8.1% | |||||
| Net Operating Income | $20,421,271 | $19,333,826 | $26,892,839 | $54.41 | 91.9% | |||||
| Total TI/LC, Capex/RR | 0 | 0 | 499,422 | 1.01 | 1.7 | |||||
| Net Cash Flow | $20,421,271 | $19,333,826 | $26,393,417 | $53.40 | 90.2% | |||||
| (1) | Percentage column represents percent of Net Rental Income for all revenue lines and represents percent of Effective Gross Income for the remainder of fields. |
| (2) | Underwritten Rents in Place are based on the July 31, 2014 rent roll, with rent bumps underwritten through September 30, 2015. |
| (3) | Underwritten Rents in Place is higher than 2013 primarily due to approximately $4.1 million (approximately 134,382 square feet; 27.2% of total square feet) in new leasing activity along with approximately $910,000 in contractual rent increases and $2.1 million rent averaging for investment-grade rated tenants through each tenant’s respective lease term. |
| (4) | The Columbus Square Portfolio benefits from Industrial and Commercial Incentive Programs (“ICIPs”) and 421a tax exemptions (the parking garages benefit from the 421a exemptions), which result in a reduced property tax expense. For a full description, please see “Tax Abatement” below. |
Property Management. The property is managed by Columbus Square Management LLC, an affiliate of the loan sponsors.
Purchase Option. A tenant at the 801 Amsterdam property, William F Ryan (24,581 square feet; 5.0% of total square feet) may exercise a purchase option on the tenant’s leased condominium unit (provided the tenant is not in default of the lease) at a purchase price of $19.8 million. In the event the purchase option is exercised (between January 2020 and January 2030), the borrowers must release the 801 Amsterdam property from the lien of the Columbus Square Portfolio Whole Loan mortgage with payment of a release price equal to $51.5 million, together with any applicable yield maintenance charges, subject to, among other things: (i) confirmation of compliance with zoning and subdivision requirements; (ii) confirmation from rating agencies that such release will not result in a downgrade, withdrawal or qualification of the respective ratings assigned to the Certificates, and similar confirmations with respect to the ratings of any securities backed by the other Columbus Square Portfolio notes; and (iii) opinion of counsel that the REMIC trust will not fail to maintain its REMIC status due to the partial release.
Tax Abatement. The Columbus Square Portfolio benefits from Industrial and Commercial Incentive Programs (“ICIPs”) and 421a tax exemptions (the parking garages benefit from the 421a exemptions), which result in a reduced property tax expense. The property tax expense as of year-end 2013 was $140,846. The ICIPs expire in the 2034/2035 tax year and will be gradually phased out beginning in the 2025/2026 tax year. The 421a exemptions expire in the 2021/2022, 2022/2023 and 2030/2031 tax years and will be gradually phased out beginning in the 2013/2014, 2014/2015 and 2022/2023 tax years for the buildings located at 801 Amsterdam Avenue, 775 Columbus Avenue and 808 Columbus Avenue, respectively. The underwritten property tax expense of $949,975 is based on the
THE INFORMATION IN THIS STRUCTURAL AND COLLATERAL TERM SHEET IS NOT COMPLETE AND MAY BE AMENDED PRIOR TO THE TIME OF SALE. THIS TERM SHEET IS NOT AN OFFER TO SELL THESE SECURITIES AND IT IS NOT A SOLICITATION OF AN OFFER TO BUY THESE SECURITIES IN ANY JURISDICTION WHERE THE OFFER OR SALE IS NOT PERMITTED.
| 51 of 124 | |
| Structural and Collateral Term Sheet | JPMBB 2014-C24 | |
| Columbus Square Portfolio | ||
current abated tax expense and is projected to increase to $1,638,023 by the time the Columbus Square Portfolio Whole Loan matures. According to the leases, all tax increases may be passed through to the tenants at the Columbus Square Portfolio.
Escrows and Reserves. At origination, the borrowers were required to deposit into escrow $249,368 for real estate taxes and $6,177 for replacement reserves.
Tax Escrows - On a monthly basis, the borrowers are required to escrow 1/12 of the annual estimated tax payments, which currently equates to $77,575.
Insurance Escrows - The requirement for the borrowers to make monthly deposits into the insurance escrow is waived so long as no event of default exists and the borrowers provide satisfactory evidence that the property is insured as part of a blanket policy in accordance with the loan documents.
Replacement Reserves - On a monthly basis, the borrowers are required to escrow $6,177 (approximately $0.15 per square foot annually) for replacement reserves. The reserve is subject to a cap of $148,267 (approximately $0.30 per square foot).
TI/LC Reserves - Beginning with the monthly payment date in January 2018, on a monthly basis, the borrowers are required to escrow $70,726 (approximately $1.72 per square foot annually) for TI/LC reserves. The reserve is subject to a cap of $4,500,000 (approximately $9.11 per square foot).
Lockbox / Cash Management. The loan is structured with a hard lockbox and in-place cash management. The borrowers were required to send tenant direction letters to tenants instructing them to deposit all rents and payments into the lockbox account controlled by the lender. All funds in the lockbox account are swept daily to a cash management account under the control of the lender and disbursed during each monthly payment date of the term of the loan in accordance with the loan documents. To the extent that there is a Cash Sweep Event, all excess cash flow after payment of debt service, required reserves and operating expenses will be held as additional collateral for the loan.
A “Cash Sweep Event” means: the period commencing upon the earlier of (i) an event of default or (ii) the debt yield being less than 5.25%. For the purposes of testing for a Cash Sweep Event, debt yield will be calculated using (a) net operating income less (i) normalized tenant improvement and leasing commission expenditures equal to $0.92 per square foot and (ii) normalized capital improvements equal to $0.10 per square foot, as the numerator and the (b) outstanding principal amount of the loan as the denominator.
THE INFORMATION IN THIS STRUCTURAL AND COLLATERAL TERM SHEET IS NOT COMPLETE AND MAY BE AMENDED PRIOR TO THE TIME OF SALE. THIS TERM SHEET IS NOT AN OFFER TO SELL THESE SECURITIES AND IT IS NOT A SOLICITATION OF AN OFFER TO BUY THESE SECURITIES IN ANY JURISDICTION WHERE THE OFFER OR SALE IS NOT PERMITTED.
| 52 of 124 | |
| Structural and Collateral Term Sheet | JPMBB 2014-C24 | |
| 635 Madison Avenue | ||
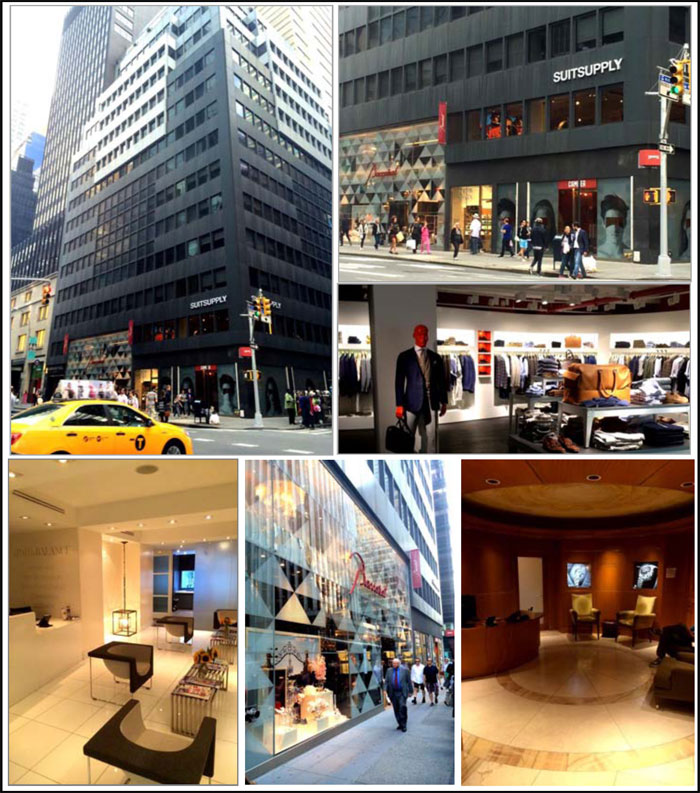
THE INFORMATION IN THIS STRUCTURAL AND COLLATERAL TERM SHEET IS NOT COMPLETE AND MAY BE AMENDED PRIOR TO THE TIME OF SALE. THIS TERM SHEET IS NOT AN OFFER TO SELL THESE SECURITIES AND IT IS NOT A SOLICITATION OF AN OFFER TO BUY THESE SECURITIES IN ANY JURISDICTION WHERE THE OFFER OR SALE IS NOT PERMITTED.
| 53 of 124 | |
��
| Structural and Collateral Term Sheet | JPMBB 2014-C24 | |
635 Madison Avenue | ||
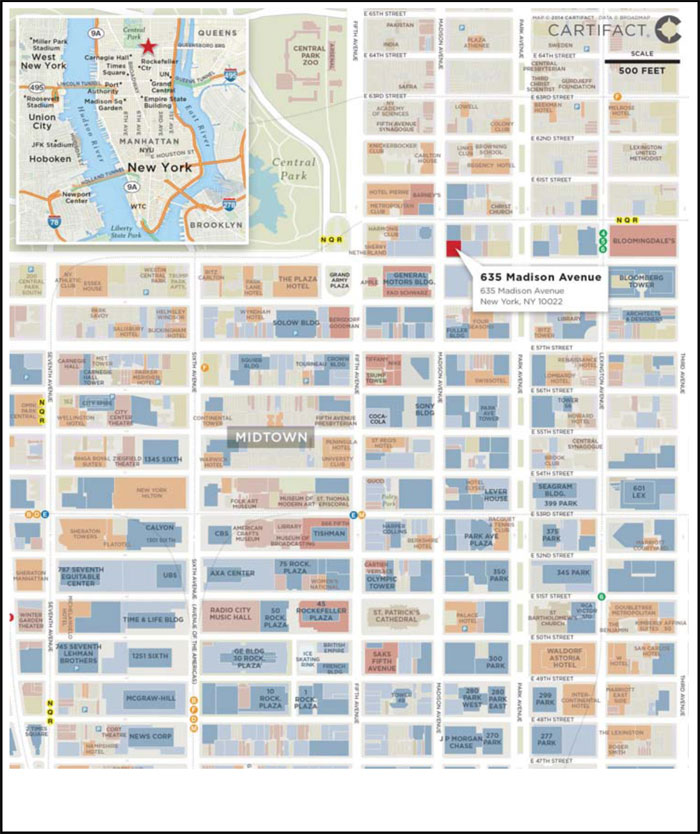
THE INFORMATION IN THIS STRUCTURAL AND COLLATERAL TERM SHEET IS NOT COMPLETE AND MAY BE AMENDED PRIOR TO THE TIME OF SALE. THIS TERM SHEET IS NOT AN OFFER TO SELL THESE SECURITIES AND IT IS NOT A SOLICITATION OF AN OFFER TO BUY THESE SECURITIES IN ANY JURISDICTION WHERE THE OFFER OR SALE IS NOT PERMITTED.
| 54 of 124 | |
| Structural and Collateral Term Sheet | JPMBB 2014-C24 | |
| 635 Madison Avenue | ||
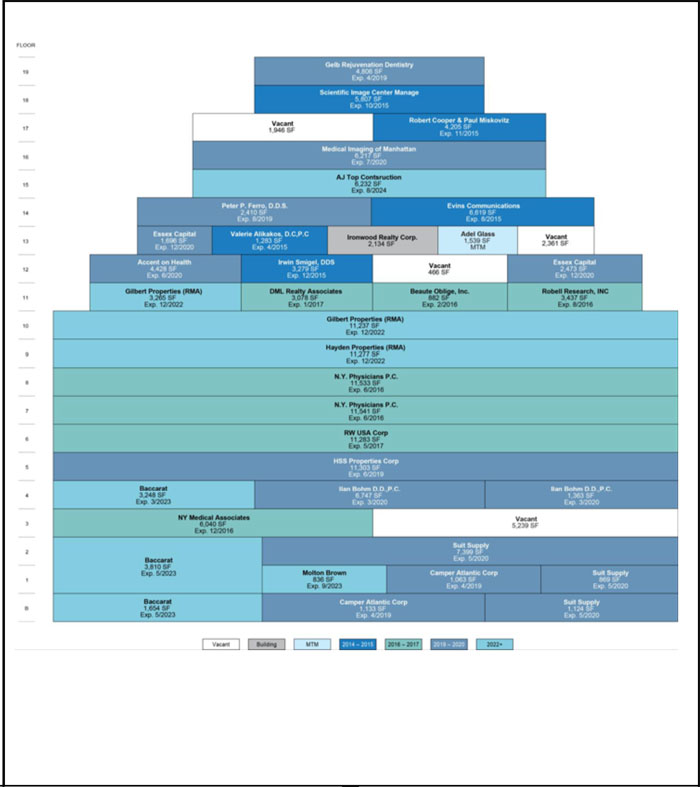
THE INFORMATION IN THIS STRUCTURAL AND COLLATERAL TERM SHEET IS NOT COMPLETE AND MAY BE AMENDED PRIOR TO THE TIME OF SALE. THIS TERM SHEET IS NOT AN OFFER TO SELL THESE SECURITIES AND IT IS NOT A SOLICITATION OF AN OFFER TO BUY THESE SECURITIES IN ANY JURISDICTION WHERE THE OFFER OR SALE IS NOT PERMITTED.
| 55 of 124 | |
| Structural and Collateral Term Sheet | JPMBB 2014-C24 | |
| 635 Madison Avenue | ||
| Mortgage Loan Information | Property Information | |||
| Mortgage Loan Seller: | JPMCB | Single Asset / Portfolio: | Single Asset | |
| Original Principal Balance: | $90,000,000 | Title: | Leasehold | |
| Cut-off Date Principal Balance: | $90,000,000 | Property Type - Subtype: | Mixed Use – Office/Retail | |
| % of Pool by IPB: | 7.1% | Net Rentable Area (SF): | 177,262 | |
| Loan Purpose: | Refinance | Location: | New York, NY | |
| Borrower: | Ironwood Realty Corporation | Year Built / Renovated: | 1957 / 2005 | |
| Sponsor: | Ben Ashkenazy | Occupancy: | 94.4% | |
Interest Rate(1): | 4.47917% | Occupancy Date: | 7/31/2014 | |
| Note Date: | 9/23/2014 | Number of Tenants: | 26 | |
| Maturity Date: | 10/1/2024 | 2011 NOI(2): | N/A | |
| Interest-only Period: | 60 months | 2012 NOI: | $4,373,973 | |
| Original Term: | 120 months | 2013 NOI(3): | $5,106,135 | |
| Original Amortization: | 360 months | TTM NOI (as of 6/2014) (3)(4): | $7,050,237 | |
| Amortization Type: | IO-Balloon | UW Economic Occupancy: | 95.1% | |
| Call Protection: | L(24),Def(93),O(3) | UW Revenues: | $17,977,859 | |
| Lockbox: | Hard | UW Expenses: | $9,755,486 | |
| Additional Debt: | Yes | UW NOI(4): | $8,222,372 | |
| Additional Debt Balance: | $35,000,000 | UW NCF: | $7,841,259 | |
| Additional Debt Type: | Mezzanine Loan | Appraised Value / Per SF: | $195,000,000 / $1,100 | |
| Appraisal Date: | 7/21/2014 | |||
Escrows and Reserves(5) | Financial Information | ||||||
| Initial | Monthly | Initial Cap | Cut-off Date Loan / SF: | $508 | |||
| Taxes: | $1,180,693 | $295,173 | N/A | Maturity Date Loan / SF: | $465 | ||
| Insurance: | $0 | Springing | N/A | Cut-off Date LTV: | 46.2% | ||
| Replacement Reserves: | $2,954 | $2,954 | N/A | Maturity Date LTV: | 42.2% | ||
| TI/LC: | $33,237 | $33,237 | $1,994,220 | UW NCF DSCR: | 1.44x | ||
| Other: | $2,788,063 | $306,465 | N/A | UW NOI Debt Yield: | 9.1% | ||
| Sources and Uses | ||||||
| Sources | Proceeds | % of Total | Uses | Proceeds | % of Total | |
| Mortgage Loan | $90,000,000 | 72.0% | Repay Existing Debt | $56,500,000 | 45.2% | |
| Mezzanine Loan | 35,000,000 | 28.0 | Return of Equity | 55,844,936 | 44.7 | |
| Closing Costs | 8,650,117 | 6.9 | ||||
| Upfront Reserves | 4,004,947 | 3.2 | ||||
| Total Sources | $125,000,000 | 100.0% | Total Uses | $125,000,000 | 100.0% | |
| (1) | The Interest Rate is 4.479167% when extended to full precision. |
| (2) | The loan sponsor purchased the property in October 2011 and did not provide borrower financial statements for 2011. |
| (3) | The increase in 2013 and TTM NOI is primarily the result of the retail space being leased to new tenants or retail tenant leases rolling over at higher rents. |
| (4) | The increase in UW NOI from TTM NOI is primarily the result of contractual rent increases through July 2015 and 7,595 square feet of newly executed leases. For additional details, please refer to the “Operating History and Underwritten Net Cash Flow” table below. |
| (5) | For a full description of Escrows and Reserves, please refer to “Escrows and Reserves” below. |
The Loan. The 635 Madison Avenue loan has an outstanding balance of $90.0 million and is secured by a first mortgage lien on the borrower’s leasehold interest in a 19-story, 177,262 square foot mixed use building located in New York, New York. The property is subject to a ground lease that commenced on January 26, 1955 which is set to expire on April 30, 2030 but has a fully extended maturity date of April 30, 2051. The loan has a ten-year term and, subsequent to a five-year interest-only period, will amortize on a 30-year schedule. The previously existing debt was securitized in 2007 as part of the WBCMT 2007-C31 securitization.
The Borrower. The borrowing entity for the 635 Madison Avenue loan is Ironwood Realty Corporation, a Delaware corporation and special purpose entity.
THE INFORMATION IN THIS STRUCTURAL AND COLLATERAL TERM SHEET IS NOT COMPLETE AND MAY BE AMENDED PRIOR TO THE TIME OF SALE. THIS TERM SHEET IS NOT AN OFFER TO SELL THESE SECURITIES AND IT IS NOT A SOLICITATION OF AN OFFER TO BUY THESE SECURITIES IN ANY JURISDICTION WHERE THE OFFER OR SALE IS NOT PERMITTED.
| 56 of 124 | |
| Structural and Collateral Term Sheet | JPMBB 2014-C24 | |
| 635 Madison Avenue | ||
The Sponsor. The loan sponsor and nonrecourse carve-out guarantor is Ben Ashkenazy, CEO/Chairman of Ashkenazy Acquisition Corporation (“AAC”). Headquartered in New York City, AAC is a private real estate investment firm focusing on retail and office assets. AAC has acquired over 13 million square feet of retail, office and residential properties, located throughout the United States, Canada and England. The company currently owns a portfolio containing more than 100 buildings valued at approximately $7.0 billion.
The loan sponsor purchased the property in July 2011 for approximately $61.0 million, which was financed through the assumption of the in-place securitized first mortgage of $56.5 million. Since acquisition, the loan sponsor has invested approximately $3.5 million in capital improvements.
The Property. 635 Madison Avenue is a 19-story, 177,262 square foot, Class A mixed use office/retail building located at the northeast corner of 59th Street and Madison Avenue in the Plaza District of Midtown Manhattan. Constructed in 1957, the office portion encompasses 156,126 square feet (88.1% of the net rentable area) of the building with the remaining 21,136 square feet (11.9% of the net rentable area) consisting of retail space on the ground and mezzanine floor levels. As of July 2014, the property was 94.4% leased to 26 tenants.
The office portion of the property is primarily leased to a mix of smaller tenants and medical office users. The largest tenant at the property, Reproductive Medical Associates, leases approximately 14.5% of the net rentable area through December 2022 with one five-year extension option remaining. Founded in 2001, Reproductive Medical Associates is a medical treatment company specializing in fertility treatment. The tenant initially leased space at the property in March 2001. Since then, it has expanded its space and extended its lease maturity through December 2022. The second largest tenant at the property, N.Y. Physicians P.C., leases approximately 13.0% of the net rentable area through June 2016. N.Y. Physicians P.C. is a group medical practice representing multiple specialties from internal medicine, obstetrics-gynecology, endocrinology, gastroenterology, rheumatology, orthopedics, and vascular surgery. N.Y. Physicians P.C. has been a tenant at the property since 1996 and renewed in 2006 through its current lease expiration in June 2016. The third largest tenant at the property, HSS Properties Corp. (Hospital for Special Surgery, “HSS”), leases approximately 6.4% of the net rentable area through June 2019. Founded in 1863, HSS is a leader in orthopedics, rheumatology and rehabilitation. HSS is nationally ranked #1 in orthopedics, #3 in rheumatology and #7 in geriatrics by U.S. News & World Report (2014-15). HSS has been a tenant at the property since 1999, signing a 10-year lease which was amended to a 15-year lease with a five-year renewal option. The in-place average office rent at the property is $57.46 per square foot which is below the appraisal’s conclusion of market rent for the property of $90.00 - $95.00 per square foot.
The retail space is currently 100.0% occupied by four tenants following a repositioning by the loan sponsor over the last several years. Due to the higher rents commanded by the space given the property’s prime location on Madison Avenue and 59th street, the retail component comprises approximately 44.8% of the underwritten base rent while only accounting for 11.9% of the net rentable area. Prior to the four retail tenants currently at the property, the retail space was 100.0% occupied with an average retail rent of approximately $105.97 per square foot. Beginning with the Baccarat lease which was signed in December 2011 with the tenant taking occupancy in November 2012, the loan sponsor has successfully repositioned the retail space, re-tenanting three of the four retail spaces as leases rolled. As a result, the in-place average retail rent is $325.81 per square foot. The largest retail tenant at the property, Suit Supply, leases approximately 5.3% of the net rentable area through May 2020. Suit Supply sells men’s suits and accessories. Approximately 869 square feet of Suit Supply’s leased space is at street level; approximately 7,399 square feet is on the second level with the remaining 1,124 square feet being below grade level. Suit Supply has been at the property since June 2013. The second largest retail tenant at the property, Baccarat, leases approximately 4.9% of the net rentable area through March 2023 (3,248 square feet) and May 2023 (5,464 square feet). Approximately 3,810 square feet of Baccarat’s leased space is in the form of a double height store at street level, 3,248 square feet is in the office portion of the property with the remaining 1,654 square feet being below grade level. Baccarat has been at the property since November 2012. The third largest retail tenant at the property, Camper Atlantic Corp. (“Camper”), leases approximately 1.2% of the net rentable area through April 2019 with no extension options. Approximately 1,063 square feet of Camper’s leased space is at street level, with the remaining 1,133 square feet being below grade level. Camper is a Spanish owned retailer of shoes, handbags, accessories and clothing and has been at the property since 1997. The tenant renewed in 2009 and is located at street level on the corner of the property with visibility from both 59th street and Madison Avenue. The space is considered the best retail space at the property. The tenant’s underwritten rent is $434.80 per square foot, which is below the appraisal’s conclusion of market retail rents for the space of $1,250.00 for the street level space.
The property is located at the intersection of 59th Street and Madison Avenue in the Plaza District of Manhattan which commands some of the highest office and retail rents in New York City. The property location provides easy access to public transportation with the F, N, Q, R, 4, 5 and 6 trains accessible within a short distance. Access to the N, Q, and R trains is provided by the 59th Street/5th Avenue subway station. Access to the north/south 4, 5, 6 trains is available at 59th Street and Lexington Avenue. The F train is accessible at 57th Street/6th Avenue or 63rd Street/Lexington Avenue. Additionally, the E and M trains are available at 53rd Street/5th Avenue.
THE INFORMATION IN THIS STRUCTURAL AND COLLATERAL TERM SHEET IS NOT COMPLETE AND MAY BE AMENDED PRIOR TO THE TIME OF SALE. THIS TERM SHEET IS NOT AN OFFER TO SELL THESE SECURITIES AND IT IS NOT A SOLICITATION OF AN OFFER TO BUY THESE SECURITIES IN ANY JURISDICTION WHERE THE OFFER OR SALE IS NOT PERMITTED.
| 57 of 124 | |
| Structural and Collateral Term Sheet | JPMBB 2014-C24 | |
| 635 Madison Avenue | ||
According to the appraisal, the property falls within the Plaza District submarket within the Midtown office market. As of the second quarter of 2014, office space within the submarket totaled approximately 12.5 million square feet with a vacancy rate of 11.2% and asking rents of $116.41 per square foot. In relation to the office portion, the appraisal identified seven competitive properties with office components ranging from approximately 366,000 to 1,000,000 square feet. The comparable properties had occupancies ranging from approximately 88.5% to 97.0% with executed leases ranging from $84.00 to $113.00 per square foot with an average of $95.00 per square foot. The appraisal’s conclusion of market rent at the property is $90.00 - $95.00 per square foot. In relation to the retail portion of the property, the appraisal identified six comparable properties with a wide range of executed leases from $500.00 per square foot to $1,750.00 per square foot. After adjusting for quality of space and location, the appraisal’s concluded market retail rents is $1,250.00 for grade level retail, $150.00 for second level retail and $50.00 per square foot for basement space which is below grade level.
Historical and Current Occupancy(1) | |||
2011 | 2012(2) | 2013 | Current(3) |
| 97.0% | 92.9% | 97.6% | 94.4% |
| (1) | Historical Occupancies are as of December 31 of each respective year. |
| (2) | Occupancy declined in 2012 due to renovation of the now occupied Baccarat space. |
| (3) | Current Occupancy is as of July 31, 2014. |
Tenant Summary(1) | ||||||||||||
| Tenant | Tenant Type | Ratings Moody’s / S&P /Fitch | Net Rentable Area (SF) | % of Total NRA | Base Rent PSF | Lease Expiration Date | ||||||
Reproductive Medical Associates(2) | Office | NA / NA / NA | 25,779 | 14.5% | $78.77 | 12/31/2022 | ||||||
| N.Y. Physicians P.C. | Office | NA / NA / NA | 23,074 | 13.0% | $40.95 | 6/30/2016 | ||||||
| HSS Properties Corp. | Office | NA / NA / NA | 11,303 | 6.4% | $62.90 | 6/30/2019 | ||||||
| RW USA Corp. | Office | NA / NA / NA | 11,283 | 6.4% | $45.33 | 5/31/2017 | ||||||
Suit Supply(3)(4) | Retail | NA / NA / NA | 9,392 | 5.3% | $212.95 | 5/31/2020 | ||||||
Baccarat(5) | Retail | NA / NA / NA | 8,712 | 4.9% | $350.78 | 5/13/2023 | ||||||
| Ilan Bohm D.D., P.C. | Office | NA / NA / NA | 8,110 | 4.6% | $53.90 | 3/31/2020 | ||||||
| Evins Communications | Office | NA / NA / NA | 6,619 | 3.7% | $50.57 | 8/31/2015 | ||||||
| AJ Top Construction | Office | NA / NA / NA | 6,232 | 3.5% | $105.00 | 8/31/2024 | ||||||
| Medical Imaging Of Manhattan | Office | NA / NA / NA | 6,217 | 3.5% | $61.93 | 7/31/2020 | ||||||
| (1) | Based on the underwritten rent roll. |
| (2) | Reproductive Medical Associates consists of two tenants, Hayden Properties L.L.C. (11,277 square feet) and Gilbert Properties L.L.C. (14,502 square feet), both of which are guaranteed by the same individuals. |
| (3) | Both the landlord and the tenant have the right to terminate this lease at any time after the first 12 months of the lease term, by providing at least 15 months prior written notice to the other party. |
| (4) | Suit Supply pays the greater of (i) rent of $2,000,000 or (ii) 15% of gross sales per annum. JPMCB has underwritten base rent of $212.95, which equals the minimum base rent of $2,000,000. |
| (5) | Baccarat has two lease expiration dates. An initial 3,248 square feet of space expires in March 2023 and the remaining 5,464 square feet of space expires in May 2023. |
Lease Rollover Schedule(1) | ||||||||||||||||||
Year | Number of Leases Expiring | Net Rentable Area Expiring | % of NRA Expiring | Base Rent Expiring | % of Base Rent Expiring | Cumulative Net Rentable Area Expiring | Cumulative % of NRA Expiring | Cumulative Base Rent Expiring | Cumulative % of Base Rent Expiring | |||||||||
| Vacant | NAP | 10,012 | 5.6% | NAP | NAP | 10,012 | 5.6% | NAP | NAP | |||||||||
| 2014 & MTM | 1 | 1,539 | 0.9 | $57,000 | 0.4% | 11,551 | 6.5% | $57,000 | 0.4% | |||||||||
| 2015 | 5 | 21,193 | 12.0 | 1,029,750 | 6.7 | 32,744 | 18.5% | $1,086,750 | 7.1% | |||||||||
| 2016 | 4 | 33,433 | 18.9 | 1,725,075 | 11.2 | 66,177 | 37.3% | $2,811,825 | 18.3% | |||||||||
| 2017 | 2 | 14,361 | 8.1 | 661,470 | 4.3 | 80,538 | 45.4% | $3,473,294 | 22.6% | |||||||||
| 2018 | 0 | 0 | 0.0 | 0 | 0.0 | 80,538 | 45.4% | $3,473,294 | 22.6% | |||||||||
| 2019 | 4 | 20,715 | 11.7 | 2,128,310 | 13.9 | 101,253 | 57.1% | $5,601,604 | 36.5% | |||||||||
| 2020 | 5 | 32,316 | 18.2 | 3,144,030 | 20.5 | 133,569 | 75.4% | $8,745,634 | 56.9% | |||||||||
| 2021 | 0 | 0 | 0.0 | 0 | 0.0 | 133,569 | 75.4% | $8,745,634 | 56.9% | |||||||||
| 2022 | 1 | 25,779 | 14.5 | 2,030,694 | 13.2 | 159,348 | 89.9% | $10,776,329 | 70.1% | |||||||||
| 2023 | 2 | 9,548 | 5.4 | 3,931,529 | 25.6 | 168,896 | 95.3% | $14,707,857 | 95.7% | |||||||||
| 2024 | 1 | 6,232 | 3.5 | 654,360 | 4.3 | 175,128 | 98.8% | $15,362,217 | 100.0% | |||||||||
2025 & Beyond(2) | 1 | 2,134 | 1.2 | 0 | 0.0 | 177,262 | 100.0% | $15,362,217 | 100.0% | |||||||||
| Total | 26 | 177,262 | 100.0% | $15,362,217 | 100.0% | |||||||||||||
| (1) | Based on the underwritten rent roll. |
| (2) | Represents the property management office and is included in the property net rentable area. |
THE INFORMATION IN THIS STRUCTURAL AND COLLATERAL TERM SHEET IS NOT COMPLETE AND MAY BE AMENDED PRIOR TO THE TIME OF SALE. THIS TERM SHEET IS NOT AN OFFER TO SELL THESE SECURITIES AND IT IS NOT A SOLICITATION OF AN OFFER TO BUY THESE SECURITIES IN ANY JURISDICTION WHERE THE OFFER OR SALE IS NOT PERMITTED.
| 58 of 124 | |
| Structural and Collateral Term Sheet | JPMBB 2014-C24 | |
| 635 Madison Avenue | ||
| Operating History and Underwritten Net Cash Flow | |||||||||||||
2012 | 2013 | TTM(1) | Underwritten | Per Square Foot | %(2) | ||||||||
Rents in Place(3)(4) | $10,037,951 | $11,775,678 | $14,154,681 | $15,362,217 | $86.66 | 81.3% | |||||||
| Vacant Income | 0 | 0 | 0 | 924,945 | 5.22 | 4.9 | |||||||
| Gross Potential Rent | $10,037,951 | $11,775,678 | $14,154,681 | $16,287,162 | $91.88 | 86.2% | |||||||
| Total Reimbursements | 2,841,426 | 2,038,998 | 1,757,925 | 2,615,641 | 14.76 | 13.8 | |||||||
| Net Rental Income | $12,879,377 | $13,814,676 | $15,912,606 | $18,902,804 | $106.64 | 100.0% | |||||||
| (Vacancy/Credit Loss) | 0 | 0 | 0 | (924,945) | (5.22) | (4.9) | |||||||
| Other Income | 0 | 0 | 0 | 0 | 0 | 0.0 | |||||||
| Effective Gross Income | $12,879,377 | $13,814,676 | $15,912,606 | $17,977,859 | $101.42 | 95.1% | |||||||
| Operating Expenses | 4,827,830 | 5,030,967 | 5,184,795 | 6,077,912 | 34.29 | 33.8 | |||||||
| Ground Rent | 3,677,574 | 3,677,574 | 3,677,574 | 3,677,574 | 20.75 | 20.5 | |||||||
| Total Expenses | $8,505,404 | $8,708,541 | $8,862,369 | $9,755,486 | $55.03 | 54.3% | |||||||
| Net Operating Income | $4,373,973 | $5,106,135 | $7,050,237 | $8,222,372 | $46.39 | 45.7% | |||||||
| Total TI/LC, Capex/RR | 0 | 0 | 0 | 381,113 | 2.15 | 2.1 | |||||||
| Net Cash Flow | $4,373,973 | $5,106,135 | $7,050,237 | $7,841,259 | $44.24 | 43.6% | |||||||
| (1) | TTM Column represents the trailing twelve months ending June 30, 2014. |
| (2) | Percentage column represents percent of Net Rental Income for all revenue lines and represents percent of Effective Gross Income for the remainder of fields. |
(3) | The increase in 2013 and TTM Rents in Place revenue is primarily the result of the retail space being leased to new tenants or retail tenant lease rollover. |
| (4) | The increase in Underwritten Rents in Place from TTM Rents in Place is primarily the result of (i) contractual rent increases which have occurred for Suit Supply totaling approximately $217,926, (ii) future rent steps for Baccarat and other office tenants through July 2015 totaling approximately $659,169 and (iii) approximately $330,442 of additional Rents in Place as a result of re-leasing 7,595 square feet of office space. |
Property Management. The property is managed by AAC Management Corp., an affiliate of the borrower.
Ground Lease. 635 Madison Avenue is encumbered by a ground lease. The ground lease commenced on January 26, 1955 and is currently in its second renewal term expiring April 30, 2030. The ground rent is currently $3,677,574 per year, which is fixed until 2030. The ground lease provides for a final renewal option of 21 years which can be exercised by the tenant no more than 24 months and no less than 18 months prior to April 30, 2030. If exercised, the ground lease would extend until the final maturity date of April 30, 2051 and reset the ground lease rent to the greater of: (1) 5.0% of the value of the land as of April 30, 2030, considered as vacant and unimproved and exclusive of all improvements, plus $3,750, or (2) the in-place ground lease rent. If prior to six months before the renewal term, landlord and tenant have not agreed on the land value, exclusive of improvements, such value will be determined by arbitration in accordance with the relevant provisions of the related lease.
Escrows and Reserves. At origination, the borrower deposited into escrow approximately $2,420,905 for outstanding free rent related to Baccarat, Suit Supply and Ilan Bohm D.D., P.C., $1,180,693 for real estate taxes, $306,465 for ground rent, $60,693 for existing tenant improvements and leasing commissions related Reproductive Medical Associates, $33,237 for future tenant improvements and leasing commissions and $2,954 for replacement reserves.
Tax Escrows - On a monthly basis, the borrower is required to escrow 1/12 of the annual estimated tax payments, which currently equates to $295,173.
Insurance Escrows - The requirement for the borrower to make monthly deposits to the insurance escrow is waived so long as no event of default exists and the borrower provides satisfactory evidence that the property is insured as part of a blanket policy in accordance with the loan documents.
Replacement Reserves - On a monthly basis, the borrower is required to escrow $2,954 (approximately $0.20 per square foot annually) for replacement reserves.
TI/LC Reserves - On a monthly basis, the borrower is required to escrow $33,237 (approximately $2.25 per square foot annually) for tenant improvements and leasing commissions. The reserve is subject to a cap of $1,994,220 (approximately $11.25 per square foot).
Ground Lease Reserve - On a monthly basis, the borrower is required to escrow 1/12 of the annual ground rent payment, which currently equates to $306,465.
THE INFORMATION IN THIS STRUCTURAL AND COLLATERAL TERM SHEET IS NOT COMPLETE AND MAY BE AMENDED PRIOR TO THE TIME OF SALE. THIS TERM SHEET IS NOT AN OFFER TO SELL THESE SECURITIES AND IT IS NOT A SOLICITATION OF AN OFFER TO BUY THESE SECURITIES IN ANY JURISDICTION WHERE THE OFFER OR SALE IS NOT PERMITTED.
| 59 of 124 | |
| Structural and Collateral Term Sheet | JPMBB 2014-C24 | |
| 635 Madison Avenue | ||
Lockbox / Cash Management. The loan is structured with a hard lockbox and in-place cash management. The borrower and property manager were required to send tenant direction letters to tenants instructing all tenants to deposit all rents and payments into the lockbox account controlled by the lender. All funds in the lockbox account are swept daily to a cash management account under the control of the lender and disbursed during each interest period of the loan term in accordance with the loan documents. To the extent that (i) the debt service coverage ratio (as calculated in the loan documents and including the mezzanine loan) based on the trailing three month period falls below 1.10x, (ii) there is an event of default under the loan documents or (iii) the borrower or property manager becomes the subject of a bankruptcy, insolvency or similar action, then all excess cash flow after payment of debt service, required reserves and operating expenses is required to be held as additional collateral for the loan.
Additional Mezzanine Debt. A mezzanine loan of $35.0 million secured by the equity interests in the borrowers was provided by JPMCB. The mezzanine loan has a coterminous maturity with the mortgage loan. The mezzanine loan makes interest only payments throughout the term of the loan and has a 7.25% coupon. Including the mezzanine loan, the Cut-off Date LTV is 64.1%, the UW NCF DSCR is 0.98x (calculated based on amortizing debt service payments for the Mortgage Loan) and the UW NOI Debt Yield is 6.6%. Including the mezzanine loan, the UW NCF DSCR (based on interest only debt service payments) is 1.18x. The mortgage and mezzanine lenders have entered into an intercreditor agreement.
THE INFORMATION IN THIS STRUCTURAL AND COLLATERAL TERM SHEET IS NOT COMPLETE AND MAY BE AMENDED PRIOR TO THE TIME OF SALE. THIS TERM SHEET IS NOT AN OFFER TO SELL THESE SECURITIES AND IT IS NOT A SOLICITATION OF AN OFFER TO BUY THESE SECURITIES IN ANY JURISDICTION WHERE THE OFFER OR SALE IS NOT PERMITTED.
| 60 of 124 | |
| Structural and Collateral Term Sheet | JPMBB 2014-C24 |
Hutch Tower Two |
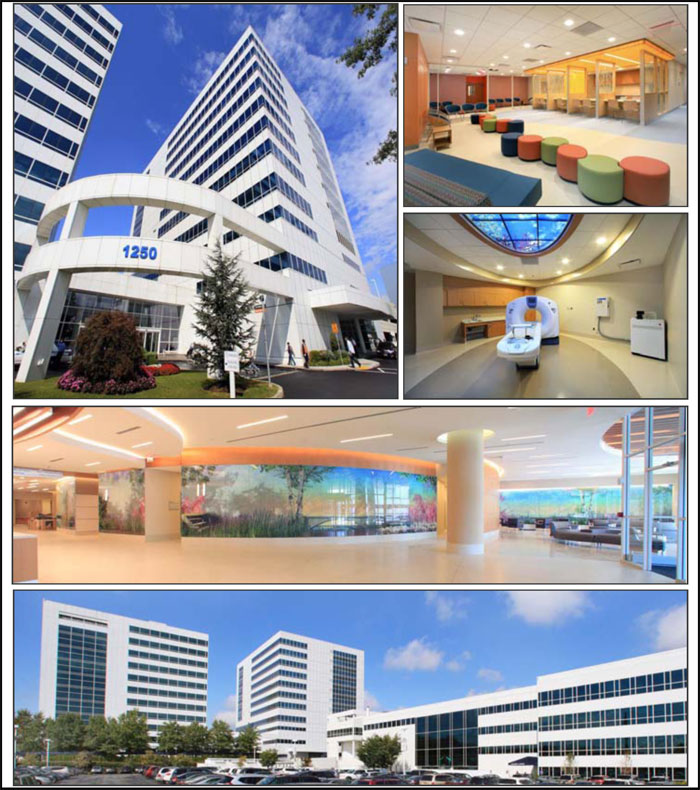
THE INFORMATION IN THIS STRUCTURAL AND COLLATERAL TERM SHEET IS NOT COMPLETE AND MAY BE AMENDED PRIOR TO THE TIME OF SALE. THIS TERM SHEET IS NOT AN OFFER TO SELL THESE SECURITIES AND IT IS NOT A SOLICITATION OF AN OFFER TO BUY THESE SECURITIES IN ANY JURISDICTION WHERE THE OFFER OR SALE IS NOT PERMITTED.
| 61 of 124 | |
| Structural and Collateral Term Sheet | JPMBB 2014-C24 |
Hutch Tower Two |
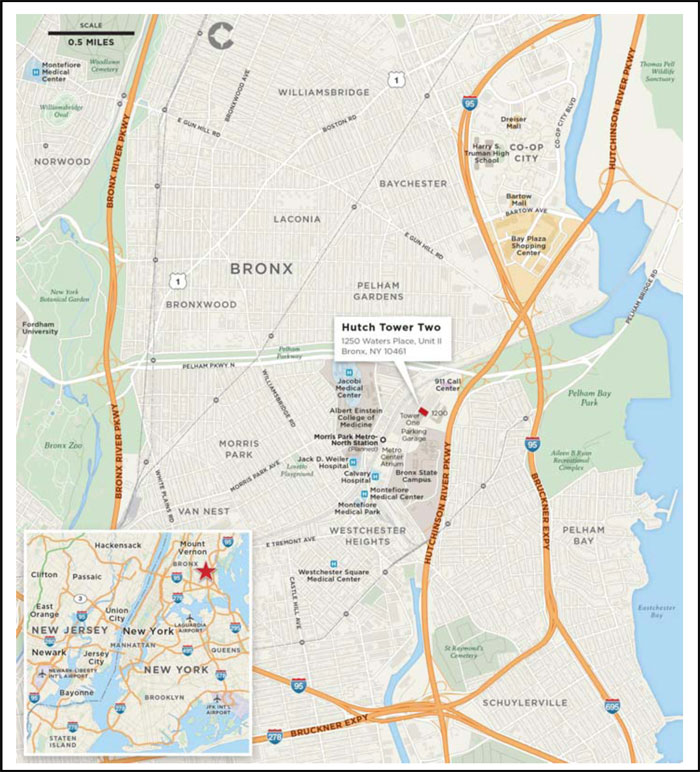
THE INFORMATION IN THIS STRUCTURAL AND COLLATERAL TERM SHEET IS NOT COMPLETE AND MAY BE AMENDED PRIOR TO THE TIME OF SALE. THIS TERM SHEET IS NOT AN OFFER TO SELL THESE SECURITIES AND IT IS NOT A SOLICITATION OF AN OFFER TO BUY THESE SECURITIES IN ANY JURISDICTION WHERE THE OFFER OR SALE IS NOT PERMITTED.
| 62 of 124 | |
| Structural and Collateral Term Sheet | JPMBB 2014-C24 |
Hutch Tower Two |
| Mortgage Loan Information | Property Information | |||
| Mortgage Loan Seller: | KeyBank | Single Asset / Portfolio: | Single Asset | |
| Original Principal Balance: | $80,500,000 | Title: | Fee | |
| Cut-off Date Principal Balance: | $80,500,000 | Property Type - Subtype: | Office - Medical | |
| % of Pool by IPB: | 6.3% | Net Rentable Area (SF): | 278,133 | |
| Loan Purpose: | Refinance | Location: | Bronx, NY | |
| Borrower: | Hutch Tower Two Owner LLC | Year Built / Renovated: | 2014 / N/A | |
| Sponsor: | Joseph Simone | Occupancy: | 100.0% | |
| Interest Rate: | 4.57000% | Occupancy Date: | 8/27/2014 | |
| Note Date: | 9/12/2014 | Number of Tenants: | 1 | |
| Maturity Date: | 10/1/2024 | 2011 NOI(1): | N/A | |
| Interest-only Period: | 36 months | 2012 NOI(1): | N/A | |
| Original Term: | 120 months | 2013 NOI(1): | N/A | |
| Original Amortization: | 360 months | UW Economic Occupancy: | 97.0% | |
| Amortization Type: | IO-Balloon | UW Revenues(2): | $9,715,642 | |
| Call Protection: | L(24),Def(93),O(3) | UW Expenses: | $2,113,687 | |
| Lockbox: | CMA | UW NOI(2): | $7,601,955 | |
| Additional Debt: | N/A | UW NCF(2): | $7,532,421 | |
| Additional Debt Balance: | N/A | Appraised Value / Per SF(3): | $117,000,000 / $421 | |
| Additional Debt Type: | N/A | Appraisal Date(3): | 10/1/2015 | |
Escrows and Reserves(4) | Financial Information | |||||
| Initial | Monthly | Initial Cap | Cut-off Date Loan / SF: | $289 | ||
| Taxes: | $35,379 | $8,845 | N/A | Maturity Date Loan / SF: | $254 | |
| Insurance: | $0 | $171 | N/A | Cut-off Date LTV(3): | 68.8% | |
| Replacement Reserves: | $0 | $0 | N/A | Maturity Date LTV(3): | 60.3% | |
| TI/LC: | $0 | $0 | N/A | UW NCF DSCR(2): | 1.53x | |
| Other: | $8,158,568 | $0 | N/A | UW NOI Debt Yield(2): | 9.4% | |
| Sources and Uses | |||||||
| Sources | Proceeds | % of Total | Uses | Proceeds | % of Total | ||
| Mortgage Loan | $80,500,000 | 100.0% | Payoff Existing Debt | $59,609,374 | 74.0 | % | |
| Return of Equity | 11,628,803 | 14.4 | |||||
| Upfront Reserves | 8,193,947 | 10.2 | |||||
| Closing Costs | 1,067,876 | 1.3 | |||||
| Total Sources | $80,500,000 | 100.0% | Total Uses | $80,500,000 | 100.0 | % | |
| (1) | Historical NOI is not available because the property was built in 2014. |
| (2) | UW Revenues, UW NOI and UW NCF assume a straight-line average of contractual rent due during the loan term under the Montefiore Medical Center lease. Based on the in-place rent, the UW NOI and UW NCF are $6,552,033 and $6,482,500, respectively and result in an UW NCF DSCR and UW NOI Debt Yield of 1.31x and 8.1%, respectively. Please refer to “Underwritten Net Cash Flow” table below. |
| (3) | The Hutch Tower Two Appraised Value reflects the “Prospective Market Value As Complete and Physically Stabilized” value of $117,000,000, which will be achieved when Montefiore Medical Center commences rent payments October 1, 2015. At origination, the borrower escrowed $8,158,568, which covers abated rent from the first payment date of the loan through September 30, 2015. The “As-Is” value for the property, which reflects the property’s current status as a master leased medical office building with rent commencement scheduled to occur on October 1, 2015, is $106,000,000 and results in a corresponding Cut-off Date LTV and Maturity Date LTV of 75.9% and 66.6%, respectively. The appraisal also concluded an aggregate “Market Value Go Dark – Under Hypothetical Condition” of $100,000,000 (approximately $360 per square foot). |
| (4) | For a full description of Escrows and Reserves, please refer to “Escrows and Reserves” below. |
THE INFORMATION IN THIS STRUCTURAL AND COLLATERAL TERM SHEET IS NOT COMPLETE AND MAY BE AMENDED PRIOR TO THE TIME OF SALE. THIS TERM SHEET IS NOT AN OFFER TO SELL THESE SECURITIES AND IT IS NOT A SOLICITATION OF AN OFFER TO BUY THESE SECURITIES IN ANY JURISDICTION WHERE THE OFFER OR SALE IS NOT PERMITTED.
| 63 of 124 | |
| Structural and Collateral Term Sheet | JPMBB 2014-C24 |
Hutch Tower Two |
The Loan. The Hutch Tower Two loan has an outstanding principal balance of $80.5 million and is secured by a first mortgage lien on a Class A, 278,133 square foot medical office building located at 1250 Waters Place, Bronx, New York. The loan has a 10-year term, and subsequent to a three-year interest-only period, amortizes on a 30-year schedule.
The Borrower. The borrowing entity for the Hutch Tower Two loan is Hutch Tower Two Owner LLC, a Delaware limited liability company and special purpose entity.
The Sponsor. The loan sponsor and nonrecourse carve-out guarantor is Joseph Simone, the founder of Simone Development, a full-service, privately held commercial and residential real estate and management company. The sponsor owns and manages a portfolio of approximately 100 properties in the tri-state region including office, medical, industrial flex, and retail, totaling more than four million square feet.
The Property. Hutch Tower Two is a 278,133 square foot, Class A medical office building located in Bronx, New York. The property is located within the Hutchinson Metro Center Campus, a state-of-the-art, Class A office complex containing four buildings located on 42 acres in eastern Bronx, New York. Simone Development, which is controlled by the loan sponsor Joseph Simone, has been renovating and constructing the campus in phases over the past decade. The sponsor purchased the Hutch Tower Two land approximately 20 years ago and constructed the Hutch Tower Two improvements in 2014 for approximately $66.0 million, and including the estimated land value of approximately $20.9 million based on a condemnation payment received from New York City on an adjacent non-collateral parcel, the sponsor has a cost basis of approximately $86.8 million.
Hutch Tower Two is 100.0% leased to Montefiore Medical Center (“Montefiore”) on a 16-year lease through September 30, 2030, with three, five-year extension options. Montefiore utilizes the property as a medical office building and outpatient surgery center for several practices. Montefiore reportedly invested approximately $114.6 million into the space, which includes approximately $54.6 million for build out and an estimated $60.0 million for furniture, fixtures, and equipment. Hutch Tower Two is connected via a common lobby and shares common parking with 1250 Waters Place, Unit I (“Hutch Tower One”), which is governed by the Declaration of Hutch Towers Condominium by-laws. Hutch Tower One features nine floors of office space over four levels of covered parking and is 100.0% occupied by multiple tenants and Hutch Tower One is not collateral for the Hutch Tower Two loan.
Montefiore is a New York State Not-for-Profit Corporation which provides health care and related services, primarily to residents of the Metropolitan New York area. Montefiore has approximately 50 primary care locations throughout the New York metropolitan area, and is the largest health system in their primary service area with approximately 54% to 71% market share. Montefiore Medical Center is ranked among the top hospitals nationally in Cardiology and Heart Surgery, Diabetes and Endocrinology, and Neurology and Neurosurgery by U.S. News & World Report. Founded in 1884, Montefiore has focused on innovating new treatments, new procedures and new approaches to patient care. Montefiore is the academic medical center and University Hospital for Albert Einstein College of Medicine (“Einstein”). Montefiore’s partnership with Einstein is the second largest medical residency program in the country, with 1,251 residents and fellows across 89 programs. Operating revenue and net income have seen annual increases for the past three years. As of December 31, 2013, Montefiore reported approximately $3.2 billion in assets, a net worth of $895.9 million, $3.3 billion in revenue and net income of $181.8 million.
Montefiore will commence paying rent October 1, 2015 in the amount of $32.80 per square foot modified gross after thirteen months of rent abatement, totaling approximately $8.9 million ($32.00 per square foot), for which approximately $8.2 million was reserved at origination. The lease has annual base rent increases of $0.80 per square foot each year through lease year four and annual base rent increases of $0.96 per square foot thereafter through lease year 16.
Hutch Tower Two is located approximately two miles south of Co-Op City and less than one mile from some of the region’s top medical hospitals, including Jack D. Weiler Hospital of the Albert Einstein College of Medicine, Montefiore Medical Center, Jacobi Medical Center, and Calvary Hospital. The property is located on Marconi Street, with a bus stop in front of the building served by MTA bus service and seven additional bus lines within blocks. The Metro-North Railroad has plans to build a Morris Park Station in 2018, which will provide direct access to Penn Station in Manhattan and Connecticut. Hutchinson River Parkway, directly east of the property, provides easy access to the Hutchinson Metro Center and is accessed via major arterials including I-95, Bronx and Pelham Parkway, Bruckner Expressway, and the Cross Bronx Expressway. In addition, subway service to New York City is located nearby and JFK and LaGuardia airports are less than 30 minutes away. According to the appraisal, the 2013 population within a three- and five-mile radius contains approximately 662,516 and 1,624,628 people, respectively.
THE INFORMATION IN THIS STRUCTURAL AND COLLATERAL TERM SHEET IS NOT COMPLETE AND MAY BE AMENDED PRIOR TO THE TIME OF SALE. THIS TERM SHEET IS NOT AN OFFER TO SELL THESE SECURITIES AND IT IS NOT A SOLICITATION OF AN OFFER TO BUY THESE SECURITIES IN ANY JURISDICTION WHERE THE OFFER OR SALE IS NOT PERMITTED.
| 64 of 124 | |
| Structural and Collateral Term Sheet | JPMBB 2014-C24 |
Hutch Tower Two |
According to the appraisal, the Bronx office market has seen only 395,721 square feet of newly constructed office space in 2012 and 2013 (not including Hutch Tower Two) for a current supply of approximately 9.6 million square feet and a 13.3% vacancy rate as of the second quarter of 2014. The appraisal noted the immediate Class A office market consists of two buildings, totaling approximately 744,000 square feet, one of which is Hutch Tower One. The immediate Class A office market has an overall occupancy rate of 98.8% and average rents of $32.26 per square foot as of the second quarter of 2014. The appraisal identified four comparable leases with asking rents from $32.00 to $35.00 per square foot. The comparable properties reported occupancies ranging from 84.0% to 100.0% with an average of 95.8%.
Historical and Current Occupancy(1) | |||
2011 | 2012 | 2013 | Current(2) |
| N/A | N/A | N/A | 100.0% |
| (1) | The property was constructed in 2014, and as such, historical occupancy is not available. |
| (2) | Current occupancy as of August 27, 2014. |
Tenant Summary(1) | |||||
| Tenant | Ratings Moody’s/S&P/Fitch | Net Rentable Area (SF) | % of Total NRA | Base Rent PSF(2) | Lease Expiration Date |
| Montefiore Medical Center | NA / NA / NA | 278,133 | 100.0% | $36.01 | 9/30/2030 |
| (1) | Based on the underwritten rent roll. |
| (2) | Base Rent PSF is based on the straight-line contractual rent due during the loan term under the Montefiore Medical Center lease. Abated rent during lease year one is $32.00 per square foot, and Montefiore Medical Center commences rent in the amount of $32.80 per square foot October 1, 2015. |
Lease Rollover Schedule(1) | ||||||||||||||||||
Year | Number of Leases Expiring | Net Rentable Area Expiring | % of NRA Expiring | Base Rent Expiring | % of Base Rent Expiring | Cumulative Net Rentable Area Expiring | Cumulative % of NRA Expiring | Cumulative Base Rent Expiring | Cumulative % of Base Rent Expiring | |||||||||
| Vacant | NAP | 0 | 0.0 | % | NAP | NAP | 0 | 0.0% | NAP | NAP | ||||||||
| 2014 & MTM | 0 | 0 | 0.0 | $0 | 0.0 | % | 0 | 0.0% | $0 | 0.0% | ||||||||
| 2015 | 0 | 0 | 0.0 | 0 | 0.0 | 0 | 0.0% | $0 | 0.0% | |||||||||
| 2016 | 0 | 0 | 0.0 | 0 | 0.0 | 0 | 0.0% | $0 | 0.0% | |||||||||
| 2017 | 0 | 0 | 0.0 | 0 | 0.0 | 0 | 0.0% | $0 | 0.0% | |||||||||
| 2018 | 0 | 0 | 0.0 | 0 | 0.0 | 0 | 0.0% | $0 | 0.0% | |||||||||
| 2019 | 0 | 0 | 0.0 | 0 | 0.0 | 0 | 0.0% | $0 | 0.0% | |||||||||
| 2020 | 0 | 0 | 0.0 | 0 | 0.0 | 0 | 0.0% | $0 | 0.0% | |||||||||
| 2021 | 0 | 0 | 0.0 | 0 | 0.0 | 0 | 0.0% | $0 | 0.0% | |||||||||
| 2022 | 0 | 0 | 0.0 | 0 | 0.0 | 0 | 0.0% | $0 | 0.0% | |||||||||
| 2023 | 0 | 0 | 0.0 | 0 | 0.0 | 0 | 0.0% | $0 | 0.0% | |||||||||
| 2024 | 0 | 0 | 0.0 | 0 | 0.0 | 0 | 0.0% | $0 | 0.0% | |||||||||
| 2025 & Beyond | 1 | 278,133 | 100.0 | 10,016,126 | 100.0 | 278,133 | 100.0% | $10,016,126 | 100.0% | |||||||||
| Total | 1 | 278,133 | 100.0 | % | $10,016,126 | 100.0 | % | |||||||||||
| (1) | Based on the underwritten rent roll. |
THE INFORMATION IN THIS STRUCTURAL AND COLLATERAL TERM SHEET IS NOT COMPLETE AND MAY BE AMENDED PRIOR TO THE TIME OF SALE. THIS TERM SHEET IS NOT AN OFFER TO SELL THESE SECURITIES AND IT IS NOT A SOLICITATION OF AN OFFER TO BUY THESE SECURITIES IN ANY JURISDICTION WHERE THE OFFER OR SALE IS NOT PERMITTED.
| 65 of 124 | |
| Structural and Collateral Term Sheet | JPMBB 2014-C24 |
Hutch Tower Two |
Underwritten Net Cash Flow(1) | ||||||
Underwritten | Per Square Foot | %(2) | ||||
Rents in Place(3) | $10,016,126 | $36.01 | 100.0% | |||
| Vacant Income | 0 | 0.00 | 0.0 | |||
| Gross Potential Rent | $10,016,126 | $36.01 | 100.0% | |||
| Total Reimbursements | 0 | 0.00 | 0.0 | |||
| Net Rental Income | $10,016,126 | $36.01 | 100.0% | |||
(Vacancy/Credit Loss) (4) | (300,484) | (1.08) | (3.0) | |||
| Other Income | 0 | 0.00 | 0.0 | |||
| Effective Gross Income | $9,715,642 | $34.93 | 97.0% | |||
Total Expenses(5) | $2,113,687 | $7.60 | 21.8% | |||
| Net Operating Income | $7,601,955 | $27.33 | 78.2% | |||
Total TI/LC, Capex/RR(4) | 69,533 | 0.25 | 0.7 | |||
| Net Cash Flow | $7,532,421 | $27.08 | 77.5% | |||
| (1) | The property was constructed in 2014, and as such, historical financials are not available. |
| (2) | Percentage column represents percent of Net Rental Income for all revenue lines and represents percent of Effective Gross Income for the remainder of fields. |
| (3) | Underwritten Rents in Place is based on the straight-line average contractual rent due during the loan term under the Montefiore lease. Abated rent during lease year one is $32.00 per square foot and Montefiore Medical Center commences rent in the amount of $32.80 per square foot October 1, 2015. |
| (4) | A 3.0% economic vacancy and no TI/LC costs were underwritten due to Montefiore Medical Center’s long term lease maturing September 2030 (six years beyond the Hutch Tower Two loan maturity date) and substantial investment by Montefiore Medical Center in the Hutch Tower Two property. |
| (5) | Hutch Tower Two benefits from Industrial and Commercial Incentive Program (“ICIP”), which results in a reduced property tax expense. For a full description, please see “Industrial and Commercial Incentive Program” below. |
Industrial and Commercial Incentive Program. Hutch Tower Two benefits from a 25-year Industrial and Commercial Incentive Program (“ICIP”) from the City of New York with a benefit start date of July 1, 2009. The ICIP provides that the building portion of the property’s assessed value is 100% exempt for the first 16 years, with such benefit reducing annually by 10% through year 26, when the building is fully taxable. The property’s 2014-2015 assessed value results in real estate taxes of $2,294,292, and after deducting the ICIP tax benefit of $2,193,208, produces a property tax expense of $101,084, which is underwritten.
Property Management. The property is managed by Hutch Management LLC, an affiliate of the borrower.
Escrows and Reserves. At origination, the borrower deposited into escrow approximately $8,158,568 for outstanding rent abatements associated with Montefiore and $35,379 for real estate taxes. Lender will disburse on a monthly basis $741,688 from the rent abatement reserve fund to pay the monthly debt service payment with the excess to be released to the borrower as long as: (a) no event of default exists, (b) Montefiore Medical Center is in full occupancy and open for business to the public, (c) borrower has delivered evidence that all tenant improvements required to be completed by borrower have been completed in a lien free and workmanlike manner and/or owed tenant improvements and leasing commissions have been paid and (d) upon expiration of the free rent period on September 30, 2015, receipt of an estoppel from Montefiore Medical Center, confirming that full unabated rent has commenced.
Tax Escrows - On a monthly basis, the borrower is required to escrow 1/12 of the annual estimated tax payments, which currently equates to $8,845.
Insurance Escrows - Except for flood insurance, the requirement for the borrower to make monthly deposits into the insurance escrow is waived so long as, among other things, no event of default exists and the borrower provides satisfactory evidence the property is insured as part of a blanket policy in accordance with the loan documents. For flood insurance, the borrower paid approximately $2,054 at loan closing and is required to deposit approximately $171 monthly in the flood insurance reserve.
THE INFORMATION IN THIS STRUCTURAL AND COLLATERAL TERM SHEET IS NOT COMPLETE AND MAY BE AMENDED PRIOR TO THE TIME OF SALE. THIS TERM SHEET IS NOT AN OFFER TO SELL THESE SECURITIES AND IT IS NOT A SOLICITATION OF AN OFFER TO BUY THESE SECURITIES IN ANY JURISDICTION WHERE THE OFFER OR SALE IS NOT PERMITTED.
| 66 of 124 | |
| Structural and Collateral Term Sheet | JPMBB 2014-C24 |
Hutch Tower Two |
Lockbox / Cash Management. The loan is structured with a CMA lockbox. The borrower was required to send a tenant direction letter to the tenant instructing them to deposit all rents and payments into the lockbox account controlled by the lender. The funds will be disbursed to an account designated by the borrower until the occurrence of a Cash Sweep Event. Upon the occurrence, and during the continuance of a Cash Sweep Event, all sums on deposit in the lockbox account will be deposited into a cash management account. The lender will have a first priority security interest in the cash management account and such account will be under the lender’s sole control.
A “Cash Sweep Event” means: (i) the occurrence of an event of default, (ii) the borrower or property manager becomes the subject of a bankruptcy, insolvency or similar action, (iii) the DSCR of the mortgage loan as calculated in the loan agreement based on the trailing three-month period immediately preceding the date of such determination falls below 1.20x, or (iv) the occurrence of an event of default by Montefiore under the lease, Montefiore has gone dark or vacated its space at the property, a bankruptcy or similar action by Montefiore, Montefiore reduces occupancy to less than 75% of the gross floor area, including subleases, or Montefiore is subject to a foreclosure action or deed in lieu under any lease approved mortgage secured by Montefiore’s rights under the lease including any appurtenances and fixtures.
THE INFORMATION IN THIS STRUCTURAL AND COLLATERAL TERM SHEET IS NOT COMPLETE AND MAY BE AMENDED PRIOR TO THE TIME OF SALE. THIS TERM SHEET IS NOT AN OFFER TO SELL THESE SECURITIES AND IT IS NOT A SOLICITATION OF AN OFFER TO BUY THESE SECURITIES IN ANY JURISDICTION WHERE THE OFFER OR SALE IS NOT PERMITTED.
| 67 of 124 | |
| Structural and Collateral Term Sheet | JPMBB 2014-C24 |
[THIS PAGE INTENTIONALLY LEFT BLANK]
THE INFORMATION IN THIS STRUCTURAL AND COLLATERAL TERM SHEET IS NOT COMPLETE AND MAY BE AMENDED PRIOR TO THE TIME OF SALE. THIS TERM SHEET IS NOT AN OFFER TO SELL THESE SECURITIES AND IT IS NOT A SOLICITATION OF AN OFFER TO BUY THESE SECURITIES IN ANY JURISDICTION WHERE THE OFFER OR SALE IS NOT PERMITTED.
| 68 of 124 | |
| Structural and Collateral Term Sheet | JPMBB 2014-C24 | |
17 State Street | ||
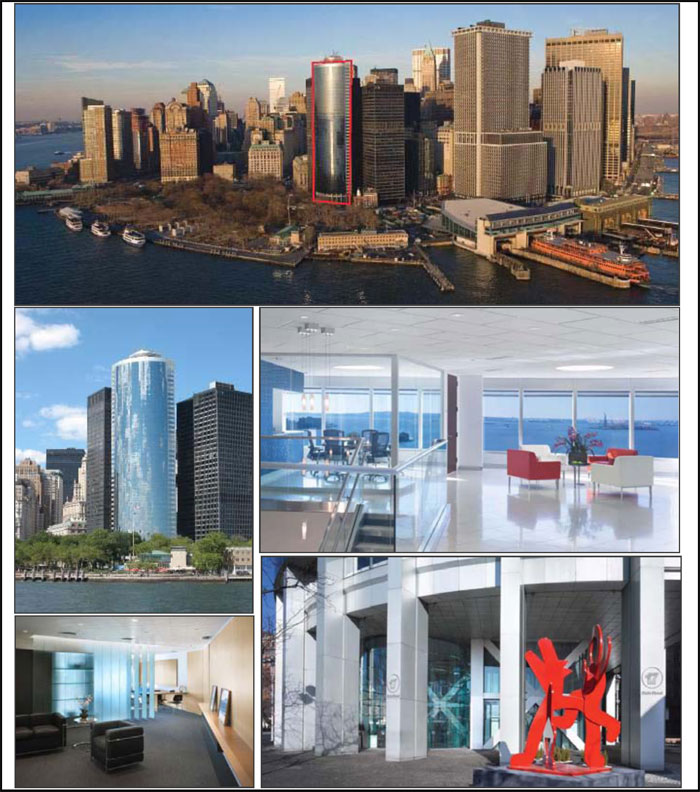
THE INFORMATION IN THIS STRUCTURAL AND COLLATERAL TERM SHEET IS NOT COMPLETE AND MAY BE AMENDED PRIOR TO THE TIME OF SALE. THIS TERM SHEET IS NOT AN OFFER TO SELL THESE SECURITIES AND IT IS NOT A SOLICITATION OF AN OFFER TO BUY THESE SECURITIES IN ANY JURISDICTION WHERE THE OFFER OR SALE IS NOT PERMITTED.
| 69 of 124 | |
| Structural and Collateral Term Sheet | JPMBB 2014-C24 | |
17 State Street | ||
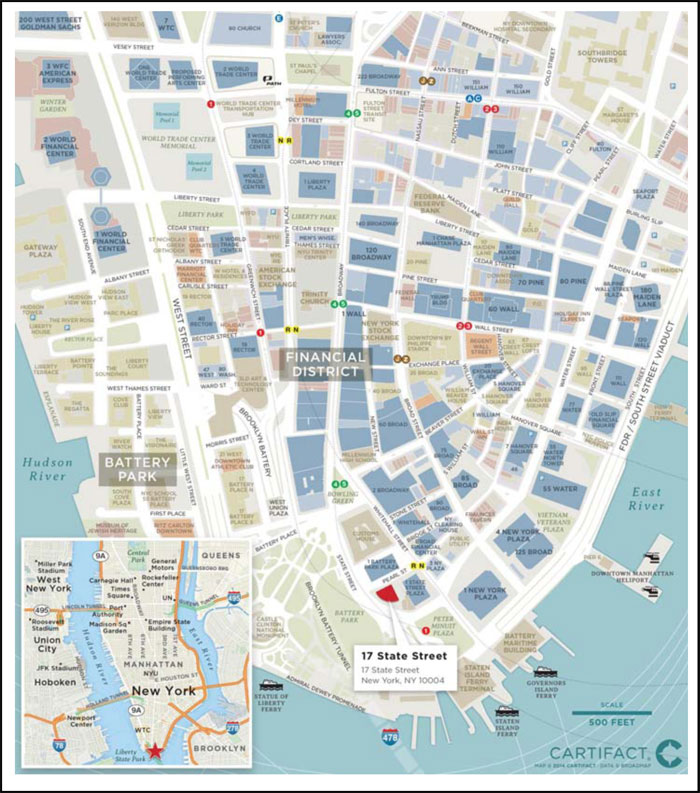
THE INFORMATION IN THIS STRUCTURAL AND COLLATERAL TERM SHEET IS NOT COMPLETE AND MAY BE AMENDED PRIOR TO THE TIME OF SALE. THIS TERM SHEET IS NOT AN OFFER TO SELL THESE SECURITIES AND IT IS NOT A SOLICITATION OF AN OFFER TO BUY THESE SECURITIES IN ANY JURISDICTION WHERE THE OFFER OR SALE IS NOT PERMITTED.
| 70 of 124 | |
| Structural and Collateral Term Sheet | JPMBB 2014-C24 | |
17 State Street | ||
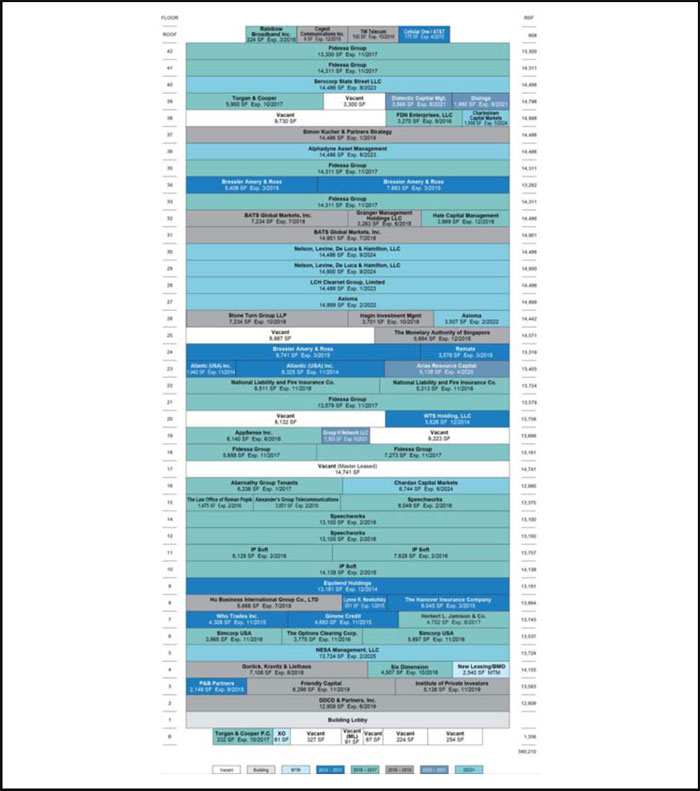
THE INFORMATION IN THIS STRUCTURAL AND COLLATERAL TERM SHEET IS NOT COMPLETE AND MAY BE AMENDED PRIOR TO THE TIME OF SALE. THIS TERM SHEET IS NOT AN OFFER TO SELL THESE SECURITIES AND IT IS NOT A SOLICITATION OF AN OFFER TO BUY THESE SECURITIES IN ANY JURISDICTION WHERE THE OFFER OR SALE IS NOT PERMITTED.
| 71 of 124 | |
| Structural and Collateral Term Sheet | JPMBB 2014-C24 | |
17 State Street | ||
| Mortgage Loan Information | Property Information | |||
| Mortgage Loan Seller: | JPMCB | Single Asset / Portfolio: | Single Asset | |
Original Principal Balance(1): | $75,000,000 | Title: | Fee | |
Cut-off Date Principal Balance(1): | $75,000,000 | Property Type - Subtype: | Office - CBD | |
| % of Pool by IPB: | 5.9% | Net Rentable Area (SF): | 560,210 | |
| Loan Purpose: | Refinance | Location: | New York, NY | |
| Borrower: | 17 State Owner LLC | Year Built / Renovated: | 1988 / N/A | |
| Sponsors: | Aby Rosen and Michael Fuchs | Occupancy(2): | 90.7% | |
| Interest Rate: | 4.45250% | Occupancy Date: | 6/19/2014 | |
| Note Date: | 7/15/2014 | Number of Tenants: | 54 | |
| Maturity Date: | 8/1/2024 | 2011 NOI: | $15,281,901 | |
| Interest-only Period: | 120 months | 2012 NOI: | $13,966,450 | |
| Original Term: | 120 months | 2013 NOI: | $13,047,516 | |
| Original Amortization: | None | TTM NOI (as of 5/2014)(3): | $14,030,219 | |
| Amortization Type: | Interest Only | UW Economic Occupancy(2): | 91.1% | |
| Call Protection: | L(26),Def(90),O(4) | UW Revenues(2): | $29,372,273 | |
| Lockbox: | Hard | UW Expenses: | $14,176,879 | |
| Additional Debt: | Yes | UW NOI(3): | $15,195,394 | |
| Additional Debt Balance: | $105,000,000 / $40,000,000 | UW NCF: | $14,534,346 | |
Additional Debt Type(6)(7): | Pari Passu / Mezzanine | Appraised Value / Per SF: | $325,000,000 / $580 | |
| Appraisal Date: | 4/1/2014 | |||
Escrows and Reserves(4) | Financial Information(1) | |||||
Initial(5) | Monthly | Initial Cap | Cut-off Date Loan / SF: | $321 | ||
| Taxes: | $1,040,885 | $520,500 | N/A | Maturity Date Loan / SF: | $321 | |
| Insurance: | $0 | $69,400 | N/A | Cut-off Date LTV: | 55.4% | |
| Replacement Reserves: | $0 | $8,395 | N/A | Maturity Date LTV: | 55.4% | |
| TI/LC: | $0 | $46,640 | N/A | UW NCF DSCR(2): | 1.79x | |
| Other: | $4,011,639 | $0 | N/A | UW NOI Debt Yield(2): | 8.4% | |
| Sources and Uses | ||||||
| Sources | Proceeds | % of Total | Uses | Proceeds | % of Total | |
Mortgage Loan(1) | $180,000,000 | 81.8% | Payoff Existing Preferred Equity(6) | $103,125,750 | 46.9% | |
Mezzanine Loan(6)(7) | 40,000,000 | 18.2 | Payoff Existing Debt | 98,010,350 | 44.6 | |
| Return of Equity | 12,025,228 | 5.5 | ||||
| Closing Costs | 4,222,285 | 1.9 | ||||
| Upfront Reserves | 2,616,386 | 1.2 | ||||
| Total Sources | $220,000,000 | 100.0% | Total Uses | $220,000,000 | 100.0% | |
| (1) | 17 State Street is part of a whole loan evidenced by two pari passu notes with an aggregate original principal balance of $180.0 million. The Financial Information presented in the chart above reflects the Cut-off Date balance of the $180.0 million 17 State Street Whole Loan. |
| (2) | Occupancy, UW Economic Occupancy and UW Revenues exclude a master lease which is guaranteed by the sponsors. Please refer to “Master Lease” below. Including the master lease, the Occupancy, UW Economic Occupancy, UW NCF DSCR and UW NOI Debt Yield are 93.4%, 93.5%, 1.88x and 8.9%, respectively. |
| (3) | The increase in UW NOI from TTM NOI is primarily the result of nine newly executed leases totaling approximately 58,932 square feet and $3,274,841 of annual rent with lease commencement dates in 2014. |
| (4) | For a full description of Escrows and Reserves, please refer to “Escrows and Reserves” below. |
| (5) | Approximately $308,516 of the Initial Taxes escrow and $2,127,622 of the Initial Other escrows were transferred from reserves held by the previously existing lender. |
| (6) | The mezzanine lender is an affiliate of the holder of the previously existing preferred equity that was paid off in connection with the origination of the mortgage loan. |
| (7) | The mezzanine loan is cross-defaulted with subordinate financing encumbering three other assets. Please refer to “Additional Debt” below for more information. |
THE INFORMATION IN THIS STRUCTURAL AND COLLATERAL TERM SHEET IS NOT COMPLETE AND MAY BE AMENDED PRIOR TO THE TIME OF SALE. THIS TERM SHEET IS NOT AN OFFER TO SELL THESE SECURITIES AND IT IS NOT A SOLICITATION OF AN OFFER TO BUY THESE SECURITIES IN ANY JURISDICTION WHERE THE OFFER OR SALE IS NOT PERMITTED.
| 72 of 124 | |
| Structural and Collateral Term Sheet | JPMBB 2014-C24 | |
17 State Street | ||
The Loan. The 17 State Street loan is secured by a first mortgage lien on a 42-story, 560,210 square foot office building located in New York, New York. The whole loan has an outstanding principal balance of $180.0 million (the “17 State Street Whole Loan”), which is comprised of two pari passu notes, Note A-1 and Note A-2. Note A-2, with an outstanding principal balance as of the Cut-off Date of $75.0 million, is being contributed to the JPMBB 2014-C24 trust. Note A-1 has an outstanding principal balance as of the Cut-off Date of $105.0 million and was contributed to the JPMBB 2014-C23 trust. The holder of Note A-1 (the “Controlling Noteholder”) will be the trustee of the JPMBB 2014-C23 trust. The trustee of the JPMBB 2014-C23 trust (or, prior to the occurrence and continuance of a control event under the related pooling and servicing agreement, the directing certificateholder for that securitization) will be entitled to exercise all of the rights of the Controlling Noteholder with respect to the related 17 State Street Whole Loan; however, the holder of Note A-2 will be entitled, under certain circumstances, to consult with respect to certain major decisions. The loan has a 10-year term and is interest-only for the term of the loan. The previously existing debt was securitized in the BACM 2004-3 transaction.
The Borrower. The borrowing entity for the 17 State Street Whole Loan is 17 State Owner LLC, a Delaware limited liability company and special purpose entity.
The Sponsors. The loan sponsors and nonrecourse carve-out guarantors are Aby Rosen and Michael Fuchs, co-founders and principals of RFR Holding LLC (“RFR”). RFR is a Manhattan-based, privately controlled real estate investment, development and management company founded in 1991. RFR owns a portfolio of commercial and residential real estate, including New York City office towers, luxury condominiums, hotels and retail developments such as Lever House (390 Park Avenue), Seagram Building (375 Park Avenue), 530 Park Avenue and the W South Beach Hotels & Residences in Miami. In 2002, Mr. Rosen was honored by the New York City Landmarks Conservancy with its Chairman’s Award and was recently appointed by the Governor of New York as the Chair of the New York State Council on the Arts. The sponsors purchased the property in 1999 for approximately $118.3 million.
The Property. 17 State Street is an iconic Class A office building located on the northeast corner of Pearl Street opposite Battery Park in the Financial East submarket of downtown Manhattan. The 42-story property was constructed in 1988 and totals 560,210 square feet. The building has column-free floor plates of approximately 14,000 square feet along with floor-to-ceiling windows.
As of June 19, 2014, the property was 90.7% leased by 54 tenants. The largest tenant at the property, Fidessa Group, leases approximately 14.8% of the net rentable area through November 2017 with one, five-year extension option remaining. Fidessa Group has been a tenant at the property since 1998, when it originally occupied approximately 13,300 square feet, and has subsequently expanded multiple times to its current 82,973 square feet. Fidessa Group provides trading, market data, order management and execution capabilities to global equity brokers. Fidessa Group is headquartered in London and has offices in Boston, Tokyo, Hong Kong, Paris and Toronto. The second largest tenant, Speechworks, leases approximately 6.1% of the net rentable area through February 2016. Speechworks subleases all of its space to IP Soft through its lease expiration date. In addition to the 34,249 square feet subleased from Speechworks, IP Soft has a direct lease for an additional 27,895 square feet through February 2016. Including the subleased space, IP Soft leases 62,144 square feet (11.1% of the net rentable area). IP Soft originally started leasing a portion of the Speechworks space in 2003, and in both 2004 and 2006 expanded to take over additional Speechworks space. IP Soft has one, five-year extension option remaining that covers both its direct lease and the subleased space. IP Soft is a technology consulting firm focused on the elimination of manual processes through automation technologies. IP Soft has 13 offices on four continents with its New York office at 17 State Street serving as its corporate headquarters. The third largest tenant, Nelson, Levine, De Luca & Hamilton, LLC (“Nelson Levine”), leases approximately 5.2% of the net rentable area through September 2024. Nelson Levine is a law firm focused solely on the business of insurance.
The property is located on the northeast corner of Pearl Street opposite Battery Park in the Financial East submarket of downtown Manhattan. The property is located a few blocks from the New York Stock Exchange and is in close proximity to several subway lines including the 1, 2, 3, 5, J, Z and R lines. According to the appraisal, despite the increase in supply coming to the market, downtown Manhattan has benefited from the conversion of office space to residential units. This resulted in an increased residential population, which is, in turn, driving demand for new restaurants, shops and additional retail development. In addition to the residential development, downtown office space continues to be priced lower than the Midtown market where average asking rents are $69.52 per square foot compared to downtown office space of $48.26 per square foot.
Due to damage caused by Hurricane Sandy in October 2012, the property was closed for repairs for approximately two weeks. The total losses as a result of Hurricane Sandy were approximately $14.0 million, which consisted primarily of repair costs for electrical work, elevators, clean up, fire alarm systems and domestic water service. In addition to the property’s all risk insurance policy, 17 State Street has flood insurance for $10.5 million which includes $500,000 from the National Flood Insurance Program and $10.0 million of excess coverage, including business interruption coverage.
THE INFORMATION IN THIS STRUCTURAL AND COLLATERAL TERM SHEET IS NOT COMPLETE AND MAY BE AMENDED PRIOR TO THE TIME OF SALE. THIS TERM SHEET IS NOT AN OFFER TO SELL THESE SECURITIES AND IT IS NOT A SOLICITATION OF AN OFFER TO BUY THESE SECURITIES IN ANY JURISDICTION WHERE THE OFFER OR SALE IS NOT PERMITTED.
| 73 of 124 | |
| Structural and Collateral Term Sheet | JPMBB 2014-C24 | |
17 State Street | ||
According to the appraisal, the Downtown office market totals approximately 72.8 million square feet with an overall vacancy rate of 12.2% and average rents of $48.26 per square foot as of the fourth quarter of 2013. The Financial East submarket totals approximately 35.9 million square feet and reported an overall vacancy rate of 10.5% with average Class A rents of $43.88 per square foot. The average rents at the property are approximately $51.98 per square foot which the appraisal concluded as below market. The appraisal concluded market rents of $52.00 per square foot for floors 2-12, $56.00 per square foot for floors 14-25 and $58.00 per square foot for floors 26-42. The appraisal identified eight directly competitive properties built between 1972 and 2006 and ranging in size from 395,000 to 2.3 million square feet. The comparable properties reported occupancies ranging from 35.6% to 100.0% with a weighted average of 83.6%. Asking rents for the comparable properties range from $45.00 to $65.00 per square foot. According to the appraisal, approximately 3.0 million square feet of office space has become available at several buildings in the Brookfield Place complex and the newly completed Four World Trade Center. The majority of the new space coming online has larger floor plates with asking rents of $55 to $70 per square foot and caters to a different tenant profile than 17 State Street, which has smaller floor plates.
Historical and Current Occupancy(1) | ||||
2010 | 2011(2) | 2012(2) | 2013 | Current(3) |
| 95.5% | 89.5% | 84.8% | 92.5% | 90.7% |
| (1) | Historical Occupancies are as of December 31 of each respective year. |
| (2) | The decrease in occupancy in 2011 and 2012 is attributed to two large tenants vacating. Georgeson Shareholder Communications vacated approximately 70,646 square feet in February of 2011 and AXA Reinsurance vacated 90,968 square feet in July 2012. In both instances, the tenant vacated the market completely. |
| (3) | Current Occupancy is as of June 19, 2014. |
Tenant Summary(1) | ||||||||||||
| Tenant | Ratings Moody’s/S&P/Fitch | Net Rentable Area (SF) | % of Total NRA | Base Rent PSF | Lease Expiration Date | |||||||
| Fidessa Group | NA / NA / NA | 82,973 | 14.8% | $54.92 | 11/30/2017 | |||||||
Speechworks(2) | NA / NA / NA | 34,249 | 6.1% | $70.56 | 2/29/2016 | |||||||
| Nelson, Levine, De Luca & Hamilton, LLC | NA / NA / NA | 29,386 | 5.2% | $55.00 | 9/30/2024 | |||||||
| IP Soft | NA / NA / NA | 27,895 | 5.0% | $49.47 | 2/29/2016 | |||||||
| Bressler Amery & Ross | NA / NA / NA | 23,033 | 4.1% | $41.92 | 3/31/2015 | |||||||
Bats Global Markets(3) | NA / NA / NA | 22,135 | 4.0% | $54.35 | 7/31/2018 | |||||||
| Axioma | NA / NA / NA | 18,406 | 3.3% | $50.38 | 2/28/2022 | |||||||
| Servcorp State Street | NA / NA / NA | 14,486 | 2.6% | $58.00 | 8/31/2023 | |||||||
Simon Kucher & Partners(4) | NA / NA / NA | 14,486 | 2.6% | $54.50 | 1/31/2019 | |||||||
| Alphadyne Asset Management | NA / NA / NA | 14,486 | 2.6% | $53.00 | 8/31/2023 | |||||||
| (1) | Based on the underwritten rent roll. |
| (2) | Speechworks currently subleases all of its space to IP Soft. |
| (3) | Bats Global Markets may terminate its lease on July 31, 2018 with 12 months’ prior notice and payment of a termination fee. |
| (4) | Simon Kucher & Partners may terminate its lease on January 31, 2019 with 12 months’ prior notice and payment of a termination fee. |
Lease Rollover Schedule(1) | ||||||||||||||||||||||||||
Year | Number of Leases Expiring | Net Rentable Area Expiring | % of NRA Expiring | Base Rent Expiring | % of Base Rent Expiring | Cumulative Net Rentable Area Expiring | Cumulative % of NRA Expiring | Cumulative Base Rent Expiring | Cumulative % of Base Rent Expiring | |||||||||||||||||
Vacant(2) | NAP | 51,976 | 9.3% | NAP | NAP | 51,976 | 9.3% | NAP | NAP | |||||||||||||||||
| 2014 & MTM | 5 | 29,675 | 5.3 | $1,017,979 | 3.9 | % | 81,651 | 14.6% | $1,017,979 | 3.9% | ||||||||||||||||
| 2015 | 8 | 44,922 | 8.0 | 1,991,176 | 7.5 | 126,573 | 22.6% | $3,009,154 | 11.4% | |||||||||||||||||
| 2016 | 12 | 112,961 | 20.2 | 6,200,627 | 23.5 | 239,534 | 42.8% | $9,209,781 | 34.9% | |||||||||||||||||
| 2017 | 4 | 100,243 | 17.9 | 5,418,113 | 20.5 | 339,777 | 60.7% | $14,627,894 | 55.4% | |||||||||||||||||
| 2018 | 8 | 49,234 | 8.8 | 2,705,643 | 10.2 | 389,011 | 69.4% | $17,333,537 | 65.6% | |||||||||||||||||
| 2019 | 5 | 45,496 | 8.1 | 2,297,957 | 8.7 | 434,507 | 77.6% | $19,631,494 | 74.3% | |||||||||||||||||
| 2020 | 1 | 5,138 | 0.9 | 282,590 | 1.1 | 439,645 | 78.5% | $19,914,084 | 75.4% | |||||||||||||||||
| 2021 | 3 | 6,849 | 1.2 | 426,618 | 1.6 | 446,494 | 79.7% | $20,340,702 | 77.0% | |||||||||||||||||
| 2022 | 1 | 18,406 | 3.3 | 927,314 | 3.5 | 464,900 | 83.0% | $21,268,016 | 80.5% | |||||||||||||||||
| 2023 | 3 | 43,458 | 7.8 | 2,375,704 | 9.0 | 508,358 | 90.7% | $23,643,720 | 89.5% | |||||||||||||||||
| 2024 | 3 | 38,128 | 6.8 | 2,069,314 | 7.8 | 546,486 | 97.6% | $25,713,034 | 97.3% | |||||||||||||||||
| 2025 & Beyond | 1 | 13,724 | 2.4 | 706,808 | 2.7 | 560,210 | 100.0% | $26,419,842 | 100.0% | |||||||||||||||||
| Total | 54 | 560,210 | 100.0% | $26,419,842 | 100.0 | % | ||||||||||||||||||||
| (1) | Based on the underwritten rent roll. |
| (2) | Vacant space includes 14,837 square feet master leased to an affiliate of the borrower and sponsors. |
THE INFORMATION IN THIS STRUCTURAL AND COLLATERAL TERM SHEET IS NOT COMPLETE AND MAY BE AMENDED PRIOR TO THE TIME OF SALE. THIS TERM SHEET IS NOT AN OFFER TO SELL THESE SECURITIES AND IT IS NOT A SOLICITATION OF AN OFFER TO BUY THESE SECURITIES IN ANY JURISDICTION WHERE THE OFFER OR SALE IS NOT PERMITTED.
| 74 of 124 | |
| Structural and Collateral Term Sheet | JPMBB 2014-C24 | |
17 State Street | ||
| Operating History and Underwritten Net Cash Flow | |||||||||||||||
2011 | 2012 | 2013 | TTM(1) | Underwritten | Per Square Foot | %(2) | |||||||||
Rents in Place(3)(4) | $24,450,373 | $24,550,081 | $23,194,293 | $24,335,774 | $26,419,842 | $47.16 | 82.3 | % | |||||||
| Vacant Income | 0 | 0 | 0 | 0 | 2,859,311 | 5.10 | 8.9 | ||||||||
| Gross Potential Rent | $24,450,373 | $24,550,081 | $23,194,293 | $24,335,774 | $29,279,153 | $52.26 | 91.2 | % | |||||||
| Total Reimbursements | 4,096,984 | 3,162,230 | 3,661,982 | 3,826,840 | 2,839,102 | 5.07 | 8.8 | ||||||||
| Net Rental Income | $28,547,357 | $27,712,311 | $26,856,276 | $28,162,614 | $32,118,255 | $57.33 | 100.0 | % | |||||||
| (Vacancy/Credit Loss) | 0 | 0 | 0 | 0 | (2,859,186) | (5.10) | (8.9) | ||||||||
| Other Income | 234,481 | 125,855 | 943,290 | 617,275 | 113,204 | 0.20 | 0.4 | ||||||||
| Effective Gross Income | $28,781,838 | $27,838,166 | $27,799,566 | $28,779,889 | $29,372,273 | $52.43 | 91.5 | % | |||||||
| Total Expenses | $13,499,936 | $13,871,717 | $14,752,050 | $14,749,671 | $14,176,879 | $25.31 | 48.3 | % | |||||||
| Net Operating Income | $15,281,901 | $13,966,450 | $13,047,516 | $14,030,219 | $15,195,394 | $27.12 | 51.7 | % | |||||||
| Total TI/LC, Capex/RR | 0 | 0 | 0 | 0 | 661,048 | 1.18 | 2.3 | ||||||||
| Net Cash Flow | $15,281,901 | $13,966,450 | $13,047,516 | $14,030,219 | $14,534,346 | $25.94 | 49.5 | % | |||||||
| (1) | TTM column represents the trailing twelve months ending on May 31, 2014. |
| (2) | Percentage column represents percent of Net Rental Income for all revenue lines and represents percent of Effective Gross Income for the remainder of fields. |
| (3) | Underwritten Rents in Place exclude $778,692 of additional rent from a master lease which was entered into by an affiliate of the sponsors at closing. Please refer to “Master Lease” below. |
| (4) | The increase in Rents in Place from TTM to Underwritten is primarily the result of nine newly executed leases totaling approximately 58,932 square feet and $3,274,841 of annual rent with lease commencement dates in 2014. |
Property Management. The property is managed by RFR Realty LLC, an affiliate of the borrower.
Master Lease. At closing, an affiliate of the sponsors entered into a master lease covering approximately 14,837 square feet (2.6% of the net rentable area) through July 31, 2026. The monthly master lease payment (which is not included in the underwritten income) is $64,891. The square footage demised under the master lease may be reduced on any date when the projected net operating income exceeds a certain threshold (which, with respect to the first reduction event, is the net operating income as of the origination date and, with respect to subsequent reductions, is the projected net operating income on the immediately preceding date that the space demised under the master lease was reduced). The square footage will be reduced in an amount such that the aggregate rent paid under the master lease is reduced in proportion to the amount by which the projected net operating income exceeds the operating income as of the origination date in accordance with the loan agreement. Projected net operating income will be based on current executed leases and projected annualized operating expenses and will be calculated assuming (1) a minimum vacancy equal to the greater of (i) 5.0% and (ii) actual vacancy, (2) rent due under the master lease shall be excluded, (3) any new lease with an initial lease term of less than three years shall not be included in determining net operating income, (4) a deduction for a management fee equal to the greater of (x) actual management fees and (y) the lesser of (a) assumed management fees of 4.0% of gross income from operations and (b) $1,000,000 and (5) a deduction of $100,735 for replacement reserves escrows and $559,640 for TI/LC reserve escrows. The master lease will be terminated when the projected net operating income exceeds $16,000,000 on any determination date.
Occupancy including the master leased space is 93.4% and the UW NCF DSCR including the cash flow from the master lease for the 17 State Street Whole Loan is 1.88x and 1.31x for the 17 State Street Whole Loan and the total debt (including the related mezzanine loan), respectively.
Escrows and Reserves. At origination, the borrower deposited into escrow approximately $2.1 million for outstanding tenant improvement and leasing commissions, $1.9 million for outstanding rent abatements associated with 15 tenants and $1.0 million for real estate taxes.
Tax Escrows - On a monthly basis, the borrower is required to escrow 1/12 of the annual estimated tax payments, which currently equates to $520,500.
Insurance Escrows - On a monthly basis, the borrower is required to escrow 1/12 of the annual insurance payments, which currently equates to $69,400.
Replacement Reserves - On a monthly basis, the borrower is required to escrow $8,395 (approximately $0.18 per square foot annually) for replacement reserves.
THE INFORMATION IN THIS STRUCTURAL AND COLLATERAL TERM SHEET IS NOT COMPLETE AND MAY BE AMENDED PRIOR TO THE TIME OF SALE. THIS TERM SHEET IS NOT AN OFFER TO SELL THESE SECURITIES AND IT IS NOT A SOLICITATION OF AN OFFER TO BUY THESE SECURITIES IN ANY JURISDICTION WHERE THE OFFER OR SALE IS NOT PERMITTED.
| 75 of 124 | |
| Structural and Collateral Term Sheet | JPMBB 2014-C24 | |
17 State Street | ||
TI/LC Reserves - On a monthly basis, the borrower is required to escrow $46,640 (approximately $1.00 per square foot annually) for tenant improvement and leasing commission reserves.
Lockbox / Cash Management. The loan is structured with a hard lockbox and in-place cash management. The borrower was required to send tenant direction letters to tenants within three business days of the origination date instructing them to deposit all rents and payments into the lockbox account controlled by the lender. All funds in the lockbox account are swept daily to a cash management account under the control of the lender and disbursed during each interest period during the term of the loan in accordance with the loan documents. To the extent that (i) the debt service coverage ratio (as calculated in the loan documents and including the mezzanine loan) based on a trailing three month period falls below 1.10x, (ii) there is an event of default under the loan documents or (iii) the borrower or property manager becomes the subject of a bankruptcy, insolvency or similar action, then all excess cash flow after payment of debt service, required reserves and operating expenses is required to be held as additional collateral for the loan.
Additional Debt. The previously existing debt was securitized in the BACM 2004-3 transaction and had a maturity date of April 2014. Refinancing of such debt was delayed, in part, as a result of negotiations between the sponsors and RREEF on behalf of a RREEF fund which held subordinate investments in 17 State Street and three other assets controlled by the sponsors. As a result of the delay, the mortgage loan entered maturity default. In May 2014, JPMCB provided a bridge loan to the predecessor-in-interest to the borrower in order to pay off the defaulted mortgage debt at par which permitted the sponsors to continue negotiations with RREEF. In July 2014, the current mortgage loan funded and the proceeds were used to pay off the bridge financing and approximately $63.1 million of the subordinate investments. $40.0 million of the remaining subordinate investments was structured as a mezzanine loan which is held by RREEF on behalf of a RREEF fund and is cross-defaulted with the $88.5 million subordinate investments encumbering three other assets. The three other assets are all located in Manhattan at 160 Fifth Avenue (141,497 square feet, 100% occupied), 85 Fifth Avenue (16,987 square feet, 100% occupied) and 90 Fifth Avenue (137,004 square feet, 40.8% occupied). The initial amount of the subordinate financing was $32,000,000 for 90 Fifth Avenue, $39,000,000 for 160 Fifth Avenue and $17,500,000 for 85 Fifth Avenue. The interest rate required under the subordinate financing documents is 9.75% for 90 Fifth Avenue and 8.0% for each of the other two properties, and each requires interest-only payments, with the principal to be repaid on the related maturity dates (August 30, 2017 for 90 Fifth Avenue with no extension option and December 17, 2015 for the other two properties, which may be extended to December 17, 2017 in each case). Upon 90 Fifth Avenue achieving an occupancy of 90.0%, provided that at such time no event of default exists under the 17 State Street mezzanine loan or the subordinate financing referenced above, the 17 State Street mezzanine loan will no longer be cross defaulted with any subordinate financing. At the time the subordinate financing was put in place at 90 Fifth Avenue, a debt service reserve was established to cover both the mortgage debt and the subordinate financing through maturity for 90 Fifth Avenue. The total mortgage debt across all four assets including 17 State Street is approximately $363.4 million, which equates to a 49.9% Cut-off Date LTV and the total mortgage debt and subordinate financing across all four assets is approximately $491.9 million, which equates to a Cut-off Date LTV of 67.5%. The debt service coverage ratio across all four assets including 17 State Street is approximately 1.93x on the combined mortgage debt and 1.15x including the combined mortgage debt and subordinate financing.
The $40.0 million mezzanine loan is secured by the direct and indirect equity interests in the borrower and is coterminous with the mortgage loan. The mezzanine loan is interest-only for the term of the loan and has an 8.82000% coupon. Including the mezzanine loan, the Cut-off Date LTV is 67.7%, the UW NCF DSCR is 1.24x and the UW NOI Debt Yield is 6.9%. The lenders have entered into a customary intercreditor agreement.
THE INFORMATION IN THIS STRUCTURAL AND COLLATERAL TERM SHEET IS NOT COMPLETE AND MAY BE AMENDED PRIOR TO THE TIME OF SALE. THIS TERM SHEET IS NOT AN OFFER TO SELL THESE SECURITIES AND IT IS NOT A SOLICITATION OF AN OFFER TO BUY THESE SECURITIES IN ANY JURISDICTION WHERE THE OFFER OR SALE IS NOT PERMITTED.
| 76 of 124 | |
| Structural and Collateral Term Sheet | JPMBB 2014-C24 |
North Riverside Park Mall |
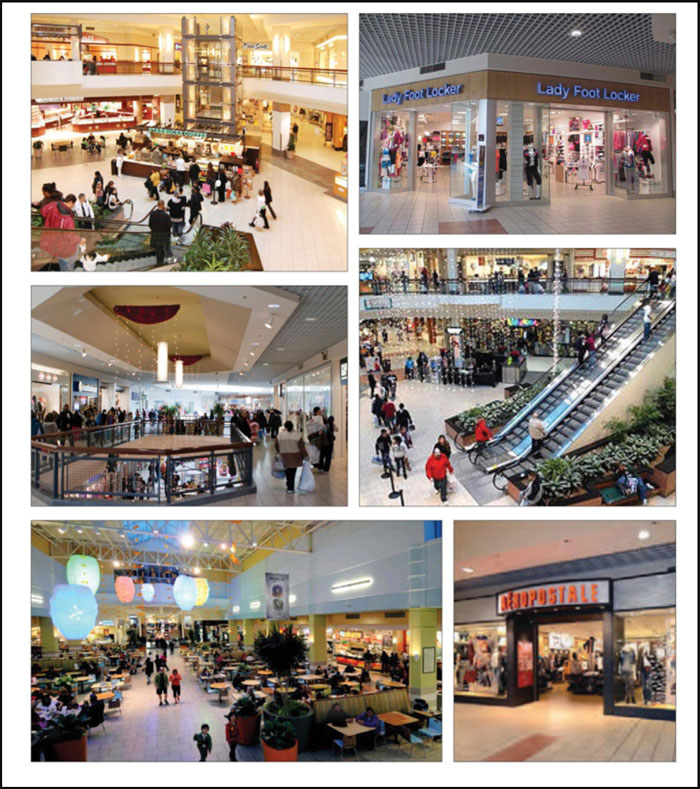
THE INFORMATION IN THIS STRUCTURAL AND COLLATERAL TERM SHEET IS NOT COMPLETE AND MAY BE AMENDED PRIOR TO THE TIME OF SALE. THIS TERM SHEET IS NOT AN OFFER TO SELL THESE SECURITIES AND IT IS NOT A SOLICITATION OF AN OFFER TO BUY THESE SECURITIES IN ANY JURISDICTION WHERE THE OFFER OR SALE IS NOT PERMITTED.
| 77 of 124 | |
| Structural and Collateral Term Sheet | JPMBB 2014-C24 |
North Riverside Park Mall |
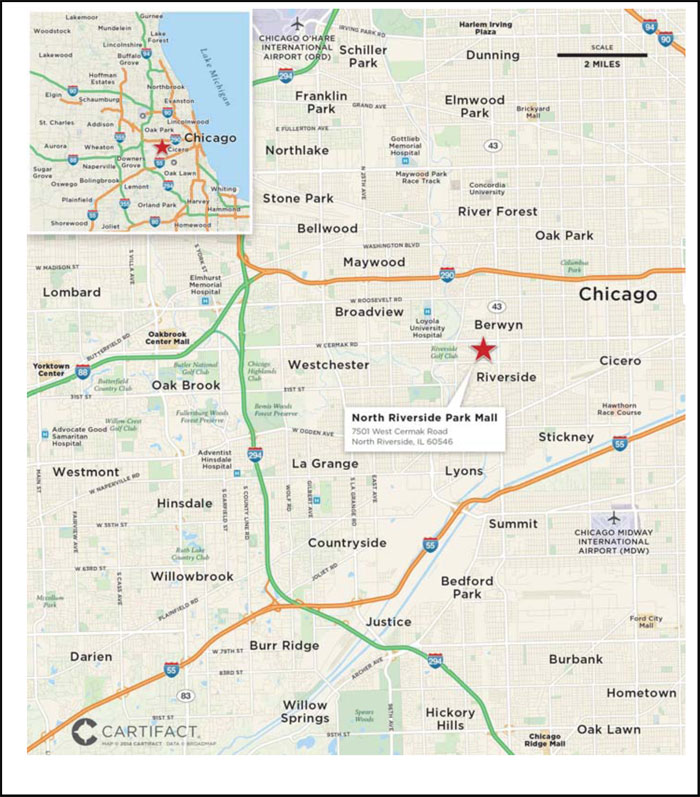
THE INFORMATION IN THIS STRUCTURAL AND COLLATERAL TERM SHEET IS NOT COMPLETE AND MAY BE AMENDED PRIOR TO THE TIME OF SALE. THIS TERM SHEET IS NOT AN OFFER TO SELL THESE SECURITIES AND IT IS NOT A SOLICITATION OF AN OFFER TO BUY THESE SECURITIES IN ANY JURISDICTION WHERE THE OFFER OR SALE IS NOT PERMITTED.
| 78 of 124 | |
| Structural and Collateral Term Sheet | JPMBB 2014-C24 |
North Riverside Park Mall |
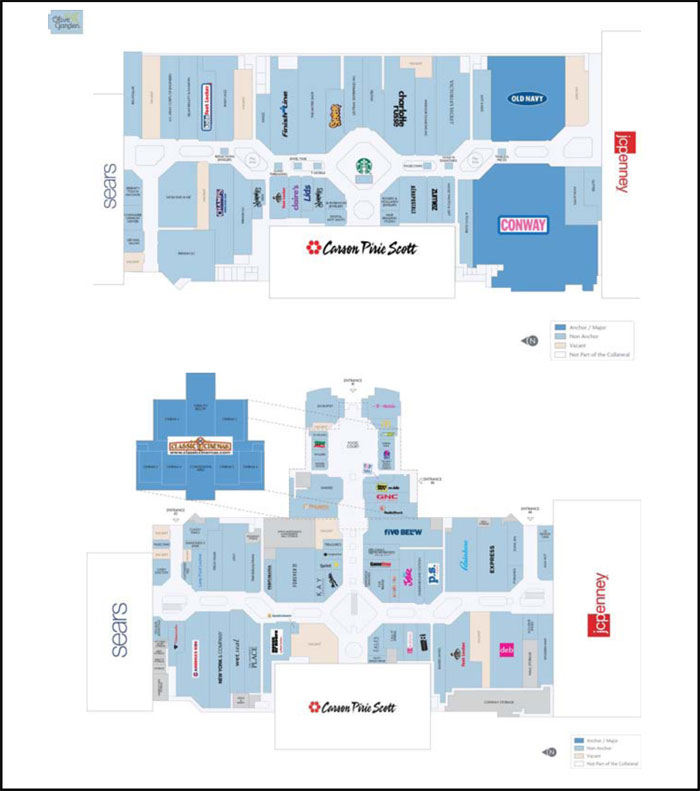
THE INFORMATION IN THIS STRUCTURAL AND COLLATERAL TERM SHEET IS NOT COMPLETE AND MAY BE AMENDED PRIOR TO THE TIME OF SALE. THIS TERM SHEET IS NOT AN OFFER TO SELL THESE SECURITIES AND IT IS NOT A SOLICITATION OF AN OFFER TO BUY THESE SECURITIES IN ANY JURISDICTION WHERE THE OFFER OR SALE IS NOT PERMITTED.
| 79 of 124 | |
| Structural and Collateral Term Sheet | JPMBB 2014-C24 |
North Riverside Park Mall |
| Mortgage Loan Information | Property Information | |||
| Mortgage Loan Seller: | Barclays | Single Asset / Portfolio: | Single Asset | |
| Original Principal Balance: | $75,000,000 | Title: | Fee | |
| Cut-off Date Principal Balance: | $75,000,000 | Property Type - Subtype: | Retail - Regional Mall | |
| % of Pool by IPB: | 5.9% | Net Rentable Area (SF): | 429,038 | |
| Loan Purpose: | Refinance | Location: | North Riverside, IL | |
| Borrower: | North Riverside Park Associates, | Year Built / Renovated: | 1974 / 2010 | |
| LLC | Occupancy(2): | 94.1% | ||
Sponsors(1): | Various | Occupancy Date: | 7/1/2014 | |
| Interest Rate: | 4.93500% | Number of Tenants(2): | 126 | |
| Note Date: | 9/15/2014 | 2011 NOI: | $7,308,177 | |
| Maturity Date: | 10/6/2019 | 2012 NOI: | $7,215,211 | |
| Interest-only Period: | None | 2013 NOI: | $7,173,983 | |
| Original Term: | 60 months | TTM NOI (as of 6/2014): | $7,649,693 | |
| Original Amortization: | 360 months | UW Economic Occupancy: | 91.9% | |
| Amortization Type: | Balloon | UW Revenues: | $18,665,676 | |
| Call Protection: | L(24),Def(32),O(4) | UW Expenses: | $11,255,210 | |
| Lockbox: | Hard | UW NOI: | $7,410,466 | |
| Additional Debt: | N/A | UW NCF: | $7,027,826 | |
| Additional Debt Balance: | N/A | Appraised Value / Per SF: | $129,000,000 / $301 | |
| Additional Debt Type: | N/A | Appraisal Date: | 7/16/2014 | |
Escrows and Reserves(3) | Financial Information | |||||
| Initial | Monthly | Initial Cap | Cut-off Date Loan / SF: | $175 | ||
| Taxes: | $0 | $413,295 | N/A | Maturity Date Loan / SF: | $161 | |
| Insurance: | $0 | Springing | N/A | Cut-off Date LTV: | 58.1% | |
| Replacement Reserves: | $900,000 | $17,973 | N/A | Maturity Date LTV: | 53.6% | |
| TI/LC: | $2,925,805 | $44,931 | N/A | UW NCF DSCR: | 1.47x | |
| Other: | $715,848 | $0 | N/A | UW NOI Debt Yield: | 9.9% | |
| Sources and Uses | |||||||
| Sources | Proceeds | % of Total | Uses | Proceeds | % of Total | ||
| Mortgage Loan | $75,000,000 | 93.9% | Payoff Existing Debt | $74,937,099 | 93.8% | ||
| Sponsor Equity | 4,874,398 | 6.1 | Upfront Reserves | 4,541,653 | 5.7 | ||
| Closing Costs | 395,646 | 0.5 | |||||
| Total Sources | $79,874,398 | 100.0% | Total Uses | $79,874,398 | 100.0% | ||
| (1) | For a full description of the sponsors, please refer to “The Sponsors” below. |
| (2) | Occupancy and Number of Tenants include temporary tenants, which occupy 55,470 square feet. Occupancy excluding temporary tenants is 81.2%. |
| (3) | For a full description of Escrows and Reserves, please refer to “Escrows and Reserves” below. |
The Loan. The North Riverside Park Mall loan has an outstanding principal balance of $75.0 million and is secured by a first mortgage lien on 429,038 square feet of a super regional mall totaling 1,075,445 square feet located in North Riverside, Illinois. The loan has a five-year term and amortizes on a 30-year schedule. The previously existing debt was securitized in the WBCMT 2004-C10 transaction.
The Borrower. The borrowing entity for the loan is North Riverside Park Associates, LLC, a New York limited liability company and special purpose entity.
The Sponsors. The loan sponsors and nonrecourse carve-out guarantors are Jeffrey J. Feil and Lloyd Goldman. The sponsors acquired the property in 2004 for approximately $108.0 million and after other project costs has a reported total cost basis of approximately $113.8 million. The sponsors will have approximately $38.8 million of equity remaining which includes approximately $4.9 million of fresh equity being contributed as part of the refinancing. Jeffrey J. Feil is and has been the President and CEO of The Feil Organization for the past 20 years. The Feil Organization is an established investment, development and management firm in New
THE INFORMATION IN THIS STRUCTURAL AND COLLATERAL TERM SHEET IS NOT COMPLETE AND MAY BE AMENDED PRIOR TO THE TIME OF SALE. THIS TERM SHEET IS NOT AN OFFER TO SELL THESE SECURITIES AND IT IS NOT A SOLICITATION OF AN OFFER TO BUY THESE SECURITIES IN ANY JURISDICTION WHERE THE OFFER OR SALE IS NOT PERMITTED.
| 80 of 124 | |
| Structural and Collateral Term Sheet | JPMBB 2014-C24 |
North Riverside Park Mall |
York City. Active in many facets of the industry, The Feil Organization owns, develops and manages over 26 million square feet of retail, commercial and industrial properties, over 5,000 residential units, as well as hundreds of net leased properties and thousands of acres of undeveloped land across the country. Lloyd Goldman is a Principal and the President of BLDG Management Co., Inc. and its affiliated entities, which own and operate considerable real estate throughout the United States.
The Property. North Riverside Park Mall is a 1,075,445 square foot two-story super regional mall, of which 429,038 square feet serve as collateral for the loan. The property was constructed in 1974, renovated in 2010 and is situated on approximately 27.8 acres in North Riverside, Illinois, approximately nine miles southwest of Chicago’s central business district. There are 5,410 surface and garage parking spaces at the property which are included in the collateral, resulting in a parking ratio of 5.05 spaces per 1,000 square feet of gross leasable area. The property is anchored by JCPenney (266,275 square feet, of which 178,404 square feet is being utilized), Sears (199,544 square feet, of which 149,658 square feet is being utilized) and Carson Pirie Scott (180,588 square feet). Each of the anchors owns their respective land and improvements and is excluded from the collateral of the loan. Based on 2013 loan sponsor estimates, JCPenney generated sales of approximately $26.0 million ($146 per utilized square foot), Sears generated sales of approximately $21.0 million ($140 per utilized square foot) and Carson Pirie Scott generated sales of approximately $21.0 million ($116 per square foot). Each of the anchors is outperforming the chain-wide national average on a gross sales basis. The JCPenney space at the property is a modern prototype store that includes boutiques such as Sephora, Disney, Claiborne and IZOD. According to the appraisal, the anchors at the property are primarily targeted toward middle-income consumers, which fits well with the demographic profile of the property’s immediate trade area.
As of July 1, 2014, the property, inclusive of non-collateral anchors, was approximately 97.6% occupied by 129 tenants and 92.5% occupied excluding 18 temporary tenants. For the same period, the collateral was 94.1% occupied by 126 tenants and 81.2% occupied excluding the 18 temporary tenants. The property’s major and in-line tenants generally consist of national tenants such as Forever 21, Old Navy, Aeropostale, Foot Locker, Charlotte Russe, Champs Sports, Victoria’s Secret and Express. One of the property’s larger tenants, Classic Cinema, a six-screen theater at the property, will reportedly be investing over $500,000 in their space to include new seating and other upgrades. Other recent leasing at the property has been strong and since December 2013, the borrower has successfully executed leases for seven major and in-line tenants accounting for 11.2% of the collateral square feet and 13.7% of the underwritten base rent. As of June 2014, gross mall sales for reporting tenants were approximately $97.6 million. In-line sales per square foot for comparable stores less than 10,000 square feet were approximately $427, $451, $461 and $459 in 2011, 2012, 2013 and as of June 2014, respectively. As of June 2014, occupancy costs for comparable tenants occupying less than 10,000 square feet were 12.8%.
North Riverside Park Mall is located in the village of North Riverside, Illinois, a near west suburb of Chicago and approximately nine miles southwest of Chicago’s central business district. The property is located along West Cermak Road to the north and one block west of Harlem Avenue. West Cermak Road is the neighborhood’s primary east-west roadway and Harlem Avenue is the neighborhood’s primary north-south roadway. Additionally, the property is located approximately 1.6 miles south of I-290 which is the primary interstate serving downtown Chicago and the western suburbs. According to the appraisal, traffic counts bordering the mall are in excess of 30,000 vehicles per day, which is above average for the area.
According to the appraisal, the property has a primary trade area consisting of a five-mile radius that contains 619,512 people, with an average household income of $64,763. The secondary trade area, defined as being within a seven-mile radius of the property, contains 1,247,872 people, with an average household income of $61,572. The appraisal concluded per square foot market rents of $63.00 for in-line space less than 1,000 square feet, $36.00 for in-line space between 1,000 and 2,500 square feet, $26.00 for in-line space between 2,501 and 5,000 square feet, $18.00 for in-line space greater than 5,000 square feet, $90.00 for food court space, $500.00 for kiosk space, $35.00 for major tenant space, $10.00 for junior anchor space, $15.00 for the theater space and $16.50 for outparcel space. According to the appraisal, the property’s primary competition consists of the five properties detailed in the table below.
Competitive Set Summary(1) | ||||||||
| Property | Year Built / Renovated | Total GLA | Est. Occ. | Proximity | Anchor Tenants | |||
| Ford City Mall | 1965 / 1989 | 1,346,430 | 80.0% | 7.0 | JCPenney, Carson Pirie Scott, AMC 14, Marshalls, HHGregg, Old Navy | |||
| Harlem Irving Plaza | 1956 / 2004 | 700,000 | 99.0% | 7.4 | Carson Pirie Scott, Target, Kohl’s, Best Buy | |||
| Oak Brook Center | 1962 / 1991 | 2,068,092 | 96.0% | 7.2 | Crate & Barrel, Lord & Taylor, Macy’s, Neiman Marcus, Nordstrom, Sears | |||
| Yorktown Center & Shops | 2007 | 1,324,450 | 89.0% | 10.1 | JCPenney, Carson Pirie Scott, Von Maur, AMC Theater, Sports Authority | |||
| Chicago Ridge Mall | 1981 / 2004 | 885,841 | 95.0% | 9.0 | Sears, Carson Pirie Scott, Kohl’s, Bed Bath & Beyond, Michael’s, Aldi | |||
| Total / Weighted Average | 6,324,813 | 91.3% | ||||||
| (1) | Per the appraisal. |
THE INFORMATION IN THIS STRUCTURAL AND COLLATERAL TERM SHEET IS NOT COMPLETE AND MAY BE AMENDED PRIOR TO THE TIME OF SALE. THIS TERM SHEET IS NOT AN OFFER TO SELL THESE SECURITIES AND IT IS NOT A SOLICITATION OF AN OFFER TO BUY THESE SECURITIES IN ANY JURISDICTION WHERE THE OFFER OR SALE IS NOT PERMITTED.
| 81 of 124 | |
| Structural and Collateral Term Sheet | JPMBB 2014-C24 |
North Riverside Park Mall |
Historical and Current Occupancy(1)(2) | |||
| 2011 | 2012 | 2013 | Current(3) |
| 96.4% | 96.3% | 95.8% | 94.1% |
| (1) | Historical Occupancies are as of December 31 of each respective year. |
| (2) | Current and Historical Occupancy includes temporary tenants. Excluding temporary tenants, 2011, 2012, 2013 and Current Occupancy is 84.5%, 85.0%, 82.3% and 81.2%, respectively. |
| (3) | Current Occupancy is as of July 1, 2014. |
Historical In-line Sales and Occupancy Costs(1) | ||||||||
| 2011 | 2012 | 2013 | TTM(2) | |||||
| In-line Sales PSF | $427 | $451 | $461 | $459 | ||||
Occupancy Costs(3) | N/A | N/A | N/A | 12.8% | ||||
| (1) | In-line Sales PSF and Occupancy Costs are for comparable tenants less than 10,000 square feet. |
| (2) | TTM In-line Sales PSF and Occupancy Costs represent the trailing twelve months ending June 30, 2014. |
| (3) | Historical Occupancy Costs were not provided by the borrower. |
Tenant Summary(1) | |||||||||||||
| Tenant | Ratings(2) Moody’s/S&P/Fitch | Net Rentable Area (SF) | % of Total NRA | Base Rent PSF | Sales PSF(3) | Occupancy Costs(3) | Lease Expiration Date | ||||||
Non-Collateral Anchor(4)(5) | |||||||||||||
JCPenney(6) | Caa1 / CCC+ / CCC | 266,275 | N/A | N/A | $98 | N/A | N/A | ||||||
Sears(7) | Caa1 / CCC+ / CCC | 199,544 | N/A | N/A | $105 | N/A | N/A | ||||||
Carson Pirie Scott(8) | Caa2 / B- / NA | 180,588 | N/A | N/A | $116 | N/A | N/A | ||||||
| 646,407 | |||||||||||||
| Top 10 Collateral Tenants | |||||||||||||
| Conway Store | NA / NA / NA | 33,324 | 7.8% | $9.90 | $75 | 13.1% | 11/30/2019 | ||||||
Classic Cinema(9) | NA / NA / NA | 30,000 | 7.0% | $6.67 | $345,450 | 10.3% | 10/31/2016 | ||||||
| Forever 21 | NA / NA / NA | 16,000 | 3.7% | $33.75 | N/A | N/A | 6/30/2024 | ||||||
Old Navy(10) | Baa3 / BBB- / BBB- | 14,949 | 3.5% | $30.00 | $371 | 9.0% | 3/31/2019 | ||||||
| Deb Shop | NA / NA / NA | 10,275 | 2.4% | $20.25 | $109 | 18.7% | 1/31/2016 | ||||||
America’s Kids | NA / NA / NA | 9,579 | 2.2% | $22.88 | $131 | 17.8% | 3/31/2021 | ||||||
| Olive Garden | Baa3 / BBB- / BBB- | 9,100 | 2.1% | $14.41 | $532 | 3.1% | 1/31/2016 | ||||||
The Mister Shop(11) | NA / NA / NA | 8,442 | 2.0% | $28.43 | $240 | 11.8% | MTM | ||||||
| Rainbow | NA / NA / NA | 8,151 | 1.9% | $28.22 | $157 | 18.0% | 1/31/2021 | ||||||
Champs Sports(12) | Ba2 / BB+ / NA | 8,119 | 1.9% | $28.00 | $332 | 16.9% | 4/30/2024 | ||||||
| (1) | Based on the underwritten rent roll. |
| (2) | Ratings provided are for the parent company of the entity listed in the “Tenant” field whether or not the parent company guarantees the lease. |
| (3) | Sales PSF and Occupancy Costs represent sales for the twelve-month period ending on June 30, 2014 for all collateral tenants. |
| (4) | Non-Collateral Anchor tenants own their respective land and improvements and are excluded from the collateral for the North Riverside Park Mall loan. |
| (5) | Non-Collateral Anchor tenants Sales PSF are based on 2013 loan sponsor estimates. |
| (6) | JCPenney Sales PSF reflects JCPenney’s total space and gross sales of approximately $26.0 million. Sales PSF based on 178,404 square feet of utilized space is approximately $146. |
| (7) | Sears Sales PSF reflects Sears’ total space and gross sales of approximately $21.0 million. Sales PSF based on 149,658 square feet of utilized space is approximately $140. |
| (8) | Gross sales for Carson Pirie Scott were approximately $21.0 million. |
| (9) | Sales PSF reflects sales per screen for Classic Cinema. Sales per screen is based on a total of six screens. |
| (10) | Old Navy Sales PSF reflects Old Navy’s current space (effective 4/2014) of 14,949 square feet. Old Navy’s prior space consisted of 20,068 square feet. |
| (11) | According to the loan sponsor, The Mister Shop is currently negotiating a new five-year lease. The Mister Shop has been in occupancy at the property since 1981. |
| (12) | Champ Sports Sales PSF reflects Champs Sports’ current space (effective 4/2014) of 8,119 square feet. Champ Sports’ prior space consisted of 5,927 square feet. |
THE INFORMATION IN THIS STRUCTURAL AND COLLATERAL TERM SHEET IS NOT COMPLETE AND MAY BE AMENDED PRIOR TO THE TIME OF SALE. THIS TERM SHEET IS NOT AN OFFER TO SELL THESE SECURITIES AND IT IS NOT A SOLICITATION OF AN OFFER TO BUY THESE SECURITIES IN ANY JURISDICTION WHERE THE OFFER OR SALE IS NOT PERMITTED.
| 82 of 124 | |
| Structural and Collateral Term Sheet | JPMBB 2014-C24 |
North Riverside Park Mall |
Lease Rollover Schedule(1) | |||||||||||||||||
| Year | Number of Leases Expiring | Net Rentable Area Expiring | % of NRA Expiring | Base Rent Expiring | % of Base Rent Expiring | Cumulative Net Rentable Area Expiring | Cumulative % of NRA Expiring | Cumulative Base Rent Expiring | Cumulative % of Base Rent Expiring | ||||||||
| Vacant | NAP | 25,347 | 5.9% | NAP | NAP | 25,347 | 5.9% | NAP | NAP | ||||||||
2014 & MTM(2) | 28 | 70,821 | 16.5 | $555,590 | 5.3% | 96,168 | 22.4% | $555,590 | 5.3% | ||||||||
| 2015 | 17 | 34,573 | 8.1 | 1,400,850 | 13.3 | 130,741 | 30.5% | $1,956,440 | 18.6% | ||||||||
| 2016 | 24 | 95,644 | 22.3 | 2,288,582 | 21.7 | 226,385 | 52.8% | $4,245,022 | 40.3% | ||||||||
| 2017 | 19 | 38,103 | 8.9 | 1,738,555 | 16.5 | 264,488 | 61.6% | $5,983,576 | 56.8% | ||||||||
| 2018 | 6 | 13,437 | 3.1 | 482,499 | 4.6 | 277,925 | 64.8% | $6,466,075 | 61.4% | ||||||||
| 2019 | 5 | 54,673 | 12.7 | 1,000,583 | 9.5 | 332,598 | 77.5% | $7,466,658 | 70.9% | ||||||||
| 2020 | 1 | 7,500 | 1.7 | 105,000 | 1.0 | 340,098 | 79.3% | $7,571,658 | 71.9% | ||||||||
| 2021 | 9 | 28,458 | 6.6 | 784,501 | 7.5 | 368,556 | 85.9% | $8,356,160 | 79.4% | ||||||||
| 2022 | 7 | 9,571 | 2.2 | 494,604 | 4.7 | 378,127 | 88.1% | $8,850,764 | 84.1% | ||||||||
| 2023 | 4 | 11,582 | 2.7 | 273,934 | 2.6 | 389,709 | 90.8% | $9,124,698 | 86.7% | ||||||||
| 2024 | 4 | 32,253 | 7.5 | 1,176,512 | 11.2 | 421,962 | 98.4% | $10,301,210 | 97.9% | ||||||||
| 2025 & Beyond | 2 | 7,076 | 1.6 | 225,995 | 2.1 | 429,038 | 100.0% | $10,527,205 | 100.0% | ||||||||
| Total | 126 | 429,038 | 100.0% | $10,527,205 | 100.0% | ||||||||||||
| (1) | Based on the underwritten rent roll. |
| (2) | 2014 & MTM includes the 55,470 square feet leased to temporary tenants. |
| Operating History and Underwritten Net Cash Flow | ||||||||||||||||
| 2011 | 2012 | 2013 | TTM(1) | Underwritten | Per Square Foot | %(2) | ||||||||||
Rents in Place(3)(4) | $10,633,670 | $8,963,550 | $9,585,991 | $10,074,289 | $10,527,205 | $24.54 | 55.7% | |||||||||
| Vacant Income | 0 | 0 | 0 | 0 | 1,534,206 | 3.58 | 8.1 | |||||||||
| Gross Potential Rent | $10,633,670 | $8,963,550 | $9,585,991 | $10,074,289 | $12,061,411 | $28.11 | 63.9% | |||||||||
| Total Reimbursements | 6,714,920 | 7,097,783 | 7,223,998 | 6,983,636 | 6,827,092 | 15.91 | 36.1 | |||||||||
| Net Rental Income | $17,348,590 | $16,061,333 | $16,809,989 | $17,057,925 | $18,888,503 | $44.03 | 100.0% | |||||||||
(Vacancy/Credit Loss)(5) | (696,745) | 534,801 | (104,977) | (104,977) | (1,534,206) | (3.58) | (8.1) | |||||||||
Other Income(6) | 1,555,295 | 1,787,788 | 1,561,677 | 1,564,586 | 1,311,379 | 3.06 | 6.9 | |||||||||
| Effective Gross Income | $18,207,140 | $18,383,922 | $18,266,689 | $18,517,534 | $18,665,676 | $43.51 | 98.8% | |||||||||
| Total Expenses | $10,898,963 | $11,168,711 | $11,092,706 | $10,867,841 | $11,255,210 | $26.23 | 60.3% | |||||||||
| Net Operating Income | $7,308,177 | $7,215,211 | $7,173,983 | $7,649,693 | $7,410,466 | $17.27 | 39.7% | |||||||||
| Total TI/LC, Capex/RR | 0 | 0 | 0 | 0 | 754,380 | 1.76 | 4.0 | |||||||||
TI/LC Adjustment(7) | 0 | 0 | 0 | 0 | (371,740) | (0.87) | (2.0) | |||||||||
| Net Cash Flow | $7,308,177 | $7,215,211 | $7,173,983 | $7,649,693 | $7,027,826 | $16.38 | 37.7% | |||||||||
| (1) | TTM column represents the trailing twelve-month period ending on June 30, 2014. |
| (2) | Percentage column represents percent of Net Rental Income for all revenue lines and represents percent of Effective Gross Income for the remainder of fields. |
| (3) | Underwritten Rents in Place are based on the July 1, 2014 rent roll, with rent bumps underwritten through August 31, 2015. |
| (4) | Underwritten Rents in Place is higher than TTM primarily due to $297,740 of rent bumps. |
| (5) | The 2012 credit loss figure is positive due to previous amounts written off to bad debt which were subsequently collected and were recognized as income in a later year. |
| (6) | Other Income is primarily attributable to temporary tenants and overage rent. |
| (7) | The Underwritten TI/LC Adjustment reflects straight-lining of the $1,858,699 upfront reserve (see below) for future tenant improvements and leasing commissions over the five-year loan term. |
Property Management. The property is managed by Jeffrey Management Corp., an affiliate of the loan sponsor.
Escrows and Reserves. At origination, the borrower is required to deposit $1,858,699 for future tenant improvements and leasing commissions, $1,067,106 for outstanding tenant improvement obligations, $900,000 for replacement reserves and $715,848 for immediate repairs.
Leasing Obligation - Of the $1,858,699 escrow for future tenant improvements and leasing commissions, $716,339 of such amount may be used by the borrower to pay tenant improvement obligations, tenant work allowance and leasing commission obligations with respect to any lease entered into by and between the borrower and H & M Hennes & Mauritz L.P. (“H&M”) or any affiliated brand. This lease has not been underwritten. Any additional H&M lease obligations in excess of the $716,339, is guaranteed to be funded by the borrower up to an additional $1,421,161.
THE INFORMATION IN THIS STRUCTURAL AND COLLATERAL TERM SHEET IS NOT COMPLETE AND MAY BE AMENDED PRIOR TO THE TIME OF SALE. THIS TERM SHEET IS NOT AN OFFER TO SELL THESE SECURITIES AND IT IS NOT A SOLICITATION OF AN OFFER TO BUY THESE SECURITIES IN ANY JURISDICTION WHERE THE OFFER OR SALE IS NOT PERMITTED.
| 83 of 124 | |
| Structural and Collateral Term Sheet | JPMBB 2014-C24 |
North Riverside Park Mall |
Tax Escrows - On a monthly basis, the borrowers are required to escrow 1/12 of the annual estimated tax payments, which currently equates to $413,295.
Insurance Escrows - The requirement for the borrowers to make monthly deposits into the insurance escrow is waived so long as no event of default exists and the borrowers provide satisfactory evidence that the property is insured as part of a blanket policy in accordance with the loan documents.
Replacement Reserves - On a monthly basis, the borrower is required to escrow $17,973 (approximately $0.50 per square foot annually) for replacement reserves.
TI/LC Reserves - On a monthly basis, the borrower is required to escrow $44,931 (approximately $1.26 per square foot annually) for TI/LC reserves.
Lockbox / Cash Management. The loan is structured with a hard lockbox and in-place cash management. The borrower is required to send tenant direction letters to tenants instructing them to deposit all rents and payments into the lockbox account controlled by the lender. All funds in the lockbox account are swept daily to a cash management account under the control of the lender and disbursed during on the business day preceding each monthly payment date of the term of the loan in accordance with the loan documents. To the extent that there is a Triggering Event, all excess cash flow after payment of debt service, required reserves and operating expenses will be held as additional collateral for the loan.
A “Triggering Event” means: the period commencing upon the earlier of (i) an event of default or (ii) the date on which the DSCR is less than 1.25x for any calendar quarter and ending on the date the DSCR equals or exceeds 1.30x for two consecutive calendar quarters.
THE INFORMATION IN THIS STRUCTURAL AND COLLATERAL TERM SHEET IS NOT COMPLETE AND MAY BE AMENDED PRIOR TO THE TIME OF SALE. THIS TERM SHEET IS NOT AN OFFER TO SELL THESE SECURITIES AND IT IS NOT A SOLICITATION OF AN OFFER TO BUY THESE SECURITIES IN ANY JURISDICTION WHERE THE OFFER OR SALE IS NOT PERMITTED.
| 84 of 124 | |
| Structural and Collateral Term Sheet | JPMBB 2014-C24 | |
| NoBu Station | ||

THE INFORMATION IN THIS STRUCTURAL AND COLLATERAL TERM SHEET IS NOT COMPLETE AND MAY BE AMENDED PRIOR TO THE TIME OF SALE. THIS TERM SHEET IS NOT AN OFFER TO SELL THESE SECURITIES AND IT IS NOT A SOLICITATION OF AN OFFER TO BUY THESE SECURITIES IN ANY JURISDICTION WHERE THE OFFER OR SALE IS NOT PERMITTED.
| 85 of 124 | |
| Structural and Collateral Term Sheet | JPMBB 2014-C24 | |
| NoBu Station | ||

THE INFORMATION IN THIS STRUCTURAL AND COLLATERAL TERM SHEET IS NOT COMPLETE AND MAY BE AMENDED PRIOR TO THE TIME OF SALE. THIS TERM SHEET IS NOT AN OFFER TO SELL THESE SECURITIES AND IT IS NOT A SOLICITATION OF AN OFFER TO BUY THESE SECURITIES IN ANY JURISDICTION WHERE THE OFFER OR SALE IS NOT PERMITTED.
| 86 of 124 | |
| Structural and Collateral Term Sheet | JPMBB 2014-C24 | |
| NoBu Station | ||
| Mortgage Loan Information | Property Information | |||
| Mortgage Loan Seller: | JPMCB | Single Asset / Portfolio: | Single Asset | |
| Original Principal Balance: | $42,000,000 | Title: | Fee | |
| Cut-off Date Principal Balance: | $42,000,000 | Property Type - Subtype: | Multifamily - Garden | |
| % of Pool by IPB: | 3.3% | Net Rentable Area (Units): | 474 | |
| Loan Purpose: | Acquisition | Location: | San Antonio, TX | |
| Borrower: | Elysian at Nobu Station, LP | Year Built / Renovated: | 2013 / N/A | |
| Sponsors: | Oren Blatt, Yacob Blatt and | Occupancy: | 98.9% | |
| Yehonatan Sade | Occupancy Date: | 8/31/2014 | ||
| Interest Rate: | 4.36000% | Number of Tenants: | N/A | |
| Note Date: | 9/19/2014 | 2011 NOI(1): | N/A | |
| Maturity Date: | 10/1/2024 | 2012 NOI(1): | N/A | |
| Interest-only Period: | 60 months | 2013 NOI(1): | N/A | |
| Original Term: | 120 months | TTM NOI (as of 6/2014)(2): | $3,236,300 | |
| Original Amortization: | 360 months | UW Economic Occupancy: | 94.3% | |
| Amortization Type: | IO-Balloon | UW Revenues: | $5,877,258 | |
| Call Protection: | L(25),Grtr1%orYM(93),O(2) | UW Expenses: | $2,690,208 | |
| Lockbox: | Springing | UW NOI: | $3,187,050 | |
| Additional Debt: | N/A | UW NCF: | $3,092,250 | |
| Additional Debt Balance: | N/A | Appraised Value / Per Unit: | $54,000,000 / $113,924 | |
| Additional Debt Type: | N/A | Appraisal Date: | 8/20/2014 | |
Escrows and Reserves(3) | Financial Information | |||||||
| Initial | Monthly | Initial Cap | Cut-off Date Loan / Unit: | $88,608 | ||||
| Taxes: | $864,108 | $96,012 | N/A | Maturity Date Loan / Unit: | $80,911 | |||
| Insurance: | $71,868 | $8,984 | N/A | Cut-off Date LTV: | 77.8% | |||
| Replacement Reserves: | $7,900 | $7,900 | N/A | Maturity Date LTV: | 71.0% | |||
| TI/LC: | $0 | $0 | N/A | UW NCF DSCR: | 1.23x | |||
| Other: | $0 | $0 | N/A | UW NOI Debt Yield: | 7.6% | |||
| Sources and Uses | ||||||
| Sources | Proceeds | % of Total | Uses | Proceeds | % of Total | |
| Mortgage Loan | $42,000,000 | 75.9% | Purchase Price(4) | $54,159,804 | 97.8% | |
| Sponsor Equity | 13,355,817 | 24.1 | Upfront Reserves | 943,876 | 1.7 | |
| Closing Costs | 252,137 | 0.5 | ||||
| Total Sources | $55,355,817 | 100.0% | Total Uses | $55,355,817 | 100.0% | |
| (1) | Historical NOI is not available because the property was built in 2013. |
| (2) | TTM NOI is based on the trailing three-month period ending on June 30, 2014 annualized. |
| (3) | For a full description of Escrows and Reserves, please refer to “Escrows and Reserves” below. |
| (4) | Purchase Price is net of cash held at the property and prorated expenses. |
The Loan. The NoBu Station loan has an outstanding principal balance of $42.0 million and is secured by a first mortgage lien on the fee interest in a newly constructed, Class A multifamily property totaling 474 units located in San Antonio, Texas. The loan has a 10-year term and, subsequent to a five-year interest-only period, will amortize on a 30-year schedule.
The Borrower. The borrowing entity for the loan is Elysian at Nobu Station, LP, a Texas limited partnership and special purpose entity.
THE INFORMATION IN THIS STRUCTURAL AND COLLATERAL TERM SHEET IS NOT COMPLETE AND MAY BE AMENDED PRIOR TO THE TIME OF SALE. THIS TERM SHEET IS NOT AN OFFER TO SELL THESE SECURITIES AND IT IS NOT A SOLICITATION OF AN OFFER TO BUY THESE SECURITIES IN ANY JURISDICTION WHERE THE OFFER OR SALE IS NOT PERMITTED.
| 87 of 124 | |
| Structural and Collateral Term Sheet | JPMBB 2014-C24 | |
| NoBu Station | ||
The Sponsors. The loan sponsors and nonrecourse carve-out guarantors are Oren Blatt, Yacob Blatt and Yehonatan Sade, jointly and severally. Oren Blatt, Yacob Blatt and Yehonatan Sade are the principals of Sun Holdings Group (“Sun Holdings”), which is headquartered in Tel Aviv and also has offices in Montreal, Boston, Houston and Jacksonville. Sun Holdings is involved in the ownership and management of a commercial real estate portfolio consisting of over 2,000 apartments and nearly 250,000 square feet of office, industrial and retail space. Sun Holdings acquired the property in September 2014 from an affiliate of the developer of the property, Godfrey Residential Group, for approximately $53.85 million ($113,608 per unit). Sun Holdings is also the loan sponsor of Arden Park, another loan included in the trust.
The Property. NoBu Station is a 474 unit, newly constructed Class A multifamily complex that is situated on approximately 27.9 acres in San Antonio, Texas. The property was completed in February 2013 and, as of August 2014, was approximately 98.9% occupied. Amenities at the property include a club house, fitness center, business center, swimming pool and cabanas. The property consists of 25 two- and three-story buildings that have a unit-mix consisting of 314 one-bedroom units, 144 two-bedroom units and 16 three-bedroom units. The apartments feature washer/dryer combinations, and a private patio or balcony area with an exterior storage room. The property has 732 parking spaces, resulting in a parking ratio of 1.54 spaces per unit.
The property is located in the Far North Central submarket of San Antonio, Texas, approximately 18 miles north of the San Antonio central business district. Local access to the property is provided by Bulverde Road, which intersects with State Highway 1604, the outer-loop around San Antonio. State Highway 1604 intersects with State Highway 281 approximately five miles to the west, as well as Interstate 35 approximately eight miles to the southeast, both of which provide access to downtown San Antonio.
Major employers located near the property include Chase Bank and Clear Channel Radio, which have campuses located approximately seven miles northwest of the property along State Highway 281. The Methodist Stone Oak Hospital campus, which was built in 2009 and is subject to a planned property expansion scheduled to take place from 2014 to 2017, is also located less than five miles from the property. According to the appraisal, the property has a primary trade area consisting of a one-mile radius that contains 2,371 people with an average household income of $100,790 as of 2014. The property has a secondary trade area consisting of a three-mile radius that contains 73,113 people with an average household income of $75,919 as of 2014.
The submarket’s Class A occupancy rate was 93.0%, and competitive properties had an occupancy of 95.8% (excluding two properties still in lease-up). The average monthly market rent is $1.11 per square foot and the appraisal’s competitive set has an average monthly market rent of $1.20 per square foot ($1,089 per unit). All of the properties in the appraiser’s competitive set were built between 2010 and 2013. Within the San Antonio metropolitan statistical area there are almost 22 properties composed of 5,900 units currently under construction, and another 23 properties composed of 6,800 units are proposed. Four properties under construction, totaling 1,182 units, are located in the same submarket as our property.
Historical and Current Occupancy(1) | |||
2011(2) | 2012(2) | 2013(3) | Current(4) |
| N/A | N/A | 41.0% | 98.9% |
| (1) | Historical Occupancies are as of December 31 of each respective year. |
| (2) | 2011 and 2012 Historical Occupancy is not available because the property was built in 2013. |
| (3) | The property was completed in February 2013 and was leasing up throughout the remainder of the year. The property reached stabilized occupancy in 2014. |
| (4) | Current Occupancy is as of August 31, 2014. |
Multifamily Unit Mix(1) | ||||||||||||||||||
| Unit Type | # of Units | % of Total | Occupied Units | Occupancy | Average Unit Size (Square Feet) | Average Monthly Rental Rate | Average Monthly Rental Rate PSF | Monthly Market Rental Rate | Monthly Market Rental Rate PSF | |||||||||
| 1 Bedroom | 314 | 66.2 | % | 312 | 99.4 | % | 730 | $863 | $1.18 | $868 | $1.19 | |||||||
| 2 Bedroom | 144 | 30.4 | 141 | 97.9 | % | 1,123 | $1,157 | $1.03 | $1,199 | $1.07 | ||||||||
| 3 Bedroom | 16 | 3.4 | 16 | 100.0 | % | 1,621 | $1,781 | $1.10 | $1,769 | $1.09 | ||||||||
| Total/Wtd. Avg. | 474 | 100.0 | % | 469 | 98.9 | % | 880 | $983 | $1.12 | $998 | $1.13 | |||||||
| (1) | Based on the underwritten rent roll. |
THE INFORMATION IN THIS STRUCTURAL AND COLLATERAL TERM SHEET IS NOT COMPLETE AND MAY BE AMENDED PRIOR TO THE TIME OF SALE. THIS TERM SHEET IS NOT AN OFFER TO SELL THESE SECURITIES AND IT IS NOT A SOLICITATION OF AN OFFER TO BUY THESE SECURITIES IN ANY JURISDICTION WHERE THE OFFER OR SALE IS NOT PERMITTED.
| 88 of 124 | |
| Structural and Collateral Term Sheet | JPMBB 2014-C24 | |
| NoBu Station | ||
| Operating History and Underwritten Net Cash Flow | |||||
TTM(1) | Underwritten | Per Unit | %(2) | ||
Rents in Place(3) | $5,568,350 | $5,530,535 | $11,668 | 98.8 | % |
| Vacant Income | 0 | 64,800 | 137 | 1.2 | |
| Gross Potential Rent | $5,568,350 | $5,595,335 | $11,805 | 100.0 | % |
| Reimbursements | 0 | 0 | 0 | 0.0 | |
| Net Rental Income | $5,568,350 | $5,595,335 | $11,805 | 100.0 | % |
(Vacancy/Credit Loss/Concessions)(4) | (591,538) | (320,057) | (675) | (5.7) | |
| Other Income | 500,886 | 601,980 | 1,270 | 10.8 | |
| Effective Gross Income | $5,477,697 | $5,877,258 | $12,399 | 105.0 | % |
| Total Expenses | $2,241,397 | $2,690,208 | $5,676 | 45.8 | % |
| Net Operating Income | $3,236,300 | $3,187,050 | $6,724 | 54.2 | % |
| Replacement Reserves | 0 | 94,800 | 200 | 1.6 | |
| Net Cash Flow | $3,236,300 | $3,092,250 | $6,524 | 52.6 | % |
| (1) | The numbers provided are based on a trailing 3-month period ending on June 30, 2014 annualized. |
| (2) | Percentage column represents percent of Net Rental Income for all revenue lines and represents percent of Effective Gross Income for the remainder of fields. |
| (3) | Underwritten Rents in Place are based on the August 2014 rent roll annualized. |
| (4) | Vacancy/Credit Loss/Concessions in the TTM period represent concessions relating to leasing up the property. The property is no longer offering concessions. |
Property Management. The NoBu Station property is managed by GREP South, LP, an affiliate of Greystar. Greystar is a fully integrated real estate company focused on investment management, development and property management of residential properties. Headquartered in Charleston, South Carolina, Greystar is the largest operator of apartments in the United States, managing approximately 385,000 units in over 100 markets.
Escrows and Reserves. At origination, the borrower deposited into escrow approximately $864,108 for real estate taxes, $71,868 for insurance premiums and $7,900 for replacements.
Tax Escrows - On a monthly basis, the borrower is required to escrow 1/12 of the annual estimated tax payments, which currently equates to $96,012.
Insurance Escrows - On a monthly basis, the borrower is required to escrow 1/12 of the annual estimated insurance payments, which currently equates to $8,984.
Replacement Reserves - On a monthly basis, the borrower is required to escrow $7,900 (approximately $200 per unit annually) for replacement reserves.
Lockbox / Cash Management. The loan is structured with a springing lockbox and springing cash management. Upon the occurrence of a Cash Sweep Event, the borrower and property manager are required to have all collected rents deposited into a lockbox account. All funds in the lockbox account are swept daily to a cash management account under the control of the lender and disbursed during each interest period of the loan term in accordance with the loan documents. During a Cash Sweep Event, all excess cash flow after payment of debt service, required reserves and operating expenses are required to be deposited into the cash management account and will be held as additional collateral for the loan.
A “Cash Sweep Event” means: (i) the occurrence or continuance of an event of default under the loan documents, (ii) the debt service coverage ratio as calculated in the loan documents based on a trailing six-month period falls below 1.05x or (iii) the borrower or the property manager becomes the subject of a bankruptcy, insolvency or similar action or is substantially consolidated with another debtor.
THE INFORMATION IN THIS STRUCTURAL AND COLLATERAL TERM SHEET IS NOT COMPLETE AND MAY BE AMENDED PRIOR TO THE TIME OF SALE. THIS TERM SHEET IS NOT AN OFFER TO SELL THESE SECURITIES AND IT IS NOT A SOLICITATION OF AN OFFER TO BUY THESE SECURITIES IN ANY JURISDICTION WHERE THE OFFER OR SALE IS NOT PERMITTED.
| 89 of 124 | |
| Structural and Collateral Term Sheet | JPMBB 2014-C24 |
[THIS PAGE INTENTIONALLY LEFT BLANK]
THE INFORMATION IN THIS STRUCTURAL AND COLLATERAL TERM SHEET IS NOT COMPLETE AND MAY BE AMENDED PRIOR TO THE TIME OF SALE. THIS TERM SHEET IS NOT AN OFFER TO SELL THESE SECURITIES AND IT IS NOT A SOLICITATION OF AN OFFER TO BUY THESE SECURITIES IN ANY JURISDICTION WHERE THE OFFER OR SALE IS NOT PERMITTED.
| 90 of 124 | |
| Structural and Collateral Term Sheet | JPMBB 2014-C24 | |
| Meridian Corporate Center I | ||
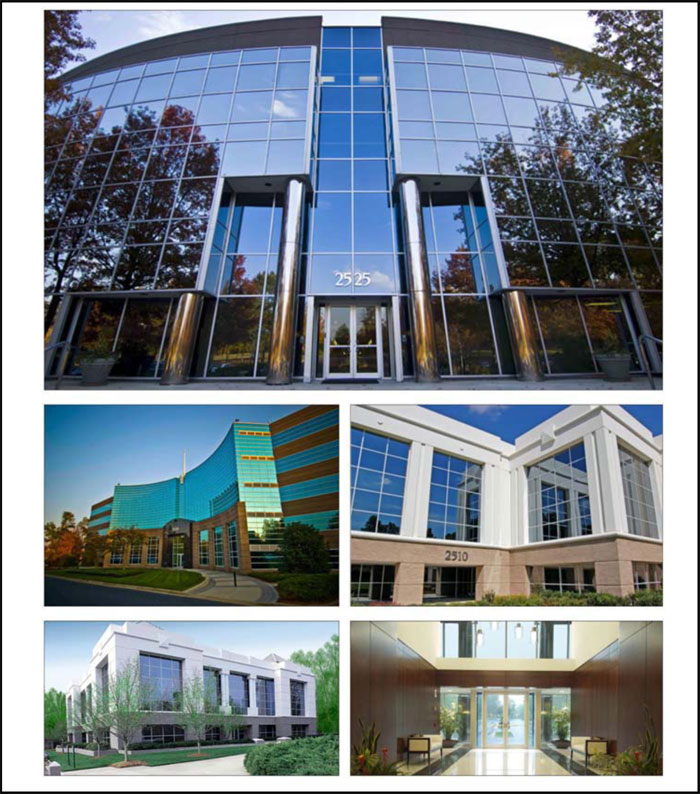
THE INFORMATION IN THIS STRUCTURAL AND COLLATERAL TERM SHEET IS NOT COMPLETE AND MAY BE AMENDED PRIOR TO THE TIME OF SALE. THIS TERM SHEET IS NOT AN OFFER TO SELL THESE SECURITIES AND IT IS NOT A SOLICITATION OF AN OFFER TO BUY THESE SECURITIES IN ANY JURISDICTION WHERE THE OFFER OR SALE IS NOT PERMITTED.
| 91 of 124 | |
| Structural and Collateral Term Sheet | JPMBB 2014-C24 | |
| Meridian Corporate Center I | ||
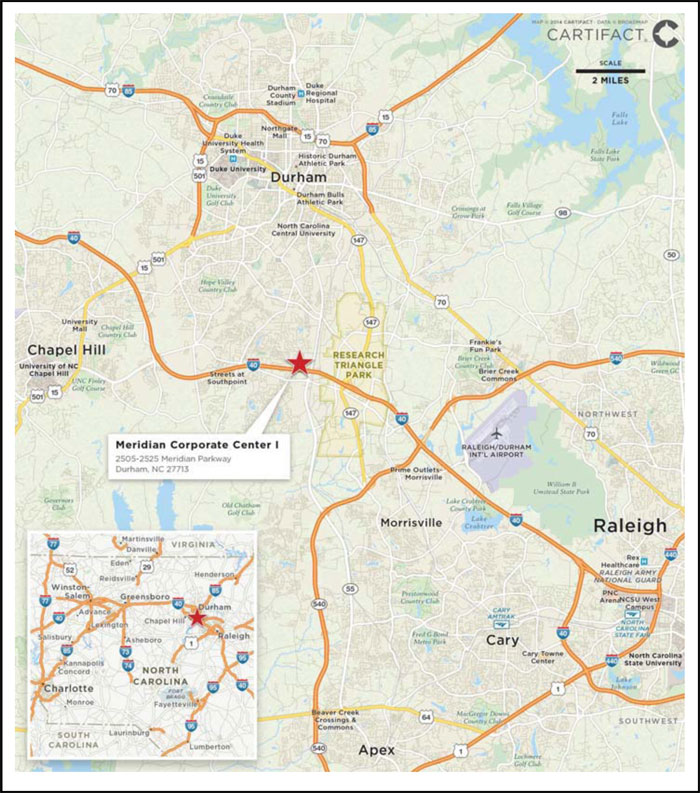
THE INFORMATION IN THIS STRUCTURAL AND COLLATERAL TERM SHEET IS NOT COMPLETE AND MAY BE AMENDED PRIOR TO THE TIME OF SALE. THIS TERM SHEET IS NOT AN OFFER TO SELL THESE SECURITIES AND IT IS NOT A SOLICITATION OF AN OFFER TO BUY THESE SECURITIES IN ANY JURISDICTION WHERE THE OFFER OR SALE IS NOT PERMITTED.
| 92 of 124 | |
| Structural and Collateral Term Sheet | JPMBB 2014-C24 | |
| Meridian Corporate Center I | ||
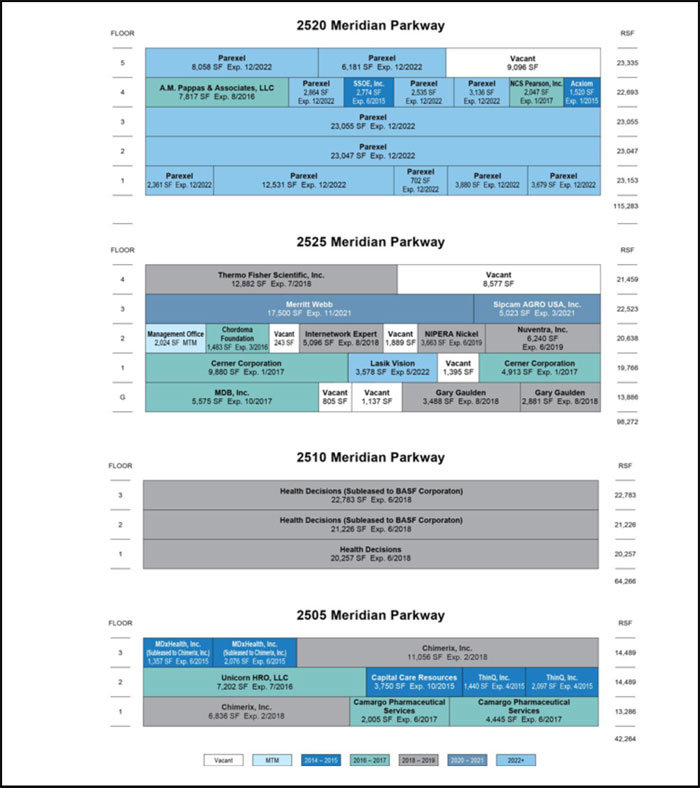
THE INFORMATION IN THIS STRUCTURAL AND COLLATERAL TERM SHEET IS NOT COMPLETE AND MAY BE AMENDED PRIOR TO THE TIME OF SALE. THIS TERM SHEET IS NOT AN OFFER TO SELL THESE SECURITIES AND IT IS NOT A SOLICITATION OF AN OFFER TO BUY THESE SECURITIES IN ANY JURISDICTION WHERE THE OFFER OR SALE IS NOT PERMITTED.
| 93 of 124 | |
| Structural and Collateral Term Sheet | JPMBB 2014-C24 | |
| Meridian Corporate Center I | ||
| Mortgage Loan Information | Property Information | |||
| Mortgage Loan Seller: | Barclays | Single Asset / Portfolio: | Single Asset | |
| Original Principal Balance: | $36,261,000 | Title: | Fee | |
| Cut-off Date Principal Balance: | $36,261,000 | Property Type - Subtype: | Office - Suburban | |
| % of Pool by IPB: | 2.9% | Net Rentable Area (SF): | 320,085 | |
| Loan Purpose: | Acquisition | Location: | Durham, NC | |
| Borrower: | IVC Meridian LL O, LLC | Year Built / Renovated(1): | 1989 - 1997 / 2009 - 2013 | |
| Sponsor: | Investcorp US Real Estate, LLC | Occupancy: | 92.8% | |
| Interest Rate: | 3.90600% | Occupancy Date: | 7/30/2014 | |
| Note Date: | 8/7/2014 | Number of Tenants: | 23 | |
| Maturity Date: | 9/6/2019 | 2011 NOI(2): | $1,962,922 | |
| Interest-only Period: | 60 months | 2012 NOI(2): | $2,407,622 | |
| Original Term: | 60 months | 2013 NOI(2): | $3,164,813 | |
| Original Amortization: | None | TTM NOI (as of 6/2014)(2): | $3,237,180 | |
| Amortization Type: | Interest Only | UW Economic Occupancy: | 93.3% | |
| Call Protection: | L(25),Def(31),O(4) | UW Revenues: | $6,960,429 | |
| Lockbox: | CMA | UW Expenses: | $2,763,015 | |
| Additional Debt: | N/A | UW NOI(2): | $4,197,414 | |
| Additional Debt Balance: | N/A | UW NCF: | $3,618,889 | |
| Additional Debt Type: | N/A | Appraised Value / Per SF: | $53,100,000 / $166 | |
| Appraisal Date: | 7/21/2014 | |||
Escrows and Reserves(3) | Financial Information | |||||||||
| Initial | Monthly | Initial Cap | Cut-off Date Loan / SF: | $113 | ||||||
| Taxes: | $477,671 | $54,817 | N/A | Maturity Date Loan / SF: | $113 | |||||
| Insurance: | $0 | Springing | N/A | Cut-off Date LTV: | 68.3% | |||||
| Replacement Reserves: | $325,000 | Springing | $325,000 | Maturity Date LTV: | 68.3% | |||||
| TI/LC: | $1,375,000 | Springing | $1,375,000 | UW NCF DSCR: | 2.52x | |||||
Other(4): | $754,662 | $0 | N/A | UW NOI Debt Yield: | 11.6% | |||||
| Sources and Uses | ||||||
| Sources | Proceeds | % of Total | Uses | Proceeds | % of Total | |
| Mortgage Loan | $36,261,000 | 65.1% | Purchase Price | $52,500,000 | 94.3% | |
| Sponsor Equity | 19,422,500 | 34.9 | Upfront Reserves(4) | 2,177,671 | 3.9 | |
| Closing Costs | 1,005,829 | 1.8 | ||||
| Total Sources | $55,683,500 | 100.0% | Total Uses | $55,683,500 | 100.0% | |
| (1) | For details of Year Built / Renovated for each building, please refer to “Property Summary” below. |
| (2) | UW NOI is greater than historical figures due to nine new leases signed or renewed in the past 18 months, contributing approximately $1.3 million of annual underwritten base rent. |
| (3) | For a full description of Escrows and Reserves, please refer to “Escrows and Reserves” below. |
| (4) | The Initial Other Escrows and Reserves are comprised of $490,230 for outstanding tenant improvements and $264,432 for outstanding free rent as of the origination date. These amounts were paid by the seller in conjunction with the acquisition and are not included in Upfront Reserves in Sources and Uses above. |
The Loan. The Meridian Corporate Center I loan has an outstanding balance of approximately $36.3 million and is secured by a first mortgage lien on a property comprised of four midrise Class A office towers totaling 320,085 square feet located in Durham, North Carolina. The loan has a five-year term and is interest-only for the term of the loan.
The Borrower. The borrowing entity for the Meridian Corporate Center I loan is IVC Meridian LL O, LLC, a Delaware limited liability company and special purpose entity. In order to comply with Islamic law (Shari’ah) the borrower master leases the property to IVC Meridian TT O, LLC, an entity owned by affiliates of the sponsor. See “Risk Factors—Shari’ah Compliant Loans” in the Free Writing Prospectus.
THE INFORMATION IN THIS STRUCTURAL AND COLLATERAL TERM SHEET IS NOT COMPLETE AND MAY BE AMENDED PRIOR TO THE TIME OF SALE. THIS TERM SHEET IS NOT AN OFFER TO SELL THESE SECURITIES AND IT IS NOT A SOLICITATION OF AN OFFER TO BUY THESE SECURITIES IN ANY JURISDICTION WHERE THE OFFER OR SALE IS NOT PERMITTED.
| 94 of 124 | |
| Structural and Collateral Term Sheet | JPMBB 2014-C24 | |
| Meridian Corporate Center I | ||
The Sponsor. The loan sponsor and non-recourse carve-out guarantor is Investcorp US Real Estate, LLC (“Investcorp”). Investcorp is an affiliate of Investcorp International, Inc., an investment group founded in 1982. Investcorp International, Inc. focuses on five lines of business including private equity, hedge funds, technology, Arabian Gulf growth capital and real estate investments. Since 1995, Investcorp has acquired over 200 properties totaling approximately $10 billion in capitalization and currently invests $600 to $800 million of total capital per year in United States real estate. Investcorp is also the loan sponsor of the Meridian Corporate Center II, another loan included in the trust.
The Property. Meridian Corporate Center I is a four-building 320,085 square foot Class A office property located in Durham, North Carolina, approximately four miles west of Research Triangle Park. The buildings were built in phases between 1989 and 1997. The property is part of the larger Meridian Corporate Center campus, which includes five additional single-story lab and research and development buildings (Meridian Corporate Center II) along with a full service 203-guestroom DoubleTree Suites by Hilton hotel renovated in March 2014. The campus is set among landscaping with walking trails and a lake. As of July 30, 2014, Meridian Corporate Center I was 92.8% occupied by 23 tenants.
2520 Meridian Parkway (40.5% of the allocated loan amount). 2520 Meridian Parkway is a five-story 115,283 square foot Class A office building built in 1997 and features a two-story atrium style lobby and floor-to-ceiling windows. The building is 92.1% occupied by five tenants at an average underwritten base rent of $22.88 per square foot. The largest tenant in the building, Parexel (NASDAQ: PRXL), leases 79.8% of the net rentable area in the building through December 2022 with one five-year extension option remaining. Parexel has been in occupancy since January 2003 and has expanded its space and/or renewed its lease seven times, most recently in January 2014. Parexel is a global biopharmaceutical services firm that provides a broad range of knowledge-based contract research, consulting, medical communications and technology solutions and services to the worldwide pharmaceutical, biotechnology and medical device industries. Parexel is headquartered near Boston and has 15,560 employees in 79 offices across 51 countries.
2525 Meridian Parkway (27.0% of the allocated loan amount). 2525 Meridian Parkway is a five-story 98,272 square foot Class A office building built in 1995. The building underwent approximately $1.1 million in capital improvements from 2009 to 2012, including HVAC and electrical panel replacements, new flooring, installation of LED lighting and the removal of several walls and ceiling barriers, creating an open two-story lobby and entry way. The building also features a rear two-story rotunda-style lobby that opens out to a lakeside outdoor plaza area. The building is 85.7% occupied by 11 tenants at an average underwritten base rent of $21.84 per square foot. The largest tenant at the building, Merritt Webb, leases 17.8% of the net rentable area in the building through November 2021 with two five-year renewal options remaining. Merritt Webb has been at the property since June 2003 and renewed its lease in February 2014. Merritt Webb is a full service law firm with over 40 attorneys handling cases that involve, among other things, bankruptcy, business and corporate law, employment law, car accidents, trucking accidents, medical malpractice, criminal law, workers’ compensation, traffic defense, elder law, and probate and estate planning. The building serves as the firm’s headquarters and the firm has five other offices located across North Carolina, South Carolina and Tennessee.
2510 Meridian Parkway (20.2% of the allocated loan amount). 2510 Meridian Parkway is a three-story 64,266 square foot Class A office building built in 1990 and features a two-story wood-paneled lobby with marble and granite flooring. The building is 100.0% leased to Health Decisions through June 2018 at the underwritten base rent of $26.90 per square foot with two five-year extension options remaining. Health Decisions provides contract research services to clinical-stage biopharmaceutical and medical device companies. Health Decisions subleases 68.5% of the net rentable area in the building to BASF Corporation through June 2018. BASF Corporation, headquartered in Ludwigshafen, Germany, is one of the largest chemical companies in the world with over 112,000 employees across 80 countries. BASF Corporation has been in the Research Triangle Park since 1986, headquartering its global Plant Science and Crop Protection divisions in the area with over 900 employees. Most of BASF Corporation’s Plant Science division employees are based in the building.
2505 Meridian Parkway (12.0% of the allocated loan amount). 2505 Meridian Parkway is a three-story 42,264 square foot Class A office building built in 1989. The building underwent $437,261 in capital improvements from 2009-2013 and features a rotunda-style lobby with a combination of marble and terrazzo flooring and a domed ceiling. The building is 100.0% occupied by 6 tenants at an average underwritten base rent of $20.73 per square foot. The largest tenant in the building, Chimerix, Inc. (NASDAQ: CMRX), leases 42.3% of the net rentable in the building through February 2018 with one three-year extension option remaining. Chimerix, Inc. is headquartered in the building and has been in occupancy since 2007, extending its lease in March 2013 and expanding its space in July 2014. Chimerix, Inc. also subleases an additional 3,433 square feet in the building through June 2015. Founded in 2000, Chimerix, Inc. is a biopharmaceutical company dedicated to discovering, developing and commercializing novel, oral antivirals in areas of high unmet medical need. Chimerix, Inc.’s lead antiviral compound is in late-stage phase 3 clinical trials. The company’s 2013 IPO and 2014 follow-on offering generated approximately $118 million and $119 million, respectively.
THE INFORMATION IN THIS STRUCTURAL AND COLLATERAL TERM SHEET IS NOT COMPLETE AND MAY BE AMENDED PRIOR TO THE TIME OF SALE. THIS TERM SHEET IS NOT AN OFFER TO SELL THESE SECURITIES AND IT IS NOT A SOLICITATION OF AN OFFER TO BUY THESE SECURITIES IN ANY JURISDICTION WHERE THE OFFER OR SALE IS NOT PERMITTED.
| 95 of 124 | |
| Structural and Collateral Term Sheet | JPMBB 2014-C24 | |
| Meridian Corporate Center I | ||
The Meridian Corporate Center I property is located along Interstate 40, proximate to Durham, Raleigh and Chapel Hill, North Carolina and approximately eight miles west of the Raleigh-Durham International Airport. Research Triangle Park, four miles east of the property, is the largest research park in the United States comprising approximately 190 domestic and international companies with over 50,000 employees in fields such as micro-electronics, telecommunications, biotechnology, pharmaceuticals and environmental sciences. In addition, Streets at Southpoint, a Nordstrom and Belk anchored General Growth Properties mall, is one exit west of the property on Interstate 40. Regional access to the property is provided by Interstate 85, Interstate 540, State Highway 147 and State Highway 55.
According to the appraisal, the property is located in the Raleigh/Durham office market which has become one of the top metropolitan areas in the United States for business relocations, medical research, and entrepreneurial activity. Citing CoStar, the appraisal concluded that net absorption in the Raleigh/Durham office market for the second quarter of 2014 was a positive 424,576 square feet, decreasing vacancy to 10.4% from 10.6% in the prior two quarters and from 12.3% in 2010. According to the appraisal, less than a third of the vacant space in the Raleigh/Durham office market is Class A space while slightly less than two thirds of the vacant space in the market is Class B space. More specifically, according to CoStar, the property is located in the South Durham submarket which, as of the second quarter of 2014, had a Class A vacancy rate of 10.4% and average rents of approximately $20.52 per square foot.
| Property Summary | ||||||||||||||
| Building | Year Built / Renovated | Number of Stories | Net Rentable Area (SF) | Allocated Loan Amount | % of Allocated Loan Amount | Appraised Value | Largest Tenant | |||||||
| 2520 Meridian Parkway | 1997 / N/A | 5 | 115,283 | $14,699,021 | 40.5% | $21,525,000 | Parexel | |||||||
| 2525 Meridian Parkway | 1995 / 2009-2012 | 5 | 98,272 | 9,782,275 | 27.0 | 14,325,000 | Merritt Webb | |||||||
| 2510 Meridian Parkway | 1990 / N/A | 3 | 64,266 | 7,340,975 | 20.2 | 10,750,000 | Health Decisions | |||||||
| 2505 Meridian Parkway | 1989 / 2009-2013 | 3 | 42,264 | 4,438,729 | 12.2 | 6,500,000 | Chimerix, Inc. | |||||||
| Total: | 320,085 | $36,261,000 | 100.0% | $53,100,000 | ||||||||||
Historical and Current Occupancy(1) | |||
| 2011 | 2012 | 2013 | Current(2) |
| 79.3% | 86.4% | 86.2% | 92.8% |
| (1) | Historical Occupancies are as of December 31 of each respective year. |
| (2) | Current Occupancy is as of July 30, 2014. |
Tenant Summary(1) | ||||||||||||
| Tenant | Building | Ratings(2) Moody’s/S&P/Fitch | Net Rentable Area (SF) | % of Total NRA | UW Base Rent PSF | Lease Expiration Date | ||||||
Parexel(3) | 2520 Meridian Parkway | NA / NA / NA | 92,029 | 28.8% | $22.92 | 12/31/2022 | ||||||
Health Decisions(4) | 2510 Meridian Parkway | NA / NA / NA | 64,266 | 20.1% | $26.90 | 6/30/2018 | ||||||
Chimerix, Inc.(5) | 2505 Meridian Parkway | NA / NA / NA | 17,892 | 5.6% | $20.82 | 2/28/2018 | ||||||
| Merritt Webb | 2525 Meridian Parkway | NA / NA / NA | 17,500 | 5.5% | $21.58 | 11/30/2021 | ||||||
| Cerner Corporation | 2525 Meridian Parkway | NA / NA / NA | 14,793 | 4.6% | $21.52 | 1/31/2017 | ||||||
| Thermo Fisher Scientific, Inc. | 2525 Meridian Parkway | Baa3 / BBB / BBB | 12,882 | 4.0% | $22.33 | 7/31/2018 | ||||||
| A.M. Pappas & Associates, LLC | 2520 Meridian Parkway | NA / NA / NA | 7,817 | 2.4% | $22.00 | 8/31/2016 | ||||||
| Unicorn HRO, LLC | 2505 Meridian Parkway | NA / NA / NA | 7,202 | 2.3% | $21.33 | 7/31/2016 | ||||||
| Camargo Pharmaceutical Services | 2505 Meridian Parkway | NA / NA / NA | 6,450 | 2.0% | $19.92 | 6/30/2017 | ||||||
| Gary Gaulden | 2525 Meridian Parkway | NA / NA / NA | 6,369 | 2.0% | $22.91 | 8/31/2018 | ||||||
| (1) | Based on the underwritten rent roll. |
| (2) | Ratings provided are for the parent company of the entity listed in the “Tenant” field whether or not the parent company guarantees the lease. |
| (3) | Parexel has a one-time right to terminate 24,636 square feet of space effective August 31, 2020 by delivering notice no later than March 1, 2020. |
| (4) | Health Decisions subleases 44,009 square feet to BASF Corporation. In addition, Health Decisions has a one-time right to terminate its lease effective June 30, 2016 by delivering notice no later than June 30, 2015. |
| (5) | Chimerix, Inc. expanded its space by 6,836 square feet in July 2014 and is expected to take occupancy of this space by December 2014. Chimerix, Inc. also subleases an additional 3,433 square feet of space in 2505 Meridian Parkway. |
THE INFORMATION IN THIS STRUCTURAL AND COLLATERAL TERM SHEET IS NOT COMPLETE AND MAY BE AMENDED PRIOR TO THE TIME OF SALE. THIS TERM SHEET IS NOT AN OFFER TO SELL THESE SECURITIES AND IT IS NOT A SOLICITATION OF AN OFFER TO BUY THESE SECURITIES IN ANY JURISDICTION WHERE THE OFFER OR SALE IS NOT PERMITTED.
| 96 of 124 | |
| Structural and Collateral Term Sheet | JPMBB 2014-C24 | |
| Meridian Corporate Center I | ||
Lease Rollover Schedule(1) | ||||||||||||||||||
| Year | Number of Leases Expiring | Net Rentable Area Expiring | % of NRA Expiring | Base Rent Expiring | % of Base Rent Expiring | Cumulative Net Rentable Area Expiring | Cumulative % of NRA Expiring | Cumulative Base Rent Expiring | Cumulative % of Base Rent Expiring | |||||||||
| Vacant | NAP | 23,142 | 7.2% | NAP | NAP | 23,142 | 7.2% | NAP | NAP | |||||||||
2014 & MTM(2) | 0 | 2,024 | 0.6 | $0 | 0.0% | 25,166 | 7.9% | $0 | 0.0% | |||||||||
| 2015 | 5 | 15,014 | 4.7 | 323,030 | 4.7 | 40,180 | 12.6% | $323,030 | 4.7% | |||||||||
| 2016 | 3 | 16,502 | 5.2 | 356,057 | 5.2 | 56,682 | 17.7% | $679,087 | 9.9% | |||||||||
| 2017 | 4 | 28,865 | 9.0 | 610,777 | 8.9 | 85,547 | 26.7% | $1,289,864 | 18.9% | |||||||||
| 2018 | 5 | 106,505 | 33.3 | 2,644,167 | 38.7 | 192,052 | 60.0% | $3,934,030 | 57.6% | |||||||||
| 2019 | 2 | 9,903 | 3.1 | 219,072 | 3.2 | 201,955 | 63.1% | $4,153,103 | 60.8% | |||||||||
| 2020 | 0 | 0 | 0.0 | 0 | 0.0 | 201,955 | 63.1% | $4,153,103 | 60.8% | |||||||||
| 2021 | 2 | 22,523 | 7.0 | 488,457 | 7.2 | 224,478 | 70.1% | $4,641,560 | 68.0% | |||||||||
| 2022 | 2 | 95,607 | 29.9 | 2,187,834 | 32.0 | 320,085 | 100.0% | $6,829,394 | 100.0% | |||||||||
| 2023 | 0 | 0 | 0.0 | 0 | 0.0 | 320,085 | 100.0% | $6,829,394 | 100.0% | |||||||||
| 2024 | 0 | 0 | 0.0 | 0 | 0.0 | 320,085 | 100.0% | $6,829,394 | 100.0% | |||||||||
| 2025 & Beyond | 0 | 0 | 0.0 | 0 | 0.0 | 320,085 | 100.0% | $6,829,394 | 100.0% | |||||||||
| Total | 23 | 320,085 | 100.0% | $6,829,394 | 100.0% | |||||||||||||
| (1) | Based on the underwritten rent roll. |
| (2) | 2014 & MTM includes 2,024 square feet for a management office. |
| Operating History and Underwritten Net Cash Flow | |||||||||||||||
| 2011 | 2012 | 2013 | TTM(1) | Underwritten | Per Square Foot | %(2) | |||||||||
Rents in Place(3) | $4,427,547 | $5,029,220 | $5,735,978 | $5,898,570 | $6,829,394 | $21.34 | 91.5% | ||||||||
| Vacant Income | 0 | 0 | 0 | 0 | 503,339 | 1.57 | 6.7 | ||||||||
| Gross Potential Rent | $4,427,547 | $5,029,220 | $5,735,978 | $5,898,570 | $7,332,732 | $22.91 | 98.2% | ||||||||
| Total Reimbursements | 21,225 | 45,679 | 73,173 | 85,394 | 131,036 | 0.41 | 1.8 | ||||||||
| Net Rental Income | $4,448,772 | $5,074,899 | $5,809,151 | $5,983,963 | $7,463,768 | $23.32 | 100.0% | ||||||||
| (Vacancy/Credit Loss) | 0 | 0 | 0 | 0 | (503,339) | (1.57) | (6.7) | ||||||||
| Effective Gross Income | $4,448,772 | $5,074,899 | $5,809,151 | $5,983,963 | $6,960,429 | $21.75 | 93.3% | ||||||||
| Total Expenses | $2,485,850 | $2,667,277 | $2,644,338 | $2,746,783 | $2,763,015 | $8.63 | 39.7% | ||||||||
| Net Operating Income | $1,962,922 | $2,407,622 | $3,164,813 | $3,237,180 | $4,197,414 | $13.11 | 60.3% | ||||||||
| Total TI/LC, Capex/RR | 0 | 0 | 0 | 0 | 578,525 | 1.81 | 8.3 | ||||||||
| Net Cash Flow | $1,962,922 | $2,407,622 | $3,164,813 | $3,237,180 | $3,618,889 | $11.31 | 52.0% | ||||||||
| (1) | TTM column represents the trailing twelve-month period ending in June 30, 2014. |
| (2) | Percentage column represents percent of Net Rental Income for all revenue lines and represents percent of Effective Gross Income for the remainder of fields. |
| (3) | Underwritten Rents in Place are greater than historical figures due to nine new leases signed or renewed in the past 18 months, contributing approximately $1.3 million of annual underwritten base rent. |
Property Management. The property is managed by American Real Estate Partners Management LLC, an affiliate of American Real Estate Partners, a privately held commercial real estate investment and development firm that owns and operates over 10.5 million square feet of office space in the eastern United States.
THE INFORMATION IN THIS STRUCTURAL AND COLLATERAL TERM SHEET IS NOT COMPLETE AND MAY BE AMENDED PRIOR TO THE TIME OF SALE. THIS TERM SHEET IS NOT AN OFFER TO SELL THESE SECURITIES AND IT IS NOT A SOLICITATION OF AN OFFER TO BUY THESE SECURITIES IN ANY JURISDICTION WHERE THE OFFER OR SALE IS NOT PERMITTED.
| 97 of 124 | |
| Structural and Collateral Term Sheet | JPMBB 2014-C24 | |
| Meridian Corporate Center I | ||
Escrows and Reserves. At origination, the borrower was required to deposit into escrow $1,375,000 for tenant improvements and leasing commissions, $477,671 for real estate taxes and $325,000 for replacement reserves. As part of the acquisition, the seller deposited $490,230 for outstanding tenant improvements and leasing commissions and $264,432 for outstanding free rent.
Tax Escrows - On a monthly basis, the borrower is required to escrow 1/12 of the annual estimated tax payments, which currently equates to $54,817.
Insurance Escrows - The requirement for the borrower to make monthly deposits into the insurance escrow is waived so long as no event of default exists and the borrower provides satisfactory evidence that the property is insured as part of a blanket policy in accordance with the loan documents.
Replacement Reserves - If the balance of the replacement reserve is less than $162,500 then, on a monthly basis, the borrower is required to escrow $4,001 (approximately $0.15 per square foot annually) for replacement reserves. The reserve is subject to a cap of $325,000 (approximately $1.02 per square foot).
TI/LC Reserves - If the balance of the TI/LC reserve is less than $500,000 then, on a monthly basis, the borrower is required to escrow $26,679 (approximately $1.00 per square foot annually) for TI/LC reserves. The reserve is subject to a cap of $1,375,000 (approximately $4.30 per square foot).
Lockbox / Cash Management. The loan is structured with a CMA lockbox. The borrower was required to send tenant direction letters to all tenants instructing them to deposit all rents and payments into the lockbox account controlled by the lender. The funds are then returned to an account controlled by the borrower until the occurrence of a Lockbox Event. During the continuance of a Lockbox Event, all rents will be swept daily to a segregated cash management account and held in trust and for the benefit of the lender. The lender will have a first priority security interest in the cash management account. Upon the occurrence and during the continuance of a Lockbox Event, all funds deposited into the cash management account after payment of debt service, required reserves and budgeted operating expenses will be held as additional security for the loan.
A “Lockbox Event” means: (i) the occurrence and continuance of an event of default or (ii) the debt service coverage ratio as calculated in the loan documents based on the trailing three months annualized falls below 1.15x.
Release of Buildings. After the expiration of the lockout period, the borrower may release one or more individual buildings from the lien of the mortgage, provided that, among other things; (i) no event of default exists; (ii) the borrower defeases the loan in an amount equal to the greater of (A) 115.0% of the allocated loan amount for the individual building, as calculated in the loan documents, and (B) 90.0% of the net sales proceeds from the sale of the individual building, provided that, if the outstanding principal balance of the loan following the release of the individual building is greater than $29,008,800 when using method (A) above, then the borrower will calculate the defeasance amount using method (A) above; (iii) the debt service coverage ratio, as calculated in the loan documents, for the portion of the property then remaining will be greater than or equal to the greater of (a) 2.52x and (b) the lesser of (x) 2.77x (which the borrower may satisfy by posting cash or a letter of credit that if applied to repay the loan would cause the debt service coverage ratio, as calculated in the loan documents, to satisfy 2.77x) and (y) the debt service coverage ratio, as calculated in the loan documents, immediately preceding the release, inclusive of the individual building requested to be released; (iv) after giving effect to the release for the applicable individual building, the debt yield, as calculated in the loan documents, for the portion of the property then remaining will be equal to or greater than the greater of (1) 11.19% and (2) the lesser of (aa) 12.31% (which the borrower may satisfy by posting cash or letter of credit that if applied to repay the loan would cause the debt yield, as calculated in the loan documents, to satisfy 12.31%) and (bb) the debt yield, as calculated in the loan documents, immediately preceding the release, inclusive of the individual building requested to be released and (v) after giving effect to the release for the applicable individual building, the loan to value ratio, as calculated in the loan documents, will not be greater than the lesser of (I) 68.29% and (II) the greater of (xx) 65.0% (which the borrower may satisfy by posting cash or a letter of credit that if applied to repay the loan would cause the loan to value ratio, as calculated in the loan documents, to satisfy 65.0%) and (yy) the loan to value ratio, as calculated in the loan documents, immediately preceding the release, inclusive of the individual building requested to be released.
THE INFORMATION IN THIS STRUCTURAL AND COLLATERAL TERM SHEET IS NOT COMPLETE AND MAY BE AMENDED PRIOR TO THE TIME OF SALE. THIS TERM SHEET IS NOT AN OFFER TO SELL THESE SECURITIES AND IT IS NOT A SOLICITATION OF AN OFFER TO BUY THESE SECURITIES IN ANY JURISDICTION WHERE THE OFFER OR SALE IS NOT PERMITTED.
| 98 of 124 | |
| Structural and Collateral Term Sheet | JPMBB 2014-C24 | |
| Hilton Houston Post Oak | ||
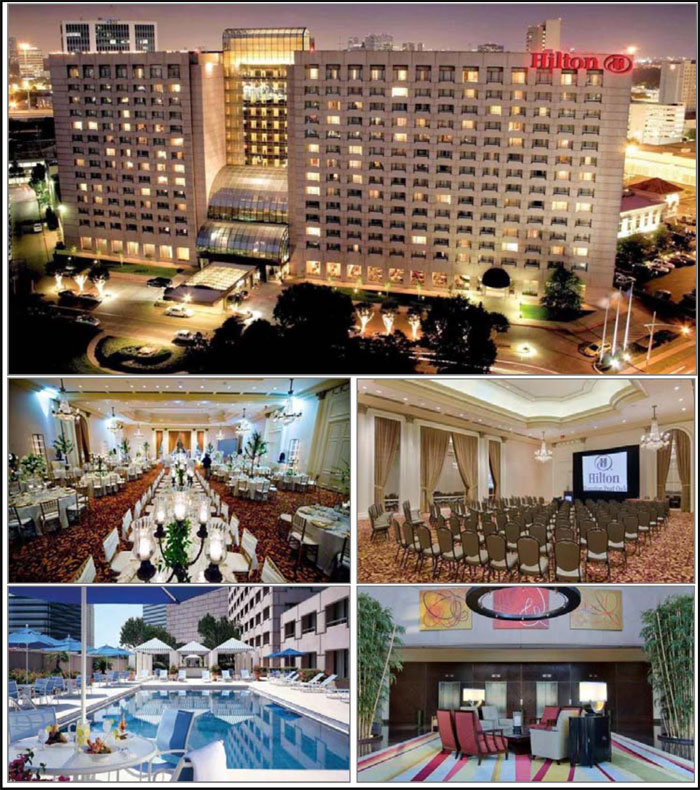
THE INFORMATION IN THIS STRUCTURAL AND COLLATERAL TERM SHEET IS NOT COMPLETE AND MAY BE AMENDED PRIOR TO THE TIME OF SALE. THIS TERM SHEET IS NOT AN OFFER TO SELL THESE SECURITIES AND IT IS NOT A SOLICITATION OF AN OFFER TO BUY THESE SECURITIES IN ANY JURISDICTION WHERE THE OFFER OR SALE IS NOT PERMITTED.
| 99 of 124 | |
| Structural and Collateral Term Sheet | JPMBB 2014-C24 | |
| Hilton Houston Post Oak | ||
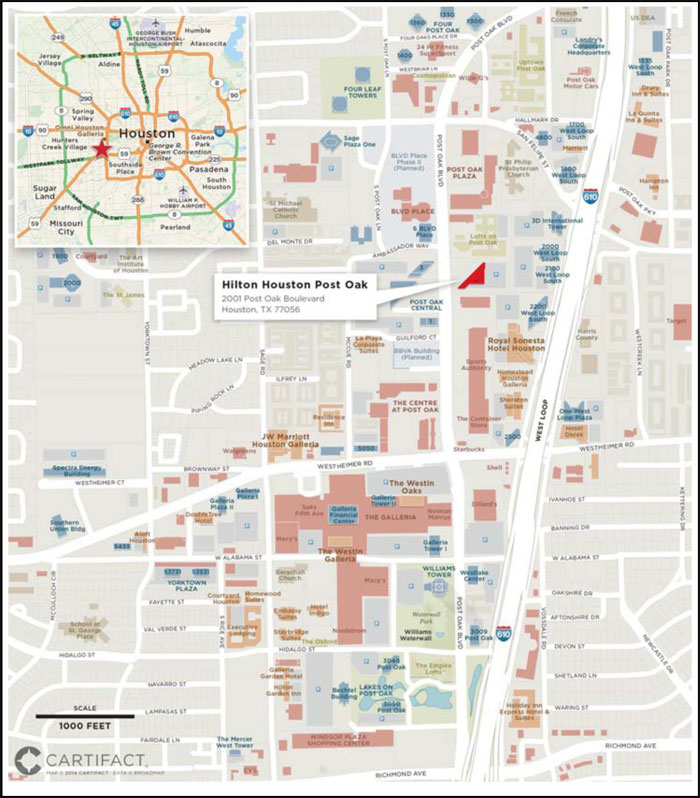
THE INFORMATION IN THIS STRUCTURAL AND COLLATERAL TERM SHEET IS NOT COMPLETE AND MAY BE AMENDED PRIOR TO THE TIME OF SALE. THIS TERM SHEET IS NOT AN OFFER TO SELL THESE SECURITIES AND IT IS NOT A SOLICITATION OF AN OFFER TO BUY THESE SECURITIES IN ANY JURISDICTION WHERE THE OFFER OR SALE IS NOT PERMITTED.
| 100 of 124 | |
| Structural and Collateral Term Sheet | JPMBB 2014-C24 | |
| Hilton Houston Post Oak | ||
| Mortgage Loan Information | Property Information | |||
| Mortgage Loan Seller: | JPMCB | Single Asset / Portfolio: | Single Asset | |
Original Principal Balance(1): | $35,000,000 | Title: | Leasehold | |
Cut-off Date Principal Balance(1): | $35,000,000 | Property Type - Subtype: | Hotel - Full Service | |
| % of Pool by IPB: | 2.8% | Net Rentable Area (Rooms): | 448 | |
| Loan Purpose: | Refinance | Location: | Houston, TX | |
| Borrower: | Post Oak TX, LLC | Year Built / Renovated: | 1982 / 2014 | |
| Sponsor: | Hotel Resort Properties, LLLP | Occupancy / ADR / RevPAR: | 83.5% / $156.87 / $130.93 | |
| Interest Rate: | 4.48600% | Occupancy / ADR / RevPAR Date: | 8/31/2014 | |
| Note Date: | 9/15/2014 | Number of Tenants: | N/A | |
| Maturity Date: | 10/1/2024 | 2011 NOI: | $7,151,749 | |
| Interest-only Period: | 36 months | 2012 NOI: | $8,056,656 | |
| Original Term: | 120 months | 2013 NOI: | $9,472,969 | |
| Original Amortization: | 360 months | TTM NOI (as of 8/2014): | $9,697,603 | |
| Amortization Type: | IO-Balloon | UW Occupancy / ADR / RevPAR: | 80.0% / $163.66 / $130.93 | |
| Call Protection: | L(25),Grtr1%orYM(92),O(3) | UW Revenues: | $31,384,479 | |
| Lockbox: | CMA | UW Expenses: | $21,824,811 | |
| Additional Debt: | Yes | UW NOI: | $9,559,668 | |
| Additional Debt Balance: | $45,000,000 | UW NCF: | $9,559,668 | |
| Additional Debt Type: | Pari Passu | Appraised Value / Per Room: | $126,200,000 / $281,696 | |
| Appraisal Date: | 6/27/2014 | |||
Escrows and Reserves(2) | Financial Information(1) | ||||||
| Initial | Monthly | Initial Cap | Cut-off Date Loan / Room: | $178,571 | |||
| Taxes: | $0 | Springing | N/A | Maturity Date Loan / Room: | $156,266 | ||
| Insurance: | $0 | Springing | N/A | Cut-off Date LTV: | 63.4% | ||
| FF&E Reserves: | $97,236 | 4% of Gross Revenues | N/A | Maturity Date LTV: | 55.5% | ||
| TI/LC: | $0 | $0 | N/A | UW NCF DSCR: | 1.97x | ||
| Other: | $0 | Springing | N/A | UW NOI Debt Yield: | 11.9% | ||
| Sources and Uses | ||||||
| Sources | Proceeds | % of Total | Uses | Proceeds | % of Total | |
Mortgage Loan(1) | $80,000,000 | 100.0% | Payoff Existing Debt | $52,983,883 | 66.2% | |
| Return of Equity | 25,718,448 | 32.1 | ||||
| Closing Costs | 1,200,433 | 1.5 | ||||
| Upfront Reserves | 97,236 | 0.1 | ||||
| Total Sources | $80,000,000 | 100.0% | Total Uses | $80,000,000 | 100.0% | |
| (1) | Hilton Houston Post Oak is part of a loan evidenced by two pari passu notes with an aggregate original balance of $80.0 million. The Financial Information presented in the chart above reflects the Cut-off Date balance of the $80.0 million Hilton Houston Post Oak Whole Loan. |
| (2) | For a full description of Escrows and Reserves, please refer to “Escrows and Reserves” below. |
THE INFORMATION IN THIS STRUCTURAL AND COLLATERAL TERM SHEET IS NOT COMPLETE AND MAY BE AMENDED PRIOR TO THE TIME OF SALE. THIS TERM SHEET IS NOT AN OFFER TO SELL THESE SECURITIES AND IT IS NOT A SOLICITATION OF AN OFFER TO BUY THESE SECURITIES IN ANY JURISDICTION WHERE THE OFFER OR SALE IS NOT PERMITTED.
| 101 of 124 | |
| Structural and Collateral Term Sheet | JPMBB 2014-C24 | |
| Hilton Houston Post Oak | ||
The Loan. The Hilton Houston Post Oak loan is secured by a first mortgage loan on the leasehold interest in a 448-room full service Hilton brand hotel located in Houston, Texas. The whole loan has an outstanding principal balance as of the Cut-off Date of $80.0 million (the “Hilton Houston Post Oak Whole Loan”) and is comprised of two pari passu notes, Note A-1 and Note A-2. Note A-2, with an outstanding principal balance as of the Cut-off Date of $35.0 million, is being contributed to the JPMBB 2014-C24 trust. Note A-1, with an outstanding principal balance as of the Cut-off Date of $45.0 million, is expected to be contributed to a future securitization trust. Prior to securitization of Note A-1, the trustee of the JPMBB 2014-C24 trust, as the holder of Note A-2, will be the controlling noteholder of the Hilton Houston Post Oak Whole Loan and the trustee of the JPMBB 2014-C24 trust (or, prior to the occurrence and continuance of a control event, the directing certificateholder) will be entitled to exercise all of the rights of the controlling noteholder with respect to the Hilton Houston Post Oak Whole Loan. Following the securitization of Note A-1, the trustee with respect to such other securitization, as the holder of Note A-1, will be the controlling noteholder of the Hilton Houston Post Oak Whole Loan and the trustee for that securitization (or, prior to the occurrence and continuance of a control event under the related pooling and servicing agreement, the directing certificateholder with respect to such other securitization) will be entitled to exercise all of the rights of the controlling noteholder with respect to the related Hilton Houston Post Oak Whole Loan; however, the holder of Note A-2 will be entitled, under certain circumstances, to consult with respect to certain major decisions. The Hilton Houston Post Oak Whole Loan has a 10-year term and, subsequent to a three-year interest-only period, will amortize on a 30-year schedule.
The Borrower. The borrowing entity for the Hilton Houston Post Oak Whole Loan is Post Oak TX, LLC, a Delaware limited liability company and special purpose entity.
The Sponsor. The loan sponsor and nonrecourse carve-out guarantor is Hotel Resort Properties, LLLP, a Florida limited liability limited partnership, whose general partner is an entity controlled by E. Llywd Ecclestone. Mr. Ecclestone is best known for his development of the PGA National golf community in Palm Beach Gardens in 1976. Anchored by the headquarters of the PGA of America, PGA National features five championship golf courses, the 339-room PGA National Resort & Spa and a 140,000 square foot retail village on PGA Boulevard. In 2007, Mr. Ecclestone sold the PGA National Resort and Spa and commercial properties associated with the development. Since 2003, Mr. Eccelstone’s companies have built over 3,500 units on campuses across the United States. In addition, Mr. Ecclestone’s companies have developed and continue to own Tower 1555, a 15-story office tower in West Palm Beach and the PGA National Office Center at PGA National. Furthermore, Hotel Resort Properties, LLLP owns two additional hotel assets, the 461-room DoubleTree Anaheim in Orange, California and the 356-room DoubleTree Overland Park located in Overland Park, Kansas.
The loan sponsor acquired 70.0% of the property in 2007 and the remaining 30.0% in 2010 from USAA Real Estate for a total acquisition basis of approximately $77.5 million. Since 2007, the loan sponsor has invested an additional $4.0 million in capital expenditures for a total cost basis of approximately $81.5 million.
The Property. The Hilton Houston Post Oak property is a 448-room, full service hotel situated on approximately 5.0 acres located one block north of the Houston Galleria – the fourth largest shopping mall in the nation with over 375 retail stores. The 15-story hotel was originally designed by I.M. Pei as a luxury Warwick Hotel in 1982, and was converted to a Hilton in 2005 following Hilton’s acquisition of the DoubleTree brand. The rooms are situated around a central atrium rising several floors above the entrance. A two-story portion on the east end of the building contains 29,548 square feet of meeting space, a business center, a fitness center, an outdoor pool, a spa and salon, a gift shop, a car rental store and a 345-space parking deck. The hotel’s guestrooms feature pillow-top mattresses, luxury bedding, private balconies, executive work area, high-speed wireless internet access, coffee makers, flat-screen TVs and in-room safes.
The loan sponsor recently revised and extended the long term management agreement with Hilton Worldwide, Inc. to September 4, 2035. As part of the revised management agreement, the property is required to complete a four-year, approximately $8.4 million Property Improvement Plan (“PIP”). As of origination of the loan, approximately $2.3 million of public space and restaurant refurbishments have been completed. The remaining PIP work, which is anticipated to cost approximately $6.1 million, is for improvements to guestrooms, guest bathrooms, lobby, corridors, technology and building signage among several other things, and will be funded by the borrower and, to the extent not waived, monthly deposits into the FF&E reserve. See “Escrows and Reserves” below for additional information.
The property is situated on Post Oak Boulevard, a six-lane thoroughfare, in Houston’s Galleria/West Loop submarket. The property is approximately six miles west of the Houston central business district and is anchored by the 2.4 million square foot Houston Galleria, which attracts over 24 million visitors a year. The property is adjacent to the 1.8 million square foot mixed-use BLVD Place, which is expected to be the site of a Whole Foods Market and home to numerous upscale shops, boutiques and restaurants and the George R. Brown Convention Center. The property is also located near the headquarters BBVA Compass Bancshares, a United States financial holding company with over $75.0 billion in assets, and Marathon Oil Corporation, a United States-based oil and natural gas exploration and production company. The appraisal identified three full service hotels as the expected new supply: the 325-room Hyatt Regency Houston Galleria is currently under construction and expected to open in September 2015, while the 275-room BLVD Place Hotel and
THE INFORMATION IN THIS STRUCTURAL AND COLLATERAL TERM SHEET IS NOT COMPLETE AND MAY BE AMENDED PRIOR TO THE TIME OF SALE. THIS TERM SHEET IS NOT AN OFFER TO SELL THESE SECURITIES AND IT IS NOT A SOLICITATION OF AN OFFER TO BUY THESE SECURITIES IN ANY JURISDICTION WHERE THE OFFER OR SALE IS NOT PERMITTED.
| 102 of 124 | |
| Structural and Collateral Term Sheet | JPMBB 2014-C24 | |
| Hilton Houston Post Oak | ||
the 250-room Lifestyle Hotel & Spa are still in the early development phase and expected to open in July 2016 and January 2017, respectively.
Historical Occupancy, ADR, RevPAR | |||||||||
Competitive Set(1) | Hilton Houston Post Oak(2) | Penetration Factor(3) | |||||||
Year | Occupancy | ADR | RevPAR | Occupancy | ADR | RevPAR | Occupancy | ADR | RevPAR |
| 2011 | 75.1% | $135.93 | $102.15 | 83.7% | $129.93 | $108.79 | 111.5% | 95.6% | 106.5% |
| 2012 | 77.9% | $143.94 | $112.07 | 84.4% | $138.54 | $116.89 | 108.3% | 96.2% | 104.3% |
| 2013 | 76.2% | $159.86 | $121.89 | 86.1% | $149.73 | $128.94 | 113.0% | 93.7% | 105.8% |
TTM(4) | 75.1% | $168.51 | $126.50 | 83.5% | $156.87 | $130.93 | 111.2% | 93.1% | 103.5% |
(1) | Data provided by Smith Travel Research. The competitive set contains the following properties: Royal Sonesta Houston, JW Marriott Houston, Doubletree Guest Suites Houston by the Galleria, Westin Oaks Houston @ the Galleria and Sheraton Hotel Suites Galleria. |
(2) | Based on operating statements provided by the borrower. |
| (3) | Penetration Factor is calculated based on data provided by Smith Travel Research for the competitive set and operating statements for the property provided by the borrower. |
| (4) | TTM row represents the trailing twelve-month period ending on August 31, 2014. |
Competitive Hotels Profile(1) | |||||||||||
| 2014 Estimated Market Mix | 2013 Estimated Operating Statistics | ||||||||||
| Property | Rooms | Year Built | Meeting Space (SF) | Commercial | Meeting & Group | Leisure | Contract | Occupancy | ADR | RevPAR | |
| Hilton Houston Post Oak | 448 | 1982 | 29,548 | 45% | 20% | 26% | 9% | 85.4% | $150.95 | $128.94 | |
| Royal Sonesta Hotel Houston | 485 | 1984 | 50,000 | 35% | 35% | 20% | 10% | 77% | $135.00 | $103.95 | |
| JW Marriott Houston Galleria | 515 | 1988 | 41,000 | 48% | 40% | 10% | 2% | 75% | $184.00 | $138.00 | |
| Omni Houston Galleria | 378 | 1981 | 32,000 | 35% | 40% | 15% | 10% | 77% | $129.00 | $99.33 | |
| Westin Galleria & Oaks | 893 | 1976 | 78,000 | 51% | 24% | 20% | 5% | 86% | $161.00 | $138.46 | |
Total(2) | 2,271 | ||||||||||
| (1) | Based on the appraisal. |
| (2) | Excludes the mortgaged property. |
THE INFORMATION IN THIS STRUCTURAL AND COLLATERAL TERM SHEET IS NOT COMPLETE AND MAY BE AMENDED PRIOR TO THE TIME OF SALE. THIS TERM SHEET IS NOT AN OFFER TO SELL THESE SECURITIES AND IT IS NOT A SOLICITATION OF AN OFFER TO BUY THESE SECURITIES IN ANY JURISDICTION WHERE THE OFFER OR SALE IS NOT PERMITTED.
| 103 of 124 | |
| Structural and Collateral Term Sheet | JPMBB 2014-C24 | |
| Hilton Houston Post Oak | ||
| Operating History and Underwritten Net Cash Flow | |||||||
| 2011 | 2012 | 2013 | TTM(1) | Underwritten | Per Room(2) | % of Total Revenue(3) | |
| Occupancy | 83.7% | 84.4% | 86.1% | 83.5% | 80.0% | ||
| ADR | $129.93 | $138.54 | $149.73 | $156.87 | $163.66 | ||
RevPAR(4) | $108.79 | $116.89 | $128.94 | $130.93 | $130.93 | ||
| Room Revenue | $17,789,245 | $19,166,905 | $21,084,323 | $21,409,650 | $21,409,647 | $47,789 | 68.2% |
| Food and Beverage | 7,306,393 | 7,797,568 | 8,021,655 | 8,191,964 | 8,191,964 | 18,286 | 26.1 |
| Other Department Revenues | 1,734,893 | 1,713,491 | 1,718,550 | 1,782,868 | 1,782,868 | 3,980 | 5.7 |
| Total Revenue | $26,830,531 | $28,677,964 | $30,824,528 | $31,384,482 | $31,384,479 | $70,055 | 100.0% |
| Room Expense | $4,225,796 | $4,338,751 | $4,430,991 | $4,226,450 | $4,226,449 | $9,434 | 19.7% |
| Food and Beverage Expense | 4,396,810 | 4,573,077 | 4,720,041 | 4,789,383 | 4,789,383 | 10,691 | 58.5 |
| Other Departmental Expenses | 805,237 | 785,436 | 777,203 | 787,610 | 787,610 | 1,758 | 44.2 |
| Departmental Expenses | $9,427,843 | $9,697,264 | $9,928,235 | $9,803,443 | $9,803,442 | $21,883 | 31.2% |
| Departmental Profit | $17,402,688 | $18,980,700 | $20,896,293 | $21,581,039 | $21,581,037 | $48,172 | 68.8% |
| Operating Expenses | $6,870,601 | $6,996,135 | $7,224,639 | $7,241,429 | $7,241,429 | $16,164 | 23.1% |
| Gross Operating Profit | $10,532,087 | $11,984,565 | $13,671,654 | $14,339,610 | $14,339,608 | $32,008 | 45.7% |
Management Fee(5) | $838,975 | $1,120,631 | $1,539,080 | $1,611,897 | $1,145,202 | $2,556 | 3.6% |
Fixed Expenses(6) | 1,468,142 | 1,660,159 | 1,426,624 | 1,774,732 | 2,379,359 | 5,311 | 7.6 |
| FF&E | 1,073,221 | 1,147,119 | 1,232,981 | 1,255,379 | 1,255,379 | 2,802 | 4.0 |
| Total Other Expenses | $3,380,338 | $3,927,909 | $4,198,685 | $4,642,007 | $4,779,940 | $10,670 | 15.2% |
| Net Operating Income | $7,151,749 | $8,056,656 | $9,472,969 | $9,697,603 | $9,559,668 | $21,339 | 30.5% |
Net Cash Flow(4) | $7,151,749 | $8,056,656 | $9,472,969 | $9,697,603 | $9,559,668 | $21,339 | 30.5% |
| (1) | The TTM column represents the trailing twelve-month period ending on August 31, 2014. |
| (2) | Per Room values are based on 448 rooms. |
| (3) | % of Total Revenue column for Room Expense, Food and Beverage Expense and Other Departmental Expenses is based on their corresponding revenue line item. |
| (4) | Historical RevPAR for 2007, 2008, 2009 and 2010 was $172.77, $184.48, $146.66 and $152.54, respectively, and Net Cash Flow was approximately $7.0 million, $8.3 million, $5.6 million and $6.4 million, respectively. |
| (5) | The decrease from the TTM Management Fee to the Underwritten Management Fee is primarily due to underwriting the revised management agreement as of April 2014. |
| (6) | The increase from the TTM Fixed Expenses to the Underwritten Fixed Expenses is primarily due to underwriting the 2019 rent adjustment per the ground leases. |
Property Management. The Hilton Houston Post Oak property management agreement with Hilton Worldwide, Inc., commenced on March 1, 2005 and expires on September 4, 2035. The agreement provides for a contractual franchise fee equal to 3.0% of adjusted gross revenues as well as an incentive management fee. The management agreement was revised in September 2014 and includes a revision to the incentive management fee calculation, which provides for an incentive management fee equal to 20.0% of the amount by which the net operating income for each year exceeds $79.5 million. This change in the incentive management fee will result in an estimated savings of $459,504 in year one compared to the trailing twelve months ended in August 2014.
Ground Leases. The hotel and plaza are subject to two unsubordinated ground leases, both of which commenced on June 1, 1969 and expire on May 31, 2068. The current total ground rent payments for the two ground leases equals $76,849 per year, with rent escalations in June 2019 and June 2044 based on the Consumer Price Index.
Escrows and Reserves. At origination, the borrower deposited into escrow $97,236 for FF&E reserves.
Tax Escrows - The requirement for the borrower to make monthly deposits into the tax escrow is waived so long as (i) the borrower provides satisfactory evidence that the manager has paid taxes prior to the due date or (ii) no event of default exists, the debt service coverage ratio (as calculated in the loan documents) based on the trailing six months is at least 1.35x.
Insurance Escrows - The requirement for the borrower to make monthly deposits into the insurance escrow is waived so long as (i) the borrower provides satisfactory evidence that the manager has paid insurance premiums on or prior to the due date or (ii) no event of default exists and the borrower provides satisfactory evidence that the property is insured under an approved blanket policy in accordance with the loan documents.
THE INFORMATION IN THIS STRUCTURAL AND COLLATERAL TERM SHEET IS NOT COMPLETE AND MAY BE AMENDED PRIOR TO THE TIME OF SALE. THIS TERM SHEET IS NOT AN OFFER TO SELL THESE SECURITIES AND IT IS NOT A SOLICITATION OF AN OFFER TO BUY THESE SECURITIES IN ANY JURISDICTION WHERE THE OFFER OR SALE IS NOT PERMITTED.
| 104 of 124 | |
| Structural and Collateral Term Sheet | JPMBB 2014-C24 | |
| Hilton Houston Post Oak | ||
FF&E Reserves - On a monthly basis, the borrower is required to deposit 4.0% of gross revenues into an escrow for FF&E. The requirement for the borrower to make monthly deposits into the FF&E reserve fund will be waived to the extent that the borrower delivers a letter of credit in the following amount: (i) prior to the end of the 2015 fiscal year, $3.75 million and (ii) at any time after the end of the 2015 fiscal year, 12.0% of gross income from operations for the immediately preceding fiscal year. In addition, on a monthly basis, the borrower is required to deposit an amount reasonably estimated by the lender as required to complete the PIP, but the requirement for the borrower to make the monthly PIP deposits is waived so long as the borrower provides satisfactory evidence that it has complied with its obligations under the PIP.
Ground Rent Reserve - The requirement for the borrower to make monthly deposits into the ground rent reserve fund is waived so long as the lender receives satisfactory evidence that the manager has paid, when due, all ground rent.
Lockbox / Cash Management. The loan is structured with a CMA lockbox. The borrower and property manager are required to deposit all revenues into the lockbox account controlled by the lender. All funds in the lockbox account are returned to an account controlled by the borrower until the occurrence of a Cash Sweep Event. During a Cash Sweep Event, all funds on deposit in the lockbox account will be swept on a daily basis to a cash management account established upon the occurrence of a Cash Sweep Event, and all excess cash flows after payment of debt service, required reserves and operating expenses is required to be held as additional collateral for the loan.
A “Cash Sweep Event” means: (i) the debt service coverage ratio as calculated in the loan documents based on the trailing six-month period falls below 1.20x, (ii) there is an event of default under the loan documents or (iii) the borrower or the property manager becomes the subject of a bankruptcy, insolvency or similar action.
THE INFORMATION IN THIS STRUCTURAL AND COLLATERAL TERM SHEET IS NOT COMPLETE AND MAY BE AMENDED PRIOR TO THE TIME OF SALE. THIS TERM SHEET IS NOT AN OFFER TO SELL THESE SECURITIES AND IT IS NOT A SOLICITATION OF AN OFFER TO BUY THESE SECURITIES IN ANY JURISDICTION WHERE THE OFFER OR SALE IS NOT PERMITTED.
| 105 of 124 | |
| Structural and Collateral Term Sheet | JPMBB 2014-C24 |
[THIS PAGE INTENTIONALLY LEFT BLANK]
THE INFORMATION IN THIS STRUCTURAL AND COLLATERAL TERM SHEET IS NOT COMPLETE AND MAY BE AMENDED PRIOR TO THE TIME OF SALE. THIS TERM SHEET IS NOT AN OFFER TO SELL THESE SECURITIES AND IT IS NOT A SOLICITATION OF AN OFFER TO BUY THESE SECURITIES IN ANY JURISDICTION WHERE THE OFFER OR SALE IS NOT PERMITTED.
| 106 of 124 | |
| Structural and Collateral Term Sheet | JPMBB 2014-C24 | |
Oakland Square and Oakland Plaza | ||
| Mortgage Loan Information | Property Information | |||
| Mortgage Loan Seller: | Barclays / RAIT Funding, LLC | Single Asset / Portfolio: | Portfolio | |
| Original Principal Balance: | $35,000,000 | Title: | Fee | |
| Cut-off Date Principal Balance: | $35,000,000 | Property Type - Subtype: | Retail - Anchored | |
| % of Pool by IPB: | 2.8% | Net Rentable Area (SF): | 392,237 | |
| Loan Purpose: | Acquisition | Location: | Troy, MI | |
| Borrowers: | Oakland Plaza Owner, LLC | Year Built / Renovated(1): | Various / Various | |
| and Oakland Square Owner, LLC | Occupancy(2): | 96.3% | ||
| Sponsor: | RAIT Partnership, L.P. | Occupancy Date: | 8/31/2014 | |
| Interest Rate: | 4.97000% | Number of Tenants: | 26 | |
| Note Date: | 9/15/2014 | 2011 NOI: | $3,323,972 | |
| Maturity Date: | 10/1/2021 | 2012 NOI: | $3,607,199 | |
| Interest-only Period: | 24 months | 2013 NOI: | $3,410,178 | |
| Original Term: | 84 months | TTM NOI (as of 7/2014): | $3,619,591 | |
| Original Amortization: | 360 months | UW Economic Occupancy(2): | 91.6% | |
| Amortization Type: | IO-Balloon | UW Revenues(3): | $5,922,595 | |
| Call Protection: | L(24),Def(56),O(4) | UW Expenses: | $2,166,942 | |
| Lockbox: | CMA | UW NOI: | $3,755,654 | |
| Additional Debt: | N/A | UW NCF: | $3,394,756 | |
| Additional Debt Balance: | N/A | Appraised Value / Per SF: | $51,090,000 / $130 | |
| Additional Debt Type: | N/A | Appraisal Date: | 8/8/2014 | |
| Escrows and Reserves | Financial Information | ||||||
| Initial | Monthly | Initial Cap | Cut-off Date Loan / SF: | $89 | |||
| Taxes: | $164,640 | $54,880 | N/A | Maturity Date Loan / SF: | $82 | ||
| Insurance: | $43,026 | $3,663 | N/A | Cut-off Date LTV: | 68.5% | ||
| Replacement Reserves: | $0 | $5,659 | N/A | Maturity Date LTV: | 63.1% | ||
| TI/LC: | $0 | $24,416 | N/A | UW NCF DSCR: | 1.51x | ||
Other(4): | $1,218,394 | $0 | N/A | UW NOI Debt Yield: | 10.7% | ||
| Sources and Uses | ||||||
| Sources | Proceeds | % of Total | Uses | Proceeds | % of Total | |
| Mortgage Loan | $35,000,000 | 65.1% | Purchase Price | $50,833,200 | 94.5% | |
| Borrowers Equity | 18,773,640 | 34.9 | Closing Costs | 1,514,380 | 2.8 | |
| Upfront Reserves | 1,426,060 | 2.7 | ||||
| Total Sources | $53,773,640 | 100.0% | Total Uses | $53,773,640 | 100.0% | |
| (1) | Oakland Square was built in 1986 and renovated in 1997. Oakland Plaza was built in 1979. |
| (2) | Occupancy and UW Economic Occupancy both include a 21,677 square foot lease for Michael’s. The lease was executed in January 2014. The lease states that if the lease has not commenced prior to October 2014, there will be no rent due until April 2015. The lender escrowed $209,753 in a free rent reserve relating to outstanding rent and reimbursement obligations during the free rent period under the Michael’s lease. |
| (3) | UW Revenue includes rent under the Michael’s lease. At loan origination, $209,753 was escrowed for a free rent reserve in respect of the Michael’s lease covering the free rent period from loan origination through March 2015. |
| (4) | At loan origination: (i) a total of $625,039 was escrowed for a TI/LC reserve relating to outstanding tenant improvement obligations under the Michael’s lease, (ii) $97,353 was escrowed for a leasing commission reserve relating to outstanding leasing commission obligations under the Michael’s lease, (iii) $209,753 was escrowed for a free rent reserve relating to outstanding rent and reimbursement obligations during a free rent period under the Michael’s lease and (iv) $286,250 was escrowed for an immediate repair reserve. |
THE INFORMATION IN THIS STRUCTURAL AND COLLATERAL TERM SHEET IS NOT COMPLETE AND MAY BE AMENDED PRIOR TO THE TIME OF SALE. THIS TERM SHEET IS NOT AN OFFER TO SELL THESE SECURITIES AND IT IS NOT A SOLICITATION OF AN OFFER TO BUY THESE SECURITIES IN ANY JURISDICTION WHERE THE OFFER OR SALE IS NOT PERMITTED.
| 107 of 124 | |
| Structural and Collateral Term Sheet | JPMBB 2014-C24 | |
Oakland Square and Oakland Plaza | ||
The Loan. The Oakland Square and Oakland Plaza loan is secured by a first mortgage lien on 392,237 square foot anchored retail center located in Troy, Michigan. The whole loan has an outstanding principal balance of $35.0 million (the “Oakland Square and Oakland Plaza Whole Loan”), which is comprised of two pari passu notes, Note A-1 and Note A-2. Note A-1 has an outstanding principal balance as of the Cut-off Date of $17.5 million and will be contributed to the JPMBB 2014-C24 trust by RAIT Funding, LLC. Note A-2 has an outstanding principal balance as of the Cut-off Date of $17.5 million and will be contributed to the JPMBB 2014-C24 trust by Barclays. The Oakland Square and Oakland Plaza Whole Loan has a seven-year term and, subsequent to a 24-month interest-only period, will amortize on a 30-year schedule. The Oakland Square and Oakland Plaza Whole Loan’s sponsor and nonrecourse carve-out guarantor is RAIT Partnership, L.P., a Delaware limited partnership (“RAIT Partnership”). RAIT Partnership is an affiliate of RAIT Funding, LLC, a sponsor and a mortgage loan seller to the JPMBB 2014-C24 Trust. RAIT Partnership’s commercial real estate portfolio consists of 7,046 multifamily units, 2.2 million square feet of commercial office space, and 1.42 million square feet of retail space, as of the end of the second quarter 2014. See “Risk Factors – Risks Related to the Offered Certificates – Potential Conflicts of Interest -- Potential Conflicts of Interest of the Sponsors and the Mortgage Loan Sellers” in the Free Writing Prospectus.
The Properties. The 392,237 square foot Oakland Square and Oakland Plaza Portfolio is comprised of two anchored retail centers located in Troy, Michigan, consisting of the Oakland Square retail center (“Oakland Square”) and the Oakland Plaza retail center (“Oakland Plaza”). Oakland Square is 220,726 square feet and is located at 500 John R Road, Troy, Oakland County, Michigan. The Oakland Square main improvements were constructed in 1986 and an additional outbuilding (leased to Chuck E. Cheese’s) was constructed in 1997. Oakland Square is currently 100.0% occupied and is anchored by Kohl’s, Bed Bath & Beyond and Chuck E. Cheese’s. Kohl’s, which occupies 94,345 square feet, owns its own improvements and ground leases the land from the applicable borrower.
Oakland Plaza is a 171,511-square foot anchored retail property located at 260-396 John R Road, Troy, Oakland County, Michigan, adjacent to Oakland Square. The improvements were constructed in 1979. Oakland Plaza is anchored by TJ Maxx, Michael’s and Planet Fitness and, as of August 31, 2014, the property is 91.4% occupied including the Michael’s space which is under construction. Michael’s signed a new 10-year, triple net lease at $12.00 per square foot for the first 60 months of the lease term in January 2014, which lease is anticipated to commence between loan origination and April 2015. Oakland Plaza’s 171,511 square feet of net rentable area includes one tenant, Chase Bank (3,303 square feet), which is located on an outparcel.
Both Oakland Square and Oakland Plaza are located across the street from the Oakland Mall, a 1.5 million square foot regional mall anchored by Sears, Macy’s, and JCPenney.
The Market. Oakland Square and Oakland Plaza are both located in the Troy, Michigan submarket, approximately 20 miles north-northwest of the Detroit central business district. Oakland Square and Oakland Plaza are located at the northeast intersection of John R Road and 14 Mile Road, across the street from the Oakland Mall and approximately one mile from Interstate-75. According to the appraisal, as of the end of the first quarter of 2014, the Troy retail submarket had an average overall vacancy rate of approximately 6.6% and average asking rents of $14.46 per square foot.
Tenant Summary(1) | |||||||
| Tenant | Ratings(2) Moody’s/S&P/Fitch | Net Rentable Area (SF) | % of Total NRA | Base Rent PSF | Sales PSF(3) | Occupancy Costs(3) | Lease Expiration Date |
Kohl’s (4) | Baa1 / BBB+ / BBB+ | 94,345 | 24.1% | N/A | $233 | N/A | 10/31/2016 |
| DSW | NA / NA / NA | 50,500 | 12.9% | $10.83 | $279 | 5.5% | 2/28/2018 |
| Bed Bath & Beyond | Baa1 / A- / NA | 36,416 | 9.3% | $10.92 | $298 | 5.1% | 1/31/2017 |
| TJ Maxx | A3 / A+/ NA | 31,469 | 8.0% | $9.25 | $283 | 5.4% | 1/31/2023 |
| Planet Fitness | B1 / NA / NA | 27,400 | 7.0% | $7.89 | N/A | N/A | 11/30/2021 |
Michael’s(5) | NA / B / NA | 21,677 | 5.5% | $12.00 | N/A | N/A | 2/28/2025 |
| Chuck E. Cheese’s | NA / NA / NA | 17,825 | 4.5% | $12.82 | $88 | 21.8% | 3/31/2022 |
| Pier 1 Imports | NA / B+ / NA | 14,579 | 3.7% | $9.00 | $105 | 15.4% | 9/30/2017 |
| Five Below | NA / NA / NA | 10,880 | 2.8% | $13.00 | $199 | 8.8% | 1/31/2021 |
| Ulta Salon, Cosmetics & Fragrance | NA / NA / NA | 10,760 | 2.7% | $19.50 | N/A | N/A | 2/29/2020 |
| (1) | Based on the underwritten rent roll. Assumes no tenant exercises an early termination option. |
| (2) | Ratings provided are for the parent company of the entity listed in the “Tenant” field whether or not the parent company guarantees the lease. |
| (3) | Sales PSF and Occupancy Costs represent sales for the trailing twelve month period ending July 31, 2014. |
| (4) | Kohl’s owns its own improvements but ground leases the land from the borrowers. |
| (5) | The Michael’s lease was executed in January 2014. The lease states that if the lease has not commenced prior to October 2014, there will be no rent due until April 2015. The lender escrowed $209,753 in a free rent reserve relating to outstanding rent and reimbursement obligations during the free rent period under the Michael’s lease. |
THE INFORMATION IN THIS STRUCTURAL AND COLLATERAL TERM SHEET IS NOT COMPLETE AND MAY BE AMENDED PRIOR TO THE TIME OF SALE. THIS TERM SHEET IS NOT AN OFFER TO SELL THESE SECURITIES AND IT IS NOT A SOLICITATION OF AN OFFER TO BUY THESE SECURITIES IN ANY JURISDICTION WHERE THE OFFER OR SALE IS NOT PERMITTED.
| 108 of 124 | |
| Structural and Collateral Term Sheet | JPMBB 2014-C24 | |
Oakland Square and Oakland Plaza | ||
| Operating History and Underwritten Net Cash Flow | ||||||||
| 2011 | 2012 | 2013 | TTM(1) | Underwritten(2) | Per Square Foot | %(3) | ||
Rents in Place(4) | $3,659,788 | $3,794,389 | $3,760,356 | $3,786,015 | $4,031,066 | $ 10.28 | 62.6% | |
| Vacant Income | 0 | 0 | 0 | 0 | 382,289 | 0.97 | 5.9 | |
| Other Income | (48,036) | 22,224 | (7,841) | 77,532 | 3,600 | 0.01 | 0.1 | |
| Gross Potential Rent | $3,611,752 | $3,816,613 | $3,752,515 | $3,863,547 | $4,416,955 | $11.26 | 68.6% | |
| Total Reimbursements Income | 1,848,653 | 1,882,941 | 1,722,063 | 1,799,892 | 2,021,996 | 5.16 | 31.4 | |
| Net Rental Income | $5,460,405 | $5,699,554 | $5,474,578 | $5,663,439 | $6,438,951 | $16.42 | 100.0% | |
| (Vacancy/Credit Loss) | 0 | (497) | 0 | 0 | (540,226) | (1.38) | (8.4) | |
| Other Income | 104,748 | 28,237 | 81,803 | 96,298 | 23,870 | 0.06 | 0.4 | |
| Percentage Rent | 473 | 1,126 | 646 | 34 | 0 | 0.00 | 0.0 | |
| Effective Gross Income | $5,565,626 | $5,728,420 | $5,557,027 | $5,759,771 | $5,922,595 | $15.10 | 92.0% | |
| Total Expenses | $2,241,654 | $2,121,221 | $2,146,849 | $2,140,180 | $2,166,942 | $5.52 | 36.6% | |
| Net Operating Income | $3,323,972 | $3,607,199 | $3,410,178 | $3,619,591 | $3,755,654 | $9.57 | 63.4% | |
| Total TI/LC, Capex/RR | 44,145 | 44,145 | 44,145 | 0 | 360,897 | 0.92 | 6.1 | |
| Net Cash Flow | $3,279,827 | $3,563,054 | $3,366,033 | $3,619,591 | $3,394,756 | $8.65 | 57.3% | |
Occupancy(5)(6) | 94.0% | 95.7% | 94.3% | 96.3% | 91.6% | |||
| (1) | TTM represents the trailing twelve-month period ending July 31, 2014. |
| (2) | Underwritten cash flow includes rent for Michael’s. The Michael’s lease was executed in January 2014 and is anticipated to commence between loan origination and April 2015. A free rent reserve of $209,753 was escrowed relating to outstanding rent and reimbursement obligations during a free rent period under the Michael’s lease. |
| (3) | Percentage column represents percent of Net Rental Income for all revenue lines and represents percent of Effective Gross Income for the remainder of fields. |
| (4) | Underwritten Rents in Place includes contractual rent steps through March 15, 2015. |
| (5) | Occupancy and UW Economic Occupancy both include a 21,677 square foot lease for Michael’s. |
| (6) | TTM Occupancy is as of August 31, 2014. |
Release of Individual Property. The borrowers are permitted to obtain a release of the Oakland Plaza mortgaged property from the lien of the related mortgage after the earlier of the second anniversary of the securitization Closing Date or the fourth anniversary of the origination date of the related mortgage loan, subject to the satisfaction of various conditions, including (i) the related borrowers defease a portion of the mortgage loan in an amount equal to $23,037,015 (125% of the allocated loan amount) for the property; (ii) after giving effect to such release, (a) the debt service coverage ratio is at least equal to 1.50x and (b) the loan-to-value ratio with respect to the Oakland Square mortgaged property is not greater than 70.0%; (iii) the borrowers must deliver rating agency confirmation with respect to the partial defeasance; and (iv) the borrowers must deliver a REMIC opinion.
THE INFORMATION IN THIS STRUCTURAL AND COLLATERAL TERM SHEET IS NOT COMPLETE AND MAY BE AMENDED PRIOR TO THE TIME OF SALE. THIS TERM SHEET IS NOT AN OFFER TO SELL THESE SECURITIES AND IT IS NOT A SOLICITATION OF AN OFFER TO BUY THESE SECURITIES IN ANY JURISDICTION WHERE THE OFFER OR SALE IS NOT PERMITTED.
| 109 of 124 | |
| Structural and Collateral Term Sheet | JPMBB 2014-C24 |
[THIS PAGE INTENTIONALLY LEFT BLANK]
THE INFORMATION IN THIS STRUCTURAL AND COLLATERAL TERM SHEET IS NOT COMPLETE AND MAY BE AMENDED PRIOR TO THE TIME OF SALE. THIS TERM SHEET IS NOT AN OFFER TO SELL THESE SECURITIES AND IT IS NOT A SOLICITATION OF AN OFFER TO BUY THESE SECURITIES IN ANY JURISDICTION WHERE THE OFFER OR SALE IS NOT PERMITTED.
| 110 of 124 | |
| Structural and Collateral Term Sheet | JPMBB 2014-C24 | |
Arden Park | ||
| Mortgage Loan Information | Property Information | |||
| Mortgage Loan Seller: | JPMCB | Single Asset / Portfolio: | Single Asset | |
| Original Principal Balance: | $32,600,000 | Title: | Fee | |
| Cut-off Date Principal Balance: | $32,600,000 | Property Type - Subtype: | Multifamily - Garden | |
| % of Pool by IPB: | 2.6% | Net Rentable Area (Units): | 301 | |
| Loan Purpose: | Acquisition | Location: | San Antonio, TX | |
| Borrower: | Elysian at Arden Park, LP | Year Built / Renovated: | 2013 / N/A | |
| Sponsors: | Oren Blatt, Yacob Blatt and | Occupancy: | 95.3% | |
| Yehonatan Sade | Occupancy Date: | 8/22/2014 | ||
| Interest Rate: | 4.31950% | Number of Tenants: | N/A | |
| Note Date: | 9/2/2014 | 2011 NOI(1): | N/A | |
| Maturity Date: | 10/1/2024 | 2012 NOI(1): | N/A | |
| Interest-only Period: | 60 months | 2013 NOI(1): | N/A | |
| Original Term: | 120 months | TTM NOI (as of 7/2014)(2)(3): | $1,992,344 | |
| Original Amortization: | 360 months | UW Economic Occupancy: | 95.0% | |
| Amortization Type: | IO-Balloon | UW Revenues: | $4,481,825 | |
| Call Protection: | L(25),Grtr1%orYM(93),O(2) | UW Expenses: | $2,020,304 | |
| Lockbox: | Springing | UW NOI(2): | $2,461,521 | |
| Additional Debt: | N/A | UW NCF: | $2,401,321 | |
| Additional Debt Balance: | N/A | Appraised Value / Per Unit: | $42,300,000 / $140,532 | |
| Additional Debt Type: | N/A | Appraisal Date: | 7/29/2014 | |
| Escrows and Reserves | Financial Information | |||||
| Initial | Monthly | Initial Cap | Cut-off Date Loan / Unit: | $108,306 | ||
| Taxes: | $632,984 | $79,123 | N/A | Maturity Date Loan / Unit: | $98,832 | |
| Insurance: | $0 | $5,865 | N/A | Cut-off Date LTV: | 77.1% | |
| Replacement Reserves: | $5,017 | $5,017 | N/A | Maturity Date LTV: | 70.3% | |
| TI/LC: | $0 | $0 | N/A | UW NCF DSCR: | 1.24x | |
| Other: | $0 | $0 | N/A | UW NOI Debt Yield: | 7.6% | |
| Sources and Uses | ||||||
| Sources | Proceeds | % of Total | Uses | Proceeds | % of Total | |
| Mortgage Loan | $32,600,000 | 77.4% | Purchase Price(4) | $40,981,555 | 97.3% | |
| Sponsor Equity | 9,497,871 | 22.6 | Upfront Reserves | 638,001 | 1.5 | |
| Closing Costs | 478,316 | 1.1 | ||||
| Total Sources | $42,097,871 | 100.0% | Total Uses | $42,097,871 | 100.0% | |
| (1) | Historical NOI is not available because the property was built in 2013. |
| (2) | Increase from TTM NOI to UW NOI is due to decreased tenant concessions following the lease-up at the property. |
| (3) | TTM NOI is based on a trailing three-month period ending on July 31, 2014. |
| (4) | Purchase Price is net of cash and prorated expenses at the property. |
The Loan. The Arden Park loan has an outstanding principal balance of $32.6 million and is secured by a first mortgage lien on a newly constructed, Class A multifamily property totaling 301 units located in San Antonio, Texas. The loan has a 10-year term and, subsequent to a five-year interest-only period, will amortize on a 30-year schedule. The loan sponsors and nonrecourse carve-out guarantors of the mortgage loan are Oren Blatt, Yacob Blatt and Yehonatan Sade, jointly and severally. Oren Blatt, Yacob Blatt and Yehonatan Sade are the principals of Sun Holdings Group (“Sun Holdings”), which is headquartered in Tel Aviv and also has offices in Montreal, Boston, Houston and Jacksonville. Sun Holdings is involved in the ownership and management of a commercial real estate portfolio consisting of over 2,000 apartments and nearly 250,000 square feet of office, industrial and retail space. Sun Holdings acquired the property in September 2014 from the developer of the property, Flournoy Propeties, for approximately $42.25 million ($140,365 per unit). Sun Holdings is also the loan sponsor of NoBu Station, another loan included in the trust.
THE INFORMATION IN THIS STRUCTURAL AND COLLATERAL TERM SHEET IS NOT COMPLETE AND MAY BE AMENDED PRIOR TO THE TIME OF SALE. THIS TERM SHEET IS NOT AN OFFER TO SELL THESE SECURITIES AND IT IS NOT A SOLICITATION OF AN OFFER TO BUY THESE SECURITIES IN ANY JURISDICTION WHERE THE OFFER OR SALE IS NOT PERMITTED.
| 111 of 124 | |
| Structural and Collateral Term Sheet | JPMBB 2014-C24 | |
Arden Park | ||
The Property. Arden Park is a 301-unit, newly constructed Class A multifamily complex which was completed in April 2013 and as of August 2014 is approximately 95.3% occupied. Amenities at the property include a clubhouse with a fitness center and business center, as well as a swimming pool, cabanas, a playground, dog park and storage units. The property consists of nine four-story and two, two-story buildings that have a unit-mix consisting of 112 one-bedroom units, 141 two-bedroom units and 48 three-bedroom units. The apartments feature finishes such as nine-foot ceilings, crown molding and private balconies. The property has 490 parking spaces, which results in a parking ratio of 1.63 spaces per unit.
The Market. The property is located in San Antonio, Texas, approximately 11 miles northwest of the San Antonio central business district and approximately six miles from the intersection of I-10, which provides access to downtown San Antonio, and I-410, which is the inner-loop around San Antonio. A major economic driver in the area is the South Texas Medical Center, which is located within two miles of the property and is a conglomerate of numerous hospitals, clinics and research and higher education institutions that employ over 28,000 people. USAA Insurance’s headquarters is also located approximately two miles from the property, and the insurer employs approximately 17,000 people in San Antonio. As of July 2013, the submarket’s Class A occupancy rate was 91.3%, and competitive properties had an average occupancy of 96.4% (excluding two properties still in lease-up). The average monthly market rent is $1,290 per unit ($1.33 per square foot) and the appraisal’s competitive set has an average monthly market rent of $1,199 ($1.27 per square foot). All of the properties in the appraisal’s competitive set were built between 2006 and 2014.
Within the San Antonio metropolitan statistical area there are approximately 22 properties composed of 5,900 units currently under construction, and another 23 properties composed of 6,800 units are proposed. Two properties under construction, totaling 388 units, are located in the same submarket as the property.
Multifamily Unit Mix(1) | |||||||||
| Unit Type | # of Units | % of Total | Occupied Units | Occupancy | Average Unit Size (Square Feet) | Average Monthly Rental Rate | Average Monthly Rental Rate PSF | Monthly Market Rental Rate | Monthly Market Rental Rate PSF |
| 1 Bedroom | 112 | 37.2% | 109 | 97.3% | 733 | $966 | $1.32 | $1,205 | $1.64 |
| 2 Bedroom | 141 | 46.8 | 130 | 92.2% | 1,041 | $1,275 | $1.22 | $1,278 | $1.23 |
| 3 Bedroom | 48 | 15.9 | 48 | 100.0% | 1,307 | $1,526 | $1.17 | $1,530 | $1.17 |
| Total/Wtd. Avg. | 301 | 100.0% | 287 | 95.3% | 969 | $1,200 | $1.24 | $1,292 | $1.33 |
| (1) | Based on the underwritten rent roll. |
| Operating History and Underwritten Net Cash Flow | |||||
TTM(1) | Underwritten | Per Unit | %(2) | ||
Rents in Place(3) | $4,353,492 | $4,131,719 | $13,727 | 95.1% | |
| Vacant Income | 0 | 213,360 | 709 | 4.9 | |
| Gross Potential Rent | $4,353,492 | $4,345,079 | $14,435 | 100.0% | |
| Reimbursements | 0 | 0 | 0 | 0.0 | |
| Net Rental Income | $4,353,492 | $4,345,079 | $14,435 | 100.0% | |
(Vacancy/Credit Loss/Concessions)(4) | (827,892) | (217,254) | (722) | (5.0) | |
| Other Income | 296,948 | 354,000 | 1,176 | 8.1 | |
| Effective Gross Income | $3,822,548 | $4,481,825 | $14,890 | 103.1% | |
| Total Expenses | $1,830,204 | $2,020,304 | $6,712 | 45.1% | |
| Net Operating Income | $1,992,344 | $2,461,521 | $8,178 | 54.9% | |
| Replacement Reserves | 0 | 60,200 | 200 | 1.3 | |
| Net Cash Flow | $1,992,344 | $2,401,321 | $7,978 | 53.6% | |
Occupancy(5) | 95.3% | 95.0% | |||
| (1) | The numbers provided are based on a trailing three-month period ending on July 31, 2014. |
| (2) | Percentage column represents percent of Net Rental Income for all revenue lines and represents percent of Effective Gross Income for the remainder of fields. |
| (3) | Underwritten Rents in Place are based on the August 2014 rent roll annualized. |
| (4) | Vacancy/Credit Loss/Concessions in the TTM period represent concessions relating to leasing up the property. |
| (5) | TTM Occupancy is the occupancy as of August 22, 2014. Underwritten Occupancy represents economic occupancy. |
THE INFORMATION IN THIS STRUCTURAL AND COLLATERAL TERM SHEET IS NOT COMPLETE AND MAY BE AMENDED PRIOR TO THE TIME OF SALE. THIS TERM SHEET IS NOT AN OFFER TO SELL THESE SECURITIES AND IT IS NOT A SOLICITATION OF AN OFFER TO BUY THESE SECURITIES IN ANY JURISDICTION WHERE THE OFFER OR SALE IS NOT PERMITTED.
| 112 of 124 | |
| Structural and Collateral Term Sheet | JPMBB 2014-C24 | |
| Canyon Ranch Portfolio | ||
| Mortgage Loan Information | Property Information | |||
| Mortgage Loan Seller: | GECC | Single Asset / Portfolio: | Portfolio | |
Original Principal Balance(1): | $30,000,000 | Title: | Fee | |
Cut-off Date Principal Balance(1): | $30,000,000 | Property Type - Subtype: | Hotel - Full Service | |
| % of Pool by IPB: | 2.4% | Net Rentable Area (Rooms): | 277 | |
| Loan Purpose: | Refinance | Location: | Various | |
| Borrower: | CR Resorts, LLC | Year Built / Renovated: | Various / 2007 | |
| Sponsor: | CR Operating, LLC | Occupancy / ADR / RevPar: | 58.4% / $501.27 / $292.77 | |
| Interest Rate: | 4.13000% | Occupancy / ADR / RevPar Date: | 6/30/2014 | |
| Note Date: | 8/20/2014 | Number of Tenants: | N/A | |
| Anticipated Repayment Date: | 9/1/2024 | 2011 NOI: | $20,436,767 | |
| Interest-only Period: | 60 months | 2012 NOI: | $20,065,195 | |
| Original Term: | 120 months | 2013 NOI: | $23,018,973 | |
| Original Amortization: | 360 months | TTM NOI (as of 6/2014): | $24,411,908 | |
| Amortization Type: | IO-Balloon | UW Occupancy / ADR / RevPar: | 58.4% / $501.27 / $292.77 | |
| Call Protection: | L(25),Def(91),O(4) | UW Revenues: | $98,371,191 | |
| Lockbox: | CMA | UW Expenses: | $77,985,859 | |
| Additional Debt: | Yes | UW NOI: | $20,385,332 | |
| Additional Debt Balance: | $120,000,000 | UW NCF: | $20,385,332 | |
| Additional Debt Type: | Pari Passu | Appraised Value / Per Room: | $282,100,000 / $1,018,412 | |
| Appraisal Date: | June 2014 | |||
| Escrows and Reserves | Financial Information(1) | ||||||
| Initial | Monthly | Initial Cap | Cut-off Date Loan / Room: | $541,516 | |||
| Taxes: | $559,583 | $102,500 | N/A | Maturity Date Loan / Room: | $492,583 | ||
| Insurance: | $305,000 | $42,917 | N/A | Cut-off Date LTV: | 53.2% | ||
| FF&E Reserves: | $0 | 4% of Gross Revenues | N/A | Maturity Date LTV: | 48.4% | ||
| TI/LC: | $0 | $0 | N/A | UW NCF DSCR: | 2.34x | ||
| Other: | $0 | $0 | N/A | UW NOI Debt Yield: | 13.6% | ||
| Sources and Uses | ||||||
| Sources | Proceeds | % of Total | Uses | Proceeds | % of Total | |
Mortgage Loan(1) | $150,000,000 | 68.2% | Payoff of Preferred Equity | $119,408,207 | 54.3% | |
| Sponsor Equity | 69,859,633 | 31.8 | Payoff Existing Debt | 96,483,970 | 43.9 | |
| Closing Costs | 3,102,874 | 1.4 | ||||
| Upfront Reserves | 864,583 | 0.4 | ||||
| Total Sources | $219,859,633 | 100.0% | Total Uses | $219,859,633 | 100.0% | |
| (1) | Canyon Ranch Portfolio is part of a loan evidenced by three pari passu notes with an aggregate original principal balance of $150.0 million. The Financial Information presented in the chart above reflects the Cut-off Date balance of the $150.0 million Canyon Ranch Portfolio Whole Loan. |
The Loan. The Canyon Ranch Portfolio loan (the “Canyon Ranch Portfolio Whole Loan”) is secured by a first mortgage lien on two full service destination spas totaling 277 rooms located in Tucson, Arizona and Lenox, Massachusetts (the “Canyon Ranch - Tucson Property” and the “Canyon Ranch - Lenox Property”, together, the “Canyon Ranch Portfolio Properties”). The Canyon Ranch Portfolio Whole Loan has an outstanding principal balance of $150.0 million, which is comprised of three pari passu notes; Note A-1, Note A-2 and Note A-3. Note A-3 has an outstanding principal balance as of the Cut-Off Date of $30.0 million and is being contributed to the JPMBB 2014-C24 trust. Note A-1 has an outstanding principal balance as of the Cut-off Date of $75.0 million and was contributed to COMM 2014-UBS5 trust. Note A-2 has an outstanding principal balance as of the Cut-Off Date of $45.0 million and was contributed to the JPMBB 2014-C23 trust. The holder of Note A-1 (the “Controlling Noteholder”) is the trustee of the COMM 2014-UBS5 trust. The trustee of the COMM 2014-UBS5 trust (or, prior to the occurrence and continuance of a control event, the directing certificateholder for that securitization) will be entitled to exercise all of the rights of the Controlling Noteholder with respect to the Canyon Ranch Portfolio Whole Loan; however, the holders of Note A-2 and Note A-3 will be entitled, under certain circumstances, to consult with respect to
THE INFORMATION IN THIS STRUCTURAL AND COLLATERAL TERM SHEET IS NOT COMPLETE AND MAY BE AMENDED PRIOR TO THE TIME OF SALE. THIS TERM SHEET IS NOT AN OFFER TO SELL THESE SECURITIES AND IT IS NOT A SOLICITATION OF AN OFFER TO BUY THESE SECURITIES IN ANY JURISDICTION WHERE THE OFFER OR SALE IS NOT PERMITTED.
| 113 of 124 | |
| Structural and Collateral Term Sheet | JPMBB 2014-C24 | |
| Canyon Ranch Portfolio | ||
certain major decisions. The Canyon Ranch Portfolio Whole Loan has a 10-year term, and subsequent to a five-year interest-only period, will amortize on a 30-year schedule. The most recent prior financing of the Canyon Ranch Portfolio Whole Loan was included in the BACM 2005-2 transaction. The borrowing entity for the Canyon Ranch Portfolio Whole Loan is CR Resorts, LLC, a Delaware limited liability company and special purpose entity.
The Sponsor. The loan sponsor and the nonrecourse carve-out guarantor is CR Operating, LLC. CR Operating, LLC is owned by Crescent CR Holdings LLC 68% (“Crescent”) and CR Founders, LLC 32% (“Founders”). Crescent is owned by a subsidiary of Barclays PLC (Barclays) and John Goff. John Goff orchestrated the formation of Crescent REIT through a $350.0 million IPO in 1994, and its sale to Morgan Stanley in 2007 for $6.5 billion. In 2009 Barclays foreclosed on Morgan Stanley and simultaneously entered into a joint venture with Goff Capital whereby John Goff would lead the $1.5 billion company. Crescent has been invested in Canyon Ranch since 1996. The Founders are the original owners Mel Zuckerman and Jerold Cohen. They maintain their day to day oversight and shared vision for Canyon Ranch with Crescent who performs the day to day duties of the controlling member. The hotel is managed by ZC Management, L.L.C., which is an affiliate of CR Founders, L.L.C.
The Properties. The Canyon Ranch Portfolio Properties consist of two full service destination resort spas totaling 277 rooms and 471 paid guest nights, located in Tucson, Arizona and Lenox, Massachusetts. The properties were purchased and developed by co-founders Mel Zuckerman and Jerrold Cohen. Crescent Real Estate Holdings LLC has been a part of ownership since 1996. Both of the resorts are operated under the Canyon Ranch brand. The brand also operates; Canyon Ranch Miami Beach, Canyon Ranch at Sea and Canyon Ranch Las Vegas none of which are collateral for this loan. The Canyon Ranch operating model, does not track occupancy by the number of rooms sold, as is typical for standard hotels, but rather on the number of paid guest nights. This is due to the fact that, as an all-inclusive property, the subjects collect revenue from each individual guest rather than from each room sold. Thus, while the subjects offer a total of 277 rooms (151 at the Canyon Ranch - Tucson Property and 126 at the Canyon Ranch - Lenox Property), its supply is based on total 471 total available paying guests (259 at Canyon Ranch - Tucson Property and 212 at Canyon Ranch – Lenox Property). The 471 available guests figure is not related to the number of total beds in the rooms, but rather the optimum number of guests on-site utilizing the facilities, restaurants, programs, consultants and activities. These guests could stay at Canyon Ranch or be housed in adjacent rental properties for day use. Canyon Ranch has operated this way for 35 years.
Canyon Ranch – Tucson. The Canyon Ranch - Tucson Property is a 151-room (259 paid guest night) full service destination resort spa located at 8600 East Rockcliff Road in Tucson, Arizona, and is located approximately 11 miles northeast of downtown Tucson. The location provides great privacy and creates a relaxed and secluded environment. The Canyon Ranch - Tucson Property has 151 rooms, but is able to accommodate 259 guests per night. Amenities at the Canyon Ranch - Tucson Property include 13,000 square feet of meeting space, a 25,000 square feet club house, a 65,000 square feet spa complex, a 20,000 square feet health and healing center, a 17,500 square feet life enhancement center, an 11,000 square feet aquatic center, 4,000 square feet golf performance center, three dining outlets, ranch store, seven outdoor tennis courts, an outdoor basketball court and three outdoor pools. The guestrooms are located throughout the property in guest unit complexes, each containing between one and four rooms. They are separated into six different categories including 77 deluxe rooms, 47 executive rooms, 17 haciendas, eight casitas, the Zpad and the Casa Grande. There are 14 rental units that owners can rent for Canyon Ranch resort use. Guestroom amenities include flat screen televisions, luxury Mascioni Italian linens, mini fridge, pillow menu with over 20 pillow options and desk. The Canyon Ranch - Tucson Property was originally constructed in 1979 and most recently renovated from 2005 through 2007 for approximately $19.5 million dollars ($129,019 per room). The renovations included updates to all the guestrooms and expansion of the Health and Healing Center. Planned capital expenditures for 2014 include a room update, carpeting, vehicles, spa, and IT update for approximately $2.6 million.
Canyon Ranch – Lenox. The Canyon Ranch - Lenox Property is a 126-room (212 paid guest night) full service destination resort spa located at 165 Kemble Street in Lenox, Massachusetts, in a quiet, residential area removed from major highways. The three primary buildings are connected through enclosed, heated glass walkways and arranged around a pool and formal gardens. The Canyon Ranch - Lenox Property has 126 rooms, but is able to accommodate 212 guests per night. Amenities at the Canyon Ranch - Lenox Property include a 118,300 square feet spa facility, 3,433 square feet of meeting space, two dining outlets and an outdoor seasonal cafe, a medical center, a library, six gyms, an indoor and outdoor pool, tennis courts, a ropes challenge course, walking trails, a yoga studio and valet parking. Guestroom amenities include flat screen televisions, work desk and chair, upholstered chair and ottoman, mini fridge, wet-bar and marble sink and cast-iron tub in the bathrooms. Complimentary services include over 40 daily fitness classes, 15 daily outdoor activities, body composition analyses and fitness walks. The Canyon Ranch - Lenox Property was originally constructed in 1897. The last major renovation was completed in 2007 for approximately $11.7 million ($92,995 per room). The renovations included updates to all guest bathrooms; replacement of all furniture, fixtures, and equipment; new bedding; updates to main pool building; and redesign of locker rooms. Since 2005 capital expenditures have totaled $18.4 million reflecting an ongoing commitment by ownership to improve the property. Planned capital expenditures include a complete upgrade of guest room HVAC, café remodeling, IT upgrades and facilities improvement for approximately $4.9 million.
THE INFORMATION IN THIS STRUCTURAL AND COLLATERAL TERM SHEET IS NOT COMPLETE AND MAY BE AMENDED PRIOR TO THE TIME OF SALE. THIS TERM SHEET IS NOT AN OFFER TO SELL THESE SECURITIES AND IT IS NOT A SOLICITATION OF AN OFFER TO BUY THESE SECURITIES IN ANY JURISDICTION WHERE THE OFFER OR SALE IS NOT PERMITTED.
| 114 of 124 | |
| Structural and Collateral Term Sheet | JPMBB 2014-C24 | |
| Canyon Ranch Portfolio | ||
Operating History and Underwritten Net Cash Flow | |||||||
| 2011 | 2012 | 2013 | TTM(1) | UW | Per Room(2) | % of Total Revenue(3) | |
| Occupancy | 56.2% | 54.7% | 57.6% | 58.4% | 58.4% | ||
| ADR | $455.14 | $475.16 | $488.31 | $501.27 | $501.27 | ||
| RevPAR | $255.62 | $259.85 | $281.04 | $292.77 | $292.77 | ||
| Room Revenue | $43,944,998 | $44,672,226 | $48,315,230 | $50,331,693 | $50,331,693 | $106,861 | 51.2% |
| Food and Beverage | 648,291 | 595,270 | 663,903 | 644,013 | 644,013 | 1,367 | 0.7 |
| Other Department Revenues | 43,480,776 | 43,864,692 | 46,293,785 | 47,395,485 | 47,395,485 | 100,627 | 48.2 |
| Total Revenue | $88,074,065 | $89,132,188 | $95,272,918 | $98,371,191 | $98,371,191 | $208,856 | 100.0% |
| Payroll Expense | $41,835,938 | $42,535,819 | $44,357,574 | $44,935,878 | $44,935,878 | $95,405 | 45.7% |
| Food and Beverage Expense | 2,846,204 | 2,854,509 | 3,143,043 | 3,309,321 | 3,309,321 | 7,026 | 3.4 |
| Other Departmental Expenses | 10,177,660 | 10,264,782 | 10,376,552 | 11,228,817 | 11,228,817 | 23,840 | 11.4 |
| Departmental Expenses | $54,859,802 | $55,655,110 | $57,877,169 | $59,474,016 | $59,474,016 | $126,272 | 60.5% |
| Departmental Profit | $33,214,263 | $33,477,078 | $37,395,749 | $38,897,175 | $38,897,175 | $82,584 | 39.5% |
| Operating Expenses | $11,082,651 | $11,531,478 | $12,530,484 | $12,609,448 | $12,701,176 | $26,966 | 12.9% |
| Gross Operating Profit | $22,131,612 | $21,945,600 | $24,865,265 | $26,287,727 | $26,195,999 | $55,618 | 26.6% |
| Fixed Expenses | $1,694,845 | $1,880,405 | $1,846,292 | $1,875,819 | $1,875,819 | $3,983 | 1.9% |
| FF&E | 0 | 0 | 0 | 0 | 3,934,848 | 8,354 | 4.0 |
| Total Other Expenses | $1,694,845 | $1,880,405 | $1,846,292 | $1,875,819 | $5,810,667 | $12,337 | 5.9% |
| Net Operating Income | $20,436,767 | $20,065,195 | $23,018,973 | $24,411,908 | $20,385,332 | $43,281 | 20.7% |
| Net Cash Flow | $20,436,767 | $20,065,195 | $23,018,973 | $24,411,908 | $20,385,332 | $43,281 | 20.7% |
| (1) | The TTM column represents the trailing twelve months ending June 30, 2014. |
| (2) | Per Room values based on 471 guest night. |
| (3) | % of Total Revenue column represents the line item as a portion of Total Revenue. |
THE INFORMATION IN THIS STRUCTURAL AND COLLATERAL TERM SHEET IS NOT COMPLETE AND MAY BE AMENDED PRIOR TO THE TIME OF SALE. THIS TERM SHEET IS NOT AN OFFER TO SELL THESE SECURITIES AND IT IS NOT A SOLICITATION OF AN OFFER TO BUY THESE SECURITIES IN ANY JURISDICTION WHERE THE OFFER OR SALE IS NOT PERMITTED.
| 115 of 124 | |
| Structural and Collateral Term Sheet | JPMBB 2014-C24 |
[THIS PAGE INTENTIONALLY LEFT BLANK]
THE INFORMATION IN THIS STRUCTURAL AND COLLATERAL TERM SHEET IS NOT COMPLETE AND MAY BE AMENDED PRIOR TO THE TIME OF SALE. THIS TERM SHEET IS NOT AN OFFER TO SELL THESE SECURITIES AND IT IS NOT A SOLICITATION OF AN OFFER TO BUY THESE SECURITIES IN ANY JURISDICTION WHERE THE OFFER OR SALE IS NOT PERMITTED.
| 116 of 124 | |
| Structural and Collateral Term Sheet | JPMBB 2014-C24 | |
Embassy Suites Kennesaw | ||
| Mortgage Loan Information | Property Information | |||
| Mortgage Loan Seller: | JPMCB | Single Asset / Portfolio: | Single Asset | |
Original Principal Balance(1): | $29,500,000 | Title: | Fee | |
Cut-off Date Principal Balance(1): | $29,500,000 | Property Type - Subtype: | Hotel - Full Service | |
| % of Pool by IPB: | 2.3% | Net Rentable Area (Rooms): | 192 | |
| Loan Purpose: | Refinance | Location: | Kennesaw, GA | |
| Borrower: | TownPark Hotel, LLC | Year Built / Renovated: | 2009 / N/A | |
| Sponsor: | Gerald L. Sapp | Occupancy / ADR / RevPAR: | 78.3% / $127.63 / $99.88 | |
Interest Rate(2): | 5.49804% | Occupancy / ADR / RevPAR Date: | 8/31/2014 | |
| Note Date: | 9/9/2014 | Number of Tenants: | N/A | |
| Maturity Date: | 10/1/2019 | 2011 NOI: | $1,978,514 | |
| Interest-only Period: | 12 months | 2012 NOI: | $2,713,245 | |
| Original Term: | 60 months | 2013 NOI: | $2,935,326 | |
Original Amortization(3): | 360 months | TTM NOI (as of 8/2014): | $3,132,772 | |
| Amortization Type: | IO-Balloon | UW Occupancy / ADR / RevPAR: | 78.3% / $127.63 / $99.88 | |
| Call Protection: | L(25),Grtr1%orYM(11),O(24) | UW Revenues: | $7,565,842 | |
| Lockbox: | CMA | UW Expenses: | $4,433,871 | |
| Additional Debt: | Yes | UW NOI: | $3,131,971 | |
Additional Debt Balance(4): | $5,000,000 | UW NCF: | $3,131,971 | |
Additional Debt Type(4): | B-Note | Appraised Value / Per Room: | $43,800,000 / $228,125 | |
| Appraisal Date: | 7/1/2014 | |||
| Escrows and Reserves | Financial Information | ||||||
| Initial | Monthly | Initial Cap | A-Note(1) | Whole Loan | |||
| Taxes: | $48,507 | $24,254 | N/A | Cut-off Date Loan / Room: | $153,646 | $179,688 | |
| Insurance: | $0 | Springing | N/A | Maturity Date Loan / Room: | $146,195 | $170,974 | |
| FF&E Reserves: | $25,005 | 4% of Gross Revenues | N/A | Cut-off Date LTV: | 67.4% | 78.8% | |
| TI/LC: | $0 | $0 | N/A | Maturity Date LTV: | 64.1% | 74.9% | |
| Other: | $0 | $0 | N/A | UW NCF DSCR(5): | 1.60x | 1.24x | |
| UW NOI Debt Yield: | 10.6% | 9.1% | |||||
| Sources and Uses | ||||||
| Sources | Proceeds | % of Total | Uses | Proceeds | % of Total | |
A-Note(1) | $29,500,000 | 84.6% | Payoff Existing Debt | $34,292,402 | 98.3% | |
B-Note(4) | 5,000,000 | 14.3 | Closing Costs | 505,043 | 1.4 | |
| Sponsor Equity | 370,957 | 1.1 | Upfront Reserves | 73,512 | 0.2 | |
| Total Sources | $34,870,957 | 100.0% | Total Uses | $34,870,957 | 100.0% | |
| (1) | Embassy Suites Kennesaw is part of a loan evidenced by one senior note (the “Embassy Suites Kennesaw Mortgage Loan” or “A-Note”) and a subordinate note (the “ESK Companion Loan” or “B-Note”), with an aggregate principal balance of $34,500,000. The A-Note Financial Information presented in the chart above reflects the Cut-off Date balance of the $29.5 million senior portion of the Embassy Suites Kennesaw Whole Loan, but excludes the $5.0 million subordinate ESK Companion Loan. |
| (2) | The Interest Rate is 5.498042372881360% when extended to full precision. |
| (3) | The Embassy Suites Kennesaw Whole Loan is structured with an assumed principal payment schedule based on a 360-month amortization period for the whole loan. See Annex F of the Free Writing Prospectus. |
| (4) | Amounts allocated to the ESK Companion Loan will be payable to the Class ESK Certificates. |
| (5) | The UW NCF DSCR is calculated using the average of principal and interest payments over the first 12 months following the initial interest-only period based on the assumed principal payment schedule provided on Annex F of the Free Writing Prospectus. |
The Loan. The Embassy Suites Kennesaw loan is secured by a mortgage lien on the fee interest in a full service hotel located in Kennesaw, Georgia. The whole loan has an outstanding principal balance of $34.5 million (the “Embassy Suites Kennesaw Whole Loan”), which consists of a $29.5 million Embassy Suites Kennesaw Mortgage Loan and a $5.0 million subordinate B-Note, the ESK Companion Loan. The Embassy Suites Kennesaw Whole Loan has a five-year term, and subsequent to a one-year interest-only period, will amortize on a 30-year schedule. Principal amortization on the Embassy Suites Kennesaw Whole Loan is allocated to the Embassy Suites Kennesaw Mortgage Loan and the ESK Companion Loan, pro rata, prior to certain defaults as set forth in the Free Writing
THE INFORMATION IN THIS STRUCTURAL AND COLLATERAL TERM SHEET IS NOT COMPLETE AND MAY BE AMENDED PRIOR TO THE TIME OF SALE. THIS TERM SHEET IS NOT AN OFFER TO SELL THESE SECURITIES AND IT IS NOT A SOLICITATION OF AN OFFER TO BUY THESE SECURITIES IN ANY JURISDICTION WHERE THE OFFER OR SALE IS NOT PERMITTED.
| 117 of 124 | |
| Structural and Collateral Term Sheet | JPMBB 2014-C24 | |
Embassy Suites Kennesaw | ||
Prospectus. The Embassy Suites Kennesaw Mortgage Loan and the ESK Companion Loan carry an interest rate of 5.498042372881360% and 10.000000%, respectively. The Embassy Suites Kennesaw Whole Loan is an asset of the trust; however, amounts allocated to the Embassy Suites Kennesaw Mortgage Loan will be payable to the pooled certificates and amounts allocated to the ESK Companion Loan will be payable to the Class ESK Certificates, in each case, as reduced as a result of the payment of additional trust fund expenses and certain other fees and expenses payable in accordance with the Pooling and Servicing Agreement. See “Description of the Mortgage Pool—The ESK Whole Loan” in the Free Writing Prospectus. The previously existing debt was securitized in 2012 in the NRF 2012-1 transaction. The borrowing entity for the loan is TownPark Hotel, LLC, a Delaware limited liability company and special purpose entity.
The Sponsor. The loan sponsor and nonrecourse carve-out guarantor is Gerald L. Sapp, the owner and CEO of GS Development, LLC. Based in Tifton, Georgia, GS Development, LLC was established in 1999 and is the parent company to GS Hospitality, LLC and GS Management, LLC. GS Development, LLC, together with its affiliated companies, acquire and manage commercial properties throughout the southern United States. To date, Dr. Sapp has, individually or through partnerships, developed 12 hotel projects with Hilton or Marriott franchises, four retail shopping centers, three build-to-suit restaurants and over 500 self storage units throughout Georgia and Florida. Dr. Sapp currently owns five hotels in Georgia and Florida. The loan sponsor developed the property in 2009 for approximately $43.0 million (approximately $223,958 per key) and the hotel opened in October 2009.
The Property. The Embassy Suites Kennesaw property is a 192-room, full service hotel located in Kennesaw, Georgia, approximately 25 miles northwest of downtown Atlanta. Developed by the loan sponsor in 2009, property amenities include 6,580 square feet of meeting space, a fitness center, an indoor pool, a business center and a Ruth’s Chris Steak House. Ruth’s Chris Steak House serves lunch and dinner as well as provides room service for hotel guests. Ruth’s Chris Steak House has been at the hotel since its opening in 2009 and has a 10-year lease that expires on April 1, 2019 with four, five-year extension options remaining. The property’s 192 two-room suites feature a private bedroom, a living room, a work table, a 37-inch HDTV, mini-refrigerator and microwave. The hotel also offers a complimentary local shuttle that provides transportation to businesses and attractions within six miles of the property. The property is managed by Commonwealth Hotels, LLC. Founded in 1986, Commonwealth Hotels, LLC currently manages over 3,900 rooms in 17 states for hotel franchises that include Hilton, Marriott, Hyatt, Starwood, Choice and Intercontinental Hotels Group.
The property is located in Cobb County, just west of the City of Kennesaw in Georgia and is accessible by both Interstate 75 to the west and Interstate 575 to the east. The property is located off of Chastain Road NW as part of The Village of TownPark, a mixed-use development with 65,000 square feet of retail space, restaurants such as Panera Bread and Five Guys and 40 residential units in the Townpark Village Townhomes complex. The property is also approximately 0.7 miles east of Kennesaw State University’s main campus and approximately one mile from Simon’s Town Center at Cobb. Kennesaw State University is the third largest state university in Georgia with over 24,600 students and the Town Center at Cobb has over 175 stores and is anchored by Macy’s, JCPenney, Sears and Belk. The Embassy Suites Kennesaw property is within walking distance of the Town Park commercial office park, a Class A multi-tenant office park that houses several large employers in Kennesaw including Hapag-Lloyd, Wells Fargo, Impact Partnership, Bank of America and Lowe’s Home Improvement.
The appraisal identified two new hotel developments planned for the Kennesaw market. There is a 96-room Courtyard by Marriott expected to open in December 2015, approximately 3.7 miles southwest of the property, and a 100-room Hampton Inn & Suites is expected to open in July 2015 approximately 0.4 miles west of the property. In the TTM period which ended on August 31, 2014, the Embassy Suites Kennesaw property achieved a RevPar penetration index of 128.5%, with an average RevPAR penetration index of 133.9% from 2011 through 2013, based on year-end data provided by Smith Travel Research and operating statements provided by the borrower.
Historical Occupancy, ADR, RevPAR | |||||||||
Competitive Set(1) | Embassy Suites Kennesaw(2) | Penetration Factor(3) | |||||||
Year | Occupancy | ADR | RevPAR | Occupancy | ADR | RevPAR | Occupancy | ADR | RevPAR |
| 2011 | 62.5% | $95.90 | $59.96 | 66.1% | $116.34 | $76.90 | 105.8% | 121.3% | 128.3% |
| 2012 | 63.7% | $97.18 | $61.91 | 71.0% | $120.30 | $85.45 | 111.5% | 123.8% | 138.0% |
| 2013 | 68.5% | $100.88 | $69.12 | 75.6% | $123.84 | $93.67 | 110.4% | 122.8% | 135.5% |
TTM(4) | 74.4% | $104.40 | $77.70 | 78.3% | $127.63 | $99.88 | 105.2% | 122.3% | 128.5% |
| (1) | Data provided by Smith Travel Research. The competitive set contains the following properties: Holiday Inn Express Atlanta Kennesaw, Residence Inn Atlanta Kennesaw Town Center, Springhill Suites Atlanta Kennesaw, Hilton Garden Inn Atlanta Northwest Kennesaw Town Center, Comfort Suites @ Kennesaw State University and Homewood Suites Atlanta Northwest Kennesaw Town Center. |
| (2) | Based on operating statements provided by the borrower. |
| (3) | Penetration Factor is calculated based on data provided by Smith Travel Research for the competitive set and operating statements for the property provided by the borrower. |
| (4) | TTM represents trailing twelve-month period ending on August 31, 2014. |
THE INFORMATION IN THIS STRUCTURAL AND COLLATERAL TERM SHEET IS NOT COMPLETE AND MAY BE AMENDED PRIOR TO THE TIME OF SALE. THIS TERM SHEET IS NOT AN OFFER TO SELL THESE SECURITIES AND IT IS NOT A SOLICITATION OF AN OFFER TO BUY THESE SECURITIES IN ANY JURISDICTION WHERE THE OFFER OR SALE IS NOT PERMITTED.
| 118 of 124 | |
| Structural and Collateral Term Sheet | JPMBB 2014-C24 | |
Embassy Suites Kennesaw | ||
Competitive Hotels Profile(1) | |||||||||
| 2013 Market Mix | 2013 Estimated Operating Statistics | ||||||||
| Property | Rooms | Year Built | Meeting Space (SF) | Commercial | Meeting & Group | Leisure | Occupancy | ADR | RevPAR |
| Embassy Suites Kennesaw | 192 | 2009 | 6,580 | 60% | 21% | 19% | 75.6% | $123.84 | $93.67 |
| Holiday Inn Express Atlanta-Kennesaw | 147 | 1988 | 1,872 | 60% | 15% | 25% | 68.0% | $97.00 | $65.96 |
| Residence Inn Atlanta Kennesaw/Town Center | 120 | 1997 | 720 | 75% | 5% | 20% | 75.0% | $105.00 | $78.75 |
| SpringHill Suites Atlanta Kennesaw | 90 | 2000 | 364 | 70% | 10% | 20% | 70.0% | $100.00 | $70.00 |
| Hilton Garden Inn Atlanta NW/Kennesaw Town Center | 114 | 2005 | 3,300 | 60% | 20% | 20% | 73.0% | $113.00 | $82.49 |
| Comfort Suites At Kennesaw State University | 70 | 2007 | - | 65% | 5% | 30% | 60.0% | $80.00 | $48.00 |
| Homewood Suites by Hilton Atl NW-Kennesaw | 100 | 2008 | 945 | 75% | 5% | 20% | 75.0% | $105.00 | $78.75 |
Total(2) | 641 | ||||||||
| (1) | Based on the appraisal. |
| (2) | Excludes the subject property. |
Operating History and Underwritten Net Cash Flow(1) | |||||||
| 2011 | 2012 | 2013 | TTM(2) | Underwritten | Per Room(3) | % of Total Revenue(4) | |
| Occupancy | 66.1% | 71.0% | 75.6% | 78.3% | 78.3% | ||
| ADR | $116.34 | $120.30 | $123.84 | $127.63 | $127.63 | ||
RevPAR(5) | $76.90 | $85.45 | $93.67 | $99.88 | $99.88 | ||
| Room Revenue | $5,389,273 | $5,988,242 | $6,564,539 | $6,999,301 | $6,999,301 | $36,455 | 92.5% |
| Food and Beverage | 221,932 | 365,495 | 386,120 | 391,361 | 391,361 | 2,038 | 5.2 |
| Other Department Revenues | 168,291 | 186,038 | 175,053 | 175,180 | 175,180 | 912 | 2.3 |
| Total Revenue | $5,779,496 | $6,539,775 | $7,125,712 | $7,565,842 | $7,565,842 | $39,405 | 100.0% |
| Room Expense | $1,409,022 | $1,479,811 | $1,666,453 | $1,732,515 | $1,732,515 | $9,024 | 24.8% |
| Food and Beverage Expense | 3,562 | 2,239 | 567 | 59 | 59 | 0 | 0.0 |
| Other Departmental Expenses | 55,737 | 62,255 | 77,862 | 82,096 | 82,096 | 428 | 46.9 |
| Departmental Expenses | $1,468,321 | $1,544,305 | $1,744,882 | $1,814,669 | $1,814,669 | $9,451 | 24.0% |
| Departmental Profit | $4,311,175 | $4,995,470 | $5,380,830 | $5,751,173 | $5,751,173 | $29,954 | 76.0% |
| Operating Expenses | $1,586,660 | $1,510,877 | $1,607,972 | $1,732,842 | $1,732,842 | $9,025 | 22.9% |
| Gross Operating Profit | $2,724,515 | $3,484,593 | $3,772,858 | $4,018,330 | $4,018,330 | $20,929 | 53.1% |
| Management Fee | $183,895 | $196,223 | $213,763 | $226,174 | $226,975 | $1,182 | 3.0% |
| Fixed Expenses | 330,926 | 313,534 | 338,741 | 356,750 | 356,750 | 1,858 | 4.7 |
| FF&E | 231,180 | 261,591 | 285,028 | 302,634 | 302,634 | 1,576 | 4.0 |
| Total Other Expenses | $746,001 | $771,348 | $837,532 | $885,558 | $886,359 | $4,616 | 11.7% |
| Net Operating Income | $1,978,514 | $2,713,245 | $2,935,326 | $3,132,772 | $3,131,971 | $16,312 | 41.4% |
Net Cash Flow(5) | $1,978,514 | $2,713,245 | $2,935,326 | $3,132,772 | $3,131,971 | $16,312 | 41.4% |
| (1) | The information provided in the table reflects the cash flow from operations of the hotel. |
| (2) | The TTM column represents the trailing twelve-month period ending on August 31, 2014. |
| (3) | Per Room values are based on 192 rooms. |
| (4) | % of Total Revenue column for Room Expense, Food and Beverage Expense and Other Departmental Expenses is based on their corresponding revenue line item. |
| (5) | The property was built in 2009. Historical RevPAR for 2010 was $62.13 and Net Cash Flow was approximately $1.5 million. |
Franchise Agreement. The Embassy Suites Kennesaw property is subject to a franchise agreement with Promus Hotels, Inc., a subsidiary of Hilton Hotels Corporation, which is set to expire on June 29, 2028 with no extension options. The agreement provides for a contractual monthly program fee equal to 4.0% of gross rooms revenue and a monthly royalty fee equal to 4.0% of gross rooms revenue.
THE INFORMATION IN THIS STRUCTURAL AND COLLATERAL TERM SHEET IS NOT COMPLETE AND MAY BE AMENDED PRIOR TO THE TIME OF SALE. THIS TERM SHEET IS NOT AN OFFER TO SELL THESE SECURITIES AND IT IS NOT A SOLICITATION OF AN OFFER TO BUY THESE SECURITIES IN ANY JURISDICTION WHERE THE OFFER OR SALE IS NOT PERMITTED.
| 119 of 124 | |
| Structural and Collateral Term Sheet | JPMBB 2014-C24 | |
Embassy Suites Kennesaw | ||
Shared Appreciation Agreement. In connection with the previous debt of approximately $33.8 million that was originated in April 2012 and secured by the property, the borrower and an affiliate of the prior lender entered into a shared profit arrangement based on a future sale, transfer or refinancing of the property. In connection with the mortgage loan, an affiliate of the prior lender was repaid in full and released all liens on the property. At origination of the mortgage loan, JPMCB received a signed estoppel and subordination agreement from an affiliate of the prior lender which subordinated the shared appreciation agreement to the lien of the mortgage loan. Under the prior shared appreciation agreement, an affiliate of the prior lender may require the borrower to convert its shared appreciation interests into membership interests in the borrower without the lender’s consent, provided that the lender receives 30 days’ prior written notice that such conversion does not result in a change of control or management of the borrower and the transfer complies with any “know your customer” or OFAC searches required by the lender. See “Description of the Mortgage Pool – Mortgaged Property Considerations—Additional Considerations” in the Free Writing Prospectus for additional information.
THE INFORMATION IN THIS STRUCTURAL AND COLLATERAL TERM SHEET IS NOT COMPLETE AND MAY BE AMENDED PRIOR TO THE TIME OF SALE. THIS TERM SHEET IS NOT AN OFFER TO SELL THESE SECURITIES AND IT IS NOT A SOLICITATION OF AN OFFER TO BUY THESE SECURITIES IN ANY JURISDICTION WHERE THE OFFER OR SALE IS NOT PERMITTED.
| 120 of 124 | |
| Structural and Collateral Term Sheet | JPMBB 2014-C24 | |
Motorola Solutions – Building I & III | ||
| Mortgage Loan Information | Property Information | |||
| Mortgage Loan Seller: | KeyBank | Single Asset / Portfolio: | Single Asset | |
| Original Principal Balance: | $28,000,000 | Title: | Fee | |
| Cut-off Date Principal Balance: | $28,000,000 | Property Type - Subtype: | Office - Suburban | |
| % of Pool by IPB: | 2.2% | Net Rentable Area (SF): | 323,025 | |
| Loan Purpose: | Refinance | Location: | Plantation, FL | |
| Borrower: | 8000 West Sunrise, LLC | Year Built / Renovated: | 1982 / 2014 | |
| Sponsor: | Michael K. Burns | Occupancy: | 100.0% | |
| Interest Rate: | 4.93000% | Occupancy Date: | 9/2/2014 | |
| Note Date: | 9/18/2014 | Number of Tenants: | 1 | |
| Maturity Date: | 10/1/2025 | 2011 NOI(1): | N/A | |
| Interest-only Period: | None | 2012 NOI(1): | N/A | |
| Original Term: | 132 months | 2013 NOI(1): | N/A | |
| Original Amortization: | 360 months | UW Economic Occupancy: | 95.0% | |
| Amortization Type: | Balloon | UW Revenues(2): | $5,110,267 | |
| Call Protection: | L(36),Def(72),O(24) | UW Expenses: | $2,538,936 | |
| Lockbox: | CMA | UW NOI(2): | $2,571,331 | |
| Additional Debt: | N/A | UW NCF(2): | $2,168,087 | |
| Additional Debt Balance: | N/A | Appraised Value / Per SF(3): | $38,850,000 / $120 | |
| Additional Debt Type: | N/A | Appraisal Date(3): | 6/5/2014 | |
| Escrows and Reserves | Financial Information | ||||||
| Initial | Monthly | Initial Cap | Cut-off Date Loan / SF: | $87 | |||
Taxes(4): | $0 | Springing | N/A | Maturity Date Loan / SF: | $69 | ||
Insurance(4): | $0 | Springing | N/A | Cut-off Date LTV: | 72.1% | ||
| Replacement Reserves: | $9,960 | $9,960 | $597,596 | Maturity Date LTV: | 57.4% | ||
TI/LC(5): | $0 | Springing | $5,168,400 | UW NCF DSCR: | 1.21x | ||
| Other: | $0 | $0 | N/A | UW NOI Debt Yield: | 9.2% | ||
| Sources and Uses | ||||||
| Sources | Proceeds | % of Total | Uses | Proceeds | % of Total | |
| Mortgage Loan | $28,000,000 | 81.9% | Payoff Existing Bank Debt | $26,287,283 | 76.9% | |
Bank Loan(6) | 5,751,151 | 16.8 | Payoff Existing Mezz Debt | 7,541,792 | 22.1 | |
| Sponsor Equity | 446,882 | 1.3 | Closing Costs | 358,998 | 1.0 | |
| Upfront Reserves | 9,960 | 0.0 | ||||
| Total Sources | $34,198,033 | 100.0% | Total Uses | $34,198,033 | 100.0% | |
| (1) | Historical financials are not available due to the sponsor acquiring the property through a sale-leaseback from Motorola Solutions, Inc. in October 2013. |
| (2) | UW Revenues, UW NOI and UW NCF assume a straight-line average of contractual rent due under the Motorola Solutions, Inc. lease. Based on the in-place rent, the UW NOI and UW NCF are $2,274,416 and $1,880,325, respectively, and result in an UW NCF DSCR and UW NOI Debt Yield of 1.05x and 8.1%, respectively. Please refer to “Underwritten Net Cash Flow” table below. |
| (3) | The appraisal also concluded an aggregate “Go Dark Value” of approximately $21,570,000 (approximately $67 per square foot). |
| (4) | Monthly collections will commence upon the occurrence of certain conditions, including: (i) the Motorola Solutions, Inc. senior unsecured corporate credit rating falls below “BB+”; (ii) the occurrence of an event of default under the loan; (iii) either the Motorola Solutions, Inc. lease (1) does not require the tenant to pay taxes and insurance premiums directly, and Motorola Solutions, Inc. fails to pay all taxes and insurance premiums prior to their due date, or (2) does not require Motorola Solutions, Inc. to reimburse borrower for all taxes and insurance premiums; (iv) lender does not receive copies of all tax bills and premiums of insurance, as well as satisfactory evidence of payment and (v) the Motorola Solutions, Inc. lease is no longer in full force and effect. |
| (5) | If the Motorola Solutions, Inc. senior unsecured credit rating falls below: (i) “BB+”, monthly collections will commence equal to $13,459 or (ii) “B+”, monthly collections will commence equal to $26,919. Upon the occurrence of (i) Motorola Solutions, Inc. senior unsecured credit rating falls below “B“, (ii) Motorola Solutions, Inc. ceases doing business at or vacates the property (“Go Dark Event”), or (iii) the date that is 36 months prior to the maturity date, all excess cash flow shall be deposited in an excess cash flow reserve fund and held as additional security for the loan. Upon the occurrence of a Go Dark Event, the cash flow sweep will cease when $5,168,400 is deposited in the TI/LC reserve. |
| (6) | The source of funds was used to payoff an existing KeyBank balance sheet loan and third party mezzanine loan which were used to acquire the Motorola Campus in October 2013. Motorola Solutions – Building I & III is not collateral for the Bank Loan. The Bank Loan is secured by the remaining portion of the Motorola Campus. |
THE INFORMATION IN THIS STRUCTURAL AND COLLATERAL TERM SHEET IS NOT COMPLETE AND MAY BE AMENDED PRIOR TO THE TIME OF SALE. THIS TERM SHEET IS NOT AN OFFER TO SELL THESE SECURITIES AND IT IS NOT A SOLICITATION OF AN OFFER TO BUY THESE SECURITIES IN ANY JURISDICTION WHERE THE OFFER OR SALE IS NOT PERMITTED.
| 121 of 124 | |
| Structural and Collateral Term Sheet | JPMBB 2014-C24 | |
Motorola Solutions – Building I & III | ||
The Loan. The Motorola Solutions – Building I & III loan has an outstanding balance of approximately $28.0 million and is secured by a first mortgage lien on a 323,025 square foot suburban office property, located in Plantation, Florida. The loan has an 11-year term and will amortize on a 30-year schedule. The loan sponsor and nonrecourse carveout guarantor is Michael K. Burns. Mr. Burns is the CEO of Torburn Partners, Inc., a commercial real estate firm specializing in assisting and advising large corporations in connection with development, acquisition and management of office and industrial properties. Torburn Partners, Inc.’s current portfolio consists of four industrial and two office properties occupied by credit rated tenants.
The Property. Motorola Solutions – Building I & III is a 323,025 square foot Class B suburban office building with a research and development component, located on 23.4 acres at 8000 West Sunrise Boulevard, Plantation, Florida. The building was constructed in 1982 and is located within a larger office campus containing 77.5 acres known as the Motorola Campus, which includes three additional office buildings totaling 474,354 square feet that are not included as collateral for the Motorola Solutions – Building I & III loan. Motorola, Inc. occupied the entire campus since it was developed in 1982, and the sponsor purchased the entire four-building Motorola Campus from Motorola, Inc. as part of a sale-leaseback in October 2013. Motorola Solutions, Inc. (“MSI”), occupies 100.0% of the net rentable area of Building I & III via a 12-year lease which expires October 31, 2025, with three, five-year extension options. The property contains 935 surface parking spaces and is comprised of 80.0% office space and 20.0% research and development space that MSI utilizes for electronics testing and repair.
As part of the lease executed in October 2013 on Building I & III, MSI is investing approximately $15 million ($46 per square foot) into the space. MSI is a data communications and telecommunications equipment provider headquartered in suburban Chicago that specializes in products and services for public safety, government agencies and commercial enterprises. Such public safety communications range from infrastructure to applications and devices such as radios. MSI utilizes the subject space for the government services division, which had a segment profitability compound annual growth rate of 12.1% from 2007 through 2013 and accounted for approximately 70.0% of MSI’s 2013 revenue.
Several retail centers exist within a short distance of the property including Sawgrass Mills Mall, Westfield Broward, The Fountains, Village Shoppes of Pine Plaza, Sunrise Town Center, and Plantation Promenade. Sawgrass Mills Mall, the largest outlet and value retail shopping destination in the United States, contains over 350 stores that include Bloomingdales, Nike, Tommy Hilfiger, Ralph Lauren, Saks Fifth Avenue OFF 5th, Bed Bath & Beyond, Target, and Marshalls. The Westfield Broward Mall is located two miles from the property and includes such anchors as Sears, Dillard’s, JCPenney, Macy’s, and Regal Cinemas among several other prominent retailers.
The Market. The property is located at 8000 West Sunrise Boulevard in Plantation, Florida, approximately nine miles from Fort Lauderdale and 27 miles from Miami. The property is situated at the intersection of two, six-lane major arterials, West Sunrise Boulevard and North University Drive, which provide access to I-595 to the south, State Road 869 (I-75) to the west, and Florida’s Turnpike to the east, all located within a five-mile radius. The property is located in the Plantation office submarket, which had a vacancy rate of 11.3% with average asking rents of $21.93 per square foot as of the end of the first quarter of 2014. The appraisal identified five comparable leases at properties built between 1983 and 2007. The leases range in size from approximately 25,000 to 80,000 square feet with effective rental rates ranging from $13.40 per square foot to $19.50 per square foot triple net. The appraisal concluded market rent of $12.00 per square foot. The underwritten rent at the property is $9.00 per square foot, which is below the appraiser’s conclusions.
Tenant Summary(1) | |||||
| Tenant | Ratings(2) Moody’s/S&P/Fitch | Net Rentable Area (SF) | % of Total NRA | UW Base Rent PSF(3) | Lease Expiration Date |
| Motorola Solutions, Inc. | Baa2 / BBB / BBB | 323,025 | 100.0% | $9.00 | 10/31/2025 |
| (1) | Based on the underwritten rent roll. |
| (2) | Ratings provided are for the parent company of the entity listed in the “Tenant” field whether or not the parent company guarantees the lease. |
| (3) | UW Base Rent PSF is based on the straight-line contractual rent due under the MSI lease. In-place rent is $8.00 per square foot. |
THE INFORMATION IN THIS STRUCTURAL AND COLLATERAL TERM SHEET IS NOT COMPLETE AND MAY BE AMENDED PRIOR TO THE TIME OF SALE. THIS TERM SHEET IS NOT AN OFFER TO SELL THESE SECURITIES AND IT IS NOT A SOLICITATION OF AN OFFER TO BUY THESE SECURITIES IN ANY JURISDICTION WHERE THE OFFER OR SALE IS NOT PERMITTED.
| 122 of 124 | |
| Structural and Collateral Term Sheet | JPMBB 2014-C24 | |
Motorola Solutions – Building I & III | ||
Underwritten Net Cash Flow(1) | |||
| Underwritten | Per Square Foot | %(2) | |
Rents in Place(3) | $2,906,409 | $9.00 | 54.0% |
| Vacant Income | 0 | 0.00 | 0 |
| Gross Potential Rent | $2,906,409 | $9.00 | 54.0% |
| Total Reimbursements | 2,472,820 | 7.66 | 46.0 |
| Net Rental Income | $5,379,229 | $16.65 | 100.0% |
| (Vacancy/Credit Loss) | (268,961) | (0.83) | (5.0) |
| Other Income | 0 | 0.00 | 0 |
| Effective Gross Income | $5,110,267 | $15.82 | 95.0% |
| Total Expenses | $2,538,936 | $7.86 | 49.7% |
| Net Operating Income | $2,571,331 | $7.96 | 50.3% |
| Total TI/LC, Capex/RR | 403,244 | 1.25 | 7.9 |
| Net Cash Flow | $2,168,087 | $6.71 | 42.4% |
| Occupancy | 95.0% | ||
| (1) | Historical financials are not available due to the loan sponsor acquiring the property through a sale-leaseback from MSI in October 2013. |
| (2) | Percentage column represents percent of Net Rental Income for all revenue lines and represents percent of Effective Gross Income for the remainder of fields. |
| (3) | Underwritten Rents in Place is based on the straight-line average contractual rent due under the MSI lease. Current Rents in Place are $2,584,200 ($8.00 per square foot). |
THE INFORMATION IN THIS STRUCTURAL AND COLLATERAL TERM SHEET IS NOT COMPLETE AND MAY BE AMENDED PRIOR TO THE TIME OF SALE. THIS TERM SHEET IS NOT AN OFFER TO SELL THESE SECURITIES AND IT IS NOT A SOLICITATION OF AN OFFER TO BUY THESE SECURITIES IN ANY JURISDICTION WHERE THE OFFER OR SALE IS NOT PERMITTED.
| 123 of 124 | |
| Structural and Collateral Term Sheet | JPMBB 2014-C24 | |
Contacts | ||
| J.P. Morgan CMBS Capital Markets & Banking | ||
| Contact | Phone Number | |
Kunal Singh Executive Director | kunal.k.singh@jpmorgan.com | (212) 834-5467 |
Brad Horn Vice President | bradley.j.horn@jpmporgan.com | (212) 834-9708 |
| J.P. Morgan CMBS Trading | ||
| Contact | Phone Number | |
Andy Taylor Managing Director | andrew.b.taylor@jpmorgan.com | (212) 834-3813 |
Avinash Sharma Vice President | avinash.sharma@jpmorgan.com | (212) 272-6108 |
| J.P. Morgan Securitized Products Syndicate | ||
| Contact | Phone Number | |
Andy Cherna Managing Director | andy.cherna@jpmorgan.com | (212) 834-4154 |
Mick Wiedrick Executive Director | mick.k.wiedrick@jpmorgan.com | (212) 834-4154 |
| Barclays CMBS Capital Markets & Banking | ||
| Contact | Phone Number | |
Daniel Vinson Managing Director | daniel.vinson@barclays.com | (212) 528-8224 |
Luke Adovasio Vice President | luke.adovasio@barclays.com | (212) 526-5248 |
| Barclays CMBS Trading | ||
| Contact | Phone Number | |
Max Baker Director | max.baker@barclays.com | (212) 412-2084 |
David Kung Director | david.kung@barclays.com | (212) 528-7970 |
| Barclays Securitized Products Syndicate | ||
| Contact | Phone Number | |
Brian Wiele Managing Director | brian.wiele@barclays.com | (212) 412-5780 |
Kenneth Rosenberg Director | kenneth.rosenberg@barclays.com | (212) 412-5780 |
THE INFORMATION IN THIS STRUCTURAL AND COLLATERAL TERM SHEET IS NOT COMPLETE AND MAY BE AMENDED PRIOR TO THE TIME OF SALE. THIS TERM SHEET IS NOT AN OFFER TO SELL THESE SECURITIES AND IT IS NOT A SOLICITATION OF AN OFFER TO BUY THESE SECURITIES IN ANY JURISDICTION WHERE THE OFFER OR SALE IS NOT PERMITTED.
| 124 of 124 | |