UNITED STATES
SECURITIES AND EXCHANGE COMMISSION
Washington, D.C. 20549
| | | | | | | | | | | |
(Mark One)
| | |
| ☒ | QUARTERLY REPORT PURSUANT TO SECTION 13 OR 15(d) OF THE SECURITIES EXCHANGE ACT OF 1934 |
For the quarterly period ended June 29, 2024
OR
| | | | | |
| ☐ | TRANSITION REPORT PURSUANT TO SECTION 13 OR 15(d) OF THE SECURITIES EXCHANGE ACT OF 1934 |
For the transition period from to
Commission file numbers:
001-36873 (Summit Materials, Inc.)
| | |
| SUMMIT MATERIALS, INC. |
|
| (Exact name of registrant as specified in its charter) |
| | | | | | | | |
| Delaware | | 47-1984212 |
| | |
| (State or other jurisdiction of incorporation or organization) | | (I.R.S. Employer Identification No.) |
| 1801 California Street, Suite 3500 | | 80202 |
| Denver, Colorado | | (Zip Code) |
| (Address of principal executive offices) | | |
Registrant's telephone number, including area code: (303) 893-0012
Not Applicable
(Former name, former address and former fiscal year, if changed since last report)
| | | | | | | | | | | | | | |
| Securities registered pursuant to Section 12(b) of the Act: |
| Title of each class | | Trading symbol(s) | | Name of each exchange on which registered |
| Class A Common Stock (par value $.01 per share) | | SUM | | New York Stock Exchange |
| | | | | | | | | | | | | | | | | | | | | | | | | | | | | | | | |
| Indicate by check mark whether the registrant (1) has filed all reports required to be filed by Section 13 or 15(d) of the Securities Exchange Act of 1934 during the preceding 12 months (or for such shorter period that the registrant was required to file such reports), and (2) has been subject to such filing requirements for the past 90 days. |
| Yes | ☒ | No | ☐ | | | | | | |
| Indicate by check mark whether the registrant has submitted electronically every Interactive Data File required to be submitted pursuant to Rule 405 of Regulation S‑T (§232.405 of this chapter) during the preceding 12 months (or for such shorter period that the registrant was required to submit such files). |
| Yes | ☒ | No | ☐ | | | | | | |
| Indicate by check mark whether the registrant is a large accelerated filer, an accelerated filer, a non-accelerated filer, a smaller reporting company, or an emerging growth company. See the definitions of “large accelerated filer,” “accelerated filer,” “smaller reporting company” and “emerging growth company” in Rule 12b-2 of the Exchange Act. |
| | | | | | | | | | |
| Large accelerated filer | ☒ | | | | | Accelerated filer | ☐ | | |
| Non-accelerated filer | ☐ | | | | | Smaller reporting company | ☐ | | |
| | | | | | Emerging growth company | ☐ | | |
| | |
| | | | | | | | | | |
| | | | | | | | | |
| | | | | | | | | |
| | | | | | | | | |
| If an emerging growth company, indicate by check mark if the registrant has elected not to use the extended transition period for complying with any new or revised financial accounting standards provided pursuant to Section 13(a) of the Exchange Act. |
| Indicate by check mark whether the registrant is a shell company (as defined in Rule 12b-2 of the Exchange Act). |
| Yes | ☐ | No | ☒ | | | | | | |
As of August 2, 2024, the number of shares of Summit Materials, Inc.’s outstanding Class A and Class B common stock, par value $0.01 per share for each class, was 175,586,471 and 0, respectively.
EXPLANATORY NOTE
Summit Materials, Inc. a Delaware Corporation ("Summit Inc." and, together with its subsidiaries, "Summit," "we," "us," "our" or "the Company").
Summit Inc. was formed on September 23, 2014 to be a holding company. As of June 29, 2024, it held 100.0% of the economic interest and 100% of the voting rights of Summit Materials Holdings L.P., a Delaware limited partnership (“Summit Holdings”), which is the indirect parent of Summit Materials, LLC ("Summit LLC"). Summit LLC is a co-issuer of our outstanding 6 1/2 % senior notes due 2027 (“2027 Notes”), our 5 1/4% senior notes due 2029 (“2029 Notes”) and our 7 1/4% senior notes due 2031 (“2031 Notes” collectively with the 2027 Notes and 2029 Notes, the “Senior Notes”) and borrower under our senior credit facilities. Summit Inc. controls all of the business and affairs of Summit Holdings and, in turn, Summit LLC.
CAUTIONARY NOTE REGARDING FORWARD-LOOKING STATEMENTS
This report includes “forward-looking statements” within the meaning of the federal securities laws, which involve risks and uncertainties. Forward-looking statements include all statements that do not relate solely to historical or current facts, and you can identify forward-looking statements because they contain words such as “believes,” “expects,” “may,” “will,” “should,” “seeks,” “intends,” “trends,” “plans,” “estimates,” “projects” or “anticipates” or similar expressions that concern our strategy, plans, expectations or intentions. All statements made relating to our estimated and projected earnings, margins, costs, expenditures, cash flows, growth rates and financial results are forward-looking statements. These forward-looking statements are subject to risks, uncertainties and other factors that may cause our actual results, performance or achievements to be materially different from future results, performance or achievements expressed or implied by such forward-looking statements. We derive many of our forward-looking statements from our operating budgets and forecasts, which are based upon many detailed assumptions. While we believe that our assumptions are reasonable, it is very difficult to predict the effect of known factors, and, of course, it is impossible to anticipate all factors that could affect our actual results. In light of the significant uncertainties inherent in the forward-looking statements included herein, the inclusion of such information should not be regarded as a representation by us or any other person that the results or conditions described in such statements or our objectives and plans will be realized. Important factors could affect our results and could cause results to differ materially from those expressed in our forward-looking statements, including but not limited to the factors discussed in the section entitled “Risk Factors” in Summit Inc.’s Annual Report on Form 10-K for the fiscal year ended December 30, 2023 (the “Annual Report”), as filed with the Securities and Exchange Commission (the “SEC”), the factors discussed in the section entitled “Risk Factors” of this report and the following:
•our dependence on the construction industry and the strength of the local economies in which we operate, including residential;
•the cyclical nature of our business;
•risks related to weather and seasonality;
•risks associated with our capital-intensive business;
•competition within our local markets;
•risks related to the integration of Argos USA and realization of intended benefits within the intended timeframe;
•our ability to execute on our acquisition strategy and portfolio optimization strategy and, successfully integrate acquisitions with our existing operations;
•our dependence on securing and permitting aggregate reserves in strategically located areas;
•the impact of rising interest rates;
•declines in public infrastructure construction and delays or reductions in governmental funding, including the funding by transportation authorities, the federal government and other state agencies particularly;
•our reliance on private investment in infrastructure, which may be adversely affected by periods of economic stagnation and recession;
•environmental, health, and safety laws or governmental requirements or policies concerning zoning and land use;
•rising prices for, or more limited availability of, commodities, labor and other production and delivery inputs as a result of inflation, supply chain challenges or otherwise;
•our ability to accurately estimate the overall risks, requirements or costs when we bid on or negotiate contracts that are ultimately awarded to us;
•material costs and losses as a result of claims that our products do not meet regulatory requirements or contractual specifications;
•cancellation of a significant number of contracts or our disqualification from bidding for new contracts;
•special hazards related to our operations that may cause personal injury or property damage not covered by insurance;
•unexpected factors affecting self-insurance claims and reserve estimates;
•our current level of indebtedness, including our exposure to variable interest rate risk;
•potential incurrence of substantially more debt;
•restrictive covenants in the instruments governing our debt obligations;
•our dependence on senior management and other key personnel, and our ability to retain and attract qualified personnel;
•supply constraints or significant price fluctuations in the coal, electricity, diesel fuel, natural gas, liquid asphalt and other petroleum‑based resources that we use;
•climate change and climate change legislation or other regulations;
•evolving corporate governance and corporate disclosure regulations and expectations, including with respect to environmental, social and governance matters;
•unexpected operational failures or difficulties;
•costs associated with pending and future litigation;
•interruptions in our information technology systems and infrastructure, including cybersecurity and data leakage risks;
•potential labor disputes, strikes, other forms of work stoppage or other union activities; and
•material or adverse effects related to the Argos USA combination.
All subsequent written and oral forward-looking statements attributable to us, or persons acting on our behalf, are expressly qualified in their entirety by these cautionary statements.
Any forward-looking statement that we make herein speaks only as of the date of this report. We undertake no obligation to publicly update or revise any forward-looking statement as a result of new information, future events or otherwise, except as required by law.
SUMMIT MATERIALS, INC.
FORM 10-Q
TABLE OF CONTENTS
| | | | | | | | |
| | | Page No. |
PART I—Financial Information |
| | | |
| | |
| | | |
| | | |
| | | |
| | | |
| | | |
| | | |
| | | |
| | | |
| | | |
| | | |
| | | |
| | | |
| | | |
| | |
| | |
| | |
| | | |
| | |
| | | |
| | |
| | | |
PART II — Other Information |
| | | |
| | |
| | | |
| | |
| | | |
| | |
| | | |
| | |
| | | |
| | |
| | | |
| | |
| | | |
| | |
| | |
| |
PART I—FINANCIAL INFORMATION
ITEM 1. FINANCIAL STATEMENTS
SUMMIT MATERIALS, INC. AND SUBSIDIARIES
Consolidated Balance Sheets
(In thousands, except share and per share amounts)
| | | | | | | | | | | |
| | June 29, 2024 | | December 30, 2023 |
| | (unaudited) | | (audited) |
| Assets | | | |
| Current assets: | | | |
| Cash and cash equivalents | $ | 538,708 | | | $ | 374,162 | |
| Restricted cash | — | | | 800,000 | |
| Accounts receivable, net | 550,093 | | | 287,252 | |
| Costs and estimated earnings in excess of billings | 33,948 | | | 10,289 | |
| Inventories | 349,099 | | | 241,350 | |
| Other current assets | 28,461 | | | 17,937 | |
| Current assets held for sale | 446 | | | 1,134 | |
| Total current assets | 1,500,755 | | | 1,732,124 | |
| Property, plant and equipment, less accumulated depreciation, depletion and amortization (June 29, 2024 - $1,509,453 and December 30, 2023 - $1,399,468) | 4,354,088 | | | 1,976,820 | |
| Goodwill | 2,093,010 | | | 1,224,861 | |
| Intangible assets, less accumulated amortization (June 29, 2024 - $39,586 and December 30, 2023 - $18,972) | 168,282 | | | 68,081 | |
| Deferred tax assets, less valuation allowance (June 29, 2024 - $1,113 and December 30, 2023 - $1,113) | — | | | 52,009 | |
| Operating lease right-of-use assets | 89,360 | | | 36,553 | |
| Other assets | 108,497 | | | 59,134 | |
| Total assets | $ | 8,313,992 | | | $ | 5,149,582 | |
| Liabilities and Stockholders’ Equity | | | |
| Current liabilities: | | | |
| Current portion of debt | $ | 7,575 | | | $ | 3,822 | |
| Current portion of acquisition-related liabilities | 8,987 | | | 7,007 | |
| Accounts payable | 282,091 | | | 123,621 | |
| Accrued expenses | 250,355 | | | 171,691 | |
| Current operating lease liabilities | 17,217 | | | 8,596 | |
| Billings in excess of costs and estimated earnings | 7,635 | | | 8,228 | |
| Total current liabilities | 573,860 | | | 322,965 | |
| Long-term debt | 2,771,463 | | | 2,283,639 | |
| Acquisition-related liabilities | 21,217 | | | 28,021 | |
| Tax receivable agreement liability | 47,667 | | | 41,276 | |
| Deferred tax liabilities | 189,138 | | | 15,854 | |
| Noncurrent operating lease liabilities | 77,326 | | | 33,230 | |
| Other noncurrent liabilities | 300,577 | | | 108,017 | |
| Total liabilities | 3,981,248 | | | 2,833,002 | |
| Commitments and contingencies (see note 12) | | | |
| Stockholders’ equity: | | | |
| Class A common stock, par value $0.01 per share; 1,000,000,000 shares authorized, 175,586,471 and 119,529,380 shares issued and outstanding as of June 29, 2024 and December 30, 2023, respectively | 1,757 | | | 1,196 | |
| Class B common stock, par value $0.01 per share; 250,000,000 shares authorized, 0 and 99 shares issued and outstanding as of June 29, 2024 and December 30, 2023, respectively | — | | | — | |
| Preferred Stock, par value $0.01 per share; 250,000,000 shares authorized, 1 and 0 shares issued and outstanding as of June 29, 2024 and December 30, 2023, respectively | — | | | — | |
| Additional paid-in capital | 3,412,879 | | | 1,421,813 | |
| Accumulated earnings | 915,960 | | | 876,751 | |
| Accumulated other comprehensive income | 2,148 | | | 7,275 | |
| Stockholders’ equity | 4,332,744 | | | 2,307,035 | |
| Noncontrolling interest in Summit Holdings | — | | | 9,545 | |
| Total stockholders’ equity | 4,332,744 | | | 2,316,580 | |
| Total liabilities and stockholders’ equity | $ | 8,313,992 | | | $ | 5,149,582 | |
See notes to unaudited consolidated financial statements.
SUMMIT MATERIALS, INC. AND SUBSIDIARIES
Unaudited Consolidated Statements of Operations
(In thousands, except share and per share amounts)
| | | | | | | | | | | | | | | | | | | | | | | |
| | Three months ended | | Six months ended |
| | June 29, 2024 | | July 1, 2023 | | June 29, 2024 | | July 1, 2023 |
| Revenue: | | | | | | | |
| Product | $ | 993,741 | | | $ | 595,714 | | | $ | 1,722,435 | | | $ | 967,886 | |
| Service | 81,730 | | | 84,659 | | | 126,265 | | | 119,757 | |
| Net revenue | 1,075,471 | | | 680,373 | | | 1,848,700 | | | 1,087,643 | |
| Delivery and subcontract revenue | 42,791 | | | 48,777 | | | 74,577 | | | 76,895 | |
| Total revenue | 1,118,262 | | | 729,150 | | | 1,923,277 | | | 1,164,538 | |
| Cost of revenue (excluding items shown separately below): | | | | | | | |
| Product | 650,088 | | | 377,634 | | | 1,206,108 | | | 673,515 | |
| Service | 57,130 | | | 65,992 | | | 93,335 | | | 96,030 | |
| Net cost of revenue | 707,218 | | | 443,626 | | | 1,299,443 | | | 769,545 | |
| Delivery and subcontract cost | 42,791 | | | 48,777 | | | 74,577 | | | 76,895 | |
| Total cost of revenue | 750,009 | | | 492,403 | | | 1,374,020 | | | 846,440 | |
| General and administrative expenses | 83,875 | | | 53,838 | | | 152,401 | | | 99,836 | |
| Depreciation, depletion, amortization and accretion | 104,397 | | | 54,787 | | | 200,368 | | | 105,681 | |
| Transaction and integration costs | 10,265 | | | 1,712 | | | 72,473 | | | 2,076 | |
| Gain on sale of property, plant and equipment | (3,180) | | | (3,223) | | | (4,028) | | | (3,653) | |
| Operating income | 172,896 | | | 129,633 | | | 128,043 | | | 114,158 | |
| Interest expense | 52,849 | | | 27,902 | | | 104,741 | | | 55,322 | |
| Loss on debt financings | — | | | — | | | 5,453 | | | 493 | |
| | | | | | | |
| Gain on sale of businesses | (3,758) | | | — | | | (18,743) | | | — | |
| Other income, net | (8,086) | | | (5,478) | | | (16,964) | | | (11,188) | |
| Income from operations before taxes | 131,891 | | | 107,209 | | | 53,556 | | | 69,531 | |
| Income tax expense | 25,816 | | | 22,481 | | | 14,751 | | | 16,015 | |
| Net income | 106,075 | | | 84,728 | | | 38,805 | | | 53,516 | |
| | | | | | | |
| Net income (loss) attributable to noncontrolling interest in Summit Holdings | — | | | 1,091 | | | (404) | | | 683 | |
| Net income attributable to Summit Inc. | $ | 106,075 | | | $ | 83,637 | | | $ | 39,209 | | | $ | 52,833 | |
| Earnings per share of Class A common stock: | | | | | | | |
| Basic | $ | 0.60 | | | $ | 0.70 | | | $ | 0.23 | | | $ | 0.44 | |
| Diluted | $ | 0.60 | | | $ | 0.70 | | | $ | 0.23 | | | $ | 0.44 | |
| Weighted average shares of Class A common stock: | | | | | | | |
| Basic | 175,550,487 | | | 118,931,914 | | | 171,531,031 | | | 118,805,785 | |
| Diluted | 176,132,001 | | | 119,393,709 | | | 172,308,044 | | | 119,431,604 | |
See notes to unaudited consolidated financial statements.
SUMMIT MATERIALS, INC. AND SUBSIDIARIES
Unaudited Consolidated Statements of Comprehensive Income
(In thousands)
| | | | | | | | | | | | | | | | | | | | | | | |
| | Three months ended | | Six months ended |
| | June 29, 2024 | | July 1, 2023 | | June 29, 2024 | | July 1, 2023 |
| Net income | $ | 106,075 | | | $ | 84,728 | | | $ | 38,805 | | | $ | 53,516 | |
| Other comprehensive income (loss): | | | | | | | |
| Foreign currency translation adjustment | (2,015) | | | 3,902 | | | (6,739) | | | 4,105 | |
| | | | | | | |
| Less tax effect of other comprehensive income (loss) items | 473 | | | (779) | | | 1,612 | | | (818) | |
| Other comprehensive (loss) income | (1,542) | | | 3,123 | | | (5,127) | | | 3,287 | |
| Comprehensive income | 104,533 | | | 87,851 | | | 33,678 | | | 56,803 | |
| Less comprehensive income (loss) attributable to Summit Holdings | — | | | 1,133 | | | (404) | | | 728 | |
| Comprehensive income attributable to Summit Inc. | $ | 104,533 | | | $ | 86,718 | | | $ | 34,082 | | | $ | 56,075 | |
See notes to unaudited consolidated financial statements.
SUMMIT MATERIALS, INC. AND SUBSIDIARIES
Unaudited Consolidated Statements of Cash Flows
(In thousands)
| | | | | | | | | | | |
| | Six months ended |
| | June 29, 2024 | | July 1, 2023 |
| Cash flows from operating activities: | | | |
| Net income | $ | 38,805 | | | $ | 53,516 | |
| Adjustments to reconcile net income to net cash provided by operating activities: | | | |
| Depreciation, depletion, amortization and accretion | 206,668 | | | 110,659 | |
| Share-based compensation expense | 14,133 | | | 9,924 | |
| Net gain on asset and business disposals | (22,773) | | | (3,655) | |
| Non-cash loss on debt financings | 5,453 | | | 161 | |
| Change in deferred tax asset, net | 2,976 | | | 9,350 | |
| Other | 1,163 | | | (21) | |
| Decrease (increase) in operating assets, net of acquisitions and dispositions: | | | |
| Accounts receivable, net | (104,579) | | | (101,119) | |
| Inventories | (11,552) | | | (27,115) | |
| Costs and estimated earnings in excess of billings | (24,076) | | | (28,760) | |
| Other current assets | 2,509 | | | (1,070) | |
| Other assets | 3,922 | | | 1,732 | |
| (Decrease) increase in operating liabilities, net of acquisitions and dispositions: | | | |
| Accounts payable | 7,700 | | | 52,157 | |
| Accrued expenses | (4,584) | | | 19,048 | |
| Billings in excess of costs and estimated earnings | (144) | | | 1,299 | |
| Tax receivable agreement (benefit) expense | 6,227 | | | (531) | |
| Other liabilities | (10,444) | | | (1,533) | |
| Net cash provided by operating activities | 111,404 | | | 94,042 | |
| Cash flows from investing activities: | | | |
| Acquisitions, net of cash acquired | (1,113,267) | | | (237,666) | |
| Purchase of intellectual property | (21,400) | | | — | |
| Purchases of property, plant and equipment | (175,960) | | | (126,893) | |
| Proceeds from the sale of property, plant and equipment | 14,217 | | | 5,760 | |
| Proceeds from sale of businesses | 86,031 | | | — | |
| Other | (2,070) | | | (1,852) | |
| Net cash used in investing activities | (1,212,449) | | | (360,651) | |
| Cash flows from financing activities: | | | |
| Proceeds from debt issuances | 1,007,475 | | | — | |
| Debt issuance costs | (17,731) | | | (1,566) | |
| Payments on debt | (509,765) | | | (6,720) | |
| | | |
| Payments on acquisition-related liabilities | (6,289) | | | (11,539) | |
| | | |
| | | |
| Proceeds from stock option exercises | 1,580 | | | 84 | |
| Other | (8,088) | | | (4,838) | |
| Net cash provided by (used in) financing activities | 467,182 | | | (24,579) | |
| Impact of foreign currency on cash | (1,591) | | | 747 | |
| Net decrease in cash and cash equivalents and restricted cash | (635,454) | | | (290,441) | |
| Cash and cash equivalents and restricted cash—beginning of period | 1,174,162 | | | 520,451 | |
| Cash and cash equivalents and restricted cash—end of period | $ | 538,708 | | | $ | 230,010 | |
See notes to unaudited consolidated financial statements.
SUMMIT MATERIALS, INC. AND SUBSIDIARIES
Unaudited Consolidated Statements of Changes in Stockholders’ Equity
(In thousands, except share amounts)
| | | | | | | | | | | | | | | | | | | | | | | | | | | | | | | | | | | | | | | | | | | | | | | | | | | | | |
| | Summit Materials, Inc. | | |
| | | | Accumulated | | | | | | | | | | | | | | |
| | | Other | | Class A | | Class B | | Additional | | Noncontrolling | | Total |
| Accumulated | | Comprehensive | | Common Stock | | Common Stock | | Paid-in | | Interest in | | Stockholders’ |
| | Earnings | | income | | Shares | | Dollars | | Shares | | Dollars | | Capital | | Summit Holdings | | Equity |
| Balance - December 30, 2023 | $ | 876,751 | | | $ | 7,275 | | | 119,529,380 | | | $ | 1,196 | | | 99 | | | $ | — | | | $ | 1,421,813 | | | $ | 9,545 | | | $ | 2,316,580 | |
| | | | | | | | | | | | | | | | | |
| | | | | | | | | | | | | | | | | |
| | | | | | | | | | | | | | | | | |
| | | | | | | | | | | | | | | | | |
| | | | | | | | | | | | | | | | | |
| | | | | | | | | | | | | | | | | |
| | | | | | | | | | | | | | | | | |
| Net loss | (66,866) | | | — | | | — | | | — | | | — | | | — | | | — | | | (404) | | | (67,270) | |
| LP Unit exchanges | — | | | — | | | 763,243 | | | 8 | | | — | | | — | | | 9,534 | | | (9,542) | | | — | |
| Other comprehensive loss, net of tax | — | | | (3,585) | | | — | | | — | | | — | | | — | | | — | | | — | | | (3,585) | |
| Stock option exercises | — | | | — | | | 29,216 | | | — | | | — | | | — | | | 593 | | | — | | | 593 | |
| Class B share cancellation | — | | | — | | | — | | | — | | | (99) | | | — | | | — | | | — | | | — | |
| Share-based compensation | — | | | — | | | — | | | — | | | — | | | — | | | 6,720 | | | — | | | 6,720 | |
| Issuance of Class A Shares | — | | | — | | | 54,720,000 | | | 547 | | | — | | | — | | | 1,973,203 | | | — | | | 1,973,750 | |
| | | | | | | | | | | | | | | | | |
| | | | | | | | | | | | | | | | | |
| Shares redeemed to settle taxes and other | — | | | — | | | 412,411 | | | 4 | | | — | | | — | | | (8,556) | | | 401 | | | (8,151) | |
| Balance — March 30, 2024 | $ | 809,885 | | | $ | 3,690 | | | 175,454,250 | | | $ | 1,755 | | | — | | | $ | — | | | $ | 3,403,307 | | | $ | — | | | $ | 4,218,637 | |
| | | | | | | | | | | | | | | | | |
| | | | | | | | | | | | | | | | | |
| | | | | | | | | | | | | | | | | |
| | | | | | | | | | | | | | | | | |
| | | | | | | | | | | | | | | | | |
| | | | | | | | | | | | | | | | | |
| | | | | | | | | | | | | | | | | |
| | | | | | | | | | | | | | | | | |
| | | | | | | | | | | | | | | | | |
| Net income | 106,075 | | | — | | | — | | | — | | | — | | | — | | | — | | | — | | | 106,075 | |
| | | | | | | | | | | | | | | | | |
| Other comprehensive loss, net of tax | — | | | (1,542) | | | — | | | — | | | — | | | — | | | — | | | — | | | (1,542) | |
| Stock option exercises | — | | | — | | | 54,272 | | | 1 | | | — | | | — | | | 986 | | | — | | | 987 | |
| | | | | | | | | | | | | | | | | |
| Share-based compensation | — | | | — | | | — | | | — | | | — | | | — | | | 7,413 | | | — | | | 7,413 | |
| | | | | | | | | | | | | | | | | |
| | | | | | | | | | | | | | | | | |
| | | | | | | | | | | | | | | | | |
| Shares redeemed to settle taxes and other | — | | | — | | | 77,949 | | | 1 | | | — | | | — | | | 1,173 | | | — | | | 1,174 | |
| Balance - June 29, 2024 | $ | 915,960 | | | $ | 2,148 | | | 175,586,471 | | | $ | 1,757 | | | — | | | $ | — | | | $ | 3,412,879 | | | $ | — | | | $ | 4,332,744 | |
| | | | | | | | | | | | | | | | | |
| | | | | | | | | | | | | | | | | |
| | | | | | | | | | | | | | | | | |
| | | | | | | | | | | | | | | | | |
| | | | | | | | | | | | | | | | | |
| | | | | | | | | | | | | | | | | |
| | | | | | | | | | | | | | | | | |
| | | | | | | | | | | | | | | | | |
| | | | | | | | | | | | | | | | | |
| | | | | | | | | | | | | | | | | |
| | | | | | | | | | | | | | | | | |
| | | | | | | | | | | | | | | | | |
| | | | | | | | | | | | | | | | | |
| | | | | | | | | | | | | | | | | |
| | | | | | | | | | | | | | | | | |
| | | | | | | | | | | | | | | | | |
| | | | | | | | | | | | | | | | | |
| | | | | | | | | | | | | | | | | |
| | | | | | | | | | | | | | | | | |
| | | | | | | | | | | | | | | | | |
| | | | | | | | | | | | | | | | | |
| | | | | | | | | | | | | | | | | |
| | | | | | | | | | | | | | | | | |
| | | | | | | | | | | | | | | | | |
| | | | | | | | | | | | | | | | | |
| | | | | | | | | | | | | | | | | |
| | | | | | | | | | | | | | | | | |
| | | | | | | | | | | | | | | | | |
| | | | | | | | | | | | | | | | | |
| | | | | | | | | | | | | | | | | | | | | | | | | | | | | | | | | | | | | | | | | | | | | | | | | | | | | |
| | | | | | | | | | | | | | | | | |
| Summit Materials, Inc. | | |
| | | Accumulated | | | | | | | | | | | | | | |
| | | Other | | Class A | | Class B | | Additional | | Noncontrolling | | Total |
| Accumulated | | Comprehensive | | Common Stock | | Common Stock | | Paid-in | | Interest in | | Stockholders’ |
| Earnings | | income | | Shares | | Dollars | | Shares | | Dollars | | Capital | | Summit Holdings | | Equity |
| Balance — December 31, 2022 | $ | 590,895 | | | $ | 3,084 | | | 118,408,655 | | | $ | 1,185 | | | 99 | | | $ | — | | | $ | 1,404,122 | | | $ | 12,704 | | | $ | 2,011,990 | |
| Net loss | (30,804) | | | — | | | — | | | — | | | — | | | — | | | — | | | (408) | | | (31,212) | |
| LP Unit exchanges | — | | | — | | | 2,000 | | | — | | | — | | | — | | | 21 | | | (21) | | | — | |
| Other comprehensive income, net of tax | — | | | 161 | | | — | | | — | | | — | | | — | | | — | | | 3 | | | 164 | |
| Stock option exercises | — | | | — | | | 902 | | | — | | | — | | | — | | | 15 | | | — | | | 15 | |
| Share-based compensation | — | | | — | | | — | | | — | | | — | | | — | | | 4,708 | | | — | | | 4,708 | |
| | | | | | | | | | | | | | | | | |
| | | | | | | | | | | | | | | | | |
| Shares redeemed to settle taxes and other | — | | | — | | | 407,114 | | | 4 | | | — | | | — | | | (5,680) | | | (43) | | | (5,719) | |
| Balance — April 1, 2023 | $ | 560,091 | | | $ | 3,245 | | | 118,818,671 | | | $ | 1,189 | | | 99 | | | $ | — | | | $ | 1,403,186 | | | $ | 12,235 | | | $ | 1,979,946 | |
| Net income | 83,637 | | | — | | | — | | | — | | | — | | | — | | | — | | | 1,091 | | | 84,728 | |
| | | | | | | | | | | | | | | | | |
| Other comprehensive income, net of tax | — | | | 3,081 | | | — | | | — | | | — | | | — | | | — | | | 42 | | | 3,123 | |
| Stock option exercises | — | | | — | | | 3,338 | | | — | | | — | | | — | | | 69 | | | — | | | 69 | |
| Share-based compensation | — | | | — | | | — | | | — | | | — | | | — | | | 5,216 | | | — | | | 5,216 | |
| | | | | | | | | | | | | | | | | |
| Shares redeemed to settle taxes and other | — | | | — | | | 64,265 | | | 1 | | | — | | | — | | | 893 | | | (12) | | | 882 | |
| Balance — July 1, 2023 | $ | 643,728 | | | $ | 6,326 | | | 118,886,274 | | | $ | 1,190 | | | 99 | | | $ | — | | | $ | 1,409,364 | | | $ | 13,356 | | | $ | 2,073,964 | |
| | | | | | | | | | | | | | | | | |
| | | | | | | | | | | | | | | | | |
| | | | | | | | | | | | | | | | | |
| | | | | | | | | | | | | | | | | |
| | | | | | | | | | | | | | | | | |
| | | | | | | | | | | | | | | | | |
| | | | | | | | | | | | | | | | | |
| | | | | | | | | | | | | | | | | |
| | | | | | | | | | | | | | | | | |
See notes to unaudited consolidated financial statements.
SUMMIT MATERIALS, INC. AND SUBSIDIARIES
NOTES TO UNAUDITED CONSOLIDATED FINANCIAL STATEMENTS
(Dollars in tables in thousands, except per share amounts or otherwise noted)
1.SUMMARY OF ORGANIZATION AND SIGNIFICANT ACCOUNTING POLICIES
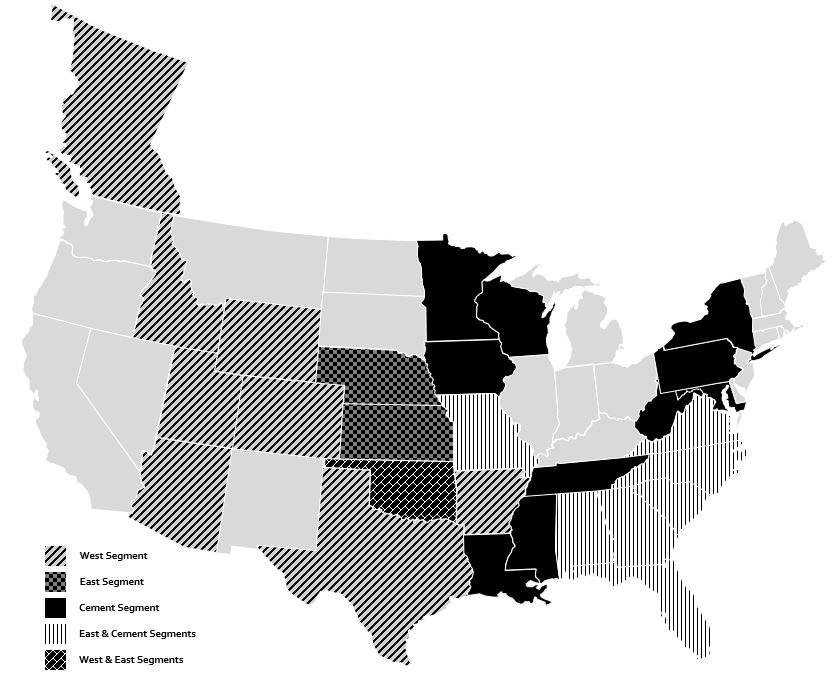
Summit Materials, Inc. ("Summit Inc." and together with its subsidiaries, "Summit," "we," "our" or the Company") is a vertically-integrated construction materials company. The Company is engaged in the production and sale of aggregates, cement, ready-mix concrete, asphalt paving mix and concrete products and owns and operates quarries, sand and gravel pits, six cement plants, cement distribution terminals, ready-mix concrete plants, asphalt plants and landfill sites. It is also engaged in paving and related services. The Company’s three operating and reporting segments are the West, East and Cement segments.
Substantially all of the Company’s construction materials, products and services are produced, consumed and performed outdoors, primarily in the spring, summer and fall. Seasonal changes and other weather-related conditions can affect the production and sales volumes of its products and delivery of services. Therefore, the financial results for any interim period are typically not indicative of the results expected for the full year. Furthermore, the Company’s sales and earnings are sensitive to national, regional and local economic conditions, weather conditions and to cyclical changes in construction spending, among other factors.
On September 23, 2014, Summit Inc. was formed as a Delaware corporation to be a holding company. As of March 30, 2024, Summit Inc. held 100% of the economic interests and voting power of Summit Materials Holdings L.P. (“Summit Holdings”). Pursuant to a reorganization into a holding company structure (the “Reorganization”) consummated in connection with Summit Inc.’s March 2015 initial public offering ("IPO"), Summit Inc. became a holding corporation operating and controlling all of the business and affairs of Summit Holdings and its subsidiaries. Summit Inc. directly and indirectly owns all of the partnership interests of Summit Holdings (see note 9, Stockholders’ Equity). Summit Materials, LLC (“Summit LLC”) an indirect wholly owned subsidiary of Summit Holdings, conducts the majority of our operations. Summit Materials Finance Corp. (“Summit Finance”), an indirect wholly owned subsidiary of Summit LLC, has jointly issued our Senior Notes as described below.
On January 12, 2024, Summit completed a combination with Argos North America Corp. ("Argos USA"), Cementos Argos S.A. ("Cementos Argos"), Argos SEM LLC and Valle Cement Investments, Inc. (the "Argos Parties," and together with Argos USA, "Argos"), pursuant to which Summit acquired all of the outstanding equity interests (the "Transaction") of Argos USA from the Argos SEM LLC and Valle Cement Investments, Inc. in exchange for $1.2 billion of cash, the issuance of 54,720,000 shares of the Summit Inc.'s Class A common stock and one preferred share in a transaction valued at approximately $3.1 billion. The cash consideration was funded from the net proceeds of an $800 million offering of Senior Notes due 2031 and new term loan borrowings under our current credit facility. The purchase price is subject to customary adjustments, with any upward or downward adjustments made against the cash consideration. The Transaction Agreement, dated as of September 7, 2023, contains customary representations and warranties, covenants and agreements, including a Stockholder Agreement. For additional details related to the Transaction, see Note 2, Acquisitions, Dispositions, Goodwill and Intangibles.
Basis of Presentation—These unaudited consolidated financial statements were prepared in accordance with U.S. generally accepted accounting principles (“U.S. GAAP”) for interim financial information, without audit, pursuant to the rules and regulations of the Securities and Exchange Commission (“SEC”). Certain information and footnote disclosures typically included in financial statements prepared in accordance with U.S. GAAP have been condensed or omitted pursuant to such rules and regulations. These unaudited consolidated financial statements should be read in conjunction with the Company's audited consolidated financial statements and the notes thereto as of and for the year ended December 30, 2023. The Company continues to follow the accounting policies set forth in those audited consolidated financial statements.
Management believes that these consolidated interim financial statements include all adjustments, normal and recurring in nature, that are necessary to present fairly the financial position of the Company as of June 29, 2024, the results of operations for the three and six months ended June 29, 2024 and July 1, 2023 and cash flows for the six months ended June 29, 2024 and July 1, 2023.
Principles of Consolidation—The consolidated financial statements include the accounts of Summit Inc. and its majority owned subsidiaries. All intercompany balances and transactions have been eliminated.
For a summary of the changes in Summit Inc.’s ownership of Summit Holdings, see Note 9, Stockholders’ Equity.
Use of Estimates—Preparation of these consolidated financial statements in conformity with U.S. GAAP requires management to make estimates and assumptions. These estimates and the underlying assumptions affect the amounts of assets and liabilities reported, disclosures about contingent assets and liabilities and reported amounts of revenue and expenses. Such estimates include the valuation of accounts receivable, inventories, valuation of deferred tax assets, goodwill, intangibles and other long-lived assets, tax receivable agreement ("TRA") liability, pension and other postretirement obligations and asset retirement obligations. Estimates also include revenue earned on contracts and costs to complete contracts. Most of the Company’s paving and related services are performed under fixed unit-price contracts with state and local governmental entities. Management regularly evaluates its estimates and assumptions based on historical experience and other factors, including the current economic environment. As future events and their effects cannot be determined with precision, actual results can differ significantly from estimates made. Changes in estimates, including those resulting from continuing changes in the economic environment, are reflected in the Company’s consolidated financial statements when the change in estimate occurs.
Business and Credit Concentrations—The Company’s operations are conducted primarily across 24 U.S. states and in British Columbia, Canada, with the most significant revenue generated in Texas, Florida, Missouri, Georgia, Utah, and Kansas. The Company’s accounts receivable consist primarily of amounts due from customers within these areas. Therefore, collection of these accounts is dependent on the economic conditions in the aforementioned states, as well as specific situations affecting individual customers. Credit granted within the Company’s trade areas has been granted to many customers, and management does not believe that a significant concentration of credit exists with respect to any individual customer or group of customers. No single customer accounted for more than 10% of the Company’s total revenue in the three and six months ended June 29, 2024 or July 1, 2023.
Revenue Recognition—We earn revenue from the sale of products, which primarily include aggregates, cement, ready-mix concrete and asphalt, but also include concrete products and plastics components, and from the provision of services, which are primarily paving and related services, but also include landfill operations, the receipt and disposal of waste that is converted to fuel for use in our cement plants.
Products: Revenue for product sales is recognized when the performance obligation is satisfied, which generally is when the product is shipped.
Services: We earn revenue from the provision of services, which are primarily paving and related services, which are typically calculated using monthly progress based on a method similar to percentage of completion or a customer’s engineer review of progress.
The majority of our construction service contracts are completed within one year, but may occasionally extend beyond this time frame. The majority of our construction service contracts are for work that occurs mostly during the spring, summer and fall. We generally measure progress toward completion on long-term paving and related services contracts based on the proportion of costs incurred to date relative to total estimated costs at completion.
Estimating costs to be incurred for revenue recognition involves the use of various estimating techniques to project costs at completion, and in some cases includes estimates of recoveries asserted against the customer for changes in specifications or other disputes.
Earnings per Share—The Company computes basic earnings per share attributable to stockholders by dividing income attributable to Summit Inc. by the weighted-average shares of Class A common stock outstanding. Diluted earnings per share reflects the potential dilution beyond shares for basic earnings per share that could occur if securities or other contracts to issue common stock were exercised, converted into common stock, or resulted in the issuance of common stock that would have shared in the Company’s earnings. In addition, as the shares of Class A common stock are issued by Summit Inc., the earnings and equity interests of noncontrolling interests are not included in basic earnings per share.
Prior Year Reclassifications — We have reclassified transaction costs of $1.7 million and $2.1 million for the three and six months ended July 1, 2023, respectively, from general and administrative expenses to a separate line item included in operating income to conform to the current year presentation. We have also reclassified our deferred tax liabilities of $15.9 million as of December 30, 2023, from other non-current liabilities to a separate line item in long term liabilities.
2.ACQUISITIONS, DISPOSITIONS, GOODWILL AND INTANGIBLES
Acquisition of Argos USA
On January 12, 2024, Summit completed its acquisition of all of the outstanding equity interests of Argos USA from Argos SEM LLC and Valle Cement Investments, Inc. for total consideration of approximately $3.1 billion. Summit acquired all of the outstanding equity interests of Argos USA in exchange for (i) $1.2 billion of cash (subject to customary adjustments), (ii) 54,720,000 shares of Class A Common Stock and (iii) one share of preferred stock, par value $0.01 per share, of Summit Inc. (together with the Class A Consideration, the “Stock Consideration”).
The Argos USA assets include four integrated cement plants, two grinding facilities, 140 ready-mix concrete plants, eight ports and 10 inland terminals across the East and Gulf Coast regions, with a total installed cement grinding capacity of 9.6 million tons per annum and a total import capacity of 5.4 million tons of cement per annum.
The results of Argos USA’s operations are included in these consolidated financial statements from the closing date of the Transaction. Argos USA revenues and net income included in the consolidated income statement for the period from January 12, 2024 to June 29, 2024 was $805.9 million and $81.8 million, respectively.
The following table includes unaudited pro forma financial information that presents the consolidated results of operations for the three and six months ended June 29, 2024 and July 1, 2023 as if the Transaction had occurred on January 1, 2023.
| | | | | | | | | | | | | | | | | | | | | | | |
| Three months ended | | Six months ended |
| June 29, 2024 | | July 1, 2023 | | June 29, 2024 | | July 1, 2023 |
| Total Revenues | $ | 1,118,262 | | | $ | 1,156,922 | | | $ | 1,967,164 | | | $ | 1,992,318 | |
| Net income attributable to Summit Inc. | $ | 106,075 | | | $ | 108,608 | | | $ | 39,806 | | | $ | 72,764 | |
The unaudited pro forma information has been calculated after adjusting the results of Argos USA for the following impacts of the Transaction, among other items:
•Additional depreciation, depletion, and amortization for property, plant, and equipment and intangible assets acquired.
•Interest expense adjustments to reflect the payoff of Argos USA debt obligations and new debt issued by the Company to complete the Transaction.
•Elimination of royalties expenses paid to the parent of Argos USA which will not be incurred post-combination.
•Elimination of historical transaction expenses of Argos USA incurred to pursue an initial public offering.
The Company incurred combination-related costs of $71.0 million in the six months ended June 29, 2024 and none for the six months ended July 1, 2023. These expenses are included in transaction and integration costs on consolidated income statement and are reflected in pro forma net income attributable to Summit Inc. for the six months ended July 1, 2023 in the table above. The pro forma results do not include any cost savings or associated costs to achieve such savings from operating efficiencies or synergies that may result from the combination.
The unaudited pro forma financial information is provided for informational purposes only and is not necessarily indicative of the consolidated results of operations of the Company had the combination actually occurred on January 1, 2023, nor of the results of our future operations of the combined business. The pro forma results are based on the preliminary purchase price allocation and will be updated to reflect the final amounts as the allocation is finalized during the measurement period.
Fair value of consideration transferred
| | | | | |
| Cash consideration | $ | 1,145,463 | |
| Fair value of stock consideration issued | 1,973,750 | |
| Total fair value of consideration transferred | $ | 3,119,213 | |
Summit Inc. issued 54,720,000 shares of common stock and calculated the fair value of stock consideration using a per share price of $36.07 on January 12, 2024, the closing date of the Transaction. The fair value of preferred stock is immaterial.
The preferred stock is non-transferable and has no economic rights or ordinary voting rights. The preferred stock was issued to ensure the Argos Parties’ voting interests are not involuntarily diluted and provides a short window to purchase shares of Class A Common Stock in the market, in certain limited circumstances, to prevent the Argos Parties voting interests from dropping below 25.01% of the total Summit common stock.
Argos USA Preliminary Purchase Price Allocation
The acquisition of all of the outstanding equity interests of Argos USA was accounted for in accordance with Accounting Standards Codification 805, Business Combinations. The identifiable assets acquired and liabilities assumed were recorded at their estimated preliminary acquisition date fair values. The excess purchase price over the fair values of identifiable assets and liabilities is recorded as goodwill. The following table summarizes the preliminary allocation of the purchase price to the fair value of assets acquired and liabilities assumed.
| | | | | |
| Purchase Price | $ | 3,119,213 | |
| |
| Asset acquired: | |
| Cash and cash equivalents | 97,153 | |
| Accounts receivable, net | 157,170 | |
| Inventories | 101,481 | |
| Other current assets | 10,505 | |
| Intangible assets, net | 100,000 | |
| Property, plant and equipment, net | 2,355,417 | |
| Operating lease right of use assets | 55,756 | |
| Other assets | 50,414 | |
| |
| Liabilities assumed: | |
| Accounts payable | (124,242) | |
| Accrued expenses | (71,628) | |
| Current operating lease liabilities | (7,545) | |
| Noncurrent operating lease liabilities | (48,211) | |
| Deferred tax liabilities | (225,614) | |
| Other noncurrent liabilities | (203,233) | |
| |
| Fair value of identifiable net assets acquired | 2,247,423 | |
| Goodwill | $ | 871,790 | |
The purchase price has been preliminarily allocated to the assets acquired and liabilities assumed based on their estimated fair values as of the acquisition date. The fair value estimates of assets acquired and liabilities assumed are pending the completion of various items, including obtaining further information regarding the identification and valuation of all assets acquired and liabilities assumed.
Certain of the more significant balances that are not yet finalized include the valuation of property, plant and equipment, intangible assets (including goodwill), inventories, and other working capital accounts, and related income tax considerations. Accordingly, management considers the balances above to be preliminary, and there could be adjustments to the consolidated financial statements in subsequent periods, including changes to depreciation and amortization expense related to the property, plant, and equipment and intangible assets acquired and their respective useful lives, among other adjustments.
Certain measurement period adjustments were recorded in these consolidated financial statement due to the receipt of additional information and updated preliminary valuation reports. Significant adjustments during the three months ended June 29, 2024 included:
i.$92 million decrease in property, plant, and equipment and a $37 million increase in other noncurrent liabilities related to updated valuations due to revised information included in preliminary valuation reports.
ii.$38 million decrease in deferred tax liabilities related to the adjustments noted in (i.) above, among others.
The final determination of the fair values of the assets acquired and liabilities assumed will be completed within the measurement period of up to one year from the acquisition date.
The identified intangible assets acquired include Customer Relationships and Contractual Intangible Assets, with preliminary fair values of $85.0 million and $15.0 million, respectively, and expected to be amortized over a weighted average amortization period of 3 and 8 years, respectively.
Goodwill
Goodwill recognized includes synergies expected to be achieved from the operations of the combined company, the assembled workforce of Argos USA, and intangible assets that do not qualify for separate recognition. Expected synergies include both increased revenue opportunities and the cost savings from the planned integration of platform infrastructure, facilities, personnel, and systems. The transaction is considered a non-taxable business combination and the goodwill is not deductible for tax purposes. The allocation of goodwill to the Company’s reporting units is not complete and is subject to change during the measurement period. On a preliminary basis, all goodwill was assigned to the Cement reportable segment.
Intellectual Property License Agreement
In connection with the Transaction, the Company and Argos USA entered into an Intellectual Property License Agreement with the Argos Parties pursuant to which the parties will grant each other various intellectual property licenses. Certain intellectual property licenses from the Argos Parties, including the "Argos" trade name in Canada and the United States, are provided on a royalty-fee basis. The $21.4 million paid to Argos Parties, which is also the fair value of these intangible assets acquired by the Company was excluded and recorded separately from the business combination.
Other Acquisitions
The financial results of each acquisition have been included in the Company’s consolidated results of operations beginning on the respective closing dates of the acquisitions. The Company measures all assets acquired and liabilities assumed at their acquisition-date fair value. Goodwill acquired during a business combination has an indefinite life and is not amortized.
The following table summarizes the Company’s other acquisitions by region and period:
| | | | | | | | | | | |
| Six months ended | | Year ended |
| June 29, 2024 | | December 30, 2023 |
| West* | 1 | | | 3 | |
| East* | 1 | | | 1 | |
| Cement* | — | | | — | |
_______________________________________________________________________
* The combination with Argos USA affected all three reporting segments. In addition to the acquisition of all of the outstanding equity interests of Argos USA, we also acquired two aggregates-based operations, one in each of our West and East segments.
The purchase price allocation, primarily the valuation of property, plant and equipment, as well as considerations for contracts assumed in the acquisition, for the acquisitions completed during the six months ended June 29, 2024, as well as the acquisitions completed during 2023 that occurred after July 1, 2023, have not yet been finalized due to the recent timing of the acquisitions, status of the valuation of property, plant and equipment and finalization of related tax returns. The following table summarizes aggregated information regarding the fair values of the assets acquired and liabilities assumed as of the respective acquisition dates:
| | | | | | | | | | | |
| Six months ended | | Year ended |
| June 29, 2024 | | December 30, 2023 |
| Financial assets | $ | 1,739 | | | $ | 12,747 | |
| Inventories | 161 | | | 6,251 | |
| Property, plant and equipment | 29,191 | | | 125,207 | |
| | | |
| Other assets | 304 | | | 1,085 | |
| Financial liabilities | (3,177) | | | (11,973) | |
| Other long-term liabilities | (43) | | | (802) | |
| Net assets acquired | 28,175 | | | 132,515 | |
| Goodwill | 36,782 | | | 108,590 | |
| Purchase price | 64,957 | | | 241,105 | |
| | | |
| Other | — | | | (1,597) | |
| Net cash paid for acquisitions | $ | 64,957 | | | $ | 239,508 | |
Changes in the carrying amount of goodwill, by reportable segment, from December 30, 2023 to June 29, 2024 are summarized as follows:
| | | | | | | | | | | | | | | | | | | | | | | |
| | West | | East | | Cement | | Total |
| Balance—December 30, 2023 | $ | 658,704 | | | $ | 361,501 | | | $ | 204,656 | | | $ | 1,224,861 | |
| Acquisitions (1) | 36,414 | | | — | | | 871,790 | | | 908,204 | |
| Dispositions (2) | — | | | (37,938) | | | — | | | (37,938) | |
| Foreign currency translation adjustments | (2,117) | | | — | | | — | | | (2,117) | |
| | | | | | | |
| Balance—June 29, 2024 | $ | 693,001 | | | $ | 323,563 | | | $ | 1,076,446 | | | $ | 2,093,010 | |
_______________________________________________________________________
(1) Reflects goodwill from 2024 acquisitions and working capital adjustments from prior year acquisitions.
(2) Reflects goodwill derecognition from dispositions completed during 2024.
The Company’s intangible assets subject to amortization are primarily composed of operating permits, mineral lease agreements and reserve rights. Operating permits relate to permitting and zoning rights acquired outside of a business combination. The assets related to mineral lease agreements reflect the submarket royalty rates paid under agreements, primarily for extracting aggregates. The values were determined as of the respective acquisition dates by a comparison of market-royalty rates. The reserve rights relate to aggregate reserves to which the Company has certain rights of ownership, but does not own the reserves. The intangible assets are amortized on a straight-line basis over the lives of the leases or permits. The following table shows intangible assets by type and in total:
| | | | | | | | | | | | | | | | | | | | | | | | | | | | | | | | | | | |
| | June 29, 2024 | | December 30, 2023 |
| | Gross
Carrying
Amount | | Accumulated
Amortization | | Net
Carrying
Amount | | Gross
Carrying
Amount | | Accumulated
Amortization | | Net
Carrying
Amount |
| Operating permits | $ | 38,677 | | | $ | (6,505) | | | $ | 32,172 | | | $ | 38,677 | | | $ | (5,691) | | | $ | 32,986 | |
| Mineral leases | 17,375 | | | (7,724) | | | 9,651 | | | 17,778 | | | (7,676) | | | 10,102 | |
| Reserve rights | 25,586 | | | (5,432) | | | 20,154 | | | 25,586 | | | (5,020) | | | 20,566 | |
| | | | | | | | | | | |
| Intellectual property | 21,400 | | | (5,053) | | | 16,347 | | | — | | | — | | | — | |
| Other | 104,830 | | | (14,872) | | | 89,958 | | | 5,012 | | | (585) | | | 4,427 | |
| Total intangible assets | $ | 207,868 | | | $ | (39,586) | | | $ | 168,282 | | | $ | 87,053 | | | $ | (18,972) | | | $ | 68,081 | |
Amortization expense totaled $11.0 million and $20.2 million for the three and six months ended June 29, 2024, respectively, and $0.9 million and $1.8 million for the three and six months ended July 1, 2023, respectively. The estimated amortization expense for the intangible assets for each of the five years subsequent to June 29, 2024 is as follows:
| | | | | |
| 2024 (six months) | $ | 22,463 | |
| 2025 | 44,889 | |
| 2026 | 34,439 | |
| 2027 | 6,608 | |
| 2028 | 5,805 | |
| 2029 | 5,102 | |
| Thereafter | 48,976 | |
| Total | $ | 168,282 | |
During the first half of 2024, we sold two businesses in the East segment and one in the West segment, resulting in total proceeds of $86.0 million and a net gain on disposition of $18.7 million.
3.REVENUE RECOGNITION
We derive our revenue predominantly by selling construction materials, products and providing paving and related services. Construction materials consist of aggregates and cement. Products consist of related downstream products, including ready-mix concrete, asphalt paving mix and concrete products. Paving and related service revenue is generated primarily from the asphalt paving services that we provide.
Revenue by product for the three and six months ended June 29, 2024 and July 1, 2023 is as follows:
| | | | | | | | | | | | | | | | | | | | | | | |
| | Three months ended | | Six months ended |
| | June 29, 2024 | | July 1, 2023 | | June 29, 2024 | | July 1, 2023 |
| Revenue by product*: | | | | | | | |
| Aggregates | $ | 187,100 | | | $ | 182,512 | | | $ | 332,611 | | | $ | 326,165 | |
| Cement | 311,188 | | | 103,607 | | | 535,285 | | | 152,620 | |
| Ready-mix concrete | 393,278 | | | 199,570 | | | 705,325 | | | 338,348 | |
| Asphalt | 77,624 | | | 91,809 | | | 105,609 | | | 118,444 | |
| Paving and related services | 81,861 | | | 89,374 | | | 122,783 | | | 116,558 | |
| Other | 67,211 | | | 62,278 | | | 121,664 | | | 112,403 | |
| Total revenue | $ | 1,118,262 | | | $ | 729,150 | | | $ | 1,923,277 | | | $ | 1,164,538 | |
*Revenue from liquid asphalt terminals is included in asphalt revenue.
Accounts receivable, net consisted of the following as of June 29, 2024 and December 30, 2023:
| | | | | | | | | | | |
| | June 29, 2024 | | December 30, 2023 |
| Trade accounts receivable | $ | 519,801 | | | $ | 228,697 | |
| Construction contract receivables | 36,677 | | | 51,567 | |
| Retention receivables | 9,534 | | | 13,541 | |
| Receivables from related parties | 97 | | | — | |
| Accounts receivable | 566,109 | | | 293,805 | |
| Less: Allowance for doubtful accounts | (16,016) | | | (6,553) | |
| Accounts receivable, net | $ | 550,093 | | | $ | 287,252 | |
Retention receivables are amounts earned by the Company but held by customers until paving and related service contracts and projects are near completion or fully completed. Amounts are generally billed and collected within one year.
4.INVENTORIES
Inventories consisted of the following as of June 29, 2024 and December 30, 2023:
| | | | | | | | | | | |
| | June 29, 2024 | | December 30, 2023 |
| Aggregate stockpiles | $ | 172,183 | | | $ | 165,272 | |
| Finished goods | 95,702 | | | 43,122 | |
| Work in process | 17,680 | | | 10,702 | |
| Raw materials | 63,534 | | | 22,254 | |
| Total | $ | 349,099 | | | $ | 241,350 | |
5.ACCRUED EXPENSES
Accrued expenses consisted of the following as of June 29, 2024 and December 30, 2023:
| | | | | | | | | | | |
| | June 29, 2024 | | December 30, 2023 |
| Interest | $ | 71,393 | | | $ | 27,593 | |
| Payroll and benefits | 50,155 | | | 63,888 | |
| Finance lease obligations | 5,051 | | | 4,020 | |
| Insurance | 37,308 | | | 25,277 | |
| Current portion of accrued taxes and TRA liability | 22,793 | | | 11,042 | |
| Deferred asset purchase payments | 7,979 | | | 5,903 | |
| Professional fees | 3,241 | | | 2,036 | |
| Other (1) | 52,435 | | | 31,932 | |
| Total | $ | 250,355 | | | $ | 171,691 | |
(1)Consists primarily of current portion of asset retirement obligations and miscellaneous accruals.
6.DEBT
Debt consisted of the following as of June 29, 2024 and December 30, 2023:
| | | | | | | | | | | |
| | June 29, 2024 | | December 30, 2023 |
| Term Loan, due 2029: | | | |
| $1,007.5 million and $504.5 million, net of $2.3 million and $4.0 million discount at June 29, 2024 and December 30, 2023, respectively | $ | 1,005,202 | | | $ | 500,473 | |
61⁄2% Senior Notes, due 2027 | 300,000 | | | 300,000 | |
51⁄4% Senior Notes, due 2029 | 700,000 | | | 700,000 | |
71⁄4% Senior Notes, due 2031 | 800,000 | | | 800,000 | |
| Total | 2,805,202 | | | 2,300,473 | |
| Current portion of long-term debt | 7,575 | | | 3,822 | |
| Long-term debt | $ | 2,797,627 | | | $ | 2,296,651 | |
The contractual payments of long-term debt, including current maturities, for the five years subsequent to June 29, 2024, are as follows:
| | | | | |
| 2024 (six months) | $ | 2,525 | |
| 2025 | 12,625 | |
| 2026 | 10,100 | |
| 2027 | 310,100 | |
| 2028 | 10,100 | |
| 2029 | 1,662,025 | |
| Thereafter | 800,000 | |
| Total | 2,807,475 | |
| Less: Original issue net discount | (2,273) | |
| Less: Deferred financing costs | (26,164) | |
| Total debt | $ | 2,779,038 | |
Senior Notes— On December 14, 2023, Summit LLC and Summit Finance (together, the “Issuers”) issued $800.0 million in aggregate principal amount of 7.250% senior notes due January 15, 2031 (the “2031 Notes”). The 2031 Notes were issued at 100.0% of their par value with proceeds of $788.3 million, net of related fees and expenses. The 2031 Notes were issued under an indenture dated as of December 14, 2023 (the "2031 Notes Indenture"). The 2031 Notes Indenture contains covenants limiting, among other things, Summit LLC and its restricted subsidiaries’ ability to incur additional indebtedness or issue certain preferred shares, pay dividends, redeem stock or make other distributions, make certain investments, sell or transfer certain assets, create liens, consolidate, merge, sell or otherwise dispose of all or substantially all of its assets, enter into certain transactions with affiliates, and designate subsidiaries as unrestricted subsidiaries. The 2031 Notes Indenture also contains customary events of default. The gross proceeds of the 2031 Notes were held in escrow as of December 30, 2023 as the proceeds were restricted to use for the cash consideration for the Transaction. The proceeds were released upon closing of the Transaction on January 12, 2024. Interest on the 2031 Notes is payable semi-annually on January 15 and July 15 of each year commencing on July 15, 2024.
On August 11, 2020, the Issuers issued $700.0 million in aggregate principal amount of 5.250% senior notes due January 15, 2029 (the “2029 Notes”). The 2029 Notes were issued at 100.0% of their par value with proceeds of $690.4 million, net of related fees and expenses. The 2029 Notes were issued under an indenture dated August 11, 2020, the terms of which are generally consistent with the 2031 Notes Indenture. Interest on the 2029 Notes is payable semi-annually on January 15 and July 15 of each year commencing on January 15, 2021.
On March 15, 2019, the Issuers issued $300.0 million in aggregate principal amount of 6.500% senior notes due March 15, 2027 (the “2027 Notes”). The 2027 Notes were issued at 100.0% of their par value with proceeds of $296.3 million, net of related fees and expenses. The 2027 Notes were issued under an indenture dated March 25, 2019, the terms of which are generally consistent with the 2031 Notes Indenture. Interest on the 2027 Notes is payable semi-annually on March 15 and September 15 of each year commencing on September 15, 2019.
As of June 29, 2024 and December 30, 2023, the Issuers were in compliance with all covenants under the applicable indentures.
Senior Secured Credit Facilities—
On January 12, 2024, Summit LLC entered into Amendment No. 7 to the credit agreement governing the Senior Secured Credit Facilities (the “Credit Agreement”), which among other things:
(1) established new term loans in an aggregate principal amount of $1.010 billion (the "Term Loan Facility") bearing interest, at Summit LLC’s option, based on either the base rate or Term SOFR rate and an applicable margin of (i) 1.50% per annum with respect to base rate borrowings and a floor of 1.00% per annum or (ii) 2.50% per annum with respect to Term SOFR borrowings and a floor of zero, resulting in a current interest rate as of June 29, 2024 of 7.80%. Amendment No. 7 also extended the maturity date for the Term Loan Facility to January 12, 2029. In addition, the new term loan is subject to a 1.00% prepayment premium in respect of any principal amount repaid in connection with certain repricing transactions occurring within six months following the Amendment No. 7 Effective Date and requires quarterly amortization payments of 0.25% of the principal amount of the Term Loan Facility on the Amendment No. 7 effective date and due on the last business day or each March, June, September and December, commencing with the June 2024 payment. The proceeds of the new term loans were used to (i) fund a portion of the cash consideration in connection with the closing of the Transaction, (ii) refinance the $504.5 million prior term loans outstanding, resulting in charges of $5.5 million which were recognized for the six months ended June 29, 2024, which included charges of $4.0 million for the write-off of original issue discount and $1.5 million for the write-off of deferred financing fees and (iii) pay fees, commissions and expenses in connection with the foregoing. In July 2024, Summit LLC entered into Amendment No. 8 which reduced the applicable margin on Term SOFR borrowings from 2.50% to 1.75% per annum;
(2) in respect of the revolving credit facility thereunder (the “Revolving Credit Facility”), (a) increased the total aggregate commitments under the Revolving Credit Facility from $395.0 million to $625.0 million and (b) reduced the applicable margin (with no leverage-based step downs) to (i) 1.50% per annum with respect to base rate borrowings and a floor of 1.00% per annum or (ii) 2.50% per annum with respect to Term SOFR borrowings and a floor of zero; and
(3) modified certain covenants to provide greater flexibility for Summit LLC under the Credit Agreement.
The revolving credit facility matures on January 10, 2028, provided that if more than $125 million of the 2027 Notes are outstanding as of December 14, 2026, then the maturity date of the revolving credit facility will be December 14, 2026. There were no outstanding borrowings under the revolving credit facility as of June 29, 2024 and December 30, 2023, with borrowing capacity of $592.7 million remaining as of June 29, 2024, which is net of $32.3 million of outstanding letters of credit. The outstanding letters of credit are renewed annually and support required bonding on construction projects, large leases, workers compensation claims and the Company’s insurance liabilities. In connection with the combination with Argos USA described above, Summit LLC assumed a letter of credit related to Argos USA's workers compensation claims and insurance liabilities equal to $11.4 million.
Summit LLC’s Consolidated First Lien Net Leverage Ratio, as such term is defined in the Credit Agreement, should be no greater than 4.75:1.0 as of each quarter-end. As of June 29, 2024 and December 30, 2023, Summit LLC was in compliance with all financial covenants.
Summit LLC’s wholly-owned domestic subsidiary companies, subject to certain exclusions and exceptions, are named as subsidiary guarantors of the Senior Notes and the Senior Secured Credit Facilities. In addition, Summit LLC has pledged substantially all of its assets as collateral, subject to certain exclusions and exceptions including a real property exception, for the Senior Secured Credit Facilities.
In September 2023, in connection with our agreement to acquire all of the outstanding equity interests of Argos USA, we obtained a $1.3 billion 364-day term loan bridge facility commitment from various financial institutions. The term loan bridge facility expired unused upon the closing of the Transaction in January 2024.
The following table presents the activity for the deferred financing fees for the six months ended June 29, 2024 and July 1, 2023:
| | | | | |
| | Deferred financing fees |
| Balance—December 30, 2023 | $ | 14,463 | |
| Loan origination fees | 17,732 | |
| Amortization | (2,997) | |
| Write off of deferred financing fees | (1,462) | |
| Balance—June 29, 2024 | $ | 27,736 | |
| | |
| | |
| Balance—December 31, 2022 | $ | 11,489 | |
| Loan origination fees | 1,566 | |
| Amortization | (1,227) | |
| Write off of deferred financing fees | (160) | |
| Balance—July 1, 2023 | $ | 11,668 | |
Other—On January 15, 2015, the Company’s wholly-owned subsidiary in British Columbia, Canada entered into an agreement with a major Canadian Bank, which was amended on November 30, 2020, for a (i) $6.0 million Canadian dollar (“CAD”) revolving credit commitment to be used for operating activities that bears interest per annum equal to the bank’s prime rate plus 0.20%, (ii) $0.5 million CAD revolving credit commitment to be used for capital equipment that bears interest per annum at the bank’s prime rate plus 0.20% and (iii) $1.5 million CAD revolving credit commitment to provide guarantees on behalf of that subsidiary and (iv) $10.0 million CAD revolving foreign exchange facility available to purchase foreign exchange forward contracts. There were no amounts outstanding under this agreement as of June 29, 2024 or December 30, 2023, which may be terminated upon demand.
7.INCOME TAXES
Summit Inc.’s tax provision includes its proportional share of Summit Holdings’ tax attributes. Summit Holdings’ subsidiaries are primarily limited liability companies but do include certain entities organized as C corporations and a Canadian subsidiary. The tax attributes related to the limited liability companies are passed on to Summit Holdings and then to its partners, including Summit Inc. The tax attributes associated with the C corporation and Canadian subsidiaries are fully reflected in the Company’s accounts.
Our income tax expense was $25.8 million and $14.8 million in the three and six months ended June 29, 2024, respectively, and our income tax expense was $22.5 million and $16.0 million in the three and six months ended July 1, 2023, respectively. The effective tax rate for Summit Inc. differs from the federal statutory tax rate primarily due to (1) basis differences in assets divested, (2) tax depletion expense in excess of the expense recorded under U.S. GAAP, (3) state taxes, (4) various other items such as limitations on meals and entertainment, certain stock compensation, non-deductible compensation paid to covered employees, and other costs.
As of each of June 29, 2024 and December 30, 2023, Summit Inc. had a valuation allowance of $1.1 million, which relates to certain deferred tax assets in taxable entities where realization is not more likely than not.
No material interest or penalties were recognized in income tax expense during the three and six months ended June 29, 2024 and July 1, 2023.
Tax Receivable Agreement—The Company is party to a TRA with certain former holders of Class A limited partnership units of Summit Holdings ("LP Units") that provides for the payment by Summit Inc. to exchanging holders of LP Units of 85% of the benefits, if any, that Summit Inc. actually realizes (or, under certain circumstances such as an early termination of the TRA, is deemed to realize) as a result of increases in the tax basis of tangible and intangible assets of Summit Holdings and certain other tax benefits related to entering into the TRA, including tax benefits attributable to payments under the TRA.
In the six months ended June 29, 2024, all of the remaining 763,243 LP Units were acquired by Summit Inc. in exchange for an equal number of newly-issued shares of Summit Inc.’s Class A common stock and the Company recorded an increase in the TRA liability of approximately $6.7 million related to the exchanges. As of June 29, 2024, the total tax receivable agreement liability was $47.7 million.
8.EARNINGS PER SHARE
Basic earnings per share is computed by dividing net earnings by the weighted average common shares outstanding and diluted net earnings is computed by dividing net earnings, adjusted for changes in the earnings allocated to Summit Inc. as a result of the assumed conversion of LP Units, by the weighted-average common shares outstanding assuming dilution.
The following table shows the calculation of basic and diluted earnings per share:
| | | | | | | | | | | | | | | | | | | | | | | |
| | Three months ended | | Six months ended |
| | June 29, 2024 | | July 1, 2023 | | June 29, 2024 | | July 1, 2023 |
| Net income attributable to Summit Inc. | $ | 106,075 | | | $ | 83,637 | | | $ | 39,209 | | | $ | 52,833 | |
| | | | | | | |
| Weighted average shares of Class A stock outstanding | 175,510,071 | | | 118,848,214 | | | 171,478,056 | | | 118,706,385 | |
| Add: Nonvested restricted stock awards of retirement eligible shares | 40,416 | | | 83,700 | | | 52,975 | | | 99,400 | |
| Weighted average shares outstanding | 175,550,487 | | | 118,931,914 | | | 171,531,031 | | | 118,805,785 | |
| Basic earnings per share | $ | 0.60 | | | $ | 0.70 | | | $ | 0.23 | | | $ | 0.44 | |
| | | | | | | |
| Diluted net income attributable to Summit Inc. | $ | 106,075 | | | $ | 83,637 | | | $ | 39,209 | | | $ | 52,833 | |
| | | | | | | |
| Weighted average shares outstanding | 175,550,487 | | | 118,931,914 | | | 171,531,031 | | | 118,805,785 | |
| | | | | | | |
| Add: stock options | 104,706 | | | 100,895 | | | 116,734 | | | 99,102 | |
| Add: warrants | 17,061 | | | 13,194 | | | 17,116 | | | 12,978 | |
| Add: restricted stock units | 263,418 | | | 193,011 | | | 408,314 | | | 340,958 | |
| Add: performance stock units | 196,329 | | | 154,695 | | | 234,849 | | | 172,781 | |
| Weighted average dilutive shares outstanding | 176,132,001 | | | 119,393,709 | | | 172,308,044 | | | 119,431,604 | |
| Diluted earnings per share | $ | 0.60 | | | $ | 0.70 | | | $ | 0.23 | | | $ | 0.44 | |
Excluded from the above calculations were the shares noted below as they were antidilutive:
| | | | | | | | | | | | | | | | | | | | | | | |
| | Three months ended | | Six months ended |
| | June 29, 2024 | | July 1, 2023 | | June 29, 2024 | | July 1, 2023 |
| Antidilutive shares: | | | | | | | |
| LP Units | — | | | 1,310,004 | | | 255,783 | | | 1,310,630 | |
| | | | | | | |
| | | | | | | |
| | | | | | | |
| | | | | | | |
9.STOCKHOLDERS’ EQUITY
In March 2022, our Board of Directors authorized a share repurchase program, whereby we can repurchase up to $250 million of our Class A common stock. As of June 29, 2024, there was $149.0 million available for purchase, upon which they will be retired.
The following table summarizes the changes in our ownership of Summit Holdings:
| | | | | | | | | | | | | | | | | | | | | | | |
| | Summit Inc.
Shares (Class A) | | LP Units | | Total | | Summit Inc.
Ownership
Percentage |
| Balance — December 30, 2023 | 119,529,380 | | | 763,243 | | | 120,292,623 | | | 99.4 | % |
| Exchanges during period | 763,243 | | | (763,243) | | | — | | | |
| Stock option exercises | 83,488 | | | — | | | 83,488 | | | |
| | | | | | | |
| Issuance of Class A common stock | 54,720,000 | | | — | | | 54,720,000 | | | |
| Other equity transactions | 490,360 | | | — | | | 490,360 | | | |
| Balance — June 29, 2024 | 175,586,471 | | | — | | | 175,586,471 | | | 100.0 | % |
| | | | | | | |
| | | | | | | |
| Balance — December 31, 2022 | 118,408,655 | | | 1,312,004 | | | 119,720,659 | | | 98.9 | % |
| Exchanges during period | 2,000 | | | (2,000) | | | — | | | |
| Stock option exercises | 4,240 | | | — | | | 4,240 | | | |
| | | | | | | |
| Other equity transactions | 471,379 | | | — | | | 471,379 | | | |
| Balance — July 1, 2023 | 118,886,274 | | | 1,310,004 | | | 120,196,278 | | | 98.9 | % |
Summit Inc. is Summit Holdings’ primary beneficiary and thus consolidates Summit Holdings in its consolidated financial statements with a corresponding noncontrolling interest reclassification, which was 0.0% and 0.6% as of June 29, 2024 and December 30, 2023, respectively.
Accumulated other comprehensive income (loss) —The changes in each component of accumulated other comprehensive income (loss) consisted of the following:
| | | | | | | | | | | | | | | | | | | |
| | Change in
retirement plans | | Foreign currency
translation
adjustments | | | | Accumulated
other
comprehensive
income (loss) |
| Balance — December 30, 2023 | $ | 6,840 | | | $ | 435 | | | | | $ | 7,275 | |
| | | | | | | |
| | | | | | | |
| Foreign currency translation adjustment, net of tax | — | | | (5,127) | | | | | (5,127) | |
| | | | | | | |
| Balance — June 29, 2024 | $ | 6,840 | | | $ | (4,692) | | | | | $ | 2,148 | |
| | | | | | | |
| | | | | | | |
| Balance — December 31, 2022 | $ | 6,356 | | | $ | (3,272) | | | | | $ | 3,084 | |
| | | | | | | |
| Foreign currency translation adjustment, net of tax | — | | | 3,242 | | | | | 3,242 | |
| | | | | | | |
| Balance — July 1, 2023 | $ | 6,356 | | | $ | (30) | | | | | $ | 6,326 | |
10.SUPPLEMENTAL CASH FLOW INFORMATION
Supplemental cash flow information is as follows:
| | | | | | | | | | | |
| | Six months ended |
| | June 29, 2024 | | July 1, 2023 |
| Cash payments: | | | |
| Interest | $ | 53,234 | | | $ | 38,107 | |
| Payments for income taxes, net | 11,390 | | | 6,941 | |
| Operating cash payments on operating leases | 11,496 | | | 4,801 | |
| Operating cash payments on finance leases | 1,469 | | | 282 | |
| Finance cash payments on finance leases | 2,777 | | | 5,223 | |
| Non cash investing and financing activities: | | | |
| Accrued liabilities for purchases of property, plant and equipment | $ | 44,303 | | | $ | 14,994 | |
| Right of use assets obtained in exchange for operating lease obligations | 68,151 | | | 2,050 | |
| Right of use assets obtained in exchange for finance leases obligations | 28,764 | | | 413 | |
| Exchange of LP Units to shares of Class A common stock | 32,633 | | | 60 | |
| Issuance of Class A common stock | 1,973,750 | | | — | |
On January 12, 2024, Summit completed a combination with Argos USA, Cementos Argos, Argos SEM LLC and Valle Cement Investments, Inc., pursuant to which Summit acquired all of the outstanding equity interests of Argos USA from
the Argos SEM LLC and Valle Cement Investments, Inc.. Non-cash transactions related to the combination includes issuance of 54,720,000 shares of Summit Inc.'s Class A common stock and 1 preferred share.
11.LEASES
We lease construction and office equipment, distribution facilities and office space. Leases with an initial term of 12 months or less, including month to month leases, are not recorded on the balance sheet. Lease expense for short-term leases is recognized on a straight line basis over the lease term. For lease agreements we have entered into or reassessed, we combine lease and nonlease components. While we also own mineral leases for mining operations, those leases are outside the scope of Accounting Standards Update No. 2016-2, Leases (Topic 842). Assets acquired under finance leases are included in property, plant and equipment.
Many of our leases include options to purchase the leased equipment. The depreciable life of assets and leasehold improvements are limited by the expected lease term, unless there is a transfer of title or purchase option reasonably certain of exercise. Our lease agreements do not contain any material residual value guarantees or material restrictive covenants. The components of lease expense were as follows:
| | | | | | | | | | | | | | | | | | | | | | | |
| Three months ended | | Six months ended |
| June 29, 2024 | | July 1, 2023 | | June 29, 2024 | | July 1, 2023 |
| Operating lease cost | $ | 6,245 | | | $ | 2,697 | | | $ | 12,274 | | | $ | 5,338 | |
| Variable lease cost | 2,135 | | | 34 | | | 3,800 | | | 64 | |
| Short-term lease cost | 11,352 | | | 10,184 | | | 20,674 | | | 17,454 | |
| Financing lease cost: | | | | | | | |
| Amortization of right-of-use assets | 1,466 | | | 714 | | | 2,925 | | | 1,532 | |
| Interest on lease liabilities | 776 | | | 133 | | | 1,421 | | | 281 | |
| Total lease cost | $ | 21,974 | | | $ | 13,762 | | | $ | 41,094 | | | $ | 24,669 | |
| | |
| June 29, 2024 | | December 30, 2023 |
| Supplemental balance sheet information related to leases: | | | |
| Operating leases: | | | |
| Operating lease right-of-use assets | $ | 89,360 | | | $ | 36,553 | |
| | | |
| Current operating lease liabilities | $ | 17,217 | | | $ | 8,596 | |
| Noncurrent operating lease liabilities | 77,326 | | | 33,230 | |
| Total operating lease liabilities | $ | 94,543 | | | $ | 41,826 | |
| Finance leases: | | | |
| Property and equipment, gross | $ | 56,022 | | | $ | 30,136 | |
| Less accumulated depreciation | (13,206) | | | (12,088) | |
| Property and equipment, net | $ | 42,816 | | | $ | 18,048 | |
| | | |
| Current finance lease liabilities | $ | 5,051 | | | $ | 4,020 | |
| Long-term finance lease liabilities | 33,085 | | | 14,357 | |
| Total finance lease liabilities | $ | 38,136 | | | $ | 18,377 | |
|
| Weighted average remaining lease term (years): |
| Operating leases | 7.2 | | 8.4 |
| Finance lease | 10.1 | | 6.0 |
|
| Weighted average discount rate: |
| Operating leases | 7.3 | % | | 5.1 | % |
| Finance leases | 8.2 | % | | 7.7 | % |
|
| Maturities of lease liabilities, as of June 29, 2024, were as follows: |
| Operating Leases | | Finance Leases |
| 2024 (six months) | $ | 11,304 | | | $ | 4,252 | |
| 2025 | 21,854 | | | 6,900 | |
| 2026 | 18,501 | | | 5,585 | |
| 2027 | 15,148 | | | 5,402 | |
| 2028 | 12,093 | | | 5,818 | |
| 2029 | 10,536 | | | 4,477 | |
| Thereafter | 31,745 | | | 24,743 | |
| Total lease payments | 121,181 | | | 57,177 | |
| Less imputed interest | (26,638) | | | (19,041) | |
| Present value of lease payments | $ | 94,543 | | | $ | 38,136 | |
12.COMMITMENTS AND CONTINGENCIES
The Company is party to certain legal actions arising from its ordinary course of business activities. In the opinion of management, these actions will not have a material effect on the Company’s financial position, results of operations or liquidity. The Company’s policy is to record legal accruals when the outcome is probable and can be reasonably estimated and to record legal fees as incurred.
In March 2018, we were notified of an investigation by the Canadian Competition Bureau (the “CCB”) into pricing practices by certain asphalt paving contractors in British Columbia, including Winvan Paving, Ltd. (“Winvan”). We believe the investigation is focused on time periods prior to our April 2017 acquisition of Winvan and we are cooperating with the CCB. Although we currently do not believe this matter will have a material adverse effect on our business, financial condition or results of operations, we are currently not able to predict the ultimate outcome or cost of the investigation.
On January 4, 2021, prior to the closing of the Transaction, Argos USA entered into a Deferred Prosecution Agreement (“DPA”) with the U.S. Department of Justice (“DOJ”) related to the sale of ready-mix concrete in the greater Savannah, Georgia area by a small number of employees who joined the Company in October 2011 and were subsequently terminated. Pursuant to the DPA, Argos USA paid a monetary penalty of $20.0 million and was required, among other things, to periodically review and update its antitrust compliance program. The three-year term of the DPA expired on January 4, 2024. As Argos USA fully complied with the terms of the DPA, on January 18, 2024, following the conclusion of the DPA’s three-year term, the United States District Court for the Southern District of Georgia dismissed the criminal charge that was filed against the company in January 2021. Argos USA’s failure to comply with the terms and conditions of the DPA could result in additional criminal prosecution or penalties as well as continued expenses in defending these proceedings. In addition, Argos USA has been named a defendant in a putative class action filed under the caption Pro Slab, Inc. et al. v. Argos USA LLC et al. on behalf of purchasers of ready-mix concrete on November 22, 2017 in the U.S. District Court for the District of South Carolina and includes allegations of price-fixing, market allocation and other anti-competitive practices in the Savannah, Georgia and Charleston, South Carolina markets, seeking monetary damages and other remedies. This case was stayed on February 9, 2022 pending the resolution of the same criminal indictments, and only limited, written discovery may proceed while this stay is in effect.
On June 13, 2023, prior to the closing of the Transaction, Argos USA entered into a settlement and compliance agreement with the Federal Highway Administration of the U.S. Department of Transportation that requires, among other things, appointment of an independent monitor until June 2025 to monitor, among other things, bids or awards of publicly funded contracts in Georgia and South Carolina for our ready-mix and cement business, as well as our code of business conduct, antitrust compliance policy, and antitrust compliance program.
Environmental Remediation and Site Restoration —The Company’s operations are subject to and affected by federal, state, provincial and local laws and regulations relating to the environment, health and safety and other regulatory matters. These operations require environmental operating permits, which are subject to modification, renewal and revocation. The Company regularly monitors and reviews its operations, procedures and policies for compliance with these laws and regulations. Despite these compliance efforts, risk of environmental liability is inherent in the operation of the Company’s business, as it is with other companies engaged in similar businesses and there can be no assurance that environmental liabilities or noncompliance will not have a material adverse effect on the Company’s consolidated financial condition, results of operations or liquidity.
The Company has asset retirement obligations arising from regulatory and contractual requirements to perform reclamation activities at the time certain quarries and landfills are closed. As of June 29, 2024 and December 30, 2023, $44.1 million and $44.8 million, respectively, were included in other noncurrent liabilities on the consolidated balance sheets and $6.5 million and $5.1 million, respectively, were included in accrued expenses for future reclamation costs. The total undiscounted anticipated costs for site reclamation as of June 29, 2024 and December 30, 2023 were $171.4 million and $141.8 million, respectively.
Payment In Lieu Of Taxes (“PILOT”) Agreement — In connection with the Transaction, Summit assumed a PILOT agreement related to the Martinsburg, West Virginia cement plant entered into by Argos USA pursuant to an acquisition that occurred in 2016. This agreement, which includes a continuing employment base requirement and other requirements, is in effect through fiscal year 2034. Under this agreement, certain property was conveyed to the West Virginia Economic Development Authority in exchange for certain local tax incentives. The $460.0 million receivable from the municipality related to the conveyance of the property, and the $460.0 million liability associated with the financing, have been offset in the consolidated balance sheets as the opening balance sheet. The annual payment related to the financing, and receipts related to the conveyance of the property for year-ended December 30, 2023 approximated $27.1 million.
Other—The Company is obligated under various firm purchase commitments for certain raw materials and services that are in the ordinary course of business. Management does not expect any significant changes in the market value of these goods and services during the commitment period that would have a material adverse effect on the financial condition,
results of operations and cash flows of the Company. The terms of the purchase commitments generally approximate one year.
13.FAIR VALUE
Fair Value Measurements—Certain acquisitions made by the Company require the payment of contingent amounts of purchase consideration. These payments are contingent on specified operating results being achieved in periods subsequent to the acquisition and will only be made if earn-out thresholds are achieved. Contingent consideration obligations are measured at fair value each reporting period. Any adjustments to fair value are recognized in earnings in the period identified.
The fair value of contingent consideration as of June 29, 2024 and December 30, 2023 was:
| | | | | | | | | | | |
| | June 29, 2024 | | December 30, 2023 |
| Current portion of acquisition-related liabilities and Accrued expenses: | | | |
| Contingent consideration | $ | 1,701 | | | $ | 139 | |
| Acquisition-related liabilities and Other noncurrent liabilities: | | | |
| Contingent consideration | $ | 7,971 | | | $ | 9,254 | |
The fair value of contingent consideration was based on unobservable, or Level 3, inputs, including projected probability-weighted cash payments and a 10.0% discount rate, which reflects a market discount rate. Changes in fair value may occur as a result of a change in actual or projected cash payments, the probability weightings applied by the Company to projected payments or a change in the discount rate. Significant increases or decreases in any of these inputs in isolation could result in a lower, or higher, fair value measurement. There were no material valuation adjustments to contingent consideration as of June 29, 2024 and July 1, 2023.
Financial Instruments—The Company’s financial instruments include debt and certain acquisition-related liabilities (deferred consideration and noncompete obligations). The carrying value and fair value of these financial instruments as of June 29, 2024 and December 30, 2023 was:
| | | | | | | | | | | | | | | | | | | | | | | |
| | June 29, 2024 | | December 30, 2023 |
| | Fair Value | | Carrying Value | | Fair Value | | Carrying Value |
| Level 1 | | | | | | | |
| Long-term debt(1) | $ | 2,814,031 | | | $ | 2,805,202 | | | $ | 2,329,606 | | | $ | 2,300,473 | |
| Level 3 | | | | | | | |
| Current portion of deferred consideration and noncompete obligations(2) | 7,286 | | | 7,286 | | | 6,868 | | | 6,868 | |
| Long term portion of deferred consideration and noncompete obligations(3) | 13,246 | | | 13,246 | | | 18,767 | | | 18,767 | |
(1)$7.6 million and $3.8 million was included in current portion of debt as of June 29, 2024 and December 30, 2023, respectively.
(2)Included in current portion of acquisition-related liabilities on the consolidated balance sheets.
(3)Included in acquisition-related liabilities on the consolidated balance sheets.
The fair value of debt was determined based on observable, or Level 1, inputs, such as interest rates, bond yields and quoted prices in inactive markets. The fair values of the deferred consideration and noncompete obligations were determined based on unobservable, or Level 3, inputs, including the cash payment terms in the purchase agreements and a discount rate reflecting the Company’s credit risk. The discount rate used is generally consistent with that used when the obligations were initially recorded.
Securities with a maturity of three months or less are considered cash equivalents and the fair value of these assets approximates their carrying value.
14.SEGMENT INFORMATION
The Company has three operating segments: West, East and Cement, which are its reporting segments. These segments are consistent with the Company’s management reporting structure.
The operating results of each segment are regularly reviewed and evaluated by the Chief Executive Officer, our Company’s Chief Operating Decision Maker (“CODM”). The CODM primarily evaluates the performance of the Company’s segments and allocates resources to them based on a segment profit metric that we call Adjusted EBITDA ("EBITDA" refers to net income (loss) before interest expense (income), income tax expense (benefit) and depreciation, depletion and amortization), which is computed as earnings from operations before interest, taxes, depreciation, depletion, amortization, accretion and share-based compensation, as well as various other non-recurring, non-cash amounts.
The West and East segments have several subsidiaries that are engaged in various activities including quarry mining, aggregate production and contracting. The Cement segment is engaged in the production of Portland cement. Assets employed by each segment include assets directly identified with those operations. Corporate assets consist primarily of cash, property, plant and equipment for corporate operations and other assets not directly identifiable with a reportable business segment. The accounting policies applicable to each segment are consistent with those used in the consolidated financial statements.
The following tables display selected financial data for the Company’s reportable business segments as of June 29, 2024 and December 30, 2023 and for the three and six months ended June 29, 2024 and July 1, 2023:
| | | | | | | | | | | | | | | | | | | | | | | |
| | Three months ended | | Six months ended |
| | June 29, 2024 | | July 1, 2023 | | June 29, 2024 | | July 1, 2023 |
| Revenue*: | | | | | | | |
| West | $ | 453,382 | | | $ | 430,738 | | | $ | 757,920 | | | $ | 681,620 | |
| East | 340,059 | | | 186,537 | | | 608,753 | | | 316,926 | |
| Cement | 324,821 | | | 111,875 | | | 556,604 | | | 165,992 | |
| Total revenue | $ | 1,118,262 | | | $ | 729,150 | | | $ | 1,923,277 | | | $ | 1,164,538 | |
*Intercompany sales totaled $53.5 million and $94.0 million for the three and six months ended June 29, 2024, respectively, and $1.6 million and $2.4 million for the three and six months ended July 1, 2023, respectively. The presentation above only reflects sales to external customers.
| | | | | | | | | | | | | | | | | | | | | | | |
| | Three months ended | | Six months ended |
| | June 29, 2024 | | July 1, 2023 | | June 29, 2024 | | July 1, 2023 |
| Income from operations before taxes | $ | 131,891 | | | $ | 107,209 | | | $ | 53,556 | | | $ | 69,531 | |
| Interest expense | 52,849 | | | 27,902 | | | 104,741 | | | 55,322 | |
| Depreciation, depletion and amortization | 103,379 | | | 54,042 | | | 198,342 | | | 104,230 | |
| Accretion | 1,018 | | | 745 | | | 2,026 | | | 1,451 | |
| Loss on debt financings | — | | | — | | | 5,453 | | | 493 | |
| | | | | | | |
| Gain on sale of businesses | (3,758) | | | — | | | (18,743) | | | — | |
| Non-cash compensation | 7,413 | | | 5,216 | | | 14,133 | | | 9,924 | |
| Argos USA acquisition and integration costs | 9,737 | | | — | | | 71,031 | | | — | |
| Other | (6,363) | | | (3,369) | | | (13,148) | | | (8,005) | |
| Total Adjusted EBITDA | $ | 296,166 | | | $ | 191,745 | | | $ | 417,391 | | | $ | 232,946 | |
| | | | | | | |
| Total Adjusted EBITDA by Segment: | | | | | | | |
| West | $ | 101,585 | | | $ | 104,517 | | | $ | 144,985 | | | $ | 137,195 | |
| East | 70,554 | | | 47,617 | | | 108,030 | | | 66,469 | |
| Cement | 140,769 | | | 52,872 | | | 200,223 | | | 52,882 | |
| Corporate and other | (16,742) | | | (13,261) | | | (35,847) | | | (23,600) | |
| Total Adjusted EBITDA | $ | 296,166 | | | $ | 191,745 | | | $ | 417,391 | | | $ | 232,946 | |
| | | | | | | | | | | |
| | Six months ended |
| | June 29, 2024 | | July 1, 2023 |
| Purchases of property, plant and equipment | | | |
| West | $ | 75,744 | | | $ | 70,687 | |
| East | 46,570 | | | 30,378 | |
| Cement | 45,813 | | | 19,477 | |
| Total reportable segments | 168,127 | | | 120,542 | |
| Corporate and other | 7,833 | | | 6,351 | |
| Total purchases of property, plant and equipment | $ | 175,960 | | | $ | 126,893 | |
| | | | | | | | | | | | | | | | | | | | | | | |
| | Three months ended | | Six months ended |
| | June 29, 2024 | | July 1, 2023 | | June 29, 2024 | | July 1, 2023 |
| Depreciation, depletion, amortization and accretion: | | | | | | | |
| West | $ | 30,270 | | | $ | 28,144 | | | $ | 60,608 | | | $ | 54,517 | |
| East | 23,369 | | | 15,718 | | | 46,450 | | | 31,253 | |
| Cement | 48,268 | | | 9,891 | | | 88,973 | | | 17,889 | |
| Total reportable segments | 101,907 | | | 53,753 | | | 196,031 | | | 103,659 | |
| Corporate and other | 2,490 | | | 1,034 | | | 4,337 | | | 2,022 | |
| Total depreciation, depletion, amortization and accretion | $ | 104,397 | | | $ | 54,787 | | | $ | 200,368 | | | $ | 105,681 | |
| | | | | | | | | | | |
| | June 29, 2024 | | December 30, 2023 |
| Total assets: | | | |
| West | $ | 2,037,224 | | | $ | 1,837,214 | |
| East | 1,618,636 | | | 1,171,944 | |
| Cement | 4,090,823 | | | 904,508 | |
| Total reportable segments | 7,746,683 | | | 3,913,666 | |
| Corporate and other | 567,309 | | | 1,235,916 | |
| Total | $ | 8,313,992 | | | $ | 5,149,582 | |
15.RELATED PARTY TRANSACTIONS
As part of the combination with Argos USA, we entered into several agreements with affiliates of Cementos Argos as follows:
We entered into agreements whereby Cementos Argos or an affiliate of Cementos Argos provides various administrative and technical services. The technical service agreement can be terminated with six months advance notice, while the support services agreement expires January 2026. During the three and six months ended June 29, 2024, we paid $1.4 million and $1.7 million, respectively, under these agreements and is included in general and administrative costs in our statement of operations.
We also entered into a cement supply agreement with Cementos Argos with an initial term expiring December 31, 2028. Under this agreement, we will purchase a minimum volume of 425,000 metric tons of cement from an affiliate of Cementos Argos. The purchase price of the cement will be at market prices based on third party quotes. During the three and six months ended June 29, 2024, we purchased $5.3 million and $14.4 million, respectively, of cement under the cement supply agreement. Cement purchases are capitalized into inventory on the consolidated balance sheet.
We also entered into various agreements whereby an affiliate of Cementos Argos will provide logistics support for importing cement to our terminals. During the three and six months ended June 29, 2024, we paid the affiliate $2.8 million and $4.5 million, respectively, under the logistics supply agreement, and these costs are capitalized into inventory on our consolidated balance sheet.
We entered into a master purchase agreement where-by we will utilize the services of an affiliate of Cementos Argos to negotiate and coordinate a supply agreement with the international suppliers for the purchase of cement and other materials. This agreement expires on December 31, 2025. During the three and six months ended June 29, 2024, we paid $0.2 million and $0.3 million, respectively, under the master purchase agreement, and these costs are capitalized into inventory on our consolidated balance sheet.
ITEM 2. MANAGEMENT’S DISCUSSION AND ANALYSIS OF FINANCIAL CONDITION AND RESULTS OF OPERATIONS
This Management’s Discussion and Analysis of Financial Condition and Results of Operations is intended to assist in understanding and assessing the trends and significant changes in our results of operations and financial condition. Historical results may not be indicative of future performance. Forward-looking statements reflect our current views about future events, are based on assumptions and are subject to known and unknown risks and uncertainties that could cause actual results to differ materially from those contemplated by these statements. Factors that may cause differences between actual results and those contemplated by forward-looking statements include, but are not limited to, those discussed in the section entitled “Risk Factors” in the Annual Report, and factors discussed in the section entitled “Cautionary Note Regarding Forward-Looking Statements.” This Management’s Discussion and Analysis of Financial Condition and Results of Operations should be read in conjunction with our consolidated interim financial statements and the related notes and other information included in this report.
Overview
Summit’s vision is to be the most socially responsible, integrated construction materials solution provider, collaborating with stakeholders to deliver differentiated innovations and solve our customers’ challenges. Within our markets, we strive to be a market leader by offering customers a single-source provider for construction materials and related vertically integrated downstream products. Our materials include aggregates, which we supply across the United States, and in British Columbia, Canada, and cement, which we supply across the Southeast and Mid-Atlantic as well as to surrounding states along the Mississippi River from Minnesota to Southeast Gulf States. In addition to supplying aggregates to customers, we use a portion of our materials internally to produce ready-mix concrete and asphalt paving mix, which may be sold externally or used in our paving and related services businesses. Our vertically integrated business model creates opportunities to increase aggregates volumes, optimize margin at each stage of production and provide customers with efficiency gains, convenience and reliability, which we believe gives us a competitive advantage.
We are organized into nine operating companies that make up our three distinct operating segments: West, East and Cement. We operate in 24 U.S. states and in British Columbia, Canada and currently have assets in 27 U.S. states and in British Columbia, Canada. The map below illustrates our geographic footprint.
Business Trends and Conditions
The U.S. construction materials industry is composed of four primary sectors: aggregates; cement; ready-mix concrete; and asphalt paving mix. Each of these materials is widely used in most forms of construction activity. Participants in these sectors typically range from small, privately-held companies focused on a single material, product or market to publicly traded multinational corporations that offer a wide array of construction materials and services. Competition is constrained in part by the distance materials can be transported efficiently, resulting in predominantly local or regional operations. Due to the lack of product differentiation, competition for all of our products is predominantly based on price and, to a lesser extent, quality of products and service. Accordingly, our profitability is generally dependent on the level of demand for our materials and products and our ability to control operating costs. We continue to monitor supply chain issues, as well as inflationary pressures on our raw material inputs as well as labor costs.
Our revenue is derived from multiple end-use markets including public infrastructure construction and private residential and nonresidential construction. Public infrastructure includes spending by federal, state, provincial and local governments for roads, highways, bridges, airports and other infrastructure projects. Public infrastructure projects have historically been a relatively stable portion of state and federal budgets. Residential and nonresidential construction consists of new construction and repair and remodel markets. Any economic stagnation or decline, which could vary by local region and market, could affect our results of operations. Our sales and earnings are sensitive to national, regional and local economic conditions and particularly to cyclical changes in construction spending, especially in the private sector. From a macroeconomic view, we see a positive trend in highway obligations, but headwinds in housing starts.
Transportation infrastructure projects, driven by both federal and state funding programs, represent a significant share of the U.S. construction materials market. Federal funds are allocated to the states, which are required to match a portion of the federal funds they receive. Federal highway spending uses funds predominantly from the Federal Highway Trust Fund, which derives its revenue from taxes on diesel fuel, gasoline and other user fees. The dependability of federal funding allows state departments of transportation to plan for their long-term highway construction and maintenance needs. The Infrastructure Investment and Jobs Act (" IIJA") was signed into law on November 15, 2021. The IIJA provides $1.2 trillion in funding over five years from 2022 through 2026, which includes $347.8 billion for highways, and $91.0 billion for transit.
In 2023, approximately 62% of our revenue was derived from the private construction market, and the remaining revenue from the public markets. We believe the percentage of revenue derived from the private construction market will increase slightly as a result of the combination with Argos North America Corp. ("Argos USA"). We believe residential activity in our key markets will continue to be a driver for volumes in future periods. Funding for public infrastructure projects is expected to remain a high priority.
In addition to federal funding, state, county and local agencies provide highway construction and maintenance funding. Our six largest states by revenue, Texas, Florida, Missouri, Georgia, Utah, and Kansas, the following is a summary of key funding initiatives in those states:
•Texas: The fiscal year 2025 budget will rise $18.68 billion. Given that the biennial budget for fiscal year 2023 was determined in 2021, prior to passage of the IIJA, this bill is the first biennial budget to incorporate increased federal funding under IIJA. IIJA boosts the Texas Department of Transportation budget by about $1 billion per year.
•Florida: Baseline appropriations to the Florida Department of Transportation total $15.51 billion, a state record and 2% increase over the base fiscal year 2024 Florida Department of Transportation budget.
•Missouri: In fiscal year 2025, appropriations classified under highway construction totaled $3.3 billion, an 18% increase over fiscal year 2024.
•Georgia: Appropriations to the Georgia Department of Transportation total $4.18 billion in fiscal year 2025, a 7% increase over the original fiscal year 2024 budget ($3.90 billion). Importantly, the anticipated federal revenues reflected in Georgia Department of Transportation's recent budgets do not capture the extent of federal funding attributable to the IIJA.
•Utah: Between fiscal year 2017 and fiscal year 2024, total (original) transportation appropriations rose 128%, from $1.32 billion to $3.02 billion. In fiscal year 2025, appropriations fell 4% from that high to $2.92 billion.
•Kansas: The original Governor's Budget for the Kansas Department of Transportation totals $2.68 billion for fiscal year 2025, a 16% increase over the original Governor's Budget for fiscal year 2024.
Use and consumption of our products fluctuate due to seasonality. Nearly all of the products used by us, and by our customers, in the private construction and public infrastructure industries are used outdoors. Our highway operations and production and distribution facilities are also located outdoors. Therefore, seasonal changes and other weather-related conditions, in particular extended rainy and cold weather in the spring and fall, and major weather events such as hurricanes, tornadoes, tropical storms, heavy snows and flooding, can adversely affect our business and operations through a decline in both the use of our products and demand for our services. In addition, construction materials production and shipment levels follow activity in the construction industry, which typically occurs in the spring, summer and fall. Warmer and drier weather during the second and third quarters of our fiscal year typically result in higher activity and revenue levels during those quarters. The first quarter of our fiscal year typically has lower levels of activity due to weather conditions.
We are subject to commodity price risk with respect to price changes in liquid asphalt and energy, including fossil fuels and electricity for aggregates, cement, ready-mix concrete and asphalt paving mix production and diesel fuel for distribution vehicles and production related mobile equipment. Liquid asphalt escalator provisions in most of our private and commercial contracts limit our exposure to price fluctuations in this commodity. We often obtain similar escalators on public infrastructure contracts. In addition, as we seek to manage our risk to increasing energy prices, we enter into various firm purchase commitments, with terms generally less than one year, for certain raw materials.
Combination with Argos USA
In January 2024, we completed a combination with Argos USA, Cementos Argos S.A. (“Cementos Argos”), Argos SEM LLC and Valle Cement Investments, Inc. pursuant to which Summit acquired all of the outstanding equity interests (the
"Transaction") of Argos USA from Argos SEM LLC and Valle Cement Investments, Inc. in exchange for $1.2 billion of cash, the issuance of 54.7 million shares of our Class A common stock and one preferred share in a transaction valued at approximately $3.1 billion. The purchase price is subject to customary adjustments, with any upward or downward adjustments made against the cash consideration. The Transaction Agreement contains customary representations and warranties, covenants and agreements, including entry into a stockholder agreement. The cash consideration was funded from the net proceeds of an $800 million offering of Senior Notes due 2031 and new term loan borrowings under our current credit facility. Argos USA is among the largest cement producers with four integrated cement plants and approximately 140 ready-mix plants in the Southeast, Mid-Atlantic and Texas geographies.
Backlog
Our products are generally delivered upon receipt of orders or requests from customers, or shortly thereafter. Accordingly, the backlog associated with product sales is converted into revenue within a relatively short period of time. Inventory for products is generally maintained in sufficient quantities to meet rapid delivery requirements of customers. Therefore, a period-over-period increase or decrease of backlog does not necessarily result in an improvement or a deterioration of our business. Our backlog includes only those products and projects for which we have obtained a purchase order or a signed contract with the customer and does not include products purchased and sold or services awarded and provided within the period.
Financial Highlights
The principal factors in evaluating our financial condition and operating results as of and for the three and six months ended June 29, 2024 as compared to the three and six months ended July 1, 2023, and certain other highlights include:
•On January 12, 2024, Summit acquired all of the outstanding equity interests in Argos USA for a value of approximately $3.1 billion.
•Net revenue increased $395.1 million and $761.1 million in the three and six months ended June 29, 2024, respectively, primarily resulting from the Transaction, as well as increases in average sales prices, which more than offset reduced volumes due to divestitures completed in 2023.
•Our operating income increased $43.3 million and $13.9 million in the three and six months ended June 29, 2024, respectively, primarily resulting from increased revenues due to the Transaction, which more than offset the greater general and administrative expenses, depreciation, depletion, amortization and accretion expenses incurred as a result of the Transaction, as well as $71.0 million of transaction and integration costs related to the Transaction.
•In the three and six months ended June 29, 2024, average sales price increased 11.8% and 11.3% in aggregates, 2.9% and 2.9% in cement, 10.4% and 11.2% in ready-mix concrete and 1.6% and 2.9% in asphalt, respectively.
•In the three and six months ended June 29, 2024, sales volume decreased 10.0% and 8.8% in aggregates, increased 238.0% and 295.2% in cement, increased 78.2% and 87.1% in ready-mix concrete and decreased 16.9% and 13.3% in asphalt, respectively. The increased sales volumes for cement and ready-mix concrete was primarily due to the combination with Argos USA.
•In the first six months of 2024, Summit Materials, LLC entered into Amendment No.7 to the credit agreement governing our senior secured credit facilities (the "Credit Agreement") and established new terms loans in an aggregate amount of $1.010 billion. Summit Materials, LLC increased the total aggregate commitments under our revolving credit facility from $395.0 million to $625.0 million.
•In the first six months of 2024, we sold three businesses, resulting in total proceeds of $86.0 million and a net gain on disposition of $18.7 million.
Results of Operations
The following discussion of our results of operations is focused on the key financial measures we use to evaluate the performance of our business from both a consolidated and operating segment perspective. Operating income and margins are discussed in terms of changes in volume, pricing and mix of revenue source (i.e., type of product, sales or service revenue). We focus on operating margin, which we define as operating income as a percentage of net revenue, as a key metric when assessing the performance of the business, as analyzing changes in costs in relation to changes in revenue provides more meaningful insight into the results of operations than examining costs in isolation.
Operating income (loss) reflects our profit from operations after taking into consideration cost of revenue, general and administrative expenses, depreciation, depletion, amortization and accretion and gain on sale of property, plant and equipment.
Cost of revenue generally increases ratably with revenue, as labor, transportation costs and subcontractor costs are recorded in cost of revenue. General and administrative expenses as a percentage of revenue vary throughout the year due to the seasonality of our business, and may also be impacted by acquisition and divestiture activities, depending on the size of the business acquired or divested.
Consolidated Results of Operations
The table below sets forth our consolidated results of operations for the three and six months ended June 29, 2024 and July 1, 2023.
| | | | | | | | | | | | | | | | | | | | | | | |
| | Three months ended | | Six months ended |
| | June 29, 2024 | | July 1, 2023 | | June 29, 2024 | | July 1, 2023 |
| ($ in thousands) | | | | | | | |
| Net revenue | $ | 1,075,471 | | | $ | 680,373 | | | $ | 1,848,700 | | | $ | 1,087,643 | |
| Delivery and subcontract revenue | 42,791 | | | 48,777 | | | 74,577 | | | 76,895 | |
| Total revenue | 1,118,262 | | | 729,150 | | | 1,923,277 | | | 1,164,538 | |
| Cost of revenue (excluding items shown separately below) | 750,009 | | | 492,403 | | | 1,374,020 | | | 846,440 | |
| General and administrative expenses | 83,875 | | | 53,838 | | | 152,401 | | | 99,836 | |
| Depreciation, depletion, amortization and accretion | 104,397 | | | 54,787 | | | 200,368 | | | 105,681 | |
| Transaction and integration costs | 10,265 | | | 1,712 | | | 72,473 | | | 2,076 | |
| Gain on sale of property, plant and equipment | (3,180) | | | (3,223) | | | (4,028) | | | (3,653) | |
| Operating income | 172,896 | | | 129,633 | | | 128,043 | | | 114,158 | |
| Interest expense | 52,849 | | | 27,902 | | | 104,741 | | | 55,322 | |
| Loss on debt financings | — | | | — | | | 5,453 | | | 493 | |
| | | | | | | |
| Gain on sale of businesses | (3,758) | | | — | | | (18,743) | | | — | |
| Other income, net | (8,086) | | | (5,478) | | | (16,964) | | | (11,188) | |
| Income from operations before taxes | 131,891 | | | 107,209 | | | 53,556 | | | 69,531 | |
| Income tax expense | 25,816 | | | 22,481 | | | 14,751 | | | 16,015 | |
| Net income | $ | 106,075 | | | $ | 84,728 | | | $ | 38,805 | | | $ | 53,516 | |
Three and six months ended June 29, 2024 compared to the three and six months ended July 1, 2023
| | | | | | | | | | | | | | | | | | | | | | | | | | | | | | | | | | | | | | | | | | | | | | | |
| | Three months ended | | | | | | Six months ended | | | | |
| ($ in thousands) | June 29, 2024 | | July 1, 2023 | | Variance | | June 29, 2024 | | July 1, 2023 | | Variance |
| Net revenue | $ | 1,075,471 | | | $ | 680,373 | | | $ | 395,098 | | | 58.1 | % | | $ | 1,848,700 | | | $ | 1,087,643 | | | $ | 761,057 | | | 70.0 | % |
| Operating income | 172,896 | | | 129,633 | | | 43,263 | | | 33.4 | % | | 128,043 | | | 114,158 | | | 13,885 | | | 12.2 | % |
| Operating margin percentage | 16.1 | % | | 19.1 | % | | | | | | 6.9 | % | | 10.5 | % | | | | |
| Adjusted EBITDA (1) | $ | 296,166 | | | $ | 191,745 | | | $ | 104,421 | | | 54.5 | % | | $ | 417,391 | | | $ | 232,946 | | | $ | 184,445 | | | 79.2 | % |
| Adjusted EBITDA Margin (1) | 27.5 | % | | 28.2 | % | | | | | | 22.6 | % | | 21.4 | % | | | | |
(1)Adjusted EBITDA and Adjusted EBITDA Margin are non-GAAP measures that we find helpful in monitoring the performance of our business. See "Non-GAAP Performance Measures" below for a reconciliation of Adjusted EBITDA to net income (loss), which is the most directly comparable GAAP measure.
Net revenue increased $395.1 million in the three months ended June 29, 2024, primarily resulting from the Transaction as well as organic price increases across all lines of business. In the three months ended June 29, 2024, we recognized $464.0 million of revenue from our recent acquisitions which more than offset a decrease of $46.6 million in net revenue related to divestitures. Of the increase in net revenue, $212.2 million was from increased sales of materials, $185.9 million from increased sales of products, partially offset by $2.9 million from decreased service revenue. We experienced organic volume decline of 9.4%, 16.5%, 14.9% and 6.6% in our aggregates, cement, ready-mix concrete and asphalt lines of business, respectively. The organic volume decreases for aggregates and ready-mix concrete were primarily attributable to unfavorable weather conditions and reduced activity in residential markets in our West segment. The organic volume decline in cement was due to reduced import volume in the River Markets and moderating demand conditions.
Net revenue increased $761.1 million in the six months ended June 29, 2024, primarily resulting from the Transaction as well as organic price increases across all lines of business. In the six months ended June 29, 2024, we recognized $842.5 million of revenue from our recent acquisitions which more than offset a decrease of $68.8 million in net revenue related to divestitures. Of the increase in net revenue, $389.1 million was from increased sales of materials, $365.4 million from increased sales of products, and $6.5 million from increased service revenue. Our organic volumes declined 8.8%, 12.2%, 14.9% and 2.8% in aggregates, cement, ready-mix concrete and asphalt, respectively. The organic volume decreases for aggregates and ready-mix concrete were primarily attributable to unfavorable weather conditions and reduced activity in residential markets in our West segment. We had organic price growth in our aggregates, cement, ready-mix and asphalt lines of business of 10.6%, 6.8%, 6.7% and 1.6%, respectively, during the first six months of 2024.
Operating income increased by $43.3 million and $13.9 million in the three and six months ended June 29, 2024, respectively. In the three and six months ended June 29, 2024, we incurred $10.3 million and $72.5 million of transaction costs, respectively, which were mostly due to $9.7 million and $71.0 million, respectively, of acquisition and integration costs related to our combination with Argos USA.
Our operating margin percentage for the three and six months ended June 29, 2024 decreased from 19.1% to 16.1% and from 10.5% to 6.9%, respectively, from the comparable period a year ago, due to the factors noted above, notably the transaction and integration costs related to our combination with Argos USA. Adjusted EBITDA, as defined in "Non-GAAP Performance Measures" below, increased by $104.4 million and $184.4 million in the three and six months ended June 29, 2024, due to the factors noted above.
As a vertically-integrated company, we include intercompany sales from materials to products and from products to services when assessing the operating results of our business. We refer to revenue inclusive of intercompany sales as gross revenue. These intercompany transactions are eliminated in the consolidated financial statements. Gross revenue by product was as follows:
| | | | | | | | | | | | | | | | | | | | | | | | | | | | | | | | | | | | | | | | | | | | | | | |
| | Three months ended | | | | | | Six months ended | | | | |
| ($ in thousands) | June 29, 2024 | | July 1, 2023 | | Variance | | June 29, 2024 | | July 1, 2023 | | Variance |
| Revenue by product*: | | | | | | | | | | | | | | | |
| Aggregates | $ | 225,148 | | | $ | 223,727 | | | $ | 1,421 | | | 0.6 | % | | $ | 398,645 | | | $ | 392,664 | | | $ | 5,981 | | | 1.5 | % |
| Cement | 364,477 | | | 104,889 | | | 259,588 | | | 247.5 | % | | 628,969 | | | 154,631 | | | 474,338 | | | 306.8 | % |
| Ready-mix concrete | 393,294 | | | 199,826 | | | 193,468 | | | 96.8 | % | | 705,449 | | | 338,970 | | | 366,479 | | | 108.1 | % |
| Asphalt | 77,700 | | | 91,926 | | | (14,226) | | | (15.5) | % | | 105,819 | | | 118,643 | | | (12,824) | | | (10.8) | % |
| Paving and related services | 131,027 | | | 151,011 | | | (19,984) | | | (13.2) | % | | 186,426 | | | 191,728 | | | (5,302) | | | (2.8) | % |
| Other | (73,384) | | | (42,229) | | | (31,155) | | | (73.8) | % | | (102,031) | | | (32,098) | | | (69,933) | | | (217.9) | % |
| Total revenue | $ | 1,118,262 | | | $ | 729,150 | | | $ | 389,112 | | | 53.4 | % | | $ | 1,923,277 | | | $ | 1,164,538 | | | $ | 758,739 | | | 65.2 | % |
*Revenue by product includes intercompany and intracompany sales transferred at market value. The elimination of intracompany transactions is included in Other. Revenue from the liquid asphalt terminals is included in asphalt revenue.
Detail of our volumes and average selling prices by product for the three and six months ended June 29, 2024 and July 1, 2023 were as follows:
| | | | | | | | | | | | | | | | | | | | | | | | | | | | | | | | | | | |
| | Three months ended | | | | |
| | June 29, 2024 | | July 1, 2023 | | | | |
| Volume(1) | | | | Volume(1) | | | | Percentage Change in |
| (in thousands) | | Pricing(2) | | (in thousands) | | Pricing(2) | | Volume | | Pricing |
| Aggregates | 14,758 | | | $ | 15.26 | | | 16,396 | | | $ | 13.65 | | | (10.0) | % | | 11.8 | % |
| Cement | 2,376 | | | 153.43 | | | 703 | | | 149.10 | | | 238.0 | % | | 2.9 | % |
| Ready-mix concrete | 2,376 | | | 165.51 | | | 1,333 | | | 149.91 | | | 78.2 | % | | 10.4 | % |
| Asphalt | 911 | | | 85.25 | | | 1,096 | | | 83.90 | | | (16.9) | % | | 1.6 | % |
| | | | | | | | | | | |
| | Six months ended | | | | |
| | June 29, 2024 | | July 1, 2023 | | | | |
| Volume(1) | | | | Volume(1) | | | | Percentage Change in |
| (in thousands) | | Pricing(2) | | (in thousands) | | Pricing(2) | | Volume | | Pricing |
| Aggregates | 26,412 | | | $ | 15.09 | | | 28,968 | | | $ | 13.56 | | | (8.8) | % | | 11.3 | % |
| Cement | 4,114 | | | 152.87 | | | 1,041 | | | 148.55 | | | 295.2 | % | | 2.9 | % |
| Ready-mix concrete | 4,273 | | | 165.10 | | | 2,284 | | | 148.41 | | | 87.1 | % | | 11.2 | % |
| Asphalt | 1,231 | | | 85.99 | | | 1,420 | | | 83.54 | | | (13.3) | % | | 2.9 | % |
(1)Volumes are shown in tons for aggregates, cement and asphalt and in cubic yards for ready-mix concrete.
(2)Pricing is shown on a per ton basis for aggregates, cement and asphalt and on a per cubic yard basis for ready-mix concrete.
Revenue from aggregates increased $1.4 million and $6.0 million in the three and six months ended June 29, 2024, respectively. In the six months ended June 29, 2024, we had strong organic price increases which were mostly offset by a decrease in organic aggregate volumes. Organic aggregate volumes decreased 8.8% in the first six months of 2024 as compared to the same period a year ago, primarily due to unfavorable weather conditions in certain geographies noted below. Aggregates average sales price of $15.09 per ton increased 11.3% in the first six months of 2024 as compared to the first six months of 2023, due to pricing actions designed to more than offset current inflationary conditions. We continue to focus on value pricing in our local market.
Revenue from cement increased $259.6 million and $474.3 million in the three and six months ended June 29, 2024, respectively, primarily due to our combination with Argos USA. In the three and six months ended June 29, 2024, organic cement average sales prices increased 7.3% and 6.8%, respectively.
Revenue from ready-mix concrete increased $193.5 million and $366.5 million in the three and six months ended June 29, 2024, respectively, primarily due to our combination with Argos USA. In the three and six months ended June 29, 2024, our organic ready-mix concrete volumes decreased 14.9% and 14.9%, respectively, and our organic average sales prices increased 5.6% and 6.7%, respectively.
Revenue from asphalt decreased $14.2 million and $12.8 million in the three and six months ended June 29, 2024, respectively, primarily due to divestitures completed in 2023. In the first six months of 2024, organic volumes decreased by 2.8% due to less favorable weather conditions in 2024. In the first six months of 2024, organic pricing increased 1.6%, with pricing gains across all our major markets.
Other Financial Information
Transaction and Integration Costs
Our transaction and integration costs were $10.3 million and $72.5 million in three and six months ended June 29, 2024, respectively, and $1.7 million and $2.1 million in the three and six months ended July 1, 2023, respectively. In the three and six months ended June 29, 2024, $9.7 million and $71.0 million, respectively, of the transaction and integration costs were related to costs associated with the Transaction.
Interest Expense
Our interest expense was $52.8 million and $104.7 million in the three and six months ended June 29, 2024, respectively, and $27.9 million and $55.3 million in the three and six months ended July 1, 2023, respectively. Our total debt
balance has increased period over period due to the increased debt levels related to the Transaction, resulting in higher interest expense in 2024, which is expected to continue during the remainder of 2024.
Income Tax Expense
Our income tax expense was $25.8 million and $14.8 million in the three and six months ended June 29, 2024, respectively, and our income tax expense was $22.5 million and $16.0 million in the three and six months ended July 1, 2023, respectively. The effective tax rate for Summit Inc. differs from the federal statutory tax rate primarily due to (1) basis differences in assets divested, (2) tax depletion expense in excess of the expense recorded under U.S. GAAP, (3) state taxes, (4) various other items such as limitations on meals and entertainment, certain stock compensation, non-deductible compensation paid to covered employees, and other costs.
The ultimate realization of deferred tax assets is dependent upon the generation of future taxable income during the periods in which those temporary differences become deductible, as well as consideration of tax-planning strategies we may seek to utilize net operating loss carryforwards that begin to expire in 2030.
As of each of June 29, 2024 and December 30, 2023, Summit Inc. had a valuation allowance of $1.1 million, which relates to certain deferred tax assets in taxable entities where realization is not more likely than not.
Segment results of operations
West Segment
| | | | | | | | | | | | | | | | | | | | | | | | | | | | | | | | | | | | | | | | | | | | | | | |
| | Three months ended | | | | | | Six months ended | | | | |
| ($ in thousands) | June 29, 2024 | | July 1, 2023 | | Variance | | June 29, 2024 | | July 1, 2023 | | Variance |
| Net revenue | $ | 423,680 | | | $ | 400,038 | | | $ | 23,642 | | | 5.9 | % | | $ | 707,285 | | | $ | 634,408 | | | $ | 72,877 | | | 11.5 | % |
| Operating income | 70,735 | | | 74,680 | | | (3,945) | | | (5.3) | % | | 83,353 | | | 80,393 | | | 2,960 | | | 3.7 | % |
| Operating margin percentage | 16.7 | % | | 18.7 | % | | | | | | 11.8 | % | | 12.7 | % | | | | |
| Adjusted EBITDA (1) | $ | 101,585 | | | $ | 104,517 | | | $ | (2,932) | | | (2.8) | % | | $ | 144,985 | | | $ | 137,195 | | | $ | 7,790 | | | 5.7 | % |
| Adjusted EBITDA Margin (1) | 24.0 | % | | 26.1 | % | | | | | | 20.5 | % | | 21.6 | % | | | | |
(1)Adjusted EBITDA and Adjusted EBITDA Margin are non-GAAP measures that we find helpful in monitoring the performance of our business. See "Non-GAAP Performance Measures" below for a reconciliation of Adjusted EBITDA to net income (loss), which is the most directly comparable GAAP measure.
Net revenue in the West segment increased $23.6 million and $72.9 million for the three and six months ended June 29, 2024, respectively, due to revenue increases in ready-mix concrete and from the impact of the Transaction. Organic aggregates average sales prices increased 7.1% and 7.8% in the three and six months ended June 29, 2024, respectively, as price increases were implemented across all geographies. Organic aggregate volumes decreased 9.2% in the six month period due, in part, to unfavorable weather conditions and, to a lesser degree, decrease in demand in our South Texas and British Columbia markets, as compared to the first six months of 2023. Organic ready-mix concrete volumes decreased 15.2%, while our organic ready-mix concrete average sales prices increased 6.7% in the first six months of 2024. As we expected, higher mortgage interest rates are impacting nonresidential in the Intermountain West and South Texas markets. These conditions are affecting, to varying degrees, our largest markets, Houston, Phoenix and Salt Lake City.
The West segment’s operating income decreased $3.9 million and increased $3.0 million in the three and six months ended June 29, 2024, respectively. Adjusted EBITDA decreased $2.9 million and increased $7.8 million in the three and six months ended June 29, 2024, respectively, due to the price increases noted above and from the impact of the acquisition of Argos USA ready-mix concrete plants in the Houston market which accounted for $2.1 million and $4.5 million, respectively. The reduction in operating income and Adjusted EBITDA for the three month period was primarily due to severe weather in Houston that negatively impacted construction activity and costs. Adjusted EBITDA margin decreased to 24.0% from 26.1% and to 20.5% from 21.6% during the three and six months ended June 29, 2024, respectively. The operating margin percentage in the West segment decreased in the three and six months ended June 29, 2024 due to product mix and the impact of adverse weather conditions particularly in the Houston market as well as product mix from the Transaction.
Gross revenue by product/ service was as follows:
| | | | | | | | | | | | | | | | | | | | | | | | | | | | | | | | | | | | | | | | | | | | | | | |
| | Three months ended | | | | | | Six months ended | | | | |
| ($ in thousands) | June 29, 2024 | | July 1, 2023 | | Variance | | June 29, 2024 | | July 1, 2023 | | Variance |
| Revenue by product*: | | | | | | | | | | | | | | | |
| Aggregates | $ | 104,832 | | | $ | 110,258 | | | $ | (5,426) | | | (4.9) | % | | $ | 186,876 | | | $ | 190,772 | | | $ | (3,896) | | | (2.0) | % |
| Ready-mix concrete | 201,429 | | | 172,654 | | | 28,775 | | | 16.7 | % | | 361,088 | | | 295,910 | | | 65,178 | | | 22.0 | % |
| Asphalt | 77,700 | | | 82,752 | | | (5,052) | | | (6.1) | % | | 105,403 | | | 106,513 | | | (1,110) | | | (1.0) | % |
| Paving and related services | 131,027 | | | 131,102 | | | (75) | | | (0.1) | % | | 185,433 | | | 168,494 | | | 16,939 | | | 10.1 | % |
| Other | (61,606) | | | (66,028) | | | 4,422 | | | 6.7 | % | | (80,880) | | | (80,069) | | | (811) | | | (1.0) | % |
| Total revenue | $ | 453,382 | | | $ | 430,738 | | | $ | 22,644 | | | 5.3 | % | | $ | 757,920 | | | $ | 681,620 | | | $ | 76,300 | | | 11.2 | % |
*Revenue by product includes intercompany and intracompany sales transferred at market value. The elimination of intracompany transactions is included in “Other.” Revenue from the liquid asphalt terminals is included in asphalt revenue.
The West segment’s percent changes in sales volumes and pricing in the three and six months ended June 29, 2024 from the three and six months ended July 1, 2023 were as follows:
| | | | | | | | | | | | | | | | | | | | | | | |
| | Three months ended | | Six months ended |
| Percentage Change in | | Percentage Change in |
| Volume | | Pricing | | Volume | | Pricing |
| Aggregates | (12.2) | % | | 8.3 | % | | (10.1) | % | | 9.0 | % |
| Ready-mix concrete | 12.4 | % | | 3.8 | % | | 16.4 | % | | 4.9 | % |
| Asphalt | (6.6) | % | | 0.4 | % | | (2.6) | % | | 1.6 | % |
Revenue from aggregates in the West segment decreased $5.4 million and $3.9 million in the three and six months ended June 29, 2024, respectively. Aggregates pricing for the three and six months ended June 29, 2024 increased 8.3% and 9.0%, respectively, when compared to the same period in 2023. A 12.2% decrease in sales volumes in the second quarter of 2024 were partially offset by increased average sales prices. In the three and six months ended June 29, 2024, aggregate volumes decreased in our British Columbia and South Texas markets, which more than offset increases in our Intermountain West and North Texas markets.
Revenue from ready-mix concrete in the West segment increased $28.8 million and $65.2 million in the three and six months ended June 29, 2024, respectively, primarily resulting from the acquisition of the Argos USA ready-mix plants in the Houston market. For the three and six months ended June 29, 2024, our organic ready-mix concrete volumes decreased 13.9% and 15.2%, respectively, which was partially offset by increased organic ready-mix concrete prices of 5.3% and 6.7%, respectively. For the three and six months ended June 29, 2024, our organic ready-mix concrete volumes decreased due to unfavorable weather in our South Texas market and reduced private end-market activity.
Revenue from asphalt in the West segment decreased $5.1 million and $1.1 million in the three and six months ended June 29, 2024, respectively. For the three and six months ended June 29, 2024, asphalt volumes decreased 6.6% and 2.6%, respectively, primarily due to reduced market demand in our British Colombia and Intermountain West markets. Average sales prices for asphalt increased 0.4% and 1.6% in the three and six months ended June 29, 2024, respectively. Revenue for paving and related services in the West segment decreased by $0.1 million and increased $16.9 million in the three and six months ended June 29, 2024, respectively.
Prior to eliminations of intercompany transactions, the net effect of volume and pricing changes on gross revenue in the six months ended June 29, 2024 was approximately $26.5 million and 33.6 million, respectively.
East Segment
| | | | | | | | | | | | | | | | | | | | | | | | | | | | | | | | | | | | | | | | | | | | | | | |
| | Three months ended | | | | | | Six months ended | | | | |
| ($ in thousands) | June 29, 2024 | | July 1, 2023 | | Variance | | June 29, 2024 | | July 1, 2023 | | Variance |
| Net revenue | $ | 326,970 | | | $ | 168,460 | | | $ | 158,510 | | | 94.1 | % | | $ | 584,811 | | | $ | 287,243 | | | $ | 297,568 | | | 103.6 | % |
| Operating income | 46,882 | | | 31,603 | | | 15,279 | | | 48.3 | % | | 60,874 | | | 34,567 | | | 26,307 | | | 76.1 | % |
| Operating margin percentage | 14.3 | % | | 18.8 | % | | | | | | 10.4 | % | | 12.0 | % | | | | |
| Adjusted EBITDA (1) | $ | 70,554 | | | $ | 47,617 | | | $ | 22,937 | | | 48.2 | % | | $ | 108,030 | | | $ | 66,469 | | | $ | 41,561 | | | 62.5 | % |
| Adjusted EBITDA Margin (1) | 21.6 | % | | 28.3 | % | | | | | | 18.5 | % | | 23.1 | % | | | | |
(1)Adjusted EBITDA and Adjusted EBITDA Margin are non-GAAP measures that we find helpful in monitoring the performance of our business. See "Non-GAAP Performance Measures" below for a reconciliation of Adjusted EBITDA to net income (loss), which is the most directly comparable GAAP measure.
Net revenue in the East segment increased $158.5 million and $297.6 million in the three and six months ended June 29, 2024, respectively, as compared to the same period a year ago, primarily due to the impact of the Transaction. Operating income increased $15.3 million and $26.3 million in the three and six months ended June 29, 2024, respectively. Adjusted EBITDA increased $22.9 million and $41.6 million in the three and six months ended June 29, 2024, respectively, which more than offset the negative impact to Adjusted EBITDA from two divestitures totaling $5.0 million and $7.6 million in the three and six months ended June 29, 2024, respectively. Operating income margin decreased to 14.3% from 18.8% and to 10.4% from 12.0% in the three and six months ended June 29, 2024, respectively, as compared to the same period a year ago. Adjusted EBITDA Margin decreased to 21.6% from 28.3% and to 18.5% from 23.1% in the three and six months ended June 29, 2024, respectively, as compared to the same period a year ago, due to higher contribution from our acquired ready-mix concrete operations which have lower operating and Adjusted EBITDA margins than our aggregates line of businesses.
Gross revenue by product/ service was as follows:
| | | | | | | | | | | | | | | | | | | | | | | | | | | | | | | | | | | | | | | | | | | | | | | |
| | Three months ended | | | | | | Six months ended | | | | |
| ($ in thousands) | June 29, 2024 | | July 1, 2023 | | Variance | | June 29, 2024 | | July 1, 2023 | | Variance |
| Revenue by product*: | | | | | | | | | | | | | | | |
| Aggregates | $ | 120,316 | | | $ | 113,469 | | | $ | 6,847 | | | 6.0 | % | | $ | 211,769 | | | $ | 201,892 | | | $ | 9,877 | | | 4.9 | % |
| Ready-mix concrete | 191,865 | | | 27,172 | | | 164,693 | | | 606.1 | % | | 344,361 | | | 43,060 | | | 301,301 | | | 699.7 | % |
| Asphalt | — | | | 9,174 | | | (9,174) | | | — | % | | 416 | | | 12,130 | | | (11,714) | | | (96.6) | % |
| Paving and related services | — | | | 19,909 | | | (19,909) | | | — | % | | 993 | | | 23,234 | | | (22,241) | | | (95.7) | % |
| Other | 27,878 | | | 16,813 | | | 11,065 | | | 65.8 | % | | 51,214 | | | 36,610 | | | 14,604 | | | 39.9 | % |
| Total revenue | $ | 340,059 | | | $ | 186,537 | | | $ | 153,522 | | | 82.3 | % | | $ | 608,753 | | | $ | 316,926 | | | $ | 291,827 | | | 92.1 | % |
*Revenue by product includes intercompany and intracompany sales transferred at market value. The elimination of intracompany transactions is included in Other. Revenue from the liquid asphalt terminals is included in asphalt revenue.
The East segment’s percent changes in sales volumes and pricing in the three and six months ended June 29, 2024 from the three and six months ended July 1, 2023 were as follows:
| | | | | | | | | | | | | | | | | | | | | | | |
| | Three months ended | | Six months ended |
| Percentage Change in | | Percentage Change in |
| Volume | | Pricing | | Volume | | Pricing |
| Aggregates | (7.6) | % | | 14.8 | % | | (7.5) | % | | 13.3 | % |
| Ready-mix concrete | 460.2 | % | | 26.1 | % | | 535.7 | % | | 25.8 | % |
| Asphalt | (100.0) | % | | (100.0) | % | | (97.5) | % | | 32.7 | % |
Revenue from aggregates in the East segment increased $6.8 million and $9.9 million in the three and six months ended June 29, 2024, respectively, as compared to the same period a year ago as increases in average sales prices more than offset the impact of lower sales volumes. Aggregate pricing increased 14.8% and 13.3% in the three and six months ended June 29, 2024, respectively, due to price increases across all of our major markets. Aggregate volumes in the three and six months ended June 29, 2024 decreased 7.6% and 7.5%, respectively, due, in part, to unfavorable weather and lower volumes in our Kansas markets.
Revenue from ready-mix concrete in the East segment increased $164.7 million and $301.3 million as ready-mix concrete volumes increased 460.2% and 535.7% in the three and six months ended June 29, 2024, respectively, as compared to the same period in 2023, primarily due to the acquisition of the Argos USA ready-mix concrete operations notably in Florida, Georgia and the Carolinas. In the six months ended June 29, 2024, our ready-mix concrete average sales prices increased 25.8% due to higher prices in our recently acquired Florida, Carolinas and Georgia markets.
Due entirely to a 2024 divestiture, revenue from asphalt decreased $9.2 million and $11.7 million in the three and six months ended June 29, 2024, respectively, when compared to the same periods in 2023. Asphalt pricing increased 32.7% in the six months ended June 29, 2024. Paving and related service revenue decreased $19.9 million and $22.2 million in the three and six months ended June 29, 2024, respectively.
Prior to eliminations of intercompany transactions, the net effect of volume and pricing changes on gross revenue in the six months ended June 29, 2024 was approximately $248.3 million and $51.2 million, respectively.
Cement Segment
| | | | | | | | | | | | | | | | | | | | | | | | | | | | | | | | | | | | | | | | | | | | | | | |
| | Three months ended | | | | | | Six months ended | | | | |
| ($ in thousands) | June 29, 2024 | | July 1, 2023 | | Variance | | June 29, 2024 | | July 1, 2023 | | Variance |
| Net revenue | $ | 324,821 | | | $ | 111,875 | | | $ | 212,946 | | | 190.3 | % | | $ | 556,604 | | | $ | 165,992 | | | $ | 390,612 | | | 235.3 | % |
| Operating income | 92,015 | | | 43,037 | | | 48,978 | | | 113.8 | % | | 109,684 | | | 35,093 | | | 74,591 | | | 212.6 | % |
| Operating margin percentage | 28.3 | % | | 38.5 | % | | | | | | 19.7 | % | | 21.1 | % | | | | |
| Adjusted EBITDA (1) | $ | 140,769 | | | $ | 52,872 | | | $ | 87,897 | | | 166.2 | % | | $ | 200,223 | | | $ | 52,882 | | | $ | 147,341 | | | 278.6 | % |
| Adjusted EBITDA Margin (1) | 43.3 | % | | 47.3 | % | | | | | | 36.0 | % | | 31.9 | % | | | | |
(1)Adjusted EBITDA and Adjusted EBITDA Margin are non-GAAP measures that we find helpful in monitoring the performance of our business. See "Non-GAAP Performance Measures" below for a reconciliation of Adjusted EBITDA to net income (loss), which is the most directly comparable GAAP measure.
Net revenue in the Cement segment increased $212.9 million and $390.6 million primarily due to the acquisition of the four Argos USA cement plants, as well as an average sales price increases of 2.9% in the three and six months ended June 29, 2024, respectively.
Operating income increased $49.0 million and $74.6 million during the three and six months ended June 29, 2024, respectively, despite increased depreciation expense resulting from the revaluation of assets from our combination with Argos USA. Operating margin percentage for the three and six months ended June 29, 2024 decreased to 28.3% from 38.5% and to 19.7% from 21.1%, respectively, from the comparable period a year ago for the same reason. In the three months ended June 29, 2024, Adjusted EBITDA margin decreased to 43.3% from 47.3% due to a combination of product mix from the Transaction and planned maintenance at one of our cement plants. For the six months ended June 29, 2024, Adjusted EBITDA margin increased to 36.0% from 31.9% due to reduced seasonality relative to the prior year.
Gross revenue by product was as follows:
| | | | | | | | | | | | | | | | | | | | | | | | | | | | | | | | | | | | | | | | | | | | | | | |
| | Three months ended | | | | | | Six months ended | | | | |
| ($ in thousands) | June 29, 2024 | | July 1, 2023 | | Variance | | June 29, 2024 | | July 1, 2023 | | Variance |
| Revenue by product*: | | | | | | | | | | | | | | | |
| Cement | $ | 364,477 | | | $ | 104,889 | | | $ | 259,588 | | | 247.5 | % | | $ | 628,969 | | | $ | 154,631 | | | $ | 474,338 | | | 306.8 | % |
| Other | (39,656) | | | 6,986 | | | (46,642) | | | (667.6) | % | | (72,365) | | | 11,361 | | | (83,726) | | | (737.0) | % |
| Total revenue | $ | 324,821 | | | $ | 111,875 | | | $ | 212,946 | | | 190.3 | % | | $ | 556,604 | | | $ | 165,992 | | | $ | 390,612 | | | 235.3 | % |
*Revenue by product includes intercompany and intracompany sales transferred at market value. Revenue from waste processing and the elimination of intracompany transactions is included in Other.
The Cement segment’s percent changes in sales volumes and pricing in the three and six months ended June 29, 2024 from the three and six months ended July 1, 2023 were as follows:
| | | | | | | | | | | | | | | | | | | | | | | |
| | Three months ended | | Six months ended |
| Percentage Change in | | Percentage Change in |
| Volume | | Pricing | | Volume | | Pricing |
| Cement | 238.0 | % | | 2.9 | % | | 295.2 | % | | 2.9 | % |
Revenue from cement increased $259.6 million and $474.3 million in the three and six months ended June 29, 2024, respectively, due to the addition of the four Argos USA cement plants as well as average cement pricing gains of 2.9%.
Liquidity and Capital Resources
Our primary sources of liquidity include cash on-hand, cash provided by operations, amounts available for borrowing under our senior secured credit facilities and capital-raising activities in the debt and capital markets. In addition to our current sources of liquidity, we have access to liquidity through public offerings of shares of our Class A common stock. To facilitate such offerings, in January 2023, we filed a shelf registration statement with the SEC that will expire in January 2026. The amount of Class A common stock to be issued pursuant to this shelf registration statement was not specified when it was filed and there is no specific limit on the amount we may issue. The specifics of any future offerings, along with the use of the proceeds thereof, will be described in detail in a prospectus supplement, or other offering materials, at the time of any offering.
As of June 29, 2024, we had $538.7 million in cash and cash equivalents and $926.9 million of working capital compared to $374.2 million and $609.2 million, respectively, at December 30, 2023. Working capital is calculated as current assets less current liabilities. There was no restricted cash balances as of June 29, 2024 and $800 million of restricted cash as of December 30, 2023 related to the Transaction. In January 2024, we amended our senior secured revolving credit facility, increasing the total availability to $625.0 million and extending the maturity date to January 2029. We had no outstanding borrowings on our senior secured revolving credit facility, which had borrowing capacity of $592.7 million as of June 29, 2024, which is net of $32.3 million of outstanding letters of credit and is fully available to us within the terms and covenant requirements of our Credit Agreement.
In March 2022, our Board of Directors authorized a share repurchase program, whereby we can repurchase up to $250.0 million of our Class A common stock. No repurchases were made during the six month period ended June 29, 2024. As of June 29, 2024, approximately $149.0 million remained available for share repurchases under the share repurchase program.
Given the seasonality of our business, we typically experience significant fluctuations in working capital needs and balances throughout the year. Our working capital requirements generally increase during the first half of the year as we build up inventory and focus on repair and maintenance and other set-up costs for the upcoming season. Working capital levels then decrease as the construction season winds down and we enter the winter months, which is when we see significant inflows of cash from the collection of receivables.
As of June 29, 2024 and December 30, 2023, our long-term borrowings totaled $2.8 billion and $2.3 billion, respectively, for which we incurred $48.2 million and $95.6 million of interest expense for the three and six months ended June 29, 2024, respectively and $25.0 million and $49.2 million of interest expense for the three and six months ended July 1, 2023, respectively. We expect that normal operating cash flow will be sufficient to fund our seasonal working capital needs. We had no outstanding borrowings on the senior secured revolving credit facility as of June 29, 2024.
We believe we have access to sufficient financial resources from our liquidity sources to fund our business and operations, including contractual obligations, capital expenditures and debt service obligations, for the next twelve months and foreseeable future. Our growth strategy contemplates future acquisitions for which we believe we have sufficient access to capital. We also plan to divest of certain dilutive businesses as we rationalize our portfolio, which will also generate additional capital.
We and our affiliates may from time to time purchase our outstanding debt through open market purchases, privately negotiated transactions or otherwise. Purchases or retirement of debt, if any, will depend on prevailing market conditions, liquidity requirements, contractual restrictions and other factors. The amounts involved may be material.
Indebtedness
Please refer to the notes to the consolidated interim financial statements for detailed information about our long-term debt, scheduled maturities of long-term debt and affirmative and negative covenants, including the maximum allowable consolidated first lien net leverage ratio. As of June 29, 2024, we were in compliance with all debt covenants. At June 29, 2024 and December 30, 2023, $2.8 billion and $2.3 billion, respectively, of total debt was outstanding under our respective debt
agreements. Due to our ongoing divestiture program, we have made prepayments on our term loan and may be required to do so again in the future.
Cash Flows
The following table summarizes our net cash used in or provided by operating, investing and financing activities and our capital expenditures in the six months ended June 29, 2024 and July 1, 2023:
| | | | | | | | | | | |
| | Summit Inc. |
| ($ in thousands) | June 29, 2024 | | July 1, 2023 |
| Net cash provided by (used in): | | | |
| Operating activities | $ | 111,404 | | | $ | 94,042 | |
| Investing activities | (1,212,449) | | | (360,651) | |
| Financing activities | 467,182 | | | (24,579) | |
Operating activities
During the six months ended June 29, 2024, cash provided by operating activities was $111.4 million primarily as a result of:
•Net income of $38.8 million, decreased by non-cash expenses, including $206.7 million of depreciation, depletion, amortization and accretion expense and $14.1 million of share-based compensation, offset by the net gain on asset and business disposals of $22.8 million.
•Billed and unbilled accounts receivable increased by $128.7 million in the first six months of 2024 as a result of the seasonality of our business. The majority of our sales occur in the spring, summer and fall and we typically incur an increase in accounts receivable (net billed and unbilled) during the second and third quarters of each year. This amount is typically converted to cash in the fourth and first quarters. Our inventory levels also increased during the first quarter as we prepared for the increase in activity over the warmer months.
•The timing of payments associated with accounts payable and accrued expenses of cash, which is consistent with the seasonality of our business whereby we build-up inventory levels and incur repairs and maintenance costs to ready the business for increased sales volumes in the summer and fall. These costs are typically incurred in the first half of the year and paid by year-end. In addition, we made $53.2 million of interest payments in the six months ended June 29, 2024.
During the six months ended July 1, 2023, cash provided by operating activities was $94.0 million primarily as a result of:
•Net income of $53.5 million, decreased by non-cash expenses, including $110.7 million of depreciation, depletion, amortization and accretion expense and $9.9 million of share-based compensation, offset by the net gain on asset disposals of $3.7 million.
•Billed and unbilled accounts receivable increased by $129.9 million in the first six months of 2023 as a result of the seasonality of our business. The majority of our sales occur in the spring, summer and fall and we typically incur an increase in accounts receivable (net billed and unbilled) during the second and third quarters of each year. This amount is typically converted to cash in the fourth and first quarters. Our inventory levels also increased during the first quarter as we prepared for the increase in activity over the warmer months.
•The timing of payments associated with accounts payable and accrued expenses of cash, which is consistent with the seasonality of our business whereby we build-up inventory levels and incur repairs and maintenance costs to ready the business for increased sales volumes in the summer and fall. These costs are typically incurred in the first half of the year and paid by year-end. In addition, we made $38.1 million of interest payments in the six months ended July 1, 2023.
Investing activities
During the six months ended June 29, 2024, cash used for investing activities was $1,212.4 million, of which $1,113.3 million was used primarily for the Transaction, $176.0 million was invested in capital expenditures, $21.4 million was used to
purchase intellectual property and was partially offset by $14.2 million of proceeds from asset sales. We also received net proceeds of $86.0 million from the divestiture of three businesses.
During the six months ended July 1, 2023, cash used for investing activities was $360.7 million, of which $126.9 million was invested in capital expenditures and $237.7 million was used for acquisitions in the West and East segments, and was partially offset by $5.8 million of proceeds from asset sales.
Financing activities
During the six months ended June 29, 2024, cash provided by financing activities was $467.2 million, primarily related to the increase in our senior secured credit facility due to the Transaction. We also made $509.8 million of payments on debt, $6.3 million payments on acquisition-related liabilities and used $9.7 million on shares redeemed to settle taxes on restricted stock units.
During the six months ended July 1, 2023, cash used in financing activities was $24.6 million. We made $6.7 million of payments on debt, $11.5 million payments on acquisition-related liabilities and used $6.0 million on shares redeemed to settle taxes on restricted stock units.
Cash paid for capital expenditures
We paid cash of approximately $176.0 million in capital expenditures in the six months ended June 29, 2024 compared to $126.9 million in the six months ended July 1, 2023.
We currently estimate that we will invest between $430 million to $470 million inclusive of spend associated with greenfield projects. The timing of our greenfield expenditures is dependent upon the timing of when permits may be issued. We expect to fund our capital expenditure program through cash on hand, cash from operations, and outside financing arrangements including our senior secured revolving credit facility.
Tax Receivable Agreement
When the Company purchases LP Units for cash or LP Units are exchanged for shares of Class A common stock, this results in increases in the Company’s share of the tax basis of the tangible and intangible assets of Summit Holdings. These increases in tax basis may increase, for tax purposes, depreciation and amortization deductions and therefore reduce the amount of tax that Summit Inc. would otherwise be required to pay in the future. In connection with our initial public offering, we entered into a TRA with the holders of the LP Units that provides for the payment by Summit Inc. to exchanging holders of LP Units of 85% of the benefits, if any, that Summit Inc. actually realizes (or, under certain circumstances such as an early termination of the TRA is deemed to realize) as a result of these increases in tax basis and certain other tax benefits related to entering into the TRA, including tax benefits attributable to payments under the TRA. The amount and timing of any payments under the TRA, are difficult to accurately estimate, as they will vary depending upon a number of factors, including the amount and timing of our income and the effective tax rate.
We anticipate funding payments under the TRA from cash flows from operations, available cash and available borrowings under our senior secured revolving credit facility. As of June 29, 2024, we had accrued $48.0 million as TRA liability in our consolidated financial statements. Of the total TRA liability, $0.3 million is expected to be paid in the next twelve months.
In the six months ended June 29, 2024, Summit Inc. acquired the remaining 763,243 LP Units in exchange for an equal number of newly-issued shares of Summit Inc.’s Class A common stock. As of June 29, 2024 and December 30, 2023, we had recorded $48.0 million and $41.7 million of TRA liability, respectively.
For the three months ended June 29, 2024, based on a contractually defined discount rate of 6.33%, if the early termination provisions of the TRA were triggered, the aggregate amount required to settle the TRA would be approximately $26.3 million. Estimating the amount and the timing of payments that may be made under the TRA is by its nature difficult and imprecise, insofar as the amounts payable depends on a variety of factors, including, but not limited to, the timing of the generation of future taxable income.
Commitments and contingencies
We are party to certain legal actions arising from the ordinary course of business activities. Accruals are recorded when the outcome is probable and can be reasonably estimated. While the ultimate results of claims and litigation cannot be predicted with certainty, management expects that the ultimate resolution of all pending or threatened claims and litigation will not have a material effect on our consolidated financial position, results of operations or liquidity. We record legal fees as incurred.
Litigation and claims—On January 4, 2021, prior to the closing of the Transaction, Argos USA entered into a Deferred Prosecution Agreement (“DPA”) with the U.S. Department of Justice (“DOJ”) related to the sale of ready-mix concrete in the greater Savannah, Georgia area by a small number of employees who joined the Company in October 2011 and were subsequently terminated. Pursuant to the DPA, Argos USA paid a monetary penalty of $20.0 million and was required, among other things, to periodically review and update its antitrust compliance program. The three-year term of the DPA expired on January 4, 2024. As Argos USA fully complied with the terms of the DPA, on January 18, 2024, following the conclusion of the DPA’s three-year term, the United States District Court for the Southern District of Georgia dismissed the criminal charge that was filed against the company in January 2021. Argos USA's failure to comply with the terms and conditions of the DPA could result in additional criminal prosecution or penalties as well as continued expenses in defending these proceedings. In addition, Argos USA has been named a defendant in a putative class action filed under the caption Pro Slab, Inc. et al. v. Argos USA LLC et al. on behalf of purchasers of ready-mix concrete on November 22, 2017 in the U.S. District Court for the District of South Carolina and includes allegations of price-fixing, market allocation and other anti-competitive practices in the Savannah, Georgia and Charleston, South Carolina markets, seeking monetary damages and other remedies. This case was stayed on February 9, 2022 pending the resolution of the same criminal indictments, and only limited, written discovery may proceed while this stay is in effect.
On June 13, 2023, prior to the closing of the Transaction, Argos USA entered into a settlement and compliance agreement with the Federal Highway Administration of the U.S. Department of Transportation that requires, among other things, appointment of an independent monitor until June 2025 to monitor, among other things, bids or awards of publicly funded contracts in Georgia and South Carolina for our ready-mix and cement business, as well as our code of business conduct, antitrust compliance policy, and antitrust compliance program.
Environmental Remediation—Our operations are subject to and affected by federal, state, provincial and local laws and regulations relating to the environment, health and safety and other regulatory matters. These operations require environmental operating permits, which are subject to modification, renewal and revocation. We regularly monitor and review its operations, procedures and policies for compliance with these laws and regulations. Despite these compliance efforts, risk of environmental liability is inherent in the operation of our business, as it is with other companies engaged in similar businesses and there can be no assurance that environmental liabilities and noncompliance will not have a material adverse effect on our consolidated financial condition, results of operations or liquidity.
Other—We are obligated under various firm purchase commitments for certain raw materials and services that are in the ordinary course of business. Management does not expect any significant changes in the market value of these goods and services during the commitment period that would have a material adverse effect on the financial condition, results of operations, and cash flows of the Company. The terms of the purchase commitments generally approximate one year.
Supplemental Guarantor Financial Information
Summit LLC’s domestic wholly-owned subsidiary companies other than Summit Finance Corp. are named as guarantors (collectively, the “Guarantors”) of the Senior Notes. Summit Finance Corp. (the “Subsidiary Issuer”) does not and will not have any assets or operations other than as may be incidental to its activities as a co-issuer of the Senior Notes and other indebtedness. Certain other partially-owned subsidiaries and a non-U.S. entity do not guarantee the Senior Notes (collectively, the “Non-Guarantors”). The Guarantors provide a joint and several, full and unconditional guarantee of the Senior Notes. As of June 29, 2024, Summit LLC had issued and outstanding $1.8 billion aggregate principal amount of senior notes maturing on various dates between 2027 and 2031. For Further information regarding the Senior Notes, see the information under the caption "Senior Notes" note 6, “Debt” in the notes to our unaudited consolidated financial statements included elsewhere in this Quarterly Report on Form 10-Q.
There are no significant restrictions on Summit LLC’s ability to obtain funds from any of the Guarantors in the form of dividends or loans. Additionally, there are no significant restrictions on a Guarantor’s ability to obtain funds from Summit LLC or its direct or indirect subsidiaries.
The obligations of the Subsidiary Issuer to pay principal, premiums, if any, and interest are guaranteed jointly and severally on an unsecured senior basis by Summit LLC and substantially all of its 100% owned subsidiaries. The guarantees are
full and unconditional, and the Subsidiary Issuer and each of the Guarantor Subsidiaries are consolidated subsidiaries of Summit LLC. Our Non-Guarantor Subsidiaries do not guarantee the Senior Notes. Our material operations are conducted almost entirely through the Guarantor Subsidiaries. Accordingly, the Subsidiary Issuer’s cash flow and ability to service the Senior Notes is dependent upon the earnings of the Company’s subsidiaries and the distribution of those earnings to the Subsidiary Issuer, whether by dividends, loans or otherwise. The obligations of the Guarantors under their guarantees will be limited as necessary to recognize certain defenses generally available to guarantors (including those that relate to fraudulent conveyance or transfer, voidable preference or similar laws affecting the rights of creditors generally) under applicable law. Summarized financial information regarding the Issuer and the Guarantors has been omitted herein because such information would not be materially different from our unaudited consolidated financial statements included elsewhere in this Quarterly Report on Form 10-Q.
Our Non-Guarantor Subsidiaries collectively represented approximately 2.7% of our total assets, 3.6% of our total liabilities, 2.7% of consolidated revenue, and 6.4% of consolidated operating income as of June 29, 2024, which is not materially different than corresponding amounts included in the consolidated financial statements of the Guarantors. As of June 29, 2024, our Non-Guarantor Subsidiaries had no indebtedness outstanding other than intercompany debt. Summit Inc. has an additional $9.8 million in cash, $47.7 million of tax receivable agreement liability, $19.6 million income tax expense and a lower deferred tax liability of $109.5 million when compared to Summit LLC. Summit Inc. and Summit LLC have eliminating payables and receivables, respectively, of tax receivable agreement interests of $126.1 million. Financial metrics comparing information regarding Summit LLC have been omitted herein because such information would not be materially different, other than what is disclosed above, from our unaudited consolidated financial statements included elsewhere in this Quarterly Report on Form 10-Q.
Off-Balance sheet arrangements
As of June 29, 2024, we had no material off-balance sheet arrangements.
Non-GAAP Performance Measures
We evaluate our operating performance using metrics that we refer to as “Adjusted EBITDA,” “Adjusted EBITDA Margin,” “Adjusted Cash Gross Profit” and “Adjusted Cash Gross Profit Margin” which are not defined by U.S. GAAP and should not be considered as an alternative to earnings measures defined by U.S. GAAP. We define Adjusted EBITDA as EBITDA ("EBITDA" refers to net income (loss) before interest expense (income), income tax expense (benefit) and depreciation, depletion and amortization), adjusted to exclude accretion, loss on debt financings, acquisition and integration costs related to our combination with Argos USA, gain on sale of business, non-cash compensation and certain other non-cash and non-operating items. We define Adjusted EBITDA Margin as Adjusted EBITDA divided by net revenue. We define Adjusted Cash Gross Profit as operating income before general and administrative expenses, depreciation, depletion, amortization and accretion and Adjusted Cash Gross Profit Margin as Adjusted Cash Gross Profit as a percentage of net revenue.
We present Adjusted EBITDA, Adjusted EBITDA Margin, Adjusted Cash Gross Profit and Adjusted Cash Gross Profit Margin for the convenience of investment professionals who use such metrics in their analyses. The investment community often uses these metrics to assess the operating performance of a company’s business and to provide a consistent comparison of performance from period to period. We use these metrics, among others, to assess the operating performance of our individual segments and the consolidated company.
Non-GAAP financial measures are not standardized; therefore, it may not be possible to compare such financial measures with other companies’ non-GAAP financial measures having the same or similar names. We strongly encourage investors to review our consolidated financial statements in their entirety and not rely on any single financial measure.
The tables below reconcile our net income (loss) to EBITDA and Adjusted EBITDA, present Adjusted EBITDA by segment and reconcile operating income to Adjusted Cash Gross Profit for the periods indicated:
| | | | | | | | | | | | | | | | | | | | | | | | | | | | | |
| Reconciliation of Net Income (Loss) to Adjusted EBITDA | Three months ended June 29, 2024 |
| by Segment | West | | East | | Cement | | Corporate | | Consolidated |
| ($ in thousands) | | | | | | | | | |
| Net income (loss) | $ | 82,939 | | | $ | 51,434 | | | $ | 98,787 | | | $ | (127,085) | | | $ | 106,075 | |
| Interest (income) expense | (7,734) | | | (5,408) | | | (6,286) | | | 72,277 | | | 52,849 | |
| Income tax expense | 1,300 | | | — | | | — | | | 24,516 | | | 25,816 | |
| Depreciation, depletion and amortization | 29,824 | | | 22,841 | | | 48,224 | | | 2,490 | | | 103,379 | |
| EBITDA | $ | 106,329 | | | $ | 68,867 | | | $ | 140,725 | | | $ | (27,802) | | | $ | 288,119 | |
| Accretion | 446 | | | 528 | | | 44 | | | — | | | 1,018 | |
| | | | | | | | | |
| | | | | | | | | |
| (Gain) loss on sale of businesses | (4,672) | | | 914 | | | — | | | — | | | (3,758) | |
| Non-cash compensation | — | | | — | | | — | | | 7,413 | | | 7,413 | |
| Argos USA acquisition and integration costs (1) | — | | | — | | | — | | | 9,737 | | | 9,737 | |
| Other (2) | (518) | | | 245 | | | — | | | (6,090) | | | (6,363) | |
| Adjusted EBITDA | $ | 101,585 | | | $ | 70,554 | | | $ | 140,769 | | | $ | (16,742) | | | $ | 296,166 | |
| | | | | | | | | | | | | | | | | | | | | | | | | | | | | |
| Reconciliation of Net Income (Loss) to Adjusted EBITDA | Six months ended June 29, 2024 |
| by Segment | West | | East | | Cement | | Corporate | | Consolidated |
| ($ in thousands) | | | | | | | | | |
| Net income (loss) | $ | 101,889 | | | $ | 85,925 | | | $ | 123,780 | | | $ | (272,789) | | | $ | 38,805 | |
| Interest (income) expense | (14,497) | | | (9,980) | | | (12,640) | | | 141,858 | | | 104,741 | |
| Income tax expense | 1,809 | | | — | | | — | | | 12,942 | | | 14,751 | |
| Depreciation, depletion and amortization | 59,718 | | | 45,400 | | | 88,887 | | | 4,337 | | | 198,342 | |
| EBITDA | $ | 148,919 | | | $ | 121,345 | | | $ | 200,027 | | | $ | (113,652) | | | $ | 356,639 | |
| Accretion | 890 | | | 1,050 | | | 86 | | | — | | | 2,026 | |
| Loss on debt financings | — | | | — | | | — | | | 5,453 | | | 5,453 | |
| Tax receivable agreement expense | — | | | — | | | — | | | — | | | — | |
| Gain on sale of businesses | (3,828) | | | (14,915) | | | — | | | — | | | (18,743) | |
| Non-cash compensation | — | | | — | | | — | | | 14,133 | | | 14,133 | |
| Argos USA acquisition and integration costs (1) | — | | | 62 | | | 110 | | | 70,859 | | | 71,031 | |
| Other (2) | (996) | | | 488 | | | — | | | (12,640) | | | (13,148) | |
| Adjusted EBITDA | $ | 144,985 | | | $ | 108,030 | | | $ | 200,223 | | | $ | (35,847) | | | $ | 417,391 | |
| | | | | | | | | | | | | | | | | | | | | | | | | | | | | |
| Reconciliation of Net Income (Loss) to Adjusted EBITDA | Three months ended July 1, 2023 |
| by Segment | West | | East | | Cement | | Corporate | | Consolidated |
| ($ in thousands) | | | | | | | | | |
| Net income (loss) | $ | 78,354 | | | $ | 34,648 | | | $ | 47,871 | | | $ | (76,145) | | | $ | 84,728 | |
| Interest (income) expense | (3,378) | | | (2,890) | | | (4,890) | | | 39,060 | | | 27,902 | |
| Income tax expense | 1,478 | | | — | | | — | | | 21,003 | | | 22,481 | |
| Depreciation, depletion and amortization | 27,884 | | | 15,254 | | | 9,870 | | | 1,034 | | | 54,042 | |
| EBITDA | $ | 104,338 | | | $ | 47,012 | | | $ | 52,851 | | | $ | (15,048) | | | $ | 189,153 | |
| Accretion | 260 | | | 464 | | | 21 | | | — | | | 745 | |
| | | | | | | | | |
| | | | | | | | | |
| | | | | | | | | |
| Non-cash compensation | — | | | — | | | — | | | 5,216 | | | 5,216 | |
| | | | | | | | | |
| Other (2) | (81) | | | 141 | | | — | | | (3,429) | | | (3,369) | |
| Adjusted EBITDA | $ | 104,517 | | | $ | 47,617 | | | $ | 52,872 | | | $ | (13,261) | | | $ | 191,745 | |
| | | | | | | | | | | | | | | | | | | | | | | | | | | | | |
| Reconciliation of Net Income (Loss) to Adjusted EBITDA | Six months ended July 1, 2023 |
| by Segment | West | | East | | Cement | | Corporate | | Consolidated |
| ($ in thousands) | | | | | | | | | |
| Net income (loss) | $ | 87,276 | | | $ | 40,586 | | | $ | 44,846 | | | $ | (119,192) | | | $ | 53,516 | |
| Interest (income) expense | (6,709) | | | (5,652) | | | (9,853) | | | 77,536 | | | 55,322 | |
| Income tax expense | 2,217 | | | — | | | — | | | 13,798 | | | 16,015 | |
| Depreciation, depletion and amortization | 54,007 | | | 30,351 | | | 17,850 | | | 2,022 | | | 104,230 | |
| EBITDA | $ | 136,791 | | | $ | 65,285 | | | $ | 52,843 | | | $ | (25,836) | | | $ | 229,083 | |
| Accretion | 510 | | | 902 | | | 39 | | | — | | | 1,451 | |
| Loss on debt financings | — | | | — | | | — | | | 493 | | | 493 | |
| | | | | | | | | |
| | | | | | | | | |
| Non-cash compensation | — | | | — | | | — | | | 9,924 | | | 9,924 | |
| Other (2) | (106) | | | 282 | | | — | | | (8,181) | | | (8,005) | |
| Adjusted EBITDA | $ | 137,195 | | | $ | 66,469 | | | $ | 52,882 | | | $ | (23,600) | | | $ | 232,946 | |
(1)The adjustment for acquisition and integration costs related to the Transaction is comprised of finder's fees, advisory, legal and professional fees incurred relating to the Transaction.
(2)Consists primarily of interest income earned on cash balances.
| | | | | | | | | | | |
| Reconciliation of Working Capital | June 29, 2024 | | December 30, 2023 |
| ($ in thousands) | | | |
| Total current assets | $ | 1,500,755 | | | $ | 932,124 | |
| Less total current liabilities | (573,860) | | | (322,965) | |
| Working capital | $ | 926,895 | | | $ | 609,159 | |
| | | | | | | | | | | | | | | | | | | | | | | |
| | Three months ended | | Six months ended |
| Reconciliation of Operating Income to Adjusted Cash Gross Profit | June 29, 2024 | | July 1, 2023 | | June 29, 2024 | | July 1, 2023 |
| ($ in thousands) | | | | | | | |
| Operating income | $ | 172,896 | | | $ | 129,633 | | | $ | 128,043 | | | $ | 114,158 | |
| General and administrative expenses | 83,875 | | | 53,838 | | | 152,401 | | | 99,836 | |
| Depreciation, depletion, amortization and accretion | 104,397 | | | 54,787 | | | 200,368 | | | 105,681 | |
| Transaction and integration costs | 10,265 | | | 1,712 | | | 72,473 | | | 2,076 | |
| Gain on sale of property, plant and equipment | (3,180) | | | (3,223) | | | (4,028) | | | (3,653) | |
| Adjusted Cash Gross Profit (exclusive of items shown separately) | $ | 368,253 | | | $ | 236,747 | | | $ | 549,257 | | | $ | 318,098 | |
| Adjusted Cash Gross Profit Margin (exclusive of items shown separately) (1) | 34.2 | % | | 34.8 | % | | 29.7 | % | | 29.2 | % |
(1)Adjusted Cash Gross Profit Margin, which we define as Adjusted Cash Gross Profit as a percentage of net revenue.
Critical Accounting Policies and Estimates
Our management’s discussion and analysis of our financial condition and results of operations is based on our consolidated financial statements, which have been prepared in accordance with U.S. GAAP. The preparation of these consolidated financial statements requires management to make estimates and assumptions that affect the reported amounts of assets and liabilities, disclosure of contingent assets and liabilities at the date of the consolidated financial statements and the reported amounts of revenue and expenses during the reported period.
Please refer to “Critical Accounting Policies and Estimates” described in “Part II. Item 7. Management’s Discussion and Analysis of our Financial Condition and Results of Operations” of our annual report on Form 10-K filed with the SEC on February 15, 2024, from which there have been no material changes.
New Accounting Pronouncements Not Yet Adopted
In December 2023, the Financial Accounting Standards Board (“FASB”) issued Accounting Standards Update ("ASU") No. 2023-09, Income Taxes (Topic 740): Improvements to Income Tax Disclosures, which requires additional information regarding income taxes paid and specific categories in the rate reconciliation. The ASU is effective for annual
periods beginning after December 15, 2024. Early adoption is permitted. We are evaluating the additional disclosure requirements and beginning to assess the impact of adopting this ASU.
In November 2023, the FASB issued ASU No. 2023-07, Segment Reporting (Topic 280): Improvements to Reportable Segment Disclosures, which expands disclosure about significant segment expenses. The ASU is effective for fiscal years beginning after December 15, 2023, and interim periods within fiscal years beginning after December 15, 2024. Early adoption is permitted. We are evaluating the additional disclosure requirements and beginning to assess the impact of adopting this ASU.
ITEM 3. QUANTITATIVE AND QUALITATIVE DISCLOSURES ABOUT MARKET RISK
We are exposed to certain market risks arising from transactions that are entered into in the normal course of business. Our operations are highly dependent upon the interest rate-sensitive construction industry as well as the general economic environment. Consequently, these marketplaces could experience lower levels of economic activity in an environment of rising interest rates or escalating costs. For a discussion of quantitative and qualitative disclosures about market risk, please refer to the Annual Report from which our exposure to market risk has not materially changed.
ITEM 4. CONTROLS AND PROCEDURES
Disclosure Controls and Procedures
The Company maintains disclosure controls and procedures (as such term is defined in Rules 13a-15(e) and 15d-15(e) under the Securities Exchange Act of 1934, as amended (the “Exchange Act”)), that are designed to ensure that information required to be disclosed in the Company's reports under the Exchange Act, is recorded, processed, summarized and reported within the time periods specified in the SEC’s rules and forms, and that such information is accumulated and communicated to the Company's management, including its Chief Executive Officer and Chief Financial Officer, as appropriate, to allow timely decisions regarding required disclosure. Consistent with guidance issued by the Securities and Exchange Commission that an assessment of internal controls over financial reporting of a recently acquired business may be omitted from management's evaluation of disclosure controls and procedures, management is excluding an assessment of such internal controls of Argos USA from its evaluation of the effectiveness of the Company's disclosure controls and procedures. The Company acquired all of the outstanding equity interests in Argos USA in January 2024. Argos USA represented approximately 48.1% of the Company’s consolidated total assets at June 29, 2024. Argos USA net revenue included in the Company’s consolidated results for the fiscal quarter ended June 29, 2024 was $453.5 million. Any controls and procedures, no matter how well designed and operated, can provide only reasonable, not absolute, assurance of achieving the desired control objectives. The Company's management, with the participation of its Chief Executive Officer and Chief Financial Officer, has evaluated the effectiveness of Summit Inc.’s disclosure controls and procedures as of June 29, 2024. Based upon that evaluation, The Company's Chief Executive Officer and Chief Financial Officer concluded that, as of June 29, 2024, the Company's disclosure controls and procedures were effective to accomplish their objectives at the reasonable assurance level.
Changes in Internal Control over Financial Reporting
There was no change in the Company's internal control over financial reporting (as such term is defined in Rules 13a-15(f) and 15d-15(f) under the Exchange Act) that occurred during their last fiscal quarter that has materially affected, or is reasonably likely to materially affect, their internal control over financial reporting, except that, as reported above, the Company acquired all of the outstanding equity interests in Argos USA in January 2024. As a result, the Company is currently integrating Argos USA’s operations in its overall system of internal control over financial reporting and, if necessary, will make appropriate changes as it integrates Argos USA into its overall internal control over financial reporting process.
PART II—OTHER INFORMATION
ITEM 1. LEGAL PROCEEDINGS
The information set forth under Note 12, "Commitments and Contingencies," to our unaudited consolidated financial statements is incorporated herein by reference. Consistent with the requirements of Item 103 of SEC Regulation S-K, the Company's threshold for disclosing environmental legal proceedings involving a governmental authority is potential monetary sanctions that management believes will meet or exceed $1 million. Applying this threshold, there are no material environmental matters to disclose for the period covered by this report.
ITEM 1A. RISK FACTORS
There have been no material changes to the risk factors disclosed under Item 1A. of our Annual Report on Form 10-K for the fiscal year ended December 30, 2023, except as previously updated by our Quarterly Report on Form 10-Q for the fiscal period ended March 30, 2024. The information below updates, and should be read in conjunction with, the risk factors and information disclosed under Item 1A. of our Annual Report on Form 10-K for the fiscal year ended December 30, 2023, as updated by the information disclosed under Part II, Item 1A, of our Quarterly Report on Form 10-Q for the fiscal period ended March 30, 2024.
ITEM 2. UNREGISTERED SALES OF EQUITY SECURITIES AND USE OF PROCEEDS
None.
ITEM 3. DEFAULTS UPON SENIOR SECURITIES
None.
ITEM 4. MINE SAFETY DISCLOSURES
The information concerning mine safety violations and other regulatory matters required by Section 1503(a) of the Dodd-Frank Wall Street Reform and Consumer Protection Act and Item 104 of Regulation S-K (17 CFR 229.104) is included in Exhibit 95.1 to this report.
ITEM 5. OTHER INFORMATION
During the three months ended June 29, 2024, no director or officer (as defined in Rule 16a-1(f) of the Exchange Act) of the Company adopted or terminated a “Rule 10b5-1 trading arrangement” or “non-Rule 10b5-1 trading arrangement,” as each term is defined in Item 408(a) of Regulation S-K.
On December 15, 2023, plaintiff Bruce Taylor (“Plaintiff”), on behalf of himself and all other similarly situated stockholders of Summit Materials, Inc. (“Summit”), filed a putative class action complaint in the Court of Chancery of the State of Delaware (“Court”) captioned Taylor v. Summit Materials, Inc., et al., Case No. 2023-1258-KSJM (Del. Ch.) (the “Action”), against Summit and its directors (collectively “Defendants”) alleging breaches of fiduciary duty in connection with certain disclosures relating to the transaction between and among the Company, Argos North America Corp. (“Argos USA”), Cementos Argos S.A., Argos SEM, LLC, and Valle Cement Investments, Inc., pursuant to which the Company acquired all of the outstanding equity interests of Argos USA (the “Transaction”). Summit and the director defendants do not believe that the disclosures were deficient and deny that any breach of fiduciary duty or other wrongful conduct occurred, and solely to avoid the costs, distractions, and uncertainties inherent in litigation, on December 28, 2023 issued additional disclosures that mooted Plaintiff’s claims. On February 21, 2024, Plaintiff filed a Motion for an Award of Attorneys’ Fees and Expenses (the “Fee Motion”). Counsel for the Parties thereafter entered into arm’s-length negotiations, and, to avoid the time and expense of continued litigation, the parties have agreed to fully resolve the Fee Motion in exchange for a payment by Summit of $160,000 to Plaintiff’s counsel. The Court has not been asked to review, and will pass no judgment on, the payment of attorneys’ fees and expenses or their reasonableness.
ITEM 6. EXHIBITS
| | | | | |
| 2.1† | Transaction Agreement, dated September 7, 2023, among Summit Materials, Inc., Argos North America, Corp., Cementos Argos S.A., Argos SEM LLC, and Valle Cement Investments, Inc. (incorporated by reference to Exhibit 2.1 to the Registrant’s Current Report on Form 8-K, filed on September 8, 2023). |
| 3.1 | |
| 3.2 | |
| |
| |
| 3.3 | |
| |
| |
| |
| |
| |
| |
| |
| |
| |
| |
| |
| |
| |
| 31.1* | |
| 31.2* | |
| |
| |
| 32.1** | |
| 32.2** | |
| |
| |
| 95.1* | |
| |
| 101.INS* | Inline XBRL Instance Document - the instance document does not appear in the interactive data file because XBRL tags are embedded within the inline XBRL document |
| 101.SCH* | Inline XBRL Taxonomy Extension Schema Document With Embedded Linkbase Documents |
104.1*
| Cover Page from the Company’s Quarterly Report on Form 10-Q for the quarter ended June 29, 2024, formatted in Inline XBRL (and contained in Exhibit 101).
|
* Filed herewith
** Furnished herewith
† Certain sensitive personally identifiable information in this exhibit was omitted by means of redacting a portion of the text and replacing it with [***]
The agreements and other documents filed as exhibits to this report are not intended to provide factual information or other disclosure other than with respect to the terms of the agreements or other documents themselves, and you should not rely on them other than for that purpose. In particular, any representations and warranties made by us in these agreements or other documents were made solely within the specific context of the relevant agreement or document and may not describe the actual state of affairs as of the date they were made or at any other time.
SIGNATURES
Pursuant to the requirements of the Securities Exchange Act of 1934, the registrant has duly caused this report to be signed on its behalf by the undersigned thereunto duly authorized.
| | | | | | | | |
| | | |
| | SUMMIT MATERIALS, INC. |
| |
| | | |
| Date: August 6, 2024 | By: | /s/ Anne P. Noonan |
| | | Anne P. Noonan |
| | | Chief Executive Officer |
| | | (Principal Executive Officer) |
| | |
| Date: August 6, 2024 | By: | /s/ C. Scott Anderson |
| | C. Scott Anderson |
| | Chief Financial Officer |
| | (Principal Financial Officer) |
| | |
| Date: August 6, 2024 | By: | /s/ Brian D. Frantz |
| | Brian D. Frantz |
| | Chief Accounting Officer |
| | (Principal Accounting Officer) |