
May 13, 2016
Consolidated Financial Results for the fiscal year ended March 31, 2016
<under Japanese GAAP>
| Company Name: Concordia Financial Group, Ltd. (with regards to The Bank of Yokohama, Ltd.) | |||
| Stock Exchange Listing: | Tokyo | ||
| Code Number: | 7186 | ||
| URL: | http://www.concordia-fg.jp/ | ||
Representative: Representative Director, President Tatsumaro Terazawa | |||
| Securities Report (Yukashoken Hokokusho) Issuing Date: | June 30, 2016 | ||
| Commencement of Dividend Payment: | May 26, 2016 | ||
| Trading Accounts: | Established | ||
| Supplemental Information for Financial Statements: | Available | ||
| Investor Meeting Presentation: | Scheduled (For Institutional Investors and Analysts) | ||
(Amounts less than one million yen are rounded down.)
1. Consolidated Financial Results (for fiscal year ended March 31, 2016)
| (1) Operating Results | (Unit: Millions of Yen, except per share data and percentages) |
| Ordinary Income | Ordinary Profit | Profit Attributable to Owners of Parent | |||||||||||||||||||
| Fiscal year ended March 31, 2016 | 324,950 | 6.3% | 114,648 | 6.0% | 74,574 | (2.2%) | |||||||||||||||
| Fiscal year ended March 31, 2015 | 305,462 | 3.7% | 108,074 | 5.7% | 76,324 | 25.7% | |||||||||||||||
| (Note1) | Comprehensive Income: Fiscal year ended March 31, 2016: ¥45,112 million [(68.8%)]; Fiscal year ended March 31, 2015: ¥144,813 million [118.2%] |
| (Note2) | Percentages shown in Ordinary Income, Ordinary Profit, Profit Attributable to Owners of Parent and Comprehensive Income are the increase (decrease) from the same period previous year. |
| Net Income per Share | Net Income per Share (Diluted) | Return on Equity | Ordinary Profit on Total Assets | Ordinary Profit on Ordinary Income | ||||||||||||||
| Fiscal year ended March 31, 2016 | ¥60.80 | ¥60.77 | 7.7% | 0.7% | 35.2% | |||||||||||||
| Fiscal year ended March 31, 2015 | ¥60.52 | ¥60.48 | 8.3% | 0.7% | 35.3% | |||||||||||||
(Reference) Equity in earnings of associated companies: Fiscal year ended March 31, 2016: None; Fiscal year ended March 31, 2015: None
| (2) Financial Position | (Unit: Millions of Yen, except per share data and percentages) |
| Total Assets | Total Net Assets | Own Capital Ratio | Net Assets per Share | ||||||||||||
| March 31, 2016 | 15,268,948 | 1,008,803 | 6.3% | ¥799.85 | |||||||||||
| March 31, 2015 | 15,377,845 | 1,010,495 | 6.2% | ¥774.51 | |||||||||||
(Reference) Own Capital: March 31, 2016: ¥963,485 million; March 31, 2015: ¥965,213 million
| (Note) | Own Capital Ratio = (Total Net Assets - Subscription Rights to Shares - Non-controlling Interests) / Total Assets The ratio above is not based on the regulation of Capital Adequacy Ratio. |
(3) Cash Flows | (Unit: Millions of Yen) |
| Cash Flows from Operating Activities | Cash Flows from Investing activities | Cash Flows from Financing activities | Cash and cash equivalents at end of period | |||||||||||||
| Fiscal year ended March 31, 2016 | (76,179 | ) | (28,051 | ) | (46,873 | ) | 2,038,749 | |||||||||
| Fiscal year ended March 31, 2015 | 1,330,904 | (334,472 | ) | (74,632 | ) | 2,189,882 | ||||||||||
2. Dividend on Common Stock
| Annual Cash Dividends per Share | ||||||||||||||||||||
1st Quarter -End | 2nd Quarter -End | 3rd Quarter -End | Fiscal Year -End | Total | Total Cash Dividends (Annual) | Dividends Pay-out Ratio (Consolidated basis) | Dividends on Net Assets (Consolidated basis) | |||||||||||||
| Fiscal year ended March 31, 2015 | - | ¥5.50 | - | ¥7.50 | ¥13.00 | ¥16,295 million | 21.4 | % | 1.7 | % | ||||||||||
| Fiscal year ended March 31, 2016 | - | ¥5.50 | - | ¥8.50 | ¥14.00 | ¥17,028 million | 23.0 | % | 1.7 | % | ||||||||||
(Note) Year-End Dividend for Fiscal year ended March 31, 2016 includes a Special Dividend of ¥3.00.
For forecast for operating result and dividends for the year ending March 31, 2017, refer to “Selected financial information for the year ended March 31, 2016”.
1
※Note
(1) Changes in the scope of consolidated significant subsidiaries in the fiscal year ended March 31, 2016: No
(2) Changes in accounting policies, accounting estimates, and restatements:
| (A) Changes in accounting policies due to revision of accounting standards: | Yes | |
| (B) Changes in accounting policies due to reasons other than (A): | No | |
| (C) Changes in accounting estimates: | No | |
| (D) Restatements: | No |
(3) Number of common stocks issued:
| (A) Number of stocks issued (including treasury stocks): | March 31, 2016 | 1,254,071,054 shares | March 31, 2015 | 1,254,071,054 shares | |
| (B) Number of treasury stocks: | March 31, 2016 | 49,489,306 shares | March 31, 2015 | 7,855,711 shares | |
| (C) Average outstanding stocks for the fiscal year ended: | March 31, 2016 | 1,226,501,268 shares | March 31, 2015 | 1,261,052,177 shares |
(Reference) Non-Consolidated Financial Highlight
| 1. | Non-Consolidated Financial Results (for the fiscal year ended March 31, 2016) |
| (1) Operating Results | (Unit: Millions of Yen, except per share data and percentages) |
| Ordinary Income | Ordinary Profit | Net Income | ||||||||||||||||||||||
| Fiscal year ended March 31, 2016 | 280,550 | 7.8% | 108,433 | 6.2% | 72,834 | 7.8% | ||||||||||||||||||
| Fiscal year ended March 31, 2015 | 260,193 | 5.9% | 102,037 | 10.4% | 67,521 | 14.9% | ||||||||||||||||||
(Note) Percentages shown in Ordinary Income, Ordinary Profit and Net Income are the increase (decrease) from the same period previous year.
| Net Income per Share | Net Income per Share (Diluted) | ||||||
| Fiscal year ended March 31, 2016 | ¥59.38 | ¥59.35 | |||||
| Fiscal year ended March 31, 2015 | ¥53.54 | ¥53.51 | |||||
| (2) Financial Position | (Unit: Millions of Yen, except per share data and percentages) |
| Total Assets | Total Net Assets | Own Capital Ratio | Net Assets per Share | ||||||||||||
| March 31, 2016 | 15,135,207 | 948,773 | 6.2% | ¥787.41 | |||||||||||
| March 31, 2015 | 15,204,334 | 945,469 | 6.2% | ¥758.42 | |||||||||||
(Reference) Own Capital: March 31, 2016: ¥948,506 million; March 31, 2015: ¥945,154 million
(Note) Own Capital Ratio = (Total Net Assets - Subscription Rights to Shares) / Total Assets
The ratio above is not based on the regulation of Capital Adequacy Ratio.
For forecast for operating result for the year ending March 31, 2017, refer to “Selected financial information for the year ended March 31, 2016”.
(Display of implementation status of the audit procedure)
This report is out of the scope of the audit procedure which is required by “Financial Instruments and Exchange Law”. Therefore, the audit process of consolidated financial statement and financial statement has not been completed as of the disclosure of this report.
(Notes for using forecasts information, etc.)
The description of future performance of this report is based on information, which is presently available and certain assumptions which are considered to be reasonable, and it does not guarantee future performance. Please take note that future performance may differ from forecasts. For underlying assumptions of forecast for operating results, refer to the attachment.
2
Contents of Attachment
1. Analysis of operating results and financial position
(1) Analysis of operating results
(2) Analysis of financial position
(3) Basic policy for profit allocation and dividend for the year ended March 31, 2016 and the year ending March 31, 2017
2. Overview of Bank of Yokohama group
(1) Nature of the business
(2) Organization
3. Management policy
(1) Basic policy
(2) Targeted management indicators
(3) Medium to long-term management strategy
(4) Issues to be addressed
4. Basic concept for selecting accounting standards
5. Consolidated Financial Statements
(1) Consolidated Balance Sheets
(2) Consolidated Statements of Income and Consolidated Statements of Comprehensive Income
(3) Consolidated Statements of Changes in Net Assets
(4) Consolidated Statements of Cash Flows
(5) Note on Going Concern Assumption
(6) Changes in Accounting Policies, Accounting Estimates, and Restatements
(7) Notes to consolidated financial statements
6. Non-Consolidated Financial Statements
(1) Non-Consolidated Balance Sheets
(2) Non-Consolidated Statements of Income
(3) Non-Consolidated Statements of Changes in Net Assets
※Supplemental Information
Selected Financial Information for the year ended March 31, 2016
3
1. Analysis of operating results and financial position
(1) Analysis of operating results
a) Overview of operating results for the year ended March 31, 2016
The Bank of Yokohama, Ltd. (“Bank of Yokohama”) has made efforts to strengthen earning capacity by strengthening sales activities focusing on regional retail business. As a result, ordinary profit increased by 6.0% from the previous year. Profit attributable to owners of parent decreased by 2.2% from the previous year. Excluding the effect of extraordinary factor such as gain on bargain purchase, profit attributable to owners of parent increased by 10.9% from the previous year.
b) Operating results for the year ended March 31, 2016
Ordinary income increased by ¥19,488 million from the previous year to ¥324,950 million due to the increase in income from derivatives other than for trading or hedging. On the other hand, ordinary expenses increased by ¥12,915 million from the previous year to ¥210,302 million due to the increase in loss on sales of bonds.
As a result, ordinary profit increased by ¥6,574 million from the previous year to ¥114,648 million, and profit attributable to owners of parent decreased by ¥1,750 million from the previous year to ¥74,574 million. Net income per share is ¥60.80.
c) Forecasts for the year ending March 31, 2017
The forecast of operating results for Concordia Financial Group, Ltd (“Concordia Financial Group”), which is wholly-owning parent company of Bank of Yokohama and The Higashi-Nippon Bank, Limited (“Higashi-Nippon Bank”) established on April 1, 2016, for the year ending March 31, 2017 is as follows:
| (Unit: Billions of yen) | ||
| Consolidated | ||
| Ordinary profit | 93.5 | |
| Profit attributable to owners of parent | 123.5 |
The forecast for operating results above is based on the information available to Concordia Financial Group and assumptions related to uncertain factors that may affect the future results. The actual results may differ significantly due to various factors.
(2) Analysis of financial position
a) Assets and liabilities
As a result of promoting comprehensive transactions, deposits increased by ¥513.8 billion to ¥12,635.2 billion, of which time deposits increased by ¥0.3 billion to ¥3,233.5 billion.
As a result of focusing on apartment loans and loans to small and medium-sized businesses, loans increased by ¥224.4 billion to ¥9,948.4 billion. In addition, securities decreased by ¥92.1 billion to ¥2,368.3 billion, of which government bonds decreased by ¥73.2 billion to ¥630 billion.
Total assets decreased by ¥108.9 billion to ¥15, 268.9 billion.
Capital adequacy ratio is 12.77% (preliminary figures) on a consolidated basis and 12.41% (preliminary figures) on a non-consolidated basis.
| March 31, 2012 | March 31, 2013 | March 31, 2014 | March 31, 2015 | March 31, 2016 | |
Capital adequacy ratio (Consolidated) | 13.67% | 13.99% | 13.37% | 13.29% | 12.77% (preliminary figures) |
Capital Adequacy Ratio is calculated in accordance with “the standards for determining whether the status of capital adequacy is appropriate in consideration of assets, etc. held by the bank under the provisions of Article 14-2 of the Banking Law (FSA Notification No.19, 2006)”. The ratio has been calculated in accordance with the notification of revision to Capital Adequacy Ratio (FSA Notification No.28, 2012) since the end of March 2013. Bank of Yokohama calculates the capital adequacy ratio in accordance with BIS standard.
b) Cash flows
Bank of Yokohama used ¥76,179 million in cash flows from operating activities due to the decrease in call money and others, used ¥28,051 million in cash flows from investing activities due to acquisition of securities, and used ¥46,873 million in cash flows from financing activities due to purchase of treasury shares. Consequently, cash and cash equivalents amounted to ¥ 2,038,749 million, a year-on-year decrease of ¥151,133 million.
4
(3) Basic policy for profit allocation and dividend for the year ended March 31, 2016 and the year ending March 31, 2017
a) Basic policy for profit allocation for the year ended March 31, 2016
Bank of Yokohama adopts a profit return policy of maintaining stable dividends based on its performance as follows. Under this policy, Bank of Yokohama will provide proactive profit return considering flexible purchase of treasury shares continuously. In addition, Bank of Yokohama will pay a special dividend in the case where profit attributable to owners of parent (consolidated) exceeds ¥55 billion.
| Profit return policy |
Bank of Yokohama will pay ¥11 per year as an ordinary dividend stably, of which half of ¥5.5 as an interim dividend and remaining of ¥5.5 as a year-end dividend, regardless of operating results. In addition, Bank of Yokohama will flexibly purchase treasury shares based on the market condition and forecast for operating results. Bank of Yokohama will pay a special dividend in the case where profit attributable to owners of parent (consolidated) exceeds ¥55 billion. |
b) Dividend for the year ended March 31, 2016
For dividends of Bank of Yokohama for the year ended March 31, 2016, as profit attributable to owners of parent exceeded ¥55 billion, Bank of Yokohama will pay a special dividend of ¥3 per share as a performance-based dividend and ordinary dividends of ¥11 per share as a stable dividend, totaled to ¥14 per share per year based on the profit return policy mentioned above.
c) Basic policy for profit allocation for the year ending March 31, 2017
Concordia Financial Group adopts shareholders’ return policy of maintaining stable dividends based on its performance as follows. Under this policy, Concordia Financial Group will provide shareholders’ return proactively.
| Shareholders’ return policy |
Concordia Financial Group will pay ¥13 per year as ordinary dividends stably, of which half of ¥6.5 as an interim dividend and remaining of ¥6.5 as a year-end dividend, regardless of operating results. In addition, Concordia Financial Group will flexibly purchase treasury shares based on the market condition and forecasts for operating results. Furthermore, Concordia Financial Group will pay a special dividend in the case where profit attributable to owners of parent* exceeds ¥60 billion and set approximately 50% of profit attributable to owners of parent * as a guide for our consideration of the total annual shareholders’ return. * Gain on bargain purchase will be excluded. |
d) Dividend for the year ending March 31, 2017
For dividends of Concordia Financial Group for the year ending March 31, 2017, Concordia Financial Group will pay ordinary dividends of ¥13 per share as a stable dividend, and an additional dividend of ¥1 per share as an anniversary dividend accompanying the establishment of Concordia Financial Group, totaled to ¥14 per share based on the shareholders’ return policy. In addition, Concordia Financial Group will pay a special dividend in the case where profit attributable to owners of parent (consolidated) exceeds ¥60 billion. The amount of a special dividend will be announced based on the performance.
5
2. Overview of Bank of Yokohama group
(1) Nature of the business
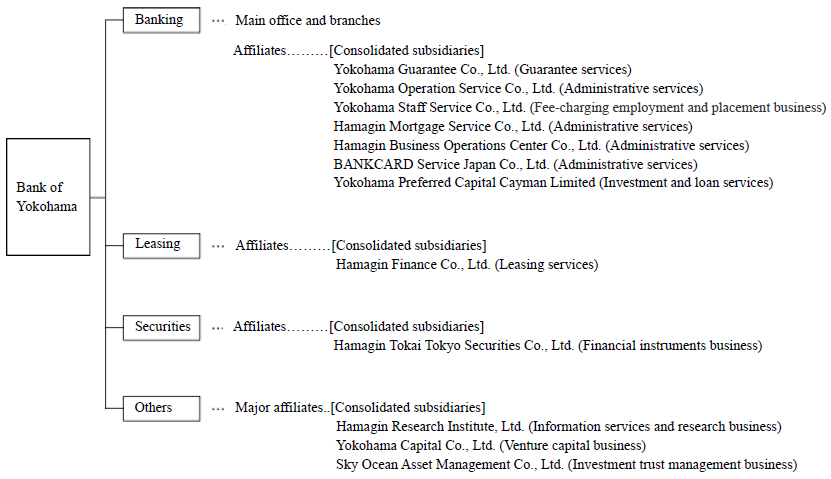
Bank of Yokohama group (Bank of Yokohama and its affiliates) is consisted of Bank of Yokohama and its 15 subsidiaries, and engages in banking as a mainstay business as well as leasing, securities, venture capital and other financial services.
(2) Organization
3. Management policy
(1) Basic policy
Concordia Financial Group wholly-owing parent of Bank of Yokohama and Higashi-Nippon Bank, has formulated “Management Philosophy”, a philosophy that forms our basis of business activities, set “Long-term Vision” to realize the Management Philosophy for each relationship between Concordia Financial Group and stakeholders, and fulfilled social mission and role as a regional financial group with a slogan of “One Heart for You”, derived from our business name “Concordia”.
【Management philosophy of Concordia Financial Group】
Concordia Financial Group aims to contribute to creating a vibrant future as a trusted financial group and to enhance its corporate value together with the growth of the region by providing the best financial services to its customers through collaboration that leverages the strengths and uniqueness of each group company.
【Long-term visions of Concordia Financial Group】
(a) Aim to become a trusted financial group by maintaining deep relationship with customers as a regional financial institution and providing broad, high-quality financial services and regional information leveraging its wide-area network achieved through the business integration.
(b) Aim to strengthen earning capacity and improve corporate value by strategically placing into growing areas and business fields management resources that are created through proactive sharing of each group company’s business infrastructure and know-how to the maximum extent and promoting streamlining and improvements in efficiency, even while maintaining each group company’s brand.
6
(c) Aim to improve each employee’s capabilities in consulting services and of assessing the future prospects of customers’ businesses in order to appropriately respond to changes in environment and customers’ needs and to pursue constant customer satisfaction.
(d) Contribute to the prosperity of the region by providing solutions that utilize sophisticated consulting services and financial techniques to address various issues in the Metropolitan area and the surrounding region where the group is based.
(2) Targeted management indicators
Concordia Financial Group has started the Medium-term Management Plan “One Heart for You -1st Stage-”, which is positioned as a 3-year phase starting from April 2016 through March 2019 whereby Concordia Financial Group enhances and deepens relationships with customers by adapting promptly to the change of financial environment and putting efforts in efficiency improvement as well as proactive investments in growth area to realize synergies from the business integration as early as possible.
Targeted indicators of medium-term management plan for the year ended March 31, 2019 are as follows:
| Targeted indicators for the year ended March 31, 2019 | ||
| ROE (consolidated) | Around 7% | |
| Common Equity Tier 1 Capital Ratio (consolidated) | Middle of 11% | |
OHR (sum of the two banks’ non-consolidated figures) | Around 50% | |
In addition to the above, Bank of Yokohama has developed following 3 basic policies: 1) share know-how with Higashi-Nippon Bank to realize synergies from the management integration as early as possible, 2) aim to become a bank serving both the region and customers, with a focus on Kanagawa Prefecture, the major sales activity base of Bank of Yokohama, 3) aim to realize an optimum balance between financial soundness, profitability and growth, and will execute initiatives to achieve targeted indicators.
<Targeted indicators of medium-term management plan of Bank of Yokohama>
| Targeted indicators for the year ended March 31, 2019 | ||
| Main individual customers (Note 1) | Around 2.5 million individual customers | |
| Core corporate customers (Note 1) | Around 12,000 corporate customers | |
| Fees and commissions income ratio (consolidated) | Around 25% | |
| RORA (consolidated) (Note 2) | Around 1.0% | |
(Note 1) The number of main individual customers and core corporate customers represents that of customers using Bank of Yokohama as their main bank (definition by Bank of Yokohama)
(Note 2) RORA (consolidated) is based on the profit attributable to the owners of parent (Bank of Yokohama’s consolidated profit)
(3) Medium to long-term management strategy
Under the Concordia Financial Group’s Medium-term Management Plan “One Heart for You -1st Stage-”, Concordia Financial Group will implement following 4 fundamental strategies to achieve long-term visions and management objectives.
<Fundamental strategies>
(a) Enhance connection with customers and widen services scope
(b) Accelerate growth by realizing group synergies
(c) Nurture human resources with broad expertise and promote diversity
(d) Get involved in regional issues, including regional revitalization proactively
(4) Issues to be addressed
While external environment surrounding banks is changing rapidly, including the implementation of quantitative and qualitative monetary easing with a negative interest rate by the Bank of Japan, development of FinTech, tightening of capital adequacy requirements, Concordia Financial Group has started the Medium-term Management Plan “One Heart for You -1st Stage-”, which is positioned as a 3-year phase starting from April 2016 through March 2019 whereby Concordia Financial Group enhances and deepens relationships with customers by adapting promptly to the change of financial environment and putting efforts in efficiency improvement as well as proactive investments in growth area to realize synergies from the business integration as early as possible.
7
Under the Medium-term Management Plan, Concordia Financial Group focuses on 4 fundamental strategies, (a) Enhance connection with customers and widen services scope, (b) Accelerate growth by realizing group synergies, (c) Nurture human resources with broad expertise and promote diversity, (d) Get involved in regional issues, including regional revitalization proactively, and aims to formulate a trusted and preferred group by customers by providing useful services to customers.
4. Basic concept for selecting accounting standards
Bank of Yokohama group prepares consolidated financial statements in accordance with generally accepted accounting principles in Japan (“Japanese GAAP”). With regard to the adoption of International Financial Reporting Standards (“IFRS”), Bank of Yokohama will consider current situations and take appropriate actions.
8
| 5. Consolidated Financial Statements | ||||||||
| (1) Consolidated Balance Sheets | ||||||||
| (Unit: Millions of Yen) | ||||||||
| As of March 31, 2015 | As of March 31, 2016 | |||||||
| Assets : | ||||||||
| Cash and due from banks | 2,303,301 | 2,079,132 | ||||||
| Call loans and bills bought | 273,006 | 263,285 | ||||||
| Monetary claims bought | 124,369 | 102,977 | ||||||
| Trading assets | 15,233 | 12,058 | ||||||
| Securities | 2,460,453 | 2,368,351 | ||||||
| Loans and bills discounted | 9,724,053 | 9,948,486 | ||||||
| Foreign exchanges | 7,315 | 12,214 | ||||||
| Lease receivables and investment assets | 65,028 | 64,697 | ||||||
| Other assets | 115,104 | 147,662 | ||||||
| Tangible fixed assets | 125,136 | 130,383 | ||||||
| Buildings, net | 37,700 | 43,007 | ||||||
| Land | 80,328 | 79,499 | ||||||
| Construction in progress | 1,965 | 1,262 | ||||||
| Other tangible fixed assets | 5,143 | 6,613 | ||||||
| Intangible fixed assets | 12,205 | 11,705 | ||||||
| Software | 11,161 | 10,886 | ||||||
| Goodwill | 621 | 402 | ||||||
| Other intangible fixed assets | 422 | 416 | ||||||
| Net defined benefit asset | 32,392 | 27,843 | ||||||
| Deferred tax assets | 5,150 | 4,698 | ||||||
| Customers' liabilities for acceptances and guarantees | 182,209 | 155,087 | ||||||
| Allowance for loan losses | (67,115 | ) | (59,635 | ) | ||||
| Total assets | 15,377,845 | 15,268,948 | ||||||
| Liabilities : | ||||||||
| Deposits | 12,121,479 | 12,635,256 | ||||||
| Negotiable certificates of deposit | 106,960 | 177,110 | ||||||
| Call money and bills sold | 777,299 | 126,364 | ||||||
| Payables under securities lending transactions | 247,651 | 111,855 | ||||||
| Trading liabilities | 609 | 194 | ||||||
| Borrowed money | 695,315 | 825,662 | ||||||
| Foreign exchanges | 56 | 181 | ||||||
| Other liabilities | 193,190 | 196,873 | ||||||
| Provision for directors' bonuses | 69 | 59 | ||||||
| Net defined benefit liability | 253 | 296 | ||||||
| Provision for reimbursement of deposits | 1,653 | 1,745 | ||||||
| Provision for contingent losses | 774 | 710 | ||||||
| Reserves under special laws | 11 | 15 | ||||||
| Deferred tax liabilities | 22,353 | 12,137 | ||||||
| Deferred tax liabilities for land revaluation | 17,461 | 16,594 | ||||||
| Acceptances and guarantees | 182,209 | 155,087 | ||||||
| Total liabilities | 14,367,349 | 14,260,145 | ||||||
9
| (Unit: Millions of Yen) | ||||||||
| As of March 31, 2015 | As of March 31, 2016 | |||||||
| Net assets : | ||||||||
| Capital stock | 215,628 | 215,628 | ||||||
| Capital surplus | 177,244 | 177,244 | ||||||
| Retained earnings | 430,668 | 488,988 | ||||||
| Treasury shares | (5,090 | ) | (34,009 | ) | ||||
| Total shareholders’ equity | 818,450 | 847,851 | ||||||
| Valuation difference on available-for-sale securities | 109,501 | 84,335 | ||||||
| Deferred gains or losses on hedges | 41 | 37 | ||||||
| Revaluation reserve for land | 36,060 | 36,928 | ||||||
| Remeasurements of defined benefit plans | 1,159 | (5,668 | ) | |||||
| Total accumulated other comprehensive income | 146,762 | 115,633 | ||||||
| Subscription rights to shares | 314 | 267 | ||||||
| Non-controlling interests | 44,967 | 45,050 | ||||||
| Total net assets | 1,010,495 | 1,008,803 | ||||||
| Total liabilities and net assets | 15,377,845 | 15,268,948 | ||||||
10
| (2) Consolidated Statements of Income and Consolidated Statements of Comprehensive Income | ||||||||
| (Consolidated Statements of Income) | ||||||||
| (Unit: Millions of Yen) | ||||||||
For the year ended March 31, 2015 | For the year ended March 31, 2016 | |||||||
| Ordinary income | 305,462 | 324,950 | ||||||
| Interest income | 164,181 | 161,314 | ||||||
| Interest on loans and discounts | 132,268 | 127,049 | ||||||
| Interest and dividends on securities | 26,255 | 27,744 | ||||||
| Interest on call loans and bills bought | 1,235 | 1,954 | ||||||
| Interest on receivables under securities borrowing transactions | - | 0 | ||||||
| Interest on deposits with banks | 2,142 | 2,321 | ||||||
| Other interest income | 2,279 | 2,244 | ||||||
| Fees and commissions | 67,206 | 65,186 | ||||||
| Trading income | 2,366 | 2,829 | ||||||
| Other ordinary income | 65,386 | 81,766 | ||||||
| Other income | 6,320 | 13,853 | ||||||
| Reversal of allowance for loan losses | - | 3,489 | ||||||
| Recoveries of written off claims | 2,759 | 1,943 | ||||||
| Other | 3,561 | 8,420 | ||||||
| Ordinary expenses | 197,387 | 210,302 | ||||||
| Interest expenses | 7,959 | 9,912 | ||||||
| Interest on deposits | 4,406 | 4,724 | ||||||
| Interest on negotiable certificates of deposit | 69 | 173 | ||||||
| Interest on call money and bills sold | 578 | 1,508 | ||||||
| Interest on payables under securities lending transactions | 412 | 842 | ||||||
| Interest on borrowings and rediscounts | 498 | 972 | ||||||
| Interest on bonds | 143 | - | ||||||
| Other interest expenses | 1,850 | 1,691 | ||||||
| Fees and commissions payments | 11,895 | 12,258 | ||||||
| Trading expenses | 4 | - | ||||||
| Other ordinary expenses | 55,721 | 70,260 | ||||||
| General and administrative expenses | 113,075 | 111,523 | ||||||
| Other expenses | 8,731 | 6,347 | ||||||
| Provision of allowance for loan losses | 2,123 | - | ||||||
| Other | 6,608 | 6,347 | ||||||
| Ordinary profit | 108,074 | 114,648 | ||||||
| Extraordinary income | 12,230 | 8 | ||||||
| Gain on disposal of non-current assets | 3,128 | 8 | ||||||
| Gain on bargain purchase | 9,101 | - | ||||||
| Extraordinary losses | 1,618 | 713 | ||||||
| Loss on disposal of non-current assets | 1,615 | 709 | ||||||
| Other | 3 | 4 | ||||||
| Profit before income taxes | 118,686 | 113,943 | ||||||
| Income taxes - current | 31,774 | 29,977 | ||||||
| Income taxes - deferred | 7,588 | 7,724 | ||||||
| Total income taxes | 39,362 | 37,702 | ||||||
| Profit | 79,324 | 76,241 | ||||||
| Profit attributable to non-controlling interests | 2,999 | 1,666 | ||||||
| Profit attributable to owners of parent | 76,324 | 74,574 | ||||||
11
| (Consolidated Statements of Comprehensive Income) | ||||||||
| (Unit: Millions of Yen) | ||||||||
For the year ended March 31, 2015 | For the year ended March 31, 2016 | |||||||
| Profit | 79,324 | 76,241 | ||||||
| Other comprehensive income | 65,489 | (31,129 | ) | |||||
| Valuation difference on available-for-sale securities | 53,982 | (25,165 | ) | |||||
| Deferred gains or losses on hedges | 33 | (3 | ) | |||||
| Revaluation reserve for land | 1,843 | 867 | ||||||
| Remeasurements of defined benefit plans | 9,629 | (6,827 | ) | |||||
| Comprehensive income | 144,813 | 45,112 | ||||||
| (Comprehensive income attributable to) | ||||||||
| Comprehensive income attributable to owners of parent | 141,142 | 43,445 | ||||||
| Comprehensive income attributable to non-controlling interests | 3,671 | 1,666 | ||||||
12
(3) Consolidated Statements of Changes in Net Assets
For the year ended March 31, 2015
Shareholders’ equity | |||||
| Capital stock | Capital surplus | Retained earnings | Treasury shares | Total shareholders’ equity | |
| Balance at beginning of current period | 215,628 | 177,244 | 393,957 | (5,585) | 781,244 |
| Cumulative effects of changes in accounting policies | (2,097) | (2,097) | |||
| Restated balance | 215,628 | 177,244 | 391,859 | (5,585) | 779,146 |
| Changes of items during period | |||||
| Dividends of surplus | (15,276) | (15,276) | |||
| Profit attributable to owners of parent | 76,324 | 76,324 | |||
| Purchase of treasury shares | (22,536) | (22,536) | |||
| Disposal of treasury shares | 72 | 719 | 792 | ||
| Retirement of treasury shares | (72) | (22,239) | 22,312 | ― | |
Net changes of items other than shareholders’ equity | |||||
| Total changes of items during period | ― | ― | 38,808 | 494 | 39,303 |
| Balance at end of current period | 215,628 | 177,244 | 430,668 | (5,090) | 818,450 |
| Accumulated other comprehensive income | ||||||||
| Valuation difference on available-for-sale securities | Deferred gains or losses on hedges | Revaluation reserve for land | Remeasurements of defined benefit plans | Total accumulated other comprehensive income | Subscription rights to shares | Non-controlling interests | Total net assets | |
| Balance at beginning of current period | 56,190 | 7 | 34,216 | (8,469) | 81,945 | 265 | 58,050 | 921,506 |
| Cumulative effects of changes in accounting policies | (2,097) | |||||||
| Restated balance | 56,190 | 7 | 34,216 | (8,469) | 81,945 | 265 | 58,050 | 919,409 |
| Changes of items during period | ||||||||
| Dividends of surplus | (15,276) | |||||||
| Profit attributable to owners of parent | 76,324 | |||||||
| Purchase of treasury shares | (22,536) | |||||||
| Disposal of treasury shares | 792 | |||||||
| Retirement of treasury shares | ― | |||||||
Net changes of items other than shareholders’ equity | 53,310 | 33 | 1,843 | 9,629 | 64,817 | 48 | (13,082) | 51,783 |
| Total changes of items during period | 53,310 | 33 | 1,843 | 9,629 | 64,817 | 48 | (13,082) | 91,086 |
| Balance at end of current period | 109,501 | 41 | 36,060 | 1,159 | 146,762 | 314 | 44,967 | 1,010,495 |
13
For the year ended March 31, 2016
Shareholders’ equity | |||||
| Capital stock | Capital surplus | Retained earnings | Treasury shares | Total shareholders’ equity | |
| Balance at beginning of current period | 215,628 | 177,244 | 430,668 | (5,090) | 818,450 |
| Changes of items during period | |||||
| Dividends of surplus | (16,135) | (16,135) | |||
| Profit attributable to owners of parent | 74,574 | 74,574 | |||
| Purchase of treasury shares | (30,040) | (30,040) | |||
| Disposal of treasury shares | (118) | 1,121 | 1,003 | ||
Net changes of items other than shareholders’ equity | |||||
| Total changes of items during period | ― | ― | 58,319 | (28,918) | 29,401 |
| Balance at end of current period | 215,628 | 177,244 | 488,988 | (34,009) | 847,851 |
| Accumulated other comprehensive income | ||||||||
| Valuation difference on available-for-sale securities | Deferred gains or losses on hedges | Revaluation reserve for land | Remeasurements of defined benefit plans | Total accumulated other comprehensive income | Subscription rights to shares | Non-controlling interests | Total net assets | |
| Balance at beginning of current period | 109,501 | 41 | 36,060 | 1,159 | 146,762 | 314 | 44,967 | 1,010,495 |
| Changes of items during period | ||||||||
| Dividends of surplus | (16,135) | |||||||
| Profit attributable to owners of parent | 74,574 | |||||||
| Purchase of treasury shares | (30,040) | |||||||
| Disposal of treasury shares | 1,003 | |||||||
Net changes of items other than shareholders’ equity | (25,165) | (3) | 867 | (6,827) | (31,129) | (47) | 82 | (31,094) |
| Total changes of items during period | (25,165) | (3) | 867 | (6,827) | (31,129) | (47) | 82 | (1,692) |
| Balance at end of current period | 84,335 | 37 | 36,928 | (5,668) | 115,633 | 267 | 45,050 | 1,008,803 |
14
| (4) Consolidated Statements of Cash Flows | ||||||||
| (Unit: Millions of Yen) | ||||||||
For the year ended March 31, 2015 | For the year ended March 31, 2016 | |||||||
| Cash flows from operating activities : | ||||||||
| Profit before income taxes | 118,686 | 113,943 | ||||||
| Depreciation | 8,722 | 8,749 | ||||||
| Amortization of goodwill | 204 | 219 | ||||||
| Gain on bargain purchase | (9,101 | ) | - | |||||
| Increase (decrease) in allowance for loan losses | (4,960 | ) | (7,480 | ) | ||||
| Increase (decrease) in provision for directors' bonuses | 4 | (9 | ) | |||||
| Decrease (increase) in net defined benefit asset | (4,666 | ) | (5,329 | ) | ||||
| Increase (decrease) in net defined benefit liability | 37 | 42 | ||||||
| Increase (decrease) in provision for reimbursement of deposits | 80 | 92 | ||||||
| Increase (decrease) in provision for contingent losses | 25 | (63 | ) | |||||
| Interest income | (164,181 | ) | (161,314 | ) | ||||
| Interest expenses | 7,959 | 9,912 | ||||||
| Loss (gain) related to securities | 23,087 | 30,469 | ||||||
| Foreign exchange losses (gains) | (25,607 | ) | 17,300 | |||||
| Loss (gain) on disposal of non-current assets | (1,512 | ) | 700 | |||||
| Net decrease (increase) in trading assets | (5,188 | ) | 3,175 | |||||
| Net increase (decrease) in trading liabilities | (92 | ) | (415 | ) | ||||
| Net decrease (increase) in loans and bills discounted | (270,456 | ) | (224,377 | ) | ||||
| Net increase (decrease) in deposits | 292,257 | 513,777 | ||||||
| Net increase (decrease) in negotiable certificates of deposit | 57,350 | 70,150 | ||||||
| Net increase (decrease) in borrowed money (excluding subordinated borrowings) | 394,131 | 130,346 | ||||||
| Net decrease (increase) in due from banks (excluding due from the Bank of Japan) | 41,711 | 73,035 | ||||||
| Net decrease (increase) in call loans and others | 9,420 | 29,785 | ||||||
| Net increase (decrease) in call money and others | 595,121 | (650,935 | ) | |||||
| Net increase (decrease) in payables under securities lending transactions | 156,060 | (135,796 | ) | |||||
| Net decrease (increase) in foreign exchanges - assets | (2,213 | ) | (4,899 | ) | ||||
| Net increase (decrease) in foreign exchanges - liabilities | (2 | ) | 125 | |||||
| Net decrease (increase) in lease receivables and investment assets | 1,057 | (742 | ) | |||||
| Interest and dividends received | 169,383 | 167,662 | ||||||
| Interest paid | (8,230 | ) | (9,617 | ) | ||||
| Other, net | (10,672 | ) | (17,376 | ) | ||||
| Subtotal | 1,368,412 | (48,867 | ) | |||||
| Income taxes paid | (37,507 | ) | (27,312 | ) | ||||
| Net cash provided by (used in) operating activities | 1,330,904 | (76,179 | ) | |||||
15
| (Unit: Millions of Yen) | ||||||||
For the year ended March 31, 2015 | For the year ended March 31, 2016 | |||||||
| Cash flows from investing activities : | ||||||||
| Purchase of securities | (5,973,138 | ) | (4,986,273 | ) | ||||
| Proceeds from sales of securities | 5,028,022 | 4,346,278 | ||||||
| Proceeds from redemption of securities | 619,775 | 626,434 | ||||||
| Purchase of tangible fixed assets | (7,130 | ) | (10,754 | ) | ||||
| Proceeds from sales of tangible fixed assets | 3,395 | 206 | ||||||
| Purchase of intangible fixed assets | (5,125 | ) | (3,666 | ) | ||||
| Other, net | (271 | ) | (277 | ) | ||||
| Net cash provided by (used in) investing activities | (334,472 | ) | (28,051 | ) | ||||
| Cash flows from financing activities : | ||||||||
| Payments for redemption of subordinated bonds and bonds with subscription rights to shares | (30,000 | ) | - | |||||
| Proceeds from share issuance to non-controlling shareholders | 204 | - | ||||||
| Cash dividends paid | (15,276 | ) | (16,135 | ) | ||||
| Cash dividends paid to non-controlling interests | (1,592 | ) | (1,584 | ) | ||||
| Purchase of treasury shares | (22,536 | ) | (30,040 | ) | ||||
| Proceeds from sales of treasury shares | 763 | 886 | ||||||
| Purchase of treasury shares of subsidiaries | (6,194 | ) | - | |||||
| Net cash provided by (used in) financing activities | (74,632 | ) | (46,873 | ) | ||||
| Effect of exchange rate change on cash and cash equivalents | 53 | (27 | ) | |||||
| Net increase (decrease) in cash and cash equivalents | 921,853 | (151,133 | ) | |||||
| Cash and cash equivalents at beginning of period | 1,268,029 | 2,189,882 | ||||||
| Cash and cash equivalents at end of period | 2,189,882 | 2,038,749 | ||||||
16
(5) Note on Going Concern Assumption
Not applicable.
(6) Changes in Accounting Policies, Accounting Estimates, and Restatements
(Changes in accounting policies)
Bank of Yokohama has adopted Accounting Standard for Business Combinations (ASBJ Statement No. 21 issued on September 13, 2013, “Business Combination Accounting Standard”), Accounting Standard for Consolidated Financial Statements (ASBJ Statement No. 22 issued on September 13, 2013, “Consolidation Accounting Standard”) and Accounting Standard for Business Divestitures (ASBJ Statement No. 7 issued on September 13, 2013, “Business Divestitures Accounting Standard”), effective from the year ended March 31, 2016. In accordance with these accounting standards, Bank of Yokohama has changed accounting policies as follows:
| (a) | The difference arising from a change in Bank of Yokohama’s ownership interests in a subsidiary over which Bank of Yokohama continues to have control is recognized in Capital surplus. |
| (b) | Acquisition-related costs are expensed in the period incurred. |
| (c) | For a business combination occurring on or after April 1, 2015, an adjustment to the provisional amounts arising from the finalization of the tentative accounting treatment relating to the purchase price allocation is retrospectively recognized in the consolidated financial statements for the accounting period in which the combination occurs. |
In addition, changes are made to the presentation of “Profit” and other relevant items, and “Minority interests” is changed to “Non-controlling interests”. Certain amounts in the consolidated financial statements for the year ended March 31, 2015 have been reclassified to reflect these changes.
In accordance with the transitional treatments set forth in Paragraph 58-2 (4) of Business Combination Accounting Standard, Paragraph 44-5 (4) of Consolidation Accounting Standard and Paragraph 57-4 (4) of Business Divestitures Accounting Standard, Bank of Yokohama has prospectively adopted these accounting standards from the beginning of the year ended March 31, 2016.
There is no effect of these changes on the consolidated financial statements for the year ended March 31, 2016.
(7) Notes to consolidated financial statements
(Additional information)
On March 29, 2016, the “Act to partially revise the Income Tax Act and Others” (Act No. 15 of 2016) and “Act to partially revise the Local Tax Act and Others” (Act No.13 of 2016) were enacted. Under these acts, effective for fiscal years beginning on or after April 1, 2016, corporate tax rate will be reduced. As a result, effective statutory tax rates used to determine deferred tax assets and liabilities will be from current 32.2% to 30.8% for temporary differences that are expected to reverse during the fiscal year beginning on April 1, 2016 and beginning on April 1, 2017 and to 30.6% for temporary differences that are expected to reverse during the fiscal years beginning on April 1, 2018. The effect of these changes in the statutory tax rates was to decrease deferred tax assets by ¥81 million and deferred tax liabilities by ¥1,063 million, and increase valuation difference on available-for-sale securities by ¥1,834 million and income taxes-deferred by ¥984 million, and decrease deferred tax liabilities for land revaluation by ¥867 million with an increase of the same amount of revaluation reserve for land.
(Segment information)
Bank of Yokohama Group engages in banking as its mainstay business, as well as leasing, securities, and other financial services businesses.
The Group Strategic Conference established by Bank of Yokohama helps each group company set its own management goals and conducts periodic reviews of progress as part of its thorough supervision of the management of the whole group. Segment information for businesses other than the banking of each Group company is not disclosed due to its immateriality.
17
(Per share information)
| For the year ended March 31, 2016 | |
| Net assets per share | ¥799.85 |
| Net income per share | ¥60.80 |
| Diluted net income per share | ¥60.77 |
(Note) 1. Basis for calculation of net assets per share is as follows:
| As of March 31, 2016 | ||
| Total net assets | Millions of yen | 1,008,803 |
| Deduction from total net assets | Millions of yen | 45,317 |
| Subscription rights to shares | Millions of yen | 267 |
Non-controlling interests | Millions of yen | 45,050 |
| Net assets applicable to common stock | Millions of yen | 963,485 |
| Number of shares of common stock used in calculation of net assets per share | Thousand of shares | 1,204,581 |
2. Basis for calculation of net income per share and diluted net income per share is as follows:
| For the year ended March 31, 2016 | ||
| Net income per share | ||
| Profit attributable to owners of parent | Millions of yen | 74,574 |
| Amount not available to common shareholders | Millions of yen | ― |
| Profit attributable to owners of parent for common stock | Millions of yen | 74,574 |
| Average number of shares of common stock outstanding during the period | Thousand of shares | 1,226,501 |
| Diluted net income per share | ||
| Adjusted to profit attributable to owners of parent | Millions of yen | ― |
| Increase in the number of shares of common stock | Thousand of shares | 601 |
| Subscription rights to shares | Thousand of shares | 601 |
| Summary of dilutive shares not included in the calculation of diluted net income per share since there was no dilutive effect | ― | |
(Significant subsequent events)
1. Business integration between Bank of Yokohama and The Higashi-Nippon Bank, Limited
Bank of Yokohama and The Higashi-Nippon Bank, Limited (Representative Director, President: Michitoo Ishii) (“Higashi-Nippon Bank”, together, the “Banks”) resolved at their respective meetings of the board of directors held on September 8, 2015 to incorporate a company named “Concordia Financial Group, Ltd.” (the “Joint Holding Company”) that would become a wholly-owning parent company of the Banks effective as of April 1, 2016 through a share transfer (“Share Transfer”) subject to obtaining the approval of shareholders of the Banks and regulatory approvals and resolved the outline of the Joint Holding Company and terms of the Share Transfer. The Banks also entered into the “Business Integration Agreement” and jointly prepared the Share Transfer Plan on September 8, 2015.
The Share Transfer Plan was approved at their respective extraordinary meetings of shareholders on December 21, 2015 and the Joint Holding Company was incorporated on April 1, 2016.
18
(1) Outline of the business combination
(a) Name of the acquired company and its business
Higashi-Nippon Bank (Banking business)
(b) Major reasons for the business combination
In recent years, the market size in regional economies has been expected to shrink in the future due to the aging and declining population. In addition, there has been a significant structural change in the operating foundation of regional financial institutions, due to the fact that the number of regional financial institutions has not declined despite the fact that, since the collapse of the bubble economy, the corporate sector has surplus funds and has thus been less dependent on indirect finance. Consequently, it has become an important business challenge for all regional financial institutions to cope with reduction of profit margins and deterioration of earnings capacity resulting from interest rate competition.
Taking into account such changes in the environment, the Banks believed that it was necessary for regional financial institutions to promote sharing of a wide-area network and cooperation with each other to further contribute to sustainable regional growth going forward. Based on this belief, the Banks decided to form a new financial group that is open to other regional financial institutions that share the same management strategy and that would play a central role in regional finance with wide area coverage.
While the Banks are both based in the Metropolitan area, Bank of Yokohama Ltd. has as its strengths a stable fund raising capability and the ability to efficiently and broadly provide high-quality financial services that are supported by strong brand power principally in Kanagawa Prefecture and southwest Tokyo, whereas Higashi-Nippon Bank has as its strength sales capabilities focusing on attentive face-to-face transactions and presentation of proposals in the area of loans to small and medium-sized enterprises.
Taking into account such strengths and characteristics of the Banks and the fact that despite both being based in the Metropolitan area, the Banks are not competing much against each other in sales areas, customer bases and areas of strength, etc. but rather are more complementary to each other, the Banks confirmed that the Banks would be able to improve services to customers and corporate value through the expected improvements in efficiency and synergy effects for growth from the business integration. Accordingly, Bank of Yokohama and Higashi-Nippon Bank reached a definitive agreement on the implementation of the business integration through the establishment of a holding company on September 8, 2015.
(c) Date of the business combination
April 1, 2016
(d) Legal form of the business combination
Incorporation of a joint holding company through a share transfer
(e) Company name after the business combination
Concordia Financial Group, Ltd.
(f) Ratio of voting rights acquired
100%
(g) Main basis for determining the acquiring company
Based on factors in determining the acquiring company in the Accounting Standard for Business Combination.
(2) Transfer ratio by class of shares, its calculation method, and the number of shares delivered
(a) Share transfer ratio by class of shares
(i) One share of the Joint Holding Company for each share of common stock of Bank of Yokohama
(ii) 0.541 share of the Joint Holding Company for each share of common stock of Higashi-Nippon Bank
(b) Calculation method
Bank of Yokohama appointed Daiwa Securities Co. Ltd. and Higashi-Nippon Bank appointed SMBC Nikko Securities Inc. as independent third party assessors and each requested its respective assessor to calculate the share transfer ratio. Based on the reports submitted by the assessors and upon discussions on the share transfer ratio among the Banks, the share transfer ratio was agreed upon and determined.
(c) Number of shares delivered
Common stock 1,300,263,183 shares
19
2. Retirement of treasury shares
Bank of Yokohama decided retirement of treasury shares at meeting of the board of directors held on February 24, 2016 in accordance with Article 178 of the Companies Act and performed as follows:
(1) Reason for retirement of treasury shares
In pursuing the business integration between Bank of Yokohama and Higashi-Nippon Bank, Bank of Yokohama retired treasury shares in accordance with the Share Transfer Plan approved at their respective extraordinary meetings of shareholders on December 21, 2015.
(2) Type of shares retired
Common stock
(3) Total number of shares retired
49,494,306 shares
(4) Date of retirement
April 1, 2016
3. Redemption of preferred securities
Bank of Yokohama determined the redemption of preferred securities issued through an overseas special purpose company, a subsidiary of Bank of Yokohama, on April 27, 2016. The outline of preferred securities to be redeemed is as follows:
(1) Issuer
Yokohama Preferred Capital Cayman Limited
(2) Type of securities issued
Non-cumulative perpetual preferred securities
(3) Gross amount of redemption
¥40 billion
(4) Expected redemption date
July 25, 2016
(5) Reasons for redemption
Due for voluntary redemption
20
| 6. Non-Consolidated Financial Statements | ||||||||
| (1) Non-Consolidated Balance Sheets | ||||||||
| (Unit: Millions of Yen) | ||||||||
| As of March 31, 2015 | As of March 31, 2016 | |||||||
| Assets : | ||||||||
| Cash and due from banks | 2,299,181 | 2,077,722 | ||||||
| Cash | 125,751 | 147,818 | ||||||
| Due from banks | 2,173,430 | 1,929,903 | ||||||
| Call loans | 273,006 | 263,285 | ||||||
| Monetary claims bought | 117,416 | 95,255 | ||||||
| Trading assets | 15,233 | 12,058 | ||||||
| Trading account securities | 7,599 | 11,540 | ||||||
| Derivatives of trading securities | 64 | - | ||||||
| Trading-related financial derivatives | 570 | 517 | ||||||
| Other trading assets | 6,999 | - | ||||||
| Securities | 2,461,869 | 2,371,236 | ||||||
| Government bonds | 700,195 | 628,588 | ||||||
| Local government bonds | 258,822 | 234,687 | ||||||
| Corporate bonds | 689,545 | 613,971 | ||||||
| Stocks | 232,184 | 217,110 | ||||||
| Other securities | 581,120 | 676,878 | ||||||
| Loans and bills discounted | 9,778,038 | 10,005,477 | ||||||
| Bills discounted | 31,993 | 27,445 | ||||||
| Loans on bills | 263,106 | 264,519 | ||||||
| Loans on deeds | 8,647,854 | 8,902,649 | ||||||
| Overdrafts | 835,083 | 810,862 | ||||||
| Foreign exchanges | 7,315 | 12,214 | ||||||
| Due from foreign banks (our accounts) | 2,640 | 8,827 | ||||||
| Foreign bills bought | 525 | 506 | ||||||
| Foreign bills receivable | 4,148 | 2,880 | ||||||
| Other assets | 87,452 | 120,247 | ||||||
| Prepaid expenses | 1,975 | 3,116 | ||||||
| Accrued income | 12,568 | 12,230 | ||||||
| Initial margins of futures markets | 32 | 1,653 | ||||||
| Variation margins of futures markets | 15 | 27 | ||||||
| Derivatives other than for trading - assets | 48,437 | 63,228 | ||||||
| Cash collateral paid for financial instruments | 7,391 | 20,137 | ||||||
| Other | 17,030 | 19,854 | ||||||
| Tangible fixed assets | 126,047 | 131,690 | ||||||
| Buildings, net | 34,410 | 39,726 | ||||||
| Land | 86,108 | 85,280 | ||||||
| Construction in progress | 1,965 | 1,262 | ||||||
| Other tangible fixed assets | 3,562 | 5,420 | ||||||
| Intangible fixed assets | 10,696 | 10,542 | ||||||
| Software | 10,285 | 10,137 | ||||||
| Other intangible fixed assets | 411 | 405 | ||||||
| Prepaid pension cost | 30,682 | 36,011 | ||||||
| Customers’ liabilities for acceptances and guarantees | 54,678 | 49,463 | ||||||
| Allowance for loan losses | (57,284 | ) | (49,997 | ) | ||||
| Total assets | 15,204,334 | 15,135,207 | ||||||
21
| (Unit: Millions of Yen) | ||||||||
| As of March 31, 2015 | As of March 31, 2016 | |||||||
| Liabilities : | ||||||||
| Deposits | 12,158,517 | 12,680,813 | ||||||
| Current deposits | 419,672 | 413,733 | ||||||
| Ordinary deposits | 7,947,161 | 8,365,740 | ||||||
| Saving deposits | 216,309 | 209,830 | ||||||
| Deposits at notice | 96,583 | 101,489 | ||||||
| Time deposits | 3,234,467 | 3,234,824 | ||||||
| Other deposits | 244,322 | 355,194 | ||||||
| Negotiable certificates of deposit | 126,960 | 197,110 | ||||||
| Call money | 777,299 | 126,364 | ||||||
| Payables under securities lending transactions | 247,651 | 111,855 | ||||||
| Trading liabilities | 609 | 194 | ||||||
| Derivatives of trading securities | 71 | 11 | ||||||
| Trading-related financial derivatives | 538 | 182 | ||||||
| Borrowed money | 710,193 | 840,538 | ||||||
| Borrowings from other banks | 710,193 | 840,538 | ||||||
| Foreign exchanges | 56 | 181 | ||||||
| Due to foreign banks (their accounts) | - | 15 | ||||||
| Foreign bills sold | 20 | 1 | ||||||
| Foreign bills payable | 35 | 164 | ||||||
| Other liabilities | 140,327 | 145,457 | ||||||
| Income taxes payable | 10,807 | 15,057 | ||||||
| Accrued expenses | 10,974 | 11,543 | ||||||
| Unearned revenue | 2,693 | 2,478 | ||||||
| Derivatives other than for trading - liabilities | 42,771 | 45,711 | ||||||
| Cash collateral received for financial instruments | - | 3,753 | ||||||
| Asset retirement obligations | 22 | 14 | ||||||
| Other | 73,058 | 66,898 | ||||||
| Provision for directors’ bonuses | 69 | 59 | ||||||
| Provision for reimbursement of deposits | 1,653 | 1,745 | ||||||
| Provision for contingent losses | 774 | 710 | ||||||
| Deferred tax liabilities | 22,613 | 15,345 | ||||||
| Deferred tax liabilities for land revaluation | 17,461 | 16,594 | ||||||
| Acceptances and guarantees | 54,678 | 49,463 | ||||||
| Total liabilities | 14,258,865 | 14,186,433 | ||||||
22
| (Unit: Millions of Yen) | ||||||||
| As of March 31, 2015 | As of March 31, 2016 | |||||||
| Net assets : | ||||||||
| Capital stock | 215,628 | 215,628 | ||||||
| Capital surplus | 177,244 | 177,244 | ||||||
| Legal capital surplus | 177,244 | 177,244 | ||||||
| Retained earnings | 413,864 | 470,444 | ||||||
| Legal retained earnings | 38,384 | 38,384 | ||||||
| Other retained earnings | 375,479 | 432,060 | ||||||
| Reserve for advanced depreciation of non-current assets | 2,585 | 2,563 | ||||||
| General reserve | 118,234 | 118,234 | ||||||
| Retained earnings brought forward | 254,660 | 311,262 | ||||||
| Treasury shares | (5,090 | ) | (34,009 | ) | ||||
| Total shareholders’ equity | 801,646 | 829,308 | ||||||
| Valuation difference on available-for-sale securities | 107,406 | 82,232 | ||||||
| Deferred gains or losses on hedges | 41 | 37 | ||||||
| Revaluation reserve for land | 36,060 | 36,928 | ||||||
| Total valuation and translation adjustments | 143,508 | 119,198 | ||||||
| Subscription rights to shares | 314 | 267 | ||||||
| Total net assets | 945,469 | 948,773 | ||||||
| Total liabilities and net assets | 15,204,334 | 15,135,207 | ||||||
23
| (2) Non-Consolidated Statements of Income | ||||||||
| (Unit: Millions of Yen) | ||||||||
For the year ended March 31, 2015 | For the year ended March 31, 2016 | |||||||
| Ordinary income | 260,193 | 280,550 | ||||||
| Interest income | 165,670 | 163,537 | ||||||
| Interest on loans and discounts | 132,425 | 127,207 | ||||||
| Interest and dividends on securities | 27,723 | 29,928 | ||||||
| Interest on call loans | 1,235 | 1,954 | ||||||
| Interest on receivables under securities borrowing transactions | - | 0 | ||||||
| Interest on deposits with banks | 2,142 | 2,321 | ||||||
| Other interest income | 2,143 | 2,125 | ||||||
| Fees and commissions | 57,021 | 56,673 | ||||||
| Fees and commissions on domestic and foreign exchanges | 10,374 | 10,360 | ||||||
| Other fees and commissions | 46,646 | 46,312 | ||||||
| Trading income | 424 | 535 | ||||||
| Gains on trading account securities transactions | 421 | 219 | ||||||
| Income from trading-related financial derivatives transactions | - | 313 | ||||||
| Other trading income | 3 | 2 | ||||||
| Other ordinary income | 30,205 | 45,823 | ||||||
| Gains on foreign exchange transactions | 1,503 | 1,447 | ||||||
| Gains on sales of bonds | 1,978 | 3,976 | ||||||
| Income from derivatives other than for trading or hedging | 26,700 | 40,397 | ||||||
| Other | 22 | 2 | ||||||
| Other income | 6,872 | 13,980 | ||||||
| Reversal of allowance for loan losses | - | 4,264 | ||||||
| Recoveries of written off claims | 1,751 | 940 | ||||||
| Gain on sales of stocks and other securities | 1,598 | 4,805 | ||||||
| Other | 3,522 | 3,970 | ||||||
| Ordinary expenses | 158,156 | 172,116 | ||||||
| Interest expenses | 9,072 | 11,016 | ||||||
| Interest on deposits | 4,412 | 4,730 | ||||||
| Interest on negotiable certificates of deposit | 75 | 179 | ||||||
| Interest on call money | 578 | 1,508 | ||||||
| Interest on payables under securities lending transactions | 412 | 842 | ||||||
| Interest on borrowings and rediscounts | 1,599 | 2,064 | ||||||
| Interest on bonds | 143 | - | ||||||
| Interest on interest swaps | 9 | 128 | ||||||
| Other interest expenses | 1,840 | 1,562 | ||||||
| Fees and commissions payments | 14,385 | 14,652 | ||||||
| Fees and commissions on domestic and foreign exchanges | 1,917 | 1,947 | ||||||
| Other fees and commissions | 12,468 | 12,705 | ||||||
| Trading expenses | 4 | - | ||||||
| Expenses on trading-related financial derivatives transactions | 4 | - | ||||||
| Other ordinary expenses | 25,372 | 39,212 | ||||||
| Loss on sales of bonds | 23,114 | 37,961 | ||||||
| Loss on redemption of bonds | 2,211 | 1,139 | ||||||
| Loss on devaluation of bonds | 46 | 111 | ||||||
| General and administrative expenses | 104,362 | 102,777 | ||||||
| Other expenses | 4,959 | 4,456 | ||||||
| Provision of allowance for loan losses | 730 | - | ||||||
| Written-off of loans | 1,372 | 1,008 | ||||||
| Losses on sales of stocks and other securities | 13 | - | ||||||
| Losses on devaluation of stocks and other securities | 8 | 20 | ||||||
| Other | 2,834 | 3,427 | ||||||
24
| (Unit: Millions of Yen) | ||||||||
For the year ended March 31, 2015 | For the year ended March 31, 2016 | |||||||
| Ordinary profit | 102,037 | 108,433 | ||||||
| Extraordinary income | 2,630 | 8 | ||||||
| Gain on disposal of non-current assets | 2,630 | 8 | ||||||
| Extraordinary losses | 1,610 | 706 | ||||||
| Loss on disposal of non-current assets | 1,610 | 706 | ||||||
| Income before income taxes | 103,057 | 107,736 | ||||||
| Income taxes - current | 28,570 | 27,746 | ||||||
| Income taxes - deferred | 6,965 | 7,155 | ||||||
| Total income taxes | 35,536 | 34,901 | ||||||
| Net income | 67,521 | 72,834 | ||||||
25
(3) Non-Consolidated Statements of Changes in Net Assets
For the year ended March 31, 2015
Shareholders’ equity | |||||||||||
| Capital surplus | Retained earnings | ||||||||||
| Other retained earnings | |||||||||||
| Capital stock | Legal capital surplus | Other capital surplus | Total capital surplus | Legal retained earnings | Reserve for advanced depreciation of non-current assets | General reserve | Retained earnings brought forward | Total retained earnings | Treasury shares | Total shareholders' equity | |
| Balance at beginning of current period | 215,628 | 177,244 | ― | 177,244 | 38,384 | 1,157 | 118,234 | 228,180 | 385,956 | (5,585) | 773,243 |
| Cumulative effects of changes in accounting policies | (2,097) | (2,097) | (2,097) | ||||||||
| Restated balance | 215,628 | 177,244 | ― | 177,244 | 38,384 | 1,157 | 118,234 | 226,082 | 383,858 | (5,585) | 771,146 |
| Changes of items during period | |||||||||||
| Dividends of surplus | (15,276) | (15,276) | (15,276) | ||||||||
| Provision of reserve for advanced depreciation of non-current assets | 1,471 | (1,471) | ― | ― | |||||||
| Reversal of reserve for advanced depreciation of non-current assets | (43) | 43 | ― | ― | |||||||
| Net income | 67,521 | 67,521 | 67,521 | ||||||||
| Purchase of treasury shares | (22,536) | (22,536) | |||||||||
| Disposal of treasury shares | 72 | 72 | 719 | 792 | |||||||
| Retirement of treasury shares | (72) | (72) | (22,239) | (22,239) | 22,312 | ― | |||||
| Net changes of items other than shareholders' equity | |||||||||||
| Total changes of items during period | ― | ― | ― | ― | ― | 1,427 | ― | 28,577 | 30,005 | 494 | 30,500 |
| Balance at end of current period | 215,628 | 177,244 | ― | 177,244 | 38,384 | 2,585 | 118,234 | 254,660 | 413,864 | (5,090) | 801,646 |
| Valuation and translation adjustments | ||||||
| Valuation difference on available-for-sale securities | Deferred gains or losses on hedges | Revaluation reserve for land | Total valuation and translation adjustments | Subscription rights to shares | Total net assets | |
| Balance at beginning of current period | 55,158 | 7 | 34,216 | 89,382 | 265 | 862,892 |
| Cumulative effects of changes in accounting policies | (2,097) | |||||
| Restated balance | 55,158 | 7 | 34,216 | 89,382 | 265 | 860,794 |
| Changes of items during period | ||||||
| Dividends of surplus | (15,276) | |||||
| Provision of reserve for advanced depreciation of non-current assets | ― | |||||
| Reversal of reserve for advanced depreciation of non-current assets | ― | |||||
| Net income | 67,521 | |||||
| Purchase of treasury shares | (22,536) | |||||
| Disposal of treasury shares | 792 | |||||
| Retirement of treasury shares | ― | |||||
| Net changes of items other than shareholders' equity | 52,248 | 33 | 1,843 | 54,125 | 48 | 54,174 |
| Total changes of items during period | 52,248 | 33 | 1,843 | 54,125 | 48 | 84,674 |
| Balance at end of current period | 107,406 | 41 | 36,060 | 143,508 | 314 | 945,469 |
26
For the year ended March 31, 2016
| (Unit: Millions of Yen) |
Shareholders’ equity | ||||||||||
| Capital surplus | Retained earnings | |||||||||
| Other retained earnings | ||||||||||
| Capital stock | Legal capital surplus | Total capital surplus | Legal retained earnings | Reserve for advanced depreciation of non-current assets | General reserve | Retained earnings brought forward | Total retained earnings | Treasury shares | Total shareholders’ equity | |
| Balance at beginning of current period | 215,628 | 177,244 | 177,244 | 38,384 | 2,585 | 118,234 | 254,660 | 413,864 | (5,090) | 801,646 |
| Changes of items during period | ||||||||||
| Dividends of surplus | (16,135) | (16,135) | (16,135) | |||||||
| Provision of reserve for advanced depreciation of non-current assets | 65 | (65) | ― | ― | ||||||
| Reversal of reserve for advanced depreciation of non-current assets | (87) | 87 | ― | ― | ||||||
| Net income | 72,834 | 72,834 | 72,834 | |||||||
| Purchase of treasury shares | (30,040) | (30,040) | ||||||||
| Disposal of treasury shares | (118) | (118) | 1,121 | 1,003 | ||||||
Net changes of items other than shareholders’ equity | ||||||||||
| Total changes of items during period | ― | ― | ― | ― | (21) | ― | 56,602 | 56,580 | (28,918) | 27,662 |
| Balance at end of current period | 215,628 | 177,244 | 177,244 | 38,384 | 2,563 | 118,234 | 311,262 | 470,444 | (34,009) | 829,308 |
| Valuation and translation adjustments | ||||||
| Valuation difference on available-for-sale securities | Deferred gains or losses on hedges | Revaluation reserve for land | Total valuation and translation adjustments | Subscription rights to shares | Total net assets | |
| Balance at beginning of current period | 107,406 | 41 | 36,060 | 143,508 | 314 | 945,469 |
| Changes of items during period | ||||||
| Dividends of surplus | (16,135) | |||||
| Provision of reserve for advanced depreciation of non-current assets | ― | |||||
| Reversal of reserve for advanced depreciation of non-current assets | ― | |||||
| Net income | 72,834 | |||||
| Purchase of treasury shares | (30,040) | |||||
| Disposal of treasury shares | 1,003 | |||||
Net changes of items other than shareholders’ equity | (25,174) | (3) | 867 | (24,310) | (47) | (24,357) |
| Total changes of items during period | (25,174) | (3) | 867 | (24,310) | (47) | 3,304 |
| Balance at end of current period | 82,232 | 37 | 36,928 | 119,198 | 267 | 948,773 |
27
| SELECTED FINANCIAL INFORMATION FOR THE YEAR ENDED MARCH 31, 2016 |
| 【 CONTENTS 】 | |||
| I. DIGEST OF FINANCIAL RESULTS FOR THE YEAR ENDED MARCH 31, 2016 | Non-Consolidated Consolidated | ||
| II. SUMMARY OF FINANCIAL RESULTS | |||
| 1. | Profit and Loss | Non-Consolidated Consolidated | |
| 2. | Average Balance of Use and Source of Funds (Domestics) | Non-Consolidated | |
| 3. | Interest Margins (Domestics) | Non-Consolidated | |
| 4. | Fees and Commissions (Domestics) | Non-Consolidated | |
| 5. | Gains or Losses on Investment Securities | Non-Consolidated | |
| 6. | Net Unrealized Gains (Losses) on Securities | Non-Consolidated Consolidated | |
| 7. | Derivative contracts | Consolidated | |
| 8. | Expenses, Employees and Branches | Non-Consolidated | |
| 9. | Net Business Profit | Non-Consolidated | |
| 10. | Return on Equity | Non-Consolidated Consolidated | |
| 11. | Return on Assets | Non-Consolidated | |
| 12. | Retirement Benefit | Non-Consolidated Consolidated | |
| 13. | Deferred Tax Assets | Non-Consolidated Consolidated | |
| 14. | Capital Adequacy Ratio (BIS Standard) | Consolidated Non-Consolidated | |
| III. LOANS, etc. INFORMATION | |||
| 1. | Risk Managed Loan Information | Non-Consolidated Consolidated | |
| 2. | Allowance for Loan Losses | Non-Consolidated Consolidated | |
| 3. | Percentage of Allowance to Total Risk Managed Loans | Non-Consolidated Consolidated | |
| 4. | Status of Claims disclosed under the Financial Revitalization Law | Non-Consolidated Consolidated | |
| 5. | Status of Coverage of Claims disclosed under the Financial Revitalization Law | Non-Consolidated | |
| ※ | Allowance Coverage Ratio・Total Coverage Ratio | Non-Consolidated | |
| ※ | Each Standards Concerning Disclosure of Assets | Non-Consolidated | |
| 6. | Off-Balanced Credits | Non-Consolidated | |
| 7. | Status of Bankruptcy due to Classification of Loan Categories | Non-Consolidated | |
| 8. | Loan Portfolio, etc. Information | Non-Consolidated | |
| 9. | Loans Information | Non-Consolidated | |
| 10. | Deposits Information | Non-Consolidated | |
| 11. | Individual Deposit Assets, etc. | Non-Consolidated Consolidated | |
| 12. | Average Balance of Use and Source of Funds, etc. | Non-Consolidated | |
| 13. | Loan-Deposit Ratio and Securities-Deposit Ratio | Non-Consolidated | |
28
| Ⅰ. DIGEST OF FINANCIAL RESULTS FOR THE YEAR ENDED MARCH 31, 2016 |
| 1. Income status |
| <Non- consolidated> | For the year ended | (Unit: Billions of Yen) | ||||||
| March 31, 2015 | March 31, 2016 | |||||||
| Increase /(Decrease) | ||||||||
| 1 | Gross operating income | 204.4 | 201.6 | [(1.3%)] | (2.8) | |||
| 2 | Gross operating income from domestic operations | 200.9 | 197.5 | (3.4) | ||||
| 3 | Interest income | 155.0 | 150.7 | (4.3) | ||||
| 4 | Fees and commissions | 42.2 | 41.6 | (0.6) | ||||
| 5 | Trading income | 0.3 | 0.2 | (0.1) | ||||
| 6 | Other ordinary income | 3.2 | 4.8 | 1.6 | ||||
| 7 | Gross operating income from international operations | 3.4 | 4.1 | 0.7 | ||||
| 8 | Expenses | 100.4 | 99.4 | [(1.0%)] | (1.0) | |||
| 9 | (Reference) OHR (※1) | 49.1% | 49.2% | 0.1% | ||||
| 10 | Of which, personnel | 44.5 | 45.2 | 0.7 | ||||
| 11 | Of which, facilities | 49.6 | 47.0 | (2.6) | ||||
| 12 | Core net business profit | (1-8) | 104.0 | 102.2 | [(1.7%)] | (1.8) | ||
| 13 | Provision of allowance for general loan losses | (2.7) | - | 2.7 | ||||
| 14 | Net business profit | (1-8-13) | 106.7 | 102.2 | [(4.2%)] | (4.5) | ||
| 15 | Non-recurring gains (losses) | (4.7) | 6.1 | 10.8 | ||||
| 16 | Of which, disposal of bad debts | 3.4 | (3.9) | (7.3) | ||||
| 17 | Of which, provision of allowance for specific loan losses | 3.4 | - | (3.4) | ||||
| 18 | Of which, reversal of allowance for loan losses | - | 4.2 | 4.2 | ||||
| 19 | Of which, gains or losses on stocks and other securities | 1.5 | 4.7 | 3.2 | ||||
| 20 | Ordinary profit | (14+15) | 102.0 | 108.4 | [6.2%] | 6.4 | ||
| 21 | Extraordinary income (losses) | 1.0 | (0.6) | (1.6) | ||||
| 22 | Total income taxes | 35.5 | 34.9 | (0.6) | ||||
| 23 | Net income | (20+21-22) | 67.5 | 72.8 | [7.8%] | 5.3 | ||
| 24 | Credit costs | (13+16) | 0.7 | (3.9) | (4.6) | |||
| 25 | Credit cost ratio (※2) | 0.00% | (0.03%) | (0.03%) | ||||
| [the rate of change] | ||||||||
| <Consolidated> | For the year ended | (Unit: Billions of Yen) | ||||||
| March 31, 2015 | March 31, 2016 | |||||||
| Increase /(Decrease) | ||||||||
| 26 | Ordinary profit | 108.0 | 114.6 | [6.0%] | 6.6 | |||
| 27 | Profit attributable to owners of parent | 76.3 | 74.5 | [(2.2%)] | (1.8) | |||
| 28 | Of which, excluding gain on bargain purchase | 67.2 | 74.5 | 7.3 | ||||
| 29 | ROE (※3) | 8.35% | 7.73% | (0.62%) | ||||
| 30 | Of which, excluding gain on bargain purchase | 7.39% | 7.73% | 0.34% | ||||
| 31 | RORA (※4) | 1.10% | 1.04% | (0.06%) | ||||
| 32 | Fees and commissions income ratio (※5) | 24.7% | 24.2% | (0.5%) | ||||
| [the rate of change] | ||||||||
<Non-Consolidated>
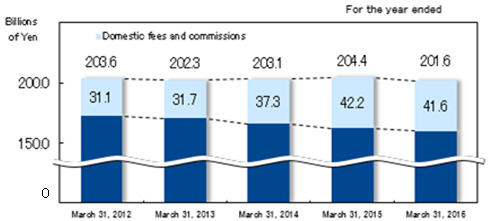
■ Gross operating income (1)
Gross operating income decreased by ¥2.8 billion from the previous year to ¥201.6 billion, mainly due to the decrease in interest income from domestic operations in accordance with the decline in market interest rates and the decrease in domestic fees and commissions in accordance with the weakness in stock markets.
■ Expenses (8)
Expenses decreased by ¥1.0 billion from the previous year to ¥99.4 billion, mainly due to the decrease in non-personnel expense resulting from the decrease in deposit insurance premium rate. OHR (overhead ratio) was 49.2% and maintained at a level of less than 50%, staying with the lowest level among Japanese banks.
■ Core net business profit (12)
Core net business profit decreased by ¥1.8 billion from the previous year to ¥102.2 billion, due to the decrease in gross operating income despite of the decrease in expenses.
■ Credit costs (24)
Credit costs decreased by ¥4.6 billion from the previous year to ¥-3.9 billion for the first time, and credit cost ratio was -0.03%, mainly due to the decrease in occurrence of default and deterioration of borrowers classification.
■ Ordinary profit (20)
Ordinary profit increased by ¥6.4 billion from the previous year to ¥108.4 billion, due to the decrease in credit costs and the increase in gains or losses on stocks and other securities, mainly resulting from gain on sales of stock acquired by Debt Equity Swap, by ¥3.2 billion from the previous year.
■ Net income (23)
Net income increased by ¥5.3 billion from the previous year to ¥72.8 billion, which is a historic high, mainly due to the increase in ordinary profit. Net income increased for seven consecutive years.
<Consolidated>
■ Ordinary profit (26)
Ordinary profit increased by ¥6.6 billion from the previous year to ¥114.6 billion and posted historic-high, mainly due to the increase in non-consolidated ordinary profit.
■ Profit attributable to owners of parent (27)
Profit attributable to owners of parent decreased by ¥1.8 billion from the previous year to ¥74.5 billion. Profit attributable to owners of parent excluding gain on bargain purchases increased by ¥7.3 billion from the previous year and posted historic-high.
In addition, ROE (Consolidated) decreased by 0.62% points from the previous year to 7.73%. ROE (Consolidated) excluding gain on bargain purchases increased 0.34% points from the previous year.
| (Reference 1) Transition of gross operating income 【Non-consolidated】 | 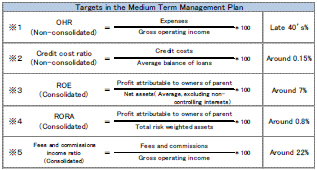 |
 | |
(Reference 2) Transition of credit costs 【Non-consolidated】 and credit cost ratio【Non-consolidated】 | (Reference 3) Transition of profit attributable to owners of parent 【Consolidated】 and ROE 【Consolidated】 |
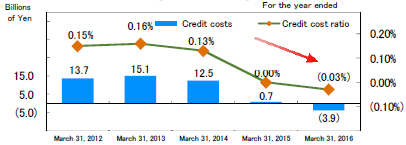 | 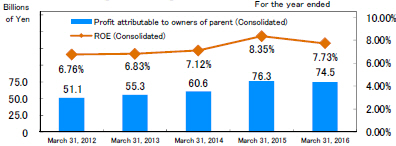 |
29
2. Loans <domestic blanches (excluding loans in offshore market account)> |
ⅰ. Transition of outstanding loan balance <Non-consolidated>
(Unit: Billions of Yen)
As of March 31, 2014 | As of March 31, 2015 (A) | As of March 31, 2016 (B) | |||||||
| (B)-(A) | |||||||||
| Loans <outstanding balance> | [C] | [2.3%] | |||||||
| 9,491.3 | 9,761.2 | 9,988.2 | 227.0 | ||||||
| Loans to small and medium-sized businesses, etc. | [A + B] | [1.9%] | |||||||
| 7,692.5 | 7,897.1 | 8,051.9 | 154.8 | ||||||
| Loans to small and medium-sized businesses | [A] | [4.6%] | |||||||
| 2,919.1 | 3,023.3 | 3,162.4 | 139.1 | ||||||
| Loans to individuals | [B] | [0.3%] | |||||||
| 4,773.3 | 4,873.8 | 4,889.4 | 15.6 | ||||||
| Of which, residential loans | [(0.0%)] | ||||||||
| 4,422.7 | 4,513.7 | 4,513.1 | (0.6) | ||||||
| Housing loans | [(1.2%)] | ||||||||
| 3,037.0 | 3,091.6 | 3,053.9 | (37.7) | ||||||
| Apartment loans | [2.6%] | ||||||||
| 1,385.6 | 1,422.0 | 1,459.1 | 37.1 | ||||||
| Loans (All branches including loans in offshore market account) | 9,505.1 | 9,778.0 | 10,005.4 | 227.4 | |||||
ⅱ. Transition of average loan balance <Non-consolidated>
| For the year ended | (Unit: Billions of Yen) | ||||||||
March 31, 2014 | March 31, 2015 (A) | March 31, 2016 (B) | |||||||
| (B)-(A) | |||||||||
| Loans <average balance> | [2.5%] | ||||||||
| 9,382.9 | 9,620.4 | 9,869.2 | 248.8 | ||||||
| Loans to small and medium-sized businesses, etc. | [A + B] | [2.2%] | |||||||
| 7,640.0 | 7,769.4 | 7,945.7 | 176.3 | ||||||
| Loans to small and medium-sized businesses | [A] | [3.9%] | |||||||
| 2,935.1 | 2,967.3 | 3,083.4 | 116.1 | ||||||
| Loans to individuals | [B] | [1.2%] | |||||||
| 4,704.9 | 4,802.1 | 4,862.2 | 60.1 | ||||||
| Of which, residential loans | [1.1%] | ||||||||
| 4,358.6 | 4,448.4 | 4,499.4 | 51.0 | ||||||
| Housing loans | [0.4%] | ||||||||
| 3,007.3 | 3,052.7 | 3,065.9 | 13.2 | ||||||
| Apartment loans | [2.7%] | ||||||||
| 1,351.2 | 1,395.7 | 1,433.5 | 37.8 | ||||||
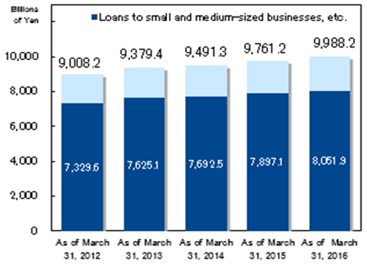
Outstanding loans balance increased by 2.3% from the end of the previous year to ¥9,988.2 billion, due to the increase in loans to small and medium-sized businesses by 4.6%. In all branches basis, the balance of loans was ¥10,005.4 billion and reached over ¥10,000 billion for the first time at the year end.
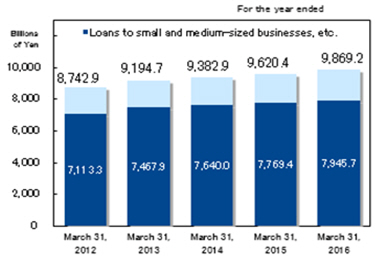
Average loans balance increased by 2.5% from the previous year to ¥9,869.2 billion, due to the increases in loans to small and medium-sized businesses and loans to individuals.
| (Reference 1) Transition of outstanding loan balance | (Reference 2) Transition of average loan balance |
 |  |
3. Deposits <domestic branches (excluding deposits in offshore market account)> |
| ⅰ. Transition of outstanding deposit balance <Non-consolidated> | (Unit: Billions of Yen) |
As of March 31, 2014 | As of March 31, 2015 (A) | As of March 31, 2016 (B) | ||||||
| (B)-(A) | ||||||||
| Deposits <outstanding balance> | [3.6%] | |||||||
| 11,854.5 | 12,112.1 | 12,549.4 | 437.3 | |||||
| Of which, individual | [2.1%] | |||||||
| 8,712.5 | 8,941.1 | 9,134.3 | 193.2 | |||||
| Of which, corporate | [4.8%] | |||||||
| 2,227.4 | 2,316.7 | 2,429.4 | 112.7 | |||||
| ⅱ. Transition of average deposit balance <Non-consolidated> | ||||||||
| For the year ended | (Unit: Billions of Yen) | |||||||
March 31, 2014 | March 31, 2015 (A) | March 31, 2016 (B) | ||||||
| (B)-(A) | ||||||||
| Deposits <average balance> | [3.2%] | |||||||
| 11,295.4 | 11,616.0 | 11,996.6 | 380.6 | |||||
| Of which, individual | [2.6%] | |||||||
| 8,602.7 | 8,854.2 | 9,089.6 | 235.4 | |||||
| Of which, corporate | [3.8%] | |||||||
| 2,208.6 | 2,305.5 | 2,394.5 | 89.0 | |||||
Outstanding deposits balance increased by 3.6% from the end of the previous year to ¥12,549.4 billion due to the increase in individual and corporate deposits.
Average deposits balance also increased by 3.2% from the previous year to ¥11,996.6 billion due to the increase in individual and corporate deposits.
(Reference) Transition of average individual deposit balance
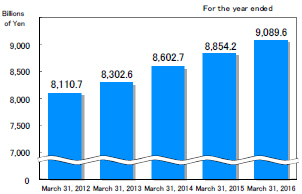
30
| 4. Deposit Assets for individuals |
| Balance of deposit assets for individuals | ||||||||
| <Non-consolidated> | (Unit: Billions of Yen) | |||||||
| As of March 31, | As of March 31, | As of March 31, | ||||||
| 2014 | 2015 (A) | 2016 (B) | (B)-(A) | |||||
| Investment trusts | 528.6 | 618.5 | 550.5 | (68.0) | ||||
| Insurance | 959.6 | 963.7 | 1,016.8 | 53.1 | ||||
| Foreign currency deposits | 37.7 | 33.5 | 27.5 | (6.0) | ||||
| Public bonds | 242.8 | 174.4 | 133.2 | (41.2) | ||||
Total balance of investment products for individuals | [A] | 1,769.0 | 1,790.2 | 1,728.2 | (62.0) | |||
| Individual deposits (deposits in yen) | [B] | 8,674.7 | 8,907.5 | 9,106.7 | 199.2 | |||
| Total deposit assets for individuals | [C] | 10,443.7 | 10,697.7 | 10,835.0 | 137.3 | |||
| <Consolidated> | (Unit: Billions of Yen) | |||||
Investment products for individuals at Hamagin Tokai Tokyo Securities Co., Ltd. | [D] | 299.0 | 350.0 | 323.3 | (26.7) | |
Total balance of investment products for individuals (Group total) | [E= A+D] | 2,068.0 | 2,140.3 | 2,051.6 | (88.7) | |
Total deposit assets for individuals (Group total) | [F = B+E] | 10,742.8 | 11,047.8 | 11,158.3 | 110.5 | |
Although the sales of investment products decreased from the previous year due to weakness in stock markets, the number of investment products’ holders increased by 11 thousand from the end of the previous year to 264 thousand mainly by providing customers with advice on portfolio building centered around “Core & Satellite Investment Strategies” and utilizing NISA.
Balance of insurance increased by ¥53.1 billion from the end of the previous year to ¥1,016.8 billion and reached over ¥1,000 billion for the first time.
On the other hand, balance of investment trusts decreased by ¥68 billion from the end of previous year due to the decrease in the net asset value of investment trusts and decrease in sales volume.
Total balances of investment products for individuals decreased by ¥62 billion from the end of previous year to ¥1,728.2 billion due to the decrease in balance of public bonds by ¥41.2 billion as well.
| (Reference 1) Transition of sales amount of investment products for individuals (Consolidated) | (Reference 2) Transition of the number of investment products’ holders and new customers (Non-consolidated) |
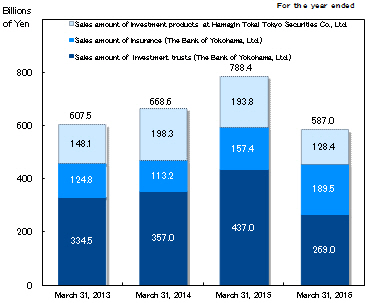 | 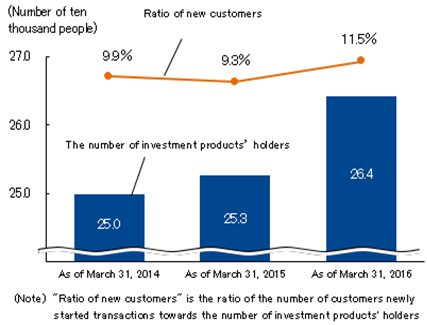 |
| 5. Shares of loans and deposits in Kanagawa Prefecture |
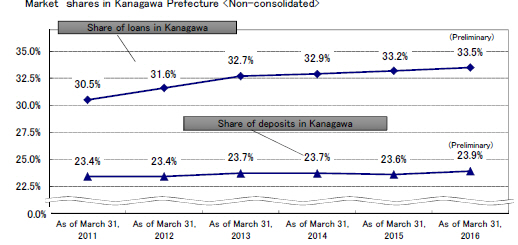
As a result of active provision of funds to our customers in Kanagawa prefecture, shares of loans in Kanagawa prefecture increased by 0.3% point from the end of previous year to 33.5%.
Individual deposits and corporate deposits increased, and shares of deposits in Kanagawa increased by 0.3% point from the end of previous year to 23.9%.
31
| 6. Status of Non-performing Loans |
| Transition of claims disclosed under the Financial Revitalization Law | |||||||
| <Non-consolidated> | (Unit: Billions of Yen) | ||||||
| As of | As of | As of | |||||
| March 31, 2014 | March 31, 2015 (A) | March 31, 2016 (B) | (B)-(A) | ||||
Unrecoverable or valueless claims ( in legal or virtual bankruptcy) | 43.7 | 53.0 | 55.0 | 2.0 | |||
Doubtful claims (in possible bankruptcy) | 137.2 | 135.1 | 124.1 | (11.0) | |||
| Claims in need of special caution | 26.1 | 19.6 | 15.3 | (4.3) | |||
| Sub-total (NPL) | [A] | 207.1 | 207.9 | 194.5 | (13.4) | ||
Claims in need of caution (excluding claims in need of special caution) | 1,003.4 | 943.7 | 971.0 | 27.3 | |||
Claims to normal borrowers (excluding claims in need of caution) | [B] | 8,453.6 | 8,773.7 | 8,975.6 | 201.9 | ||
| Normal claims | [C] | 9,457.0 | 9,717.4 | 9,946.6 | 229.2 | ||
Total (Credit exposures) | [D=A + C] | 9,664.1 | 9,925.4 | 10,141.2 | 215.8 | ||
NPL ratio (Percentage of NPL) | [A/D] | 2.1% | 2.0% | 1.9% | (0.1%) | ||
The ratio of claims to normal borrowers to credit exposures | [B/D] | 87.4% | 88.3% | 88.5% | 0.2% | ||
The balance of non-performing loans (“NPL”) under Financial Revitalization Law was ¥194.5 billion, less than ¥200 billion for the first time in 8 periods, mainly due to performance improvement of borrowers.
NPL ratio dropped by 0.1% from the end of the previous year to 1.9%, the lowest level after the enforcement of Financial Revitalization Law in 1998, due to the increase in normal claims.
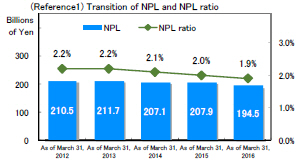 | 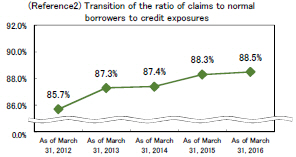 |
7. Capital Adequacy Ratio |
| <Consolidated> | (Unit: Billions of Yen) | |||||
| <Basel Ⅲ> | As of March 31, 2014 | As of March 31, 2015 (A) | As of March 31, 2016 (B) (Preliminary) | (B)-(A) | ||
Total capital ratio (BIS Standard) ※1 | 13.37% | 13.29% | 12.77% | (0.52%) | ||
| Tier 1 capital ratio | 12.29% | 12.56% | 12.43% | (0.13%) | ||
| Common Equity Tier 1 capital ratio ※3 | 11.97% | 12.28% | 12.19% | (0.09%) | ||
| Total capital | 883.3 | 916.9 | 913.1 | (3.8) | ||
| Tier 1 | 812.3 | 866.8 | 888.5 | 21.7 | ||
| Common Equity Tier 1 | 790.9 | 847.8 | 871.8 | 24.0 | ||
| Tier 2 | 71.0 | 50.1 | 24.5 | (25.6) | ||
| Total risk weighted assets ※2 | 6,605.6 | 6,898.4 | 7,147.5 | 249.1 | ||
※1. Total capital ratio (BIS Standard) is calculated in accordance with "the standards for determining whether the status of capital adequacy is appropriate in consideration of assets, etc., held by the bank under the provisions of Article 14-2 of the Banking Law (FSA Notification No. 19, 2006)."
※2. Calculation method of risk weighted assets :
<Credit risk> FIRB approach
<Operational risk> TSA (the standardized approach)
| Target in the Medium Management Plan | ||
※3. | Common Equity Tier 1 Capital ratio (Consolidated) | Around 11’ s% |
Total capital ratio based on Basel Ⅲ dropped by 0.52% points from the end of the previous year to 12.77% due to the increase in total risk weighted assets resulting from the increase in loans, despite of the increase in Common Equity Tier 1.
Common Equity Tier 1 capital ratio maintained at high level even though it dropped by 0.09% points from the end of previous year to 12.19%.
(Reference) Transition of Total capital ratio
and Common Equity Tier 1 capital ratio
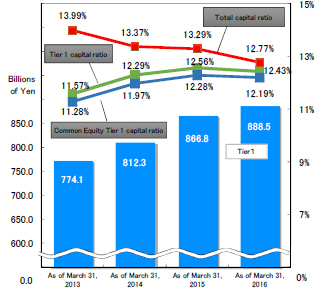
32
8. Forecasts for Fiscal Year 2016 |
<Concordia Financial Group Consolidated>
Ordinary profit is expected to be ¥93.5 billion. Profit attributable to owners of parent is expected to be ¥123.5 billion.
Gain on bargain purchase, included in profit attributable to owners of parent, is expected to be around ¥60 billion.
Concordia Financial Group will pay ordinary dividends of ¥13 per share as a stable dividend, and an additional dividend of ¥1 per share as an anniversary dividend accompanying the establishment of Concordia Financial Group, totaled to ¥14 per share based on the shareholders’ return policy in medium-term management plan.
In addition, Concordia Financial Group will pay a special dividend in the case where profit attributable to owners of parent exceeds ¥60 billion.
<Bank of Yokohama (Non-consolidated)>
Gross operating income is expected to decrease by ¥11.6 billion to ¥190 billion, mainly due to the decrease in interest income resulting from the decline of market interest rate.
Ordinary profit and net income are expected to decline due to the decrease in gross operating income and the increase in expenses resulting from proactive investments in order to realize synergies as early as possible.
<Higashi-Nippon Bank (Non-consolidated)>
Gross operating income is expected to be ¥32 billion, and remained at the same level compared to the previous year.
Ordinary profit and net income are expected to decrease mainly due to the increase in expenses resulting from proactive investments in order to improve customer service.
| Concordia Financial Group | ||||||||||||
| <Consolidated> | (Unit: Billions of Yen) | <Dividends> | ||||||||||
<Reference> Six months ending September 30, 2016 Combined Result (A) | <Reference> Fiscal year 2015 Combined Result (B) | Six months ending September 30, 2016 Forecasts (C) | (C)-(A) | Fiscal year 2016 Forecasts (D) | (D)-(B) | Six months ending September 30, 2016 Forecasts (C) | Fiscal year 2016 Forecasts (D) | |||||
| 1 | Ordinary income | 167.0 | 334.5 | 5 | Ordinary dividends per share | ¥6.50 | ¥13.00 | |||||
| 2 | Ordinary profit | 71.2 | 128.1 | 47.0 | (24.2) | 93.5 | (34.6) | 6 | Anniversary dividends per share | ¥1.00 | ¥1.00 | |
| 3 | Profit attributable to owners of parent | 46.7 | 81.5 | 92.0 | 45.3 | 123.5 | 42.0 | 7 | Total dividends per share | ¥7.50 | ¥14.00 | |
| 4 | (excluding gain on bargain purchase) | 46.7 | 81.5 | 32.0 | (14.7) | 63.5 | (18.0) | ※The amount of a special dividend will be announced based on our performance. | ||||
| <Reference>The Bank of Yokohama, Ltd. | ||||||||||||||||
| <Non-consolidated> | (Unit: Billions of Yen) | <Consolidated> | (Unit: Billions of Yen) | |||||||||||||
Six months ending September 30, 2016 Result (A) | Fiscal year 2015 Result (B) | Six months ending September 30, 2016 Forecasts (C) | (C)-(A) | Fiscal year 2016 Forecasts (D) | (D)-(B) | Six months ending September 30, 2016 Result (A) | Fiscal year 2015 Result (B) | Six months ending September 30, 2016 Forecasts (C) | (C)-(A) | Fiscal year 2016 Forecasts (D) | (D)-(B) | |||||
| 8 | Gross operating income | 102.7 | 201.6 | 96.0 | (6.7) | 190.0 | (11.6) | 14 | Ordinary profit | 62.3 | 114.6 | 44.5 | (17.8) | 88.5 | (26.1) | |
| 9 | Expenses (-) | 49.5 | 99.4 | 52.0 | 2.5 | 104.5 | 5.1 | 15 | Profit attributable to owners of parent | 40.9 | 74.5 | 30.0 | (10.9) | 59.5 | (15.0) | |
| 10 | Core net business profit | 53.1 | 102.2 | 44.0 | (9.1) | 85.5 | (16.7) | |||||||||
| 11 | Ordinary profit | 59.4 | 108.4 | 42.0 | (17.4) | 83.5 | (24.9) | |||||||||
| 12 | Net income | 40.5 | 72.8 | 29.5 | (11.0) | 57.5 | (15.3) | |||||||||
| 13 | Credit costs (-) | (2.7) | (3.9) | 0.0 | 2.7 | 0.0 | 3.9 | |||||||||
| <Reference>The Higashi-Nippon Bank, Limited | |||||||||||||||||
| <Non-consolidated> | (Unit: Billions of Yen) | <Consolidated> | (Unit: Billions of Yen) | ||||||||||||||
Six months ending September 30, 2016 Result (A) | Fiscal year 2015 Result (B) | Six months ending September 30, 2016 Forecasts (C) | (C)-(A) | Fiscal year 2016 Forecasts (D) | (D)-(B) | Six months ending September 30, 2016 Result (A) | Fiscal year 2015 Result (B) | Six months ending September 30, 2016 Forecasts (C) | (C)-(A) | Fiscal year 2016 Forecasts (D) | (D)-(B) | ||||||
| 16 | Gross operating income | 16.1 | 32.2 | 16.0 | (0.1) | 32.0 | (0.2) | 22 | Ordinary profit | 8.9 | 13.4 | 3.0 | (5.9) | 6.0 | (7.4) | ||
| 17 | Expenses (-) | 11.4 | 22.9 | 12.0 | 0.6 | 24.0 | 1.1 | 23 | Profit attributable to owners of parent | 5.7 | 6.9 | 2.0 | (3.7) | 4.0 | (2.9) | ||
| 18 | Core net business profit | 4.6 | 9.3 | 4.0 | (0.6) | 8.0 | (1.3) | ||||||||||
| 19 | Ordinary profit | 8.9 | 13.3 | 3.0 | (5.9) | 6.0 | (7.3) | ||||||||||
| 20 | Net income | 5.7 | 6.9 | 2.0 | (3.7) | 4.0 | (2.9) | ||||||||||
| 21 | Credit costs (-) | (0.3) | 0.0 | 0.9 | 1.2 | 1.8 | 1.8 | ||||||||||
| <Reference> The Bank of Yokohama, Ltd.【Non-Consolidated・Consolidated】・The Higashi-Nippon Bank, Limited【Non-Consolidated・Consolidated】 Combined | |||||||||||||||||
| <Non-consolidated> | (Unit: Billions of Yen) | <Consolidated> | (Unit: Billions of Yen) | ||||||||||||||
Six months ending September 30, 2016 Result (A) | Fiscal year 2015 Result (B) | Six months ending September 30, 2016 Forecasts (C) | (C)-(A) | Fiscal year 2016 Forecasts (D) | (D)-(B) | Six months ending September 30, 2016 Result (A) | Fiscal year 2015 Result (B) | Six months ending September 30, 2016 Forecasts (C) | (C)-(A) | Fiscal year 2016 Forecasts (D) | (D)-(B) | ||||||
| 24 | Gross operating income | 118.8 | 233.9 | 112.0 | (6.8) | 222.0 | (11.9) | 30 | Ordinary profit | 71.2 | 128.1 | 47.5 | (23.7) | 94.5 | (33.6) | ||
| 25 | Expenses (-) | 60.9 | 122.3 | 64.0 | 3.1 | 128.5 | 6.2 | 31 | Profit attributable to owners of parent | 46.7 | 81.5 | 32.0 | (14.7) | 63.5 | (18.0) | ||
| 26 | Core net business profit | 57.7 | 111.5 | 48.0 | (9.7) | 93.5 | (18.0) | ||||||||||
| 27 | Ordinary profit | 68.3 | 121.7 | 45.0 | (23.3) | 89.5 | (32.2) | ||||||||||
| 28 | Net income | 46.2 | 79.7 | 31.5 | (14.7) | 61.5 | (18.2) | ||||||||||
| 29 | Credit costs (-) | (3.1) | (3.8) | 0.9 | 4.0 | 1.8 | 5.6 | ||||||||||
33
9. Reference Income status (The Bank of Yokohama, Ltd. and The Higashi-Nippon Bank, Limited Combined) |
| <Reference>The Bank of Yokohama, Ltd.【Non-Consolidated】・The Higashi-Nippon Bank, Limited【Non-Consolidated】Combined | ||||||||||||||||
| ① Income status | (Unit: Billions of Yen) | ||||||||||||
| March 31, | March 31, | ||||||||||||
| 2016 (Combined) | Yokohama (A) | (A)-(C) | Higashi- Nippon (B) | (B)-(D) | 2015 (Combined) | Yokohama (C) | Higashi-Nippon (D) | ||||||
| 1 | Gross operating income | 233.9 | 201.6 | (2.8) | 32.2 | 0.4 | 236.3 | 204.4 | 31.8 | ||||
| 2 | Gross operating income from domestic operations | 229.1 | 197.5 | (3.4) | 31.6 | 0.4 | 232.2 | 200.9 | 31.2 | ||||
| 3 | Interest income | 179.9 | 150.7 | (4.3) | 29.1 | (0.2) | 184.4 | 155.0 | 29.3 | ||||
| 4 | Fees and commissions | 43.6 | 41.6 | (0.6) | 2.0 | 0.3 | 43.9 | 42.2 | 1.7 | ||||
| 5 | Trading income | 0.2 | 0.2 | (0.1) | - | - | 0.3 | 0.3 | - | ||||
| 6 | Other ordinary income | 5.2 | 4.8 | 1.6 | 0.4 | 0.3 | 3.4 | 3.2 | 0.1 | ||||
| 7 | Gross operating income from international operations | 4.8 | 4.1 | 0.7 | 0.6 | (0.0) | 4.1 | 3.4 | 0.6 | ||||
| 8 | Expenses | 122.3 | 99.4 | (1.0) | 22.9 | (0.3) | 123.6 | 100.4 | 23.2 | ||||
| 9 | (Reference) OHR | 52.2% | 49.2% | 0.1% | 71.1% | (1.7%) | 52.3% | 49.1% | 72.8% | ||||
| 10 | Personnel | 58.0 | 45.2 | 0.7 | 12.7 | 0.3 | 57.0 | 44.5 | 12.4 | ||||
| 11 | Facilities | 55.9 | 47.0 | (2.6) | 8.8 | (0.7) | 59.1 | 49.6 | 9.5 | ||||
| 12 | Taxes | 8.3 | 7.0 | 0.8 | 1.3 | 0.1 | 7.4 | 6.2 | 1.2 | ||||
| 13 | Core net business profit | (1-8) | 111.5 | 102.2 | (1.8) | 9.3 | 0.7 | 112.7 | 104.0 | 8.6 | |||
| 14 | Provision of allowance for general loan losses | - | - | 2.7 | - | 0.1 | (2.9) | (2.7) | (0.1) | ||||
| (Note) | [(3.3)] | [(3.0)] | [(0.3)] | [(0.2)] | [(0.1)] | ||||||||
| 15 | Net business profit | (1-8-14) | 111.5 | 102.2 | (4.5) | 9.3 | 0.5 | 115.6 | 106.7 | 8.8 | |||
| 16 | Non-recurring gains (losses) | 10.1 | 6.1 | 10.8 | 4.0 | (0.1) | (0.6) | (4.7) | 4.1 | ||||
| 17 | Disposal of bad debts | (3.8) | (3.9) | (7.3) | 0.0 | (2.8) | 6.3 | 3.4 | 2.8 | ||||
| 18 | Of which, provision of allowance for specific loan losses | - | - | (3.4) | - | (2.6) | 6.0 | 3.4 | 2.6 | ||||
| (Note) | [(1.2)] | [(1.1)] | [(4.5)] | [(0.0)] | [(2.6)] | ||||||||
| 19 | Of which, reversal of allowance for loan losses | 4.5 | 4.2 | 4.2 | 0.2 | 0.2 | - | - | - | ||||
| 20 | Gains or losses on stocks and other securities | 9.4 | 4.7 | 3.2 | 4.6 | (2.6) | 8.7 | 1.5 | 7.2 | ||||
| 21 | Other non-recurring gains (losses) | (3.1) | (2.5) | 0.3 | (0.6) | (0.5) | (3.0) | (2.8) | (0.1) | ||||
| 22 | Ordinary profit | (15+16) | 121.7 | 108.4 | 6.4 | 13.3 | 0.4 | 115.0 | 102.0 | 12.9 | |||
| 23 | Extraordinary income (losses) | (3.0) | (0.6) | (1.6) | (2.3) | (2.3) | 0.9 | 1.0 | (0.0) | ||||
| 24 | Income before income taxes | 118.6 | 107.7 | 4.7 | 10.9 | (1.9) | 115.9 | 103.0 | 12.8 | ||||
| 25 | Total income taxes | 38.9 | 34.9 | (0.6) | 4.0 | (0.3) | 39.8 | 35.5 | 4.3 | ||||
| 26 | Net income | (22+23-25) | 79.7 | 72.8 | 5.3 | 6.9 | (1.6) | 76.0 | 67.5 | 8.5 | |||
| 27 | Credit costs | (14+17) | (3.8) | (3.9) | (4.6) | 0.0 | (2.6) | 3.4 | 0.7 | 2.6 | |||
| 28 | Credit cost ratio | (0.03%) | (0.03%) | (0.03%) | 0.00% | (0.18%) | 0.03% | 0.00% | 0.18% | ||||
| (Note) | As total amount of provision of allowance for general loan losses and provision of allowance for specific loan losses was excessively reversed, the reversed amount was recognized as reversal of allowance for loan losses for the year ended March 31, 2016 and presented in brackets. |
34
| 9. Reference Loans and Deposits ,etc. (The Bank of Yokohama, Ltd. and The Higashi-Nippon Bank, Limited Combined) | |||||||||||||
| <Reference>The Bank of Yokohama, Ltd.【Non-Consolidated】・The Higashi-Nippon Bank, Limited【Non-Consolidated】 Combined | |||||||||||||
| [the rate of change] | |||||||||||||
| ② Loans <domestic blanches (excluding loans in offshore market account)> | (Unit: Billions of Yen) | ||||||||||||
| March 31, 2016 (Combined) (A) | March 31, 2015 (Combined) (D) | ||||||||||||
| (A)-(D) | Yokohama (B) | (B)-(E) | Higashi- Nippon (C) | (C)-(F) | Yokohama (E) | Higashi-Nippon (F) | |||||||
| 1 | Loans | 11,634.3 | 317.1 | 9,988.2 | [2.3%] | 227.0 | 1,646.0 | [5.7%] | 90.1 | 11,317.2 | 9,761.2 | 1,555.9 | |
| 2 | Of which, Loans to small and medium-sized businesses, etc. | 9,464.6 | 244.5 | 8,051.9 | [1.9%] | 154.8 | 1,412.6 | [6.7%] | 89.6 | 9,220.1 | 7,897.1 | 1,323.0 | |
| ③ Deposits <domestic branches (excluding deposits in offshore market account)> | (Unit: Billions of Yen) | ||||||||||||
March 31, 2016 (Combined) (A) | March 31, 2015 (Combined) (D) | ||||||||||||
| (A)-(D) | Yokohama (B) | (B)-(E) | Higashi- Nippon (C) | (C)-(F) | Yokohama (E) | Higashi-Nippon (F) | |||||||
| 3 | Deposits | 14,402.1 | 439.8 | 12,549.4 | [3.6%] | 437.3 | 1,852.6 | [0.1%] | 2.5 | 13,962.3 | 12,112.1 | 1,850.1 | |
| 4 | Of which, individual | 10,318.5 | 188.0 | 9,134.3 | [2.1%] | 193.2 | 1,184.1 | [(0.4%)] | (5.3) | 10,130.5 | 8,941.1 | 1,189.4 | |
| 5 | Of which, corporate | 3,022.3 | 125.4 | 2,429.4 | [4.8%] | 112.7 | 592.8 | [2.1%] | 12.6 | 2,896.9 | 2,316.7 | 580.2 | |
| ④ Deposit Assets for individuals | (Unit: Billions of Yen) | ||||||||||||
March 31, 2016 (Combined) (A) | March 31, 2015 (Combined) (D) | ||||||||||||
| (A)-(D) | Yokohama (B) | (B)-(E) | Higashi- Nippon (C) | (C)-(F) | Yokohama (E) | Higashi-Nippon (F) | |||||||
| 6 | Investment products for individuals | 1,853.5 | (57.8) | 1,728.2 | [(3.4%)] | (62.0) | 125.3 | [3.4%] | 4.2 | 1,911.3 | 1,790.2 | 121.1 | |
| 7 | Of which, investment trusts | 591.1 | (70.3) | 550.5 | [(10.9%)] | (68.0) | 40.5 | [(5.5%)] | (2.4) | 661.4 | 618.5 | 42.9 | |
| 8 | Of which, insurance | 1,089.9 | 58.5 | 1,016.8 | [5.5%] | 53.1 | 73.1 | [7.9%] | 5.4 | 1,031.4 | 963.7 | 67.7 | |
| ⑤ Securities | (Unit: Billions of Yen) | ||||||||||||
March 31, 2016 (Combined) (A) | March 31, 2015 (Combined) (D) | ||||||||||||
| (A)-(D) | Yokohama (B) | (B)-(E) | Higashi- Nippon (C) | (C)-(F) | Yokohama (E) | Higashi-Nippon (F) | |||||||
| 9 | Securities | 2,817.2 | (62.1) | 2,371.2 | [(3.6%)] | (90.6) | 446.0 | [6.8%] | 28.6 | 2,879.3 | 2,461.8 | 417.4 | |
| 10 | Bonds | 1,782.1 | (162.5) | 1,477.2 | [(10.3%)] | (171.3) | 304.9 | [2.9%] | 8.8 | 1,944.6 | 1,648.5 | 296.1 | |
| 11 | Stocks | 230.0 | (17.3) | 217.1 | [(6.4%)] | (15.0) | 12.9 | [(14.5%)] | (2.2) | 247.3 | 232.1 | 15.1 | |
| 12 | Other securities | 805.0 | 117.8 | 676.8 | [16.4%] | 95.7 | 128.1 | [20.7%] | 22.0 | 687.2 | 581.1 | 106.1 | |
| ⑥ Non-performing Loans | (Unit: Billions of Yen, %) | ||||||||||||
March 31, 2016 (Combined) (A) | March 31, 2015 (Combined) (D) | ||||||||||||
| (A)-(D) | Yokohama (B) | (B)-(E) | Higashi- Nippon (C) | (C)-(F) | Yokohama (E) | Higashi-Nippon (F) | |||||||
| 13 | Non-performing Loans (“NPL”) | 218.0 | (15.7) | 194.5 | [(6.4%)] | (13.4) | 23.5 | [(8.9%)] | (2.3) | 233.7 | 207.9 | 25.8 | |
| 14 | NPL ratio (Percentage of NPL) | 1.8 | (0.2) | 1.9 | (0.1) | 1.4 | (0.2) | 2.0 | 2.0 | 1.6 | |||
| Note: The table of Higashi-Nippon are indicated in case of partial direct written-off. | |||||||||||||
⑦ Consolidated ROE (The Bank of Yokohama, Ltd.【Consolidated】・The Higashi-Nippon Bank, Limited【Consolidated】 Combined) | (Unit: %) | ||||||||||||
March 31, 2016 (Combined) (A) | March 31, 2015 (Combined) (D) | ||||||||||||
| (A)-(D) | Yokohama (B) | (B)-(E) | Higashi- Nippon (C) | (C)-(F) | Yokohama (E) | Higashi-Nippon (F) | |||||||
| 15 | Consolidated R O E | 7.56 | (0.74) | 7.73 | (0.62) | 6.11 | (1.78) | 8.30 | 8.35 | 7.89 | |||
| ⑧ Employees, Directors and Auditors | (Unit: Number of People) | ||||||||||||
March 31, 2016 (Combined) (A) | March 31, 2015 (Combined) (D) | ||||||||||||
| (A)-(D) | Yokohama (B) | (B)-(E) | Higashi- Nippon (C) | (C)-(F) | Yokohama (E) | Higashi-Nippon (F) | |||||||
| 16 | Total employees | 6,116 | 35 | 4,687 | [0.7%] | 36 | 1,429 | [0.0%] | (1) | 6,081 | 4,651 | 1,430 | |
| 17 | Actual employees | 5,375 | 67 | 3,980 | [1.9%] | 78 | 1,395 | [(0.7%)] | (11) | 5,308 | 3,902 | 1,406 | |
| 18 | Directors and auditors | 29 | 1 | 15 | [7.1%] | 1 | 14 | [0.0%] | 0 | 28 | 14 | 14 | |
| ⑨ Branches | (Unit: Number of Branches) | ||||||||||||
March 31, 2016 (Combined) (A) | March 31, 2015 (Combined) (D) | ||||||||||||
| (A)-(D) | Yokohama (B) | (B)-(E) | Higashi- Nippon (C) | (C)-(F) | Yokohama (E) | Higashi-Nippon (F) | |||||||
| 19 | Domestic Branches | 287 | 3 | 205 | [0.4%] | 1 | 82 | [2.5%] | 2 | 284 | 204 | 80 | |
| 20 | Of which, Branches in Kanagawa Prefecture | 189 | 1 | 180 | [0.5%] | 1 | 9 | [0.0%] | 0 | 188 | 179 | 9 | |
| 21 | Of which, Branches in Tokyo Metropolis | 69 | 2 | 20 | [0.0%] | 0 | 49 | [4.2%] | 2 | 67 | 20 | 47 | |
| 22 | Overseas branches and offices | 5 | 0 | 5 | [0.0%] | 0 | 0 | [0.0%] | 0 | 5 | 5 | 0 | |
35
II. SUMMARY OF FINANCIAL RESULTS
| 1. Profit and Loss | For the year ended | |||||||||||
| 【Non-Consolidated】 | (Unit: Millions of Yen) | |||||||||||
| March 31, 2016 (A) | (A)-(B) | March 31, 2015 (B) | ||||||||||
| [( 1.3%)] | ||||||||||||
| Gross operating income | 201,687 | (2,799 | ) | 204,486 | ||||||||
| (Excluding gains (losses) on bonds) | 236,924 | 9,044 | 227,880 | |||||||||
| Gross operating income from domestic operations | 197,503 | (3,493 | ) | 200,996 | ||||||||
| (Excluding gains (losses) on bonds) | 233,220 | 8,638 | 224,582 | |||||||||
| Interest income | 150,788 | (4,278 | ) | 155,066 | ||||||||
| Fees and commissions | 41,653 | (616 | ) | 42,269 | ||||||||
| Trading income | 249 | (130 | ) | 379 | ||||||||
| Other ordinary income | 4,812 | 1,532 | 3,280 | |||||||||
| (Of which, gains (losses) on bonds) | (35,717 | ) | (12,132 | ) | (23,585 | ) | ||||||
| Gross operating income from international operations | 4,184 | 694 | 3,490 | |||||||||
| (Excluding gains (losses) on bonds) | 3,703 | 405 | 3,298 | |||||||||
| Interest income | 1,731 | 200 | 1,531 | |||||||||
| Fees and commissions | 367 | 2 | 365 | |||||||||
| Trading income | 285 | 245 | 40 | |||||||||
| Other ordinary income | 1,798 | 246 | 1,552 | |||||||||
| (Of which, gains (losses) on bonds) | 480 | 288 | 192 | |||||||||
| [( 1.0%)] | ||||||||||||
| Expenses | ( – ) | 99,406 | (1,024 | ) | 100,430 | |||||||
| Personnel | ( – ) | 45,257 | 673 | 44,584 | ||||||||
| Facilities | ( – ) | 47,094 | (2,536 | ) | 49,630 | |||||||
| Taxes | ( – ) | 7,054 | 839 | 6,215 | ||||||||
| [( 1.7%)] | ||||||||||||
| Core net business profit | 102,281 | (1,774 | ) | 104,055 | ||||||||
| (Excluding gains (losses) on bonds) | 137,517 | 10,068 | 127,449 | |||||||||
| ① Provision of allowance for general loan losses | ( – ) | - | 2,725 | (2,725 | ) | |||||||
| [( 4.2%)] | ||||||||||||
| Net business profit | 102,281 | (4,500 | ) | 106,781 | ||||||||
| (Of which, gains (losses) on bonds) | (35,236 | ) | (11,843 | ) | (23,393 | ) | ||||||
| Non-recurring gains (losses) | 6,152 | 10,895 | (4,743 | ) | ||||||||
| ② Disposal of bad debts | ( – ) | (3,917 | ) | (7,397 | ) | 3,480 | ||||||
| Written-off of loans | ( – ) | 1,008 | (364 | ) | 1,372 | |||||||
| Provision of allowance for specific loan losses | ( – ) | - | (3,455 | ) | 3,455 | |||||||
| Loss on sales of non-performing loans | ( – ) | 28 | 6 | 22 | ||||||||
| Reversal of allowance for loan losses | 4,264 | 4,264 | - | |||||||||
| Recoveries of written-off claims | 940 | (811 | ) | 1,751 | ||||||||
| Other | ( – ) | 251 | (130 | ) | 381 | |||||||
| Gain or loss on stocks and other securities | 4,784 | 3,208 | 1,576 | |||||||||
| Gain on sales of stocks and other securities | 4,805 | 3,207 | 1,598 | |||||||||
| Loss on sales of stocks and other securities | ( – ) | - | (13 | ) | 13 | |||||||
| Loss on devaluation of stocks and other securities | ( – ) | 20 | 12 | 8 | ||||||||
| Other non-recurring gains (losses) | (2,549 | ) | 290 | (2,839 | ) | |||||||
| [6.2%] | ||||||||||||
| Ordinary profit | 108,433 | 6,396 | 102,037 | |||||||||
| Extraordinary income (losses) | (697 | ) | (1,717 | ) | 1,020 | |||||||
| Gain (loss) on disposal of non-current assets | (697 | ) | (1,717 | ) | 1,020 | |||||||
| Gain on disposal of non-current assets | 8 | (2,622 | ) | 2,630 | ||||||||
| Loss on disposal of non-current assets | ( – ) | 706 | (904 | ) | 1,610 | |||||||
| Income before income taxes | 107,736 | 4,679 | 103,057 | |||||||||
| Income taxes-current | ( – ) | 27,746 | (824 | ) | 28,570 | |||||||
| Income taxes-deferred | ( – ) | 7,155 | 190 | 6,965 | ||||||||
| Total income taxes | ( – ) | 34,901 | (635 | ) | 35,536 | |||||||
| [7.8%] | ||||||||||||
| Net income | 72,834 | 5,313 | 67,521 | |||||||||
| [ - ] | ||||||||||||
| Credit costs (①+②) | ( – ) | (3,917 | ) | (4,672 | ) | 755 | ||||||
| Note: | As total amount of provision of allowance for general loan losses and provision of allowance for specific loan losses was reversed, the amount reversed was recognized as “Reversal of allowance for loan losses” under “Non-recurring gains (losses)” for the year ended March 31, 2016. |
36
| 【Consolidated】 | For the year ended | (Unit: Millions of Yen) | |||||||||
| March 31, 2016 (A) | (A)-(B) | March 31, 2015 (B) | |||||||||
| [( 2.1%)] | |||||||||||
| Consolidated gross operating income | 218,665 | (4,896 | ) | 223,561 | |||||||
| Interest income | 151,401 | (4,820 | ) | 156,221 | |||||||
| Fees and commissions | 52,928 | (2,383 | ) | 55,311 | |||||||
| Trading income | 2,829 | 467 | 2,362 | ||||||||
| Other ordinary income | 11,506 | 1,841 | 9,665 | ||||||||
| General and administrative expenses | ( – ) | 111,523 | (1,552 | ) | 113,075 | ||||||
| Credit costs | ( – ) | (2,317 | ) | (5,746 | ) | 3,429 | |||||
| Written-off of loans | ( – ) | 2,835 | (811 | ) | 3,646 | ||||||
| Provision of allowance for specific loan losses | ( – ) | - | (4,273 | ) | 4,273 | ||||||
| Provision of allowance for general loan losses | ( – ) | - | 2,150 | (2,150 | ) | ||||||
| Reversal of allowance for loan losses | 3,489 | 3,489 | - | ||||||||
| Recoveries of written off claims | 1,943 | (816 | ) | 2,759 | |||||||
| Other | ( – ) | 280 | (139 | ) | 419 | ||||||
| Gain or loss on stocks and other securities | 4,777 | 4,469 | 308 | ||||||||
| Other | 411 | (299 | ) | 710 | |||||||
| [6.0%] | |||||||||||
| Ordinary profit | 114,648 | 6,574 | 108,074 | ||||||||
| Extraordinary income (losses) | (704 | ) | (11,315 | ) | 10,611 | ||||||
| Of which, gain on bargain purchase | - | (9,101 | ) | 9,101 | |||||||
| Profit before income taxes | 113,943 | (4,743 | ) | 118,686 | |||||||
| Income taxes-current | ( – ) | 29,977 | (1,797 | ) | 31,774 | ||||||
| Income taxes-deferred | ( – ) | 7,724 | 136 | 7,588 | |||||||
| Total income taxes | ( – ) | 37,702 | (1,660 | ) | 39,362 | ||||||
| Profit | 76,241 | (3,083 | ) | 79,324 | |||||||
| Profit attributable to non-controlling interests | ( – ) | 1,666 | (1,333 | ) | 2,999 | ||||||
| [( 2.2%)] | |||||||||||
| Profit attributable to owners of parent | 74,574 | (1,750 | ) | 76,324 | |||||||
| Notes: | 1. | Consolidated gross operating income = (Interest income – Interest expenses) + (Fees and commissions – Fees and commissions payments) + (Trading income – Trading expenses) + (Other ordinary income – Other ordinary expenses) |
| 2. | As total amount of provision of allowance for general loan losses and provision of allowance for specific loan losses was reversed, the amount reversed was recognized as “Reversal of allowance for loan losses” for the year ended March 31, 2016. |
| (Reference) | For the year ended | (Unit: Millions of Yen) | |||||||||
| March 31, 2016 (A) | (A)-(B) | March 31, 2015 (B) | |||||||||
| [( 3.7%)] | |||||||||||
| Consolidated net business profit | 110,159 | (4,292 | ) | 114,451 | |||||||
| Note: | Consolidated net business profit = Non-consolidated core net business profit + Ordinary profit of consolidated subsidiaries (excluding Credit costs) + “Ordinary profit of equity-method affiliates” * share of stockholders equity – internal trade (dividend, etc.) |
| (Number of Consolidated Companies) | (Unit: Number of Companies) | ||||||||||
| As of March 31, 2016 (A) | (A)-(B) | As of March 31, 2015 (B) | |||||||||
| Number of consolidated subsidiaries | 12 | 0 | 12 | ||||||||
| Number of companies accounted for by the equity method | 0 | 0 | 0 | ||||||||
37
2. Average Balance of Use and Source of Funds (Domestics)
| 【Non-Consolidated】 | For the year ended | (Unit: Billions of Yen) | ||||||||||||||||||
| March 31, 2016 (A) | (A)-(B) | March 31, 2015 (B) | (B)-(C) | March 31, 2014 (C) | ||||||||||||||||
| Interest-earning assets | 12,265.2 | 147.5 | 12,117.7 | 357.9 | 11,759.8 | |||||||||||||||
| Loans and bills discounted | 9,734.1 | 213.5 | 9,520.6 | 203.7 | 9,316.9 | |||||||||||||||
| Loans to small and medium-sized businesses, etc. | 7,886.9 | 164.6 | 7,722.3 | 113.6 | 7,608.7 | |||||||||||||||
| Loans to small and medium-sized businesses | 3,024.6 | 104.4 | 2,920.2 | 16.4 | 2,903.8 | |||||||||||||||
| Loans to individuals | 4,862.2 | 60.1 | 4,802.1 | 97.2 | 4,704.9 | |||||||||||||||
| Securities | 2,238.3 | 68.6 | 2,169.7 | 203.5 | 1,966.2 | |||||||||||||||
| Bonds | 2,120.1 | 71.9 | 2,048.2 | 208.4 | 1,839.8 | |||||||||||||||
| Stocks | 118.1 | (3.4 | ) | 121.5 | (4.8 | ) | 126.3 | |||||||||||||
| Interest-bearing liabilities | 13,546.5 | 1,229.1 | 12,317.4 | 490.8 | 11,826.6 | |||||||||||||||
| Deposits | 11,854.3 | 380.5 | 11,473.8 | 328.6 | 11,145.2 | |||||||||||||||
| Individual deposits | 9,059.9 | 241.4 | 8,818.5 | 256.9 | 8,561.6 | |||||||||||||||
| External liabilities | 1,376.2 | 781.7 | 594.5 | 122.6 | 471.9 | |||||||||||||||
3. Interest Margins (Domestics)
| 【Non-Consolidated】 | For the year ended | (Unit: %) | ||||||||||||||||||
| March 31, 2016 (A) | (A)-(B) | March 31, 2015 (B) | (B)-(C) | March 31, 2014 (C) | ||||||||||||||||
| Yield on interest-earning assets | (A) | 1.27 | (0.04 | ) | 1.31 | (0.08 | ) | 1.39 | ||||||||||||
| Loans and bills discounted | (B) | 1.28 | (0.09 | ) | 1.37 | (0.11 | ) | 1.48 | ||||||||||||
| Securities | 1.18 | 0.00 | 1.18 | 0.02 | 1.16 | |||||||||||||||
| Yield on interest-bearing liabilities | 0.03 | 0.00 | 0.03 | (0.02 | ) | 0.05 | ||||||||||||||
| Deposits | (C) | 0.03 | 0.00 | 0.03 | (0.01 | ) | 0.04 | |||||||||||||
| External liabilities | 0.08 | 0.00 | 0.08 | (0.13 | ) | 0.21 | ||||||||||||||
| Expenses ratio | 0.79 | (0.04 | ) | 0.83 | 0.00 | 0.83 | ||||||||||||||
| Total funding cost | (D) | 0.74 | (0.08 | ) | 0.82 | (0.02 | ) | 0.84 | ||||||||||||
| Yield spread | (B)-(C) | 1.25 | (0.09 | ) | 1.34 | (0.10 | ) | 1.44 | ||||||||||||
| Interest margin between loans and deposits | 0.46 | (0.05 | ) | 0.51 | (0.10 | ) | 0.61 | |||||||||||||
| Net interest margin | (A)-(D) | 0.53 | 0.04 | 0.49 | (0.06 | ) | 0.55 | |||||||||||||
4. Fees and Commissions (Domestics)
| 【Non-Consolidated】 | For the year ended | (Unit: Millions of Yen) | ||||||||||||||||||
| March 31, 2016 (A) | (A)-(B) | March 31, 2015 (B) | (B)-(C) | March 31, 2014 (C) | ||||||||||||||||
| Fees and commissions | 55,988 | (397 | ) | 56,385 | 5,221 | 51,164 | ||||||||||||||
| Deposits and Loans | 21,163 | 751 | 20,412 | 723 | 19,689 | |||||||||||||||
| ATM | 4,997 | (10 | ) | 5,007 | 26 | 4,981 | ||||||||||||||
| Account transfer | 4,542 | 18 | 4,524 | (45 | ) | 4,569 | ||||||||||||||
| Syndicated Loan | 4,091 | 627 | 3,464 | 492 | 2,972 | |||||||||||||||
| Remittance | 9,755 | (24 | ) | 9,779 | 30 | 9,749 | ||||||||||||||
| Securities | 11,519 | (3,253 | ) | 14,772 | 1,436 | 13,336 | ||||||||||||||
| Investment trusts | 9,713 | (3,186 | ) | 12,899 | 1,173 | 11,726 | ||||||||||||||
| Agency business | 736 | 12 | 724 | (33 | ) | 757 | ||||||||||||||
| Safekeeping/safe deposit boxes | 1,611 | (46 | ) | 1,657 | (35 | ) | 1,692 | |||||||||||||
| Guarantee business | 560 | (55 | ) | 615 | (39 | ) | 654 | |||||||||||||
| Others | 10,641 | 2,217 | 8,424 | 3,139 | 5,285 | |||||||||||||||
| Insurance | 9,250 | 1,740 | 7,510 | 2,953 | 4,557 | |||||||||||||||
| Fees and commissions payments | 14,335 | 220 | 14,115 | 351 | 13,764 | |||||||||||||||
| Fees and commissions - net | 41,653 | (616 | ) | 42,269 | 4,870 | 37,399 | ||||||||||||||
38
5. Gains or Losses on Investment Securities
① Gains or Losses on Bonds
| 【Non-Consolidated】 | For the year ended | (Unit: Millions of Yen) | |||||
March 31, 2016 (A) | March 31, 2015 (B) | March 31, 2014 (C) | |||||
| (A)-(B) | (B)-(C) | ||||||
| Gains (losses) on bonds | (35,236) | (11,843) | (23,393) | (16,243) | (7,150) | ||
| Gain on sales | 3,976 | 1,998 | 1,978 | (1,445) | 3,423 | ||
| Gain on redemption | - | - | - | (29) | 29 | ||
| Loss on sales | 37,961 | 14,847 | 23,114 | 13,888 | 9,226 | ||
| Loss on redemption | 1,139 | (1,072) | 2,211 | 857 | 1,354 | ||
| Loss on devaluation | 111 | 65 | 46 | 24 | 22 | ||
| (Reference) Gains (losses) on bonds derivatives | For the year ended | (Unit: Millions of Yen) | |||||
March 31, 2016 (A) | March 31, 2015 (B) | March 31, 2014 (C) | |||||
| (A)-(B) | (B)-(C) | ||||||
| Gains (losses) on bonds derivatives | 36,088 | 14,657 | 21,431 | 12,662 | 8,769 | ||
| Gains (losses) on bonds + Gains (losses) on bonds derivatives | 852 | 2,814 | (1,962) | (3,580) | 1,618 | ||
| ② Gains or Losses on stocks and other securities | |||||||
| 【Non-Consolidated】 | For the year ended | (Unit: Millions of Yen) | |||||
March 31, 2016 (A) | March 31, 2015 (B) | March 31, 2014 (C) | |||||
| (A)-(B) | (B)-(C) | ||||||
| Gains (losses) on stocks and other securities | 4,784 | 3,208 | 1,576 | (354) | 1,930 | ||
| Gain on sales | 4,805 | 3,207 | 1,598 | (1,209) | 2,807 | ||
| Loss on sales | - | (13) | 13 | (811) | 824 | ||
| Loss on devaluation | 20 | 12 | 8 | (44) | 52 | ||
| (Reference) Outright Sales of Stocks (Cost of Purchase) | |||||||
| For the year ended | (Unit: Millions of Yen) | ||||||
March 31, 2016 (A) | March 31, 2015 (B) | March 31, 2014 (C) | |||||
| (A)-(B) | (B)-(C) | ||||||
| Outright sales | 681 | (3,189) | 3,870 | (7,895) | 11,765 | ||
| Balance as of end of period | 117,490 | (652) | 118,142 | (3,258) | 121,400 | ||
| Of which, valued at market prices | 97,204 | (632) | 97,836 | (617) | 98,453 | ||
Note: Outright sales include contribution to retirement benefit trust.
6. Net Unrealized Gains (Losses) on Securities
| 【Non-Consolidated】 | (Unit: Millions of Yen) |
| As of March 31, 2016 | As of March 31, 2015 | |||||||||||||||||||||
| Book Value | Net(A) | Unrealized | Unrealized | Book Value | Net(B) | Unrealized | Unrealized | |||||||||||||||
| (A)-(B) | gains | losses | gains | losses | ||||||||||||||||||
| Held-to-maturity | 199,715 | 11,269 | 21 | 11,269 | – | 224,502 | 11,248 | 11,248 | - | |||||||||||||
| Available-for-sale | 2,227,939 | 116,365 | (39,593 | ) | 132,072 | 15,707 | 2,318,096 | 155,958 | 157,344 | 1,386 | ||||||||||||
| Equity securities | 196,823 | 99,619 | (14,423 | ) | 101,373 | 1,753 | 211,878 | 114,042 | 114,424 | 381 | ||||||||||||
| Debt securities | 1,277,531 | 9,898 | 3,301 | 10,420 | 521 | 1,424,061 | 6,597 | 7,270 | 673 | |||||||||||||
| Other securities | 753,584 | 6,846 | (28,472 | ) | 20,279 | 13,432 | 682,156 | 35,318 | 35,650 | 331 | ||||||||||||
| Total | 2,427,655 | 127,634 | (39,573 | ) | 143,341 | 15,707 | 2,542,598 | 167,207 | 168,593 | 1,386 | ||||||||||||
| Equity securities | 196,823 | 99,619 | (14,423 | ) | 101,373 | 1,753 | 211,878 | 114,042 | 114,424 | 381 | ||||||||||||
| Debt securities | 1,477,247 | 21,167 | 3,322 | 21,689 | 521 | 1,648,563 | 17,845 | 18,518 | 673 | |||||||||||||
| Other securities | 753,584 | 6,846 | (28,472 | ) | 20,279 | 13,432 | 682,156 | 35,318 | 35,650 | 331 | ||||||||||||
| Notes: | 1. | “Available-for-sale securities” are marked to market; the difference between book values on the non-consolidated balance sheets and the acquisition cost is posted as “Net”. |
| 2. | In addition to “Securities” on the non-consolidated balance sheets, the tables include beneficiary rights to the trust in “Monetary claims bought”. |
39
| 【Consolidated】 | (Unit: Millions of Yen) | ||||||||||
| As of March 31, 2016 | As of March 31, 2015 | ||||||||||
| Book Value | Net(A) | Unrealized | Unrealized | Book Value | Net(B) | Unrealized | Unrealized | ||||
| (A)-(B) | gains | losses | gains | losses | |||||||
| Held-to-maturity | 201,916 | 11,281 | 18 | 11,281 | - | 228,212 | 11,263 | 11,263 | - | ||
| Available-for-sale | 2,235,761 | 119,454 | (39,601) | 135,261 | 15,807 | 2,325,935 | 159,055 | 160,483 | 1,428 | ||
| Equity securities | 204,644 | 102,708 | (14,431) | 104,562 | 1,854 | 219,714 | 117,139 | 117,563 | 423 | ||
| Debt securities | 1,277,533 | 9,898 | 3,301 | 10,420 | 521 | 1,424,064 | 6,597 | 7,270 | 673 | ||
| Other securities | 753,584 | 6,846 | (28,472) | 20,279 | 13,432 | 682,156 | 35,318 | 35,650 | 331 | ||
| Total | 2,437,678 | 130,735 | (39,583) | 146,543 | 15,807 | 2,554,147 | 170,318 | 171,747 | 1,428 | ||
| Equity securities | 204,644 | 102,708 | (14,431) | 104,562 | 1,854 | 219,714 | 117,139 | 117,563 | 423 | ||
| Debt securities | 1,479,450 | 21,180 | 3,320 | 21,701 | 521 | 1,652,276 | 17,860 | 18,533 | 673 | ||
| Other securities | 753,584 | 6,846 | (28,472) | 20,279 | 13,432 | 682,156 | 35,318 | 35,650 | 331 | ||
| Notes: | 1. | “Available-for-sale securities” are marked to market; the difference between book values on the consolidated balance sheets and the acquisition cost is posted as “Net”. |
| 2. | In addition to “Securities” on the consolidated balance sheets, the tables include beneficiary rights to the trust in “Monetary claims bought”. |
(Reference) Projected Redemption Amounts for Securities with maturities.
| 【Non-Consolidated】 | (Unit: Millions of Yen) | |||||||||
| As of March 31, 2016 | As of March 31, 2015 | |||||||||
| Within 1 year | 1-5 years | 5-10 years | Over 10 years | Within 1 year | 1-5 years | 5-10 years | Over 10 years | |||
| Bonds | 225,706 | 1,019,590 | 199,679 | 12,873 | 293,045 | 1,078,477 | 245,338 | 15,658 | ||
| Government bonds | 93,600 | 456,300 | 63,600 | - | 110,445 | 524,800 | 46,700 | 6,000 | ||
| Local government bonds | 14,622 | 202,246 | 16,482 | - | 56,516 | 185,470 | 15,929 | - | ||
| Corporate bonds | 117,483 | 361,044 | 119,597 | 12,873 | 126,083 | 368,206 | 182,709 | 9,658 | ||
| Others | 40,316 | 121,615 | 63,978 | 446,415 | 37,386 | 196,792 | 38,547 | 303,856 | ||
| Total | 266,022 | 1,141,206 | 263,658 | 459,288 | 330,432 | 1,275,269 | 283,885 | 319,514 | ||
Note: The tables are indicated in “Securities” on the non-consolidated balance sheets. | ||||||||||
| 【Consolidated】 | (Unit: Millions of Yen) | |||||||||
| As of March 31, 2016 | As of March 31, 2015 | |||||||||
| Within 1 year | 1-5 years | 5-10 years | Over 10 years | Within 1 year | 1-5 years | 5-10 years | Over 10 years | |||
| Bonds | 227,708 | 1,019,590 | 199,879 | 12,873 | 294,557 | 1,080,477 | 245,538 | 15,658 | ||
| Government bonds | 95,100 | 456,300 | 63,600 | - | 111,945 | 526,300 | 46,700 | 6,000 | ||
| Local government bonds | 15,122 | 202,246 | 16,682 | - | 56,516 | 185,970 | 16,129 | - | ||
| Corporate bonds | 117,485 | 361,044 | 119,597 | 12,873 | 126,095 | 368,206 | 182,709 | 9,658 | ||
| Others | 40,316 | 121,615 | 64,100 | 446,415 | 37,386 | 196,792 | 38,577 | 303,856 | ||
| Total | 268,024 | 1,141,206 | 263,979 | 459,288 | 331,943 | 1,277,269 | 284,115 | 319,514 | ||
Note: The tables are indicated in “Securities” on the consolidated balance sheets. |
40
| (Reference) | Transition of Outstanding Balance of Securities |
| 【Non-Consolidated】 | (Unit: Millions of Yen) | |||||
| As of March 31, 2016 (A) | (A)-(B) | As of March 31, 2015 (B) | (B)-(C) | As of March 31, 2014 (C) | ||
| Securities | 2,371,236 | (90,633) | 2,461,869 | 411,629 | 2,050,240 | |
| Government bonds | 628,588 | (71,607) | 700,195 | 156,934 | 543,261 | |
| Local government bonds | 234,687 | (24,135) | 258,822 | 1,900 | 256,922 | |
| Corporate bonds | 613,971 | (75,574) | 689,545 | (91,681) | 781,226 | |
| Stocks | 217,110 | (15,074) | 232,184 | 46,156 | 186,028 | |
| Other securities | 676,878 | 95,758 | 581,120 | 298,320 | 282,800 | |
| Of which, foreign bonds | 227,384 | (48,214) | 275,598 | 123,436 | 152,162 | |
| Of which, domestic investment trusts | 446,306 | 142,722 | 303,584 | 180,029 | 123,555 | |
| 【Consolidated】 | (Unit: Millions of Yen) | |||||
| As of March 31, 2016 (A) | (A)-(B) | As of March 31, 2015 (B) | (B)-(C) | As of March 31, 2014 (C) | ||
| Securities | 2,368,351 | (92,102) | 2,460,453 | 415,712 | 2,044,741 | |
| Government bonds | 630,089 | (73,117) | 703,206 | 156,444 | 546,762 | |
| Local government bonds | 235,387 | (24,135) | 259,522 | 1,900 | 257,622 | |
| Corporate bonds | 613,973 | (75,575) | 689,548 | (91,683) | 781,231 | |
| Stocks | 212,862 | (15,134) | 227,996 | 50,715 | 177,281 | |
| Other securities | 676,038 | 95,858 | 580,180 | 298,336 | 281,844 | |
| Of which, foreign bonds | 227,384 | (48,214) | 275,598 | 123,436 | 152,162 | |
| Of which, domestic investment trusts | 446,306 | 142,722 | 303,584 | 180,029 | 123,555 | |
| 7. Derivative Contracts |
| 【Consolidated】 |
| ① Interest rate contracts | (Unit: Millions of Yen) | ||||||
| As of March 31, 2016 | As of March 31, 2015 | ||||||
| Contract or Notional Amount | Fair Value (Loss) | Unrealized Gain (Loss) | Contract or Notional Amount | Fair Value (Loss) | Unrealized Gain (Loss) | ||
| Market | Interest rate futures | - | - | - | 5,966 | (7) | (7) |
| OTC | Interest rate swaps | 4,893,504 | 10,125 | 10,125 | 4,897,061 | 8,867 | 8,867 |
| Others | 25,380 | 0 | 299 | 32,648 | (3) | 415 | |
| Total | 10,124 | 10,424 | 8,856 | 9,276 | |||
| Note: Derivative contracts subject to hedge accounting are not included in the above table. | |||||||
| ② Foreign exchange | (Unit: Millions of Yen) | ||||||
| As of March 31, 2016 | As of March 31, 2015 | ||||||
Contract or Notional Amount | Fair Value (Loss) | Unrealized Gain (Loss) | Contract or Notional Amount | Fair Value (Loss) | Unrealized Gain (Loss) | ||
| Currency swaps | 34,162 | 81 | 81 | 49,475 | 165 | 165 | |
| OTC | Forward exchange contracts | 114,298 | (180) | (180) | 271,078 | (1,232) | (1,232) |
| Options | 39,198 | 31 | 211 | 54,609 | 10 | 268 | |
| Total | (67) | 112 | (1,056) | (798) | |||
| Note: Derivative contracts subject to hedge accounting are not included in the above table. | |||||||
| ③ Stocks contracts | Not applicable | ||||||
| ④ Bonds contracts | (Unit: Millions of Yen) | ||||||
| As of March 31, 2016 | As of March 31, 2015 | ||||||
Contract or Notional Amount | Fair Value (Loss) | Unrealized Gain (Loss) | Contract or Notional Amount | Fair Value (Loss) | Unrealized Gain (Loss) | ||
| Market | Bond futures | 4,527 | (11) | (11) | 10,855 | (7) | (7) |
| Total | (11) | (11) | (7) | (7) | |||
| ⑤ Commodity related contracts | Not applicable | ||||||
| ⑥ Credit derivative contracts | Not applicable | ||||||
41
| 8. Expenses, Employees and Branches | |||||||
| ① Expenses | |||||||
| 【Non-Consolidated】 | For the year ended | (Unit: Millions of Yen) | |||||
| March 31, 2016 (A) | (A)-(B) | March 31, 2015 (B) | (B)-(C) | March 31, 2014 (C) | |||
| Personnel | 45,257 | 673 | 44,584 | 2,300 | 42,284 | ||
| Facilities | 47,094 | (2,536) | 49,630 | 504 | 49,126 | ||
| Taxes | 7,054 | 839 | 6,215 | 784 | 5,431 | ||
| Expenses | 99,406 | (1,024) | 100,430 | 3,587 | 96,843 | ||
| (Reference) | (Unit:%) | ||||||
| OHR | 49.2 | 0.1 | 49.1 | 1.5 | 47.6 | ||
| ② General and administrative expenses | |||||||
| 【Non-Consolidated】 | For the year ended | (Unit: Millions of Yen) | |||||
| March 31, 2016 (A) | (A)-(B) | March 31, 2015 (B) | (B)-(C) | March 31, 2014 (C) | |||
| Salaries and allowance | 35,853 | 828 | 35,025 | 1,137 | 33,888 | ||
| Retirement benefit cost | 3,678 | (1,020) | 4,698 | (795) | 5,493 | ||
| Welfare | 324 | 4 | 320 | 1 | 319 | ||
| Depreciation | 7,829 | 70 | 7,759 | 70 | 7,689 | ||
| Rent of premises and equipment | 6,606 | 67 | 6,539 | 61 | 6,478 | ||
| Repairing expenses | 516 | (68) | 584 | 290 | 294 | ||
| Stationery and supplies | 1,108 | (1) | 1,109 | 71 | 1,038 | ||
| Utilities | 1,188 | (142) | 1,330 | 112 | 1,218 | ||
| Allowance for business trips | 211 | 4 | 207 | 17 | 190 | ||
| Communication expenses | 978 | (32) | 1,010 | (3) | 1,013 | ||
| Advertisement | 1,249 | 295 | 954 | 229 | 725 | ||
| Dues and membership, contribution, dinner and meeting | 431 | 26 | 405 | 5 | 400 | ||
| Taxes | 7,054 | 839 | 6,215 | 784 | 5,431 | ||
| Others | 35,745 | (2,454) | 38,199 | 1,195 | 37,004 | ||
| General and administrative expenses | 102,777 | (1,585) | 104,362 | 3,174 | 101,188 | ||
| ③ Employees and Officers | |||||||
| 【Non-Consolidated】 | (Unit: Number of People) | ||||||
| As of March 31, 2016 (A) | (A)-(B) | As of March 31, 2015 (B) | (B)-(C) | As of March 31, 2014 (C) | |||
| Total employees | 4,687 | 36 | 4,651 | 39 | 4,612 | ||
| Actual employees | 3,980 | 78 | 3,902 | 31 | 3,871 | ||
| Directors and auditors | 15 | 1 | 14 | (1) | 15 | ||
| Executive officers | 11 | (2) | 13 | 3 | 10 | ||
| ④ Branches | |||||||
| 【Non-Consolidated】 | |||||||
| 《Domestic Branch》 | (Unit: Number of Branches) | ||||||
| As of March 31, 2016 (A) | (A)-(B) | As of March 31, 2015 (B) | (B)-(C) | As of March 31, 2014 (C) | |||
| Domestic Branches | 205 | 1 | 204 | 0 | 204 | ||
| Of which, Sub-branches | 8 | 0 | 8 | 0 | 8 | ||
| Of which, Branches in Kanagawa Prefecture | 180 | 1 | 179 | 0 | 179 | ||
| ATM locations | 405 | (1) | 406 | 1 | 405 | ||
| Of which, ATM locations in Kanagawa Prefecture | 357 | (1) | 358 | 1 | 357 | ||
| Housing Loan Centers | 21 | (2) | 23 | (3) | 26 | ||
| Of which, Housing Loan Centers in Kanagawa Prefecture | 18 | (2) | 20 | (3) | 23 | ||
| 《Overseas》 | (Unit: Number of Branches) | ||||||
| As of March 31, 2016 (A) | (A)-(B) | As of March 31, 2015 (B) | (B)-(C) | As of March 31, 2014 (C) | |||
| Branches | 1 | 0 | 1 | 0 | 1 | ||
| Sub-branches | 0 | 0 | 0 | 0 | 0 | ||
| Representative offices | 4 | 0 | 4 | 0 | 4 | ||
| Total | 5 | 0 | 5 | 0 | 5 | ||
| Subsidiaries | 0 | 0 | 0 | 0 | 0 | ||
42
| 9. Net Business Profit | ||||||
| 【Non-Consolidated】 | For the year ended | (Unit: Millions of Yen) | ||||
| March 31, 2016 (A) | (A)-(B) | March 31, 2015 (B) | (B)-(C) | March 31, 2014 (C) | ||
| Core net business profit | 102,281 | (1,774) | 104,055 | (2,288) | 106,343 | |
| As per employee (in thousands of yen) | 25,953 | (820) | 26,773 | (759) | 27,532 | |
| Net business profit | 102,281 | (4,500) | 106,781 | 1,183 | 105,598 | |
| As per employee (in thousands of yen) | 25,953 | (1,521) | 27,474 | 135 | 27,339 | |
| Note: The amount of “as per employee” is calculated on the basis of the average of actual number of employees (excluding transferees). | ||||||
| 10. Return on Equity | ||||||
| 【Non-Consolidated】 | For the year ended | (Unit: %) | ||||
| March 31, 2016 (A) | (A)-(B) | March 31, 2015 (B) | (B)-(C) | March 31, 2014 (C) | ||
| Core net business profit per own capital | 10.80 | (0.72) | 11.52 | (1.02) | 12.54 | |
| Net income per own capital | 7.69 | 0.22 | 7.47 | 0.55 | 6.92 | |
| 【Consolidated】 | For the year ended | (Unit: %) | ||||
| March 31, 2016 (A) | (A)-(B) | March 31, 2015 (B) | (B)-(C) | March 31, 2014 (C) | ||
| Profit attributable to owners of parent per own capital | 7.73 | (0.62) | 8.35 | 1.23 | 7.12 | |
| 11. Return on Assets | ||||||
| 【Non-Consolidated】 | For the year ended | (Unit: %) | ||||
| March 31, 2016 (A) | (A)-(B) | March 31, 2015 (B) | (B)-(C) | March 31, 2014 (C) | ||
| Core net business profit per average total assets | 0.67 | (0.09) | 0.76 | (0.05) | 0.81 | |
| Net income per average total assets | 0.48 | (0.01) | 0.49 | 0.04 | 0.45 | |
| 12. Retirement Benefit | ||||||
| ① Retirement benefit obligation | ||||||
| 【Non-Consolidated】 | (Unit: Millions of Yen) | |||||
| As of March 31, 2016 (A) | (A)-(B) | As of March 31, 2015 (B) | (B)-(C) | As of March 31, 2014 (C) | ||
| Retirement benefit obligation | 87,474 | 5,664 | 81,810 | 4,904 | 76,906 | |
| [ Discount rate ] | [0.5%] | (0.4%) | [0.9%] | (0.5%) | [1.4%] | |
| Fair value of plan assets | 115,318 | 1,116 | 114,202 | 21,175 | 93,027 | |
| Prepaid pension cost | (36,011) | (5,329) | (30,682) | (1,410) | (29,272) | |
| Unrecognized prior service cost | 386 | 386 | - | - | - | |
| Unrecognized actuarial loss | 7,781 | 9,490 | (1,709) | (14,861) | 13,152 | |
| 【Consolidated】 | (Unit: Millions of Yen) | |||||
| As of March 31, 2016 (A) | (A)-(B) | As of March 31, 2015 (B) | (B)-(C) | As of March 31, 2014 (C) | ||
| Retirement benefit obligation | 87,770 | 5,706 | 82,064 | 4,942 | 77,122 | |
| Fair value of plan assets | 115,318 | 1,116 | 114,202 | 21,175 | 93,027 | |
| Net defined benefit asset | (27,843) | 4,549 | (32,392) | (16,272) | (16,120) | |
| Net defined benefit liability | 296 | 43 | 253 | 37 | 216 | |
| Unrecognized prior service cost(before adjusting for tax effects) | 386 | 386 | - | - | - | |
| Unrecognized acutuarial loss(before adjusting for tax effects) | 7,781 | 9,490 | (1,709) | (14,861) | 13,152 | |
| Note: Retirement benefit obligation of the unfunded pension is included in retirement benefit obligation. | ||||||
43
| ② Retirement Benefit Costs | |||||||
| 【Non-Consolidated】 | For the year ended | (Unit: Millions of Yen) | |||||
| March 31, 2016(A) | (A)-(B) | March 31, 2015(B) | (B)-(C) | March 31, 2014(C) | |||
| Retirement benefit costs | 3,678 | (1,020) | 4,698 | (795) | 5,493 | ||
| Service cost | 1,671 | 84 | 1,587 | 19 | 1,568 | ||
| Interest cost | 855 | (202) | 1,057 | (40) | 1,097 | ||
| Expected return on plan assets | (2,455) | (387) | (2,068) | (353) | (1,715) | ||
| Amortization of prior service cost | 231 | 231 | - | - | - | ||
| Recognized actuarial loss | 2,945 | (745) | 3,690 | (428) | 4,118 | ||
| Other retirement cost | 429 | (3) | 432 | 9 | 423 | ||
| 【Consolidated】 | For the year ended | (Unit: Millions of Yen) | |||||
| March 31, 2016(A) | (A)-(B) | March 31, 2015(B) | (B)-(C) | March 31, 2014(C) | |||
| Retirement benefit costs | 3,744 | (1,015) | 4,759 | (796) | 5,555 | ||
| Service cost | 1,720 | 89 | 1,631 | 16 | 1,615 | ||
| Interest cost | 855 | (202) | 1,057 | (40) | 1,097 | ||
| Expected return on plan assets | (2,455) | (387) | (2,068) | (353) | (1,715) | ||
| Amortization of prior service cost | 231 | 231 | - | - | - | ||
| Recognized actuarial loss | 2,945 | (745) | 3,690 | (428) | 4,118 | ||
| Other retirement cost | 446 | (2) | 448 | 10 | 438 | ||
| Note: Retirement benefit costs of defined contribution pension plan are included in the amount. |
| 13. Deferred Tax Assets | |||||||
| Tax effects of the items comprising net deferred tax assets and liabilities | |||||||
| 【Non-Consolidated】 | (Unit: Millions of Yen) | ||||||
| As of March 31, 2016 (A) | (A)-(B) | As of March 31, 2015 (B) | (B)-(C) | As of March 31, 2014 (C) | |||
| Allowance for loan losses | 20,834 | (4,247) | 25,081 | (2,827) | 27,908 | ||
| Provision for retirement benefits | 5,124 | (215) | 5,339 | (337) | 5,676 | ||
| Losses on devaluation of securities | 2,314 | (175) | 2,489 | (276) | 2,765 | ||
| Others | 6,048 | (1,619) | 7,667 | (2,405) | 10,072 | ||
| Subtotal deferred tax assets (A) | 34,321 | (6,256) | 40,577 | (5,846) | 46,423 | ||
| Valuation allowance (B) | (2,745) | 200 | (2,945) | 317 | (3,262) | ||
| Total deferred tax assets (A+B) (C) | 31,576 | (6,055) | 37,631 | (5,529) | 43,160 | ||
| Valuation difference on available-for-sale securities | 34,133 | (14,420) | 48,553 | 20,796 | 27,757 | ||
Gains on contribution of securities to retirement benefit trust | 6,243 | (326) | 6,569 | (694) | 7,263 | ||
| Others | 6,545 | 1,423 | 5,122 | 987 | 4,135 | ||
| Total deferred tax liabilities (D) | 46,922 | (13,323) | 60,245 | 21,089 | 39,156 | ||
| Net deferred tax assets (liabilities) (C-D) | (15,345) | 7,268 | (22,613) | (26,616) | 4,003 | ||
Net deferred tax assets excluding deferred tax liabilities (assets) valuation difference on available-for-sale securities, etc. | 18,804 | (7,155) | 25,959 | (5,806) | 31,765 | ||
| 【Consolidated】 | (Unit: Millions of Yen) | ||||||
| As of March 31, 2016 (A) | (A)-(B) | As of March 31, 2015 (B) | (B)-(C) | As of March 31, 2014 (C) | |||
| Net deferred tax assets (liabilities) | (7,438) | 9,765 | (17,203) | (33,177) | 15,974 | ||
| Net deferred tax assets excluding deferred tax liabilities (assets) relating to valuation difference on available-for-sale securities and remeasurements of defined benefit plans, etc | 25,188 | (7,738) | 32,926 | (7,151) | 40,077 | ||
(Reference) The Bank falls under “Illustrated Segment②” (performance is stable but without taxable income that exceeds the temporary difference in future subtraction at the end of term) under paragraph 5, item 1 of “Auditing Treatment concerning Determination of Recoverability of Deferred Tax Assets (Japanese Institute of Certified Public Accountants, Audit Committee Report, No.66).” |
44
| 14. Capital Adequacy Ratio (BIS Standard) |
In applying the BIS Standard, the Bank adopted FIRB (Foundation Internal Ratings Based) for calculation of assets exposed to credit risk, TSA (The Standardized Approach) for operational risk, and also introduced Market Risk Regulations. Composition of capital disclosure and consolidated leverage ratio disclosure based on the third pillar of BaselⅢ (market discipline) is to be posted on our website ( http://www.concordia-fg.jp/shareholder/finance/index.html ). |
| 【Consolidated】 | (Unit: Billions of Yen) | ||||||
| As of March 31, 2016 (A) [Preliminary] | (A)-(B) | As of March 31, 2015 (B) | (B)-(C) | As of March 31, 2014 (C) | |||
| (1) Total capital ratio (5)/(6) | 12.77 % | (0.52 %) | 13.29 % | (0.08 %) | 13.37 % | ||
| Tier 1 capital ratio (2)/(6) | 12.43 % | (0.13 %) | 12.56 % | 0.27 % | 12.29 % | ||
| Common Equity Tier 1 capital ratio (3)/(6) | 12.19 % | (0.09 %) | 12.28 % | 0.31 % | 11.97 % | ||
| (2) Tier 1 capital | 888.5 | 21.7 | 866.8 | 54.5 | 812.3 | ||
| (3) Common Equity Tier 1 capital | 871.8 | 24.0 | 847.8 | 56.9 | 790.9 | ||
| Of which, accumulated other comprehensive income | 69.3 | 10.6 | 58.7 | 42.4 | 16.3 | ||
| Additional Tier 1 capital | 16.6 | (2.4) | 19.0 | (2.3) | 21.3 | ||
| Of which, directly issued capital instruments subject to phase out from Additional Tier 1 | 24.0 | (4.0) | 28.0 | (4.0) | 32.0 | ||
| (4) Tier 2 capital | 24.5 | (25.6) | 50.1 | (20.9) | 71.0 | ||
| Of which, directly issued capital instruments subject to phase out from Tier 2 | - | - | - | (30.0) | 30.0 | ||
Regulatory adjustments applied to Tier 2 in respect of amounts subject to pre-Basel Ⅲ treatment: Of which, accumulated other comprehensive income | 31.0 | (26.2) | 57.2 | 7.2 | 50.0 | ||
| (5) Total capital (2)+(4) | 913.1 | (3.8) | 916.9 | 33.6 | 883.3 | ||
| (6) Total risk weighted assets | 7,147.5 | 249.1 | 6,898.4 | 292.8 | 6,605.6 | ||
| Of which, on balanced | 6,326.4 | 198.9 | 6,127.5 | 229.1 | 5,898.4 | ||
| Of which, off balanced | 190.3 | 1.4 | 188.9 | 12.7 | 176.2 | ||
| 【Non-Consolidated】 | (Unit: Billions of Yen) | ||||||
| As of March 31, 2016 (A) [Preliminary] | (A)-(B) | As of March 31, 2015 (B) | (B)-(C) | As of March 31, 2014 (C) | |||
| (1) Total capital ratio (5)/(6) | 12.41 % | (0.58 %) | 12.99 % | (0.06 %) | 13.05 % | ||
| Tier 1 capital ratio (2)/(6) | 12.12 % | (0.21 %) | 12.33 % | 0.26 % | 12.07 % | ||
| Common Equity Tier 1 capital ratio (3)/(6) | 11.92 % | (0.20 %) | 12.12 % | 0.26 % | 11.86 % | ||
| (2) Tier 1 capital | 855.6 | 18.7 | 836.9 | 53.7 | 783.2 | ||
| (3) Common Equity Tier 1 capital | 841.9 | 19.7 | 822.2 | 52.6 | 769.6 | ||
| Of which, valuation and translation adjustments | 71.5 | 14.1 | 57.4 | 39.6 | 17.8 | ||
| Additional Tier 1 capital | 13.7 | (1.0) | 14.7 | 1.2 | 13.5 | ||
| Of which, directly issued capital instruments subject to phase out from Additional Tier 1 | 24.0 | (4.0) | 28.0 | (4.0) | 32.0 | ||
| (4) Tier 2 capital | 20.9 | (23.7) | 44.6 | (19.1) | 63.7 | ||
| Of which, directly issued capital instruments subject to phase out from Tier 2 | - | - | - | (30.0) | 30.0 | ||
Regulatory adjustments applied to Tier 2 in respect of amounts subject to pre-Basel Ⅲ treatment: Of which, valuation and translation adjustments | 30.4 | (26.0) | 56.4 | 7.4 | 49.0 | ||
| (5) Total capital (2)+(4) | 876.6 | (5.0) | 881.6 | 34.6 | 847.0 | ||
| (6) Total risk weighted assets | 7,059.6 | 275.6 | 6,784.0 | 296.6 | 6,487.4 | ||
| Of which, on balanced | 6,278.8 | 221.9 | 6,056.9 | 233.1 | 5,823.8 | ||
| Of which, off balanced | 183.2 | 3.0 | 180.2 | 13.4 | 166.8 | ||
45
| III. LOANS, etc. INFORMATION | |||||
| 1. Risk Managed Loan Information | |||||
| 【Non-Consolidated】 | (Unit: Millions of Yen) | ||||
| Risk managed loans | As of March 31, 2016 (A) | (A)-(B) | As of March 31, 2015(B) | (B)-(C) | As of March 31, 2014 (C) |
| Loans to borrowers in bankruptcy | 2,946 | (865) | 3,811 | (827) | 4,638 |
| Past due loans | 175,294 | (7,046) | 182,340 | 6,762 | 175,578 |
| Accruing loans contractually past due for 3 months or more | 3,002 | (1,180) | 4,182 | 488 | 3,694 |
| Restructured loans | 12,339 | (3,171) | 15,510 | (6,948) | 22,458 |
| Total | 193,582 | (12,263) | 205,845 | (523) | 206,368 |
| [Amount of partial direct written-off] | 30,306 | (10,539) | 40,845 | (9,883) | 50,728 |
| Loans and bills discounted | 10,005,477 | 227,439 | 9,778,038 | 272,860 | 9,505,178 |
| Notes: 1. The amounts are presented after partial direct wrriten-off. | |||||
| 2. The standard of accrued interest for non-performing loans is based on borrowers classification under the self-assessment guidelines. | |||||
| 【Non-Consolidated】 | (Unit: %) | ||||
| Percentage against total loans and bills discounted | As of March 31, 2016 (A) | (A)-(B) | As of March 31, 2015(B) | (B)-(C) | As of March 31, 2014 (C) |
| Loans to borrowers in bankruptcy | 0.0 | 0.0 | 0.0 | 0.0 | 0.0 |
| Past due loans | 1.7 | (0.1) | 1.8 | 0.0 | 1.8 |
| Accruing loans contractually past due for 3 months or more | 0.0 | 0.0 | 0.0 | 0.0 | 0.0 |
| Restructured loans | 0.1 | 0.0 | 0.1 | (0.1) | 0.2 |
| Total | 1.9 | (0.2) | 2.1 | 0.0 | 2.1 |
| 【Consolidated】 | (Unit: Millions of Yen) | ||||
| Risk managed loans | As of March 31, 2016 (A) | (A)-(B) | As of March 31, 2015(B) | (B)-(C) | As of March 31, 2014 (C) |
| Loans to borrowers in bankruptcy | 2,946 | (859) | 3,805 | (833) | 4,638 |
| Past due loans | 174,826 | (7,252) | 182,078 | 3,756 | 178,322 |
| Accruing loans contractually past due for 3 months or more | 3,002 | (1,180) | 4,182 | 488 | 3,694 |
| Restructured loans | 12,339 | (3,171) | 15,510 | (6,948) | 22,458 |
| Total | 193,115 | (12,461) | 205,576 | (3,536) | 209,112 |
| (Amount of partial direct written-off) | 42,649 | (10,630) | 53,279 | (8,065) | 61,344 |
| Loans and bills discounted | 9,948,486 | 224,433 | 9,724,053 | 270,489 | 9,453,564 |
| Notes: 1.The amounts are presented after partial direct written-off. | |||||
| 2. The standard of accrued interest for non-performing loans is based on borrowers classification under the self-assessment guidelines. | |||||
| 【Consolidated】 | (Unit: %) | ||||
| Percentage against total loans and bills discounted | As of March 31, 2016 (A) | (A)-(B) | As of March 31, 2015(B) | (B)-(C) | As of March 31, 2014 (C) |
| Loans to borrowers in bankruptcy | 0.0 | 0.0 | 0.0 | 0.0 | 0.0 |
| Past due loans | 1.7 | (0.1) | 1.8 | 0.0 | 1.8 |
| Accruing loans contractually past due for 3 months or more | 0.0 | 0.0 | 0.0 | 0.0 | 0.0 |
| Restructured loans | 0.1 | 0.0 | 0.1 | (0.1) | 0.2 |
| Total | 1.9 | (0.2) | 2.1 | (0.1) | 2.2 |
46
| 2. Allowance for Loan Losses | ||||||
| 【Non-Consolidated】 | (Unit: Millions of Yen) | |||||
| As of March 31, 2016 (A) | (A)-(B) | As of March 31, 2015 (B) | (B)-(C) | As of March 31, 2014 (C) | ||
| Allowance for loan losses | 49,997 | (7,287) | 57,284 | (3,867) | 61,151 | |
| Allowance for general loan losses | 12,105 | (3,098) | 15,203 | (2,726) | 17,929 | |
| Allowance for specific loan losses | 37,891 | (4,189) | 42,080 | (1,142) | 43,222 | |
| Specific allowance for certain overseas loans | - | - | - | - | - | |
| 【Consolidated】 | (Unit: Millions of Yen) | |||||
| As of March 31, 2016 (A) | (A)-(B) | As of March 31, 2015 (B) | (B)-(C) | As of March 31, 2014 (C) | ||
| Allowance for loan losses | 59,635 | (7,480) | 67,115 | (4,961) | 72,076 | |
| Allowance for general loan losses | 16,692 | (3,560) | 20,252 | (4,319) | 24,571 | |
| Allowance for specific loan losses | 42,943 | (3,920) | 46,863 | (642) | 47,505 | |
| Specific allowance for certain overseas loans | - | - | - | - | - | |
3. Percentage of Allowance to Total Risk Managed Loans | ||||||
| 【Non-Consolidated】 | (Unit: %) | |||||
| As of March 31, 2016 (A) | (A)-(B) | As of March 31, 2015 (B) | (B)-(C) | As of March 31, 2014 (C) | ||
| Allowance for specific loan losses | ||||||
| Before partial direct written-off | 30.7 | (3.3) | 34.0 | (3.0) | 37.0 | |
| After partial direct written-off | 19.5 | (0.9) | 20.4 | (0.5) | 20.9 | |
| Allowance for loan losses | ||||||
| Before partial direct written-off | 36.1 | (4.1) | 40.2 | (3.8) | 44.0 | |
| After partial direct written-off | 25.8 | (2.0) | 27.8 | (1.8) | 29.6 | |
| 【Consolidated】 | (Unit: %) | |||||
| As of March 31, 2016 (A) | (A)-(B) | As of March 31, 2015 (B) | (B)-(C) | As of March 31, 2014 (C) | ||
| Allowance for specific loan losses | ||||||
| Before partial direct written-off | 36.7 | (2.7) | 39.4 | (1.8) | 41.2 | |
| After partial direct written-off | 22.2 | (0.5) | 22.7 | 0.0 | 22.7 | |
| Allowance for loan losses | ||||||
| Before partial direct written-off | 43.8 | (3.4) | 47.2 | (3.1) | 50.3 | |
| After partial direct written-off | 30.8 | (1.8) | 32.6 | (1.8) | 34.4 | |
47
4. Status of Claims disclosed under the Financial Revitalization Law | |||||||
| 【Non-Consolidated】 | (Unit: Millions of Yen) | ||||||
As of March 31, 2016 (A) | (A)-(B) | As of March 31, 2015 (B) | (B)-(C) | As of March 31, 2014 (C) | |||
| Unrecoverable or valueless claims | 55,021 | 1,928 | 53,093 | 9,332 | 43,761 | ||
| Doubtful claims | 124,198 | (10,952) | 135,150 | (2,094) | 137,244 | ||
| Claims in need of special caution | 15,342 | (4,350) | 19,692 | (6,460) | 26,152 | ||
| Sub-total (Claims in need of special caution or below) | A | 194,562 | (13,375) | 207,937 | 779 | 207,158 | |
| Claims in need of caution (excluding claims in need of special caution) | 971,032 | 27,272 | 943,760 | (59,647) | 1,003,407 | ||
| Claims to normal borrowers (excluding claims in need of caution) | 8,975,630 | 201,923 | 8,773,707 | 320,092 | 8,453,615 | ||
| Sub-total (Normal claims) | 9,946,662 | 229,195 | 9,717,467 | 260,445 | 9,457,022 | ||
| Total (Credit exposures) | B | 10,141,224 | 215,820 | 9,925,404 | 261,223 | 9,664,181 | |
Claims in need of special caution based on borrowers classification under the self-assessment guideline | 16,491 | (5,031) | 21,522 | (7,483) | 29,005 | ||
Non-performing loans ratio (Percentage of claims in need of special caution or below)(%) | A / B | 1.9 | (0.1) | 2.0 | (0.1) | 2.1 | |
| 【Consolidated】 | (Unit: Millions of Yen) | ||||||
As of March 31, 2016 (A) | (A)-(B) | As of March 31, 2015 (B) | (B)-(C) | As of March 31, 2014 (C) | |||
| Unrecoverable or valueless claims | 54,883 | 1,748 | 53,135 | 6,286 | 46,849 | ||
| Doubtful claims | 125,070 | (11,096) | 136,166 | (2,310) | 138,476 | ||
| Claims in need of special caution | 15,342 | (4,350) | 19,692 | (6,460) | 26,152 | ||
| Sub-total (Claims in need of special caution or below) | C | 195,295 | (13,699) | 208,994 | (2,484) | 211,478 | |
| Claims in need of caution (excluding claims in need of special caution) | 974,568 | 26,486 | 948,082 | (58,748) | 1,006,830 | ||
| Claims to normal borrowers (excluding claims in need of caution) | 9,020,059 | 178,104 | 8,841,955 | 282,327 | 8,559,628 | ||
| Sub-total (Normal claims) | 9,994,628 | 204,590 | 9,790,038 | 223,580 | 9,566,458 | ||
| Total (Credit exposures) | D | 10,189,924 | 190,892 | 9,999,032 | 221,096 | 9,777,936 | |
Claims in need of special caution based on borrowers classification under the self-assessment guideline | 16,943 | (5,142) | 22,085 | (7,504) | 29,589 | ||
Non-performing loans ratio (Percentage of claims in need of special caution or below)(%) | C / D | 1.9 | (0.1) | 2.0 | (0.1) | 2.1 | |
5. Status of Coverage of Claims disclosed under the Financial Revitalization Law | |||||||
| 【Non-Consolidated】 | (Unit: Millions of Yen) | ||||||
As of March 31, 2016 (A) | (A)-(B) | As of March 31, 2015 (B) | (B)-(C) | As of March 31, 2014 (C) | |||
| Coverage amount | A | 171,465 | (14,117) | 185,582 | (876) | 186,458 | |
| Allowance for loan losses | 39,843 | (6,233) | 46,076 | (2,565) | 48,641 | ||
| Collateral and guarantees | 131,622 | (7,884) | 139,506 | 1,689 | 137,817 | ||
Unrecoverable or valueless claims, doubtful claims, claims in need of special caution based on borrowers classification under the self-assessment guideline | B | 195,711 | (14,055) | 209,766 | (245) | 210,011 | |
| Coverage ratio (%) | A / B | 87.6 | (0.8) | 88.4 | (0.3) | 88.7 | |
| (Reference) Status of Coverage of Claims of Borrowers Classification | (Unit: Millions of Yen) | ||||||
As of March 31, 2016 (A) | (A)-(B) | As of March 31, 2015 (B) | (B)-(C) | As of March 31, 2014 (C) | |||
| Unrecoverable or valueless claims | 55,021 | 1,928 | 53,093 | 9,332 | 43,761 | ||
| Allowance for loan losses | 20,437 | 2,216 | 18,221 | 137 | 18,084 | ||
| Collateral and guarantees | 34,584 | (287) | 34,871 | 9,195 | 25,676 | ||
| Coverage ratio (%) | 100.0 | 0.0 | 100.0 | 0.0 | 100.0 | ||
| Doubtful claims | 124,198 | (10,952) | 135,150 | (2,094) | 137,244 | ||
| Allowance for loan losses | 17,154 | (6,468) | 23,622 | (1,247) | 24,869 | ||
| Collateral and guarantees | 89,207 | (5,312) | 94,519 | (3,388) | 97,907 | ||
| Coverage ratio (%) | 85.6 | (1.8) | 87.4 | (2.0) | 89.4 | ||
Claims in need of special caution based on borrowers classification under the self-assessment guideline | 16,491 | (5,031) | 21,522 | (7,483) | 29,005 | ||
| Allowance for loan losses | 2,251 | (1,980) | 4,231 | (1,456) | 5,687 | ||
| Collateral and guarantees | 7,830 | (2,285) | 10,115 | (4,117) | 14,232 | ||
| Coverage ratio (%) | 61.1 | (5.5) | 66.6 | (2.0) | 68.6 | ||
48
  ALLOWANCE COVERAGE RATIOoTOTAL COVERAGE RATIO(As of March 31, 2016)

  ?Non-consolidated?
                                              (Unit: Billions of Yen)
"
"                       "
"               Categories
Borrowers classification under the self-assessment guidelines
           Claims disclosed under the Financial Revitalization Law
  No categorization       Category ?      Category ?      Category ?
         Allowance  Allowance coverage ratio                Total coverage ratio

Legal bankruptcy   "Unrecoverable
 or valueless"     Entirely reserved    Entirely reserved, or direct written-off


2.9
(?2.5)              55.0   26.7  28.2  0.0   0.0         20.4  100%    100%
Virtual bankruptcy         (2.0)       (0.8) (1.1) (0.0) (0.0)

52.0
(4.4)
Covered by allowance, collaterals
and guarantees
                                                        Partially reserved
Possible bankruptcy                     Doubtful

124.1     124.1           39.2    67.0    17.8  17.1  49.0%   85.6%
(?11.0)           (?11.0)                 (?7.8)  (?4.0)  (0.8)
                          [22.1]  [67.0]  [34.9]
        In need of special caution based on borrowers           "In need of
 special caution"                 "?[ ]: Credit exposures under each
         category before reserve"

In need of caution
        16.4            15.3            1.1     15.3      2.2    26.0%   61.1%
        (?5.1)          (?4.3)          (?0.6)  (?4.4)

Covered by allowances, collaterals
and guarantees

        "Other than
 in need of special caution  based on borrowers"
986.3
(22.9)                                  198.2   771.6
                                        (1.3)   (26.7)    5.4             0.6%
        969.8           Normal
        (27.9)

                        9,946.6
Normal                  (229.2)
                                        8,975.6           4.4             0.0%
8,975.6                                 (201.9)
(201.9)

        Coverage 7.8 Non-covered 8.6
Total                   Total           No categorization
 Category ?      Category ?      Category ?
    Total                           Total coverage ratio

10,141.2  10,141.2   9,241.1 882.2   17.8    0.0             49.6
(215.8)   (215.8)    (195.7)         (19.3)  (0.8)   (0.0)
100.0%            91.1%   8.7%    0.2%    0.0%        87.6%


    Notes: 1. ( ): Amount of increase compared with that of March
                 31, 2015 ( ? ): Amount of decrease compared with
                 that of March 31, 2015

              2. Loans include the privately-placed bonds
guaranteed by the Bank.
| 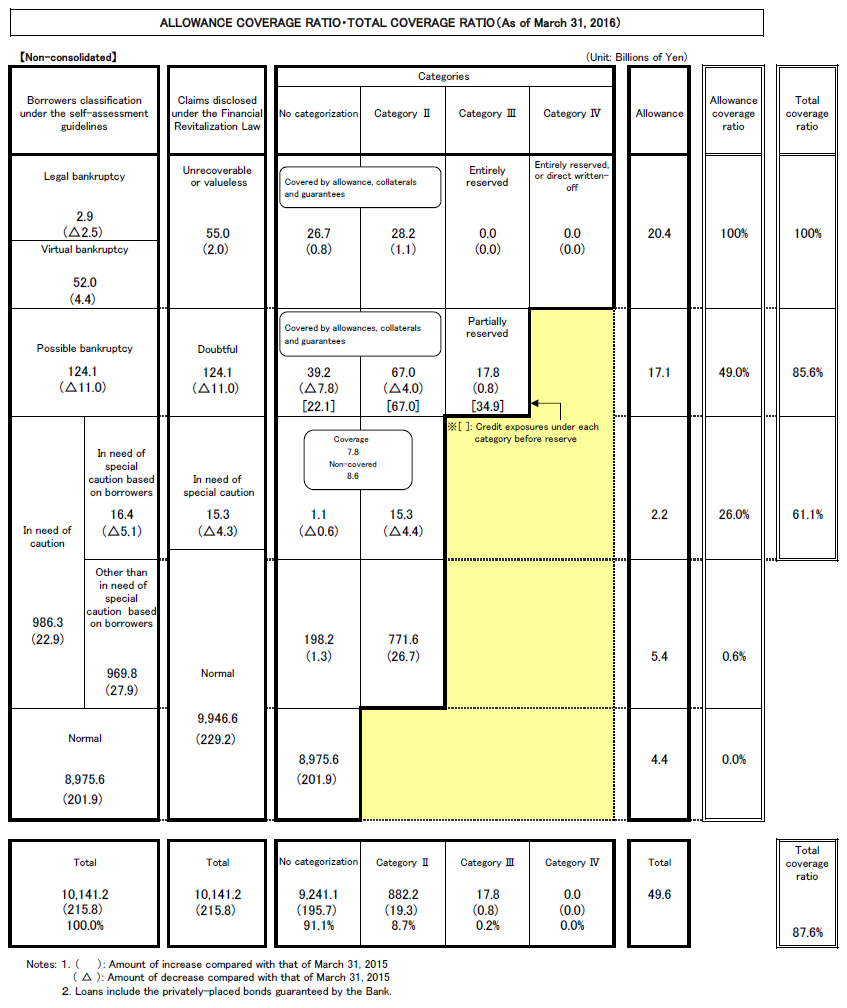 |
49
 EACH STANDARDS CONCERNING DISCLOSURE OF ASSETS (As of March 31, 2016)


  ?Non-consolidated?                        (Unit: Billions of Yen)

"Borrowers classification
under the self-assessment
 guidelines"                    "Claims disclosed
under the Financial Revitalization Law"     "Risk-managed loans
under the Banking Law"
                                "Of which, Loans
and bills discounted"                   (Loans and bills discounted)

Legal bankruptcy                        "Unrecoverable
or valueless"   54.2    2.9             Loans to borrowers in bankruptcy


2.9                                                     2.9
                                        51.2
Virtual bankruptcy
                        55.0                            Past due loans
52.0

Possible bankruptcy                                                     175.2
                        Doubtful
124.1
                        124.1   124.0

        "In need of
special caution
based on
borrowers"   In need of special caution    "Accruing loans contractually past
due for 3 months or more"
                                        3.0
                        15.3    15.3                    3.0
"In need of
caution"                        (?)       Restructured loans
        16.4                            12.3
                                                        12.3
986.3                   Sub total       Sub total                       Total
        "Other than
in need of
special caution
based on
borrowers"
                        194.5   193.5                   193.5

                        Normal
        969.8                     (?) Loans and bills discounted only
                        9,946.6 9,811.8

Normal

8,975.6
Total                   Total   Total

10,141.2                        10,141.2        10,005.4        8,737.5
| 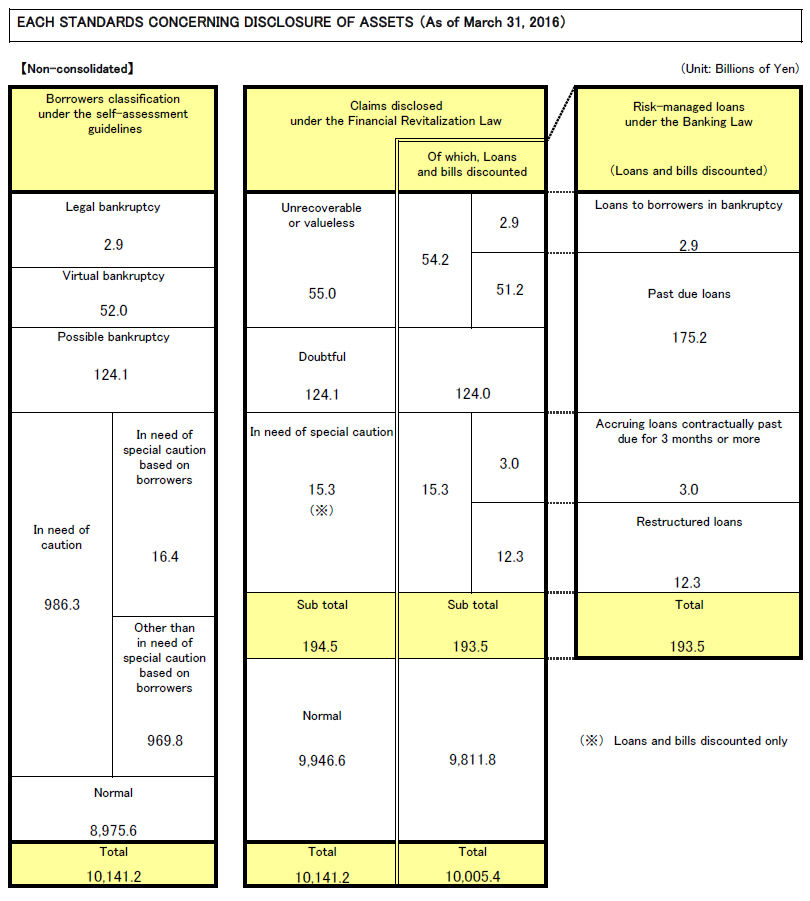 |
50
| 6. Off-Balanced Credits | ||||||
| 【Non-Consolidated】 | ||||||
| ① The amounts of doubtful claims or below, under the Financial Revitalization Law | ||||||
| (Unit: Billions of Yen) | ||||||
As of March 31, 2016 (A) | April 1, 2015 - March 31, 2016 (A)-(B) | As of March 31, 2015(B) | ||||
| Increase | Amount off-balanced | |||||
| Unrecoverable or valueless claims | 55.0 | 2.0 | 7.8 | 5.9 | 53.0 | |
| Doubtful claims | 124.1 | (11.0) | 15.9 | 26.9 | 135.1 | |
| For the year ended March 31, 2016 | 179.2 | (9.0) | 23.8 | 32.8 | 188.2 | |
As of March 31, 2015(A) | April 1, 2014 - March 31, 2015 (A)-(B) | As of March 31, 2014 (B) | ||||
| Increase | Amount off-balanced | |||||
| Unrecoverable or valueless claims | 53.0 | 9.3 | 17.9 | 8.6 | 43.7 | |
| Doubtful claims | 135.1 | (2.1) | 24.2 | 26.3 | 137.2 | |
| For the year ended March 31, 2015 | 188.2 | 7.2 | 42.2 | 34.9 | 181.0 | |
As of March 31, 2014(A) | April 1, 2013 - March 31, 2014 (A)-(B) | As of March 31, 2013 (B) | ||||
| Increase | Amount off-balanced | |||||
| Unrecoverable or valueless claims | 43.7 | (3.8) | 11.8 | 15.7 | 47.5 | |
| Doubtful claims | 137.2 | 1.8 | 29.2 | 27.4 | 135.4 | |
| For the year ended March 31, 2014 | 181.0 | (2.0) | 41.1 | 43.1 | 183.0 | |
| ② Progress of Off-balancing | (Unit: Billions of Yen) | |||||
For the year ended March 31, 2016 | For the year ended March 31, 2015 | For the year ended March 31, 2014 | ||||
Final disposal of non-performing loan by liquidation | 6.0 | 0.1 | 0.9 | |||
Final disposal of non-performing loan by restructuring | 0 | 1.4 | 4.1 | |||
Improvement in debtors' business performance due to restructuring | - | - | - | |||
| Securitization | 4.4 | 13.7 | 16.0 | |||
| Direct written-off | (13.5) | (11.1) | (14.3) | |||
| Other | 35.7 | 30.7 | 36.3 | |||
| Collection / repayment, etc. | 26.8 | 21.3 | 21.4 | |||
Improvement in debtors' business performance | 8.9 | 9.4 | 14.9 | |||
| Total | 32.8 | 34.9 | 43.1 | |||
51
| 7. Status of Bankruptcy due to Classification of Loan Categories | |||||||
| 【Non-Consolidated】 | |||||||
| ① Internal rating 1 year before bankruptcy | For the year ended | (Unit: Number of Bankruptcies, Billions of Yen) | |||||
| Internal rating | March 31, 2016 | March 31, 2015 | March 31, 2014 | ||||
| Number of bankruptcies | Amount | Number of bankruptcies | Amount | Number of bankruptcies | Amount | ||
| Category I~Ⅳ | 0 | - | 0 | - | 0 | - | |
| Category Ⅴ | 0 | - | 0 | - | 0 | - | |
| Category Ⅵ | 0 | - | 1 | 1.7 | 0 | - | |
| Category Ⅶ | 3 | 0.6 | 0 | - | 1 | 0.1 | |
| Category Ⅷ | 2 | 0.3 | 1 | 4.0 | 3 | 0.5 | |
| Category Ⅸ | 3 | 0.8 | 9 | 2.0 | 6 | 1.4 | |
| Category Ⅹ | 0 | - | 0 | - | 0 | - | |
| Category ⅩⅠ | 2 | 0.1 | 2 | 0.2 | 0 | - | |
| Category ⅩⅡ | 3 | 0.2 | 5 | 0.7 | 11 | 4.9 | |
| No rating | 1 | 0.1 | 0 | - | 0 | - | |
| ② Internal rating half a year before bankruptcy | For the year ended | (Unit: Number of Bankruptcies, Billions of Yen) | |||||
| Internal rating | March 31, 2016 | March 31, 2015 | March 31, 2014 | ||||
Number of bankruptcies | Amount | Number of bankruptcies | Amount | Number of bankruptcies | Amount | ||
| Category I~Ⅳ | 0 | - | 0 | - | 0 | - | |
| Category Ⅴ | 0 | - | 0 | - | 0 | - | |
| Category Ⅵ | 0 | - | 0 | - | 0 | - | |
| Category Ⅶ | 2 | 0.4 | 1 | 1.7 | 1 | 0.1 | |
| Category Ⅷ | 3 | 0.4 | 0 | - | 1 | 0.1 | |
| Category Ⅸ | 0 | - | 8 | 1.9 | 8 | 1.8 | |
| Category Ⅹ | 0 | - | 0 | - | 0 | - | |
| Category ⅩⅠ | 3 | 0.2 | 2 | 0.2 | 0 | - | |
| Category ⅩⅡ | 6 | 1.1 | 7 | 4.8 | 11 | 4.9 | |
| No rating | 0 | - | 0 | - | 0 | - | |
| Notes: 1. Bankruptcies with credit amount less than 50 million yen are excluded. | |||||||
| 2. The amounts are credit exposures before partial direct write-off. | |||||||
52
| 8. Loan Portfolio, etc. Information | |||||
| Domestic branches (excluding loans in offshore market account) | |||||
| ① Classification of loans by type of industry | |||||
| 【Non-Consolidated】 | (Unit: Millions of Yen) | ||||
As of March 31, 2016(A) | (A)-(B) | As of March 31, 2015(B) | (B)-(C) | As of March 31, 2014(C) | |
| Total | 9,988,290 | 227,058 | 9,761,232 | 269,859 | 9,491,373 |
| Manufacturing | 898,026 | 28,014 | 870,012 | (47,076) | 917,088 |
| Agriculture and forestry | 2,162 | (533) | 2,695 | (275) | 2,970 |
| Fishery | 5,039 | (344) | 5,383 | (199) | 5,582 |
| Mining and quarrying of stone and gravel | 3,952 | (393) | 4,345 | 18 | 4,327 |
| Construction | 219,798 | (7,735) | 227,533 | (11,005) | 238,538 |
| Electric power, gas, heat supply and water supply | 30,454 | 5,073 | 25,381 | 9,082 | 16,299 |
| IT and telecommunication | 79,161 | 15,428 | 63,733 | 8,286 | 55,447 |
| Transport and postal activities | 309,711 | 6,265 | 303,446 | (6,770) | 310,216 |
| Wholesale and retail | 784,750 | (8,542) | 793,292 | 42,662 | 750,630 |
| Finance and insurance | 204,088 | 6,417 | 197,671 | 7,099 | 190,572 |
| Real estate and goods rental and leasing | 2,800,873 | 120,389 | 2,680,484 | 132,384 | 2,548,100 |
| Other services | 758,000 | 33,476 | 724,524 | 16,494 | 708,030 |
| Local governments | 303,253 | 60,948 | 242,305 | 45,649 | 196,656 |
| Others | 3,589,017 | (31,405) | 3,620,422 | 73,511 | 3,546,911 |
| ② Classification of Risk Managed Loans under the Banking Law by type of industry | |||||
| 【Non-Consolidated】 | (Unit: Millions of Yen) | ||||
As of March 31, 2016(A) | (A)-(B) | As of March 31, 2015(B) | (B)-(C) | As of March 31, 2014(C) | |
| Total | 193,582 | (12,263) | 205,845 | (523) | 206,368 |
| Manufacturing | 28,531 | (3,663) | 32,194 | 2,337 | 29,857 |
| Agriculture and forestry | 561 | 263 | 298 | 271 | 27 |
| Fishery | - | - | - | (2) | 2 |
| Mining and quarrying of stone and gravel | - | - | - | - | - |
| Construction | 11,117 | (636) | 11,753 | (1,199) | 12,952 |
| Electric power, gas, heat supply and water supply | 3 | (1) | 4 | 0 | 4 |
| IT and telecommunication | 2,060 | (501) | 2,561 | 892 | 1,669 |
| Transport and postal activities | 6,396 | (292) | 6,688 | (63) | 6,751 |
| Wholesale and retail | 23,343 | (2,153) | 25,496 | (692) | 26,188 |
| Finance and insurance | 972 | (38) | 1,010 | (50) | 1,060 |
| Real estate and goods rental and leasing | 37,092 | (4,409) | 41,501 | (5,548) | 47,049 |
| Other services | 26,451 | (1,044) | 27,495 | (1,869) | 29,364 |
| Local governments | - | - | - | - | - |
| Others | 57,051 | 210 | 56,841 | 5,401 | 51,440 |
| ③ Classification of claims disclosed under the Financial Revitalization Law by type of industry | |||||
| 【Non-Consolidated】 | (Unit: Millions of Yen) | ||||
| As of March 31, 2016(A) | (A)-(B) | As of March 31, 2015(B) | (B)-(C) | As of March 31, 2014(C) | |
| Total | 194,562 | (13,375) | 207,937 | 779 | 207,158 |
| Manufacturing | 28,630 | (3,620) | 32,250 | 2,271 | 29,979 |
| Agriculture and forestry | 561 | 263 | 298 | 271 | 27 |
| Fishery | - | - | - | (2) | 2 |
| Mining and quarrying of stone and gravel | - | - | - | - | - |
| Construction | 11,129 | (638) | 11,767 | (1,190) | 12,957 |
| Electric power, gas, heat supply and water supply | 3 | (1) | 4 | 0 | 4 |
| IT and telecommunication | 2,062 | (2,092) | 4,154 | 2,404 | 1,750 |
| Transport and postal activities | 6,396 | (292) | 6,688 | (70) | 6,758 |
| Wholesale and retail | 24,149 | (1,646) | 25,795 | (785) | 26,580 |
| Finance and insurance | 991 | (44) | 1,035 | (44) | 1,079 |
| Real estate and goods rental and leasing | 37,103 | (4,468) | 41,571 | (5,508) | 47,079 |
| Other services | 26,476 | (1,047) | 27,523 | (1,963) | 29,486 |
| Local governments | - | - | - | - | - |
| Others | 57,057 | 210 | 56,847 | 5,396 | 51,451 |
Note: Claims in need of special caution or below are classified in the table.
53
| 9. Loans Information | ||||||||||
| 【Non-Consolidated】 | ||||||||||
| ① Balances of Loans (All branches) | For the year ended | (Unit: Billions of Yen) | ||||||||
March 31, 2016(A) | (A)-(B) | March 31, 2015(B) | (B)-(C) | March 31, 2014(C) | ||||||
| (outstanding balance) | 10,005.4 | 227.4 | 9,778.0 | 272.9 | 9,505.1 | |||||
| (average balance) | 9,883.8 | 247.1 | 9,636.7 | 241.2 | 9,395.5 | |||||
| ② Breakedown of Loans (outstanding balance) and Ratio of loans to small and medium-sized businesses, etc. | ||||||||||
Domestic branches (excluding loans in offshore market account) | (Unit: Billions of Yen) | |||||||||
As of March 31, 2016(A) | (A)-(B) | As of March 31, 2015(B) | (B)-(C) | As of March 31, 2014(C) | ||||||
| Loans to large and medium-sized businesses | 1,524.8 | 29.9 | 1,494.9 | 18.4 | 1,476.5 | |||||
| Loans to small and medium-sized businesses, etc. | A | 8,051.9 | 154.8 | 7,897.1 | 204.6 | 7,692.5 | ||||
| Loans to small and medium-sized businesses | 3,162.4 | 139.1 | 3,023.3 | 104.2 | 2,919.1 | |||||
| Loans to individuals | 4,889.4 | 15.6 | 4,873.8 | 100.5 | 4,773.3 | |||||
| Residential loans | 4,513.1 | (0.6) | 4,513.7 | 91.0 | 4,422.7 | |||||
| Housing loans | 3,053.9 | (37.7) | 3,091.6 | 54.6 | 3,037.0 | |||||
| Apartment loans | 1,459.1 | 37.1 | 1,422.0 | 36.4 | 1,385.6 | |||||
| Other individual loans | 376.3 | 16.3 | 360.0 | 9.5 | 350.5 | |||||
| Public sectors | 411.4 | 42.3 | 369.1 | 46.9 | 322.2 | |||||
| Total | B | 9,988.2 | 227.0 | 9,761.2 | 269.9 | 9,491.3 | ||||
| Retail Loans in Kanagawa Prefecture | 6,779.3 | 92.1 | 6,687.2 | 134.4 | 6,552.8 | |||||
| Loans to small and medium-sized businesses in Kanagawa Prefecture | 2,441.6 | 105.8 | 2,335.8 | 56.3 | 2,279.5 | |||||
| Loans to individuals in Kanagawa Prefecture | 4,337.6 | (13.7) | 4,351.3 | 78.1 | 4,273.2 | |||||
| Note: Retail Loans in Kanagawa Prefecture = outstanding balance of loans to small and medium-sized businesses, etc. of which in Kanagawa Prefecture | ||||||||||
| (Unit: %) | ||||||||||
| Ratio of loans to small and medium-sized businesses, etc. | A/B | 80.6 | (0.3) | 80.9 | (0.1) | 81.0 | ||||
| (Reference) | For the year ended | (Unit: Billions of Yen) | ||||||||
March 31, 2016 (A) | (A)-(B) | March 31, 2015 (B) | (B)-(C) | March 31, 2014 (C) | ||||||
| New housing Loans (Note 1, 2) | 191.9 | (75.2) | 267.1 | (43.3) | 310.4 | |||||
| New apartment Loans (Note 1) | 178.9 | 14.2 | 164.7 | (1.6) | 166.3 | |||||
| Notes: 1. Our managerial accounting basis | ||||||||||
| 2. Excluding Flat 35 | ||||||||||
| ③ Breakedown of Loans (average balance) | ||||||||||
Domestic branches (excluding loans in offshore market account) | For the year ended | (Unit: Billions of Yen) | ||||||||
March 31, 2016(A) | (A)-(B) | March 31, 2015(B) | (B)-(C) | March 31, 2014(C) | ||||||
| Loans to large and medium-sized businesses | 1,530.4 | 21.3 | 1,509.1 | 8.5 | 1,500.6 | |||||
| Loans to small and medium-sized businesses, etc. | 7,945.7 | 176.3 | 7,769.4 | 129.4 | 7,640.0 | |||||
| Loans to small and medium-sized businesses | 3,083.4 | 116.1 | 2,967.3 | 32.2 | 2,935.1 | |||||
| Loans to individuals | 4,862.2 | 60.1 | 4,802.1 | 97.2 | 4,704.9 | |||||
| Residential loans | 4,499.4 | 51.0 | 4,448.4 | 89.8 | 4,358.6 | |||||
| Housing loans | 3,065.9 | 13.2 | 3,052.7 | 45.4 | 3,007.3 | |||||
| Apartment loans | 1,433.5 | 37.8 | 1,395.7 | 44.5 | 1,351.2 | |||||
| Other individual loans | 362.8 | 9.2 | 353.6 | 7.4 | 346.2 | |||||
| Public sectors | 393.1 | 51.3 | 341.8 | 99.6 | 242.2 | |||||
| Total | 9,869.2 | 248.8 | 9,620.4 | 237.5 | 9,382.9 | |||||
| ④ Loans to certain areas | (Unit: Billions of Yen) | |||||||||
As of March 31, 2016(A) | (A)-(B) | As of March 31, 2015(B) | (B)-(C) | As of March 31, 2014(C) | ||||||
| Loans to Asian countries | 32.9 | 0.5 | 32.4 | 7.8 | 24.6 | |||||
| Of which, risk managed loans | - | - | - | - | - | |||||
| Loans to Latin America | 10.0 | (5.5) | 15.5 | 0.1 | 15.4 | |||||
| Of which, risk managed loans | - | - | - | - | - | |||||
54
| 10. Deposits Information | ||||||||||
| 【Non-Consolidated】 | ||||||||||
| ① Balances of deposits (All branches) | For the year ended | (Unit: Billions of Yen) | ||||||||
March 31, 2016(A) | (A)-(B) | March 31, 2015(B) | (B)-(C) | March 31, 2014(C) | ||||||
| (outstanding balance) | 12,680.8 | 522.3 | 12,158.5 | 290.2 | 11,868.3 | |||||
| (average balance) | 12,073.8 | 421.4 | 11,652.4 | 347.6 | 11,304.8 | |||||
| ② Breakdown of depositors' categories | ||||||||||
Domestic branches (excluding deposits in offshore market account) | (Unit: Billions of Yen) | |||||||||
| <Outstanding balance> | ||||||||||
As of March 31, 2016(A) | (A)-(B) | As of March 31, 2015(B) | (B)-(C) | As of March 31, 2014(C) | ||||||
| Individual | 9,134.3 | 193.2 | 8,941.1 | 228.6 | 8,712.5 | |||||
| Of which, liquid deposits | 6,347.2 | 214.7 | 6,132.5 | 282.0 | 5,850.5 | |||||
| Of which, fixed deposits | 2,757.7 | (15.1) | 2,772.8 | (49.5) | 2,822.3 | |||||
| Corporate | 2,429.4 | 112.7 | 2,316.7 | 89.3 | 2,227.4 | |||||
| Local Public | 854.4 | 128.8 | 725.6 | (61.9) | 787.5 | |||||
| Financial institutions | 131.1 | 2.5 | 128.6 | 1.7 | 126.9 | |||||
| Total | 12,549.4 | 437.3 | 12,112.1 | 257.6 | 11,854.5 | |||||
| Of which, deposits in Kanagawa Prefecture | 11,554.6 | 393.8 | 11,160.8 | 266.3 | 10,894.5 | |||||
| For the year ended | (Unit: Billions of Yen) | |||||||||
| <Average balance> | ||||||||||
March 31, 2016(A) | (A)-(B) | March 31, 2015(B) | (B)-(C) | March 31, 2014(C) | ||||||
| Individual | 9,089.6 | 235.4 | 8,854.2 | 251.5 | 8,602.7 | |||||
| Corporate | 2,394.5 | 89.0 | 2,305.5 | 96.9 | 2,208.6 | |||||
| Local Public | 436.9 | 58.7 | 378.2 | (28.2) | 406.4 | |||||
| Financial institutions | 75.5 | (2.5) | 78.0 | 0.3 | 77.7 | |||||
| Total | 11,996.6 | 380.6 | 11,616.0 | 320.6 | 11,295.4 | |||||
| Of which, deposits in Kanagawa Prefecture | 11,015.2 | 344.4 | 10,670.8 | 288.1 | 10,382.7 | |||||
| 11. Individual Deposit Assets, etc. | ||||||||||
| ① Balances of deposit assets for individuals | ||||||||||
| 【Non-Consolidated】 | (Unit: Billions of Yen) | |||||||||
| As of March 31, 2016(A) | (A)-(B) | As of March 31, 2015(B) | (B)-(C) | As of March 31, 2014(C) | ||||||
| Investment trusts | 550.5 | (68.0) | 618.5 | 89.9 | 528.6 | |||||
| Insurance | 1,016.8 | 53.1 | 963.7 | 4.1 | 959.6 | |||||
| Foreign currency deposits | 27.5 | (6.0) | 33.5 | (4.2) | 37.7 | |||||
| Public bonds | 133.2 | (41.2) | 174.4 | (68.4) | 242.8 | |||||
Total balance of investment products for individuals | A | 1,728.2 | (62.0) | 1,790.2 | 21.2 | 1,769.0 | ||||
| Individual deposits (deposits in yen) | 9,106.7 | 199.2 | 8,907.5 | 232.8 | 8,674.7 | |||||
| Total individual deposit assets | B | 10,835.0 | 137.3 | 10,697.7 | 254.0 | 10,443.7 | ||||
Ratio of investment products for individuals | A/B | 15.9% | (0.8%) | 16.7% | (0.2%) | 16.9% | ||||
| 【Consolidated】 | ||||||||||
Investment products for individuals at Hamagin Tokai Tokyo Securities Co., Ltd. | C | 323.3 | (26.7) | 350.0 | 51.0 | 299.0 | ||||
Total balance of investment products for individuals (Group total) | D=A+C | 2,051.6 | (88.7) | 2,140.3 | 72.3 | 2,068.0 | ||||
| Total individual deposit assets (Group total) | E=B+C | 11,158.3 | 110.5 | 11,047.8 | 305.0 | 10,742.8 | ||||
Ratio of investment products for individuals (Group total) | D/E | 18.3% | (1.0%) | 19.3% | 0.1% | 19.2% | ||||
| ② Sales amount of investment products for individuals | ||||||||||
| 【Consolidated】 | For the year ended | (Unit: Billions of Yen) | ||||||||
| March 31, 2016(A) | (A)-(B) | March 31, 2015(B) | (B)-(C) | March 31, 2014(C) | ||||||
Sales amount of Investment trusts (The Bank of Yokohama, Ltd.) | 269.0 | (168.0) | 437.0 | 80.0 | 357.0 | |||||
Sales amount of Insurance (The Bank of Yokohama, Ltd.) | 189.5 | 32.1 | 157.4 | 44.2 | 113.2 | |||||
Sales amount of Investment products for individuals at Hamagin Tokai Tokyo Securities Co., Ltd. | 128.4 | (65.4) | 193.8 | (4.5) | 198.3 | |||||
Sales amount of investment products for individuals (Group total) | 587.0 | (201.4) | 788.4 | 119.8 | 668.6 | |||||
55
| 12. Average Balance of Use and Source of Funds, etc. | ||||||||||||
| 【Non-Consolidated】 | ||||||||||||
| ① Domestic operations | For the year ended | (Unit: Billions of Yen) | ||||||||||
| March 31, 2016 | March 31, 2015 | March 31, 2014 | ||||||||||
| Average balance | Interest | Yield (%) | Average balance | Interest | Yield (%) | Average balance | Interest | Yield (%) | ||||
| Interest-earning assets | [165.4] | [0.1] | [283.1] | [0.1] | [326.1] | [0.2] | ||||||
| 12,265.2 | 155.9 | 1.27 | 12,117.7 | 159.8 | 1.31 | 11,759.8 | 164.0 | 1.39 | ||||
| Of which, loans and bills discounted | 9,734.1 | 125.4 | 1.28 | 9,520.6 | 131.2 | 1.37 | 9,316.9 | 137.9 | 1.48 | |||
| Of which, securities | 2,238.3 | 26.6 | 1.18 | 2,169.7 | 25.6 | 1.18 | 1,966.2 | 23.0 | 1.16 | |||
| Interest-bearning liabilities | 13,546.5 | 5.1 | 0.03 | 12,317.4 | 4.7 | 0.03 | 11,826.6 | 6.7 | 0.05 | |||
| Of which, deposits | 11,854.3 | 3.7 | 0.03 | 11,473.8 | 3.9 | 0.03 | 11,145.2 | 4.5 | 0.04 | |||
| Of which, negotiable certificates of deposit | 245.7 | 0.1 | 0.07 | 128.5 | 0.0 | 0.05 | 111.0 | 0.0 | 0.06 | |||
| Of which, call money | 674.3 | 0.4 | 0.06 | 287.0 | 0.1 | 0.06 | 232.4 | 0.1 | 0.07 | |||
| Note: The figures in brackets represent the average balance and interest of borrowing or lending between international and domestic operations. | ||||||||||||
| ② International operations | For the year ended | (Unit: Billions of Yen) | ||||||||||
| March 31, 2016 | March 31, 2015 | March 31, 2014 | ||||||||||
| Average balance | Interest | Yield (%) | Average balance | Interest | Yield (%) | Average balance | Interest | Yield (%) | ||||
| Interest-earning assets | 731.0 | 7.6 | 1.05 | 727.9 | 6.0 | 0.83 | 668.2 | 4.4 | 0.66 | |||
| Of which, loans and bills discounted | 149.7 | 1.7 | 1.15 | 116.1 | 1.1 | 0.99 | 78.6 | 0.7 | 0.99 | |||
| Of which, securities | 257.4 | 3.3 | 1.28 | 206.9 | 2.0 | 0.99 | 130.3 | 1.5 | 1.22 | |||
| Of which, call loans | 258.4 | 1.9 | 0.75 | 240.1 | 1.2 | 0.50 | 219.3 | 0.9 | 0.42 | |||
| Interest-bearning liabilities | [165.4] | [0.1] | [283.1] | [0.1] | [326.1] | [0.2] | ||||||
| 734.6 | 5.9 | 0.80 | 720.0 | 4.5 | 0.63 | 656.3 | 3.2 | 0.49 | ||||
| Of which, deposits | 219.5 | 0.9 | 0.43 | 178.5 | 0.5 | 0.28 | 159.6 | 0.3 | 0.20 | |||
| Of which, call money | 133.7 | 1.0 | 0.78 | 95.4 | 0.3 | 0.40 | 94.6 | 0.3 | 0.33 | |||
| Note: The figures in brackets represent the average balance and interest of borrowing or lending between international and domestic operations. | ||||||||||||
| ③ All branches | For the year ended | (Unit: Billions of Yen) | ||||||||||
| March 31, 2016 | March 31, 2015 | March 31, 2014 | ||||||||||
| Average balance | Interest | Yield (%) | Average balance | Interest | Yield (%) | Average balance | Interest | Yield (%) | ||||
| Interest-earning assets | 12,830.8 | 163.5 | 1.27 | 12,562.5 | 165.6 | 1.31 | 12,101.9 | 168.2 | 1.38 | |||
| Of which, loans and bills discounted | 9,883.8 | 127.2 | 1.28 | 9,636.7 | 132.4 | 1.37 | 9,395.5 | 138.6 | 1.47 | |||
| Of which, securities | 2,495.8 | 29.9 | 1.19 | 2,376.7 | 27.7 | 1.16 | 2,096.6 | 24.5 | 1.17 | |||
| Of which, call loans | 258.4 | 1.9 | 0.75 | 251.5 | 1.2 | 0.49 | 243.9 | 0.9 | 0.40 | |||
| Interest-bearning liabilities | 14,115.7 | 11.0 | 0.07 | 12,754.3 | 9.0 | 0.07 | 12,156.8 | 9.7 | 0.07 | |||
| Of which, deposits | 12,073.8 | 4.7 | 0.03 | 11,652.4 | 4.4 | 0.03 | 11,304.8 | 4.8 | 0.04 | |||
| Of which, negotiable certificates of deposit | 245.7 | 0.1 | 0.07 | 128.5 | 0.0 | 0.05 | 111.0 | 0.0 | 0.06 | |||
| Of which, call money | 808.0 | 1.5 | 0.18 | 382.4 | 0.5 | 0.15 | 327.1 | 0.4 | 0.14 | |||
| 13. Loan-Deposit Ratio and Securities-Deposit Ratio | ||
| 【Non-Consolidated】 | ||
| ① Loan-deposit ratio (All branches) | For the year ended | (Unit: %) |
| March 31, 2016(A) | March 31, 2015(B) | March 31, 2014(C) | |||
| (A)-(B) | (B)-(C) | ||||
| Ratio by outstanding balance | 77.69 | (1.90) | 79.59 | (0.03) | 79.62 |
| Ratio by average balance | 80.22 | (1.57) | 81.79 | (0.51) | 82.30 |
| Note: Deposits include negotiable certificates of deposit. | |||||
| ② Securities-deposit ratio (All branches) | For the year ended | (Unit: %) | |||
| March 31, 2016(A) | March 31, 2015(B) | March 31, 2014(C) | |||
| (A)-(B) | (B)-(C) | ||||
| Ratio by outstanding balance | 18.41 | (1.62) | 20.03 | 2.86 | 17.17 |
| Ratio by average balance | 20.25 | 0.08 | 20.17 | 1.81 | 18.36 |
| Note: Deposits include negotiable certificates of deposit. |
| The forecasts above include contents in respect to future performance. Therefore, these contents are based on reasonable assumption including unexpected risk and element of uncertainty. Please be cautious the actual results might differ significantly from forecast. |
56