|
Exhibit 99.2 
|
Supplemental Information Package
Fourth Quarter and Year Ended December 31, 2015
Disclaimers
Forward-looking Statement
We make statements in this Supplemental Information Package that are considered “forward-looking statements” within the meaning of Section 27A of the Securities Act of 1933, as amended, or the Securities Act, and Section 21E of the Securities Exchange Act of 1934, as amended, or the Exchange Act, which are usually identified by the use of words such as “anticipates,” “believes,” “estimates,” “expects,” “intends,” “may,” “plans,” “projects,” “seeks,” “should,” “will,” and variations of such words or similar expressions. We intend these forward-looking statements to be covered by the safe harbor provisions for forward-looking statements contained in the Private Securities Litigation Reform Act of 1995 and are including this statement in this Supplemental Information Package for purposes of complying with those safe harbor provisions. These forward-looking statements reflect our current views about our plans, intentions, expectations, strategies and prospects, which are based on the information currently available to us and on assumptions we have made. Although we believe that our plans, intentions, expectations, strategies and prospects as reflected in or suggested by those forward-looking statements are reasonable, we can give no assurance that the plans, intentions, expectations or strategies will be attained or achieved. Furthermore, actual results may differ materially from those described in the forward-looking statements and will be affected by a variety of risks and factors that are beyond our control including, without limitation: risks associated with our dependence on the U.S. Government and its agencies for substantially all of our revenues; risks associated with ownership and development of real estate; decreased rental rates or increased vacancy rates; loss of key personnel; general volatility of the capital and credit markets and the market price of our common stock; the risk that the market price of our common stock may be negatively impacted by increased selling activity following the liquidation of certain private investment funds that contributed assets in our initial public offering; the risk we may lose one or more major tenants; failure of acquisitions or development projects to occur at anticipated levelsorto yield anticipated results; risks associated with actual or threatened terrorist attacks; intense competition in the real estate market that may limit our ability to attract or retain tenants or re-lease space; insufficient amounts of insurance or exposure to events that are either uninsured or underinsured; uncertainties and risks related to adverse weather conditions, natural disasters and climate change; exposure to liability relating to environmental and health and safety matters; limited ability to dispose of assets because of the relative illiquidity of real estate investments and the nature of our assets; exposure to litigation or other claims; risks associated with breaches of our data security; risks associated with our indebtedness; and other risks and uncertainties detailed in the “Risk Factors” section of our Form 10-K for the year ended December 31, 2015, to be filed with the Securities and Exchange Commission on or about March 2, 2016. In addition, our anticipated qualification as a real estate investment trust involves the application of highly technical and complex provisions of the Internal Revenue Code of 1986, or the Code, and depends on our ability to meet the various requirements imposed by the Code through actual operating results, distribution levels and diversity of stock ownership. We assume no obligation to update publicly any forward looking statements, whether as a result of new information, future events or otherwise.
Ratings
Ratings are not recommendations to buy, sell or hold the Company’s securities.
The following discussion related to the consolidated financial statements of the Company should be read in conjunction with the financial statements for the year ended December 31, 2015 that will be released on Form 10-K to be filed on or about March 2, 2016.
Supplemental Definitions
Annualized lease income is defined as the annualized contractual base rent for the last month in a specified period, plus the annualized straight line rent adjustments for the last month in such period and the annualized expense reimbursements earned by us for the last month in such period.
Cash Available for Distribution (CAD), is a non-GAAP financial measure that is not intended to represent cash flow for the period and is not indicative of cash flow provided by operating activities as determined under GAAP. CAD is calculated in accordance with the current NAREIT definition as FFO minus normalized recurring real estate-related expenditures and other non-cash items and nonrecurring expenditures. CAD is presented solely as a supplemental disclosure with respect to liquidity because the Company believes it provides useful information regarding the Company’s ability to fund its dividends. Because all companies do not calculate CAD the same way, the presentation of CAD may not be comparable to similarly titled measures of other companies.
EBITDA is calculated as the sum of net income (loss) before interest expense, income taxes, depreciation and amortization. EBITDA is not intended to represent cash flow for the period, is not presented as an alternative to operating income as an indicator of operating performance, should not be considered in isolation or as a substitute for measures of performance prepared in accordance with GAAP and is not indicative of operating income or cash provided by operating activities as determined under GAAP. EBITDA is presented solely as a supplemental disclosure with respect to liquidity because the Company believes it provides useful information regarding the Company’s ability to service or incur debt. Because all companies do not calculate EBITDA the same way, the presentation of EBITDA may not be comparable to similarly titled measures of other companies.
Fully diluted basis assumes the exchange of all outstanding common units representing limited partnership interests in the Company’s operating partnership, or common units, the full vesting of all restricted stock units, and the exchange of all earned and outstanding LTIP units in the Company’s operating partnership for shares of common stock on a one-for-one basis, which is not the same as the meaning of “fully diluted” under GAAP. Fully diluted basis does not include outstanding LTIP units in the Company’s operating partnership that are subject to performance criteria that have not yet been met.
Funds From Operations (FFO) is generally defined by NAREIT as net income (loss), calculated in accordance with GAAP, excluding gains or losses from sales of property and impairment losses on depreciable real estate, plus real estate depreciation and amortization, and after adjustments for unconsolidated partnerships and joint ventures. FFO is a widely recognized measure of REIT performance. Although FFO is a non-GAAP financial measure, the Company believes that information regarding FFO is helpful to shareholders and potential investors.
Funds From Operations, as Adjusted (FFO, as Adjusted) adjusts Funds From Operations (FFO) to present an alternative measure of our operating performance that we believe is useful to shareholders and potential investors, which, when applicable, excludes the impact of acquisition costs, straight-line rent, above-/below-market leases, non-cash interest and non-cash compensation. In the Future, we may also exclude other items from FFO, as Adjusted that we believe may help investors compare our results. Because all companies do not calculate FFO, as Adjusted in the same way, the presentation of FFO, as Adjusted may not be comparable to similarly titled measures of other companies.
Net Operating Income (NOI) is calculated as total property revenues (rental income, tenant reimbursements and other income) less property operating expenses and real estate taxes from the properties owned by the Company. Cash NOI excludes from NOI straight-line rent and amortization of above-/below-market leases. NOI presented by the Company may not be comparable to NOI reported by other REITs that define NOI differently. NOI should not be considered an alternative to net incomeasan indication of our performance or to cash flows as a measure of the Company’s liquidity or its ability to make distributions.
Pro forma year ended December 31, 2015 (1) removes from the Company’s financial results for the period from February 11, 2015 (the date of the closing of the Company’s initial public offering) to December 31, 2015 the impact of one-time, non-recurring expenses related to its initial public offering, including legal and accounting fees and new entity formation costs and (2) reflects a full quarter of operations for the period from January 1, 2015 to March 31, 2015 on a pro forma basis basedonthe financial results of the 49 days of operations between February 11, 2015 and March 31, 2015.
Table of Contents
Overview
Corporate Information and Analyst Coverage 5
Executive Summary 6
Corporate Financials
Balance Sheet 7
Income Statement – Year Ended December 31, 2015 8
Income Statement – Three Months Ended December 31, 2015 9
Net Operating Income 10
EBITDA, FFO and CAD 11
Debt
Debt Schedules 12
Debt Maturities 13
Properties
Property Overview 14
Tenants 15
Lease Expirations 16
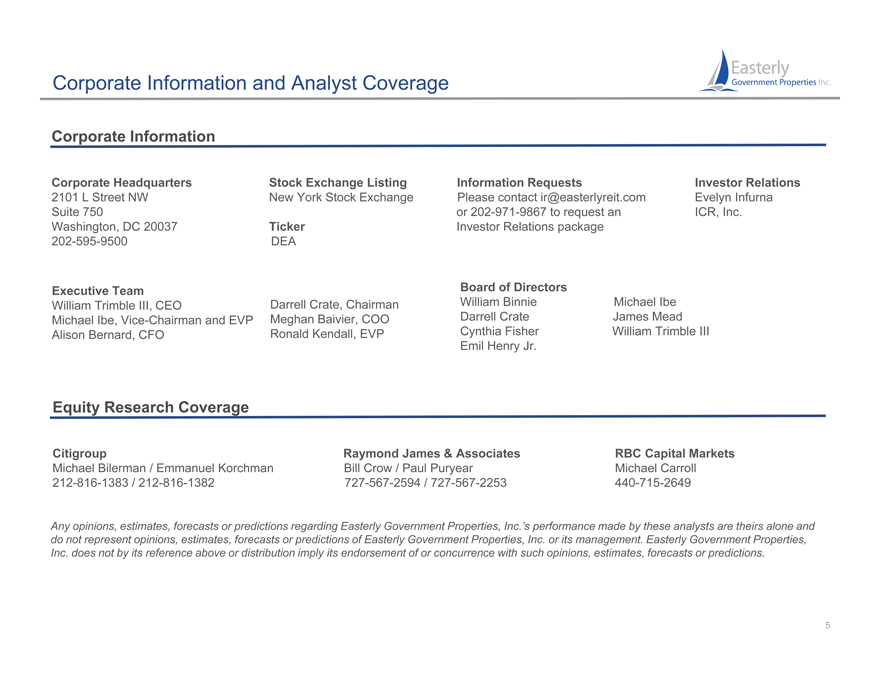
Corporate Information and Analyst Coverage
Corporate Information
Corporate Headquarters Stock Exchange Listing Information Requests Investor Relations
2101 L Street NW New York Stock Exchange Please contact ir@easterlyreit.com Evelyn Infurna
Suite 750 or 202-971-9867 to request an ICR, Inc.
Washington, DC 20037 Ticker Investor Relations package
202-595-9500 DEA
Executive Team Board of Directors
William Trimble III, CEO Darrell Crate, Chairman William Binnie Michael Ibe
Michael Ibe, Vice-Chairman and EVP Meghan Baivier, COO Darrell Crate James Mead
Alison Bernard, CFO Ronald Kendall, EVP Cynthia Fisher William Trimble III
Emil Henry Jr.
Equity Research Coverage
Citigroup Raymond James & Associates RBC Capital Markets
Michael Bilerman / Emmanuel Korchman Bill Crow / Paul Puryear Michael Carroll
212-816-1383 / 212-816-1382 727-567-2594 / 727-567-2253 440-715-2649
Any opinions, estimates, forecasts or predictions regarding Easterly Government Properties, Inc.’s performance made by these analysts are theirs alone and
do not represent opinions, estimates, forecasts or predictions of Easterly Government Properties, Inc. or its management. Easterly Government Properties,
Inc. does not by its reference above or distribution imply its endorsement of or concurrence with such opinions, estimates, forecasts or predictions.
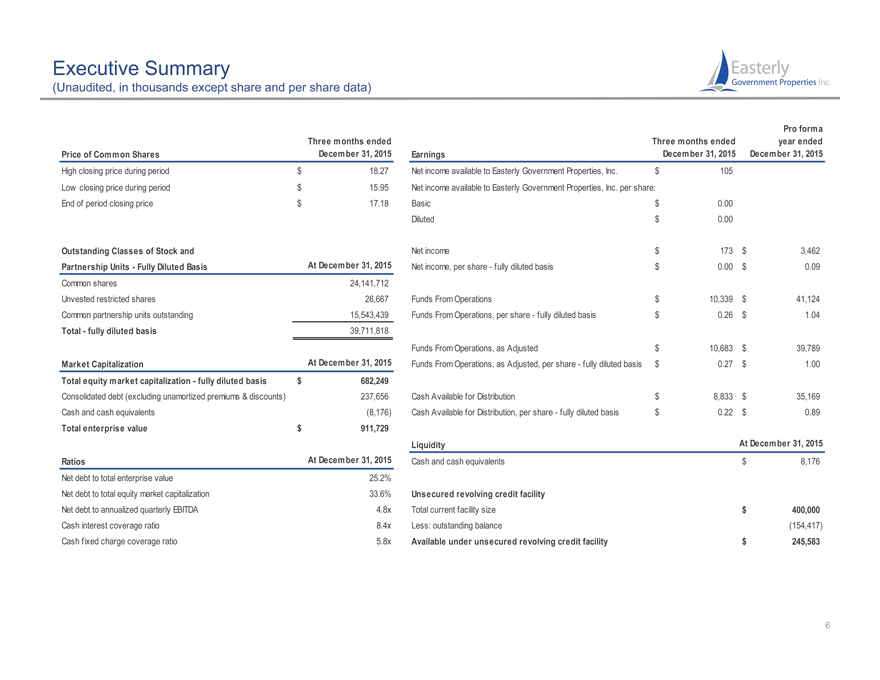
Executive Summary
(Unaudited, in thousands except share and per share data)
Pro forma
Three months ended Three months ended year ended
Price of Common Shares December 31, 2015 Earnings December 31, 2015 December 31, 2015
High closing price during period $ 18.27 Net income available to Easterly Government Properties, Inc. $ 105
Low closing price during period $ 15.95 Net income available to Easterly Government Properties, Inc. per share:
End of period closing price $ 17.18 Basic $ 0.00
Diluted $ 0.00
Outstanding Classes of Stock and Net income $ 173 $ 3,462
Partnership Units—Fully Diluted Basis At December 31, 2015 Net income, per share—fully diluted basis $ 0.00 $ 0.09
Common shares 24,141,712
Unvested restricted shares 26,667 Funds From Operations $ 10,339 $ 41,124
Common partnership units outstanding 15,543,439 Funds From Operations, per share—fully diluted basis $ 0.26 $ 1.04
Total—fully diluted basis 39,711,818
Funds From Operations, as Adjusted $ 10,683 $ 39,789
Market Capitalization At December 31, 2015 Funds From Operations, as Adjusted, per share—fully diluted basis $ 0.27 $ 1.00
Total equity market capitalization—fully diluted basis $ 682,249
Consolidated debt (excluding unamortized premiums & discounts) 237,656 Cash Available for Distribution $ 8,833 $ 35,169
Cash and cash equivalents(8,176) Cash Available for Distribution, per share—fully diluted basis $ 0.22 $ 0.89
Total enterprise value $ 911,729
Liquidity At December 31, 2015
Ratios At December 31, 2015 Cash and cash equivalents $ 8,176
Net debt to total enterprise value 25.2%
Net debt to total equity market capitalization 33.6% Unsecured revolving credit facility
Net debt to annualized quarterly EBITDA 4.8x Total current facility size $ 400,000
Cash interest coverage ratio 8.4x Less: outstanding balance(154,417)
Cash fixed charge coverage ratio 5.8x Available under unsecured revolving credit facility $ 245,583
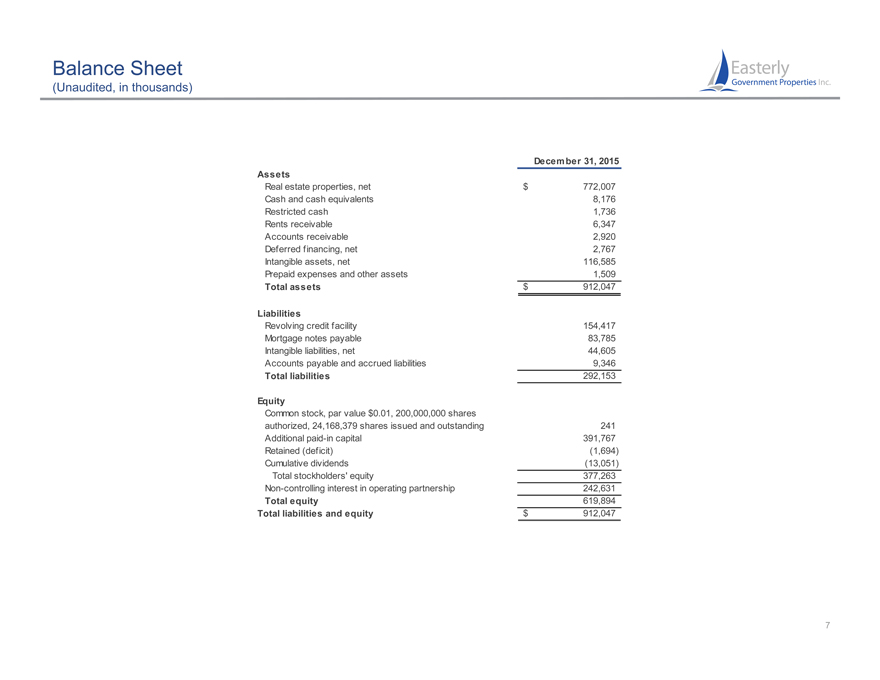
Balance Sheet
(Unaudited, in thousands)
December 31, 2015
Assets
Real estate properties, net $ 772,007
Cash and cash equivalents 8,176
Restricted cash 1,736
Rents receivable 6,347
Accounts receivable 2,920
Deferred financing, net 2,767
Intangible assets, net 116,585
Prepaid expenses and other assets 1,509
Total assets $ 912,047
Liabilities
Revolving credit facility 154,417
Mortgage notes payable 83,785
Intangible liabilities, net 44,605
Accounts payable and accrued liabilities 9,346
Total liabilities 292,153
Equity
Common stock, par value $0.01, 200,000,000 shares
authorized, 24,168,379 shares issued and outstanding 241
Additional paid-in capital 391,767
Retained (deficit)(1,694)
Cumulative dividends(13,051)
Total stockholders’ equity 377,263
Non-controlling interest in operating partnership 242,631
Total equity 619,894
Total liabilities and equity $ 912,047
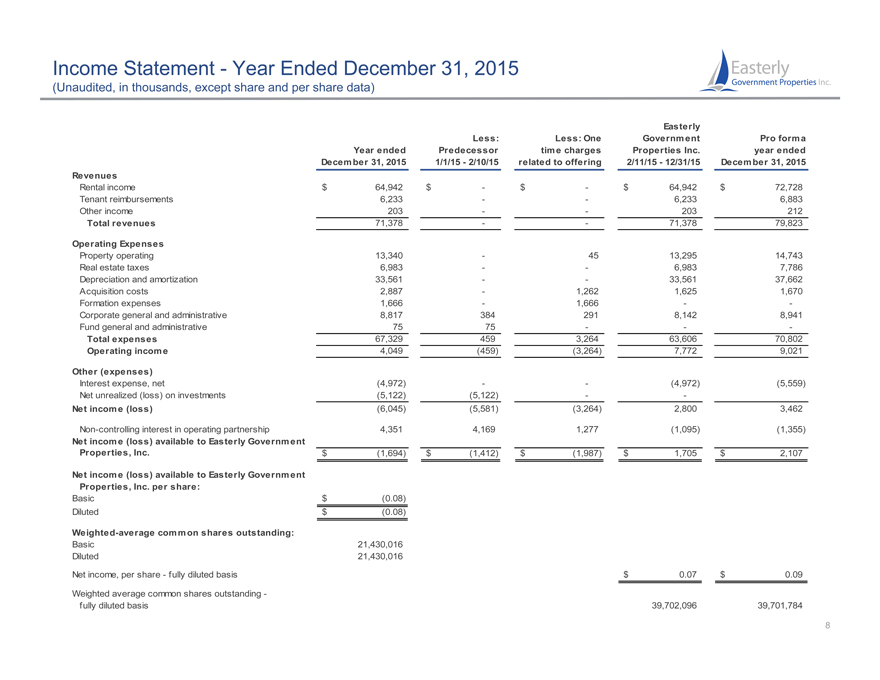
Income Statement—Year Ended December 31, 2015
(Unaudited, in thousands, except share and per share data)
Easterly
Less: Less: One Government Pro forma
Year ended Predecessor time charges Properties Inc. year ended
December 31, 2015 1/1/15—2/10/15 related to offering 2/11/15—12/31/15 December 31, 2015
Revenues
Rental income $ 64,942 $—$—$ 64,942 $ 72,728
Tenant reimbursements 6,233 — 6,233 6,883
Other income 203 — 203 212
Total revenues 71,378 — 71,378 79,823
Operating Expenses
Property operating 13,340—45 13,295 14,743
Real estate taxes 6,983 — 6,983 7,786
Depreciation and amortization 33,561 — 33,561 37,662
Acquisition costs 2,887—1,262 1,625 1,670
Formation expenses 1,666—1,666 —
Corporate general and administrative 8,817 384 291 8,142 8,941
Fund general and administrative 75 75 — -
Total expenses 67,329 459 3,264 63,606 70,802
Operating income 4,049(459)(3,264) 7,772 9,021
Other (expenses)
Interest expense, net(4,972) —(4,972)(5,559)
Net unrealized (loss) on investments(5,122)(5,122) —
Net income (loss)(6,045)(5,581)(3,264) 2,800 3,462
Non-controlling interest in operating partnership 4,351 4,169 1,277(1,095)(1,355)
Net income (loss) available to Easterly Government
Properties, Inc. $(1,694) $(1,412) $(1,987) $ 1,705 $ 2,107
Net income (loss) available to Easterly Government
Properties, Inc. per share:
Basic $(0.08)
Diluted $(0.08)
Weighted-average common shares outstanding:
Basic 21,430,016
Diluted 21,430,016
Net income, per share—fully diluted basis $ 0.07 $ 0.09
Weighted average common shares outstanding -
fully diluted basis 39,702,096 39,701,784
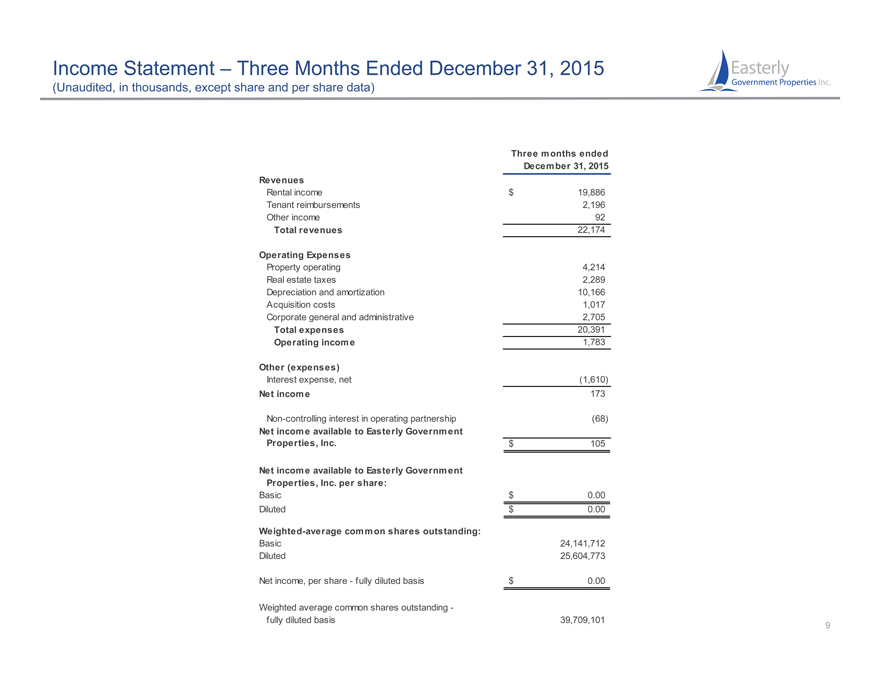
Income Statement – Three Months Ended December 31, 2015
(Unaudited, in thousands, except share and per share data)
Three months ended
December 31, 2015
Revenues
Rental income $ 19,886
Tenant reimbursements 2,196
Other income 92
Total revenues 22,174
Operating Expenses
Property operating 4,214
Real estate taxes 2,289
Depreciation and amortization 10,166
Acquisition costs 1,017
Corporate general and administrative 2,705
Total expenses 20,391
Operating income 1,783
Other (expenses)
Interest expense, net(1,610)
Net income 173
Non-controlling interest in operating partnership(68)
Net income available to Easterly Government
Properties, Inc. $ 105
Net income available to Easterly Government
Properties, Inc. per share:
Basic $ 0.00
Diluted $ 0.00
Weighted-average common shares outstanding:
Basic 24,141,712
Diluted 25,604,773
Net income, per share—fully diluted basis $ 0.00
Weighted average common shares outstanding -
fully diluted basis 39,709,101 9
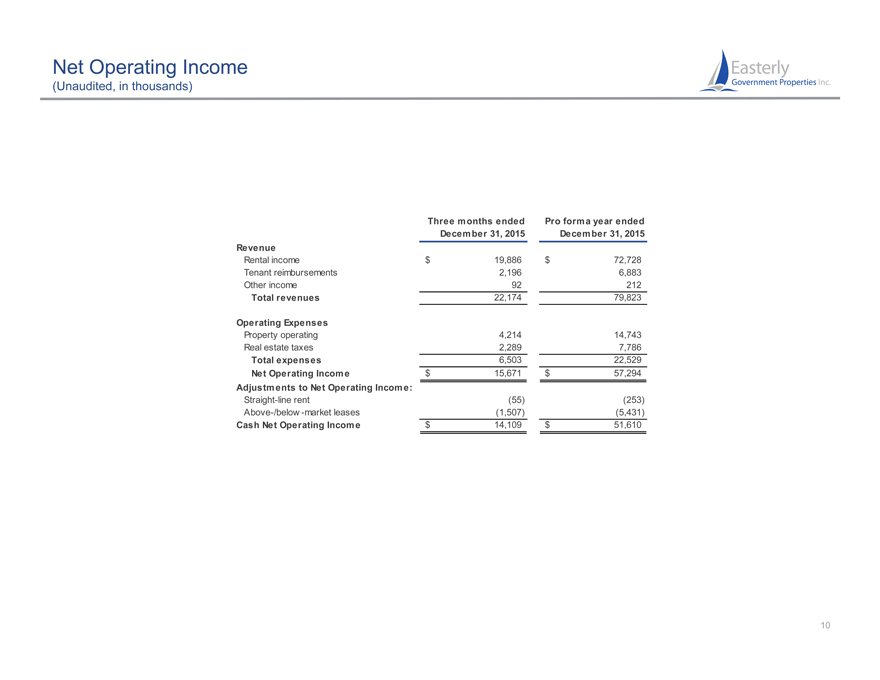
Net Operating Income
(Unaudited, in thousands)
Three months ended Pro forma year ended
December 31, 2015 December 31, 2015
Revenue
Rental income $ 19,886 $ 72,728
Tenant reimbursements 2,196 6,883
Other income 92 212
Total revenues 22,174 79,823
Operating Expenses
Property operating 4,214 14,743
Real estate taxes 2,289 7,786
Total expenses 6,503 22,529
Net Operating Income $ 15,671 $ 57,294
Adjustments to Net Operating Income:
Straight-line rent(55)(253)
Above-/below -market leases(1,507)(5,431)
Cash Net Operating Income $ 14,109 $ 51,610
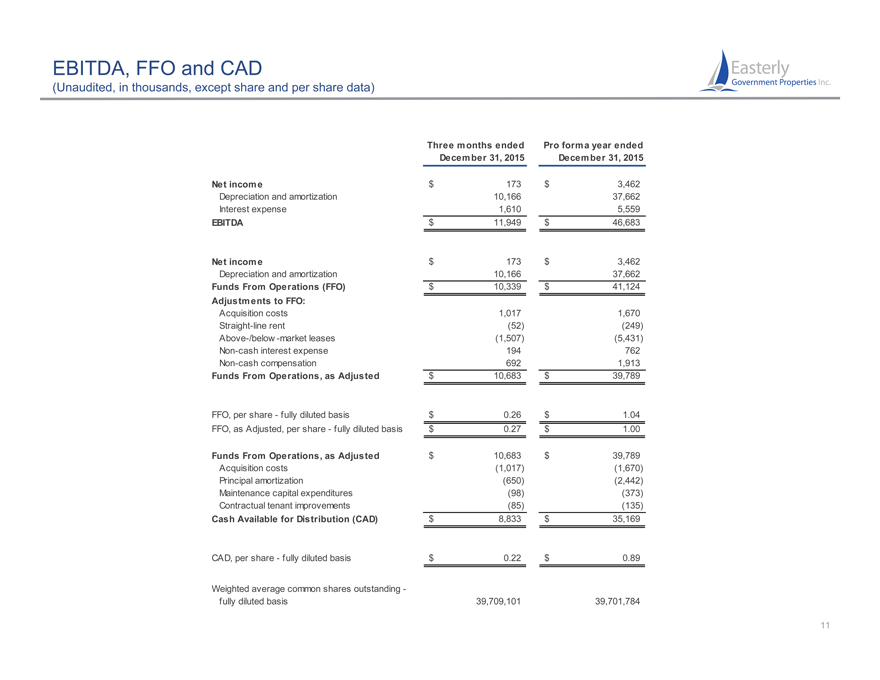
EBITDA, FFO and CAD
(Unaudited, in thousands, except share and per share data)
Three months ended Pro forma year ended
December 31, 2015 December 31, 2015
Net income $ 173 $ 3,462
Depreciation and amortization 10,166 37,662
Interest expense 1,610 5,559
EBITDA $ 11,949 $ 46,683
Net income $ 173 $ 3,462
Depreciation and amortization 10,166 37,662
Funds From Operations (FFO) $ 10,339 $ 41,124
Adjustments to FFO:
Acquisition costs 1,017 1,670
Straight-line rent(52)(249)
Above-/below -market leases(1,507)(5,431)
Non-cash interest expense 194 762
Non-cash compensation 692 1,913
Funds From Operations, as Adjusted $ 10,683 $ 39,789
FFO, per share—fully diluted basis $ 0.26 $ 1.04
FFO, as Adjusted, per share—fully diluted basis $ 0.27 $ 1.00
Funds From Operations, as Adjusted $ 10,683 $ 39,789
Acquisition costs(1,017)(1,670)
Principal amortization(650)(2,442)
Maintenance capital expenditures(98)(373)
Contractual tenant improvements(85)(135)
Cash Available for Distribution (CAD) $ 8,833 $ 35,169
CAD, per share—fully diluted basis $ 0.22 $ 0.89
Weighted average common shares outstanding -
fully diluted basis 39,709,101 39,701,784
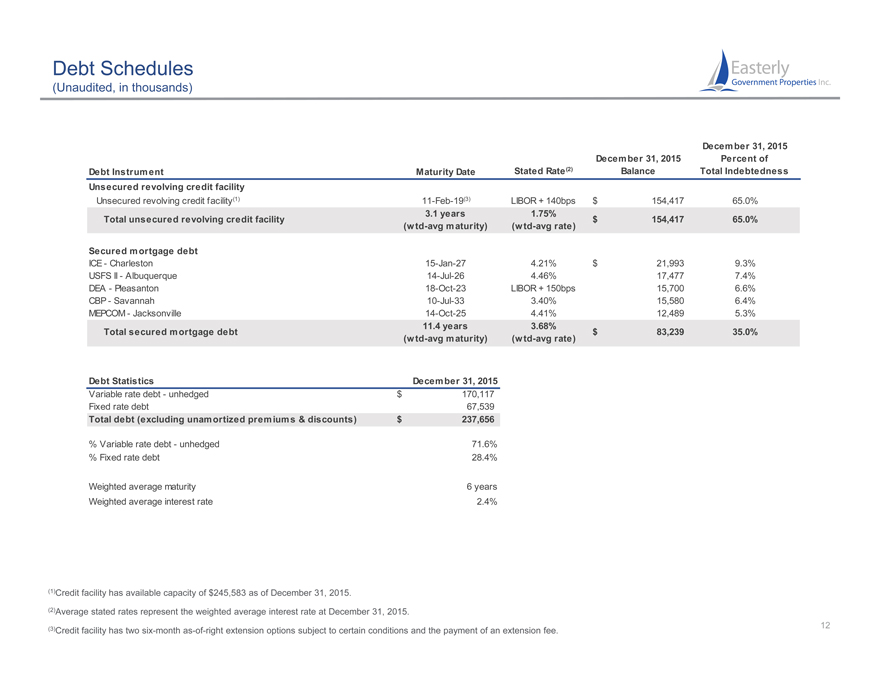
Debt Schedules
(Unaudited, in thousands)
December 31, 2015
December 31, 2015 Percent of
Debt Instrument Maturity Date Stated Rate (2) Balance Total Indebtedness
Unsecured revolving credit facility
Unsecured revolving credit facility(1) 11-Feb-19(3) LIBOR + 140bps $ 154,417 65.0%
Total unsecured revolving credit facility $ 154,417 65.0%
(wtd-avg maturity)(wtd-avg rate)
Secured mortgage debt
ICE—Charleston 15-Jan-27 4.21% $ 21,993 9.3%
USFS II—Albuquerque 14-Jul-26 4.46% 17,477 7.4%
DEA—Pleasanton 18-Oct-23 LIBOR + 150bps 15,700 6.6%
CBP—Savannah 10-Jul-33 3.40% 15,580 6.4%
MEPCOM—Jacksonville 14-Oct-25 4.41% 12,489 5.3%
Total secured mortgage debt $ 83,239 35.0%
(wtd-avg maturity)(wtd-avg rate)
Debt Statistics December 31, 2015
Variable rate debt—unhedged $ 170,117
Fixed rate debt 67,539
Total debt (excluding unamortized premiums & discounts) $ 237,656
% Variable rate debt—unhedged 71.6%
% Fixed rate debt 28.4%
Weighted average maturity 6 years
Weighted average interest rate 2.4%
(1)Credit facility has available capacity of $245,583 as of December 31, 2015.
(2)Average stated rates represent the weighted average interest rate at December 31, 2015.
(3)Credit facility has two six-month as-of-right extension options subject to certain conditions and the payment of an extension fee. 12
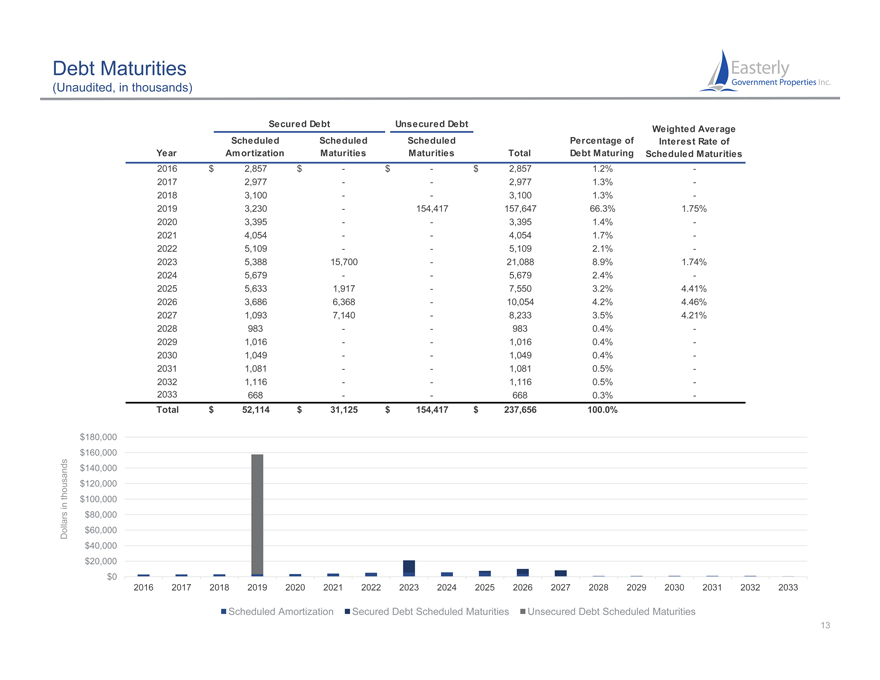
Debt Maturities
(Unaudited, in thousands)
Secured Debt Unsecured Debt Weighted Average
Scheduled Scheduled Scheduled Percentage of Interest Rate of
Year Amortization Maturities Maturities Total Debt Maturing Scheduled Maturities
2016 $ 2,857 $—$—$ 2,857 1.2% -
2017 2,977 — 2,977 1.3% -
2018 3,100 — 3,100 1.3% -
2019 3,230—154,417 157,647 66.3% 1.75%
2020 3,395 — 3,395 1.4% -
2021 4,054 — 4,054 1.7% -
2022 5,109 — 5,109 2.1% -
2023 5,388 15,700—21,088 8.9% 1.74%
2024 5,679 — 5,679 2.4% -
2025 5,633 1,917—7,550 3.2% 4.41%
2026 3,686 6,368—10,054 4.2% 4.46%
2027 1,093 7,140—8,233 3.5% 4.21%
2028 983 — 983 0.4% -
2029 1,016 — 1,016 0.4% -
2030 1,049 — 1,049 0.4% -
2031 1,081 — 1,081 0.5% -
2032 1,116 — 1116, 05%. -
2033 668 — 668 0.3% -
Total $ 52,114 $ 31,125 $ 154,417 $ 237,656 100.0%
$180,000
$160,000
ds $140,000
thousan $120,000
$100,000
in
$80,000
Dollars $60,000
$40,000
$20,000
$0
2016 2017 2018 2019 2020 2021 2022 2023 2024 2025 2026 2027 2028 2029 2030 2031 2032 2033
Scheduled Amortization Secured Debt Scheduled Maturities Unsecured Debt Scheduled Maturities
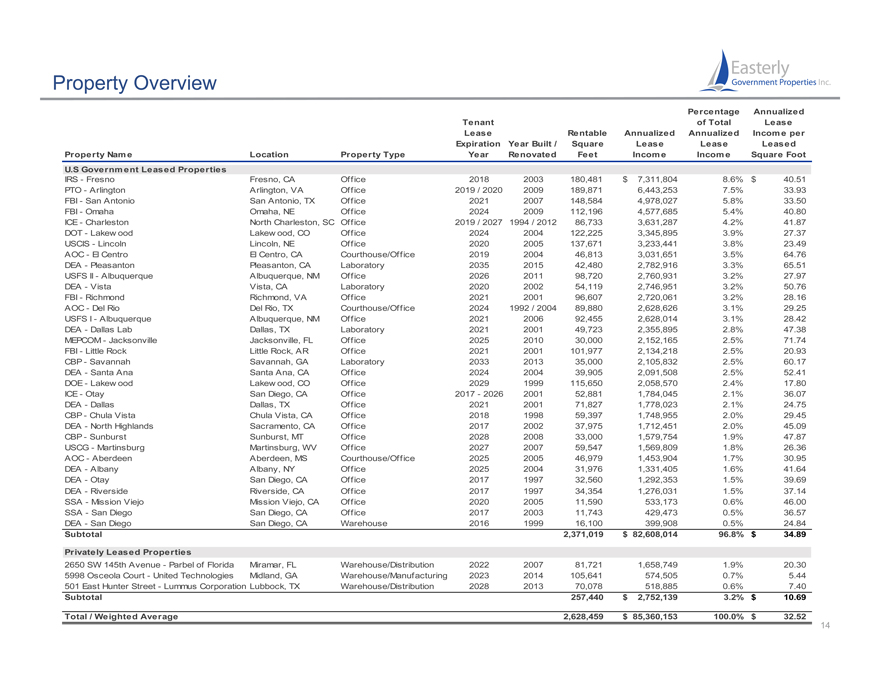
Property Overview
Percentage Annualized
Tenant of Total Lease
Lease Rentable Annualized Annualized Income per
Expiration Year Built / Square Lease Lease Leased
Property Name Location Property Type Year Renovated Feet Income Income Square Foot
U.S Government Leased Properties
IRS—Fresno Fresno, CA Office 2018 2003 180,481 $ 7,311,804 8.6% $ 40.51
PTO—Arlington Arlington, VA Office 2019 / 2020 2009 189,871 6,443,253 7.5% 33.93
FBI—San Antonio San Antonio, TX Office 2021 2007 148,584 4,978,027 5.8% 33.50
FBI—Omaha Omaha, NE Office 2024 2009 112,196 4,577,685 5.4% 40.80
ICE—Charleston North Charleston, SC Office 2019 / 2027 1994 / 2012 86,733 3,631,287 4.2% 41.87
DOT—Lakew ood Lakew ood, CO Office 2024 2004 122,225 3,345,895 3.9% 27.37
USCIS—Lincoln Lincoln, NE Office 2020 2005 137,671 3,233,441 3.8% 23.49
AOC—El Centro El Centro, CA Courthouse/Office 2019 2004 46,813 3,031,651 3.5% 64.76
DEA—Pleasanton Pleasanton, CA Laboratory 2035 2015 42,480 2,782,916 3.3% 65.51
USFS II—Albuquerque Albuquerque, NM Office 2026 2011 98,720 2,760,931 3.2% 27.97
DEA—Vista Vista, CA Laboratory 2020 2002 54,119 2,746,951 3.2% 50.76
FBI—Richmond Richmond, VA Office 2021 2001 96,607 2,720,061 3.2% 28.16
AOC—Del Rio Del Rio, TX Courthouse/Office 2024 1992 / 2004 89,880 2,628,626 3.1% 29.25
USFS I—Albuquerque Albuquerque, NM Office 2021 2006 92,455 2,628,014 3.1% 28.42
DEA—Dallas Lab Dallas, TX Laboratory 2021 2001 49,723 2,355,895 2.8% 47.38
MEPCOM—Jacksonville Jacksonville, FL Office 2025 2010 30,000 2,152,165 2.5% 71.74
FBI—Little Rock Little Rock, AR Office 2021 2001 101,977 2,134,218 2.5% 20.93
CBP—Savannah Savannah, GA Laboratory 2033 2013 35,000 2,105,832 2.5% 60.17
DEA—Santa Ana Santa Ana, CA Office 2024 2004 39,905 2,091,508 2.5% 52.41
DOE—Lakew ood Lakew ood, CO Office 2029 1999 115,650 2,058,570 2.4% 17.80
ICE—Otay San Diego, CA Office 2017—2026 2001 52,881 1,784,045 2.1% 36.07
DEA—Dallas Dallas, TX Office 2021 2001 71,827 1,778,023 2.1% 24.75
CBP—Chula Vista Chula Vista, CA Office 2018 1998 59,397 1,748,955 2.0% 29.45
DEA—North Highlands Sacramento, CA Office 2017 2002 37,975 1,712,451 2.0% 45.09
CBP—Sunburst Sunburst, MT Office 2028 2008 33,000 1,579,754 1.9% 47.87
USCG—Martinsburg Martinsburg, WV Office 2027 2007 59,547 1,569,809 1.8% 26.36
AOC—Aberdeen Aberdeen, MS Courthouse/Office 2025 2005 46,979 1,453,904 1.7% 30.95
DEA—Albany Albany, NY Office 2025 2004 31,976 1,331,405 1.6% 41.64
DEA—Otay San Diego, CA Office 2017 1997 32,560 1,292,353 1.5% 39.69
DEA—Riverside Riverside, CA Office 2017 1997 34,354 1,276,031 1.5% 37.14
SSA—Mission Viejo Mission Viejo, CA Office 2020 2005 11,590 533,173 0.6% 46.00
SSA—San Diego San Diego, CA Office 2017 2003 11,743 429,473 0.5% 36.57
DEA—San Diego San Diego, CA Warehouse 2016 1999 16,100 399,908 0.5% 24.84
Subtotal 2,371,019 $ 82,608,014 96.8% $ 34.89
Privately Leased Properties
2650 SW 145th Avenue—Parbel of Florida Miramar, FL Warehouse/Distribution 2022 2007 81,721 1,658,749 1.9% 20.30
5998 Osceola Court—United Technologies Midland, GA Warehouse/Manufacturing 2023 2014 105,641 574,505 0.7% 5.44
501 East Hunter Street—Lummus Corporation Lubbock, TX Warehouse/Distribution 2028 2013 70,078 518,885 0.6% 7.40
Subtotal 257,440 $ 2,752,139 3.2% $ 10.69
Total / Weighted Average 2,628,459 $ 85,360,153 100.0% $ 32.52
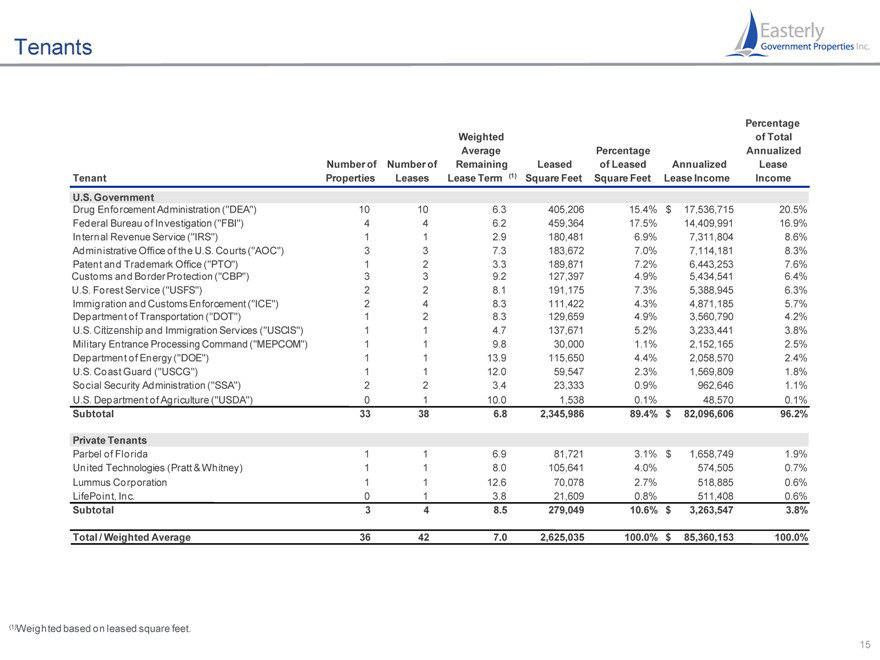
Tenants
Percentage
Weighted of Total
Average Percentage Annualized
Number of Number of Remaining Leased of Leased Annualized Lease
Tenant Properties Leases Lease Term (1) Square Feet Square Feet Lease Income Income
U.S. Government
Drug Enforcement Administration (“DEA”) 10 10 6.3 405,206 15.4% $ 17,536,715 20.5%
Federal Bureau of Investigation (“FBI”) 4 4 6.2 459,364 17.5% 14,409,991 16.9%
Internal Revenue Service (“IRS”) 1 1 2.9 180,481 6.9% 7,311,804 8.6%
Administrative Office of the U.S. Courts (“AOC”) 3 3 7.3 183,672 7.0% 7,114,181 8.3%
Patent and Trademark Office (“PTO”) 1 2 3.3 189,871 7.2% 6,443,253 7.6%
Customs and Border Protection (“CBP”) 3 3 9.2 127,397 4.9% 5,434,541 6.4%
U.S. Forest Service (“USFS”) 2 2 8.1 191,175 7.3% 5,388,945 6.3%
Immigration and Customs Enforcement (“ICE”) 2 4 8.3 111,422 4.3% 4,871,185 5.7%
Department of Transportation (“DOT”) 1 2 8.3 129,659 4.9% 3,560,790 4.2%
U.S. Citizenship and Immigration Services (“USCIS”) 1 1 4.7 137,671 5.2% 3,233,441 3.8%
Military Entrance Processing Command (“MEPCOM”) 1 1 9.8 30,000 1.1% 2,152,165 2.5%
Department of Energy (“DOE”) 1 1 13.9 115,650 4.4% 2,058,570 2.4%
U.S. Coast Guard (“USCG”) 1 1 12.0 59,547 2.3% 1,569,809 1.8%
Social Security Administration (“SSA”) 2 2 3.4 23,333 0.9% 962,646 1.1%
U.S. Department of Agriculture (“USDA”) 0 1 10.0 1,538 0.1% 48,570 0.1%
Subtotal 33 38 6.8 2,345,986 89.4% $ 82,096,606 96.2%
Private Tenants
Parbel of Florida 1 1 6.9 81,721 3.1% $ 1,658,749 1.9%
United Technologies (Pratt & Whitney) 1 1 8.0 105,641 4.0% 574,505 0.7%
Lummus Corporation 1 1 12.6 70,078 2.7% 518,885 0.6%
LifePoint, Inc. 0 1 3.8 21,609 0.8% 511,408 0.6%
Subtotal 3 4 8.5 279,049 10.6% $ 3,263,547 3.8%
Total / Weighted Average 36 42 7.0 2,625,035 100.0% $ 85,360,153 100.0%
(1)Weighted based on leased square feet.
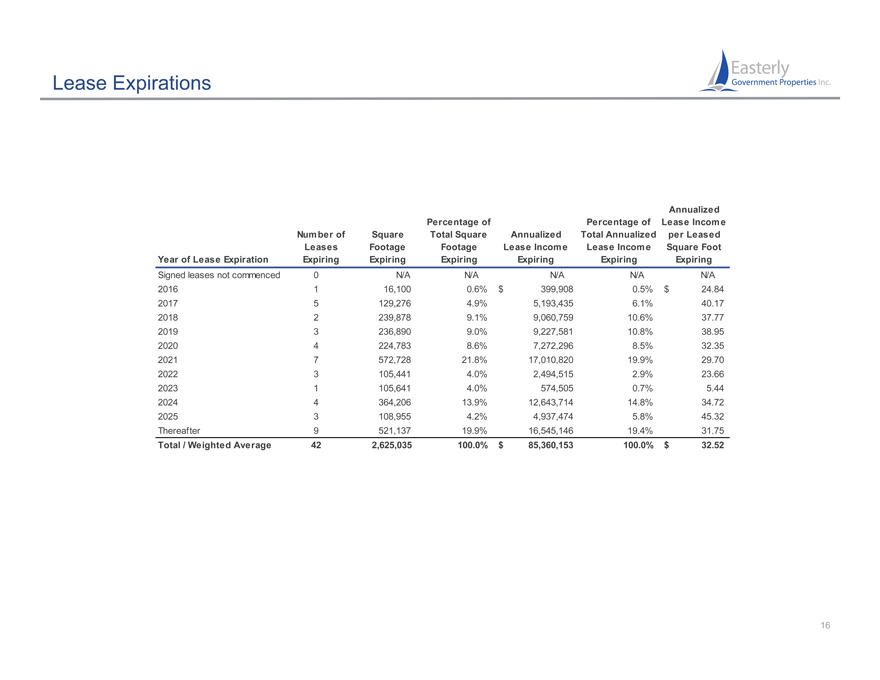
Lease Expirations
Annualized
Percentage of Percentage of Lease Income
Number of Square Total Square Annualized Total Annualized per Leased
Leases Footage Footage Lease Income Lease Income Square Foot
Year of Lease Expiration Expiring Expiring Expiring Expiring Expiring Expiring
Signed leases not commenced 0 N/A N/A N/A N/A N/A
2016 1 16,100 0.6% $ 399,908 0.5% $ 24.84
2017 5 129,276 4.9% 5,193,435 6.1% 40.17
2018 2 239,878 9.1% 9,060,759 10.6% 37.77
2019 3 236,890 9.0% 9,227,581 10.8% 38.95
2020 4 224,783 8.6% 7,272,296 8.5% 32.35
2021 7 572,728 21.8% 17,010,820 19.9% 29.70
2022 3 105,441 4.0% 2,494,515 2.9% 23.66
2023 1 105,641 4.0% 574,505 0.7% 5.44
2024 4 364,206 13.9% 12,643,714 14.8% 34.72
2025 3 108,955 4.2% 4,937,474 5.8% 45.32
Thereafter 9 521,137 19.9% 16,545,146 19.4% 31.75
Total / Weighted Average 42 2,625,035 100.0% $ 85,360,153 100.0% $ 32.52