Exhibit 99.2
| |
Disclaimers | 
|
|
Forward-looking Statement
We make statements in this Supplemental Information Package that are considered “forward-looking statements” within the meaning of Section 27A of the Securities Act of 1933, as amended, or the Securities Act, and Section 21E of the Securities Exchange Act of 1934, as amended, or the Exchange Act, which are usually identified by the use of words such as “anticipates,” “believes,” “estimates,” “expects,” “intends,” “may,” “plans,” “projects,” “seeks,” “should,” “will,” and variations of such words or similar expressions. We intend these forward-looking statements to be covered by the safe harbor provisions for forward-looking statements contained in the Private Securities Litigation Reform Act of 1995 and are including this statement in this Supplemental Information Package for purposes of complying with those safe harbor provisions. These forward-looking statements reflect our current views about our plans, intentions, expectations, strategies and prospects, which are based on the information currently available to us and on assumptions we have made. Although we believe that our plans, intentions, expectations, strategies and prospects as reflected in or suggested by those forward-looking statements are reasonable, we can give no assurance that the plans, intentions, expectations or strategies will be attained or achieved. Furthermore, actual results may differ materially from those described in the forward-looking statements and will be affected by a variety of risks and factors that are beyond our control including, without limitation: risks associated with our dependence on the U.S. Government and its agencies for substantially all of our revenues; risks associated with ownership and development of real estate; the risk of decreased rental rates or increased vacancy rates; loss of key personnel; the continuing adverse impact of the novel coronavirus (COVID-19) on the U.S., regional and global economies and the financial condition and results of operations of the Company; general volatility of the capital and credit markets and the market price of our common stock; the risk we may lose one or more major tenants; difficulties in completing and successfully integrating acquisitions; failure of acquisitions or development projects to occur at anticipated levels or to yield anticipated results; risks associated with actual or threatened terrorist attacks; intense competition in the real estate market that may limit our ability to attract or retain tenants or re-lease space; insufficient amounts of insurance or exposure to events that are either uninsured or underinsured; uncertainties and risks related to adverse weather conditions, natural disasters and climate change; exposure to liability relating to environmental and health and safety matters; limited ability to dispose of assets because of the relative illiquidity of real estate investments and the nature of our assets; exposure to litigation or other claims; risks associated with breaches of our data security; risks associated with our indebtedness; and other risks and uncertainties detailed in the “Risk Factors” section of our Form 10-K for the year ended December 31, 2020, filed with the Securities and Exchange Commission, or the SEC, on February 24, 2021 and the factors included under the heading “Risk Factors” in our other public filings. In addition, our qualification as a real estate investment trust involves the application of highly technical and complex provisions of the Internal Revenue Code of 1986, or the Code, and depends on our ability to meet the various requirements imposed by the Code through actual operating results, distribution levels and diversity of stock ownership. We assume no obligation to update publicly any forward-looking statements, whether as a result of new information, future events or otherwise.
Ratings
Ratings are not recommendations to buy, sell or hold the Company’s securities.
The following discussion related to the consolidated financial statements of the Company should be read in conjunction with the financial statements for the quarter ended June 30, 2021 that will be released in our Form 10-Q to be filed with the SEC on or about August 3, 2021.
2
| |
Supplemental Definitions |
|
|
This section contains definitions of certain non-GAAP financial measures and other terms that the Company uses in this Supplemental Information Package and, where applicable, the reasons why management believes these non-GAAP financial measures provide useful information to investors about the Company’s financial condition and results of operations and the other purposes for which management uses the measures. These measures should not be considered in isolation or as a substitute for measures of performance in accordance with GAAP. Additional detail can be found in the Company’s most recent quarterly report on Form 10-Q and the Company’s most recent annual report on Form 10-K, as well as other documents filed with or furnished to the SEC from time to time.
Annualized lease income is defined as the annualized contractual base rent for the last month in a specified period, plus the annualized straight-line rent adjustments for the last month in such period and the annualized net expense reimbursements earned by us for the last month in such period.
Cash Available for Distribution (CAD) is a non-GAAP financial measure that is not intended to represent cash flow for the period and is not indicative of cash flow provided by operating activities as determined under GAAP. CAD is calculated in accordance with the current Nareit definition as FFO minus normalized recurring real estate-related expenditures and other non-cash items and nonrecurring expenditures. CAD is presented solely as a supplemental disclosure because the Company believes it provides useful information regarding the Company’s ability to fund its dividends. Because all companies do not calculate CAD the same way, the presentation of CAD may not be comparable to similarly titled measures of other companies.
Cash fixed charge coverage ratio is calculated as EBITDA divided by the sum of principal amortization and interest expense, excluding amortization of premiums / discounts and deferred financing fees, for the most recent quarter.
Cash interest coverage ratio is calculated as EBITDA divided by interest expense, excluding amortization of premiums / discounts and deferred financing fees, for the most recent quarter.
EBITDA is calculated as the sum of net income (loss) before interest expense, taxes, depreciation and amortization. EBITDA is not intended to represent cash flow for the period, is not presented as an alternative to operating income as an indicator of operating performance, should not be considered in isolation or as a substitute for measures of performance prepared in accordance with GAAP, is not indicative of operating income or cash provided by operating activities as determined under GAAP and may be presented on a pro forma basis. EBITDA is presented solely as a supplemental disclosure with respect to liquidity because the Company believes it provides useful information regarding the Company's ability to service or incur debt. Because all companies do not calculate EBITDA the same way, the presentation of EBITDA may not be comparable to similarly titled measures of other companies.
Fully diluted basis assumes the exchange of all outstanding common units representing limited partnership interests in the Company’s operating partnership, or common units, the full vesting of all shares of restricted stock, and the exchange of all earned and vested LTIP units in the Company’s operating partnership for shares of common stock on a one-for-one basis, which is not the same as the meaning of “fully diluted” under GAAP.
Funds From Operations (FFO) is defined, in accordance with the Nareit FFO White Paper - 2018 Restatement, as net income (loss), calculated in accordance with GAAP, excluding depreciation and amortization related to real estate, gains and losses from the sale of certain real estate assets, gains and losses from change in control and impairment write-downs of certain real estate assets and investments in entities when the impairment is directly attributable to decreases in the value of depreciable real estate held by the entity. FFO is a widely recognized measure of REIT performance. Although FFO is a non-GAAP financial measure, the Company believes that information regarding FFO is helpful to shareholders and potential investors.
Funds From Operations, as Adjusted (FFO, as Adjusted) adjusts FFO to present an alternative measure of our operating performance, which, when applicable, excludes the impact of acquisition costs, straight-line rent, amortization of above-/below-market leases, amortization of deferred revenue (which results from landlord assets funded by tenants), non-cash interest expense, non-cash compensation, depreciation of non-real estate assets and other non-cash items. By excluding these income and expense items from FFO, as Adjusted, the Company believes it provides useful information as these items have no cash impact. In
3
| |
Supplemental Definitions |
|
|
addition, by excluding acquisition related costs the Company believes FFO, as Adjusted provides useful information that is comparable across periods and more accurately reflects the operating performance of the Company’s properties. Certain prior year amounts have been updated to conform to the current year FFO, as Adjusted definition.
Net Operating Income (NOI) and Cash NOI. NOI is calculated as net income adjusted to exclude depreciation and amortization, acquisition costs, corporate general and administrative costs, interest expense and gains or losses from sales of property. Cash NOI excludes from NOI straight-line rent, amortization of above-/below-market leases, and amortization of deferred revenue (which results from landlord assets funded by tenants). NOI and Cash NOI presented by the Company may not be comparable to NOI and Cash NOI reported by other REITs that define NOI and Cash NOI differently. The Company believes that NOI and Cash NOI provide investors with useful measures of the operating performance of our properties. NOI and Cash NOI should not be considered an alternative to net income as an indication of our performance or to cash flows as a measure of the Company's liquidity or its ability to make distributions. Certain prior year amounts have been updated to conform to the current year Cash NOI definition.
Net Debt and Adjusted Net Debt. Net Debt represents consolidated debt (reported in accordance with GAAP) adjusted to exclude unamortized premiums and discounts and deferred financing fees, less cash and cash equivalents. By excluding these items, the result provides an estimate of the contractual amount of borrowed capital to be repaid, net of cash available to repay it. The Company believes this calculation constitutes a beneficial supplemental non-GAAP financial disclosure to investors in understanding its financial condition. Adjusted Net Debt is Net Debt reduced by 1) for each project under construction or in design, the lesser of i) outstanding lump-sum reimbursement amounts and ii) the cost to date, 2) 40% times the amount by which the cost to date exceeds total lump-sum reimbursement amounts for each project under construction or in design and 3) outstanding lump-sum reimbursement amounts for projects previously completed. These adjustments are made to 1) remove the estimated portion of each project under construction, in design or previously completed that has been financed with debt which may be repaid with outstanding cost reimbursement payments from the US Government and 2) remove the estimated portion of each project under construction or in design, in excess of total lump-sum reimbursements, that has been financed with debt but has not yet produced earnings. See page 20 for further information. The Company’s method of calculating Net Debt and Adjusted Net Debt may be different from methods used by other REITs and, accordingly, may not be comparable to such other REITs.
4
| |
Table of Contents |
|
|
5
| |
Corporate Information and Analyst Coverage |
|
|
Corporate Information |
| | | |
Corporate Headquarters | Stock Exchange Listing | Information Requests | Investor Relations |
2001 K Street NW | New York Stock Exchange | Please contact ir@easterlyreit.com | Lindsay Winterhalter, |
Suite 775 North | | or 202-596-3947 to request an | VP, Investor Relations |
Washington, DC 20006 | Ticker | Investor Relations package | & Operations |
202-595-9500 | DEA | | |
Executive Team | | Board of Directors | |
William Trimble III, CEO | Darrell Crate, Chairman | William Binnie, Lead Independent Director | Emil Henry Jr. |
Michael Ibe, Vice-Chairman and EVP | Meghan Baivier, CFO & COO | Darrell Crate | Michael Ibe |
Mark Bauer, EVP | Ronald Kendall, EVP | Cynthia Fisher | Tara Innes |
Andrew Pulliam, EVP | | Scott Freeman | William Trimble III |
Equity Research Coverage | | |
| | |
Citigroup | Raymond James & Associates | RBC Capital Markets |
Michael Bilerman / Emmanuel Korchman | Bill Crow / Paul Puryear | Michael Carroll |
212-816-1383 / 212-816-1382 | 727-567-2594 / 727-567-2253 | 440-715-2649 |
| | |
Jefferies | Truist Securities | Compass Point Research & Trading, LLC |
Jonathan Petersen / Peter Abramowitz | Michael R. Lewis | Merrill Ross |
212-284-1705 / 212-336-7241 | 212-319-5659 | 202-534-1392 |
| | |
BMO Capital Markets | | |
John P. Kim | | |
212-885-4115 | | |
Any opinions, estimates, forecasts or predictions regarding Easterly Government Properties, Inc.’s performance made by these analysts are theirs alone and do not represent opinions, estimates, forecasts or predictions of Easterly Government Properties, Inc. or its management. Easterly Government Properties, Inc. does not by its reference above or distribution imply its endorsement of or concurrence with such opinions, estimates, forecasts or predictions.
6
| |
Executive Summary (In thousands, except share and per share amounts) |
|
|
| | | | | | | | | | | | | | | |
Outstanding Classes of Stock and Partnership Units - Fully Diluted Basis | | At June 30, 2021 | | | Earnings | | | Three months ended June 30, 2021 | | | Three months ended June 30, 2020 | |
Common shares | | | 83,856,350 | | | Net income available to Easterly Government Properties, Inc. | | $ | 8,201 | | | $ | 3,666 | |
Unvested restricted shares | | | 74,940 | | | Net income available to Easterly Government Properties, Inc. | | | | | | | | |
Common partnership and vested LTIP units | | | 11,268,691 | | | per share: | | | | | | | | | |
Total - fully diluted basis | | | 95,199,981 | | | Basic | | | $ | 0.10 | | | $ | 0.05 | |
| | | | | | Diluted | | | $ | 0.10 | | | $ | 0.05 | |
| | | | | | | | | | | | | | | |
Market Capitalization | | At June 30, 2021 | | | Net income | | | $ | 9,254 | | | $ | 4,163 | |
Price of Common Shares | | $ | 21.08 | | | Net income, per share - fully diluted basis | | | $ | 0.10 | | | $ | 0.05 | |
Total equity market capitalization - fully diluted basis | | $ | 2,006,816 | | | Funds From Operations (FFO) | | | $ | 31,226 | | | $ | 27,817 | |
Net Debt | | | 1,031,496 | | | FFO, per share - fully diluted basis | | | $ | 0.33 | | | $ | 0.32 | |
Total enterprise value | | $ | 3,038,312 | | | | | | | | | | | | |
| | | | | | FFO, as Adjusted | | | $ | 29,182 | | | $ | 27,022 | |
| | | | | | FFO, as Adjusted, per share - fully diluted basis | | | $ | 0.31 | | | $ | 0.31 | |
Ratios | | At June 30, 2021 | | | | | | | | | | | | |
Net debt to total enterprise value | | | 33.9 | % | | Cash Available for Distribution (CAD) | | | $ | 23,226 | | | $ | 23,397 | |
Net debt to annualized quarterly EBITDA | | | 6.3 | x | | | | | | | | | | | |
Adjusted Net Debt to annualized quarterly pro | | | | | | Liquidity | | | | | | | At June 30, 2021 | |
forma EBITDA | | | 6.2 | x | | Cash and cash equivalents | | | | | | | $ | 8,059 | |
Cash interest coverage ratio | | | 4.6 | x | | | | | | | | | | | |
Cash fixed charge coverage ratio | | | 4.1 | x | | Available under $450 million unsecured revolving credit facility(1) | | | $ | 312,750 | |
| | | | | | | | | | | | | | | |
(1)Revolving credit facility has an accordion feature that provides additional capacity, subject to the satisfaction of customary terms and conditions, of up to $250 million, for a total revolving credit facility size of not more than $700 million.
7
| |
Balance Sheets (Unaudited, in thousands, except share amounts) |
|
|
| | June 30, 2021 | | | December 31, 2020 | |
Assets | | | | | | | | |
Real estate properties, net | | $ | 2,284,295 | | | $ | 2,208,661 | |
Cash and cash equivalents | | | 8,059 | | | | 8,465 | |
Restricted cash | | | 6,619 | | | | 6,204 | |
Tenant accounts receivable | | | 48,742 | | | | 45,077 | |
Intangible assets, net | | | 161,187 | | | | 163,387 | |
Prepaid expenses and other assets | | | 34,663 | | | | 25,746 | |
Total assets | | $ | 2,543,565 | | | $ | 2,457,540 | |
| | | | | | | | |
Liabilities | | | | | | | | |
Revolving credit facility | | | 137,250 | | | | 79,250 | |
Term loan facilities, net | | | 249,148 | | | | 248,966 | |
Notes payable, net | | | 447,151 | | | | 447,171 | |
Mortgage notes payable, net | | | 201,049 | | | | 202,871 | |
Intangible liabilities, net | | | 22,129 | | | | 25,406 | |
Deferred revenue | | | 90,503 | | | | 92,576 | |
Interest rate swaps | | | 9,686 | | | | 12,781 | |
Accounts payable, accrued expenses, and other liabilities | | | 52,112 | | | | 48,549 | |
Total liabilities | | | 1,209,028 | | | | 1,157,570 | |
| | | | | | | | |
Equity | | | | | | | | |
Common stock, par value $0.01, 200,000,000 shares authorized, | | | | | | | | |
83,931,290 and 82,106,256 shares issued and outstanding at June 30, 2021 and December 31, 2020, respectively. | | | 839 | | | | 821 | |
Additional paid-in capital | | | 1,471,928 | | | | 1,424,787 | |
Retained earnings | | | 47,157 | | | | 31,965 | |
Cumulative dividends | | | (334,815 | ) | | | (291,652 | ) |
Accumulated other comprehensive loss | | | (8,539 | ) | | | (11,351 | ) |
Total stockholders' equity | | | 1,176,570 | | | | 1,154,570 | |
Non-controlling interest in Operating Partnership | | | 157,967 | | | | 145,400 | |
Total equity | | | 1,334,537 | | | | 1,299,970 | |
Total liabilities and equity | | $ | 2,543,565 | | | $ | 2,457,540 | |
8
| |
Income Statements (Unaudited, in thousands, except share and per share amounts) |
|
|
| | Three Months Ended | | | Six Months Ended | |
| | June 30, 2021 | | | June 30, 2020 | | | June 30, 2021 | | | June 30, 2020 | |
Revenues | | | | | | | | | | | | | | | | |
Rental income | | $ | 66,095 | | | $ | 59,550 | | | $ | 130,274 | | | $ | 116,133 | |
Tenant reimbursements | | | 1,899 | | | | 435 | | | | 2,219 | | | | 1,587 | |
Other income | | | 620 | | | | 541 | | | | 1,122 | | | | 1,024 | |
Total revenues | | | 68,614 | | | | 60,526 | | | | 133,615 | | | | 118,744 | |
| | | | | | | | | | | | | | | | |
Expenses | | | | | | | | | | | | | | | | |
Property operating | | | 14,296 | | | | 10,915 | | | | 26,390 | | | | 22,173 | |
Real estate taxes | | | 7,553 | | | | 6,617 | | | | 14,839 | | | | 13,179 | |
Depreciation and amortization | | | 22,525 | | | | 23,654 | | | | 44,850 | | | | 47,210 | |
Acquisition costs | | | 483 | | | | 668 | | | | 970 | | | | 1,206 | |
Corporate general and administrative | | | 5,768 | | | | 5,505 | | | | 11,576 | | | | 10,988 | |
Total expenses | | | 50,625 | | | | 47,359 | | | | 98,625 | | | | 94,756 | |
| | | | | | | | | | | | | | | | |
Other expense | | | | | | | | | | | | | | | | |
Interest expense, net | | | (9,265 | ) | | | (9,004 | ) | | | (18,386 | ) | | | (17,907 | ) |
Gain on the sale of operating property | | | 530 | | | | - | | | | 530 | | | | - | |
Net income | | | 9,254 | | | | 4,163 | | | | 17,134 | | | | 6,081 | |
| | | | | | | | | | | | | | | | |
Non-controlling interest in Operating Partnership | | | (1,053 | ) | | | (497 | ) | | | (1,942 | ) | | | (718 | ) |
Net income available to Easterly Government | | | | | | | | | | | | | | | | |
Properties, Inc. | | $ | 8,201 | | | $ | 3,666 | | | $ | 15,192 | | | $ | 5,363 | |
| | | | | | | | | | | | | | | | |
Net income available to Easterly Government | | | | | | | | | | | | | | | | |
Properties, Inc. per share: | | | | | | | | | | | | | | | | |
Basic | | $ | 0.10 | | | $ | 0.05 | | | $ | 0.18 | | | $ | 0.07 | |
Diluted | | $ | 0.10 | | | $ | 0.05 | | | $ | 0.18 | | | $ | 0.07 | |
| | | | | | | | | | | | | | | | |
Weighted-average common shares outstanding: | | | | | | | | | | | | | | | | |
Basic | | | 83,817,680 | | | | 76,171,627 | | | | 82,973,705 | | | | 75,532,169 | |
Diluted | | | 84,247,285 | | | | 76,869,965 | | | | 83,398,931 | | | | 76,185,277 | |
| | | | | | | | | | | | | | | | |
Net income, per share - fully diluted basis | | $ | 0.10 | | | $ | 0.05 | | | $ | 0.18 | | | $ | 0.07 | |
| | | | | | | | | | | | | | | | |
Weighted average common shares outstanding - | | | | | | | | | | | | | | | | |
fully diluted basis | | | 94,664,559 | | | | 86,766,753 | | | | 93,662,392 | | | | 85,750,924 | |
9
| |
Net Operating Income (Unaudited, in thousands) |
|
|
| | | | | | | | | | | | | | | | | |
| | | Three Months Ended | | | Six Months Ended | |
| | | June 30, 2021 | | | June 30, 2020 | | | June 30, 2021 | | | June 30, 2020 | |
| | | | | | | | | | | | | | | | | |
| Net income | | $ | 9,254 | | | $ | 4,163 | | | $ | 17,134 | | | $ | 6,081 | |
| Depreciation and amortization | | | 22,525 | | | | 23,654 | | | | 44,850 | | | | 47,210 | |
| Acquisition costs | | | 483 | | | | 668 | | | | 970 | | | | 1,206 | |
| Corporate general and administrative | | | 5,768 | | | | 5,505 | | | | 11,576 | | | | 10,988 | |
| Interest expense | | | 9,265 | | | | 9,004 | | | | 18,386 | | | | 17,907 | |
| Gain on the sale of operating property | | | (530 | ) | | | - | | | | (530 | ) | | | - | |
| Net Operating Income | | | 46,765 | | | | 42,994 | | | | 92,386 | | | | 83,392 | |
| Adjustments to Net Operating Income: | | | | | | | | | | | | | | | | |
| Straight-line rent and other non-cash adjustments | | | (1,406 | ) | | | (606 | ) | | | (2,799 | ) | | | (1,304 | ) |
| Amortization of above-/below-market leases | | | (1,225 | ) | | | (1,527 | ) | | | (2,511 | ) | | | (3,048 | ) |
| Amortization of deferred revenue | | | (1,398 | ) | | | (697 | ) | | | (2,819 | ) | | | (1,394 | ) |
| Cash Net Operating Income | | $ | 42,736 | | | $ | 40,164 | | | $ | 84,257 | | | $ | 77,646 | |
| | | | | | | | | | | | | | | | | |
10
| |
EBITDA, FFO and CAD (Unaudited, in thousands, except share and per share amounts) |
|
|
| | Three Months Ended | | | Six Months Ended | |
| | June 30, 2021 | | | June 30, 2020 | | | June 30, 2021 | | | June 30, 2020 | |
Net income | | $ | 9,254 | | | $ | 4,163 | | | $ | 17,134 | | | $ | 6,081 | |
Depreciation and amortization | | | 22,525 | | | | 23,654 | | | | 44,850 | | | | 47,210 | |
Interest expense | | | 9,265 | | | | 9,004 | | | | 18,386 | | | | 17,907 | |
Tax expense | | | 177 | | | | 177 | | | | 311 | | | | 266 | |
Gain on the sale of operating property | | | (530 | ) | | | - | | | | (530 | ) | | | - | |
EBITDA | | $ | 40,691 | | | $ | 36,998 | | | $ | 80,151 | | | $ | 71,464 | |
| | | | | | | | | | | | | | | | |
Pro forma adjustments(1) | | | 301 | | | | | | | | | | | | | |
Pro forma EBITDA | | $ | 40,992 | | | | | | | | | | | | | |
| | | | | | | | | | | | | | | | |
Net income | | $ | 9,254 | | | $ | 4,163 | | | $ | 17,134 | | | $ | 6,081 | |
Depreciation of real estate assets | | | 22,502 | | | | 23,654 | | | | 44,820 | | | | 47,210 | |
Gain on the sale of operating property | | | (530 | ) | | | - | | | | (530 | ) | | | - | |
FFO | | $ | 31,226 | | | $ | 27,817 | | | $ | 61,424 | | | $ | 53,291 | |
Adjustments to FFO: | | | | | | | | | | | | | | | | |
Acquisition costs | | | 483 | | | | 668 | | | | 970 | | | | 1,206 | |
Straight-line rent and other non-cash adjustments | | | (1,324 | ) | | | (620 | ) | | | (2,737 | ) | | | (1,329 | ) |
Amortization of above-/below-market leases | | | (1,225 | ) | | | (1,527 | ) | | | (2,511 | ) | | | (3,048 | ) |
Amortization of deferred revenue | | | (1,398 | ) | | | (697 | ) | | | (2,819 | ) | | | (1,394 | ) |
Non-cash interest expense | | | 364 | | | | 360 | | | | 727 | | | | 718 | |
Non-cash compensation | | | 1,033 | | | | 1,021 | | | | 2,367 | | | | 2,021 | |
Depreciation of non-real estate assets | | | 23 | | | | - | | | | 30 | | | | - | |
FFO, as Adjusted | | $ | 29,182 | | | $ | 27,022 | | | $ | 57,451 | | | $ | 51,465 | |
| | | | | | | | | | | | | | | | |
| | | | | | | | | | | | | | | | |
FFO, per share - fully diluted basis | | $ | 0.33 | | | $ | 0.32 | | | $ | 0.66 | | | $ | 0.62 | |
FFO, as Adjusted, per share - fully diluted basis | | $ | 0.31 | | | $ | 0.31 | | | $ | 0.61 | | | $ | 0.60 | |
| | | | | | | | | | | | | | | | |
FFO, as Adjusted | | $ | 29,182 | | | $ | 27,022 | | | $ | 57,451 | | | $ | 51,465 | |
Acquisition costs | | | (483 | ) | | | (668 | ) | | | (970 | ) | | | (1,206 | ) |
Principal amortization | | | (946 | ) | | | (878 | ) | | | (1,886 | ) | | | (1,748 | ) |
Maintenance capital expenditures | | | (3,762 | ) | | | (1,646 | ) | | | (5,012 | ) | | | (2,523 | ) |
Contractual tenant improvements | | | (765 | ) | | | (433 | ) | | | (1,927 | ) | | | (758 | ) |
Cash Available for Distribution (CAD) | | $ | 23,226 | | | $ | 23,397 | | | $ | 47,656 | | | $ | 45,230 | |
| | | | | | | | | | | | | | | | |
Weighted average common shares outstanding - | | | | | | | | | | | | | | | | |
fully diluted basis | | | 94,664,559 | | | | 86,766,753 | | | | 93,662,392 | | | | 85,750,924 | |
(1)Pro forma assuming a full quarter of operations from the two properties acquired in the second quarter of 2021.
11
| |
Debt Schedules (Unaudited, in thousands) |
|
|
Debt Instrument | Maturity Date | | | June 30, 2021 Interest Rate | | June 30, 2021 Balance(1) | | June 30, 2021 Percent of Total Indebtedness | |
Unsecured debt | | | | | | | | | | | | | |
Revolving Credit facility | 18-Jun-22(2) | | | LIBOR + 130bps | | $ | 137,250 | | 13.2% | |
2016 Term Loan facility | 29-Mar-24 | | | 2.67%(3) | | | 100,000 | | 9.6% | |
2018 Term Loan facility | 19-Jun-23 | | | 3.96%(4) | | | 150,000 | | 14.4% | |
2017 Series A Senior Notes | 25-May-27 | | | 4.05% | | | 95,000 | | 9.1% | |
2017 Series B Senior Notes | 25-May-29 | | | 4.15% | | | 50,000 | | 4.8% | |
2017 Series C Senior Notes | 25-May-32 | | | 4.30% | | | 30,000 | | 2.9% | |
2019 Series A Senior Notes | 12-Sep-29 | | | 3.73% | | | 85,000 | | 8.2% | |
2019 Series B Senior Notes | 12-Sep-31 | | | 3.83% | | | 100,000 | | 9.6% | |
2019 Series C Senior Notes | 12-Sep-34 | | | 3.98% | | | 90,000 | | 8.7% | |
Total unsecured debt | 5.8 years | | | 3.38% | | $ | 837,250 | | 80.5% | |
| (wtd-avg maturity) | | | (wtd-avg rate) | | | | | | | |
| | | | | | | | | | | | | |
Secured mortgage debt | | | | | | | | | | | | | |
DEA - Pleasanton | 18-Oct-23 | | | LIBOR + 150bps | | $ | 15,700 | | 1.5% | |
VA - Golden | 1-Apr-24 | | | 5.00% | | | 8,922 | | 0.9% | |
MEPCOM - Jacksonville | 14-Oct-25 | | | 4.41% | | | 7,351 | | 0.7% | |
USFS II - Albuquerque | 14-Jul-26 | | | 4.46% | | | 15,738 | | 1.5% | |
ICE - Charleston | 15-Jan-27 | | | 4.21% | | | 15,494 | | 1.5% | |
VA - Loma Linda | 6-Jul-27 | | | 3.59% | | | 127,500 | | 12.3% | |
CBP - Savannah | 10-Jul-33 | | | 3.40% | | | 11,600 | | 1.1% | |
Total secured mortgage debt | 5.8 years | | | 3.63% | | $ | 202,305 | | 19.5% | |
| (wtd-avg maturity) | | | (wtd-avg rate) | | | | | | | |
| | | | | | | | | | | | | |
| | | | | | | | | | | | | |
Debt Statistics | June 30, 2021 | | | | | | | | | June 30, 2021 | |
Variable rate debt - unhedged | $ | 152,950 | | | % Variable rate debt - unhedged | | | 14.7 | % |
Fixed rate debt | | 886,605 | | | % Fixed rate debt | | | 85.3 | % |
Total Debt(1) | $ | 1,039,555 | | | | | | | | | | | |
Less: cash and cash equivalents | | (8,059 | ) | | Weighted average maturity | | 5.8 years | |
Net Debt | $ | 1,031,496 | | | Weighted average interest rate | | | 3.4 | % |
Less: adjustment for development projects(5) | | (11,645 | ) | | | | | | | | | | |
Adjusted Net Debt | $ | 1,019,851 | | | | | | | | | | | |
(1)Excludes unamortized premiums / discounts and deferred financing fees.
(2)Revolving credit facility has two six-month as-of-right extension options, subject to certain conditions and the payment of an extension fee.
(3)Calculated based on two interest rate swaps with an aggregate notional value of $100.0 million, which effectively fix the interest rate at 2.67% annually based on the Company’s current leverage ratio.
(4)Calculated based on four interest rate swaps with an aggregate notional value of $150.0 million, which effectively fix the interest rate at 3.96% annually based on the Company’s current leverage ratio.
(5)See definition of Adjusted Net Debt on Page 4.
12
| |
Debt Maturities (Unaudited, in thousands) |
|
|
| | Secured Debt | | | Unsecured Debt | | | | | | | | | | | | | |
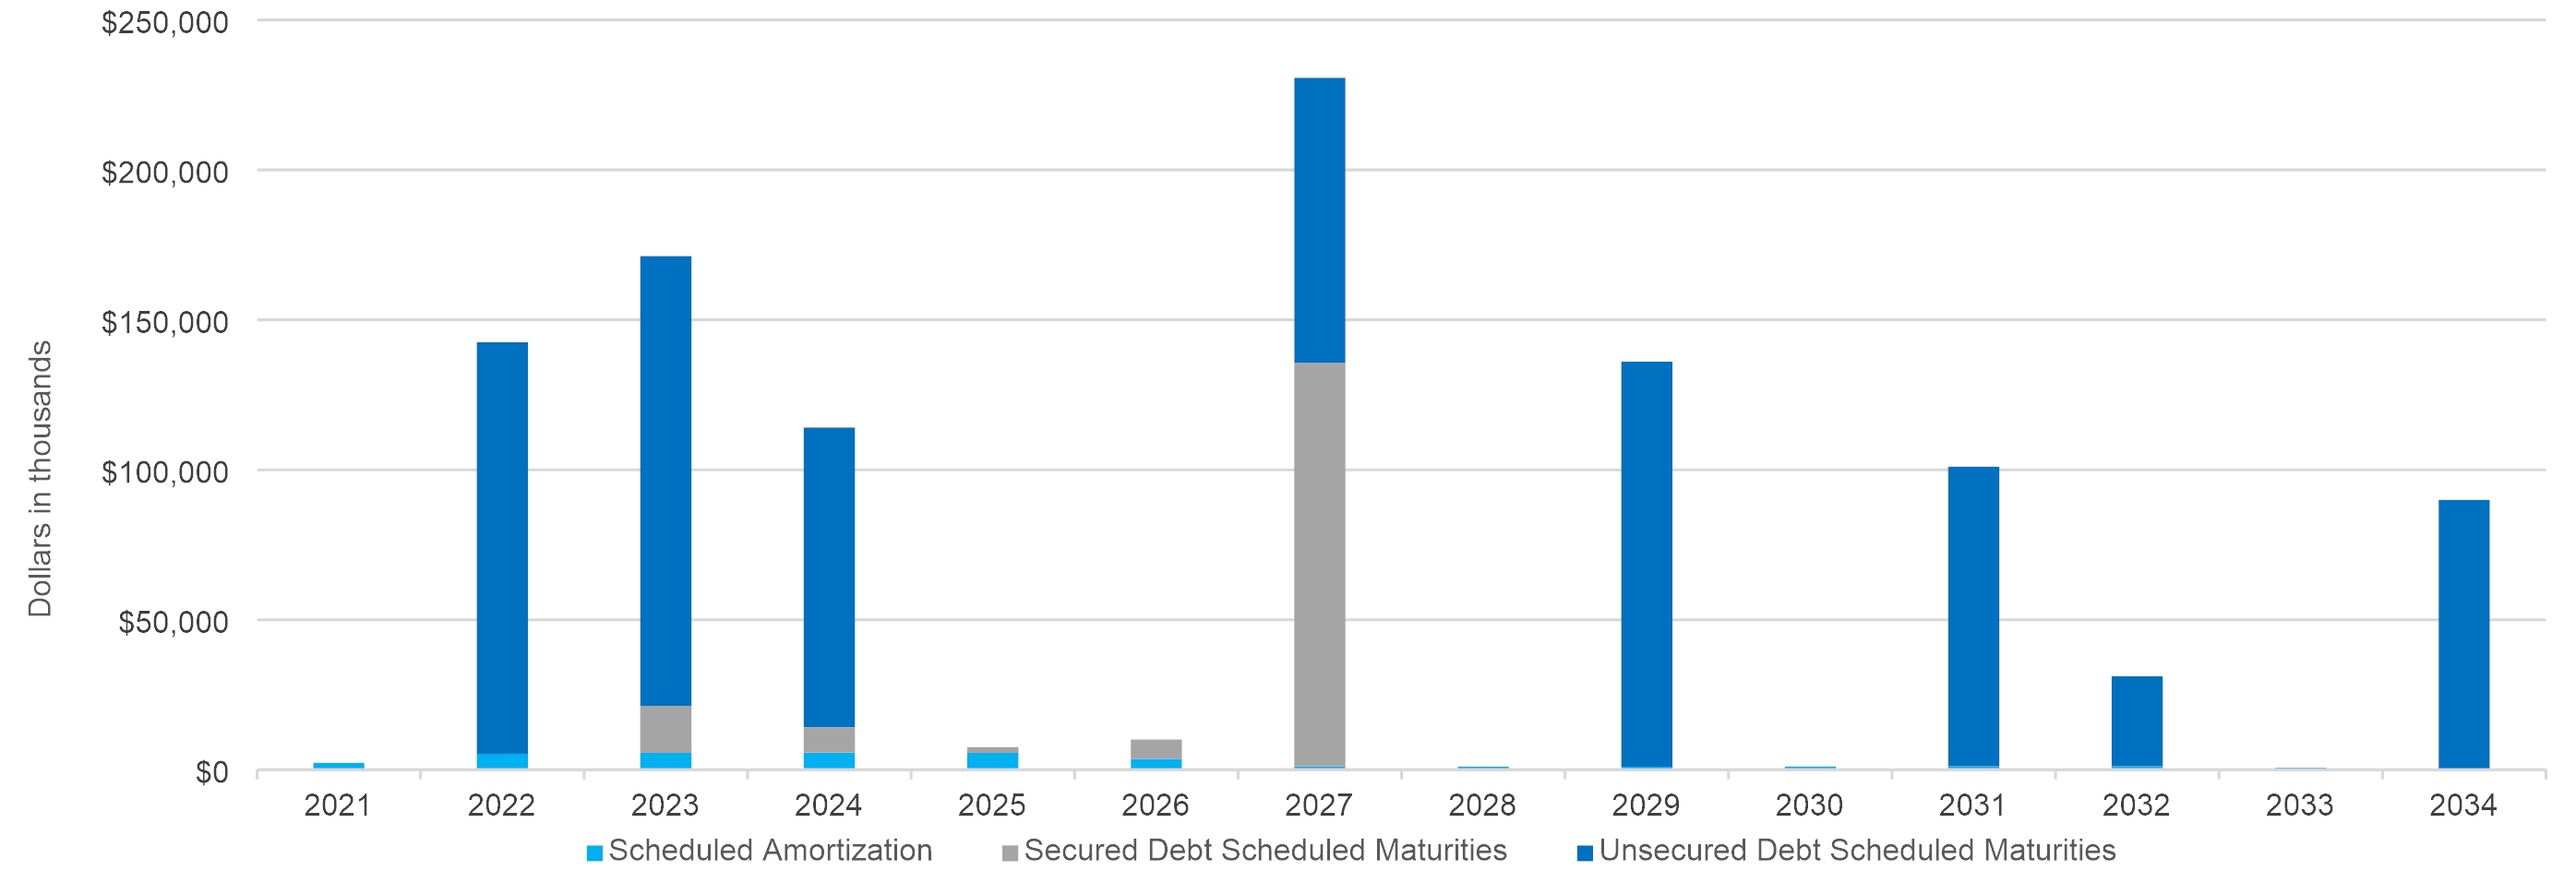
Year | | Scheduled Amortization | | | Scheduled Maturities | | | Scheduled Maturities | | | Total | | | Percentage of Debt Maturing | | | Weighted Average Interest Rate of Scheduled Maturities | |
2021 | | | 2,346 | | | | - | | | | - | | | | 2,346 | | | | 0.2 | % | | - | |
2022 | | | 5,297 | | | | - | | | | 137,250 | | | | 142,547 | | | | 13.7 | % | | | 1.39 | % |
2023 | | | 5,586 | | | | 15,700 | | | | 150,000 | | | | 171,286 | | | | 16.5 | % | | | 3.74 | % |
2024 | | | 5,731 | | | | 8,395 | | | | 100,000 | | | | 114,126 | | | | 11.0 | % | | | 2.86 | % |
2025 | | | 5,633 | | | | 1,917 | | | | - | | | | 7,550 | | | | 0.7 | % | | | 4.41 | % |
2026 | | | 3,686 | | | | 6,368 | | | | - | | | | 10,054 | | | | 1.0 | % | | | 4.46 | % |
2027 | | | 1,093 | | | | 134,640 | | | | 95,000 | | | | 230,733 | | | | 22.2 | % | | | 3.81 | % |
2028 | | | 983 | | | | - | | | | - | | | | 983 | | | | 0.1 | % | | - | |
2029 | | | 1,016 | | | | - | | | | 135,000 | | | | 136,016 | | | | 13.1 | % | | | 3.89 | % |
2030 | | | 1,049 | | | | - | | | | - | | | | 1,049 | | | | 0.1 | % | | - | |
2031 | | | 1,081 | | | | - | | | | 100,000 | | | | 101,081 | | | | 9.7 | % | | | 3.83 | % |
2032 | | | 1,116 | | | | - | | | | 30,000 | | | | 31,116 | | | | 3.0 | % | | | 4.30 | % |
2033 | | | 668 | | | | - | | | | - | | | | 668 | | | | 0.1 | % | | - | |
2034 | | | - | | | | - | | | | 90,000 | | | | 90,000 | | | | 8.6 | % | | | 3.98 | % |
Total | | $ | 35,285 | | | $ | 167,020 | | | $ | 837,250 | | | $ | 1,039,555 | | | | 100.0 | % | | | | |
13
| |
Leased Operating Property Overview (As of June 30, 2021, unaudited) |
|
|
Property Name | | Location | | Property Type | | Tenant Lease Expiration Year | | Year Built / Renovated | | Leased Square Feet | | | Annualized Lease Income | | | Percentage of Total Annualized Lease Income | | | Annualized Lease Income per Leased Square Foot | |
| | | | | | | | | | | | | | | | | | | | | | | | |
U.S. Government Leased Properties | |
VA - Loma Linda | | Loma Linda, CA | | Outpatient Clinic | | 2036 | | 2016 | | | 327,614 | | | $ | 16,388,079 | | | | 6.4 | % | | $ | 50.02 | |
Various GSA - Buffalo | | Buffalo, NY | | Office | | 2021 - 2025(1) | | 2004 | | | 266,668 | | | | 8,526,101 | | | | 3.3 | % | | | 31.97 | |
JSC - Suffolk | | Suffolk, VA | | Office | | 2028(2) | | 1993 / 2004 | | | 403,737 | | | | 8,181,271 | | | | 3.2 | % | | | 20.26 | |
IRS - Fresno | | Fresno, CA | | Office | | 2033 | | 2003 | | | 180,481 | | | | 6,975,024 | | | | 2.7 | % | | | 38.65 | |
FBI - Salt Lake | | Salt Lake City, UT | | Office | | 2032 | | 2012 | | | 169,542 | | | | 6,796,457 | | | | 2.7 | % | | | 40.09 | |
Various GSA - Chicago | | Des Plaines, IL | | Office | | 2023 | | 1971 / 1999 | | | 202,185 | | | | 6,513,508 | | | | 2.5 | % | | | 32.22 | |
Various GSA - Portland | | Portland, OR | | Office | | 2022 - 2028(3) | | 2002 | | | 211,156 | | | | 6,464,541 | | | | 2.5 | % | | | 30.62 | |
PTO - Arlington | | Arlington, VA | | Office | | 2035 | | 2009 | | | 190,546 | | | | 6,188,039 | | | | 2.4 | % | | | 32.48 | |
VA - San Jose | | San Jose, CA | | Outpatient Clinic | | 2038 | | 2018 | | | 90,085 | | | | 5,856,687 | | | | 2.3 | % | | | 65.01 | |
EPA - Lenexa | | Lenexa, KS | | Office | | 2027(2) | | 2007 / 2012 | | | 169,585 | | | | 5,541,749 | | | | 2.2 | % | | | 32.68 | |
FBI - San Antonio | | San Antonio, TX | | Office | | 2021 | | 2007 | | | 148,584 | | | | 5,185,319 | | | | 2.0 | % | | | 34.90 | |
FEMA - Tracy | | Tracy, CA | | Warehouse | | 2038 | | 2018 | | | 210,373 | | | | 4,610,303 | | | | 1.8 | % | | | 21.91 | |
FDA - Alameda | | Alameda, CA | | Laboratory | | 2039 | | 2019 | | | 69,624 | | | | 4,561,039 | | | | 1.8 | % | | | 65.51 | |
FBI - Omaha | | Omaha, NE | | Office | | 2024 | | 2009 | | | 112,196 | | | | 4,424,959 | | | | 1.7 | % | | | 39.44 | |
TREAS - Parkersburg | | Parkersburg, WV | | Office | | 2041 | | 2004 / 2006 | | | 182,500 | | | | 4,250,040 | | | | 1.7 | % | | | 23.29 | |
EPA - Kansas City | | Kansas City, KS | | Laboratory | | 2023 | | 2003 | | | 71,979 | | | | 4,226,457 | | | | 1.6 | % | | | 58.72 | |
VA - South Bend | | Mishakawa, IN | | Outpatient Clinic | | 2032 | | 2017 | | | 86,363 | | | | 4,054,515 | | | | 1.6 | % | | | 46.95 | |
FBI / DEA - El Paso | | El Paso, TX | | Office/Warehouse | | 2028 | | 1998 - 2005 | | | 203,269 | | | | 4,046,258 | | | | 1.6 | % | | | 19.91 | |
ICE - Charleston | | North Charleston, SC | | Office | | 2022 / 2027 | | 1994 / 2012 | | | 86,733 | | | | 3,905,879 | | | | 1.5 | % | | | 45.03 | |
FDA - Lenexa | | Lenexa, KS | | Laboratory | | 2040 | | 2020 | | | 59,690 | | | | 3,889,133 | | | | 1.5 | % | | | 65.16 | |
USCIS - Lincoln | | Lincoln, NE | | Office | | 2025 | | 2005 | | | 137,671 | | | | 3,814,290 | | | | 1.5 | % | | | 27.71 | |
VA - Mobile | | Mobile, AL | | Outpatient Clinic | | 2033 | | 2018 | | | 79,212 | | | | 3,796,474 | | | | 1.5 | % | | | 47.93 | |
DOI - Billings | | Billings, MT | | Office/Warehouse | | 2033 | | 2013 | | | 149,110 | | | | 3,774,594 | | | | 1.5 | % | | | 25.31 | |
FBI - Birmingham | | Birmingham, AL | | Office | | 2022 | | 2005 | | | 96,278 | | | | 3,683,969 | | | | 1.4 | % | | | 38.26 | |
FBI - Pittsburgh | | Pittsburgh, PA | | Office | | 2027 | | 2001 | | | 100,054 | | | | 3,672,014 | | | | 1.4 | % | | | 36.70 | |
FBI - New Orleans | | New Orleans, LA | | Office | | 2029(4) | | 1999 / 2006 | | | 137,679 | | | | 3,578,341 | | | | 1.4 | % | | | 25.99 | |
DOT - Lakewood | | Lakewood, CO | | Office | | 2024 | | 2004 | | | 122,225 | | | | 3,489,124 | | | | 1.4 | % | | | 28.55 | |
FBI - Knoxville | | Knoxville, TN | | Office | | 2025 | | 2010 | | | 99,130 | | | | 3,459,600 | | | | 1.3 | % | | | 34.90 | |
VA - Chico | | Chico, CA | | Outpatient Clinic | | 2034 | | 2019 | | | 51,647 | | | | 3,221,867 | | | | 1.3 | % | | | 62.38 | |
USFS II - Albuquerque | | Albuquerque, NM | | Office | | 2026(2) | | 2011 | | | 98,720 | | | | 3,063,160 | | | | 1.2 | % | | | 31.03 | |
FBI - Richmond | | Richmond, VA | | Office | | 2041 | | 2001 | | | 96,607 | | | | 3,047,997 | | | | 1.2 | % | | | 31.55 | |
OSHA - Sandy | | Sandy, UT | | Laboratory | | 2024(5) | | 2003 | | | 75,000 | | | | 3,013,567 | | | | 1.2 | % | | | 40.18 | |
FDA - College Park | | College Park, MD | | Laboratory | | 2029 | | 2004 | | | 80,677 | | | | 3,012,658 | | | | 1.2 | % | | | 37.34 | |
USCIS - Tustin | | Tustin, CA | | Office | | 2034 | | 1979 / 2019 | | | 66,818 | | | | 3,005,995 | | | | 1.2 | % | | | 44.99 | |
USFS I - Albuquerque | | Albuquerque, NM | | Office | | 2026 | | 2006 | | | 92,455 | | | | 2,999,662 | | | | 1.2 | % | | | 32.44 | |
DEA - Vista | | Vista, CA | | Laboratory | | 2021 | | 2002 | | | 54,119 | | | | 2,822,558 | | | | 1.1 | % | | | 52.15 | |
ICE - Albuquerque | | Albuquerque, NM | | Office | | 2027 | | 2011 | | | 71,100 | | | | 2,752,678 | | | | 1.1 | % | | | 38.72 | |
JUD - Del Rio | | Del Rio, TX | | Courthouse/Office | | 2024 | | 1992 / 2004 | | | 89,880 | | | | 2,718,710 | | | | 1.1 | % | | | 30.25 | |
14
| |
Leased Operating Property Overview (Cont.) (As of June 30, 2021, unaudited) |
|
|
Property Name | | Location | | Property Type | | Tenant Lease Expiration Year | | Year Built / Renovated | | Leased Square Feet | | | Annualized Lease Income | | | Percentage of Total Annualized Lease Income | | | Annualized Lease Income per Leased Square Foot | |
| | | | | | | | | | | | | | | | | | | | | | | | |
U.S. Government Leased Properties (Cont.) | |
VA - Orange(6) | | Orange, CT | | Outpatient Clinic | | 2034 | | 2019 | | | 56,330 | | | | 2,693,892 | | | | 1.1 | % | | | 47.82 | |
DEA - Pleasanton | | Pleasanton, CA | | Laboratory | | 2035 | | 2015 | | | 42,480 | | | | 2,688,502 | | | | 1.0 | % | | | 63.29 | |
JUD - El Centro | | El Centro, CA | | Courthouse/Office | | 2034 | | 2004 | | | 43,345 | | | | 2,663,767 | | | | 1.0 | % | | | 61.46 | |
FBI - Mobile | | Mobile, AL | | Office | | 2029(2) | | 2001 | | | 76,112 | | | | 2,639,933 | | | | 1.0 | % | | | 34.68 | |
SSA - Charleston | | Charleston, WV | | Office | | 2024(2) | | 1959 / 2000 | | | 110,000 | | | | 2,604,011 | | | | 1.0 | % | | | 23.67 | |
DEA - Sterling | | Sterling, VA | | Laboratory | | 2036 | | 2001 | | | 49,692 | | | | 2,575,432 | | | | 1.0 | % | | | 51.83 | |
FBI - Albany | | Albany, NY | | Office | | 2036 | | 1998 | | | 98,184 | | | | 2,542,517 | | | | 1.0 | % | | | 25.90 | |
USAO - Louisville | | Louisville, KY | | Office | | 2031 | | 2011 | | | 60,000 | | | | 2,451,797 | | | | 1.0 | % | | | 40.86 | |
TREAS - Birmingham | | Birmingham, AL | | Office | | 2029 | | 2014 | | | 83,676 | | | | 2,449,143 | | | | 1.0 | % | | | 29.27 | |
DEA - Dallas Lab | | Dallas, TX | | Laboratory | | 2021 | | 2001 | | | 49,723 | | | | 2,414,199 | | | | 0.9 | % | | | 48.55 | |
DHA - Aurora | | Aurora, CO | | Office | | 2034 | | 1998 / 2018 | | | 101,285 | | | | 2,340,112 | | | | 0.9 | % | | | 23.10 | |
JUD - Charleston | | Charleston, SC | | Courthouse/Office | | 2040 | | 1999 | | | 52,339 | | | | 2,333,282 | | | | 0.9 | % | | | 44.58 | |
DEA - Upper Marlboro | | Upper Marlboro, MD | | Laboratory | | 2037 | | 2002 | | | 50,978 | | | | 2,299,013 | | | | 0.9 | % | | | 45.10 | |
FBI - Little Rock | | Little Rock, AR | | Office | | 2021 | | 2001 | | | 102,377 | | | | 2,271,725 | | | | 0.9 | % | | | 22.19 | |
MEPCOM - Jacksonville | | Jacksonville, FL | | Office | | 2025 | | 2010 | | | 30,000 | | | | 2,204,839 | | | | 0.9 | % | | | 73.49 | |
DEA - Dallas | | Dallas, TX | | Office | | 2041 | | 2001 | | | 71,827 | | | | 2,175,689 | | | | 0.8 | % | | | 30.29 | |
CBP - Savannah | | Savannah, GA | | Laboratory | | 2033 | | 2013 | | | 35,000 | | | | 2,171,087 | | | | 0.8 | % | | | 62.03 | |
DOE - Lakewood | | Lakewood, CO | | Office | | 2029 | | 1999 | | | 115,650 | | | | 2,093,583 | | | | 0.8 | % | | | 18.10 | |
NWS - Kansas City | | Kansas City, MO | | Office | | 2033(2) | | 1998 / 2020 | | | 94,378 | | | | 2,077,157 | | | | 0.8 | % | | | 22.01 | |
JUD - Jackson | | Jackson, TN | | Courthouse/Office | | 2023(2) | | 1998 | | | 73,397 | | | | 2,051,666 | | | | 0.8 | % | | | 27.95 | |
DEA - Santa Ana | | Santa Ana, CA | | Office | | 2024 | | 2004 | | | 39,905 | | | | 1,896,619 | | | | 0.7 | % | | | 47.53 | |
ICE - Otay | | San Diego, CA | | Office | | 2022 / 2026 | | 2001 | | | 49,457 | | | | 1,780,658 | | | | 0.7 | % | | | 36.00 | |
NPS - Omaha | | Omaha, NE | | Office | | 2024 | | 2004 | | | 62,772 | | | | 1,766,700 | | | | 0.7 | % | | | 28.14 | |
VA - Golden | | Golden, CO | | Office/Warehouse | | 2026 | | 1996 / 2011 | | | 56,753 | | | | 1,755,455 | | | | 0.7 | % | | | 30.93 | |
CBP - Sunburst | | Sunburst, MT | | Office | | 2028 | | 2008 | | | 33,000 | | | | 1,631,438 | | | | 0.6 | % | | | 49.44 | |
USCG - Martinsburg | | Martinsburg, WV | | Office | | 2027 | | 2007 | | | 59,547 | | | | 1,610,513 | | | | 0.6 | % | | | 27.05 | |
DEA - Birmingham | | Birmingham, AL | | Office | | 2021 | | 2005 | | | 35,616 | | | | 1,540,180 | | | | 0.6 | % | | | 43.24 | |
JUD - Aberdeen | | Aberdeen, MS | | Courthouse/Office | | 2025 | | 2005 | | | 46,979 | | | | 1,505,573 | | | | 0.6 | % | | | 32.05 | |
GSA - Clarksburg | | Clarksburg, WV | | Office | | 2024(2) | | 1999 | | | 63,750 | | | | 1,473,177 | | | | 0.6 | % | | | 23.11 | |
DEA - North Highlands | | Sacramento, CA | | Office | | 2033 | | 2002 | | | 37,975 | | | | 1,461,610 | | | | 0.6 | % | | | 38.49 | |
USAO - Springfield | | Springfield, IL | | Office | | 2038 | | 2002 | | | 43,600 | | | | 1,408,624 | | | | 0.5 | % | | | 32.31 | |
VA - Charleston | | North Charleston, SC | | Warehouse | | 2040 | | 2020 | | | 97,718 | | | | 1,383,687 | | | | 0.5 | % | | | 14.16 | |
DEA - Albany | | Albany, NY | | Office | | 2025 | | 2004 | | | 31,976 | | | | 1,360,564 | | | | 0.5 | % | | | 42.55 | |
DEA - Riverside | | Riverside, CA | | Office | | 2032 | | 1997 | | | 34,354 | | | | 1,254,927 | | | | 0.5 | % | | | 36.53 | |
SSA - Dallas | | Dallas, TX | | Office | | 2035 | | 2005 | | | 27,200 | | | | 977,296 | | | | 0.4 | % | | | 35.93 | |
HRSA - Baton Rouge | | Baton Rouge, LA | | Office | | 2040 | | 1981 / 2020 | | | 27,569 | | | | 838,276 | | | | 0.3 | % | | | 30.41 | |
15
| |
Leased Operating Property Overview (Cont.) (As of June 30, 2021, unaudited) |
|
|
Property Name | | Location | | Property Type | | Tenant Lease Expiration Year | | Year Built / Renovated | | Leased Square Feet | | | Annualized Lease Income | | | Percentage of Total Annualized Lease Income | | | Annualized Lease Income per Leased Square Foot | |
| | | | | | | | | | | | | | | | | | | | | | | | |
U.S. Government Leased Properties (Cont.) | |
ICE - Pittsburgh | | Pittsburgh, PA | | Office | | 2023 / 2032(7) | | 2004 | | | 25,245 | | | | 803,823 | | | | 0.3 | % | | | 31.84 | |
JUD - South Bend | | South Bend, IN | | Courthouse/Office | | 2027 | | 1996 / 2011 | | | 30,119 | | | | 796,555 | | | | 0.3 | % | | | 26.45 | |
VA - Baton Rouge | | Baton Rouge, LA | | Outpatient Clinic | | 2024 | | 2004 | | | 30,000 | | | | 793,356 | | | | 0.3 | % | | | 26.45 | |
ICE - Louisville | | Louisville, KY | | Office | | 2021 | | 2011 | | | 17,420 | | | | 713,912 | | | | 0.3 | % | | | 40.98 | |
DEA - San Diego | | San Diego, CA | | Warehouse | | 2032 | | 1999 | | | 16,100 | | | | 542,753 | | | | 0.2 | % | | | 33.71 | |
SSA - San Diego | | San Diego, CA | | Office | | 2032 | | 2003 | | | 10,059 | | | | 423,446 | | | | 0.2 | % | | | 42.10 | |
DEA - Bakersfield | | Bakersfield, CA | | Office | | 2038 | | 2000 | | | 9,800 | | | | 389,559 | | | | 0.2 | % | | | 39.75 | |
Subtotal | | | | | | | | | | | 7,424,979 | | | $ | 255,362,663 | | | | 99.6 | % | | $ | 34.39 | |
| | | | | | | | | | | | | | | | | | | | | | | | |
Privately Leased Properties | | | | | | | | | | | | | | | | | | | | | | | | |
5998 Osceola Court - United Technologies | | Midland, GA | | Warehouse/Manufacturing | | 2023(8) | | 2014 | | | 105,641 | | | | 543,818 | | | | 0.2 | % | | | 5.15 | |
501 East Hunter Street - Lummus Corporation | | Lubbock, TX | | Warehouse/Distribution | | 2028(5) | | 2013 | | | 70,078 | | | | 410,157 | | | | 0.2 | % | | | 5.85 | |
Subtotal | | | | | | | | | | | 175,719 | | | $ | 953,975 | | | | 0.4 | % | | $ | 5.43 | |
| | | | | | | | | | | | | | | | | | | | | | | | |
Total / Weighted Average | | | | | | | | | | | 7,600,698 | | | $ | 256,316,638 | | | | 100.0 | % | | $ | 33.72 | |
(1)14,274 square feet leased to a private tenant will expire on September 30, 2021 and contains one five-year renewal option.
(2)Lease contains one five-year renewal option.
(3)37,811 square feet leased to the U.S. Army Corps of Engineers ("ACOE") will expire on February 19, 2025 and contains two five-year renewal options. 21,646 square feet leased to the Federal Bureau of Investigation ("FBI") will expire on December 31, 2024 and contains two five-year renewal options. 10,299 square feet leased to three private tenants will expire between 2022-2025 and all contain one five-year renewal option. 4,846 square feet leased to the Department of Energy ("DOE") will expire on April 14, 2023 and contains two five-year renewal options.
(4)Lease contains one ten-year renewal option.
(5)Lease contains two five-year renewal options.
(6)Previously named VA - Northeast.
(7)21,391 square feet leased to the U.S. Immigration and Customs Enforcement ("ICE") will expire on February 28, 2022 and contains one three-year renewal option.
(8)Lease contains three five-year renewal options.
16
| |
Tenants (As of June 30, 2021, unaudited) |
|
|
Tenant | | Weighted Average Remaining Lease Term(1) | | | Leased Square Feet | | | Percentage of Leased Square Feet | | | Annualized Lease Income | | | Percentage of Total Annualized Lease Income | |
| | | | | | | | | | | | | | | | | | | | |
U.S. Government | | | | | | | | | | | | | | | | | | | | |
Federal Bureau of Investigation ("FBI") | | | 6.8 | | | | 1,392,014 | | | | 18.4 | % | | $ | 44,570,339 | | | | 17.3 | % |
Department of Veteran Affairs ("VA") | | | 12.3 | | | | 979,979 | | | | 12.9 | % | | | 43,323,049 | | | | 16.9 | % |
Drug Enforcement Administration ("DEA") | | | 9.2 | | | | 603,323 | | | | 7.9 | % | | | 25,083,383 | | | | 9.8 | % |
Judiciary of the U.S. ("JUD") | | | 6.9 | | | | 336,059 | | | | 4.4 | % | | | 12,069,553 | | | | 4.7 | % |
Food and Drug Administration ("FDA") | | | 14.6 | | | | 209,991 | | | | 2.8 | % | | | 11,462,830 | | | | 4.5 | % |
Environmental Protection Agency ("EPA") | | | 5.0 | | | | 241,564 | | | | 3.2 | % | | | 9,768,206 | | | | 3.8 | % |
Internal Revenue Service ("IRS") | | | 9.6 | | | | 236,233 | | | | 3.1 | % | | | 8,807,268 | | | | 3.4 | % |
U.S. Immigration and Customs Enforcement ("ICE") | | | 4.8 | | | | 205,268 | | | | 2.7 | % | | | 8,439,283 | | | | 3.3 | % |
U.S. Joint Staff Command ("JSC") | | | 6.9 | | | | 403,737 | | | | 5.3 | % | | | 8,181,271 | | | | 3.2 | % |
U.S. Citizenship and Immigration Services ("USCIS") | | | 7.1 | | | | 204,489 | | | | 2.7 | % | | | 6,820,285 | | | | 2.7 | % |
Bureau of the Fiscal Service ("BFS") | | | 16.2 | | | | 266,176 | | | | 3.5 | % | | | 6,699,183 | | | | 2.6 | % |
Federal Aviation Administration ("FAA") | | | 2.3 | | | | 194,540 | | | | 2.6 | % | | | 6,258,839 | | | | 2.4 | % |
Patent and Trademark Office ("PTO") | | | 13.5 | | | | 190,546 | | | | 2.5 | % | | | 6,188,039 | | | | 2.4 | % |
U.S. Forest Service ("USFS") | | | 4.9 | | | | 191,175 | | | | 2.5 | % | | | 6,062,822 | | | | 2.4 | % |
Social Security Administration ("SSA") | | | 5.2 | | | | 189,276 | | | | 2.5 | % | | | 4,975,712 | | | | 1.9 | % |
Federal Emergency Management Agency ("FEMA") | | | 17.3 | | | | 210,373 | | | | 2.8 | % | | | 4,610,303 | | | | 1.8 | % |
U.S. Attorney Office ("USAO") | | | 12.5 | | | | 110,008 | | | | 1.4 | % | | | 4,008,491 | | | | 1.6 | % |
Customs and Border Protection ("CBP") | | | 9.8 | | | | 68,000 | | | | 0.9 | % | | | 3,802,525 | | | | 1.5 | % |
Department of Transportation ("DOT") | | | 2.8 | | | | 129,659 | | | | 1.7 | % | | | 3,740,110 | | | | 1.5 | % |
Occupational Safety and Health Administration ("OSHA") | | | 2.6 | | | | 75,000 | | | | 1.0 | % | | | 3,013,567 | | | | 1.2 | % |
Defense Health Agency ("DHA") | | | 12.8 | | | | 101,285 | | | | 1.3 | % | | | 2,340,112 | | | | 0.9 | % |
Department of Energy ("DOE") | | | 8.1 | | | | 120,496 | | | | 1.6 | % | | | 2,213,403 | | | | 0.9 | % |
Military Entrance Processing Command ("MEPCOM") | | | 4.2 | | | | 30,000 | | | | 0.4 | % | | | 2,204,839 | | | | 0.9 | % |
U.S. Department of Agriculture ("USDA") | | | 6.1 | | | | 69,440 | | | | 0.9 | % | | | 2,122,091 | | | | 0.8 | % |
National Weather Service ("NWS") | | | 12.5 | | | | 94,378 | | | | 1.2 | % | | | 2,077,157 | | | | 0.8 | % |
Bureau of Indian Affairs ("BIA") | | | 11.0 | | | | 78,184 | | | | 1.0 | % | | | 2,034,317 | | | | 0.8 | % |
National Park Service ("NPS") | | | 3.0 | | | | 62,772 | | | | 0.8 | % | | | 1,766,700 | | | | 0.7 | % |
Bureau of Reclamation ("BOR") | | | 11.8 | | | | 69,518 | | | | 0.9 | % | | | 1,759,789 | | | | 0.7 | % |
General Services Administration - Other | | | 4.2 | | | | 54,803 | | | | 0.7 | % | | | 1,686,265 | | | | 0.7 | % |
17
| |
Tenants (Cont.) (As of June 30, 2021, unaudited) |
|
|
Tenant | | Weighted Average Remaining Lease Term(1) | | | Leased Square Feet | | | Percentage of Leased Square Feet | | | Annualized Lease Income | | | Percentage of Total Annualized Lease Income | |
| | | | | | | | | | | | | | | | | | | | |
U.S. Government (Cont.) | | | | | | | | | | | | | | | | | | | | |
U.S. Coast Guard ("USCG") | | | 6.5 | | | | 59,547 | | | | 0.8 | % | | | 1,610,513 | | | | 0.6 | % |
Small Business Administration ("SBA") | | | 0.7 | | | | 42,835 | | | | 0.6 | % | | | 1,345,617 | | | | 0.5 | % |
U.S. Army Corps of Engineers ("ACOE") | | | 3.6 | | | | 39,320 | | | | 0.5 | % | | | 1,085,193 | | | | 0.4 | % |
Health Resources and Services Administration ("HRSA") | | | 19.1 | | | | 27,569 | | | | 0.4 | % | | | 838,276 | | | | 0.3 | % |
National Oceanic and Atmospheric Administration ("NOAA") | | | 1.6 | | | | 23,923 | | | | 0.3 | % | | | 799,340 | | | | 0.3 | % |
Bureau of Alcohol, Tobacco, Firearms and Explosives ("ATF") | | | 3.9 | | | | 21,342 | | | | 0.3 | % | | | 782,417 | | | | 0.3 | % |
Office of the Field Solicitor ("OFC") | | | 11.8 | | | | 4,526 | | | | 0.1 | % | | | 114,572 | | | | 0.0 | % |
Office of the Special Trustee for American Indians ("OST") | | | 11.8 | | | | 3,359 | | | | 0.0 | % | | | 85,030 | | | | 0.0 | % |
U.S. Marshals Service ("USMS") | | | 5.6 | | | | 1,054 | | | | 0.0 | % | | | 48,500 | | | | 0.0 | % |
Department of Labor ("DOL") | | | 2.6 | | | | 1,004 | | | | 0.0 | % | | | 23,198 | | | | 0.0 | % |
U.S. Probation Office ("USPO") | | | 2.6 | | | | 452 | | | | 0.0 | % | | | 10,452 | | | | 0.0 | % |
Subtotal | | | 8.7 | | | | 7,343,217 | | | | 96.6 | % | | $ | 252,832,839 | | | | 98.5 | % |
| | | | | | | | | | | | | | | | | | | | |
Private Tenants | | | | | | | | | | | | | | | | | | | | |
Other Private Tenants | | | 1.7 | | | | 38,510 | | | | 0.5 | % | | $ | 1,158,724 | | | | 0.5 | % |
Providence Health & Services | | | 4.2 | | | | 21,643 | | | | 0.3 | % | | | 717,809 | | | | 0.3 | % |
We Are Sharing Hope SC | | | 0.7 | | | | 21,609 | | | | 0.3 | % | | | 653,291 | | | | 0.3 | % |
United Technologies (Pratt & Whitney) | | | 2.5 | | | | 105,641 | | | | 1.4 | % | | | 543,818 | | | | 0.2 | % |
Lummus Corporation | | | 7.1 | | | | 70,078 | | | | 0.9 | % | | | 410,157 | | | | 0.2 | % |
Subtotal | | | 3.6 | | | | 257,481 | | | | 3.4 | % | | $ | 3,483,799 | | | | 1.5 | % |
| | | | | | | | | | | | | | | | | | | | |
Total / Weighted Average | | | 8.6 | | | | 7,600,698 | | | | 100.0 | % | | $ | 256,316,638 | | | | 100.0 | % |
| | | | | | | | | | | | | | | | | | | | |
(1)Weighted based on leased square feet.
18
| |
Lease Expirations (As of June 30, 2021, unaudited) |
|
|
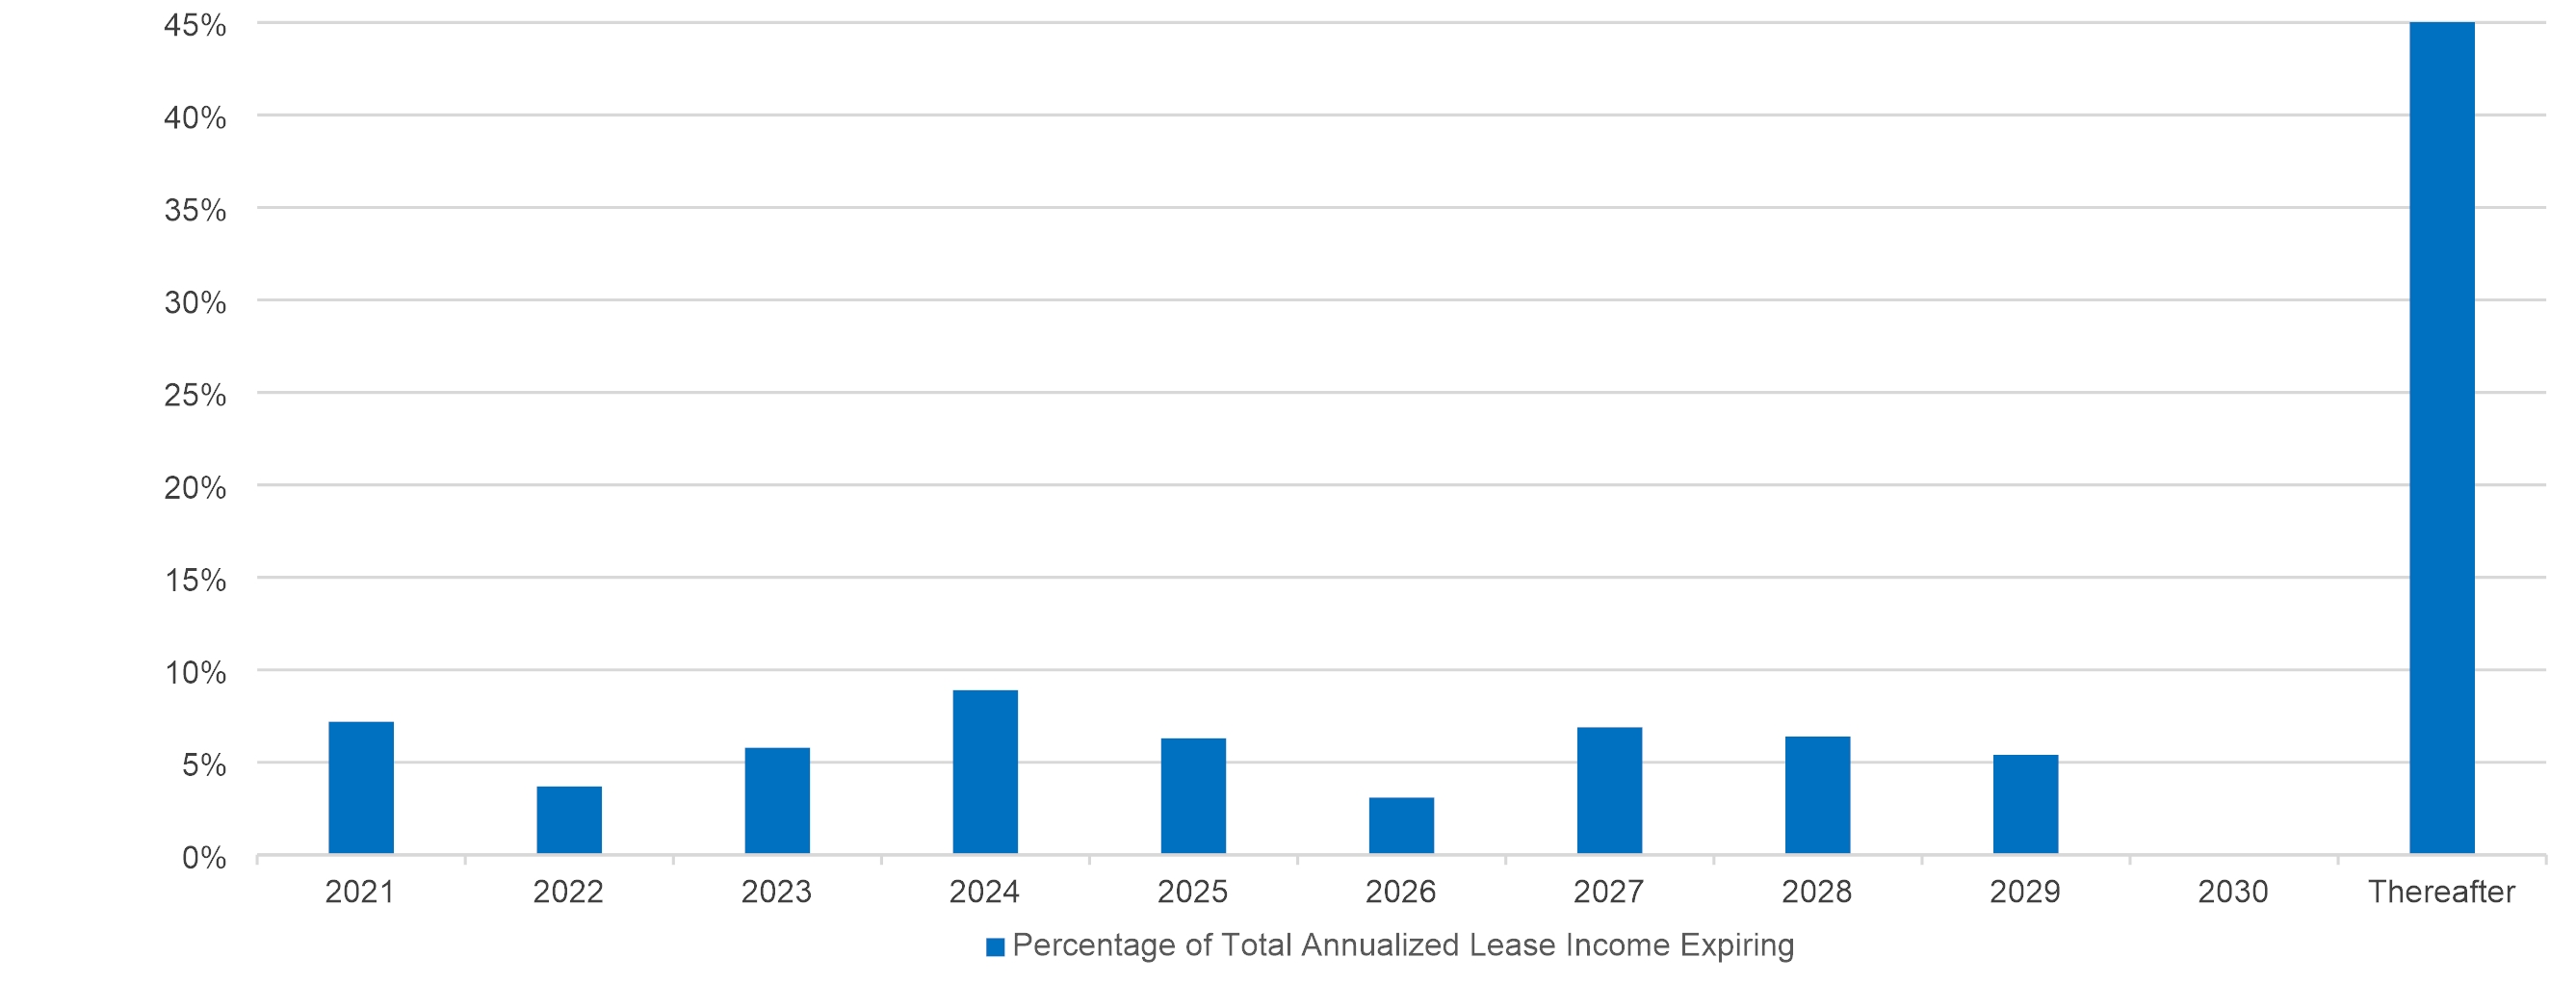
Year of Lease Expiration | | Number of Leases Expiring | | | Leased Square Footage Expiring | | | Percentage of Total Leased Square Footage Expiring | | | Annualized Lease Income Expiring | | | Percentage of Total Annualized Lease Income Expiring | | | Annualized Lease Income per Leased Square Foot Expiring | |
2021 | | 9 | | | | 515,447 | | | | 6.8 | % | | | 18,408,692 | | | | 7.2 | % | | | 35.71 | |
2022 | | 8 | | | | 272,463 | | | | 3.6 | % | | | 9,501,899 | | | | 3.7 | % | | | 34.87 | |
2023 | | 12 | | | | 500,849 | | | | 6.6 | % | | | 14,836,378 | | | | 5.8 | % | | | 29.62 | |
2024 | | 10 | | | | 727,374 | | | | 9.6 | % | | | 22,816,256 | | | | 8.9 | % | | | 31.37 | |
2025 | | 13 | | | | 470,957 | | | | 6.2 | % | | | 16,164,287 | | | | 6.3 | % | | | 34.32 | |
2026 | | 4 | | | | 249,466 | | | | 3.3 | % | | | 7,874,922 | | | | 3.1 | % | | | 31.57 | |
2027 | | 6 | | | | 495,529 | | | | 6.5 | % | | | 17,626,097 | | | | 6.9 | % | | | 35.57 | |
2028 | | 8 | | | | 783,003 | | | | 10.3 | % | | | 16,486,960 | | | | 6.4 | % | | | 21.06 | |
2029 | | 5 | | | | 493,794 | | | | 6.5 | % | | | 13,773,658 | | | | 5.4 | % | | | 27.89 | |
2030 | | - | | | | - | | | | 0.0 | % | | | - | | | | 0.0 | % | | | - | |
Thereafter | | 37 | | | | 3,091,816 | | | | 40.6 | % | | | 118,827,489 | | | | 46.3 | % | | | 38.43 | |
Total / Weighted Average | | 112 | | | | 7,600,698 | | | | 100.0 | % | | $ | 256,316,638 | | | | 100.0 | % | | $ | 33.72 | |
19
| |
Summary of Re/Development Projects (As of June 30, 2021, unaudited, in thousands, except square feet) |
|
|
Projects Under Construction(1) | | |
Property Name | | Location | | | Property Type | | | Total Leased Square Feet | | | Lease Term | | | Anticipated Total Cost | | | Cost to Date | | | Total Lump-Sum Reimbursement | | | Anticipated Completion Date | | | Anticipated Lease Commencement | | |
N/A | | | - | | | | - | | | | - | | | | - | | | $ | - | | | $ | - | | | $ | - | | | | - | | | | - | | |
| | | | | | | | | | | | | | | | | | | | | | | | | | | | | | | | | | | | | |
| | | | | | | | | | | | | | | | | | | | | | | | | | | | | | | | | | | | | |
| | | | | | | | | | | | | | | | | | | | | | | | | | | | | | | | | | | | | |
Projects in Design(2) | | | | | | | | | | |
Property Name | | Location | | | Property Type | | | Total Estimated Leased Square Feet | | | Lease Term | | | Cost to Date | | | Anticipated Completion Date | | | Anticipated Lease Commencement | | | | | | | | | | |
FDA - Atlanta | | Atlanta, GA | | | Laboratory | | | | 162,000 | | | 20-Year | | | $ | 29,113 | | | 3Q 2023 | | | 3Q 2023 | | | | | | | | | | |
Total | | | | | | | | | | | 162,000 | | | | | | | $ | 29,113 | | | | | | | | | | | | | | | | | | |
| | | | | | | | | | | | | | | | | | | | | | | | | | | | | | | | | | | | | |
| | | | | | | | | | | | | | | | | | | | | | | | | | | | | | | | | | | | | |
| | | | | | | | | | | | | | | | | | | | | | | | | | | | | | | | | | | | | |
Projects Previously Completed with Outstanding Lump-Sum Reimbursements | | | | | | | | | | |
Property Name | | Location | | | Property Type | | | Total Leased Square Feet | | | Lease Term | | | Outstanding Lump-Sum Reimbursement(3) | | | Completion Date | | | Lease Commencement | | | | | | | | | | |
N/A | | | - | | | | - | | | | - | | | | - | | | $ | - | | | | - | | | | - | | | | | | | | | | |
| | | | | | | | | | | | | | | | | | | | | | | | | | | | | | | | | | | | | |
(1)Includes properties under construction for which design is complete.
(2)Includes projects in the design phase for which project scope is not fully determined.
(3)Includes reimbursement of lump-sum tenant improvement costs and development fees.
20