Exhibit 99.2

Table of Contents
| Legal Notices | |
| | |
| Earnings Release | 4 |
| | |
| Financial Highlights – Trailing Five Quarters | 8 |
| | |
| Consolidated Balance Sheets – Trailing Five Quarters | 9 |
| | |
| Consolidated Statements of Operations | 10 |
| | |
| Calculation of Adjusted Earnings and Reconciliation to Net Income Attributable to Common Stockholders – Trailing Five Quarters | 11 |
| | |
| Schedule of Debt | 12 |
| | |
| Debt Maturity Schedule | 12 |
| | |
| Schedules of Development Projects | 13 |
| | |
| Investment Pipeline by Geography | 15 |
| | |
| Company Information | 16 |
| First Quarter 2017 |  | 2 |
Forward Looking Statements
This Supplemental Information package contains forward-looking statements within the meaning of the Private Securities Litigation Reform Act of 1995 (set forth in Section 27A of the Securities Act of 1933, as amended (the “Securities Act”) and Section 21E of the Securities Exchange Act of 1934, as amended (the “Exchange Act”)). These forward-looking statements include, without limitation, statements about our estimates, expectations, predictions and forecasts of our future business plans and financial and operating performance and/or results, as well as statements of management’s goals and objectives and other similar expressions concerning matters that are not historical facts. When we use the words “may,” “should,” “could,” “would,” “predicts,” “potential,” “continue,” “expects,” “anticipates,” “future,” “intends,” “plans,” “believes,” “estimates” or similar expressions or their negatives, as well as statements in future tense, we intend to identify forward-looking statements. Although we believe that the expectations reflected in such forward-looking statements are based upon reasonable assumptions, beliefs and expectations, such forward-looking statements are not predictions of future events or guarantees of future performance and our actual financial and operating results could differ materially from those set forth in the forward-looking statements. Some factors that might cause such differences are described in the section entitled “Risk Factors” in our most recent Annual Report on Form 10-K and in other documents that we file from time to time with the SEC, which factors include, without limitation, the following:
| · | our ability to successfully source, structure, negotiate and close investments in self-storage facilities; |
| · | changes in our business strategy and the market’s acceptance of our investment terms; |
| · | our ability to fund our outstanding and future investment commitments; |
| · | availability, terms and our rate of deployment of equity and debt capital; |
| · | our manager’s ability to hire and retain qualified personnel; |
| · | changes in the self-storage industry, interest rates or the general economy; |
| · | the degree and nature of our competition; |
| · | volatility in the value of our assets carried at fair market value; and |
| · | general volatility of the capital markets and the market price of our common stock. |
Given these uncertainties, undue reliance should not be placed on our forward-looking statements. We assume no duty or responsibility to publicly update or revise any forward-looking statement that may be made to reflect future events or circumstances or to reflect the occurrence of unanticipated events. We urge you to review the disclosures concerning risks in the sections entitled “Risk Factors” and “Management’s Discussion and Analysis of Financial Condition and Results of Operations” in our most recent Annual Report on Form 10-K and in other documents that we file from time to time with the SEC.
Non-GAAP Financial Measures
Adjusted Earnings is a non-GAAP measure and is defined as net income plus stock dividends payable on preferred stock, stock-based compensation expense, transaction and other expenses, deferred termination fee to manager, and restructuring costs. Management uses Adjusted Earnings and Adjusted Earnings per diluted share as key performance indicators in evaluating the operations of the Company's business. The Company is a capital provider to self-storage developers and believes that these measures are useful to management and investors as a starting point in measuring its operational performance because they exclude various equity-based payments (including stock dividends) and other items included in net income that do not relate to or are not indicative of its present and future operating performance, which can make periodic and peer analyses of operating performance more difficult. The Company’s computation of Adjusted Earnings and Adjusted Earnings per share may not be comparable to other key performance indicators reported by other REITs or real estate companies. Reconciliations of Adjusted Earnings and Adjusted Earnings per share to Net Income and Earnings per share, respectively, are provided in the attached table entitled “Calculation of Adjusted Earnings.”
| First Quarter 2017 | | 3 |
Press Release – May 2017
JERNIGAN CAPITAL ANNOUNCES RESULTS FOR FIRST QUARTER 2017
- Closes $105.6 Million of Development Investments –
- Increases Investment Pipeline to $825 Million –
- Begins Second Quarter with $50 Million ATM Launch –
MEMPHIS, Tennessee, May 3, 2017 / Business Wire / Jernigan Capital, Inc. (NYSE: JCAP), a leading capital partner for self-storage entrepreneurs nationwide, today announced results for the quarter ended March 31, 2017, issued earnings guidance for the second quarter, and reaffirmed earnings guidance for full year 2017.
Highlights for the quarter ended March 31, 2017 include:
| ▪ | Earnings per share and adjusted earnings per share of $0.14 and $0.21, respectively; |
| | | |
| ▪ | $105.6 million of on-balance sheet development investments through quarter end ($155.7 million through May 2, 2017); |
| | | |
| ▪ | Increased investment pipeline to approximately $825 million; and |
| | | |
| ▪ | Launched $50.0 million “at-the-market” offering program on April 5, 2017. |
“It has been said that great teams create their own momentum, and our exceptional JCAP team built upon the strong momentum we created late last year, producing outstanding first quarter results,” stated Dean Jernigan, Chairman and Chief Executive Officer of Jernigan Capital. “The $105.6 million of developments closed in the first quarter was our largest investment quarter to date, and the remainder of the year looks very promising as well. The continued growth in our pipeline to approximately $825 million gives us a high degree of confidence that we remain the investment partner of choice to self-storage entrepreneurs in a development cycle that we believe is a long way from ending. Our continued access to a large volume of high-quality development investment opportunities, combined with continued strong self-storage fundamentals and our access to significant amounts of capital leave us very optimistic about our future.”
John Good, President and Chief Operating Officer of Jernigan Capital added, “We are on pace to substantially exceed in 2017 the investment volume of 2015 and 2016 combined. As of today, we have closed $155.7 million of development investments in 2017 and have executed term sheets for another $212 million of investments. Moreover, an additional $613 million of high quality prospective investments is in our underwriting process. The well-executed and efficient issuance of approximately $20.0 million of common stock under our “at-the-market” program in the first few days after launch leaves us highly confident in our ability to finance the Company over the long term. With access to reasonably-priced capital and a business that is highly scalable, we remain poised to create meaningful long-term value for our stockholders.”
| First Quarter 2017 | | 4 |
Financial Highlights
Net income attributable to common stockholders for the three months ended March 31, 2017 increased $0.1 million to $1.2 million, or $0.14 per share, compared to net income of $1.1 million, or $0.18 per share, for the comparable period in 2016. Net income attributable to common stockholders is reflected after giving effect to the impact of $371,000, or $0.04 per share, attributable to dividends on shares of Series A Preferred Stock declared in the first quarter 2017 payable in shares of common stock. Net income attributable to common stockholders on a per share basis for the first quarter of 2017 reflects the issuance of approximately three million new shares of common stock in December 2016. Adjusted earnings were $1.9 million, or $0.21 per share, for the quarter, compared to adjusted earnings of $3.4 million, or $0.55 per share, for the comparable 2016 quarter.
Net income attributable to common stockholders and adjusted earnings for the three months ended March 31, 2017 includes a $1.4 million increase in fair value of investments, compared to a $3.8 million increase for the comparable 2016 period, primarily due to a higher volume of development investments approaching certificate of occupancy in the first quarter of 2016 compared to the first quarter of 2017. In part as a result of the Company’s Heitman joint venture, the Company did not make any on-balance sheet investments from January 1 through August 31, 2016.
General and administrative expenses for each of the quarters ended March 31, 2017 and 2016 were $1.6 million and $1.3 million, respectively and included non-cash expense of stock-based compensation of $292,000 and $175,000, respectively. Stock-based compensation was affected by the increase in the Company’s common stock price during the first quarter of 2017. General and administrative expenses were impacted by additional franchise taxes accrued in the first quarter 2017.
Capital Markets Activities
On April 5, 2017, the Company entered into an at-the-market continuous equity program, where the Company may, from time to time, offer and sell up to $50.0 million of shares of common stock (the “ATM Program”). Since the inception of the ATM Program, the Company has sold 874,402 shares of common stock at a weighted average price of $22.76 per share.
Dividends
On March 7, 2017, the Company declared a dividend of $0.35 per common share. The dividend was paid on April 14, 2017 to common shareholders of record on April 3, 2017.
Additionally on March 7, 2017, the Company declared cash and stock dividends on its Series A Preferred Stock. These dividends were paid on the following dates and in the following amounts:
| Series A Preferred | | Payment/ Issue Date | | Aggregate Value | | | No. of Shares |
| Cash Dividend | | April 14, 2017 | | $ | 175,000 | | | N/A |
| Stock Dividend | | April 17, 2017 | | $ | 371,000 | | | 16,497 shares of common stock |
| First Quarter 2017 | | 5 |
Second Quarter and Full Year 2017 Guidance
The following table reflects earnings per share and adjusted earnings per share guidance for the second quarter ending June 30, 2017. Such guidance is based on management's current and expected views of Company investment activity (including fair value appreciation), the self-storage market, and overall economic conditions. Adjusted earnings is a performance measure that is not specifically defined by accounting principles generally accepted in the United States (“GAAP”) and is defined as net income (loss) attributable to common stockholders (computed in accordance with GAAP) plus stock dividends payable to preferred stockholders, stock-based compensation expense, and depreciation on real estate assets.
| | | Dollars in thousands,
except share and per share data |
| | | Quarter ending
June 30, 2017 | |
| | | Low | | | High | |
| Total revenues | | $ | 2,345 | | | $ | 2,465 | |
| JV income | | | 500 | | | | 575 | |
| Total interest and JV income | | $ | 2,845 | | | $ | 3,040 | |
| G&A expenses | | | (2,475 | ) | | | (2,350 | ) |
| Property operating expenses | | | (95 | ) | | | (80 | ) |
| Interest expense | | | (275 | ) | | | (250 | ) |
| Other | | | 110 | | | | 125 | |
| Change in fair value of investments (1) | | | 2,500 | | | | 3,200 | |
| Net income | | | 2,610 | | | | 3,685 | |
| Net income attributable to preferred stockholders (2) | | | (175 | ) | | | (175 | ) |
| Net income attributable to common stockholders | | | 2,435 | | | | 3,510 | |
| Add: stock dividends | | | - | | | | - | |
| Add: stock based compensation | | | 525 | | | | 500 | |
| Add: depreciation on real estate assets | | | 45 | | | | 40 | |
| Adjusted earnings | | $ | 3,005 | | | $ | 4,050 | |
| Earnings per share – diluted | | $ | 0.25 | | | $ | 0.36 | |
| Adjusted earnings per share – diluted | | $ | 0.31 | | | $ | 0.42 | |
| Average shares outstanding - diluted | | | 9,750,000 | | | | 9,750,000 | |
| (1) | Excludes $0.4 million (low) / $0.5 million (high) of unrealized appreciation in fair value of investments from the real estate venture which is included in JV income for the three months ending June 30, 2017. |
| (2) | Represents both cash dividends and stock dividends estimated with respect to outstanding shares of Series A Preferred Stock. |
| First Quarter 2017 | | 6 |
The Company is also reaffirming its previously issued guidance for full year 2017. Net income attributable to common shareholders is expected to be between $1.62 and $2.02 and adjusted earnings per share is expected to be between $1.80 and $2.30.
The guidance above is based on the following key assumptions regarding the Company’s business activities in 2017:
| · | Projected closings on $350 million to $375 million of new development property investments with a profits interest for the full year 2017; |
| · | Additional advances of approximately $30 million to $35 million on the Company’s December 31, 2016 investment portfolio, and advances of approximately $115 million to $125 million on new investment commitments; |
| · | Anticipated proceeds of $30 million to $40 million from the issuance of Series A Preferred Stock in the latter part of 2017, approximately $40 million to $45 million of proceeds from senior participations primarily in the latter part of 2017, and approximately $30 million to $40 million from the issuance of common stock under the Company’s ATM Plan; |
| · | Seven additional on-balance sheet properties receiving certificates of occupancy in 2017; and |
| · | No change in the key assumptions used to value the Company’s investments other than the assumption of two 25 basis points interest rate increases in 2017. |
Over 75% of the development property investment commitments closed by the Company in 2016 were made through the Heitman joint venture. The Company resumed closing on-balance sheet investments in late 2016. The 2017 guidance reflects the impact of the limited number of on-balance sheet closings in 2016 resulting in modest fair value adjustments in 2017 on the 2016 investments. The Company expects that the substantial increase in on-balance sheet investment activity in 2017 will result in significant increases in interest income and fair value appreciation in 2018 and beyond.
| First Quarter 2017 | | 7 |
Jernigan Capital, Inc.
Financial Highlights- Trailing Five Quarters
(unaudited, in thousands, except per share data)
| | | Three months ended | |
| | | March 31,
2017 | | | December 31,
2016 | | | September 30,
2016 | | | June 30,
2016 | | | March 31,
2016 | |
| | | | | | | | | | | | | | | | |
| Operating Data: | | | | | | | | | | | | | | | | | | | | |
| Interest income and other revenues - Portfolio Investments | | $ | 2,301 | | | $ | 2,158 | | | $ | 1,698 | | | $ | 1,533 | | | $ | 1,143 | |
| JV income | | | 422 | | | | 424 | | | | 436 | | | | 418 | | | | - | |
| Total revenues and JV income | | | 2,723 | | | | 2,582 | | | | 2,134 | | | | 1,951 | | | | 1,143 | |
| General & administrative expenses | | | (2,208 | ) | | | (1,942 | ) | | | (1,865 | ) | | | (1,737 | ) | | | (1,718 | ) |
| Property operating expenses of real estate owned | | | (55 | ) | | | - | | | | - | | | | - | | | | - | |
| Transaction and other expenses, restructuring costs, and deferred termination fee to Manager | | | - | | | | - | | | | (2 | ) | | | (304 | ) | | | (2,116 | ) |
| Interest expense | | | (204 | ) | | | (373 | ) | | | (148 | ) | | | (38 | ) | | | - | |
| Subtotal | | | 256 | | | | 267 | | | | 119 | | | | (128 | ) | | | (2,691 | ) |
| Change in fair value of investments | | | 1,393 | | | | 4,185 | | | | 4,867 | | | | 5,527 | | | | 3,791 | |
| | | | | | | | | | | | | | | | | | | | | |
| Other interest income | | | 134 | | | | 37 | | | | 8 | | | | 13 | | | | 22 | |
| Net income | | | 1,783 | | | | 4,489 | | | | 4,994 | | | | 5,412 | | | | 1,122 | |
| Net income attributable to preferred stockholders | | | (546 | ) | | | (996 | ) | | | - | | | | - | | | | - | |
| Net income allocable to common stockholders | | $ | 1,237 | | | $ | 3,493 | | | $ | 4,994 | | | $ | 5,412 | | | $ | 1,122 | |
| Plus: stock dividends payable to preferred shareholders | | | 371 | | | | 823 | | | | - | | | | - | | | | - | |
| Plus: stock-based compensation | | | 292 | | | | 252 | | | | 341 | | | | 312 | | | | 175 | |
| Plus: depreciation on real estate assets | | | 24 | | | | - | | | | - | | | | - | | | | - | |
| Plus: transaction and other expenses, restructuring costs, and deferred termination fee to Manager | | | - | | | | - | | | | 2 | | | | 304 | | | | 2,116 | |
| Adjusted Earnings | | $ | 1,924 | | | $ | 4,568 | | | $ | 5,337 | | | $ | 6,028 | | | $ | 3,413 | |
| | | | | | | | | | | | | | | | | | | | | |
| Basic earnings per share attributable to common stockholders | | $ | 0.14 | | | $ | 0.53 | | | $ | 0.84 | | | $ | 0.89 | | | $ | 0.18 | |
| Diluted earnings per share attributable to common stockholders | | $ | 0.14 | | | $ | 0.53 | | | $ | 0.84 | | | $ | 0.89 | | | $ | 0.18 | |
| | | | | | | | | | | | | | | | | | | | | |
| Adjusted Earnings per share attributable to common stockholders - diluted | | $ | 0.21 | | | $ | 0.69 | | | $ | 0.90 | | | $ | 0.99 | | | $ | 0.55 | |
| | | | | | | | | | | | | | | | | | | | | |
| Weighted-average shares of common stock outstanding: | | | | | | | | | | | | | | | | | | | | |
| Basic | | | 8,857,030 | | | | 6,458,845 | | | | 5,831,135 | | | | 5,948,555 | | | | 6,000,000 | |
| Diluted | | | 8,993,528 | | | | 6,619,848 | | | | 5,963,093 | | | | 6,104,206 | | | | 6,162,500 | |
| | | | | | | | | | | | | | | | | | | | | |
| Dividends declared per share of common stock | | $ | 0.35 | | | $ | 0.35 | | | $ | 0.35 | | | $ | 0.35 | | | $ | 0.35 | |
| | | | | | | | | | | | | | | | | | | | | |
| Balance Sheet Data: | | | | | | | | | | | | | | | | | | | | |
| Cash and cash equivalents | | $ | 28,252 | | | $ | 67,373 | | | $ | 13,009 | | | $ | 15,024 | | | $ | 28,801 | |
| Development property investments at fair value | | | 117,936 | | | | 95,102 | | | | 84,986 | | | | 65,002 | | | | 47,223 | |
| Operating property loans at fair value | | | 9,965 | | | | 9,905 | | | | 15,090 | | | | 15,035 | | | | 20,178 | |
| Investment in and advances to real estate venture | | | 10,812 | | | | 5,373 | | | | 2,883 | | | | 9,127 | | | | 7,919 | |
| Self-storage real estate owned | | | 7,350 | | | | - | | | | - | | | | - | | | | - | |
| Total assets | | | 192,429 | | | | 192,779 | | | | 125,826 | | | | 110,233 | | | | 106,494 | |
| Senior loan participations | | | 19,299 | | | | 18,582 | | | | 17,521 | | | | 5,049 | | | | - | |
| Total liabilities | | | 24,873 | | | | 24,417 | | | | 20,983 | | | | 8,605 | | | | 5,433 | |
| Total stockholders' equity | | | 167,556 | | | | 168,362 | | | | 104,843 | | | | 101,628 | | | | 101,061 | |
| First Quarter 2017 | | 8 |
Jernigan Capital, Inc.
Consolidated Balance Sheets- Trailing Five Quarters
(unaudited, in thousands)
| | | As of | |
| | | March 31, | | | December 31, | | | September 30, | | | June 30, | | | March 31, | |
| | | 2017 | | | 2016 | | | 2016 | | | 2016 | | | 2016 | |
| Assets: | | | | | | | | | | | | | | | |
| Cash and cash equivalents | | $ | 28,252 | | | $ | 67,373 | | | $ | 13,009 | | | $ | 15,024 | | | $ | 28,801 | |
| Development property investments at fair value | | | 117,936 | | | | 95,102 | | | | 84,986 | | | | 65,002 | | | | 47,223 | |
| Operating property loans at fair value | | | 9,965 | | | | 9,905 | | | | 15,090 | | | | 15,035 | | | | 20,178 | |
| Investment in and advances to real estate venture | | | 10,812 | | | | 5,373 | | | | 2,883 | | | | 9,127 | | | | 7,919 | |
| Self-storage real estate owned | | | 7,350 | | | | — | | | | — | | | | — | | | | — | |
| Other loans, at cost | | | 14,826 | | | | 11,752 | | | | 6,243 | | | | — | | | | — | |
| Deferred costs | | | 2,294 | | | | 2,207 | | | | 2,690 | | | | — | | | | — | |
| Prepaid expenses and other assets | | | 809 | | | | 868 | | | | 727 | | | | 5,816 | | | | 2,128 | |
| Fixed assets, net | | | 185 | | | | 199 | | | | 198 | | | | 229 | | | | 245 | |
| Total assets | | $ | 192,429 | | | $ | 192,779 | | | $ | 125,826 | | | $ | 110,233 | | | $ | 106,494 | |
| | | | | | | | | | | | | | | | | | | | | |
| Liabilities: | | | | | | | | | | | | | | | | | | | | |
| Senior loan participations | | $ | 19,299 | | | $ | 18,582 | | | $ | 17,521 | | | $ | 5,049 | | | $ | — | |
| Due to Manager | | | 839 | | | | 1,008 | | | | 579 | | | | 636 | | | | 674 | |
| Accounts payable, accrued expenses and other liabilities | | | 1,040 | | | | 697 | | | | 796 | | | | 833 | | | | 2,602 | |
| Dividends payable | | | 3,695 | | | | 4,130 | | | | 2,087 | | | | 2,087 | | | | 2,157 | |
| Total liabilities | | $ | 24,873 | | | $ | 24,417 | | | $ | 20,983 | | | $ | 8,605 | | | $ | 5,433 | |
| | | | | | | | | | | | | | | | | | | | | |
| Equity: | | | | | | | | | | | | | | | | | | | | |
| Jernigan Capital, Inc. stockholders’ equity: | | | | | | | | | | | | | | | | | | | | |
| Cumulative preferred stock | | $ | 9,446 | | | $ | 9,448 | | | $ | — | | | $ | — | | | $ | — | |
| Common stock | | | 90 | | | | 90 | | | | 60 | | | | 60 | | | | 62 | |
| Additional paid-in capital | | | 163,772 | | | | 162,664 | | | | 108,982 | | | | 108,674 | | | | 110,809 | |
| Accumulated deficit | | | (5,752 | ) | | | (3,840 | ) | | | (4,199 | ) | | | (7,106 | ) | | | (10,431 | ) |
| Total equity | | | 167,556 | | | | 168,362 | | | | 104,843 | | | | 101,628 | | | | 100,440 | |
| Non-controlling interests | | | — | | | | — | | | | — | | | | — | | | | 621 | |
| Total equity | | | 167,556 | | | | 168,362 | | | | 104,843 | | | | 101,628 | | | | 101,061 | |
| Total liabilities and equity | | $ | 192,429 | | | $ | 192,779 | | | $ | 125,826 | | | $ | 110,233 | | | $ | 106,494 | |
| First Quarter 2017 | | 9 |
Jernigan Capital, Inc.
Consolidated Statements of Operations
(unaudited, in thousands, except per share data)
| | | Three months ended March 31, | |
| | | 2017 | | | 2016 | |
| Revenues: | | | | | | | | |
| Interest income from investments | | $ | 2,119 | | | $ | 1,143 | |
| Rental and other property related income from real estate owned | | | 63 | | | | - | |
| Other revenues | | | 119 | | | | - | |
| Total revenues | | | 2,301 | | | | 1,143 | |
| | | | | | | | | |
| Costs and expenses: | | | | | | | | |
| General and administrative expenses | | | 1,578 | | | | 1,304 | |
| Management fees to Manager | | | 630 | | | | 414 | |
| Property operating expenses of real estate owned | | | 55 | | | | - | |
| Transaction and other expenses | | | - | | | | 1,952 | |
| Restructuring costs | | | - | | | | 7 | |
| Deferred termination fee to Manager | | | - | | | | 157 | |
| Total costs and expenses | | $ | 2,263 | | | $ | 3,834 | |
| | | | | | | | | |
| Operating income (loss) | | $ | 38 | | | $ | (2,691 | ) |
| | | | | | | | | |
| Other income (expense): | | | | | | | | |
Equity in earnings from unconsolidated
real estate venture | | | 422 | | | | - | |
| Change in fair value of investments | | | 1,393 | | | | 3,791 | |
| Interest expense | | | (204 | ) | | | - | |
| Other interest income | | | 134 | | | | 22 | |
| Total other income | | $ | 1,745 | | | $ | 3,813 | |
| Net income | | $ | 1,783 | | | $ | 1,122 | |
| Net income attributable to preferred stockholders | | | (546 | ) | | | - | |
| Net income attributable to common stockholders | | $ | 1,237 | | | $ | 1,122 | |
| | | | | | | | | |
Basic earnings per share attributable to common
stockholders | | $ | 0.14 | | | $ | 0.18 | |
Diluted earnings per share attributable to common
stockholders | | $ | 0.14 | | | $ | 0.18 | |
| | | | | | | | | |
| Dividends declared per share of common stock | | $ | 0.35 | | | $ | 0.35 | |
| First Quarter 2017 | | 10 |
Jernigan Capital, Inc.
Calculation of Adjusted Earnings and Reconciliation to Net Income Attributable to
Common Stockholders – Trailing Five Quarters
(unaudited, in thousands, except per share data)
| | | Three months ended | |
| | | March 31,
2017 | | | December 31,
2016 | | | September 30,
2016 | | | June 30,
2016 | | | March 31,
2016 | |
| | | | | | | | | | | | | | | | |
| Net income attributable to common stockholders | | $ | 1,237 | | | $ | 3,493 | | | $ | 4,994 | | | $ | 5,412 | | | $ | 1,122 | |
| Plus: stock dividends payable to preferred shareholders | | | 371 | | | | 823 | | | | - | | | | - | | | | - | |
| | | | | | | | | | | | | | | | | | | | | |
| Plus: stock-based compensation | | | 292 | | | | 252 | | | | 341 | | | | 312 | | | | 175 | |
| | | | | | | | | | | | | | | | | | | | | |
| Plus: depreciation on real estate assets | | | 24 | | | | - | | | | - | | | | - | | | | - | |
| | | | | | | | | | | | | | | | | | | | | |
| Plus: transaction and other expenses | | | - | | | | - | | | | 2 | | | | 175 | | | | 1,952 | |
| | | | | | | | | | | | | | | | | | | | | |
| Plus: restructuring costs | | | - | | | | - | | | | - | | | | 47 | | | | 7 | |
| | | | | | | | | | | | | | | | | | | | | |
| Plus: deferred termination fee to Manager | | | - | | | | - | | | | - | | | | 82 | | | | 157 | |
| | | | | | | | | | | | | | | | | | | | | |
| Adjusted Earnings | | $ | 1,924 | | | $ | 4,568 | | | $ | 5,337 | | | $ | 6,028 | | | $ | 3,413 | |
| | | | | | | | | | | | | | | | | | | | | |
| Adjusted Earnings per share attributable to common stockholders - diluted | | $ | 0.21 | | | $ | 0.69 | | | $ | 0.90 | | | $ | 0.99 | | | $ | 0.55 | |
| Weighted average shares of common stock outstanding - diluted | | | 8,993,528 | | | | 6,619,848 | | | | 5,963,093 | | | | 6,104,206 | | | | 6,162,500 | |

| First Quarter 2017 | | 11 |
Jernigan Capital, Inc.
Schedule of Debt
March 31, 2017
(unaudited, dollars in thousands)
(dollars in
thousands) | | Collateral | | Commitment | | | Interest
Rate | | | 3/31/17
Balance(1) | | | Debt to
Total
Investment
Cost | | | Debt to
Total
Fair Value | | | Debt to
Total
Assets | |
| Senior Participation | | New Orleans | | $ | 2,800 | | | | 4.83 | % | | $ | 1,820 | | | | 65.0 | % | | | 65.4 | % | | | 0.9 | % |
| Senior Participation | | Miami | | | 17,733 | | | | 4.08 | % | | | - | | | | 0.0 | % | | | 0.0 | % | | | 0.0 | % |
| Senior Participation | | Atlanta 1 | | | 7,228 | | | | 4.48 | % | | | 4,442 | | | | 61.5 | % | | | 43.3 | % | | | 2.3 | % |
| Senior Participation | | Atlanta 2 | | | 5,378 | | | | 4.48 | % | | | 3,222 | | | | 59.9 | % | | | 36.2 | % | | | 1.7 | % |
| Senior Participation | | Orlando 1 | | | 4,444 | | | | 4.48 | % | | | 2,865 | | | | 64.5 | % | | | 38.5 | % | | | 1.5 | % |
| Senior Participation | | Tampa | | | 4,774 | | | | 4.48 | % | | | 3,048 | | | | 63.8 | % | | | 48.3 | % | | | 1.6 | % |
| Senior Participation | | Charlotte 1 | | | 6,777 | | | | 4.48 | % | | | 3,935 | | | | 58.1 | % | | | 38.5 | % | | | 2.0 | % |
| Total | | | | $ | 49,134 | | | | 4.36 | % | | $ | 19,332 | | | | 39.3 | % | | | 36.4 | % | | | 10.0 | % |
| (1) | Includes total unamortized fees of $33,000. |
Debt Maturity Schedule
March 31, 2017
(unaudited, dollars in thousands)
| (dollars in thousands) | | Collateral | | Maturity
Date | | Current
Interest
Rate | | | 2017 | | | 2018 | | | 2019 | | | 2020 | | | 2021 | | | Total | |
| Senior Participation | | New Orleans | | Apr-19 | | | 4.83 | % | | $ | - | | | $ | - | | | $ | 1,820 | | | $ | - | | | $ | - | | | $ | 1,820 | |
| Senior Participation | | Miami | | Jan-18 | | | 4.08 | % | | | - | | | | - | | | | - | | | | - | | | | - | | | | - | |
| Senior Participation | | Atlanta 1 | | Aug-19 | | | 4.48 | % | | | - | | | | - | | | | 4,442 | | | | - | | | | - | | | | 4,442 | |
| Senior Participation | | Atlanta 2 | | Aug-19 | | | 4.48 | % | | | - | | | | - | | | | 3,222 | | | | - | | | | - | | | | 3,222 | |
| Senior Participation | | Orlando 1 | | Aug-19 | | | 4.48 | % | | | - | | | | - | | | | 2,865 | | | | - | | | | - | | | | 2,865 | |
| Senior Participation | | Tampa | | Aug-19 | | | 4.48 | % | | | - | | | | - | | | | 3,048 | | | | - | | | | - | | | | 3,048 | |
| Senior Participation | | Charlotte 1 | | Sep-21 | | | 4.48 | % | | | - | | | | - | | | | - | | | | - | | | | 3,935 | | | | 3,935 | |
| Total | | | | | | | 4.36 | % | | $ | - | | | $ | - | | | $ | 15,397 | | | $ | - | | | $ | 3,935 | | | $ | 19,332 | |
| First Quarter 2017 | | 12 |
Jernigan Capital, Inc.
Schedule of Completed Development Projects
As of March 31, 2017
(unaudited, dollars in thousands)
| Closing Date | | Location (MSA)
Address | | Commitment | | | Funded
Investment | | | Remaining
Unfunded
Commitment | | | Fair Value | | | Senior
Participation
Amount | | | Net
Investment | | | Size
(NRSF) | | | Date
Opened | | | Days
Open(1) | | | %
Physical
Occupancy(1) | |
| 4/21/2015 | | Orlando 1
11920 W Colonial Drive | | $ | 5,372 | | | $ | 5,336 | | | $ | 36 | | | $ | 1,325 | (2) | | $ | 2,865 | | | $ | 2,471 | | | | 54,435 | | | | 5/1/2016 | | | | 365 | | | | 73.6 | % |
| 6/10/2015 | | Atlanta 1
5110 McGinnis Ferry Rd | | | 8,132 | | | | 7,763 | | | | 369 | | | | 10,265 | | | | 4,442 | | | | 3,321 | | | | 71,968 | | | | 5/25/2016 | | | | 341 | | | | 46.7 | % |
| 6/19/2015 | | Tampa
12832 S US Highway 301 | | | 5,369 | | | | 5,285 | | | | 84 | | | | 6,306 | | | | 3,048 | | | | 2,237 | | | | 59,750 | | | | 4/11/2016 | | | | 385 | | | | 77.7 | % |
| 6/26/2015 | | Atlanta 2
340 Franklin Gateway | | | 6,050 | | | | 5,655 | | | | 395 | | | | 8,895 | | | | 3,222 | | | | 2,433 | | | | 66,332 | | | | 5/24/2016 | | | | 342 | | | | 55.2 | % |
| 6/29/2015 | | Charlotte 1
9323 Wright Hill Rd | | | 7,624 | | | | 6,978 | | | | 646 | | | | 10,213 | | | | 3,935 | | | | 3,043 | | | | 87,515 | | | | 8/18/2016 | | | | 256 | | | | 22.9 | % |
| 7/2/2015 | | Milwaukee
420 W St Paul Ave | | | 7,650 | | | | 6,695 | | | | 955 | | | | 8,412 | | | | NA | | | | NA | | | | 82,767 | | | | 10/9/2016 | (3) | | | 204 | | | | 10.6 | % |
| 7/31/2015 | | New Haven
453 Washington Avenue | | | 6,930 | | | | 5,818 | | | | 1,112 | | | | 7,531 | | | | NA | | | | NA | | | | 64,225 | | | | 12/16/2016 | | | | 131 | | | | 18.6 | % |
| 9/30/2015 | | Jacksonville 1
1939 East West Parkway | | | 6,445 | | | | 5,954 | | | | 491 | | | | 8,219 | | | | NA | | | | NA | | | | 59,848 | | | | 8/12/2016 | | | | 262 | | | | 68.4 | % |
| 10/27/2015 | | Austin
251 N AW Grimes Blvd | | | 8,658 | | | | 5,616 | | | | 3,042 | | | | 6,748 | | | | NA | | | | NA | | | | 77,855 | | | | 3/16/2017 | | | | 45 | | | | 8.0 | % |
| Total Completed Development Loans | | $ | 62,230 | | | $ | 55,100 | | | $ | 7,130 | | | $ | 67,914 | | | | | | | | | | | | | | | | | | | | | | | | | |
| (2) | In February 2017, the Company purchased, for $1.3 million, 50% of the economic rights of the Class A membership units of the limited liability company which owns this development property investment, thus increasing the Company’s profits interest in this investment from 49.9% to 74.9%. As such, the Company’s investment was reclassified as self-storage real estate owned in the March 31, 2017 Consolidated Balance Sheet. The committed and funded investment amounts in this table pertain to the full terms of the development investment, while, the fair value represents only the portion (25.1%) of the principal balance constituting a loan to the Class A member. |
| (3) | Certificate of Occupancy was received in August 2016, prior to the property being ready for opening by the manager of the project. Property opened to partial leasing in October 2016. All floors opened to leasing in February 2017. |
Schedule of Development Projects in Progress
As of March 31, 2017
(unaudited, dollars in thousands)
| Closing Date | | Location (MSA) | | Commitment | | | Funded
Investment | | | Remaining
Unfunded
Commitment | | | Fair Value | | | Size
(NRSF) | | | Construction Start
Date | | Estimated C/O
Quarter | |
| 8/10/2015 | | Pittsburgh | | $ | 5,266 | | | $ | 3,961 | | | $ | 1,305 | | | $ | 5,006 | | | | 50,440 | | | 3/15/2016 | | Q2 2017 | |
| 8/14/2015 | | Raleigh | | | 8,792 | | | | 2,055 | | | | 6,737 | | | | 1,955 | | | | 60,963 | | | 12/15/2016 | | Q4 2017 | |
| 9/20/2016 | | Charlotte 2 | | | 12,888 | | | | 1,875 | | | | 11,013 | | | | 1,662 | | | | 78,264 | | | 2/1/2017 | | Q2 2018 | |
| 11/17/2016 | | Orlando 2 | | | 5,134 | | | | 2,089 | | | | 3,045 | | | | 2,074 | | | | 19,400 | | | 12/1/2016 | | Q2 2017 | |
| 11/17/2016 | | Jacksonville 2 | | | 7,530 | | | | 1,553 | | | | 5,977 | | | | 1,491 | | | | 71,080 | | | 1/10/2017 | | Q4 2017 | |
| 1/4/2017 | | New York City | | | 16,117 | | | | 8,765 | | | | 7,352 | | | | 8,746 | | | | 107,325 | | | 2/3/2017 | | Q3 2017 | |
| 1/18/2017 | | Atlanta 3 | | | 14,115 | | | | 3,051 | | | | 11,064 | | | | 2,944 | | | | 92,935 | | | 07/17/17 | | Q2 2018 | |
| 1/31/2017 | | Atlanta 4 | | | 13,678 | | | | 5,305 | | | | 8,373 | | | | 5,234 | | | | 103,561 | | | 7/29/2017 | | Q2 2018 | |
| 2/24/2017 | | Orlando 3 | | | 8,056 | | | | 604 | | | | 7,452 | | | | 526 | | | | 71,113 | | | 5/10/2017 | | Q1 2018 | |
| 2/24/2017 | | New Orleans | | | 12,549 | | | | - | | | | 12,549 | | | | - | | | | 90,315 | | | 7/31/2017 | | Q2 2018 | |
| 2/27/2017 | | Atlanta 5 | | | 17,492 | | | | 4,469 | | | | 13,023 | | | | 4,332 | | | | 84,988 | | | 3/29/2017 | | Q3 2018 | |
| 3/1/2017 | | Fort Lauderdale | | | 9,952 | | | | 1,710 | | | | 8,242 | | | | 1,622 | | | | 79,279 | | | 3/31/2017 | | Q3 2018 | |
| 3/1/2017 | | Houston | | | 13,630 | | | | 3,211 | | | | 10,419 | | | | 3,102 | | | | 132,967 | | | 4/30/2017 | | Q4 2017 | |
| Total Development Loan in Progress | | $ | 145,199 | | | $ | 38,648 | | | $ | 106,551 | | | $ | 38,694 | | | | | | | | | | |
| First Quarter 2017 | | 13 |
Schedule of Heitman JV Development Projects in Progress
As of March 31, 2017
(unaudited, dollars in thousands)
| Closing Date | | Location (MSA) | | Commitment | | | Funded
Investment | | | Remaining
Unfunded
Commitment | | | Fair Value | | | Size
(NRSF) | | | Construction
Start date | | Estimated C/O
Quarter | |
| 5/14/2015 | | Miami 1 | | $ | 13,867 | | | $ | 6,813 | | | $ | 7,054 | | | $ | 7,587 | | | | 75,838 | | | 3/28/2016 | | Q3 2017 | |
| 5/14/2015 | | Miami 2 | | | 14,849 | | | | 6,064 | | | | 8,785 | | | | 5,930 | | | | 74,113 | | | 6/27/2016 | | Q4 2017 | |
| 9/25/2015 | | Fort Lauderdale | | | 13,230 | | | | 4,574 | | | | 8,656 | | | | 4,433 | | | | 87,275 | | | 6/27/2016 | | Q2 2018 | |
| 4/15/2016 | | Washington, DC | | | 17,269 | | | | 8,716 | | | | 8,553 | | | | 8,756 | | | | 91,325 | | | 6/1/2016 | | Q3 2017 | |
| 4/29/2016 | | Atlanta 1 | | | 10,223 | | | | 1,196 | | | | 9,027 | | | | 1,109 | | | | 71,780 | | | 10/1/2016 | | Q4 2017 | |
| 7/19/2016 | | Jacksonville | | | 8,127 | | | | 3,669 | | | | 4,458 | | | | 4,257 | | | | 79,279 | | | 9/20/2016 | | Q2 2017 | |
| 7/21/2016 | | New Jersey | | | 7,828 | | | | 789 | | | | 7,039 | | | | 712 | | | | 57,975 | | | 4/18/2017 | | Q2 2018 | |
| 8/15/2016 | | Atlanta 2 | | | 8,772 | | | | 3,025 | | | | 5,747 | | | | 3,132 | | | | 70,400 | | | 9/1/2016 | | Q3 2017 | |
| 8/25/2016 | | Denver | | | 11,032 | | | | 3,557 | | | | 7,475 | | | | 3,448 | | | | 86,657 | | | 10/3/2016 | | Q3 2017 | |
| 9/28/2016 | | Columbia | | | 9,199 | | | | 3,461 | | | | 5,738 | | | | 3,427 | | | | 70,813 | | | 10/12/2016 | | Q3 2017 | |
| 12/22/2016 | | Raleigh | | | 8,877 | | | | 1,081 | | | | 7,796 | | | | 1,006 | | | | 65,110 | | | 1/31/2017 | | Q2 2018 | |
| Total Heitman JV Investments | | $ | 123,273 | | | $ | 42,945 | | | $ | 80,328 | | | $ | 43,797 | | | | - | | | | | | |

| First Quarter 2017 | | 14 |
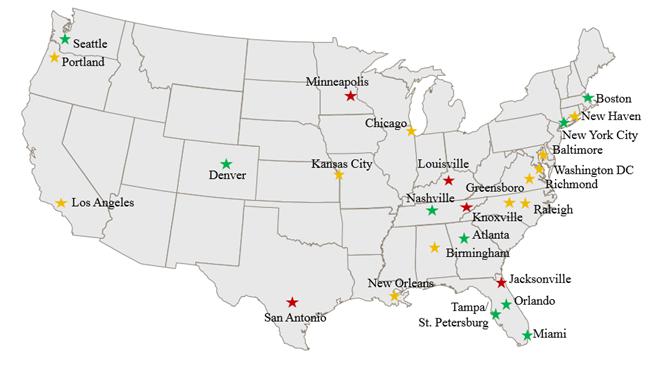
Investment Pipeline by Geography
| · | Executed term sheets for investments in 20 separate self-storage development projects for an aggregate capital commitment of approximately $212 million |
| · | Maintain a robust $825 million pipeline of additional development investment opportunities in top 50 markets |

| First Quarter 2017 | | 15 |
Jernigan Capital, Inc.
Company Information
| Corporate Headquarters | Trading Symbol | Investor Relations | Information Requests |
| 6410 Poplar Avenue | Common shares: JCAP | 6410 Poplar Avenue | To request an Investor Relations |
| Suite 650 | Stock Exchange Listing | Suite 650 | package or annual report, please |
| Memphis, TN 38119 | New York Stock Exchange | Memphis, TN 38119 | visit our website at |
| 901.567.9510 | 901.567.9510 | www.jernigancapital.com | |
Executive Management
| Dean Jernigan | John A. Good |
| Chairman and Chief Executive Officer | President and Chief Operating Officer |
| Kelly P. Luttrell |
| Senior Vice President, Chief Financial Officer, |
| and Treasurer |
Independent Directors
| Mark O. Decker | James D. Dondero |
| Director | Director |
| | |
| Howard A. Silver | Harry J. Thie |
| Director | Director |
Equity Research Coverage
| Baird Equity Research | FBR Capital Markets |
| RJ Milligan | David Corak |
| rjmilligan@rwbaird.com | dcorak@fbr.com |
| | |
| Jefferies LLC | Raymond James & Associates |
| George Hoglund | Jonathan Hughes |
| gholund@jefferies.com | jonathan.hughes@raymondjames.com |
Any opinions, estimates, forecasts or predictions regarding Jernigan Capital’s performance made by these analysts are theirs alone and do not represent opinions, estimates, forecasts or predictions of Jernigan Capital or its management. Jernigan Capital does not by its reference above or distribution imply its endorsement of or concurrence with such opinions, estimates, forecasts or predictions.
| First Quarter 2017 | | 16 |