Exhibit 99.2

Table of Contents
| Legal Notices | |
| | |
| Earnings Release | 4 |
| | |
| Financial Highlights – Trailing Five Quarters | 9 |
| | |
| Consolidated Balance Sheets – Trailing Five Quarters | 10 |
| | |
| Consolidated Statements of Operations | 11 |
| | |
| Calculation of Adjusted Earnings and Reconciliation to Net Income Attributable to Common Stockholders – Trailing Five Quarters | 12 |
| | |
| Schedule of Debt | 13 |
| | |
| Schedules of Development Projects | 14 |
| | |
Closed Investments by Geography | 17 |
| | |
| Investment Pipeline by Geography | 18 |
| | |
| Company Information | 19 |
| Second Quarter 2017 |  | 2 |
Forward Looking Statements
This Supplemental Information package contains forward-looking statements within the meaning of the Private Securities Litigation Reform Act of 1995 (set forth in Section 27A of the Securities Act of 1933, as amended (the “Securities Act”) and Section 21E of the Securities Exchange Act of 1934, as amended (the “Exchange Act”)). These forward-looking statements include, without limitation, statements about our estimates, expectations, predictions and forecasts of our future business plans and financial and operating performance and/or results, as well as statements of management’s goals and objectives and other similar expressions concerning matters that are not historical facts. When we use the words “may,” “should,” “could,” “would,” “predicts,” “potential,” “continue,” “expects,” “anticipates,” “future,” “intends,” “plans,” “believes,” “estimates” or similar expressions or their negatives, as well as statements in future tense, we intend to identify forward-looking statements. Although we believe that the expectations reflected in such forward-looking statements are based upon reasonable assumptions, beliefs and expectations, such forward-looking statements are not predictions of future events or guarantees of future performance and our actual financial and operating results could differ materially from those set forth in the forward-looking statements. Some factors that might cause such differences are described in the section entitled “Risk Factors” in our most recent Annual Report on Form 10-K and in other documents that we file from time to time with the SEC, which factors include, without limitation, the following:
| · | our ability to successfully source, structure, negotiate and close investments in self-storage facilities; |
| · | changes in our business strategy and the market’s acceptance of our investment terms; |
| · | our ability to fund our outstanding and future investment commitments; |
| · | availability, terms and our rate of deployment of equity and debt capital; |
| · | our manager’s ability to hire and retain qualified personnel; |
| · | changes in the self-storage industry, interest rates or the general economy; |
| · | the degree and nature of our competition; |
| · | volatility in the value of our assets carried at fair market value; and |
| · | general volatility of the capital markets and the market price of our common stock. |
Given these uncertainties, undue reliance should not be placed on our forward-looking statements. We assume no duty or responsibility to publicly update or revise any forward-looking statement that may be made to reflect future events or circumstances or to reflect the occurrence of unanticipated events. We urge you to review the disclosures concerning risks in the sections entitled “Risk Factors” and “Management’s Discussion and Analysis of Financial Condition and Results of Operations” in our most recent Annual Report on Form 10-K and in other documents that we file from time to time with the SEC.
Non-GAAP Financial Measures
Adjusted Earnings is a non-GAAP measure and is defined as net income plus stock dividends payable on preferred stock, stock-based compensation expense, transaction and other expenses, deferred termination fee to manager, and restructuring costs. Management uses Adjusted Earnings and Adjusted Earnings per diluted share as key performance indicators in evaluating the operations of the Company's business. The Company is a capital provider to self-storage developers and believes that these measures are useful to management and investors as a starting point in measuring its operational performance because they exclude various equity-based payments (including stock dividends) and other items included in net income that do not relate to or are not indicative of its present and future operating performance, which can make periodic and peer analyses of operating performance more difficult. The Company’s computation of Adjusted Earnings and Adjusted Earnings per share may not be comparable to other key performance indicators reported by other REITs or real estate companies. Reconciliations of Adjusted Earnings and Adjusted Earnings per share to Net Income and Earnings per share, respectively, are provided in the attached table entitled “Calculation of Adjusted Earnings.”
| Second Quarter 2017 | | 3 |
Press Release – August 2017
JERNIGAN CAPITAL ANNOUNCES $0.50 EARNINGS PER SHARE AND
$0.55 ADJUSTED EARNINGS PER SHARE FOR SECOND QUARTER 2017
MEMPHIS, Tennessee, August 2, 2017 / Business Wire / Jernigan Capital, Inc. (NYSE: JCAP), a leading capital partner for self-storage entrepreneurs nationwide, today announced results for the quarter ended June 30, 2017, issued earnings guidance for the third quarter of 2017, and adjusted earnings guidance for the full-year 2017.
Highlights for the quarter include:
| ▪ | Earnings per share and adjusted earnings per share of $0.50 and $0.55, respectively; |
| ▪ | Increased guidance of full-year net income available to common stockholders and adjusted earnings by approximately $2.3 million at the midpoint; |
| ▪ | Closed $130.1 million of new on-balance sheet development investments during the second quarter; |
| ▪ | Raised ~$108 million of additional equity capital; |
| ▪ | Maintained robust investment pipeline of approximately $700 million; and |
| ▪ | Obtained $100 million revolving credit facility that closed July 25, 2017. |
“We have had an outstanding first half of 2017,” stated Dean Jernigan, Chairman and Chief Executive Officer of Jernigan Capital. “We closed $236 million of new development investments, maintained a full pipeline of excellent new investment opportunities and were able to more effectively match future cash commitments with efficiently priced equity capital and an exciting new credit facility. Our development investments that have opened for business continue to perform at or above expectations. We look forward to continuing this momentum over the balance of the year and into 2018.”
John Good, President and Chief Operating Officer of Jernigan Capital added, “We are very pleased with our second quarter and year-to-date performance. For the quarter ended June 30, 2017, we increased total revenue by $1.1 million, or 69.5%, over the comparable period in 2016, while general and administrative expenses (excluding management fees) only increased $36,000 over the second quarter of 2016. Two of our investments are at or above 80% physical occupancy, nearly two years earlier than anticipated, and our other eight opened facilities continue to trend at or above our underwritten lease ups. Our 24 programmatic development partners, along with five new prospects who are working through our underwriting process, continue to provide us a full pipeline of prospective investments. We currently have executed term sheets for an additional $174 million of investments along with $522 million of high quality prospective investments currently in our underwriting process. We remain very excited about the growth of the business over the balance of the year and beyond.”
| Second Quarter 2017 | | 4 |
Financial Highlights
Net income attributable to common stockholders for the three months ended June 30, 2017 was $5.0 million, or $0.50 per share, and adjusted earnings was $5.5 million, or $0.55 per share. Net income attributable to common stockholders for the six months ended June 30, 2017 was $6.3 million, or $0.66 per share, and adjusted earnings was $7.4 million, or $0.78 per share.
Total revenues for the three and six months ended June 30, 2017 were $2.6 million and $4.9 million, respectively, representing increases of $1.1 million, or 69.5%, and $2.2 million, or 83.1%, as compared to total revenues for the three and six months ended June 30, 2016, respectively. The increase in revenues is primarily attributed to the increase in the outstanding principal balances on our investment portfolio and other assets.
General and administrative expenses and stock-based compensation expense (“SBE”), for the three and six months ended June 30, 2017 and 2016 were as follows(dollars in thousands):
| | | Three months ended June 30, | |
| | | 2017 | | | 2016 | | | % inc (dec) | |
| General and administrative expenses, excluding SBE | | $ | 936 | | | $ | 1,023 | | | | (8.5 | )% |
| Plus: SBE | | | 435 | | | | 312 | | | | 39.4 | % |
| General and administrative expenses | | $ | 1,371 | | | $ | 1,335 | | | | 2.7 | % |
| | | Six months ended June 30, | |
| | | 2017 | | | 2016 | | | % inc (dec) | |
| General and administrative expenses, excluding SBE | | $ | 2,222 | | | $ | 2,152 | | | | 3.3 | % |
| Plus: SBE | | | 727 | | | | 487 | | | | 49.3 | % |
| General and administrative expenses | | $ | 2,949 | | | $ | 2,639 | | | | 11.7 | % |
The increase in SBE was driven by additional grants of shares of restricted stock made to certain of the Company’s officers and certain employees of the Company’s external manager during the second quarter of 2017. SBE is also affected by changes in the market price of the Company’s common stock.
Net income attributable to common stockholders and adjusted earnings for the three and six months ended June 30, 2017 also include increases in fair value of investments of $4.3 million and $5.7 million, respectively, compared to increases of $5.5 million and $9.3 million for the three and six months ended June 30, 2016, respectively.
| Second Quarter 2017 | | 5 |
Capital Markets Activities
On April 5, 2017, the Company commenced an at-the-market continuous equity offering program (the “ATM Program”), whereby the Company may, from time to time, offer and sell up to $50.0 million of shares of its common stock. Since the inception of the ATM Program through August 1, 2017, the Company has issued and sold 1,093,202 shares of common stock at a weighted average price of $22.69 per share, receiving net proceeds after commissions of $24.2 million.
On June 27, 2017, the Company completed an underwritten public offering of 4,025,000 shares of its common stock, receiving $83.9 million in proceeds, net of underwriters’ discounts and offering expenses payable by the Company.
On July 25, 2017, the Company entered into a senior secured revolving $100 million credit facility, which has an accordion feature permitting expansion up to $200 million. The current borrowing capacity under the credit facility is $33.3 million; however, the Company’s development property investments are eligible to be added to the base of collateral available to secure loans under the credit facility once they receive a certificate of occupancy. Accordingly, the Company believes its availability under the credit facility will increase substantially over the next 12 months as construction on several investments in the Company’s portfolio is completed. The facility will provide lower-cost financing for the Company’s pipeline of self-storage development investments.
Dividends
On May 3, 2017, the Company declared a dividend of $0.35 per common share. The dividend was paid on July 14, 2017 to common shareholders of record on July 3, 2017.
Additionally on May 3, 2017, the Company declared cash and stock dividends on its Series A Preferred Stock. The cash dividend of $0.2 million was paid on July 14, 2017. No stock dividend was paid in accordance with the provisions of the Stock Purchase Agreement.
Third Quarter and Full-Year 2017 Guidance
The following table reflects earnings per share and adjusted earnings per share guidance for the three months ending September 30, 2017 and updated guidance for the full-year 2017. Such guidance is based on management's current and expected views of Company investment activity (including fair value appreciation), the self-storage market, and overall economic conditions. Adjusted earnings is a performance measure that is not specifically defined by accounting principles generally accepted in the United States (“GAAP”) and is defined as net income attributable to common stockholders (computed in accordance with GAAP) plus stock dividends payable to preferred stockholders, stock-based compensation expense, and depreciation on real estate assets.
| Second Quarter 2017 | | 6 |
| | | Dollars in thousands, except share and per share data | |
| | | Three months ending
September 30, 2017 | | | Year ending
December 31, 2017 | |
| | | Low | | | High | | | Low | | | High | |
| Total revenues | | $ | 3,100 | | | $ | 3,220 | | | $ | 11,570 | | | $ | 11,820 | |
| JV income | | | 475 | | | | 550 | | | | 1,900 | | | | 2,125 | |
| Total revenues and JV income | | $ | 3,575 | | | $ | 3,770 | | | $ | 13,470 | | | $ | 13,945 | |
| G&A expenses(1) | | | (2,720 | ) | | | (2,595 | ) | | | (10,070 | ) | | | (9,720 | ) |
| Property operating expenses | | | (105 | ) | | | (85 | ) | | | (355 | ) | | | (315 | ) |
| Interest expense | | | (340 | ) | | | (315 | ) | | | (1,200 | ) | | | (1,075 | ) |
| Other interest income | | | 240 | | | | 255 | | | | 650 | | | | 675 | |
| Change in fair value of investments(2) | | | 2,900 | | | | 3,600 | | | | 16,250 | | | | 18,750 | |
| Net income | | | 3,550 | | | | 4,630 | | | | 18,745 | | | | 22,260 | |
| Net income attributable to preferred stockholders(3) | | | (275 | ) | | | (275 | ) | | | (1,800 | ) | | | (1,700 | ) |
| Net income attributable to common stockholders | | | 3,275 | | | | 4,355 | | | | 16,945 | | | | 20,560 | |
| Add: stock dividends | | | 100 | | | | 100 | | | | 475 | | | | 475 | |
| Add: stock-based compensation | | | 375 | | | | 350 | | | | 1,475 | | | | 1,450 | |
| Add: depreciation on real estate assets | | | 45 | | | | 35 | | | | 155 | | | | 135 | |
| Adjusted earnings | | $ | 3,795 | | | $ | 4,840 | | | $ | 19,050 | | | $ | 22,620 | |
| Earnings per share – diluted | | $ | 0.23 | | | $ | 0.30 | | | $ | 1.41 | | | $ | 1.71 | |
| Adjusted earnings per share - diluted | | $ | 0.27 | | | $ | 0.34 | | | $ | 1.58 | | | $ | 1.88 | |
| Average shares outstanding - diluted | | | 14,300,000 | | | | 14,300,000 | | | | 12,050,000 | | | | 12,050,000 | |
| (1) | Includes $1.1 million (low and high) and $3.7 million (low) / $3.6 million (high) of management fees for the three months ending September 30, 2017 and for the year ending December 31, 2017, respectively. The increase in the quarterly and annual ranges compared to the actual results for the second quarter and prior full-year 2017 guidance, respectively, is primarily due to the expected increase in management fees as a result of the equity capital raised in the first half of 2017. |
| (2) | Excludes $0.4 million (low and high) and $1.4 million (low) / $1.6 million (high) of unrealized appreciation in fair value of investments from the real estate venture which is included in JV income for the three months ending September 30, 2017 and for the year ending December 31, 2017, respectively. |
| (3) | Represents both cash dividends and stock dividends estimated with respect to outstanding shares of Series A Preferred Stock. |
The Company increased the ranges forfull-year 2017 net income attributable to common stockholders to $16.9 million – $20.6 million (previously $14.6 million – $18.3 million) and adjusted earnings to $19.1 million – $22.6 million (previously $16.3 million – $20.7 million). Additionally, the Company updated its per share ranges to incorporate the impact of the equity capital raised in the first half of 2017, resulting in full-year 2017 earnings per share of $1.41 - $1.71 (previously $1.62 – $2.02) and adjusted earnings per share of $1.58 – $1.88 (previously $1.80 – $2.30).
| Second Quarter 2017 | | 7 |
The guidance above is based on the following key assumptions regarding the Company’s business activities in 2017:
| ▪ | projected closings on $350 million to $375 million of new development property investments with a profits interest for the full-year 2017; |
| ▪ | fundings of approximately $145 million to $150 million on the Company’s investment commitments during the full-year 2017; |
| ▪ | four additional on-balance sheet properties receiving certificates of occupancy in the latter half of 2017; and |
| ▪ | no change in the key assumptions used to value the Company’s investments. |
Over 75% of the development property investment commitments closed by the Company in 2016 were made through the Heitman joint venture. The Company resumed closing on-balance sheet investments in late 2016. The 2017 guidance reflects the impact of the limited number of on-balance sheet closings in 2016 resulting in modest fair value adjustments in 2017 on the 2016 investments. The Company expects that the substantial increase in on-balance sheet investment activity in 2017 will result in significant increases in interest income and fair value appreciation in 2018 and beyond.
| Second Quarter 2017 | | 8 |
Jernigan Capital, Inc.
Financial Highlights- Trailing Five Quarters
(unaudited, in thousands, except per share data)
| | | Three months ended | |
| | | June 30,
2017 | | | March 31,
2017 | | | December 31,
2016 | | | September 30,
2016 | | | June 30,
2016 | |
| Operating Data: | | | | | | | | | | | | | | | | | | | | |
| Interest income, rental related income and other revenues | | $ | 2,599 | | | $ | 2,301 | | | $ | 2,158 | | | $ | 1,698 | | | $ | 1,533 | |
| JV income | | | 595 | | | | 422 | | | | 424 | | | | 436 | | | | 418 | |
| Total revenues and JV income | | | 3,194 | | | | 2,723 | | | | 2,582 | | | | 2,134 | | | | 1,951 | |
| General & administrative expenses | | | (2,078 | ) | | | (2,208 | ) | | | (1,942 | ) | | | (1,865 | ) | | | (1,737 | ) |
| Property operating expenses of real estate owned | | | (81 | ) | | | (55 | ) | | | - | | | | - | | | | - | |
| Transaction and other expenses, restructuring costs, and deferred termination fee to Manager | | | - | | | | - | | | | - | | | | (2 | ) | | | (304 | ) |
| Interest expense | | | (230 | ) | | | (204 | ) | | | (373 | ) | | | (148 | ) | | | (38 | ) |
| Subtotal | | | 805 | | | | 256 | | | | 267 | | | | 119 | | | | (128 | ) |
| Change in fair value of investments | | | 4,289 | | | | 1,393 | | | | 4,185 | | | | 4,867 | | | | 5,527 | |
| Other interest income | | | 100 | | | | 134 | | | | 37 | | | | 8 | | | | 13 | |
| Net income | | | 5,194 | | | | 1,783 | | | | 4,489 | | | | 4,994 | | | | 5,412 | |
| Net income attributable to preferred stockholders | | | (177 | ) | | | (546 | ) | | | (996 | ) | | | - | | | | - | |
| Net income allocable to common stockholders | | $ | 5,017 | | | $ | 1,237 | | | $ | 3,493 | | | $ | 4,994 | | | $ | 5,412 | |
| Plus: stock dividends payable to preferred stockholders | | | - | | | | 371 | | | | 823 | | | | - | | | | - | |
| Plus: stock-based compensation | | | 435 | | | | 292 | | | | 252 | | | | 341 | | | | 312 | |
| Plus: depreciation on real estate assets | | | 38 | | | | 24 | | | | - | | | | - | | | | - | |
| Plus: transaction and other expenses, restructuring costs, and deferred termination fee to Manager | | | - | | | | - | | | | - | | | | 2 | | | | 304 | |
| Adjusted Earnings | | $ | 5,490 | | | $ | 1,924 | | | $ | 4,568 | | | $ | 5,337 | | | $ | 6,028 | |
| | | | | | | | | | | | | | | | | | | | | |
| Basic earnings per share attributable to common stockholders | | $ | 0.50 | | | $ | 0.14 | | | $ | 0.53 | | | $ | 0.84 | | | $ | 0.89 | |
| Diluted earnings per share attributable to common stockholders | | $ | 0.50 | | | $ | 0.14 | | | $ | 0.53 | | | $ | 0.84 | | | $ | 0.89 | |
| | | | | | | | | | | | | | | | | | | | | |
| Adjusted Earnings per share attributable to common stockholders - diluted | | $ | 0.55 | | | $ | 0.21 | | | $ | 0.69 | | | $ | 0.90 | | | $ | 0.99 | |
| | | | | | | | | | | | | | | | | | | | | |
| Weighted-average shares of common stock outstanding: | | | | | | | | | | | | | | | | | | | | |
| Basic | | | 9,850,967 | | | | 8,857,030 | | | | 6,458,845 | | | | 5,831,135 | | | | 5,948,555 | |
| Diluted | | | 10,033,029 | | | | 8,993,528 | | | | 6,619,848 | | | | 5,963,093 | | | | 6,104,207 | |
| | | | | | | | | | | | | | | | | | | | | |
| Dividends declared per share of common stock | | $ | 0.35 | | | $ | 0.35 | | | $ | 0.35 | | | $ | 0.35 | | | $ | 0.35 | |
| | | | | | | | | | | | | | | | | | | | | |
| Balance Sheet Data: | | | | | | | | | | | | | | | | | | | | |
| Cash and cash equivalents | | $ | 100,529 | | | $ | 28,252 | | | $ | 67,373 | | | $ | 13,009 | | | $ | 15,024 | |
| Development property investments at fair value | | | 163,979 | | | | 117,936 | | | | 95,102 | | | | 84,986 | | | | 65,002 | |
| Operating property loans at fair value | | | 8,790 | | | | 9,965 | | | | 9,905 | | | | 15,090 | | | | 15,035 | |
| Investment in and advances to real estate venture | | | 14,314 | | | | 10,812 | | | | 5,373 | | | | 2,883 | | | | 9,127 | |
| Self-storage real estate owned | | | 7,283 | | | | 7,350 | | | | - | | | | - | | | | - | |
| Total assets | | | 305,127 | | | | 192,429 | | | | 192,779 | | | | 125,826 | | | | 110,233 | |
| Senior loan participations | | | 20,147 | | | | 19,299 | | | | 18,582 | | | | 17,521 | | | | 5,049 | |
| Total liabilities | | | 28,733 | | | | 24,873 | | | | 24,417 | | | | 20,983 | | | | 8,605 | |
| Total equity | | | 276,394 | | | | 167,556 | | | | 168,362 | | | | 104,843 | | | | 101,628 | |
| Common book value / common shares outstanding | | $ | 18.75 | | | $ | 17.57 | | | $ | 17.74 | | | $ | 17.59 | | | $ | 17.04 | |
| Second Quarter 2017 | | 9 |
Jernigan Capital, Inc.
Consolidated Balance Sheets- Trailing Five Quarters
(unaudited, in thousands)
| | | As of | |
| | | June 30, | | | March 31, | | | December 31, | | | September 30, | | | June 30, | |
| | | 2017 | | | 2017 | | | 2016 | | | 2016 | | | 2016 | |
| Assets: | | | | | | | | | | | | | | | | | | | | |
| Cash and cash equivalents | | $ | 100,529 | | | $ | 28,252 | | | $ | 67,373 | | | $ | 13,009 | | | $ | 15,024 | |
| Development property investments at fair value | | | 163,979 | | | | 117,936 | | | | 95,102 | | | | 84,986 | | | | 65,002 | |
| Operating property loans at fair value | | | 8,790 | | | | 9,965 | | | | 9,905 | | | | 15,090 | | | | 15,035 | |
| Investment in and advances to real estate venture | | | 14,314 | | | | 10,812 | | | | 5,373 | | | | 2,883 | | | | 9,127 | |
| Self-storage real estate owned | | | 7,283 | | | | 7,350 | | | | - | | | | - | | | | - | |
| Other loans, at cost | | | 6,619 | | | | 14,826 | | | | 11,752 | | | | 6,243 | | | | - | |
| Deferred costs | | | 2,305 | | | | 2,294 | | | | 2,207 | | | | 2,690 | | | | - | |
| Prepaid expenses and other assets | | | 1,119 | | | | 809 | | | | 868 | | | | 727 | | | | 5,816 | |
| Fixed assets, net | | | 189 | | | | 185 | | | | 199 | | | | 198 | | | | 229 | |
| Total assets | | $ | 305,127 | | | $ | 192,429 | | | $ | 192,779 | | | $ | 125,826 | | | $ | 110,233 | |
| | | | | | | | | | | | | | | | | | | | | |
| Liabilities: | | | | | | | | | | | | | | | | | | | | |
| Senior loan participations | | $ | 20,147 | | | $ | 19,299 | | | $ | 18,582 | | | $ | 17,521 | | | $ | 5,049 | |
| Due to Manager | | | 1,027 | | | | 839 | | | | 1,008 | | | | 579 | | | | 636 | |
| Accounts payable, accrued expenses and other liabilities | | | 2,399 | | | | 1,040 | | | | 697 | | | | 796 | | | | 833 | |
| Dividends payable | | | 5,160 | | | | 3,695 | | | | 4,130 | | | | 2,087 | | | | 2,087 | |
| Total liabilities | | $ | 28,733 | | | $ | 24,873 | | | $ | 24,417 | | | $ | 20,983 | | | $ | 8,605 | |
| | | | | | | | | | | | | | | | | | | | | |
| Equity: | | | | | | | | | | | | | | | | | | | | |
| Jernigan Capital, Inc. stockholders’ equity: | | | | | | | | | | | | | | | | | | | | |
| Cumulative preferred stock | | $ | 9,445 | | | $ | 9,446 | | | $ | 9,448 | | | $ | - | | | $ | - | |
| Common stock | | | 142 | | | | 90 | | | | 90 | | | | 60 | | | | 60 | |
| Additional paid-in capital | | | 272,525 | | | | 163,772 | | | | 162,664 | | | | 108,982 | | | | 108,674 | |
| Accumulated deficit | | | (5,718 | ) | | | (5,752 | ) | | | (3,840 | ) | | | (4,199 | ) | | | (7,106 | ) |
| Total equity | | | 276,394 | | | | 167,556 | | | | 168,362 | | | | 104,843 | | | | 101,628 | |
| Total liabilities and equity | | $ | 305,127 | | | $ | 192,429 | | | $ | 192,779 | | | $ | 125,826 | | | $ | 110,233 | |
| Second Quarter 2017 | | 10 |
Jernigan Capital, Inc.
Consolidated Statements of Operations
(unaudited, in thousands, except per share data)
| | | Three months ended June 30, | | | Six months ended June 30, | |
| | | 2017 | | | 2016 | | | 2017 | | | 2016 | |
| Revenues: | | | | | | | | | | | | | | | | |
| Interest income from investments | | $ | 2,467 | | | $ | 1,533 | | | $ | 4,586 | | | $ | 2,676 | |
| Rental and other property related income from real estate owned | | | 105 | | | | - | | | | 168 | | | | - | |
| Other revenues | | | 27 | | | | - | | | | 146 | | | | - | |
| Total revenues | | | 2,599 | | | | 1,533 | | | | 4,900 | | | | 2,676 | |
| | | | | | | | | | | | | | | | | |
| Costs and expenses: | | | | | | | | | | | | | | | | |
| General and administrative expenses | | | 1,371 | | | | 1,335 | | | | 2,949 | | | | 2,639 | |
| Management fees to Manager | | | 707 | | | | 402 | | | | 1,337 | | | | 816 | |
| Property operating expenses of real estate owned | | | 81 | | | | - | | | | 136 | | | | - | |
| Transaction and other expenses | | | - | | | | 175 | | | | - | | | | 2,127 | |
| Restructuring costs | | | - | | | | 47 | | | | - | | | | 54 | |
| Deferred termination fee to Manager | | | - | | | | 82 | | | | - | | | | 239 | |
| Total costs and expenses | | | 2,159 | | | | 2,041 | | | | 4,422 | | | | 5,875 | |
| | | | | | | | | | | | | | | | | |
| Operating income (loss) | | | 440 | | | | (508 | ) | | | 478 | | | | (3,199 | ) |
| | | | | | | | | | | | | | | | | |
| Other income (expense): | | | | | | | | | | | | | | | | |
| Equity in earnings from unconsolidated real estate venture | | | 595 | | | | 418 | | | | 1,017 | | | | 418 | |
| Change in fair value of investments | | | 4,289 | | | | 5,527 | | | | 5,682 | | | | 9,318 | |
| Interest expense | | | (230 | ) | | | (38 | ) | | | (434 | ) | | | (38 | ) |
| Other interest income | | | 100 | | | | 13 | | | | 234 | | | | 35 | |
| Total other income | | | 4,754 | | | | 5,920 | | | | 6,499 | | | | 9,733 | |
| Net income | | | 5,194 | | | | 5,412 | | | | 6,977 | | | | 6,534 | |
| Net income attributable to preferred stockholders | | | (177 | ) | | | - | | | | (723 | ) | | | - | |
| Net income attributable to common stockholders | | $ | 5,017 | | | $ | 5,412 | | | $ | 6,254 | | | $ | 6,534 | |
| | | | | | | | | | | | | | | | | |
| Basic earnings per share attributable to common stockholders | | $ | 0.50 | | | $ | 0.89 | | | $ | 0.66 | | | $ | 1.07 | |
| Diluted earnings per share attributable to common stockholders | | $ | 0.50 | | | $ | 0.89 | | | $ | 0.66 | | | $ | 1.07 | |
| | | | | | | | | | | | | | | | | |
| Dividends declared per share of common stock | | $ | 0.35 | | | $ | 0.35 | | | $ | 0.70 | | | $ | 0.70 | |
| Second Quarter 2017 | | 11 |
Jernigan Capital, Inc.
Calculation of Adjusted Earnings and Reconciliation to Net Income Attributable to
Common Stockholders – Trailing Five Quarters
(unaudited, in thousands, except per share data)
| | | Three months ended | |
| | | June 30,
2017 | | | March 31,
2017 | | | December 31,
2016 | | | September 30,
2016 | | | June 30,
2016 | |
| | | | | | | | | | | | | | | | |
| Net income attributable to common stockholders | | $ | 5,017 | | | $ | 1,237 | | | $ | 3,493 | | | $ | 4,994 | | | $ | 5,412 | |
| Plus: stock dividends payable to preferred stockholders | | | - | | | | 371 | | | | 823 | | | | - | | | | - | |
| | | | | | | | | | | | | | | | | | | | | |
| Plus: stock-based compensation | | | 435 | | | | 292 | | | | 252 | | | | 341 | | | | 312 | |
| | | | | | | | | | | | | | | | | | | | | |
| Plus: depreciation on real estate assets | | | 38 | | | | 24 | | | | - | | | | - | | | | - | |
| | | | | | | | | | | | | | | | | | | | | |
| Plus: transaction and other expenses | | | - | | | | - | | | | - | | | | 2 | | | | 175 | |
| | | | | | | | | | | | | | | | | | | | | |
| Plus: restructuring costs | | | - | | | | - | | | | - | | | | - | | | | 47 | |
| | | | | | | | | | | | | | | | | | | | | |
| Plus: deferred termination fee to Manager | | | - | | | | - | | | | - | | | | - | | | | 82 | |
| | | | | | | | | | | | | | | | | | | | | |
| Adjusted Earnings | | $ | 5,490 | | | $ | 1,924 | | | $ | 4,568 | | | $ | 5,337 | | | $ | 6,028 | |
| | | | | | | | | | | | | | | | | | | | | |
| Adjusted Earnings per share attributable to common stockholders - diluted | | $ | 0.55 | | | $ | 0.21 | | | $ | 0.69 | | | $ | 0.90 | | | $ | 0.99 | |
| Weighted average shares of common stock outstanding - diluted | | | 10,033,029 | | | | 8,993,528 | | | | 6,619,848 | | | | 5,963,093 | | | | 6,104,207 | |
| Second Quarter 2017 | | 12 |
Jernigan Capital, Inc.
Schedule of Debt
June 30, 2017
(unaudited, dollars in thousands)
| (dollars in thousands) | | Collateral | | Commitment | | | Interest
Rate | | | 6/30/17
Balance (1) | | | Debt to
Total
Investment
Cost | | | Debt to
Total
Fair Value | | | Debt to
Total
Assets | |
| Senior Participation | | New Orleans(2) | | $ | 2,800 | | | | 5.07 | % | | $ | 1,820 | | | | 65.0 | % | | | 65.2 | % | | | 0.6 | % |
| Senior Participation | | Miami (3) | | | 17,733 | | | | 4.32 | % | | | 732 | | | | 4.1 | % | | | 8.1 | % | | | 0.2 | % |
| Senior Participation | | Atlanta 1(4) | | | 7,228 | | | | 4.72 | % | | | 4,510 | | | | 62.4 | % | | | 42.0 | % | | | 1.5 | % |
| Senior Participation | | Atlanta 2(4) | | | 5,378 | | | | 4.72 | % | | | 3,257 | | | | 60.6 | % | | | 36.0 | % | | | 1.1 | % |
| Senior Participation | | Orlando 1(4) | | | 4,444 | | | | 4.72 | % | | | 2,864 | | | | 64.5 | % | | | 38.4 | % | | | 0.9 | % |
| Senior Participation | | Tampa 1(4) | | | 4,774 | | | | 4.72 | % | | | 3,048 | | | | 63.8 | % | | | 47.9 | % | | | 1.0 | % |
| Senior Participation | | Charlotte 1(4) | | | 6,777 | | | | 4.72 | % | | | 4,041 | | | | 59.6 | % | | | 39.0 | % | | | 1.3 | % |
| Total | | | | $ | 49,134 | | | | 4.60 | % | | $ | 20,272 | | | | 41.3 | % | | | 36.4 | % | | | 6.6 | % |
| (1) | Includes total unamortized fees of $125,000. |
| (2) | On July 20, 2017, the Company received proceeds of $2.8 million for an early payoff on the Note, and the Company repurchased this senior participation. |
| (3) | This senior participation matures in 2018. |
| (4) | On July 25, 2017, the Company entered into a senior secured revolving credit facility of up to $100 million. At closing, the Company borrowed $20.0 million of the $33.3 million then available under the credit facility. The Company used the proceeds to repurchase these five senior participation interests. On July 26, 2017, the Company used proceeds from its recently completed offering of its common stock to fully repay the $20.0 million borrowed at closing, leaving $33.3 million available under the credit facility for future draws |

| Second Quarter 2017 | | 13 |
Jernigan Capital, Inc.
Schedule of Completed Development Projects
As of June 30, 2017
(unaudited, dollars in thousands)
| Closing Date | | Location (MSA)
Address | | Commitment | | | Funded
Investment | | | Remaining
Unfunded
Commitment | | | Fair Value | | | Senior
Participation
Amount | | | Net
Investment | | | Size
(NRSF)(4) | | | Date
Opened | | Months
Open(1) | | % Physical
Occupancy(1) | |
| 4/21/2015 | | Orlando 1
11920 W Colonial Drive | | $ | 5,372 | | | $ | 5,367 | | | $ | 5 | | | $ | 1,347 | (2) | | $ | 2,864 | | | $ | 2,503 | | | | 51,235 | | | 5/1/2016 | | 15 | | | 90.5 | % |
| 6/10/2015 | | Atlanta 1
5110 McGinnis Ferry Rd | | | 8,132 | | | | 7,908 | | | | 224 | | | | 10,736 | | | | 4,510 | | | | 3,398 | | | | 71,968 | | | 5/25/2016 | | 14 | | | 61.8 | % |
| 6/19/2015 | | Tampa 1
12832 S US Highway 301 | | | 5,369 | | | | 5,285 | | | | 84 | | | | 6,369 | | | | 3,048 | | | | 2,237 | | | | 50,090 | | | 4/11/2016 | | 16 | | | 83.7 | % |
| 6/26/2015 | | Atlanta 2
340 Franklin Gateway | | | 6,050 | | | | 5,684 | | | | 366 | | | | 9,043 | | | | 3,257 | | | | 2,427 | | | | 66,282 | | | 5/24/2016 | | 14 | | | 73.7 | % |
| 6/29/2015 | | Charlotte 1
9323 Wright Hill Rd | | | 7,624 | | | | 7,065 | | | | 559 | | | | 10,361 | | | | 4,041 | | | | 3,024 | | | | 87,530 | | | 8/18/2016 | | 11 | | | 39.0 | % |
| 7/2/2015 | | Milwaukee
420 W St Paul Ave | | | 7,650 | | | | 6,870 | | | | 780 | | | | 8,304 | | | | NA | | | | NA | | | | 82,936 | | | 10/9/2016 | (3) | 10 | | | 25.4 | % |
| 7/31/2015 | | New Haven
453 Washington Ave | | | 6,930 | | | | 6,093 | | | | 837 | | | | 8,058 | | | | NA | | | | NA | | | | 64,225 | | | 12/16/2016 | | 8 | | | 43.9 | % |
| 9/30/2015 | | Jacksonville 1
1939 East West Pkwy | | | 6,445 | | | | 5,988 | | | | 457 | | | | 8,320 | | | | NA | | | | NA | | | | 59,848 | | | 8/12/2016 | | 12 | | | 78.9 | % |
| 10/27/2015 | | Austin
251 N AW Grimes Blvd | | | 8,658 | | | | 6,866 | | | | 1,792 | | | | 8,619 | | | | NA | | | | NA | | | | 77,334 | | | 3/16/2017 | | 5 | | | 20.2 | % |
| 8/10/2015 | | Pittsburgh
6400 Hamilton Ave | | | 5,266 | | | | 4,361 | | | | 905 | | | | 5,936 | | | | NA | | | | NA | | | | 46,040 | | | 5/11/2017 | | 3 | | | 9.8 | % |
| Total Completed Development Loans | | $ | 67,496 | | | $ | 61,487 | | | $ | 6,009 | | | $ | 77,093 | | | | | | | | | | | | | | | | | | | | | |
| (2) | In February 2017, the Company purchased, for $1.3 million, 50% of the economic rights of the Class A membership units of the limited liability company which owns this development property investment, thus increasing the Company’s profits interest in this investment from 49.9% to 74.9%. As such, the Company’s investment was reclassified as self-storage real estate owned in the March 31, 2017 Consolidated Balance Sheet. The committed and funded investment amounts in this table pertain to the full terms of the development investment, while, the fair value represents only the portion (25.1%) of the principal balance constituting a loan to the Class A member. |
| (3) | Certificate of Occupancy was received in August 2016, prior to the property being ready for opening by the manager of the project. Property opened to partial leasing in October 2016. All floors opened to leasing in February 2017. |
| (4) | The NRSF includes only climate controlled and non-climate controlled storage space. It does not include retail space, office space, RV space or parking spaces. |
| Second Quarter 2017 | | 14 |
Schedule of Development Projects in Progress
As of June 30, 2017
(unaudited, dollars in thousands)
| Closing Date | | Location (MSA)
Address | | Commitment | | | Funded
Investment | | | Remaining
Unfunded
Commitment | | | Fair Value | | | Size
(NRSF) | | | Construction Start Date | | Estimated C/O
Quarter(1) |
| 8/14/2015 | | Raleigh
1501 Sunrise Ave | | $ | 8,792 | | | $ | 3,417 | | | $ | 5,375 | | | $ | 3,335 | | | | 60,963 | | | Q4 2016 | | Q1 2018 |
| 9/20/2016 | | Charlotte 2
1200 E 10th St | | | 12,888 | | | | 3,029 | | | | 9,859 | | | | 2,796 | | | | 78,264 | | | Q1 2017 | | Q2 2018 |
| 11/17/2016 | | Orlando 2
11920 W Colonial Dr | | | 5,134 | | | | 2,994 | | | | 2,140 | | | | 3,577 | | | | 20,465 | | | Q4 2016 | | Q3 2017 |
| 11/17/2016 | | Jacksonville 2
37 Jefferson Rd | | | 7,530 | | | | 2,847 | | | | 4,683 | | | | 3,011 | | | | 70,930 | | | Q4 2016 | | Q4 2017 |
| 1/4/2017 | | New York City 1
1775 Fifth Ave | | | 16,117 | | | | 11,093 | | | | 5,024 | | | | 12,509 | | | | 107,325 | | | Q1 2017 | | Q3 2017 |
| 1/18/2017 | | Atlanta 3
1484 Northside Dr NW | | | 14,115 | | | | 3,385 | | | | 10,730 | | | | 3,295 | | | | 92,935 | | | Q3 2017 | | Q3 2018 |
| 1/31/2017 | | Atlanta 4
4676 S Atlanta Rd | | | 13,678 | | | | 5,866 | | | | 7,812 | | | | 5,824 | | | | 103,561 | | | Q2 2017 | | Q3 2018 |
| 2/24/2017 | | Orlando 3
12711 E Colonial Dr | | | 8,056 | | | | 905 | | | | 7,151 | | | | 835 | | | | 71,113 | | | Q2 2017 | | Q2 2018 |
| 2/24/2017 | | New Orleans
2709 Severn Ave | | | 12,549 | | | | - | | | | 12,549 | | | | - | | | | 90,315 | | | Q3 2017 | | Q2 2018 |
| 2/27/2017 | | Atlanta 5
56 Peachtree Valley Rd NE | | | 17,492 | | | | 4,854 | | | | 12,638 | | | | 4,737 | | | | 84,988 | | | Q3 2017 | | Q4 2018 |
| 3/1/2017 | | Fort Lauderdale
5601 NE 14th Ave | | | 9,952 | | | | 1,740 | | | | 8,212 | | | | 1,661 | | | | 79,279 | | | Q1 2017 | | Q3 2018 |
| 3/1/2017 | | Houston
1070 Brittmoore Rd | | | 13,630 | | | | 3,532 | | | | 10,098 | | | | 3,445 | | | | 132,967 | | | Q3 2017 | | Q4 2017 |
| 4/14/2017 | | Louisville
2801 N Hurstbourne Pkwy | | | 8,523 | | | | 627 | | | | 7,896 | | | | 542 | | | | 66,150 | | | Q2 2017 | | Q3 2018 |
| 4/20/2017 | | Denver 1
6206 W Alameda Ave | | | 9,806 | | | | 1,873 | | | | 7,933 | | | | 1,783 | | | | 59,150 | | | Q2 2017 | | Q2 2018 |
| 4/20/2017 | | Denver 2
3110 S Wadsworth Blvd | | | 11,164 | | | | 2,137 | | | | 9,027 | | | | 2,035 | | | | 74,615 | | | Q2 2017 | | Q3 2018 |
| 5/2/2017 | | Atlanta 6
2033 Monroe Dr | | | 12,543 | | | | 3,671 | | | | 8,872 | | | | 3,565 | | | | 81,120 | | | Q2 2017 | | Q3 2018 |
| 5/2/2017 | | Tampa 2
9185 Ulmerton Rd | | | 8,091 | | | | 1,584 | | | | 6,507 | | | | 1,508 | | | | 71,400 | | | Q3 2017 | | Q3 2018 |
| 5/19/2017 | | Tampa 3
Lot 3B Crossroads Town Center | | | 9,224 | | | | 1,524 | | | | 7,700 | | | | 1,434 | | | | 70,888 | | | Q3 2017 | | Q3 2018 |
| 6/12/2017 | | Tampa 4
3209 30th Ave S, St | | | 10,266 | | | | 2,391 | | | | 7,875 | | | | 2,293 | | | | 73,500 | | | Q3 2017 | | Q3 2018 |
| 6/19/2017 | | Baltimore
1835 Washington Blvd | | | 10,775 | | | | 2,199 | | | | 8,576 | | | | 2,008 | | | | 83,450 | | | Q3 2017 | | Q3 2018 |
| 6/28/2017 | | Knoxville
7807 Kingston Pike | | | 9,115 | | | | 829 | | | | 8,286 | | | | 738 | | | | 72,069 | | | Q3 2017 | | Q4 2018 |
| 6/29/2017 | | Boston
329 Boston Post Rd | | | 14,103 | | | | 1,466 | | | | 12,637 | | | | 1,326 | | | | 93,738 | | | Q3 2017 | | Q3 2018 |
| 6/30/2017 | | New York City 2
465 W 150th St | | | 26,482 | | | | 16,004 | | | | 10,478 | | | | 15,637 | | | | 40,593 | | | Q3 2017 | | Q3 2018 |
| Total Development Loan in Progress | | $ | 270,025 | | | $ | 77,967 | | | $ | 192,058 | | | $ | 77,894 | | | | | | | | | |
| (1) | Estimated C/O dates represent the Company’s best estimate as of June 30, 2017 based on project specific information learned through underwriting and communications with respective developers. These dates are subject to change due to unexpected project delays/efficiencies. |
| Second Quarter 2017 | | 15 |
Schedule of Heitman JV Development Projects in Progress
As of June 30, 2017
(unaudited, dollars in thousands)
| Closing Date | | Location (MSA)
Address | | Commitment | | | Funded
Investment | | | Remaining
Unfunded
Commitment | | | Fair Value | | | Size
(NRSF) | | | Construction
Start date | | Estimated C/O
Quarter(1) |
| 5/14/2015 | | Miami 1
490 NW 36th St | | $ | 13,867 | | | $ | 8,631 | | | $ | 5,236 | | | $ | 9,610 | | | | 75,838 | | | Q1 2016 | | Q4 2017 |
| 5/14/2015 | | Miami 2
1100 NE 79th St | | | 14,849 | | | | 7,299 | | | | 7,550 | | | | 7,321 | | | | 74,113 | | | Q2 2016 | | Q4 2017 |
| 9/25/2015 | | Fort Lauderdale
812 NW 1st St | | | 13,230 | | | | 5,531 | | | | 7,699 | | | | 5,419 | | | | 87,413 | | | Q2 2016 | | Q1 2018 |
| 4/15/2016 | | Washington, DC
1325 Kenilworth Ave | | | 17,269 | | | | 11,628 | | | | 5,641 | | | | 12,600 | | | | 90,500 | | | Q2 2016 | | Q3 2017 |
| 4/29/2016 | | Atlanta 1
1801 Savoy Dr | | | 10,223 | | | | 3,475 | | | | 6,748 | | | | 3,641 | | | | 71,575 | | | Q4 2016 | | Q1 2018 |
| 7/19/2016 | | Jacksonville
3211 San Pablo Rd S | | | 8,127 | | | | 5,697 | | | | 2,430 | | | | 7,398 | | | | 79,163 | | | Q4 2016 | | Q3 2017 |
| 7/21/2016 | | New Jersey
10 Central Ave | | | 7,828 | | | | 1,161 | | | | 6,667 | | | | 1,090 | | | | 57,975 | | | Q2 2017 | | Q2 2018 |
| 8/15/2016 | | Atlanta 2
11220 Medlock Bridge Rd | | | 8,772 | | | | 4,900 | | | | 3,872 | | | | 5,474 | | | | 70,400 | | | Q3 2016 | | Q3 2017 |
| 8/25/2016 | | Denver
2225 E 104th Ave | | | 11,032 | | | | 6,100 | | | | 4,932 | | | | 6,811 | | | | 86,631 | | | Q4 2016 | | Q3 2017 |
| 9/28/2016 | | Columbia
419 Hampton St | | | 9,199 | | | | 5,462 | | | | 3,737 | | | | 5,819 | | | | 70,813 | | | Q4 2016 | | Q4 2017 |
| 12/22/2016 | | Raleigh
7620 ACC Blvd | | | 8,877 | | | | 1,641 | | | | 7,236 | | | | 1,583 | | | | 65,110 | | | Q1 2017 | | Q2 2018 |
| Total Heitman JV Investments | | $ | 123,273 | | | $ | 61,525 | | | $ | 61,748 | | | $ | 66,766 | | | | | | | | | |
| (1) | Estimated C/O dates represent the Company’s best estimate as of June 30, 2017 based on project specific information learned through underwriting and communications with respective developers. These dates are subject to change due to unexpected project delays/efficiencies. |
| Second Quarter 2017 | | 16 |
Closed Investments by Geography
As of June 30, 2017
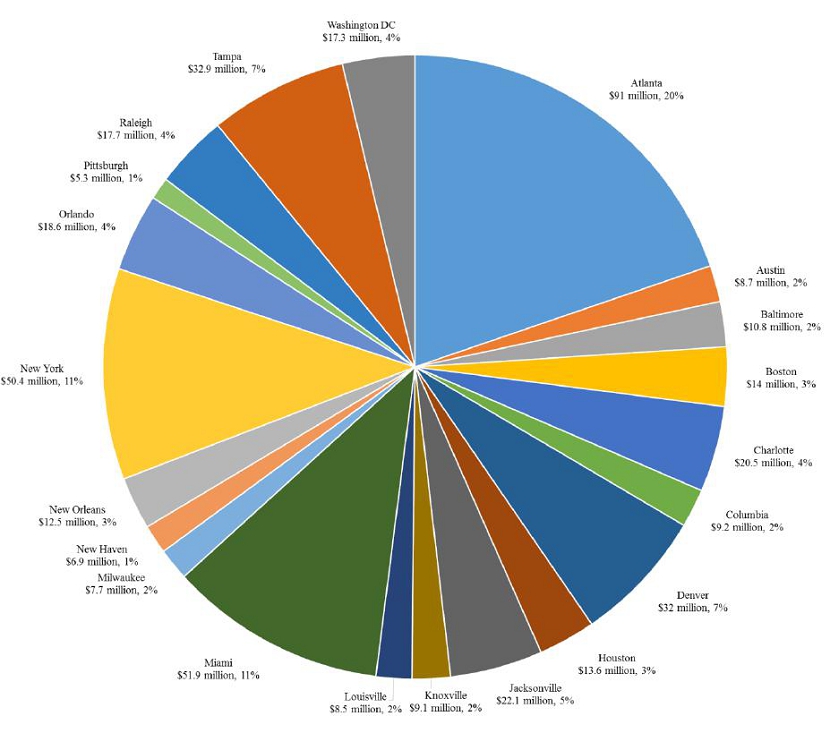
| Second Quarter 2017 | | 17 |
Investment Pipeline by Geography
| · | Executed term sheets for investments in 15 separate self-storage development projects for an aggregate capital commitment of approximately $174 million |
| · | Maintain a robust $700 million pipeline of additional development investment opportunities in top 50 markets |
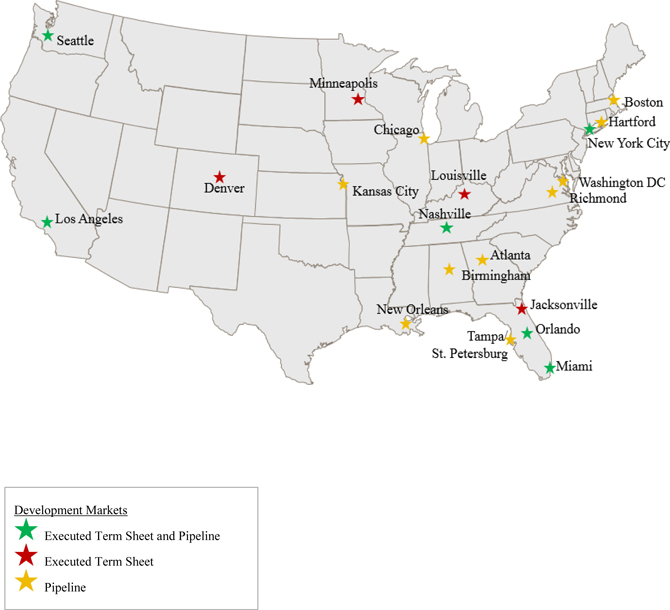
| Second Quarter 2017 | | 18 |
Jernigan Capital, Inc.
Company Information
| Corporate Headquarters | Trading Symbol | Investor Relations | Information Requests |
| 6410 Poplar Avenue | Common shares: JCAP | 6410 Poplar Avenue | To request an Investor Relations |
| Suite 650 | Stock Exchange Listing | Suite 650 | package or annual report, please |
| Memphis, TN 38119 | New York Stock Exchange | Memphis, TN 38119 | visit our website at |
| 901.567.9510 | | 901.567.9510 | www.jernigancapital.com |
Executive Management
| Dean Jernigan | John A. Good |
| Chairman and Chief Executive Officer | President and Chief Operating Officer |
| | |
| Kelly P. Luttrell | |
| Senior Vice President, Chief Financial Officer, and Treasurer | |
Independent Directors
| Mark O. Decker | James D. Dondero |
| Director | Director |
| | |
| Howard A. Silver | Harry J. Thie |
| Director | Director |
Equity Research Coverage
| Baird Equity Research | FBR Capital Markets |
| RJ Milligan | David Corak |
| rjmilligan@rwbaird.com | dcorak@fbr.com |
| | |
| Jefferies LLC | Raymond James & Associates |
| George Hoglund | Jonathan Hughes |
| gholund@jefferies.com | jonathan.hughes@raymondjames.com |
Any opinions, estimates, forecasts or predictions regarding Jernigan Capital’s performance made by these analysts are theirs alone and do not represent opinions, estimates, forecasts or predictions of Jernigan Capital or its management. Jernigan Capital does not by its reference above or distribution imply its endorsement of or concurrence with such opinions, estimates, forecasts or predictions.
| Second Quarter 2017 | | 19 |