Exhibit 99.1

1 Investor Presentation April 2018
2 Safe Harbor Disclosure Regarding Forward - Looking Statements This presentation includes "forward - looking statements" within the meaning of Section 27A of the Securities Act of 1933 and Sect ion 21E of the Securities Exchange Act of 1934 and other federal securities laws, our future performance, future book value, rates of return, ability to obtain future financing, including our ability to increase the capacity under our credit facility, exit capitalization rates, ou r use of capital, the timing of our investment cycle, the expected timing of certificates of occupancy, our ability to acquire wholly - owned assets, fu ture profits from investments, our future stock price, our dividends to our common stockholders and the holders of our Series A and Series B Pr efe rred Stock, our loan pipeline, our anticipated loan closings, future funding of existing loan commitments, and components of our first qu art er 2018 and full - year 2018 earnings guidance. The ultimate occurrence of events and results referenced in these forward - looking statements is sub ject to known and unknown risks and uncertainties, many of which are beyond our control. Such risks include our ability to obtain additiona l l iquidity to fund our loan pipeline, our ability to make distributions at expected levels, the potential impact of interest rate fluctuations, the uncertainty as to the value of our investments, the lack of liquidity in our investments and whether we can realize expected gains from our equity par ticipation interests. These forward - looking statements are based upon our present intentions and expectations, but the events and results r eferenced in these statements are not guaranteed to occur. Investors should not place undue reliance upon forward - looking statements. There c an be no assurance that our expectations of the future performance of our investments will be achieved. This information provided here in is as of this date, and we undertake no duty to update any forward - looking statements contained herein. For a discussion of these and other ri sks facing our business, see the information under the heading “Risk Factors” in our Annual Report on Form 10 - K for the year ended December 31, 2017 and in other filings we make with the Securities and Exchange Commission (“SEC”) from time to time, which are accessible on the S EC’ s website at www.sec.gov . This presentation contains statistics and other data that has been obtained from or compiled from information made available by third parties. We have not independently verified such statistics or data. Unless otherwise indicated, all metrics presented herein are as of December 31, 2017 . Contact: Jernigan Capital, Inc. Investor Relations (901) 567 - 9580 investorrelations@jernigancapital.com
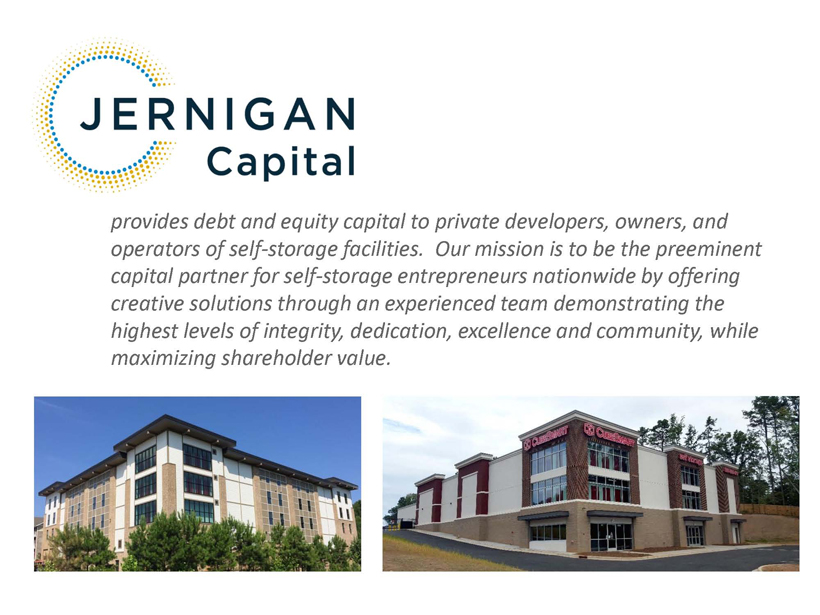
3 provides debt and equity capital to private developers, owners, and operators of self - storage facilities. Our mission is to be the preeminent capital partner for self - storage entrepreneurs nationwide by offering creative solutions through an experienced team demonstrating the highest levels of integrity, dedication, excellence and community, while maximizing shareholder value.
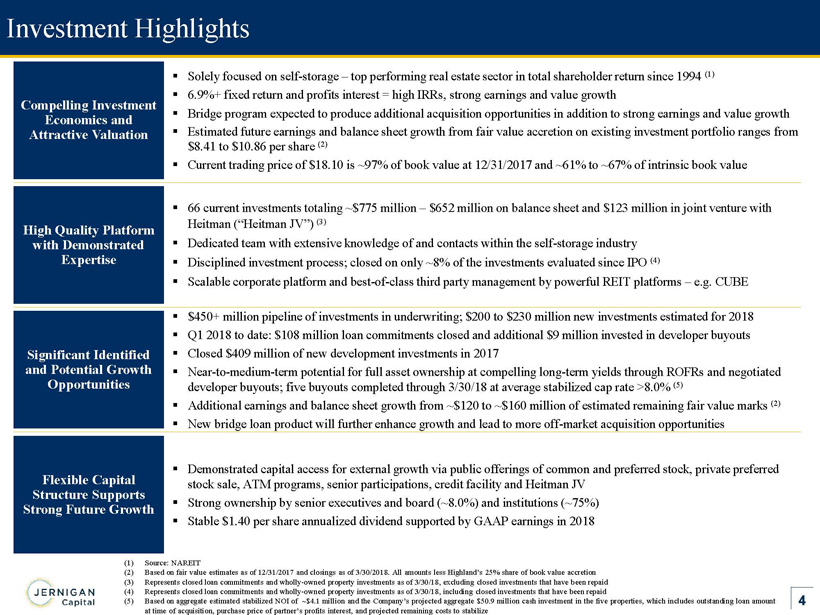
4 ▪ $450+ million pipeline of investments in underwriting; $200 to $230 million new investments estimated for 2018 ▪ Q1 2018 to date: $108 million loan commitments closed and additional $9 million invested in developer buyouts ▪ Closed $409 million of new development investments in 2017 ▪ Near - to - medium - term potential for full asset ownership at compelling long - term yields through ROFRs and negotiated developer buyouts; five buyouts completed through 3/30/18 at average stabilized cap rate >8.0% (5) ▪ Additional earnings and balance sheet growth from ~$120 to ~$160 million of estimated remaining fair value marks (2 ) ▪ New bridge loan product will further enhance growth and lead to more off - market acquisition opportunities Significant Identified and Potential Growth Opportunities Investment Highlights Compelling Investment Economics and Attractive Valuation ▪ Solely focused on self - storage – top performing real estate sector in total shareholder return since 1994 (1) ▪ 6.9%+ fixed return and profits interest = high IRRs, strong earnings and value growth ▪ Bridge program expected to produce additional acquisition opportunities in addition to strong earnings and value growth ▪ E stimated future earnings and balance sheet growth from fair value accretion on existing investment portfolio ranges from $8.41 to $10.86 per share (2) ▪ Current trading price of $18.10 is ~97% of book value at 12/31/2017 and ~61% to ~67% of intrinsic book value Flexible Capital Structure Supports Strong Future Growth ▪ Demonstrated capital access for external growth via public offerings of common and preferred stock, private preferred stock sale, ATM programs, senior participations, credit facility and Heitman JV ▪ Strong ownership by senior executives and board (~8.0%) and institutions (~75%) ▪ Stable $1.40 per share annualized dividend supported by GAAP earnings in 2018 (1) Source: NAREIT (2) Based on fair value estimates as of 12/31/2017 and closings as of 3/30/2018. All amounts less Highland’s 25% share of book va lue accretion (3) Represents closed loan commitments and wholly - owned property investments as of 3/30/18, excluding closed investments that have b een repaid (4) Represents closed loan commitments and wholly - owned property investments as of 3/30/18, including closed investments that have been repaid (5) Based on aggregate estimated stabilized NOI of ~$4.1 million and the Company’s projected aggregate $50.9 million cash investment in the five properties , which includes outstanding loan amount at time of acquisition, purchase price of partner’s profits interest, and projected remaining costs to stabilize High Quality Platform with Demonstrated Expertise ▪ 66 current investments totaling ~$ 775 million – $ 652 million on balance sheet and $123 million in joint venture with Heitman (“Heitman JV ”) (3) ▪ Dedicated team with extensive knowledge of and contacts within the self - storage industry ▪ Disciplined investment process; closed on only ~8% of the investments evaluated since IPO (4) ▪ Scalable corporate platform and best - of - class third party management by powerful REIT platforms – e.g. CUBE

5 Experienced and Aligned Senior Management Team ~ 8.0% Management and Board Ownership Creates Significant Alignment of Interests Dean Jernigan Chairman of the Board & Chief Executive Officer John Good President & Chief Operating Officer Kelly Luttrell Senior Vice President & Chief Financial Officer ▪ 32+ years of experience ▪ Has invested over $3 billion of capital in the self - storage industry ▪ CEO of CubeSmart from 2006 to 2013 ▪ Chairman and CEO of Storage USA from 1984 to 2002 ▪ Member of NAREIT’s Board of Governors from 1995 to 2002 ▪ Member of NAREIT’s Executive Committee from 1998 to 2002 ▪ 28+ years of experience with nationally - known corporate/securities law firms ▪ Former outside corporate and securities counsel to CubeSmart and IPO counsel for Jernigan Capital ▪ Nationally recognized corporate and securities lawyer, lead counsel on over 200 securities offerings raising in excess of $25 billion and M&A transactions in excess of $17 billion ▪ Previously ranked by Chambers USA as a leading lawyer to the REIT industry and has been active in NAREIT since 1994 ▪ 14+ years of accounting experience, including 11 years in Ernst & Young’s assurance practice ▪ Extensive experience providing assurance services, including involvement with multiple equity and debt transactions, for publicly - traded companies ranging from small cap companies to Fortune 100 companies ▪ Served in a leadership role for several years on large multifamily REIT engagement
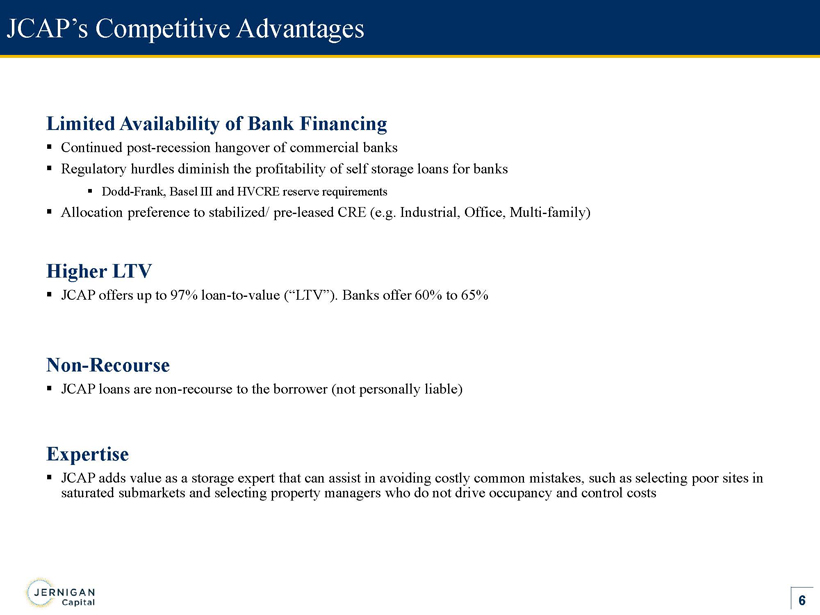
6 JCAP’s Competitive Advantages Limited Availability of Bank Financing ▪ Continued post - recession hangover of commercial banks ▪ Regulatory hurdles diminish the profitability of self storage loans for banks ▪ Dodd - Frank, Basel III and HVCRE reserve requirements ▪ Allocation p reference to stabilized/ pre - leased CRE (e.g. Industrial, Office, Multi - family) Higher LTV ▪ JCAP offers up to 97% loan - to - value (“LTV”). Banks offer 60% to 65% Non - Recourse ▪ JCAP loans are non - recourse to the borrower (not personally liable) Expertise ▪ JCAP adds value as a storage expert that can assist in avoiding costly common mistakes, such as selecting poor sites in saturated submarkets and selecting property managers who do not drive occupancy and control costs
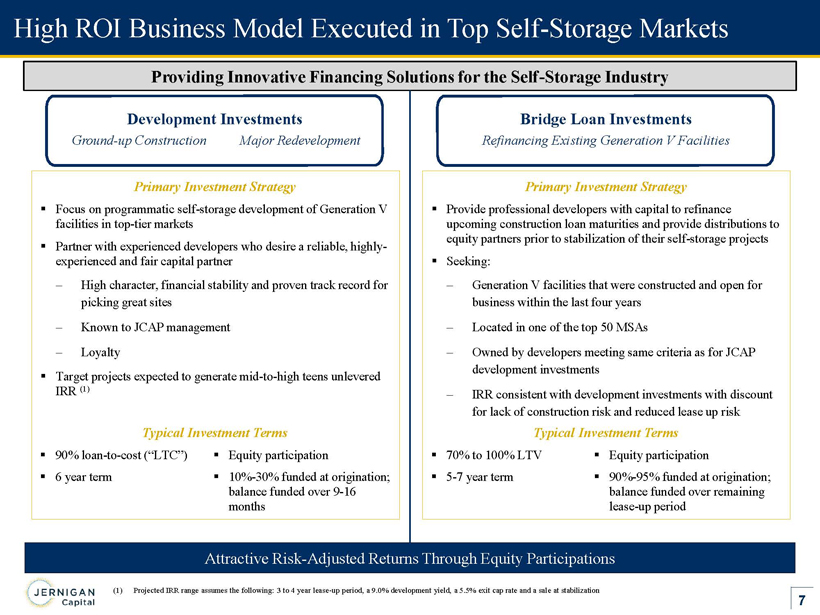
7 High ROI Business Model Executed in Top Self - Storage Markets Providing Innovative Financing Solutions for the Self - Storage Industry Attractive Risk - Adjusted Returns Through Equity Participations Deve l op m ent Investments G r ound - up C onstruction Major R e d eve lopm e nt ▪ F ocus on programmatic self - storage development of Generation V facilities in top - tier markets ▪ Partner with experienced developers who desire a reliable, highly - experienced and fair capital partner – High character, financial stability and proven track record for picking great sites – Known to JCAP management – Loyalty ▪ Target projects expected to generate mid - to - high teens unlevered IRR (1) ▪ 90% loan - to - cost (“LTC”) ▪ 6 year term ▪ Equity participation ▪ 10% - 30% fund e d a t o r i g ination; b a l a n c e funded ov e r 9 - 16 months Typical Investment Terms Primary Investment Strategy Bridge Loan Investments Refinancing Existing Generation V Facilities ▪ P rovide professional developers with capital to refinance upcoming construction loan maturities and provide distributions to equity partners prior to stabilization of their self - storage projects ▪ Seeking: – Generation V facilities that were constructed and open for business within the last four years – Located in one of the top 50 MSAs – Owned by developers meeting same criteria as for JCAP development investments – IRR consistent with development investments with discount for lack of construction risk and reduced lease up risk ▪ 70% to 100% LTV ▪ 5 - 7 year term ▪ Equity participation ▪ 90% - 95% funded at origination; balance funded over remaining lease - up period Typical Investment Terms Primary Investment Strategy (1) Projected IRR range assumes the following: 3 to 4 year lease - up period, a 9.0% development yield, a 5.5% exit cap rate and a sal e at stabilization
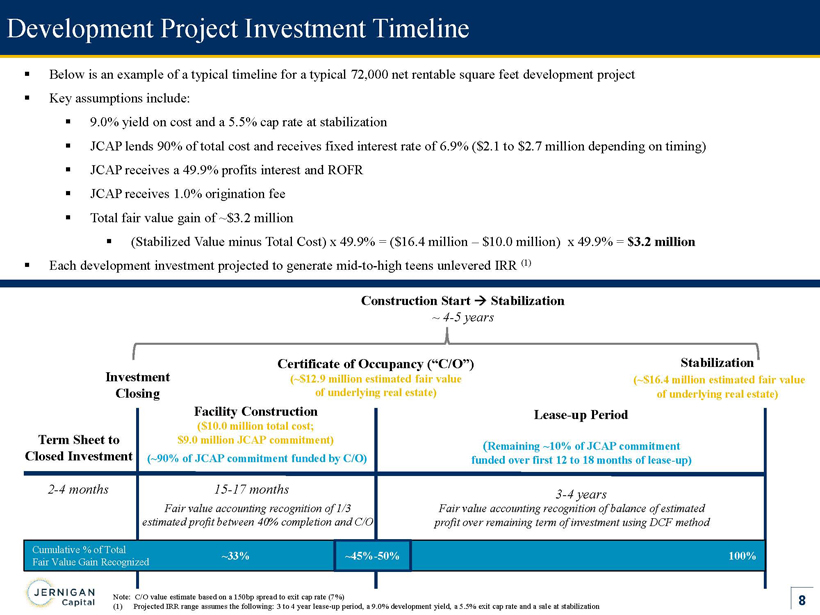
8 Development Project Investment Timeline ▪ Below is an example of a typical timeline for a typical 72,000 net rentable square feet development project ▪ Key assumptions include: ▪ 9.0 % yield on cost and a 5.5% cap rate at stabilization ▪ JCAP lends 90% of total cost and receives fixed interest rate of 6.9% ($ 2.1 to $2.7 million depending on timing ) ▪ JCAP receives a 49.9% profits interest and ROFR ▪ JCAP receives 1.0 % origination fee ▪ Total fair value gain of ~$3.2 million ▪ ( Stabilized Value minus Total Cost) x 49.9% = ($16.4 million – $10.0 million) x 49.9% = $3.2 million ▪ Each development investment projected to generate mid - to - high teens unlevered IRR (1) Fair value a ccounting recognition of 1/3 estimated profit between 40% completion and C/O Fair value a ccounting recognition of balance of estimated profit over remaining term of investment using DCF method Term Sheet to Closed Investment Facility Construction ($10.0 million total cost; $9.0 million JCAP commitment) Lease - up Period Certificate of Occupancy (“C/O”) (~$12.9 million estimated fair value of underlying real estate) Investment Closing Stabilization (~$16.4 million estimated fair value of underlying real estate) Construction Start Stabilization ~ 4 - 5 years (~90% of JCAP commitment funded by C/O) 15 - 17 months 3 - 4 years ( Remaining ~10% of JCAP commitment funded over first 12 to 18 months of lease - up) 2 - 4 months Cumulative % of Total Fair Value Gain Recognized ~33% ~45% - 50% 100% Note: C/O value estimate based on a 150bp spread to exit cap rate (7 %) (1) Projected IRR range assumes the following: 3 to 4 year lease - up period, a 9.0% development yield, a 5.5% exit cap rate and a sal e at stabilization
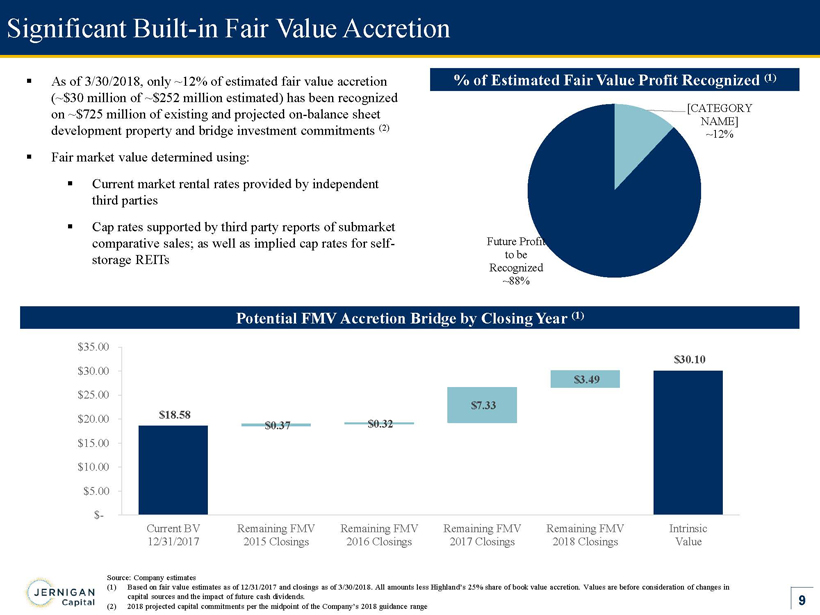
9 Significant Built - in Fair Value Accretion Source: Company estimates (1) Based on fair value estimates as of 12/31/2017 and closings as of 3/30/2018. All amounts less Highland’s 25% share of book value accretion. Values are before consideration of changes in capital sources and the impact of future cash dividends. (2) 2018 projected capital commitments per the midpoint of the Company’s 2018 guidance range ▪ As of 3/30/2018, only ~12% of estimated fair value accretion (~$30 million of ~$252 million estimated) has been recognized on ~$725 million of existing and projected on - balance sheet development property and bridge investment commitments (2) ▪ Fair market value determined using: ▪ Current market rental rates provided by independent third parties ▪ Cap rates supported by third party reports of submarket comparative sales; as well as implied cap rates for self - storage REITs % of Estimated Fair Value Profit Recognized ( 1 ) Potential FMV Accretion Bridge by Closing Year (1) [CATEGORY NAME] ~12% Future Profit to be Recognized ~88% $0.37 $0.32 $7.33 $3.49 $18.58 $30.10 $- $5.00 $10.00 $15.00 $20.00 $25.00 $30.00 $35.00 Current BV 12/31/2017 Remaining FMV 2015 Closings Remaining FMV 2016 Closings Remaining FMV 2017 Closings Remaining FMV 2018 Closings Intrinsic Value
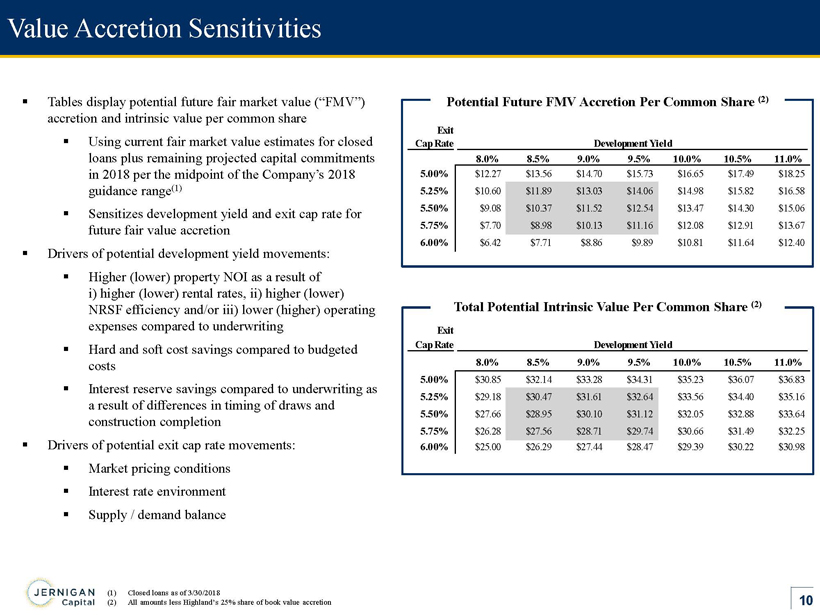
10 Value Accretion Sensitivities (1) Closed loans as of 3/30/2018 (2) All amounts less Highland’s 25% share of book value accretion ▪ Tables display potential future fair market value (“FMV”) accretion and intrinsic value per common share ▪ Using current fair market value estimates for closed loans plus remaining projected capital commitments in 2018 per the midpoint of the Company’s 2018 guidance range (1) ▪ Sensitizes development yield and exit cap rate for future fair value accretion ▪ Drivers of potential development yield movements: ▪ Higher (lower) property NOI as a result of i ) higher (lower) rental rates, ii) higher (lower) NRSF efficiency and/or iii) lower (higher) operating expenses compared to underwriting ▪ Hard and soft cost savings compared to budgeted costs ▪ Interest reserve savings compared to underwriting as a result of differences in timing of draws and construction completion ▪ Drivers of potential exit cap rate movements: ▪ Market pricing conditions ▪ I nterest rate environment ▪ S upply / demand balance Potential Future FMV Accretion Per Common Share (2) Total Potential Intrinsic Value Per Common Share (2) Exit Cap Rate Development Yield $11.52 8.0% 8.5% 9.0% 9.5% 10.0% 10.5% 11.0% 5.00% $12.27 $13.56 $14.70 $15.73 $16.65 $17.49 $18.25 5.25% $10.60 $11.89 $13.03 $14.06 $14.98 $15.82 $16.58 5.50% $9.08 $10.37 $11.52 $12.54 $13.47 $14.30 $15.06 5.75% $7.70 $8.98 $10.13 $11.16 $12.08 $12.91 $13.67 6.00% $6.42 $7.71 $8.86 $9.89 $10.81 $11.64 $12.40 Exit Cap Rate Development Yield 8.0% 8.5% 9.0% 9.5% 10.0% 10.5% 11.0% 5.00% $30.85 $32.14 $33.28 $34.31 $35.23 $36.07 $36.83 5.25% $29.18 $30.47 $31.61 $32.64 $33.56 $34.40 $35.16 5.50% $27.66 $28.95 $30.10 $31.12 $32.05 $32.88 $33.64 5.75% $26.28 $27.56 $28.71 $29.74 $30.66 $31.49 $32.25 6.00% $25.00 $26.29 $27.44 $28.47 $29.39 $30.22 $30.98
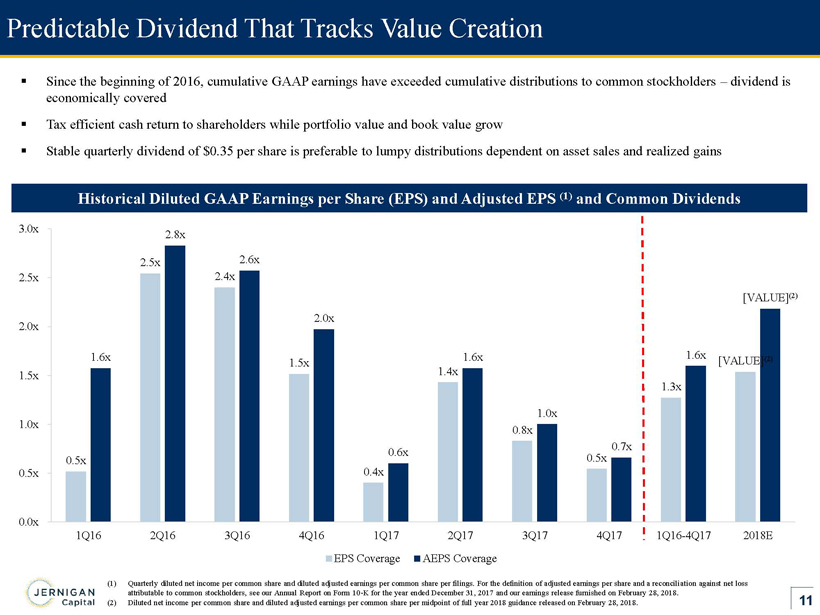
11 Predictable Dividend That Tracks Value Creation (1) Quarterly diluted net income per common share and diluted adjusted earnings per common share per filings. For the definition of adjusted earnings per share and a reconcili ati on against net loss attributable to common stockholders, see our Annual Report on Form 10 - K for the year ended December 31, 2017 and our earnings re lease furnished on February 28, 2018. (2) D iluted net income per common share and diluted adjusted earnings per common share per midpoint of full year 2018 guidance released on February 28, 2018. ▪ Since the beginning of 2016, cumulative GAAP earnings have exceeded cumulative distributions to common stockholders – dividend i s economically covered ▪ Tax efficient cash return to shareholders while portfolio value and book value grow ▪ Stable quarterly dividend of $0.35 per share is preferable to lumpy distributions dependent on asset sales and realized gains Historical Diluted GAAP Earnings per Share ( EPS) and Adjusted EPS (1) and Common Dividends 0.5x 2.5x 2.4x 1.5x 0.4x 1.4x 0.8x 0.5x 1.3x [VALUE] (2) 1.6x 2.8x 2.6x 2.0x 0.6x 1.6x 1.0x 0.7x 1.6x [VALUE] (2) 0.0x 0.5x 1.0x 1.5x 2.0x 2.5x 3.0x 1Q16 2Q16 3Q16 4Q16 1Q17 2Q17 3Q17 4Q17 1Q16-4Q17 2018E EPS Coverage AEPS Coverage
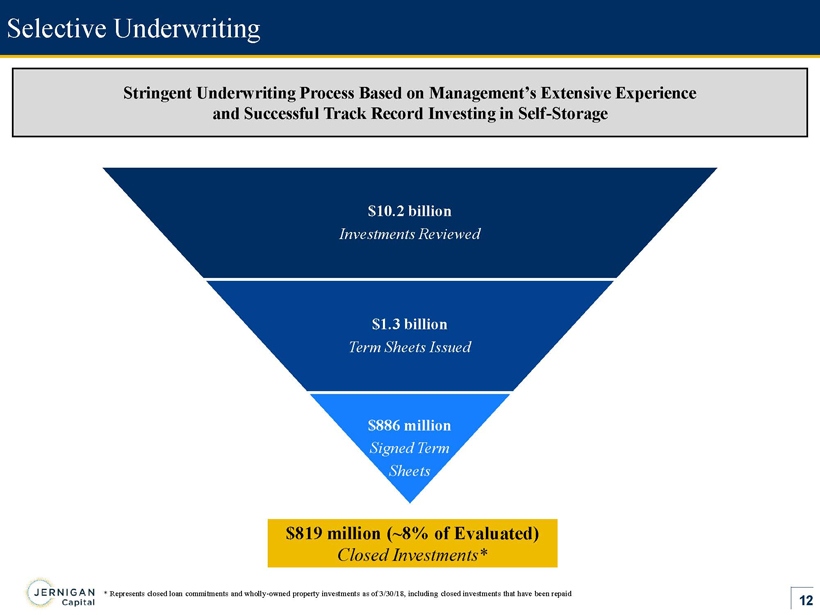
12 Selective Underwriting $10.2 billion Investments Reviewed $ 1.3 billion Term Sheets Issued $886 million Signed Term Sheets $819 million (~8% of Evaluated) Closed Investments* Stringent Underwriting Process Based on Management’s Extensive Experience and Successful Track Record Investing in Self - Storage * Represents closed loan commitments and wholly - owned property investments as of 3/30/18, including closed investments that have been repaid
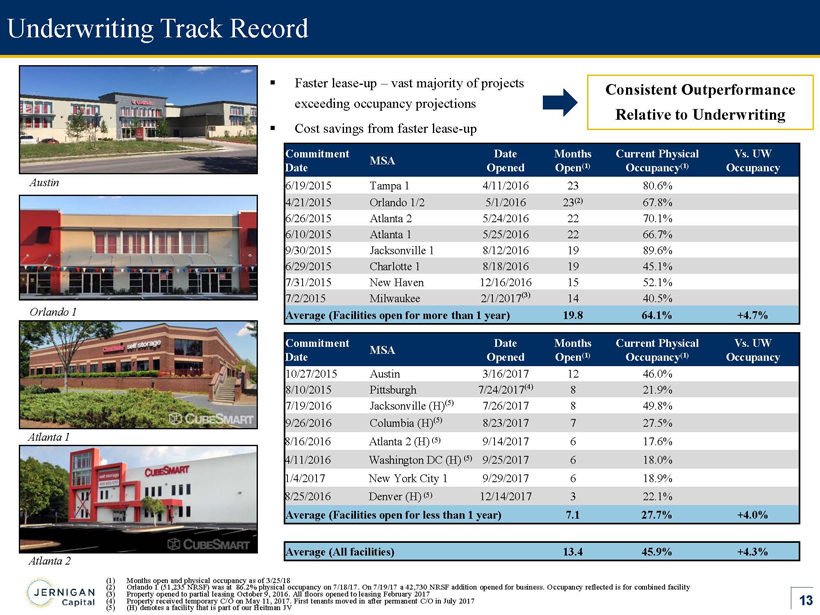
13 Austin Orlando 1 Atlanta 1 Atlanta 2 ▪ Faster lease - up – vast majority of projects exceeding occupancy projections ▪ Cost savings from faster lease - up Consistent Outperformance Relative to Underwriting (1) Months open and physical occupancy as of 3/25/18 (2) Orlando 1 (51,235 NRSF) was at 86.2% physical occupancy on 7/18/17. On 7/19/17 a 42,730 NRSF addition opened for business. O ccu pancy reflected is for combined facility (3) Property opened to partial leasing October 9, 2016. All floors opened to leasing February 2017 (4) Property received temporary C/O on May 11, 2017. First tenants moved in after permanent C/O in July 2017 (5) ( H ) denotes a facility that is part of our Heitman JV Commitment Date MSA Date Opened Months Open (1) Current Physical Occupancy (1) Vs. UW Occupancy 6/19/2015 Tampa 1 4/11/2016 23 80.6% 4/21/2015 Orlando 1/2 5/1/2016 23 (2) 67.8% 6/26/2015 Atlanta 2 5/24/2016 22 70.1% 6/10/2015 Atlanta 1 5/25/2016 22 66.7% 9/30/2015 Jacksonville 1 8/12/2016 19 89.6% 6/29/2015 Charlotte 1 8/18/2016 19 45.1% 7/31/2015 New Haven 12/16/2016 15 52.1% 7/2/2015 Milwaukee 2/1/2017 (3 ) 14 40.5% Average (Facilities open for more than 1 year) 19.8 64.1% +4.7% Commitment Date MSA Date Opened Months Open (1) Current Physical Occupancy (1) Vs. UW Occupancy 10/27/2015 Austin 3/16/2017 12 46.0% 8/10/2015 Pittsburgh 7/24/2017 (4) 8 21.9% 7/19/2016 Jacksonville (H ) (5) 7/26/2017 8 49.8% 9/26/2016 Columbia (H ) (5) 8/23/2017 7 27.5% 8/16/2016 Atlanta 2 (H) (5) 9/14/2017 6 17.6% 4/11/2016 Washington DC (H) (5) 9/25/2017 6 18.0% 1/4/2017 New York City 1 9/29/2017 6 18.9% 8/25/2016 Denver (H) (5) 12/14/2017 3 22.1% Average (Facilities open for less than 1 year) 7.1 27.7% +4.0% Average (All facilities ) 13.4 45.9% +4.3% Underwriting Track Record
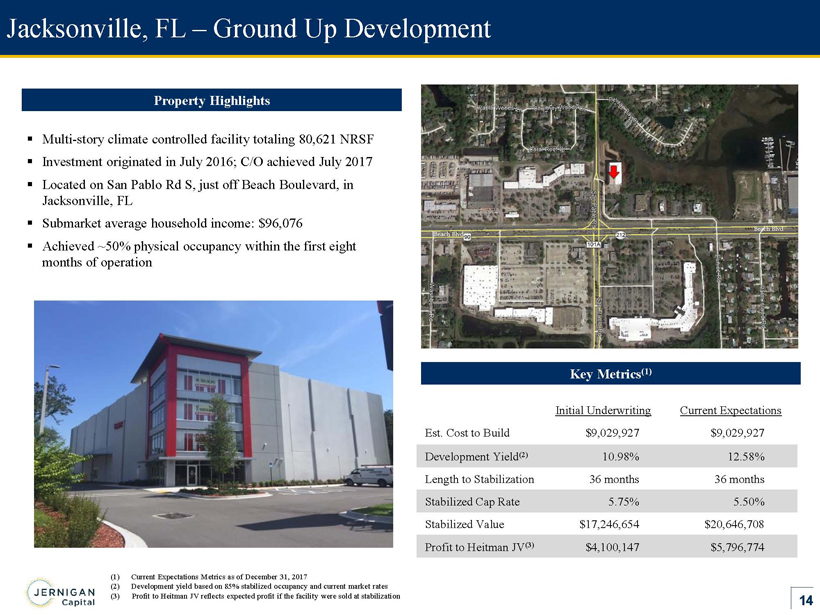
14 Jacksonville, FL – Ground Up Development Initial Underwriting Current Expectations Est. Cost to Build $9,029,927 $9,029,927 Development Yield (2) 10.98% 12.58% Length to Stabilization 36 months 36 months Stabilized Cap Rate 5.75% 5.50% Stabilized Value $17,246,654 $ 20,646,708 Profit to Heitman JV (3) $4,100,147 $ 5,796,774 Key Metrics (1) Property Highlights ▪ Multi - story climate controlled facility totaling 80,621 NRSF ▪ Investment originated in July 2016; C/O achieved July 2017 ▪ Located on San Pablo Rd S, just off Beach Boulevard, in Jacksonville, FL ▪ Submarket average household income: $96,076 ▪ Achieved ~50% physical occupancy within the first eight months of operation (1) Current Expectations Metrics as of December 31, 2017 (2) Development yield based on 85% stabilized occupancy and current market rates (3) Profit to Heitman JV reflects expected profit if the facility were sold at stabilization

15 Attractive Investment Portfolio % On Balance Sheet / % Joint Venture Status of Development Investments ▪ C/O loan - to - value (“LTV”): 72% ▪ Stabilized LTV: 56% ▪ Development investments currently represent 80% of investment portfolio ▪ ~51% of development investments expecting C/O within the next 12 months Notes: Percentage of portfolio based on committed total investment amounts, developers’ interests acquired and loan balances outstanding at the time of acquisition. Portfolio overview statistics exclude pipeline investments, including those with executed term sheets (1) Represents closed loan commitments and wholly - owned property investments as of 3/30/18, excluding closed investments that have been repaid (2) JCAP maintains equity participation on development and bridge investments only (3) Represents developers’ interests acquired and loan balance outstanding at the time of acquisition $775 Million Committed (1 ) / 66 Investments (1 ) Investments by Type (2) On Balance Sheet 84% Joint Venture 16% C/O Expected 2018 42% C/O Expected 2019 31% C/O Expected 2020 5% C/O Achieved 22% Development 80% Bridge 11% [CATEGORY NAME] (3) [VALUE] Construction (C/O takeout) 2% Operating Property 1%
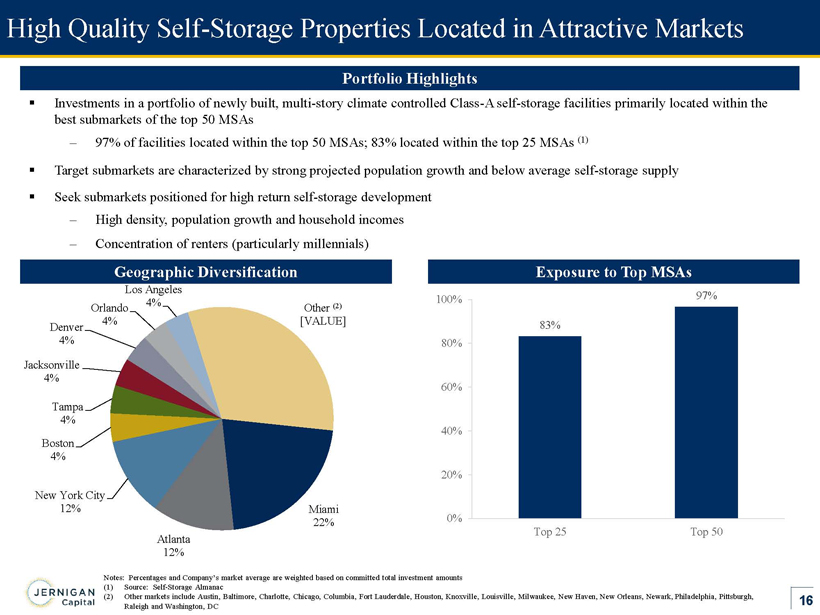
16 High Quality Self - Storage Properties Located in Attractive Markets Notes: Percentages and Company’s market average are weighted based on committed total investment amounts (1) Source: Self - Storage Almanac (2) Other markets include Austin, Baltimore, Charlotte, Chicago , Columbia, Fort Lauderdale, Houston , Knoxville, Louisville , Milwaukee, New Haven, New Orleans, Newark, Philadelphia, Pittsburgh , Raleigh and Washington, DC ▪ Investments in a portfolio of newly built, multi - story climate controlled Class - A self - storage facilities primarily located with in the best submarkets of the top 50 MSAs – 97% of facilities located within the top 50 MSAs; 83% located within the top 25 MSAs (1) ▪ Target submarkets are characterized by strong projected population growth and below average self - storage supply ▪ Seek submarkets positioned for high return self - storage development – High density, population growth and household incomes – Concentration of renters (particularly millennials ) Portfolio Highlights Geographic Diversification Exposure to Top MSAs 83% 97% 0% 20% 40% 60% 80% 100% Top 25 Top 50 Miami 22% Atlanta 12% New York City 12% Boston 4% Tampa 4% Jacksonville 4% Denver 4% Orlando 4% Los Angeles 4% Other (2) [VALUE]
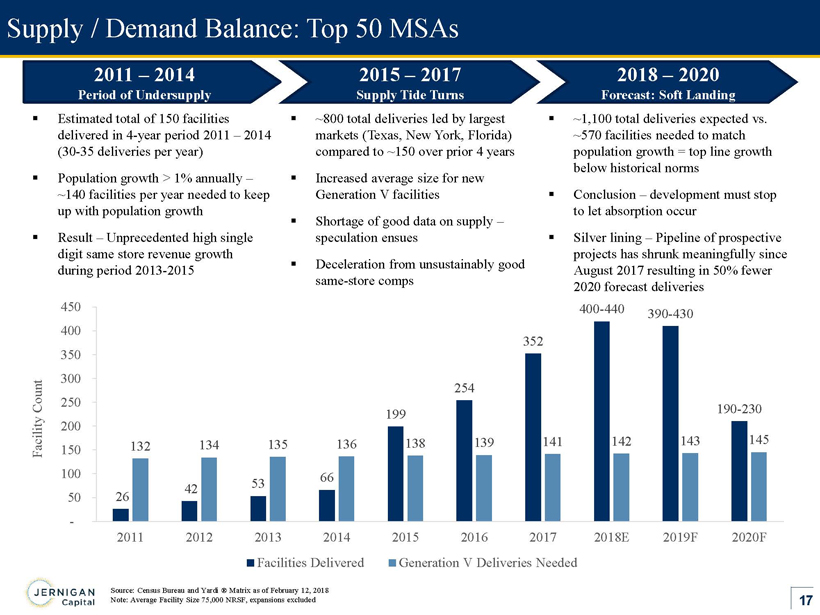
17 Supply / Demand Balance: Top 50 MSAs 26 42 53 66 199 254 352 400 - 440 390 - 430 190 - 230 132 134 135 136 138 139 141 142 143 145 - 50 100 150 200 250 300 350 400 450 2011 2012 2013 2014 2015 2016 2017 2018E 2019F 2020F Facility Count Facilities Delivered Generation V Deliveries Needed Source: Census Bureau and Yardi ® Matrix as of February 12, 2018 Note: Average Facility Size 75,000 NRSF, expansions excluded ▪ Estimated total of 150 facilities delivered in 4 - year period 2011 – 2014 (30 - 35 deliveries per year) ▪ Population growth > 1% annually – ~140 facilities per year needed to keep up with population growth ▪ Result – Unprecedented high single digit same store revenue growth during period 2013 - 2015 2015 – 2017 Supply Tide Turns 2011 – 2014 Period of Undersuppl y 2018 – 2020 Forecast: Soft Landing ▪ ~800 total deliveries led by largest markets (Texas, New York, Florida) compared to ~150 over prior 4 years ▪ Increased average size for new Generation V facilities ▪ Shortage of good data on supply – speculation ensues ▪ Deceleration from unsustainably good same - store comps ▪ ~1,100 total deliveries expected vs . ~ 570 facilities needed to match population growth = top line growth below historical norms ▪ Conclusion – development must stop to let absorption occur ▪ Silver lining – Pipeline of prospective projects has shrunk meaningfully since August 2017 resulting in 50% fewer 2020 forecast deliveries

18 Current Investment Pipeline Note: Executed term sheets are non - binding and remain subject to entry into definitive agreements (1) As of March 30, 2018 Development Markets Executed Term Sheet Pipeline Executed Term Sheet and Pipeline ▪ E xecuted term sheets for investments in 6 separate self - storage development projects for an aggregate capital commitment of approximately $64 million (1) ▪ Maintain a robust $450+ million pipeline of additional investment opportunities in top 50 U.S. markets ▪ Supported by strong developer network of over 23 programmatic developers in top - tier markets Atlanta Boston Miami New Orleans Orlando Los Angeles Bridgeport Washington DC Minneapolis Kansas City Charlotte Philadelphia Seattle
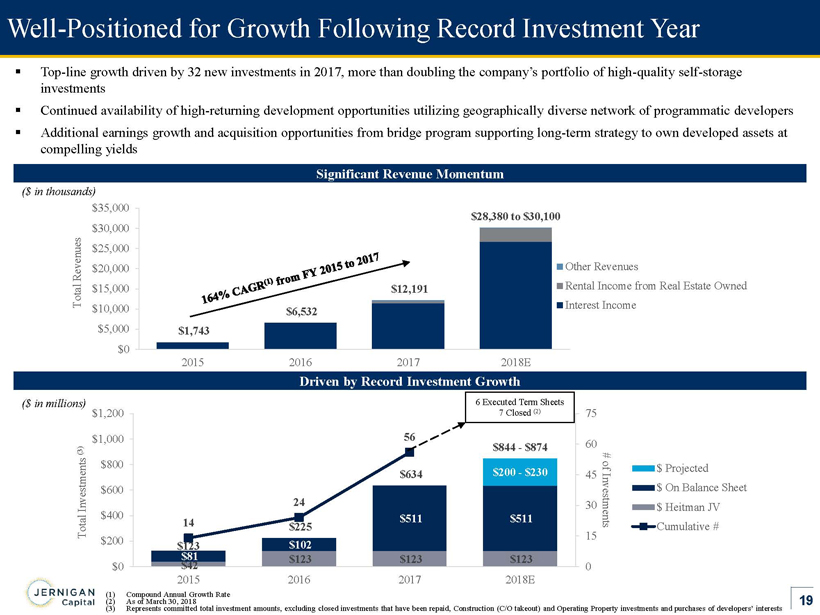
19 $42 $123 $123 $123 $81 $102 $511 $511 $200 - $230 $123 $225 $634 $844 - $874 14 24 56 0 15 30 45 60 75 $0 $200 $400 $600 $800 $1,000 $1,200 2015 2016 2017 2018E # of Investments Total Investments (3) $ Projected $ On Balance Sheet $ Heitman JV Cumulative # $1,743 $6,532 $12,191 $28,380 to $30,100 $0 $5,000 $10,000 $15,000 $20,000 $25,000 $30,000 $35,000 2015 2016 2017 2018E Total Revenues Other Revenues Rental Income from Real Estate Owned Interest Income Well - Positioned for Growth Following Record Investment Year ▪ T op - line growth driven by 32 new investments in 2017, more than doubling the company’s portfolio of high - quality self - storage investments ▪ Continued availability of high - returning development opportunities utilizing geographically diverse network of programmatic deve lopers ▪ Additional earnings growth and acquisition opportunities from bridge program supporting long - term strategy to own developed assets at compelling yields ($ in thousands) (1) Compound Annual Growth Rate (2) As of March 30, 2018 (3) Represents committed total investment amounts, excluding closed investments that have been repaid, Construction (C/O takeout) an d Operating Property investments and purchases of developers’ interests ($ in millions) 6 Executed Term Sheets 7 Closed (2) Significant Revenue Momentum Driven by Record Investment Growth
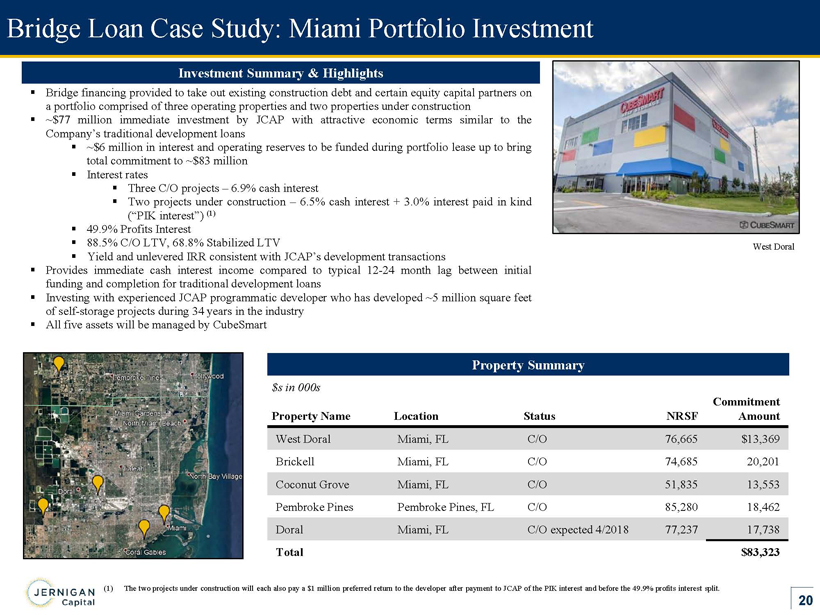
20 Bridge Loan Case Study: Miami Portfolio Investment Property Summary Investment Summary & Highlights ▪ Bridge financing provided to take out existing construction debt and certain equity capital partners on a portfolio comprised of three operating properties and two properties under construction ▪ ~ $ 77 million immediate investment by JCAP with attractive economic terms similar to the Company’s traditional development loans ▪ ~ $ 6 million in interest and operating reserves to be funded during portfolio lease up to bring total commitment to ~ $ 83 million ▪ Interest rates ▪ Three C/O projects – 6 . 9 % cash interest ▪ Two projects under construction – 6 . 5 % cash interest + 3 . 0 % interest paid in kind (“PIK interest”) ( 1 ) ▪ 49 . 9 % Profits Interest ▪ 88 . 5 % C/O LTV, 68 . 8 % Stabilized LTV ▪ Yield and unlevered IRR consistent with JCAP’s development transactions ▪ Provides immediate cash interest income compared to typical 12 - 24 month lag between initial funding and completion for traditional development loans ▪ Investing with experienced JCAP programmatic developer who has developed ~ 5 million square feet of self - storage projects during 34 years in the industry ▪ All five assets will be managed by CubeSmart (1) The two projects under construction will each also pay a $1 million preferred return to the developer after payment to JCAP of the PIK interest and before the 49.9% profits int ere st split. West Doral $s in 000s Property Name Location Status NRSF Commitment Amount West Doral Miami, FL C/O 76,665 $13,369 Brickell Miami, FL C/O 74,685 20,201 Coconut Grove Miami, FL C/O 51,835 13,553 Pembroke Pines Pembroke Pines, FL C/O 85,280 18,462 Doral Miami, FL C/O expected 4/2018 77,237 17,738 Total $83,323
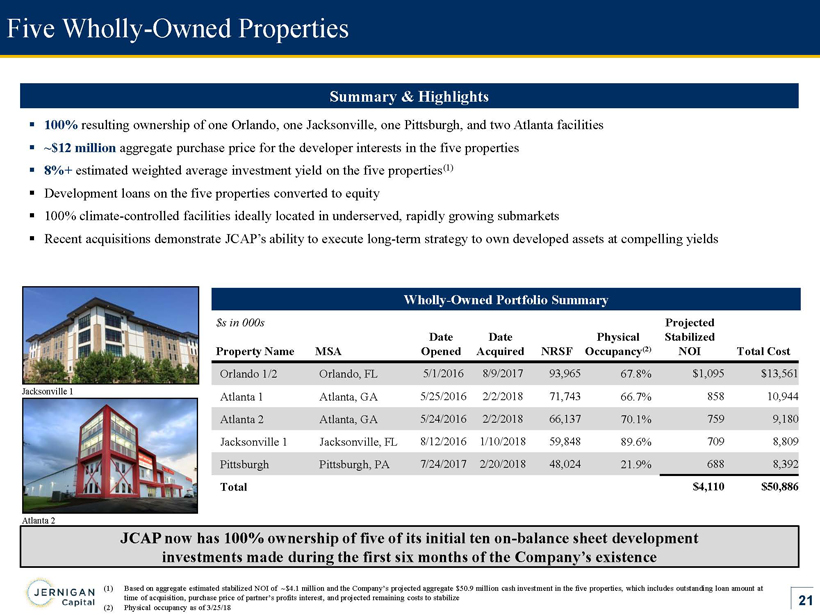
21 Five Wholly - Owned Properties Summary & Highlights ▪ 100% resulting ownership of one Orlando, one Jacksonville, one Pittsburgh, and two Atlanta facilities ▪ ~ $12 million aggregate purchase price for the developer interests in the five properties ▪ 8%+ estimated weighted average investment yield on the five properties (1) ▪ Development loans on the five properties converted to equity ▪ 100% climate - controlled facilities ideally located in underserved , rapidly growing submarkets ▪ Recent acquisitions demonstrate JCAP’s ability to execute long - term strategy to own developed assets at compelling yields JCAP now has 100% ownership of five of its initial ten on - balance sheet development investments made during the first six months of the Company’s existence (1) Based on aggregate estimated stabilized NOI of ~$4.1 million and the Company’s projected aggregate $50.9 million cash invest men t in the five properties, which includes outstanding loan amount at time of acquisition, purchase price of partner’s profits interest, and projected remaining costs to stabilize (2) P hysical occupancy as of 3/25/18 Wholly - Owned Portfolio Summary $s in 000s Property Name MSA Date Opened Date Acquired NRSF Physical Occupancy (2) Projected Stabilized NOI Total Cost Orlando 1/2 Orlando, FL 5/1/2016 8/9/2017 93,965 67.8% $1,095 $13,561 Atlanta 1 Atlanta, GA 5/25/2016 2/2/2018 71,743 66.7% 858 10,944 Atlanta 2 Atlanta, GA 5/24/2016 2/2/2018 66,137 70.1% 759 9,180 Jacksonville 1 Jacksonville, FL 8/12/2016 1/10/2018 59,848 89.6% 709 8,809 Pittsburgh Pittsburgh, PA 7/24/2017 2/20/2018 48,024 21.9% 688 8,392 Total $4,110 $50,886 Jacksonville 1 Atlanta 2
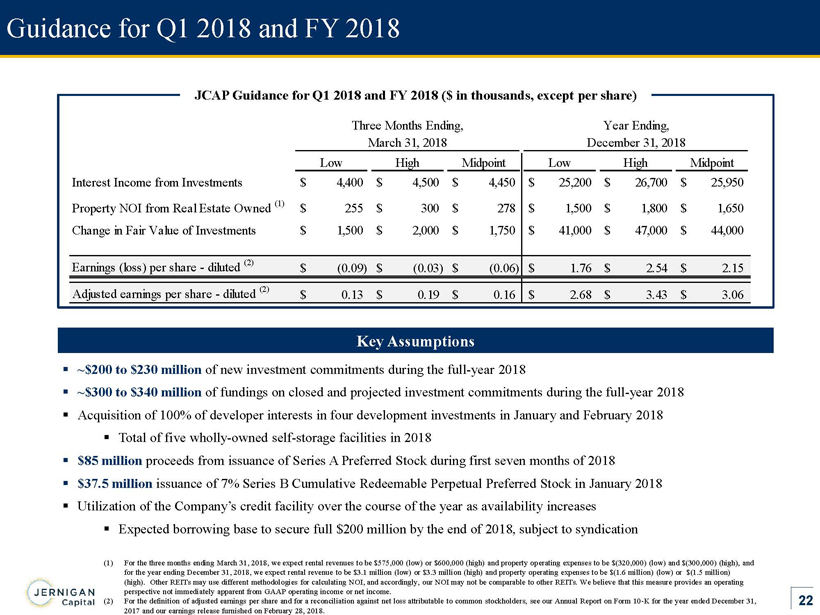
22 Guidance for Q1 2018 and FY 2018 JCAP Guidance for Q1 2018 and FY 2018 ($ in thousands, except per share) Key Assumptions ▪ ~$ 200 to $230 million of new investment commitments during the full - year 2018 ▪ ~$ 300 to $340 million of fundings on closed and projected investment commitments during the full - year 2018 ▪ Acquisition of 100% of developer interests in four development investments in January and February 2018 ▪ T otal of five wholly - owned self - storage facilities in 2018 ▪ $ 85 million proceeds from issuance of Series A Preferred Stock during first seven months of 2018 ▪ $37.5 million issuance of 7% Series B C umulative Redeemable Perpetual Preferred Stock in January 2018 ▪ Utilization of the Company’s credit facility over the course of the year as availability increases ▪ Expected borrowing base to secure full $200 million by the end of 2018, subject to syndication (1) For the three months ending March 31, 2018, we expect rental revenues to be $575,000 (low) or $600,000 (high) and property op era ting expenses to be $(320,000) (low) and $(300,000) (high), and for the year ending December 31, 2018, we expect rental revenue to be $3.1 million (low) or $3.3 million (high) and property ope rating expenses to be $(1.6 million) (low) or $(1.5 million) (high). Other REITs may use different methodologies for calculating NOI, and accordingly, our NOI may not be comparable to othe r REITs. We believe that this measure provides an operating perspective not immediately apparent from GAAP operating income or net income . (2) For the definition of adjusted earnings per share and for a reconciliation against net loss attributable to common stockholde rs, see our Annual Report on Form 10 - K for the year ended December 31, 2017 and our earnings release furnished on February 28, 2018. Three Months Ending, Year Ending, March 31, 2018 December 31, 2018 Low High Midpoint Low High Midpoint Interest Income from Investments 4,400$ 4,500$ 4,450$ 25,200$ 26,700$ 25,950$ Property NOI from Real Estate Owned (1) 255$ 300$ 278$ 1,500$ 1,800$ 1,650$ Change in Fair Value of Investments 1,500$ 2,000$ 1,750$ 41,000$ 47,000$ 44,000$ Earnings (loss) per share - diluted (2) (0.09)$ (0.03)$ (0.06)$ 1.76$ 2.54$ 2.15$ Adjusted earnings per share - diluted (2) 0.13$ 0.19$ 0.16$ 2.68$ 3.43$ 3.06$

23 Appendix
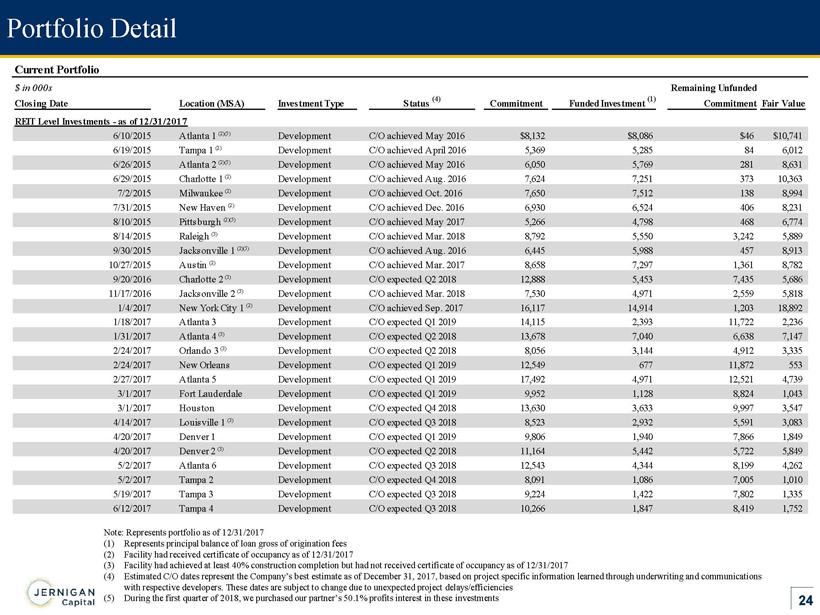
24 Portfolio Detail Note: Represents portfolio as of 12/31/2017 (1) Represents principal balance of loan gross of origination fees (2) Facility had received certificate of occupancy as of 12/31/2017 (3) Facility had achieved at least 40% construction completion but had not received certificate of occupancy as of 12/31/2017 (4) Estimated C/O dates represent the Company’s best estimate as of December 31, 2017, based on project specific information learned through underwriting and communications with respective developers. These dates are subject to change due to unexpected project delays/efficiencies (5) During the first quarter of 2018, we purchased our partner’s 50.1% profits interest in these investments (1) Current Portfolio $ in 000s Remaining Unfunded Closing Date Location (MSA) Investment Type Status (4) Commitment Funded Investment (1) Commitment Fair Value REIT Level Investments - as of 12/31/2017 6/10/2015 Atlanta 1 (2)(5) Development C/O achieved May 2016 $8,132 $8,086 $46 $10,741 6/19/2015 Tampa 1 (2) Development C/O achieved April 2016 5,369 5,285 84 6,012 6/26/2015 Atlanta 2 (2)(5) Development C/O achieved May 2016 6,050 5,769 281 8,631 6/29/2015 Charlotte 1 (2) Development C/O achieved Aug. 2016 7,624 7,251 373 10,363 7/2/2015 Milwaukee (2) Development C/O achieved Oct. 2016 7,650 7,512 138 8,994 7/31/2015 New Haven (2) Development C/O achieved Dec. 2016 6,930 6,524 406 8,231 8/10/2015 Pittsburgh (2)(5) Development C/O achieved May 2017 5,266 4,798 468 6,774 8/14/2015 Raleigh (3) Development C/O achieved Mar. 2018 8,792 5,550 3,242 5,889 9/30/2015 Jacksonville 1 (2)(5) Development C/O achieved Aug. 2016 6,445 5,988 457 8,913 10/27/2015 Austin (2) Development C/O achieved Mar. 2017 8,658 7,297 1,361 8,782 9/20/2016 Charlotte 2 (3) Development C/O expected Q2 2018 12,888 5,453 7,435 5,686 11/17/2016 Jacksonville 2 (3) Development C/O achieved Mar. 2018 7,530 4,971 2,559 5,818 1/4/2017 New York City 1 (2) Development C/O achieved Sep. 2017 16,117 14,914 1,203 18,892 1/18/2017 Atlanta 3 Development C/O expected Q1 2019 14,115 2,393 11,722 2,236 1/31/2017 Atlanta 4 (3) Development C/O expected Q2 2018 13,678 7,040 6,638 7,147 2/24/2017 Orlando 3 (3) Development C/O expected Q2 2018 8,056 3,144 4,912 3,335 2/24/2017 New Orleans Development C/O expected Q1 2019 12,549 677 11,872 553 2/27/2017 Atlanta 5 Development C/O expected Q1 2019 17,492 4,971 12,521 4,739 3/1/2017 Fort Lauderdale Development C/O expected Q1 2019 9,952 1,128 8,824 1,043 3/1/2017 Houston Development C/O expected Q4 2018 13,630 3,633 9,997 3,547 4/14/2017 Louisville 1 (3) Development C/O expected Q3 2018 8,523 2,932 5,591 3,083 4/20/2017 Denver 1 Development C/O expected Q1 2019 9,806 1,940 7,866 1,849 4/20/2017 Denver 2 (3) Development C/O expected Q2 2018 11,164 5,442 5,722 5,849 5/2/2017 Atlanta 6 Development C/O expected Q3 2018 12,543 4,344 8,199 4,262 5/2/2017 Tampa 2 Development C/O expected Q4 2018 8,091 1,086 7,005 1,010 5/19/2017 Tampa 3 Development C/O expected Q3 2018 9,224 1,422 7,802 1,335 6/12/2017 Tampa 4 Development C/O expected Q3 2018 10,266 1,847 8,419 1,752
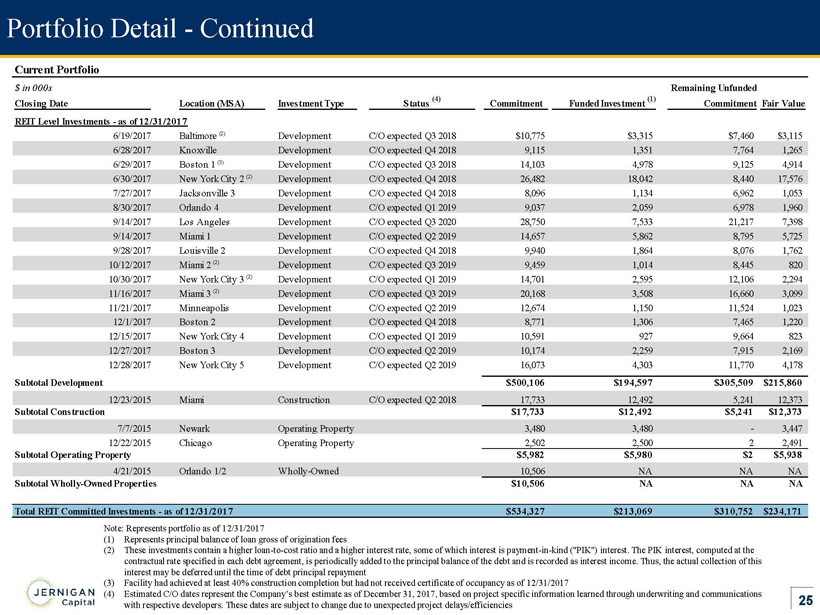
25 Portfolio Detail - Continued (1) Note: Represents portfolio as of 12/31/2017 (1) Represents principal balance of loan gross of origination fees (2) These investments contain a higher loan - to - cost ratio and a higher interest rate, some of which interest is payment - in - kind ("PI K") interest. The PIK interest, computed at the contractual rate specified in each debt agreement, is periodically added to the principal balance of the debt and is recorded as interest income. Thus, the actual collection of this interest may be deferred until the time of debt principal repayment (3) Facility had achieved at least 40% construction completion but had not received certificate of occupancy as of 12/31/2017 (4) Estimated C/O dates represent the Company’s best estimate as of December 31, 2017, based on project specific information lear ned through underwriting and communications with respective developers. These dates are subject to change due to unexpected project delays/efficiencies Current Portfolio $ in 000s Remaining Unfunded Closing Date Location (MSA) Investment Type Status (4) Commitment Funded Investment (1) Commitment Fair Value REIT Level Investments - as of 12/31/2017 6/19/2017 Baltimore (2) Development C/O expected Q3 2018 $10,775 $3,315 $7,460 $3,115 6/28/2017 Knoxville Development C/O expected Q4 2018 9,115 1,351 7,764 1,265 6/29/2017 Boston 1 (3) Development C/O expected Q3 2018 14,103 4,978 9,125 4,914 6/30/2017 New York City 2 (2) Development C/O expected Q4 2018 26,482 18,042 8,440 17,576 7/27/2017 Jacksonville 3 Development C/O expected Q4 2018 8,096 1,134 6,962 1,053 8/30/2017 Orlando 4 Development C/O expected Q1 2019 9,037 2,059 6,978 1,960 9/14/2017 Los Angeles Development C/O expected Q3 2020 28,750 7,533 21,217 7,398 9/14/2017 Miami 1 Development C/O expected Q2 2019 14,657 5,862 8,795 5,725 9/28/2017 Louisville 2 Development C/O expected Q4 2018 9,940 1,864 8,076 1,762 10/12/2017 Miami 2 (2) Development C/O expected Q3 2019 9,459 1,014 8,445 820 10/30/2017 New York City 3 (2) Development C/O expected Q1 2019 14,701 2,595 12,106 2,294 11/16/2017 Miami 3 (2) Development C/O expected Q3 2019 20,168 3,508 16,660 3,099 11/21/2017 Minneapolis Development C/O expected Q2 2019 12,674 1,150 11,524 1,023 12/1/2017 Boston 2 Development C/O expected Q4 2018 8,771 1,306 7,465 1,220 12/15/2017 New York City 4 Development C/O expected Q1 2019 10,591 927 9,664 823 12/27/2017 Boston 3 Development C/O expected Q2 2019 10,174 2,259 7,915 2,169 12/28/2017 New York City 5 Development C/O expected Q2 2019 16,073 4,303 11,770 4,178 Subtotal Development $500,106 $194,597 $305,509 $215,860 12/23/2015 Miami Construction C/O expected Q2 2018 17,733 12,492 5,241 12,373 Subtotal Construction $17,733 $12,492 $5,241 $12,373 7/7/2015 Newark Operating Property 3,480 3,480 - 3,447 12/22/2015 Chicago Operating Property 2,502 2,500 2 2,491 Subtotal Operating Property $5,982 $5,980 $2 $5,938 4/21/2015 Orlando 1/2 Wholly-Owned 10,506 NA NA NA Subtotal Wholly-Owned Properties $10,506 NA NA NA Total REIT Committed Investments - as of 12/31/2017 $534,327 $213,069 $310,752 $234,171
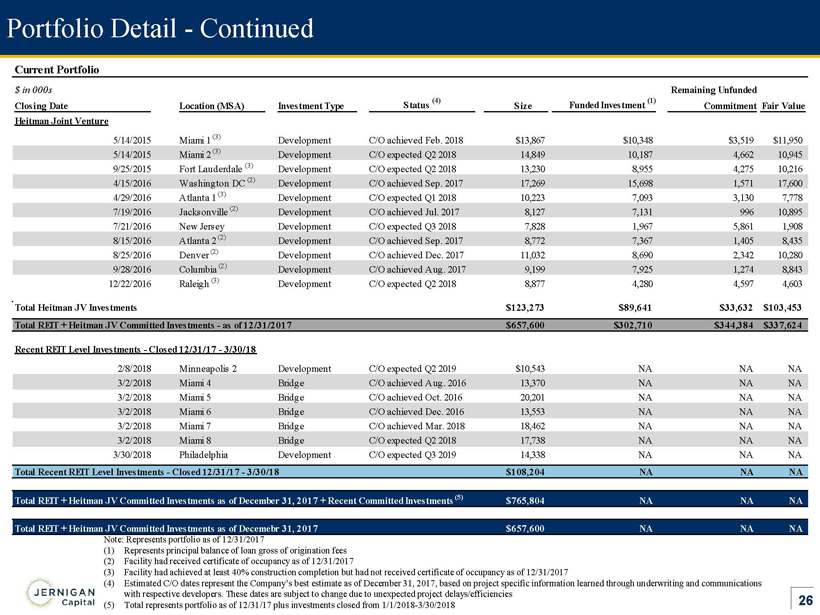
26 Portfolio Detail - Continued Note: Represents portfolio as of 12/31/2017 (1) Represents principal balance of loan gross of origination fees (2) Facility had received certificate of occupancy as of 12/31/2017 (3) Facility had achieved at least 40% construction completion but had not received certificate of occupancy as of 12/31/2017 (4) Estimated C/O dates represent the Company’s best estimate as of December 31, 2017, based on project specific information lear ned through underwriting and communications with respective developers. These dates are subject to change due to unexpected project delays/efficiencies (5) Total represents portfolio as of 12/31/17 plus investments closed from 1/1/2018 - 3/30/2018 Current Portfolio $ in 000s Remaining Unfunded Closing Date Location (MSA) Investment Type Status (4) Size Funded Investment (1) Commitment Fair Value Heitman Joint Venture 5/14/2015 Miami 1 (3) Development C/O achieved Feb. 2018 $13,867 $10,348 $3,519 $11,950 5/14/2015 Miami 2 (3) Development C/O expected Q2 2018 14,849 10,187 4,662 10,945 9/25/2015 Fort Lauderdale (3) Development C/O expected Q2 2018 13,230 8,955 4,275 10,216 4/15/2016 Washington DC (2) Development C/O achieved Sep. 2017 17,269 15,698 1,571 17,600 4/29/2016 Atlanta 1 (3) Development C/O expected Q1 2018 10,223 7,093 3,130 7,778 7/19/2016 Jacksonville (2) Development C/O achieved Jul. 2017 8,127 7,131 996 10,895 7/21/2016 New Jersey Development C/O expected Q3 2018 7,828 1,967 5,861 1,908 8/15/2016 Atlanta 2 (2) Development C/O achieved Sep. 2017 8,772 7,367 1,405 8,435 8/25/2016 Denver (2) Development C/O achieved Dec. 2017 11,032 8,690 2,342 10,280 9/28/2016 Columbia (2) Development C/O achieved Aug. 2017 9,199 7,925 1,274 8,843 12/22/2016 Raleigh (3) Development C/O expected Q2 2018 8,877 4,280 4,597 4,603 Total Heitman JV Investments $123,273 $89,641 $33,632 $103,453 Total REIT + Heitman JV Committed Investments - as of 12/31/2017 $657,600 $302,710 $344,384 $337,624 Recent REIT Level Investments - Closed 12/31/17 - 3/30/18 2/8/2018 Minneapolis 2 Development C/O expected Q2 2019 $10,543 NA NA NA 3/2/2018 Miami 4 Bridge C/O achieved Aug. 2016 13,370 NA NA NA 3/2/2018 Miami 5 Bridge C/O achieved Oct. 2016 20,201 NA NA NA 3/2/2018 Miami 6 Bridge C/O achieved Dec. 2016 13,553 NA NA NA 3/2/2018 Miami 7 Bridge C/O achieved Mar. 2018 18,462 NA NA NA 3/2/2018 Miami 8 Bridge C/O expected Q2 2018 17,738 NA NA NA 3/30/2018 Philadelphia Development C/O expected Q3 2019 14,338 NA NA NA Total Recent REIT Level Investments - Closed 12/31/17 - 3/30/18 $108,204 NA NA NA Total REIT + Heitman JV Committed Investments as of December 31, 2017 + Recent Committed Investments (5) $765,804 NA NA NA Total REIT + Heitman JV Committed Investments as of Decemebr 31, 2017 $657,600 NA NA NA
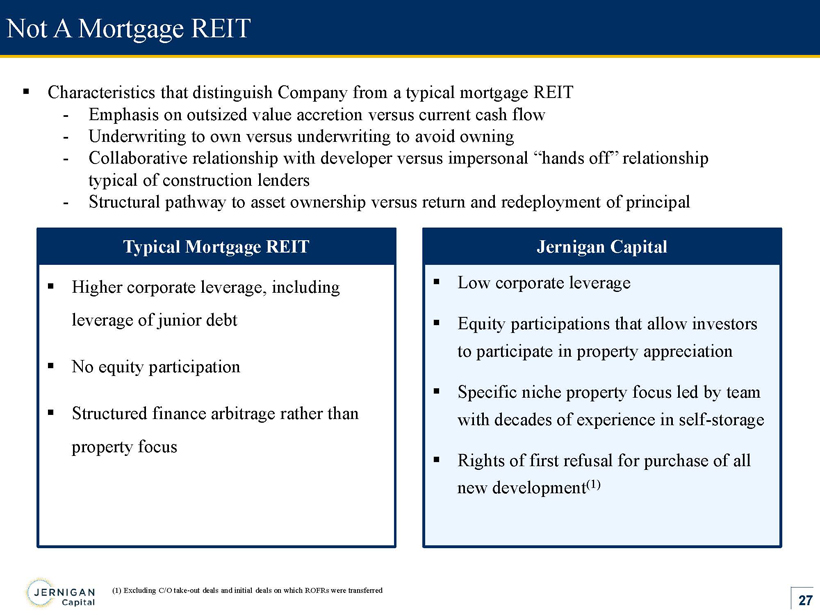
27 Not A Mortgage REIT Typical Mortgage REIT ▪ Higher corporate leverage, including leverage of junior debt ▪ No equity participation ▪ Structured finance arbitrage rather than property focus Jernigan Capital ▪ Low corporate leverage ▪ Equity participations that allow investors to participate in property appreciation ▪ Specific niche property focus led by team with decades of experience in self - storage ▪ Rights of first refusal for purchase of all new development (1) ▪ Characteristics that distinguish Company from a typical mortgage REIT - Emphasis on outsized value accretion versus current cash flow - Underwriting to own versus underwriting to avoid owning - Collaborative relationship with developer versus impersonal “hands off” relationship typical of construction lenders - Structural pathway to asset ownership versus return and redeployment of principal (1) Excluding C/O take - out deals and initial deals on which ROFRs were transferred
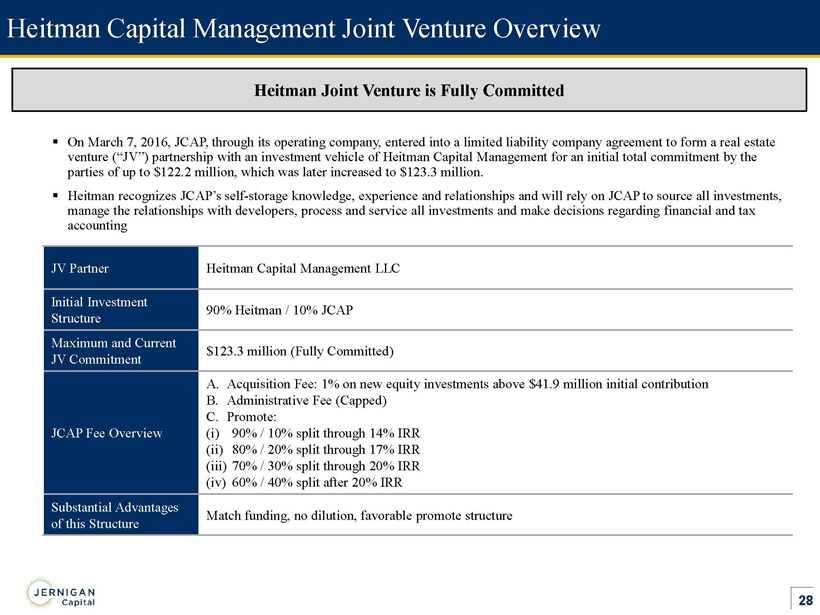
28 Heitman Capital Management Joint Venture Overview ▪ On March 7, 2016, JCAP, through its operating company, entered into a limited liability company agreement to form a real esta te venture (“JV”) partnership with an investment vehicle of Heitman Capital Management for an initial total commitment by the parties of up to $122.2 million, which was later increased to $123.3 million. ▪ Heitman recognizes JCAP’s self - storage knowledge, experience and relationships and will rely on JCAP to source all investments, manage the relationships with developers, process and service all investments and make decisions regarding financial and tax accounting JV Partner Heitman Capital Management LLC Initial Investment Structure 90% Heitman / 10% JCAP Maximum and Current JV Commitment $123.3 million (Fully Committed) JCAP Fee Overview A. Acquisition Fee: 1% on new equity investments above $41.9 million initial contribution B. Administrative Fee (Capped) C. Promote: (i) 90% / 10% split through 14% IRR (ii) 80% / 20% split through 17% IRR (iii) 70% / 30% split through 20% IRR (iv) 60% / 40% split after 20% IRR Substantial Advantages of this Structure Match funding, no dilution, favorable promote structure Heitman Joint Venture is Fully Committed
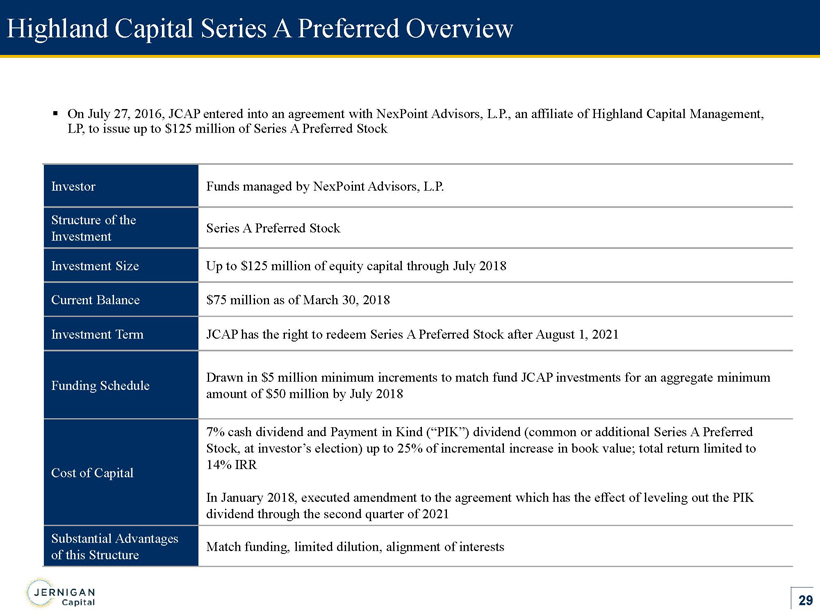
29 Highland Capital Series A Preferred Overview ▪ On July 27, 2016, JCAP entered into an agreement with NexPoint Advisors, L.P., an affiliate of Highland Capital Management, LP, to issue up to $125 million of Series A Preferred Stock Investor Funds managed by NexPoint Advisors, L.P. Structure of the Investment Series A Preferred Stock Investment Size Up to $125 million of equity capital through July 2018 Current Balance $75 million as of March 30, 2018 Investment Term JCAP has the right to redeem Series A Preferred Stock after August 1, 2021 Funding Schedule Drawn in $5 million minimum increments to match fund JCAP investments for an aggregate minimum amount of $50 million by July 2018 Cost of Capital 7% cash dividend and Payment in Kind (“PIK”) dividend (common or additional Series A P referred Stock, at investor’s election) up to 25% of incremental increase in book value; total return limited to 14% IRR In January 2018, executed amendment to the agreement which has the effect of leveling out the PIK dividend through the second quarter of 2021 Substantial Advantages of this Structure Match funding, limited dilution, alignment of interests
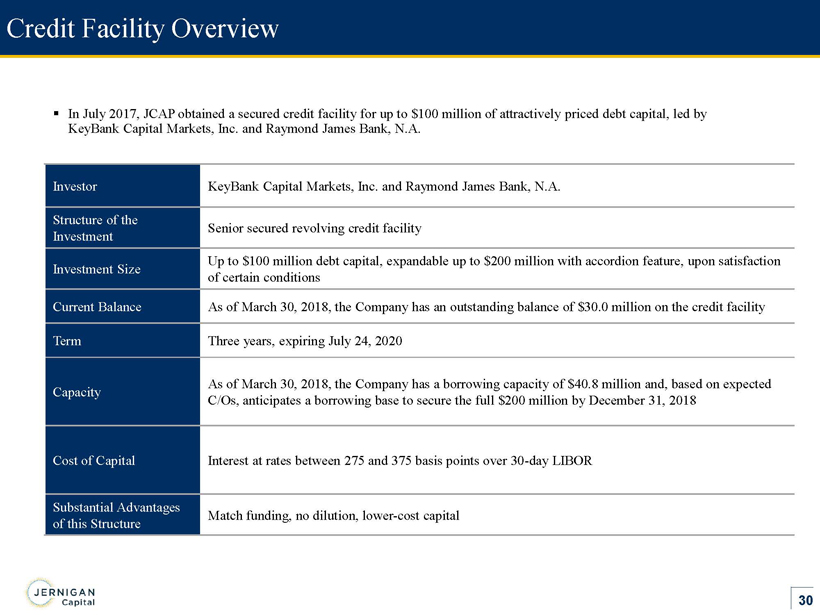
30 Credit Facility Overview Investor KeyBank Capital Markets, Inc. and Raymond James Bank, N.A. Structure of the Investment Senior secured revolving credit facility Investment Size Up to $100 million debt capital, e xpandable up to $200 million with accordion feature, upon satisfaction of certain conditions Current Balance As of March 30 , 2018, the Company has an outstanding balance of $30.0 million on the credit facility Term Three years, expiring July 24, 2020 Capacity As of March 30, 2018, the Company has a borrowing capacity of $40.8 million and, based on expected C/Os, anticipates a borrowing base to secure the full $200 million by December 31, 2018 Cost of Capital Interest at rates between 275 and 375 basis points over 30 - day LIBOR Substantial Advantages of this Structure Match funding, no dilution, lower - cost capital ▪ In July 2017, JCAP obtained a secured credit facility for up to $100 million of attractively priced debt capital, led by KeyBank Capital Markets, Inc. and Raymond James Bank, N.A.

31 Series B Preferred Stock Overview ▪ On January 26, 2018, JCAP issued $37.5 million of Series B cumulative redeemable perpetual preferred stock (“Series B Preferred Stock”) through a public offering ▪ On March 29, 2018, JCAP entered into a Distribution Agreement among JCAP, the Operating Company and B. Riley FBR, Inc., as sales agent, pursuant to which it may offer, from time to time, up to $45 million of Series B Preferred Stock NYSE Symbol JCAP - PB Structure of the Investment Series B Cumulative Redeemable Perpetual Preferred Stock, $0.01 par value per share with a liquidation preference of $25.00 per share Investment Size $37.5 million or 1,500,000 shares (1) Investment Term JCAP has the right to redeem Series B Preferred Stock on or after January 26, 2023 Cost of Capital 7% cash dividend Use of Proceeds Fund existing or future investments in the Company’s development portfolio and operating property loan portfolio, including the Miami portfolio investment opportunity, and for general corporate purposes (1) Outstanding as of March 30, 2018