Exhibit 99.1
September 2018 Investor Presentation INVESTOR PRESENTATION JERNIGAN CAPITAL 6410 Poplar Ave, Suite 650 Memphis, TN 38119
September 2018 Investor Presentation SAFE HARBOR DISCLOSURE REGARDING FORWARD - LOOKING STATEMENTS This presentation includes "forward - looking statements" within the meaning of Section 27 A of the Securities Act of 1933 and Section 21 E of the Securities Exchange Act of 1934 and other federal securities laws . Such statements relate to our future performance, future book value, rates of return, ability to obtain future financing, including our ability to increase the capacity under our credit facility, exit capitalization rates, our use of capital, the timing of our investment cycle, future deliveries of new self - storage facilities in United States markets, the expected timing of completion of projects we finance, our ability to acquire wholly - owned assets, future profits from investments, our future stock price, our dividends to our common stockholders and the holders of our Series A and Series B Preferred Stock, our investment pipeline , our anticipated investment closings , future funding of existing investment commitments , and components of our third quarter 2018 and full - year 2018 earnings guidance . The ultimate occurrence of events and results referenced in these forward - looking statements is subject to known and unknown risks and uncertainties, many of which are beyond our control . Such risks include our ability to obtain additional liquidity to fund our investment pipeline, our ability to make distributions at expected levels, the potential impact of interest rate fluctuations, the uncertainty as to the value of our investments, the lack of liquidity in our investments and whether we can realize expected gains from our equity participation interests . These forward - looking statements are based upon our present intentions and expectations, but the events and results referenced in these statements are not guaranteed to occur . Investors should not place undue reliance upon forward - looking statements . There can be no assurance that our expectations of the future performance of our investments will be achieved . This information provided herein is as of this date, and we undertake no duty to update any forward - looking statements contained herein . For a discussion of these and other risks facing our business, see the information under the heading “Risk Factors” in our Annual Report on Form 10 - K for the year ended December 31 , 2017 and in other filings we make with the Securities and Exchange Commission (“SEC”) from time to time, which are accessible on the SEC’s website at www . sec . gov . This presentation contains statistics and other data that has been obtained from or compiled from information made available by third parties . We have not independently verified such statistics or data . Unless otherwise indicated, all metrics presented herein are as of June 30 , 2018 . 2
September 2018 Investor Presentation INTRODUCTION September 2018 Investor Presentation OUR MISSION OUR TICKER SYMBOL Jernigan Capital provides debt and equity capital to private developers, owners and operators of self - storage facilities with a view to eventual outright ownership of facilities we finance . Our mission is to maximize shareholder value by accumulating a multi - billion dollar investment portfolio consisting of the newest, most attractive and best located self - storage facilities in the United States through a talented and experienced team demonstrating the highest levels of integrity, dedication, excellence and community . 3
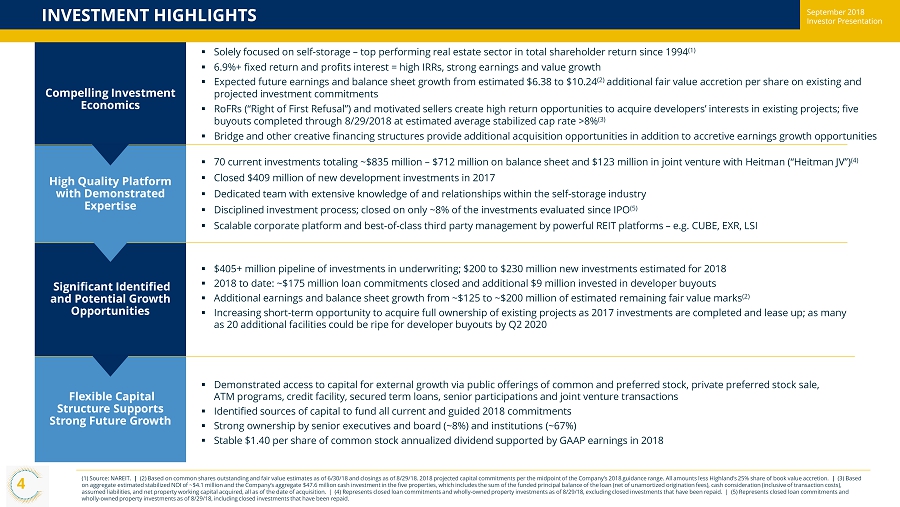
September 2018 Investor Presentation ▪ $ 405 + million pipeline of investments in underwriting; $200 to $230 million new investments estimated for 2018 ▪ 2018 to date: ~$175 million loan commitments closed and additional $9 million invested in developer buyouts ▪ Additional earnings and balance sheet growth from ~$ 125 to ~$200 million of estimated remaining fair value marks (2 ) ▪ Increasing short - term opportunity to acquire full ownership of existing projects as 2017 investments are completed and lease up; as many as 20 additional facilities could be ripe for developer buyouts by Q2 2020 Significant Identified and Potential Growth Opportunities Compelling Investment Economics ▪ Solely focused on self - storage – top performing real estate sector in total shareholder return since 1994 (1 ) ▪ 6.9%+ fixed return and profits interest = high IRRs, strong earnings and value growth ▪ Expected future earnings and balance sheet growth from estimated $6.38 to $ 10.24 (2) additional fair value accretion per share on existing and projected investment commitments ▪ RoFRs (“Right of First Refusal”) and motivated sellers create high return opportunities to acquire developers’ interests in e xis ting projects; five buyouts completed through 8/29/2018 at estimated average stabilized cap rate >8 % (3) ▪ Bridge and other creative financing structures provide additional acquisition opportunities in addition to accretive earnings gr owth opportunities Flexible Capital Structure Supports Strong Future Growth ▪ Demonstrated access to capital for external growth via public offerings of common and preferred stock, private preferred stock sale, ATM programs, credit facility, secured term loans, senior participations and joint venture transactions ▪ Identified sources of capital to fund all current and guided 2018 commitments ▪ Strong ownership by senior executives and board (~ 8%) and institutions (~67%) ▪ Stable $1.40 per share of common stock annualized dividend supported by GAAP earnings in 2018 High Quality Platform with Demonstrated Expertise ▪ 70 current investments totaling ~$ 835 million – $ 712 million on balance sheet and $123 million in joint venture with Heitman (“Heitman JV ”) (4) ▪ Closed $409 million of new development investments in 2017 ▪ Dedicated team with extensive knowledge of and relationships within the self - storage industry ▪ Disciplined investment process; closed on only ~8% of the investments evaluated since IPO (5) ▪ Scalable corporate platform and best - of - class third party management by powerful REIT platforms – e.g. CUBE, EXR, LSI INVESTMENT HIGHLIGHTS September 2018 Investor Presentation (1) Source : NAREIT. | (2) Based on common shares outstanding and fair value estimates as of 6/30/18 and closings as of 8/29/18. 2018 projected capital commitments per the midpoint of the Company’s 2018 guidance range. All amounts less Highland’s 25% sha re of book value accretion. | (3) Based on aggregate estimated stabilized NOI of ~$4.1 million and the Company’s aggregate $47.6 million cash investment in the five pro perties, which includes the sum of the funded principal balance of the loan (net of unamortized origination fees), cash consi der ation (inclusive of transaction costs), assumed liabilities, and net property working capital acquired, all as of the date of acquisition . | (4) Represents closed loan commitments and wholly - owned property investments as of 8/29/18, excluding closed investments t hat have been repaid. | (5) Represents closed loan commitments and wholly - owned property investments as of 8/29/18 , including closed investments that have been repaid. 4
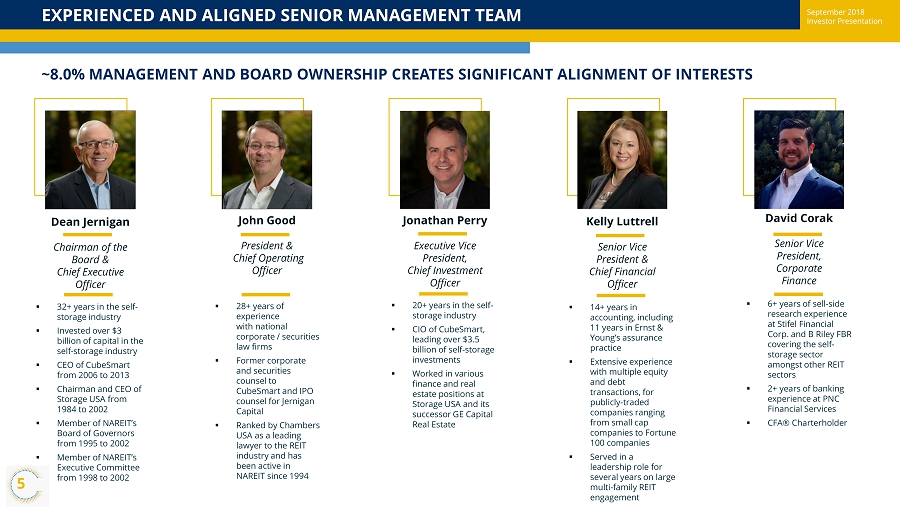
September 2018 Investor Presentation EXPERIENCED AND ALIGNED SENIOR MANAGEMENT TEAM ~8.0% Management and Board Ownership Creates Significant Alignment of Interests ~8.0% MANAGEMENT AND BOARD OWNERSHIP CREATES SIGNIFICANT ALIGNMENT OF INTERESTS ▪ 32 + years in the self - storage industry ▪ Invested over $3 billion of capital in the self - storage industry ▪ CEO of CubeSmart from 2006 to 2013 ▪ Chairman and CEO of Storage USA from 1984 to 2002 ▪ Member of NAREIT’s Board of Governors from 1995 to 2002 ▪ Member of NAREIT’s Executive Committee from 1998 to 2002 Dean Jernigan Chairman of the Board & Chief Executive Officer ▪ 28 + years of experience with national corporate / securities law firms ▪ Former corporate and securities counsel to CubeSmart and IPO counsel for Jernigan Capital ▪ Ranked by Chambers USA as a leading lawyer to the REIT industry and has been active in NAREIT since 1994 John Good President & Chief Operating Officer Jonathan Perry Executive Vice President, Chief Investment Officer ▪ 20 + years in the self - storage industry ▪ CIO of CubeSmart, leading over $3.5 billion of self - storage investments ▪ Worked in various finance and real estate positions at Storage USA and its successor GE Capital Real Estate ▪ 14 + years in accounting, including 11 years in Ernst & Young’s assurance practice ▪ Extensive experience with multiple equity and debt transactions, for publicly - traded companies ranging from small cap companies to Fortune 100 companies ▪ Served in a leadership role for several years on large multi - family REIT engagement Kelly Luttrell Senior Vice President & Chief Financial Officer ▪ 6 + years of sell - side research experience at Stifel Financial Corp. and B Riley FBR covering the self - storage sector amongst other REIT sectors ▪ 2+ years of banking experience at PNC Financial Services ▪ CFA® Charterholder David Corak Senior Vice President, Corporate Finance September 2018 Investor Presentation 5
September 2018 Investor Presentation JCAP’S COMPETITIVE ADVANTAGE ACCESSIBLE JCAP CAPITAL vs. COMMERICAL BANKS’ RETREAT FROM SELF - STORAGE CONSTRUCTION LENDING ▪ Continued post - recession hangover of commercial banks diminishes appetite for self - storage construction loans ▪ Regulatory hurdles diminish the profitability of self - storage construction loans for banks ▪ Dodd - Frank, Basel III and HVCRE reserve requirements ▪ Allocation p reference to stabilized / pre - leased CRE (e.g. Industrial, Office, Multi - family) CREATIVE INVESTMENT STRUCTURES PROVIDE ONE - STOP SHOP ▪ Development financing of up to 97% loan - to - cost (“LTC”). Banks offer 60% to 65% ▪ JCAP can offer flexible financing structures on both development projects and projects in lease - up ▪ Developer freed of burden to raise capital from multiple sources ▪ Unitranche JCAP pricing (coupon + profits interest + RoFR) is highly competitive with pricing of component parts NON - RECOURSE ▪ JCAP capital is non - recourse to the developer (except for certain carve outs) SELF - STORAGE EXPERTISE AND FOCUS ▪ JCAP adds value as a storage expert that can assist in avoiding costly common mistakes, such as selecting poor sites in saturated submarkets and selecting subpar property managers who do not drive occupancy or effectively manage revenue and / or operating expenses ▪ JCAP is a reliable exit option – operating partnership units provide tax efficient means for developer exit September 2018 Investor Presentation 6
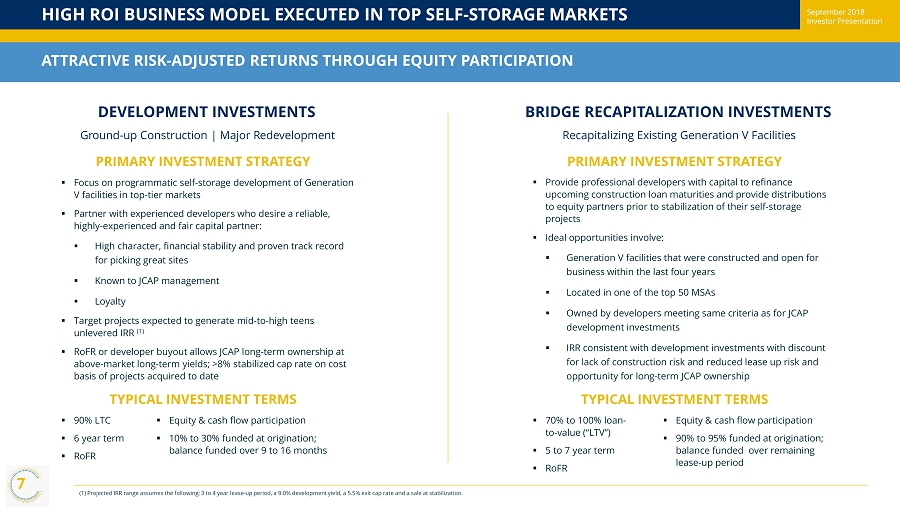
September 2018 Investor Presentation HIGH ROI BUSINESS MODEL EXECUTED IN TOP SELF - STORAGE MARKETS ATTRACTIVE RISK - ADJUSTED RETURNS THROUGH EQUITY PARTICIPATION DEVE L OP M ENT INVESTMENTS G r ound - up C onstruction | Major R e d eve lopm e nt ▪ Focus on programmatic self - storage development of Generation V facilities in top - tier markets ▪ Partner with experienced developers who desire a reliable, highly - experienced and fair capital partner: ▪ High character, financial stability and proven track record for picking great sites ▪ Known to JCAP management ▪ Loyalty ▪ Target projects expected to generate mid - to - high teens unlevered IRR (1 ) ▪ RoFR or developer buyout allows JCAP long - term ownership at above - market long - term yields; >8% stabilized cap rate on cost basis of projects acquired to date PRIMARY INVESTMENT STRATEGY TYPICAL INVESTMENT TERMS ▪ 90% LTC ▪ 6 year term ▪ RoFR ▪ Equity & cash flow participation ▪ 10% to 30 % fund e d a t o r i g ination; b a l a n c e funded ov e r 9 to 16 months BRIDGE RECAPITALIZATION INVESTMENTS Recapitalizing Existing Generation V Facilities ▪ Provide professional developers with capital to refinance upcoming construction loan maturities and provide distributions to equity partners prior to stabilization of their self - storage projects ▪ Ideal opportunities involve: ▪ Generation V facilities that were constructed and open for business within the last four years ▪ Located in one of the top 50 MSAs ▪ Owned by developers meeting same criteria as for JCAP development investments ▪ IRR consistent with development investments with discount for lack of construction risk and reduced lease up risk and opportunity for long - term JCAP ownership PRIMARY INVESTMENT STRATEGY TYPICAL INVESTMENT TERMS ▪ 70% to 100 % loan - to - value (“LTV”) ▪ 5 to 7 year term ▪ RoFR ▪ Equity & cash flow participation ▪ 90% to 95 % funded at origination; balance funded over remaining lease - up period (1) Projected IRR range assumes the following: 3 to 4 year lease - up period, a 9.0% development yield, a 5.5% exit cap rate and a sale at stabilization. September 2018 Investor Presentation 7
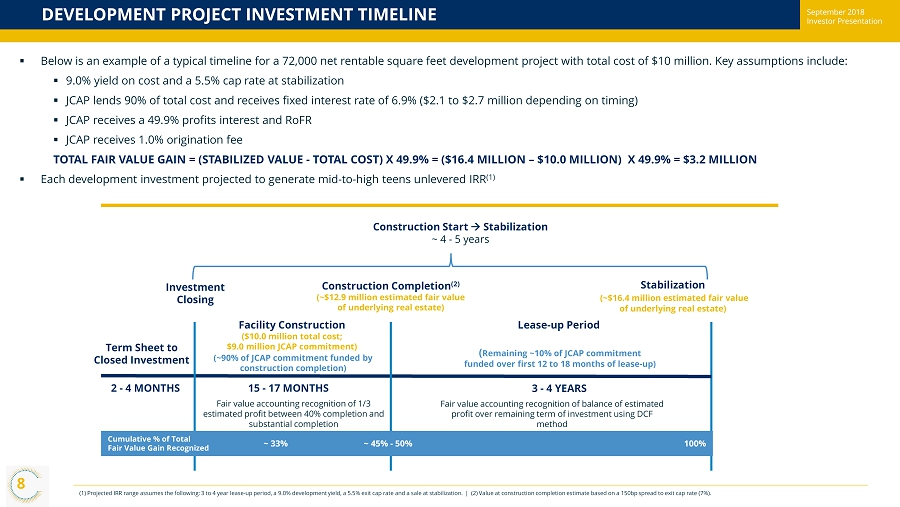
September 2018 Investor Presentation DEVELOPMENT PROJECT INVESTMENT TIMELINE (1) Projected IRR range assumes the following: 3 to 4 year lease - up period, a 9.0% development yield, a 5.5% exit cap rate and a sale at stabilization. | (2) Value at construction completion estimate based on a 150bp spread to exit cap rate (7 %). ▪ Below is an example of a typical timeline for a 72,000 net rentable square feet development project with total cost of $10 million. Key assumptions include: ▪ 9.0 % yield on cost and a 5.5% cap rate at stabilization ▪ JCAP lends 90% of total cost and receives fixed interest rate of 6.9% ($ 2.1 to $2.7 million depending on timing ) ▪ JCAP receives a 49.9% profits interest and RoFR ▪ JCAP receives 1.0 % origination fee TOTAL FAIR VALUE GAIN = (STABILIZED VALUE - TOTAL COST) X 49.9% = ($16.4 MILLION – $10.0 MILLION) X 49.9% = $3.2 MILLION ▪ Each development investment projected to generate mid - to - high teens unlevered IRR (1) Fair value a ccounting recognition of 1/3 estimated profit between 40% completion and substantial completion Fair value a ccounting recognition of balance of estimated profit over remaining term of investment using DCF method Term Sheet to Closed Investment Facility Construction ($10.0 million total cost; $9.0 million JCAP commitment) Lease - up Period Construction Completion (2) (~$12.9 million estimated fair value of underlying real estate) Investment Closing Stabilization (~$16.4 million estimated fair value of underlying real estate) Construction Start Stabilization ~ 4 - 5 years (~90% of JCAP commitment funded by construction completion) 15 - 17 MONTHS 3 - 4 YEARS ( Remaining ~10% of JCAP commitment funded over first 12 to 18 months of lease - up) 2 - 4 MONTHS Cumulative % of Total Fair Value Gain Recognized ~ 33% ~ 45% - 50% 100% September 2018 Investor Presentation 8
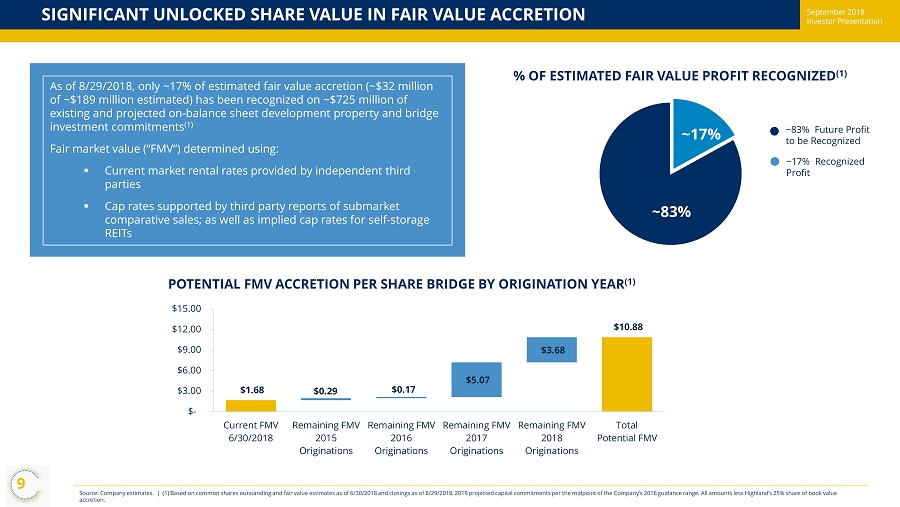
September 2018 Investor Presentation SIGNIFICANT UNLOCKED SHARE VALUE IN FAIR VALUE ACCRETION Source: Company estimates. | (1) Based on common shares outstanding and fair value estimates as of 6/30/2018 and closings as of 8/29/2018 . 2018 projected capital commitments per the midpoint of the Company’s 2018 guidance range. All amounts less Highland’s 25% s har e of book value accretion. As of 8/29/2018 , only ~ 17% of estimated fair value accretion (~$32 million of ~$ 189 million estimated) has been recognized on ~$725 million of existing and projected on - balance sheet development property and bridge investment commitments (1 ) Fair market value (“FMV”) determined using: ▪ Current market rental rates provided by independent third parties ▪ Cap rates supported by third party reports of submarket comparative sales; as well as implied cap rates for self - storage REITs % OF ESTIMATED FAIR VALUE PROFIT RECOGNIZED (1) POTENTIAL FMV ACCRETION PER SHARE BRIDGE BY ORIGINATION YEAR (1) ~83% Future Profit to be Recognized ~17% Recognized Profit September 2018 Investor Presentation ~17% ~83% 9 $0.29 $0.17 $5.07 $3.68 $1.68 $10.88 $- $3.00 $6.00 $9.00 $12.00 $15.00 Current FMV 6/30/2018 Remaining FMV 2015 Originations Remaining FMV 2016 Originations Remaining FMV 2017 Originations Remaining FMV 2018 Originations Total Potential FMV
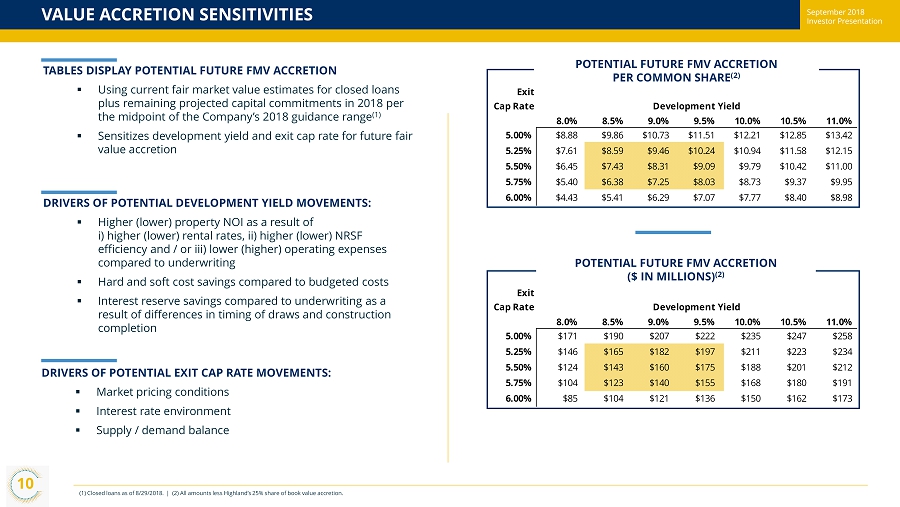
September 2018 Investor Presentation Exit Cap Rate Development Yield $8.31 8.0% 8.5% 9.0% 9.5% 10.0% 10.5% 11.0% 5.00% $8.88 $9.86 $10.73 $11.51 $12.21 $12.85 $13.42 5.25% $7.61 $8.59 $9.46 $10.24 $10.94 $11.58 $12.15 5.50% $6.45 $7.43 $8.31 $9.09 $9.79 $10.42 $11.00 5.75% $5.40 $6.38 $7.25 $8.03 $8.73 $9.37 $9.95 6.00% $4.43 $5.41 $6.29 $7.07 $7.77 $8.40 $8.98 VALUE ACCRETION SENSITIVITIES (1) Closed loans as of 8/29/2018. | (2) All amounts less Highland’s 25% share of book value accretion. TABLES DISPLAY POTENTIAL FUTURE FMV ACCRETION ▪ Using current fair market value estimates for closed loans plus remaining projected capital commitments in 2018 per the midpoint of the Company’s 2018 guidance range (1) ▪ Sensitizes development yield and exit cap rate for future fair value accretion DRIVERS OF POTENTIAL DEVELOPMENT YIELD MOVEMENTS: ▪ Higher (lower) property NOI as a result of i ) higher (lower) rental rates, ii) higher (lower) NRSF efficiency and / or iii) lower (higher) operating expenses compared to underwriting ▪ Hard and soft cost savings compared to budgeted costs ▪ Interest reserve savings compared to underwriting as a result of differences in timing of draws and construction completion DRIVERS OF POTENTIAL EXIT CAP RATE MOVEMENTS: ▪ Market pricing conditions ▪ Interest rate environment ▪ Supply / demand balance POTENTIAL FUTURE FMV ACCRETION PER COMMON SHARE (2) POTENTIAL FUTURE FMV ACCRETION ($ IN MILLIONS) (2) September 2018 Investor Presentation 10 Exit Cap Rate Development Yield 8.0% 8.5% 9.0% 9.5% 10.0% 10.5% 11.0% 5.00% $171 $190 $207 $222 $235 $247 $258 5.25% $146 $165 $182 $197 $211 $223 $234 5.50% $124 $143 $160 $175 $188 $201 $212 5.75% $104 $123 $140 $155 $168 $180 $191 6.00% $85 $104 $121 $136 $150 $162 $173
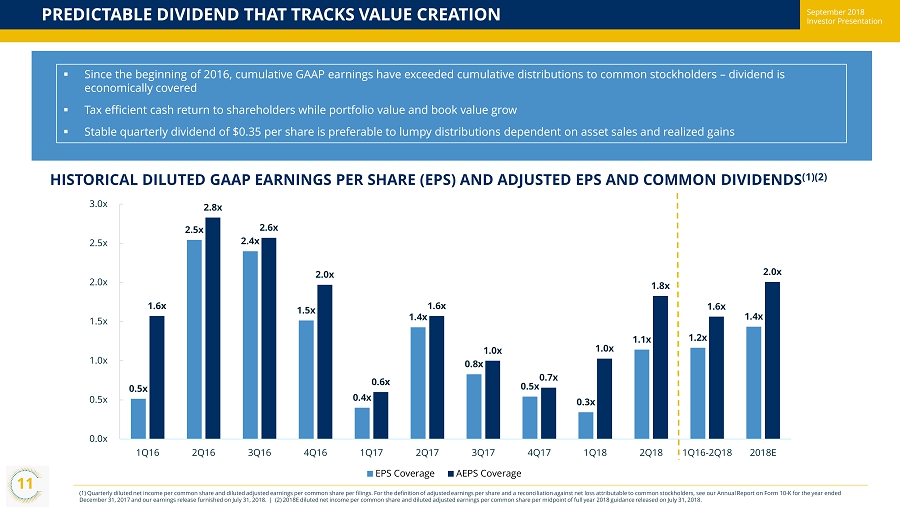
September 2018 Investor Presentation PREDICTABLE DIVIDEND THAT TRACKS VALUE CREATION (1) Quarterly diluted net income per common share and diluted adjusted earnings per common share per filings. For the definition of adjuste d e arnings per share and a reconciliation against net loss attributable to common stockholders, see our Annual Report on Form 10 - K for the year ended December 31, 2017 and our earnings release furnished on July 31, 2018. | (2) 2018E diluted net income per common share and diluted adjusted earnings per common share per midpoint of full year 2018 guidance released o n July 31, 2018. ▪ Since the beginning of 2016, cumulative GAAP earnings have exceeded cumulative distributions to common stockholders – dividend i s economically covered ▪ Tax efficient cash return to shareholders while portfolio value and book value grow ▪ Stable quarterly dividend of $0.35 per share is preferable to lumpy distributions dependent on asset sales and realized gains HISTORICAL DILUTED GAAP EARNINGS PER SHARE (EPS) AND ADJUSTED EPS AND COMMON DIVIDENDS (1)(2) September 2018 Investor Presentation 0.5x 2.5x 2.4x 1.5x 0.4x 1.4x 0.8x 0.5x 0.3x 1.1x 1.2x 1.4x 1.6x 2.8x 2.6x 2.0x 0.6x 1.6x 1.0x 0.7x 1.0x 1.8x 1.6x 2.0x 0.0x 0.5x 1.0x 1.5x 2.0x 2.5x 3.0x 1Q16 2Q16 3Q16 4Q16 1Q17 2Q17 3Q17 4Q17 1Q18 2Q18 1Q16-2Q18 2018E EPS Coverage AEPS Coverage 11
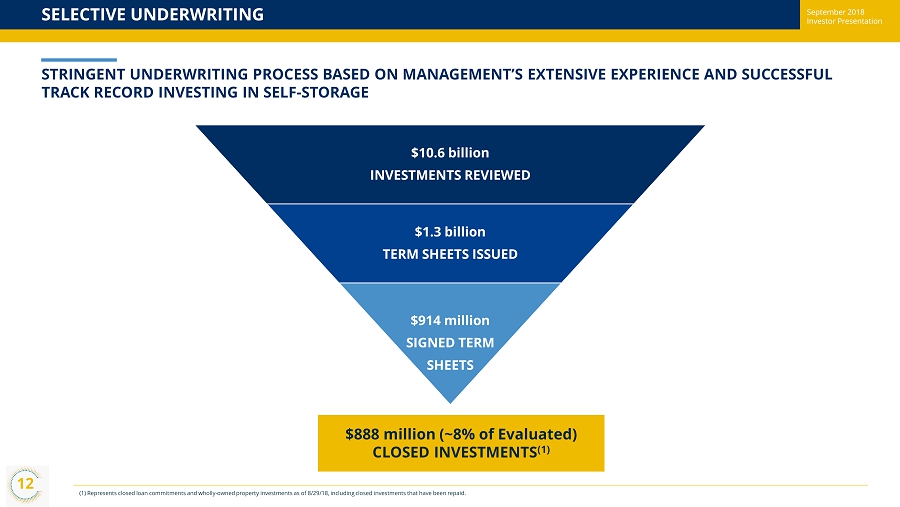
September 2018 Investor Presentation SELECTIVE UNDERWRITING (1) Represents closed loan commitments and wholly - owned property investments as of 8/29/18 , including closed investments that have been repaid. STRINGENT UNDERWRITING PROCESS BASED ON MANAGEMENT’S EXTENSIVE EXPERIENCE AND SUCCESSFUL TRACK RECORD INVESTING IN SELF - STORAGE $10.6 billion INVESTMENTS REVIEWED $ 1.3 billion TERM SHEETS ISSUED $914 million SIGNED TERM SHEETS $888 million (~8% of Evaluated) CLOSED INVESTMENTS (1) September 2018 Investor Presentation 12
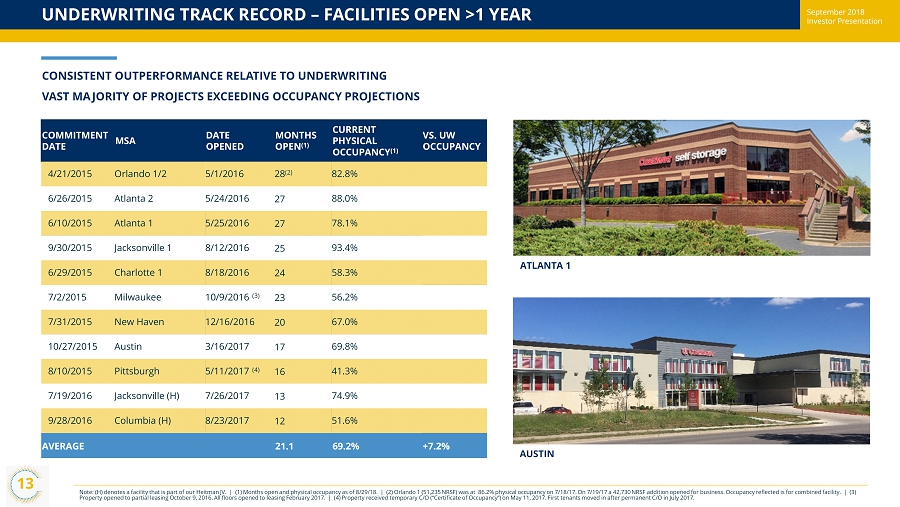
September 2018 Investor Presentation UNDERWRITING TRACK RECORD – FACILITIES OPEN >1 YEAR Note: (H) denotes a facility that is part of our Heitman JV . | (1) Months open and physical occupancy as of 8/29/18. | (2) Orlando 1 (51,235 NRSF) was at 86.2% physical occupancy on 7/18/17. On 7/19/17 a 42,730 NRSF addition opened for business. Occupancy re flected is for combined facility. | (3) Property opened to partial leasing October 9, 2016. All floors opened to leasing February 2017. | (4) Property received temporary C/O (“Certificate of Occupancy”) on May 11, 2017. First tenants moved in after permanent C/O in July 2017. COMMITMENT DATE MSA DATE OPENED MONTHS OPEN (1) CURRENT PHYSICAL OCCUPANCY (1) VS. UW OCCUPANCY 4/21/2015 Orlando 1/2 5/1/2016 28 (2) 82.8% 6/26/2015 Atlanta 2 5/24/2016 27 88.0% 6/10/2015 Atlanta 1 5/25/2016 27 78.1% 9/30/2015 Jacksonville 1 8/12/2016 25 93.4% 6/29/2015 Charlotte 1 8/18/2016 24 58.3% 7/2/2015 Milwaukee 10/9/2016 (3) 23 56.2% 7/31/2015 New Haven 12/16/2016 20 67.0% 10/27/2015 Austin 3/16/2017 17 69.8% 8/10/2015 Pittsburgh 5/11/2017 (4) 16 41.3% 7/19/2016 Jacksonville (H) 7/26/2017 13 74.9% 9/28/2016 Columbia (H) 8/23/2017 12 51.6% AVERAGE 21.1 69.2% +7.2% ATLANTA 1 AUSTIN September 2018 Investor Presentation 13 CONSISTENT OUTPERFORMANCE RELATIVE TO UNDERWRITING VAST MAJORITY OF PROJECTS EXCEEDING OCCUPANCY PROJECTIONS
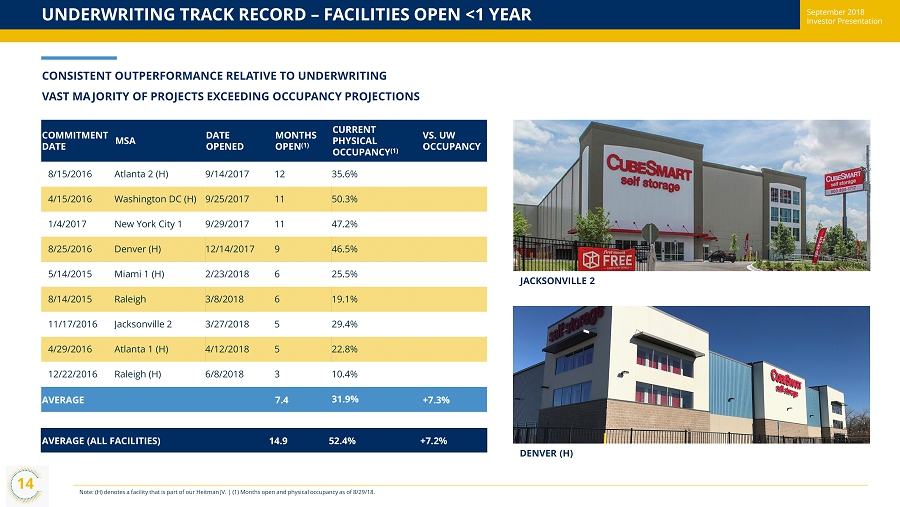
September 2018 Investor Presentation UNDERWRITING TRACK RECORD – FACILITIES OPEN <1 YEAR Note : (H ) denotes a facility that is part of our Heitman JV . | (1) Months open and physical occupancy as of 8/29/18. COMMITMENT DATE MSA DATE OPENED MONTHS OPEN (1) CURRENT PHYSICAL OCCUPANCY (1) VS. UW OCCUPANCY 8/15/2016 Atlanta 2 (H) 9/14/2017 12 35.6% 4/15/2016 Washington DC (H) 9/25/2017 11 50.3% 1/4/2017 New York City 1 9/29/2017 11 47.2% 8/25/2016 Denver (H) 12/14/2017 9 46.5% 5/14/2015 Miami 1 (H) 2/23/2018 6 25.5% 8/14/2015 Raleigh 3/8/2018 6 19.1% 11/17/2016 Jacksonville 2 3/27/2018 5 29.4% 4/29/2016 Atlanta 1 (H) 4/12/2018 5 22.8% 12/22/2016 Raleigh (H) 6/8/2018 3 10.4% AVERAGE 7.4 31.9% +7.3% DENVER (H) AVERAGE (ALL FACILITIES ) 14.9 52.4% +7.2% September 2018 Investor Presentation 14 JACKSONVILLE 2 CONSISTENT OUTPERFORMANCE RELATIVE TO UNDERWRITING VAST MAJORITY OF PROJECTS EXCEEDING OCCUPANCY PROJECTIONS
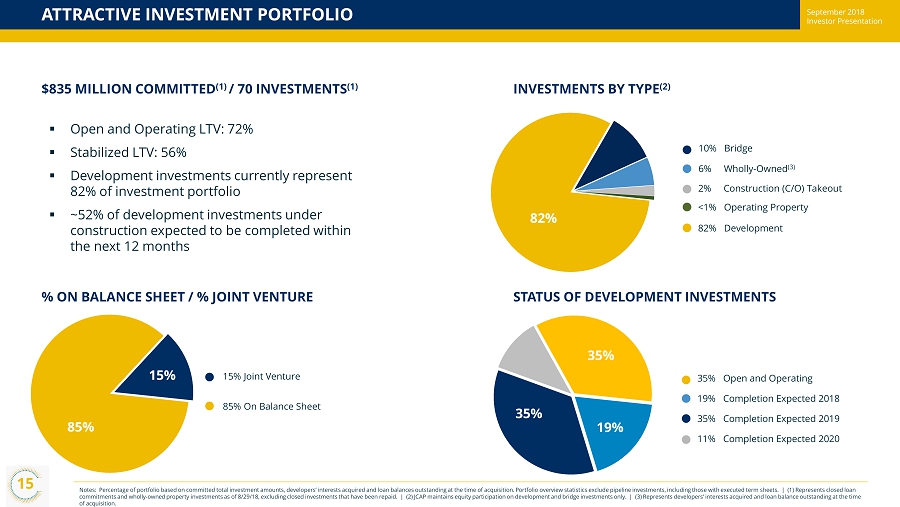
September 2018 Investor Presentation ATTRACTIVE INVESTMENT PORTFOLIO $ 835 MILLION COMMITTED (1) / 70 INVESTMENTS (1) INVESTMENTS BY TYPE (2) % ON BALANCE SHEET / % JOINT VENTURE STATUS OF DEVELOPMENT INVESTMENTS ▪ Open and Operating LTV: 72% ▪ Stabilized LTV: 56% ▪ Development investments currently represent 82% of investment portfolio ▪ ~52% of development investments under construction expected to be completed within the next 12 months 85% 15% 35% 35% 19% 15% Joint Venture 10% Bridge 6% Wholly - Owned (3) 2% Construction (C/O) Takeout < 1 % Operating Property 35% Open and Operating 19% Completion Expected 2018 11% Completion Expected 2020 35% Completion Expected 2019 September 2018 Investor Presentation 82% 15 Notes: Percentage of portfolio based on committed total investment amounts, developers’ interests acquired and loan balances ou tstanding at the time of acquisition. Portfolio overview statistics exclude pipeline investments, including those with execut ed term sheets. | (1) Represents closed loan commitments and wholly - owned property investments as of 8/29/18 , excluding closed investments that have been repaid. | (2) JCAP maintains equity participation on development and bridge investments only. | (3) Represents developers’ interes ts acquired and loan balance outstanding at the time of acquisition. 85% On Balance Sheet 82% Development
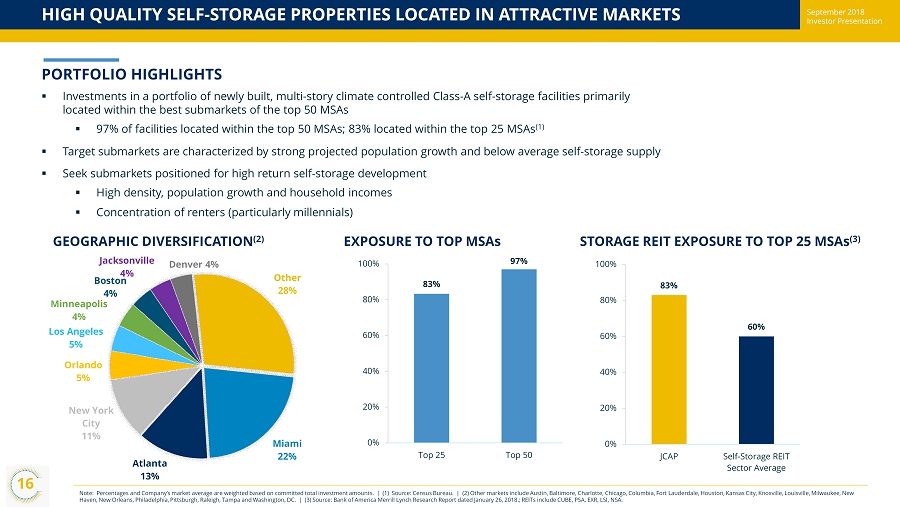
September 2018 Investor Presentation HIGH QUALITY SELF - STORAGE PROPERTIES LOCATED IN ATTRACTIVE MARKETS Note: Percentages and Company’s market average are weighted based on committed total investment amounts. | (1) Source: Census Bureau. | (2) Other markets include Austin, Baltimore, Charlotte, Chicago, Columbia, Fort Lauderdale, Houston, Kansas City, Knoxville, Louisville , M ilwaukee, New Haven, New Orleans, Philadelphia, Pittsburgh, Raleigh, Tampa and Washington, DC. | (3) Source: Bank of America Merrill Lynch Research Report dated January 26, 2018.; REITs include CUBE, PSA, EXR, LSI, NSA. PORTFOLIO HIGHLIGHTS ▪ Investments in a portfolio of newly built, multi - story climate controlled Class - A self - storage facilities primarily located within the best submarkets of the top 50 MSAs ▪ 97% of facilities located within the top 50 MSAs; 83% located within the top 25 MSAs (1) ▪ Target submarkets are characterized by strong projected population growth and below average self - storage supply ▪ Seek submarkets positioned for high return self - storage development ▪ High density, population growth and household incomes ▪ Concentration of renters (particularly millennials ) GEOGRAPHIC DIVERSIFICATION (2) EXPOSURE TO TOP MSAs Miami 22% Atlanta 13% New York City 11% Orlando 5% Los Angeles 5% Minneapolis 4% Boston 4% Jacksonville 4% Denver 4% Other 28% September 2018 Investor Presentation 83% 97% 0% 20% 40% 60% 80% 100% Top 25 Top 50 16 STORAGE REIT EXPOSURE TO TOP 25 MSAs (3) 83% 60% 0% 20% 40% 60% 80% 100% JCAP Self-Storage REIT Sector Average
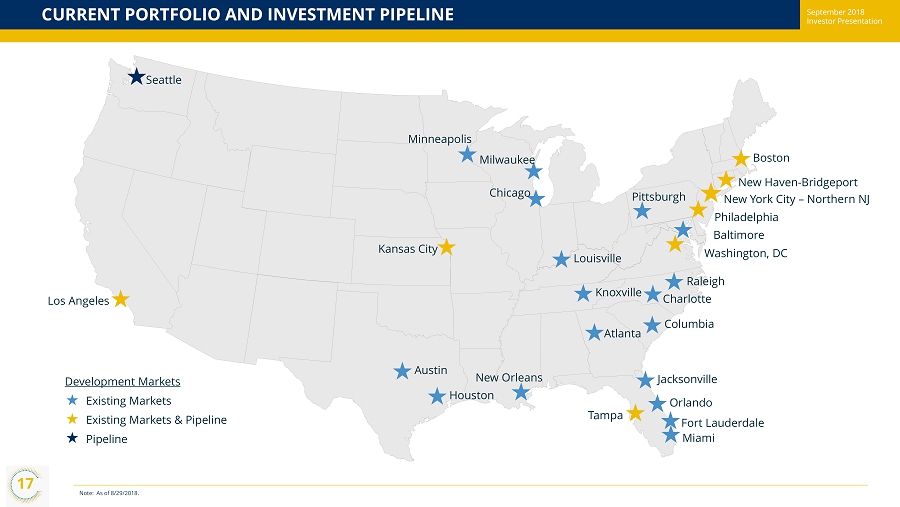
September 2018 Investor Presentation 17 CURRENT PORTFOLIO AND INVESTMENT PIPELINE Note: As of 8/29/2018. Boston Los Angeles Development Markets Existing Markets Existing Markets & Pipeline Pipeline Washington, DC Kansas City New Haven - Bridgeport Seattle New York City – Northern NJ Philadelphia Tampa September 2018 Investor Presentation Baltimore Miami Atlanta Orlando Minneapolis Jacksonville Houston Austin Fort Lauderdale New Orleans Chicago Knoxville Louisville Charlotte Columbia Milwaukee Pittsburgh Raleigh
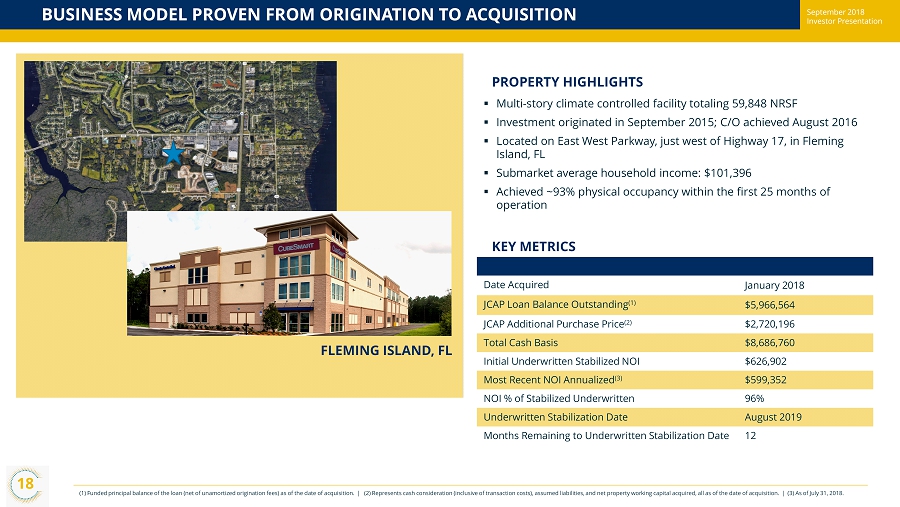
September 2018 Investor Presentation BUSINESS MODEL PROVEN FROM ORIGINATION TO ACQUISITION (1) F unded principal balance of the loan (net of unamortized origination fees ) as of the date of acquisition. | (2) Represents cash consideration (inclusive of transaction costs), assumed liabilities, and net property working capital acquired, all as of the date of acquisition. | (3) As of July 31, 2018. PROPERTY HIGHLIGHTS ▪ Multi - story climate controlled facility totaling 59,848 NRSF ▪ Investment originated in September 2015; C/O achieved August 2016 ▪ Located on East West Parkway, just west of Highway 17, in Fleming Island, FL ▪ Submarket average household income: $ 101,396 ▪ Achieved ~93% physical occupancy within the first 25 months of operation Date Acquired January 2018 JCAP Loan Balance Outstanding (1) $5,966,564 JCAP Additional Purchase Price (2) $2,720,196 Total Cash Basis $8,686,760 Initial Underwritten Stabilized NOI $626,902 Most Recent NOI Annualized (3) $599,352 NOI % of Stabilized Underwritten 96% Underwritten Stabilization Date August 2019 Months Remaining to Underwritten Stabilization Date 12 September 2018 Investor Presentation FLEMING ISLAND, FL 18 KEY METRICS
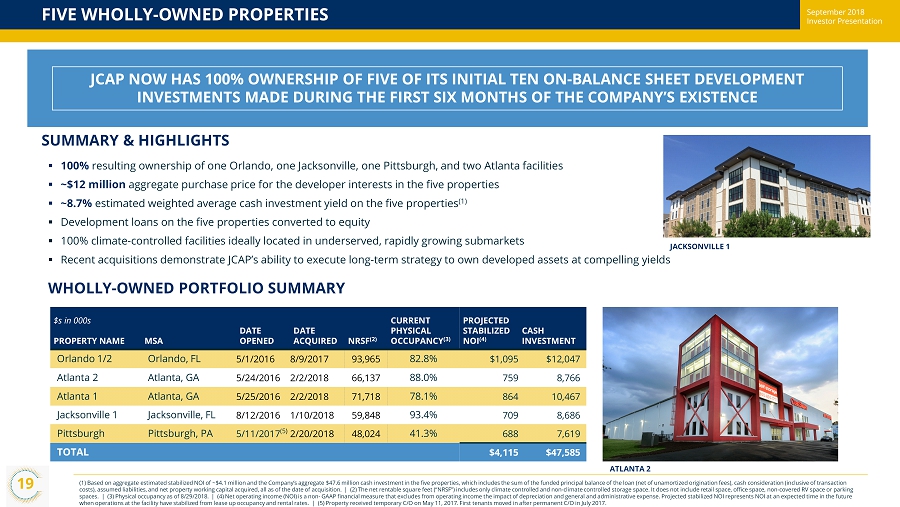
September 2018 Investor Presentation FIVE WHOLLY - OWNED PROPERTIES (1) Based on aggregate estimated stabilized NOI of ~$4.1 million and the Company’s aggregate $ 47.6 million cash investment in the five properties, which includes the sum of the funded principal balance of the loan (net of un amo rtized origination fees), cash consideration (inclusive of transaction costs), assumed liabilities, and net property working capital acquired, all as of the date of acquisition. | (2 ) The net rentable square feet (“NRSF”) includes only climate controlled and non - climate controlled storage space. It does not i nclude retail space, office space, non - covered RV space or parking spaces . | (3) Physical occupancy as of 8/29/2018. | (4 ) Net operating income (NOI) is a non - GAAP financial measure that excludes from operating income the impact of depreciation and general and administrative expense. Projected stabilized NOI represents NOI at an expected time in the future when operations at the facility have stabilized from lease up occupancy and rental rates . | ( 5 ) Property received temporary C/O on May 11, 2017. First tenants moved in after permanent C/O in July 2017 . SUMMARY & HIGHLIGHTS ▪ 100% resulting ownership of one Orlando, one Jacksonville, one Pittsburgh, and two Atlanta facilities ▪ ~ $12 million aggregate purchase price for the developer interests in the five properties ▪ ~8.7% estimated weighted average cash investment yield on the five properties (1) ▪ Development loans on the five properties converted to equity ▪ 100% climate - controlled facilities ideally located in underserved , rapidly growing submarkets ▪ Recent acquisitions demonstrate JCAP’s ability to execute long - term strategy to own developed assets at compelling yields WHOLLY - OWNED PORTFOLIO SUMMARY $s in 000s PROPERTY NAME MSA DATE OPENED DATE ACQUIRED NRSF (2) CURRENT PHYSICAL OCCUPANCY (3) PROJECTED STABILIZED NOI (4) CASH INVESTMENT Orlando 1/2 Orlando, FL 5/1/2016 8/9/2017 93,965 82.8% $1,095 $12,047 Atlanta 2 Atlanta, GA 5/24/2016 2/2/2018 66,137 88.0% 759 8,766 Atlanta 1 Atlanta, GA 5/25/2016 2/2/2018 71,718 78.1% 864 10,467 Jacksonville 1 Jacksonville, FL 8/12/2016 1/10/2018 59,848 93.4% 709 8,686 Pittsburgh Pittsburgh, PA 5/11/2017 (5 ) 2/20/2018 48,024 41.3% 688 7,619 TOTAL $ 4,115 $47,585 JCAP NOW HAS 100% OWNERSHIP OF FIVE OF ITS INITIAL TEN ON - BALANCE SHEET DEVELOPMENT INVESTMENTS MADE DURING THE FIRST SIX MONTHS OF THE COMPANY’S EXISTENCE JACKSONVILLE 1 ATLANTA 2 September 2018 Investor Presentation 19
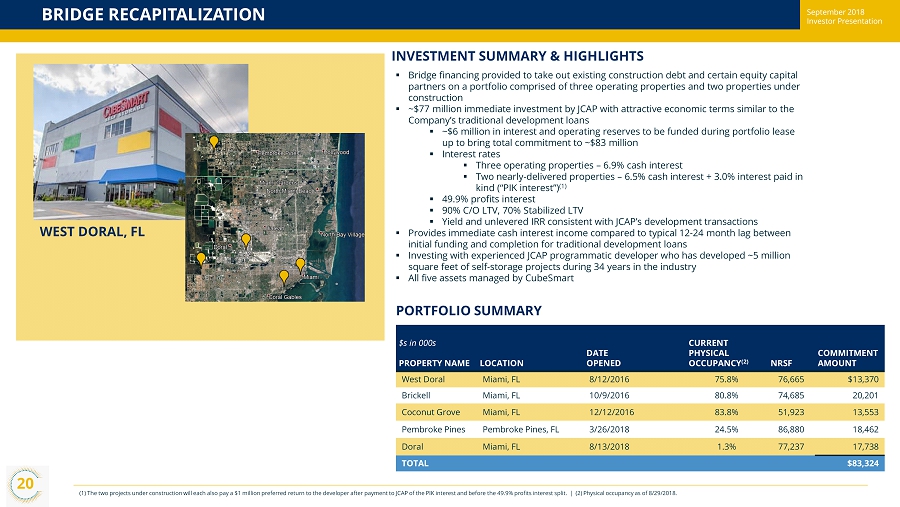
September 2018 Investor Presentation BRIDGE RECAPITALIZATION (1) The two projects under construction will each also pay a $1 million preferred return to the developer after payment to JCAP of th e P IK interest and before the 49.9% profits interest split. | (2) Physical occupancy as of 8/29/2018 . INVESTMENT SUMMARY & HIGHLIGHTS ▪ Bridge financing provided to take out existing construction debt and certain equity capital partners on a portfolio comprised of three operating properties and two properties under construction ▪ ~$77 million immediate investment by JCAP with attractive economic terms similar to the Company’s traditional development loans ▪ ~$6 million in interest and operating reserves to be funded during portfolio lease up to bring total commitment to ~$ 83 million ▪ Interest rates ▪ Three operating properties – 6.9% cash interest ▪ Two nearly - delivered properties – 6.5% cash interest + 3.0% interest paid in kind (“PIK interest ”) (1) ▪ 49.9% profits i nterest ▪ 90% C/O LTV, 70% Stabilized LTV ▪ Yield and unlevered IRR consistent with JCAP’s development transactions ▪ Provides immediate cash interest income compared to typical 12 - 24 month lag between initial funding and completion for traditional development loans ▪ Investing with experienced JCAP programmatic developer who has developed ~5 million square feet of self - storage projects during 34 years in the industry ▪ All five assets managed by CubeSmart PORTFOLIO SUMMARY $s in 000s PROPERTY NAME LOCATION DATE OPENED CURRENT PHYSICAL OCCUPANCY (2) NRSF COMMITMENT AMOUNT West Doral Miami, FL 8/12/2016 75.8% 76,665 $13,370 Brickell Miami, FL 10/9/2016 80.8% 74,685 20,201 Coconut Grove Miami, FL 12/12/2016 83.8% 51,923 13,553 Pembroke Pines Pembroke Pines, FL 3/26/2018 24.5% 86,880 18,462 Doral Miami, FL 8/13/2018 1.3% 77,237 17,738 TOTAL $83,324 September 2018 Investor Presentation WEST DORAL, FL 20
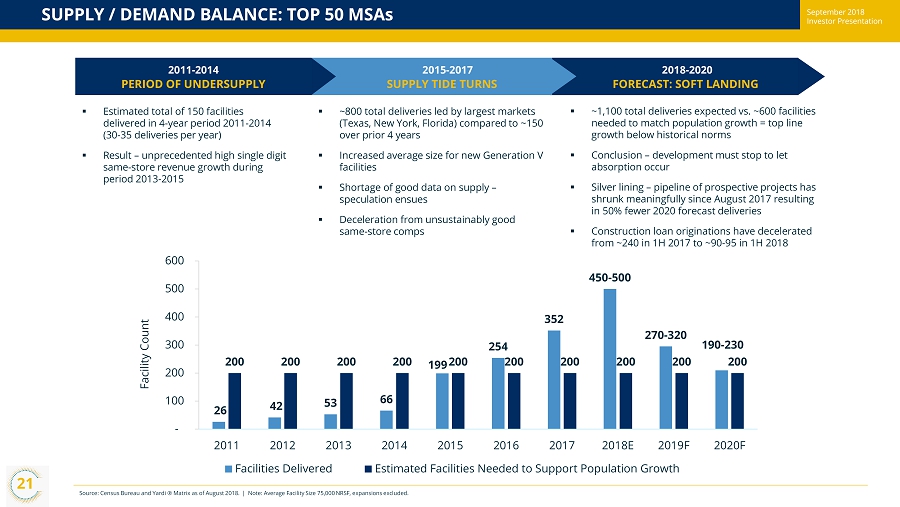
September 2018 Investor Presentation SUPPLY / DEMAND BALANCE: TOP 50 MSAs Source: Census Bureau and Yardi ® Matrix as of August 2018. | Note : Average Facility Size 75,000 NRSF, expansions excluded. 26 42 53 66 199 254 352 450 - 500 270 - 320 190 - 230 200 200 200 200 200 200 200 200 200 200 - 100 200 300 400 500 600 2011 2012 2013 2014 2015 2016 2017 2018E 2019F 2020F Facility Count Facilities Delivered Estimated Facilities Needed to Support Population Growth September 2018 Investor Presentation FORECAST: SOFT LANDING SUPPLY TIDE TURNS ▪ Estimated total of 150 facilities delivered in 4 - year period 2011 - 2014 (30 - 35 deliveries per year) ▪ Result – unprecedented high single digit same - store revenue growth during period 2013 - 2015 ▪ ~800 total deliveries led by largest markets (Texas, New York, Florida) compared to ~150 over prior 4 years ▪ Increased average size for new Generation V facilities ▪ Shortage of good data on supply – speculation ensues ▪ Deceleration from unsustainably good same - store comps ▪ ~1,100 total deliveries expected vs . ~600 facilities needed to match population growth = top line growth below historical norms ▪ Conclusion – d evelopment must stop to let absorption occur ▪ Silver lining – pipeline of prospective projects has shrunk meaningfully since August 2017 resulting in 50% fewer 2020 forecast deliveries ▪ Construction loan originations have decelerated from ~240 in 1H 2017 to ~90 - 95 in 1H 2018 PERIOD OF UNDERSUPPLY 2 011 - 2014 2015 - 2017 2018 - 2020 21
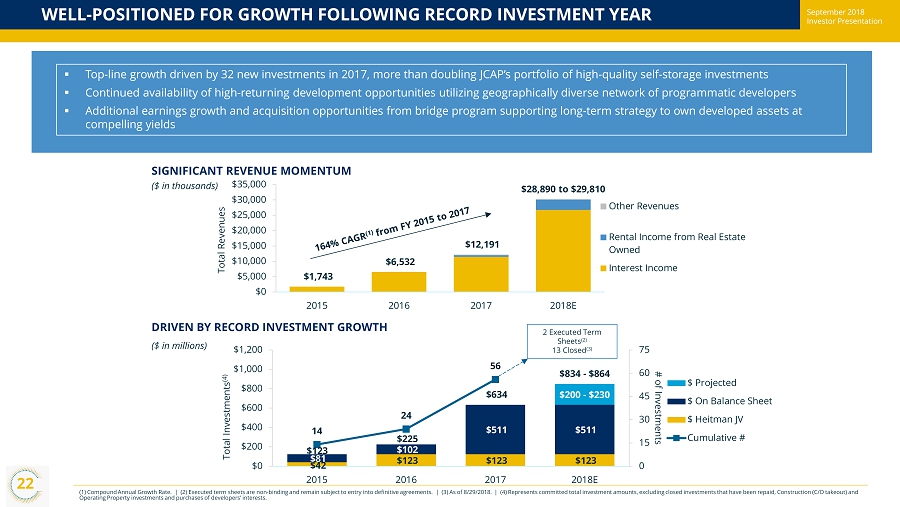
September 2018 Investor Presentation WELL - POSITIONED FOR GROWTH FOLLOWING RECORD INVESTMENT YEAR ▪ Top - line growth driven by 32 new investments in 2017, more than doubling JCAP’s portfolio of high - quality self - storage investmen ts ▪ Continued availability of high - returning development opportunities utilizing geographically diverse network of programmatic deve lopers ▪ Additional earnings growth and acquisition opportunities from bridge program supporting long - term strategy to own developed asse ts at compelling yields SIGNIFICANT REVENUE MOMENTUM ($ in thousands) $42 $123 $123 $123 $81 $102 $511 $511 $200 - $230 $123 $225 $634 $ 834 - $ 864 14 24 56 0 15 30 45 60 75 $0 $200 $400 $600 $800 $1,000 $1,200 2015 2016 2017 2018E # of Investments Total Investments (4) $ Projected $ On Balance Sheet $ Heitman JV Cumulative # $1,743 $6,532 $12,191 $ 28,890 to $29,810 $0 $5,000 $10,000 $15,000 $20,000 $25,000 $30,000 $35,000 2015 2016 2017 2018E Total Revenues Other Revenues Rental Income from Real Estate Owned Interest Income ($ in millions) 2 Executed Term Sheets (2) 13 Closed (3) DRIVEN BY RECORD INVESTMENT GROWTH (1) Compound Annual Growth Rate. | (2) Executed term sheets are non - binding and remain subject to entry into definitive agreements. | (3) As of 8/29/2018. | (4) Represents committed total investment amounts, excluding closed investments that have been repaid, Construction (C/O takeout) and Operating Property investments and purchases of developers’ interests. September 2018 Investor Presentation 22
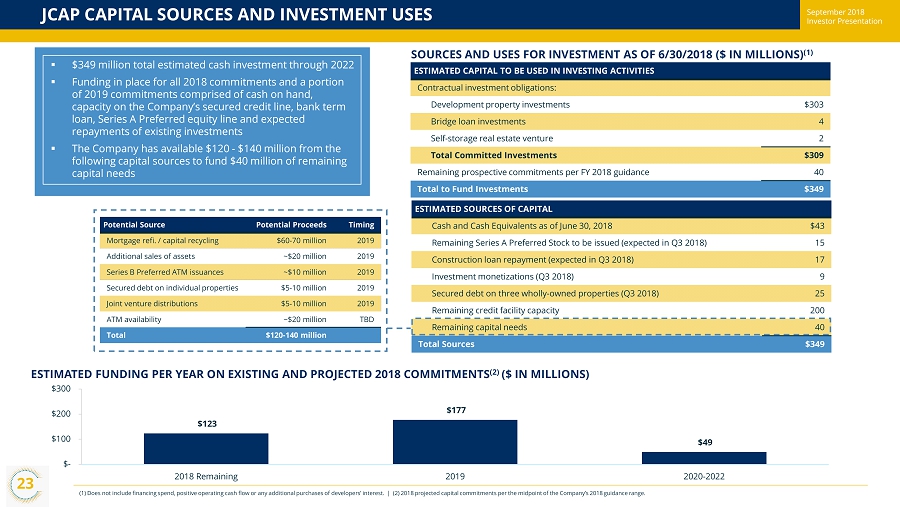
September 2018 Investor Presentation JCAP CAPITAL SOURCES AND INVESTMENT USES (1) Does not include financing spend, positive operating cash flow or any additional purchases of developers’ interest. | ( 2) 2018 projected capital commitments per the midpoint of the Company’s 2018 guidance range . ▪ $349 million total estimated cash investment through 2022 ▪ Funding in place for all 2018 commitments and a portion of 2019 commitments comprised of cash on hand, capacity on the Company’s secured credit line, bank term loan, Series A Preferred equity line and expected repayments of existing investments ▪ The Company has available $ 120 - $140 million from the following capital sources to fund $40 million of remaining capital needs SOURCES AND USES FOR INVESTMENT AS OF 6/30/2018 ($ IN MILLIONS) (1) ESTIMATED FUNDING PER YEAR ON EXISTING AND PROJECTED 2018 COMMITMENTS (2) ($ IN MILLIONS) September 2018 Investor Presentation ESTIMATED CAPITAL TO BE USED IN INVESTING ACTIVITIES Contractual investment obligations: Development property investments $303 Bridge loan investments 4 Self - storage real estate venture 2 Total Committed Investments $309 Remaining prospective commitments per FY 2018 guidance 40 Total to Fund Investments $349 ESTIMATED SOURCES OF CAPITAL Cas h and Cash Equivalents as of June 30, 2018 $43 Remaining Series A Preferred Stock to be issued (expected in Q3 2018) 15 Construction loan repayment (expected in Q3 2018) 17 Investment monetizations (Q3 2018) 9 Secured debt on three wholly - owned properties (Q3 2018) 25 Remaining credit facility capacity 200 Remaining capital needs 40 Total Sources $349 Potential Source Potential Proceeds Timing Mortgage refi. / capital recycling $60 - 70 million 2019 Additional sales of assets ~$20 million 2019 Series B Preferred ATM issuances ~$10 million 2019 Secured debt on individual properties $5 - 10 million 2019 Joint venture distributions $5 - 10 million 2019 ATM availability ~$20 million TBD Total $120 - 140 million $123 $177 $49 $- $100 $200 $300 2018 Remaining 2019 2020-2022 23
September 2018 Investor Presentation 24 RECENT DEVELOPMENTS ▪ On August 17, 2018, JCAP obtained term loans in the aggregate principal amount of $24.9 million from one of its credit facili ty participating banks, which loans are secured by three of the Company's wholly - owned self - storage facilities . ▪ On August 17, 2018, the Company’s operating property investment in Newark, NJ was fully repaid in the amount of $3.5 million. ▪ On August 28, 2018, the self - storage facility underlying the Company's Tampa 1 development was sold to a third party institutional purchaser. JCAP received full repayment of its loan principal, its contractual early repayment fee and its share of residual profit, which wa s s lightly greater than JCAP's fair value for such residual profit at June 30, 2018 .

September 2018 Investor Presentation CONTACT JERNIGAN CAPITAL JERNIGAN CAPITAL, INC investorrelations@jernigancapital.com 6410 Poplar Ave, Suite 650 Memphis, TN 38119 www.jernigancapital.com September 2018 Investor Presentation 25
September 2018 Investor Presentation APPENDIX
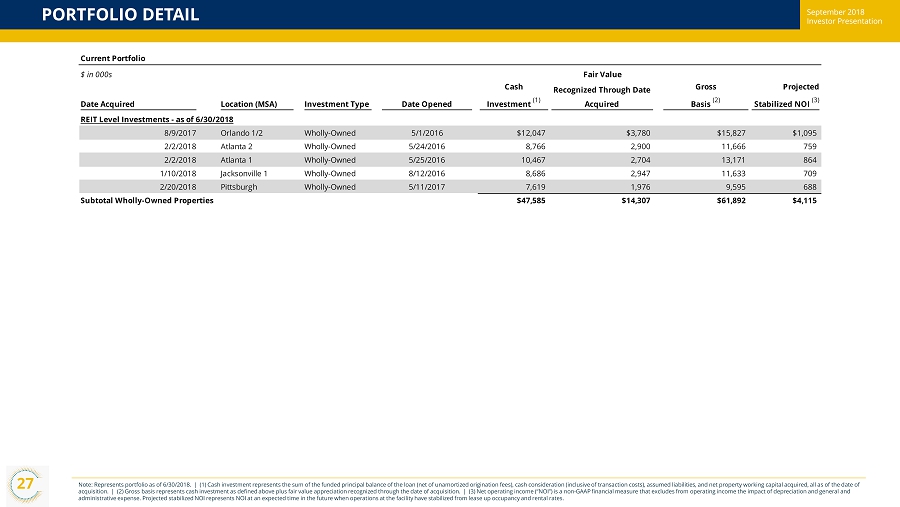
September 2018 Investor Presentation Current Portfolio $ in 000s Fair Value Date Acquired Location (MSA) Investment Type Date Opened Cash Investment (1) Recognized Through Date Acquired Gross Basis (2) Projected Stabilized NOI (3) REIT Level Investments - as of 6/30/2018 8/9/2017 Orlando 1/2 Wholly-Owned 5/1/2016 $12,047 $3,780 $15,827 $1,095 2/2/2018 Atlanta 2 Wholly-Owned 5/24/2016 8,766 2,900 11,666 759 2/2/2018 Atlanta 1 Wholly-Owned 5/25/2016 10,467 2,704 13,171 864 1/10/2018 Jacksonville 1 Wholly-Owned 8/12/2016 8,686 2,947 11,633 709 2/20/2018 Pittsburgh Wholly-Owned 5/11/2017 7,619 1,976 9,595 688 Subtotal Wholly-Owned Properties $47,585 $14,307 $61,892 $4,115 PORTFOLIO DETAIL September 2018 Investor Presentation Note: Represents portfolio as of 6/30/2018. | (1) Cash investment represents the sum of the funded principal balance of the loan (net of unamortized origination fees), cash conside rat ion (inclusive of transaction costs), assumed liabilities, and net property working capital acquired, all as of the date of acquisition. | (2) Gross basis represents cash investment as defined above plus fair value appreciation recognized through the date of acquisition. | (3) Net operating income (“NOI”) is a non - GAAP financial measure that excludes from operating income the impact of depreciation and gene ral and administrative expense. Projected stabilized NOI represents NOI at an expected time in the future when operations at the faci lit y have stabilized from lease up occupancy and rental rates. 27
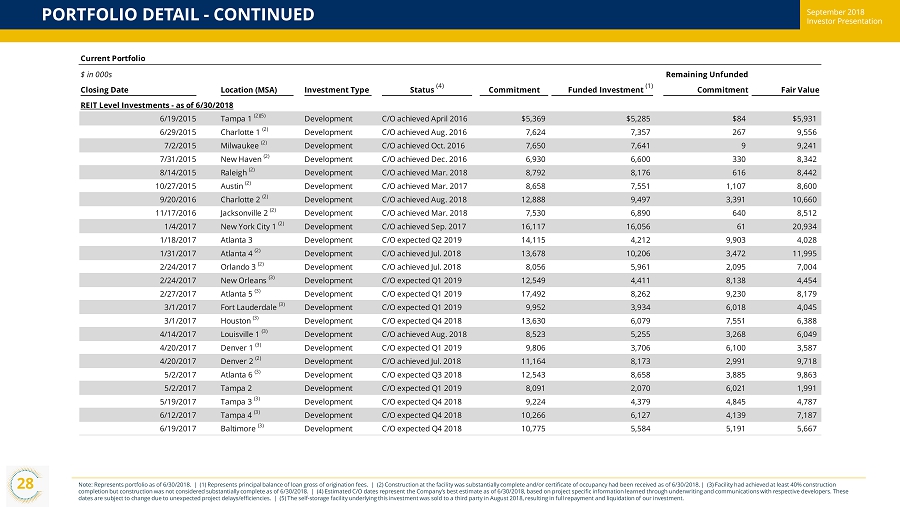
September 2018 Investor Presentation PORTFOLIO DETAIL - CONTINUED September 2018 Investor Presentation 28 Current Portfolio $ in 000s Remaining Unfunded Closing Date Location (MSA) Investment Type Status (4) Commitment Funded Investment (1) Commitment Fair Value REIT Level Investments - as of 6/30/2018 6/19/2015 Tampa 1 (2)(5) Development C/O achieved April 2016 $5,369 $5,285 $84 $5,931 6/29/2015 Charlotte 1 (2) Development C/O achieved Aug. 2016 7,624 7,357 267 9,556 7/2/2015 Milwaukee (2) Development C/O achieved Oct. 2016 7,650 7,641 9 9,241 7/31/2015 New Haven (2) Development C/O achieved Dec. 2016 6,930 6,600 330 8,342 8/14/2015 Raleigh (2) Development C/O achieved Mar. 2018 8,792 8,176 616 8,442 10/27/2015 Austin (2) Development C/O achieved Mar. 2017 8,658 7,551 1,107 8,600 9/20/2016 Charlotte 2 (2) Development C/O achieved Aug. 2018 12,888 9,497 3,391 10,660 11/17/2016 Jacksonville 2 (2) Development C/O achieved Mar. 2018 7,530 6,890 640 8,512 1/4/2017 New York City 1 (2) Development C/O achieved Sep. 2017 16,117 16,056 61 20,934 1/18/2017 Atlanta 3 Development C/O expected Q2 2019 14,115 4,212 9,903 4,028 1/31/2017 Atlanta 4 (2) Development C/O achieved Jul. 2018 13,678 10,206 3,472 11,995 2/24/2017 Orlando 3 (2) Development C/O achieved Jul. 2018 8,056 5,961 2,095 7,004 2/24/2017 New Orleans (3) Development C/O expected Q1 2019 12,549 4,411 8,138 4,454 2/27/2017 Atlanta 5 (3) Development C/O expected Q1 2019 17,492 8,262 9,230 8,179 3/1/2017 Fort Lauderdale (3) Development C/O expected Q1 2019 9,952 3,934 6,018 4,045 3/1/2017 Houston (3) Development C/O expected Q4 2018 13,630 6,079 7,551 6,388 4/14/2017 Louisville 1 (3) Development C/O achieved Aug. 2018 8,523 5,255 3,268 6,049 4/20/2017 Denver 1 (3) Development C/O expected Q1 2019 9,806 3,706 6,100 3,587 4/20/2017 Denver 2 (2) Development C/O achieved Jul. 2018 11,164 8,173 2,991 9,718 5/2/2017 Atlanta 6 (3) Development C/O expected Q3 2018 12,543 8,658 3,885 9,863 5/2/2017 Tampa 2 Development C/O expected Q1 2019 8,091 2,070 6,021 1,991 5/19/2017 Tampa 3 (3) Development C/O expected Q4 2018 9,224 4,379 4,845 4,787 6/12/2017 Tampa 4 (3) Development C/O expected Q4 2018 10,266 6,127 4,139 7,187 6/19/2017 Baltimore (3) Development C/O expected Q4 2018 10,775 5,584 5,191 5,667 Note: Represents portfolio as of 6/30/2018. | (1) Represents principal balance of loan gross of origination fees. | (2) C ons truction at the facility was substantially complete and/or certificate of occupancy had been received as of 6/30/2018. | (3) Fa cility had achieved at least 40% construction completion but construction was not considered substantially complete as of 6/30/2018. | (4) Estimated C/O dates represent the Company’s best estimate as of 6/30/2018, based on project specific information learned through underwriting and communication s with respective developers. These dates are subject to change due to unexpected project delays/efficiencies. | (5) The self - storage facility underlying this inv estment was sold to a third party in August 2018, resulting in full repayment and liquidation of our investment.
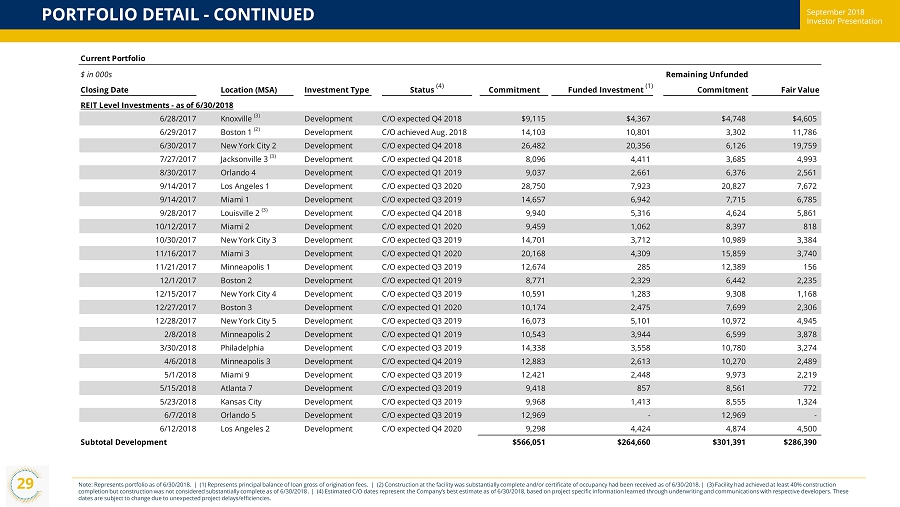
September 2018 Investor Presentation PORTFOLIO DETAIL - CONTINUED September 2018 Investor Presentation 29 Note: Represents portfolio as of 6/30/2018. | (1) Represents principal balance of loan gross of origination fees. | (2) C ons truction at the facility was substantially complete and/or certificate of occupancy had been received as of 6/30/2018. | (3) Fa cility had achieved at least 40% construction completion but construction was not considered substantially complete as of 6/30/2018 . | (4) Estimated C/O dates represent the Company’s best estimate as of 6/30/2018, based on project specific information learned through underwriting and communication s with respective developers. These dates are subject to change due to unexpected project delays/efficiencies. Current Portfolio $ in 000s Remaining Unfunded Closing Date Location (MSA) Investment Type Status (4) Commitment Funded Investment (1) Commitment Fair Value REIT Level Investments - as of 6/30/2018 6/28/2017 Knoxville (3) Development C/O expected Q4 2018 $9,115 $4,367 $4,748 $4,605 6/29/2017 Boston 1 (2) Development C/O achieved Aug. 2018 14,103 10,801 3,302 11,786 6/30/2017 New York City 2 Development C/O expected Q4 2018 26,482 20,356 6,126 19,759 7/27/2017 Jacksonville 3 (3) Development C/O expected Q4 2018 8,096 4,411 3,685 4,993 8/30/2017 Orlando 4 Development C/O expected Q1 2019 9,037 2,661 6,376 2,561 9/14/2017 Los Angeles 1 Development C/O expected Q3 2020 28,750 7,923 20,827 7,672 9/14/2017 Miami 1 Development C/O expected Q3 2019 14,657 6,942 7,715 6,785 9/28/2017 Louisville 2 (3) Development C/O expected Q4 2018 9,940 5,316 4,624 5,861 10/12/2017 Miami 2 Development C/O expected Q1 2020 9,459 1,062 8,397 818 10/30/2017 New York City 3 Development C/O expected Q3 2019 14,701 3,712 10,989 3,384 11/16/2017 Miami 3 Development C/O expected Q1 2020 20,168 4,309 15,859 3,740 11/21/2017 Minneapolis 1 Development C/O expected Q3 2019 12,674 285 12,389 156 12/1/2017 Boston 2 Development C/O expected Q1 2019 8,771 2,329 6,442 2,235 12/15/2017 New York City 4 Development C/O expected Q3 2019 10,591 1,283 9,308 1,168 12/27/2017 Boston 3 Development C/O expected Q1 2020 10,174 2,475 7,699 2,306 12/28/2017 New York City 5 Development C/O expected Q3 2019 16,073 5,101 10,972 4,945 2/8/2018 Minneapolis 2 Development C/O expected Q1 2019 10,543 3,944 6,599 3,878 3/30/2018 Philadelphia Development C/O expected Q3 2019 14,338 3,558 10,780 3,274 4/6/2018 Minneapolis 3 Development C/O expected Q4 2019 12,883 2,613 10,270 2,489 5/1/2018 Miami 9 Development C/O expected Q3 2019 12,421 2,448 9,973 2,219 5/15/2018 Atlanta 7 Development C/O expected Q3 2019 9,418 857 8,561 772 5/23/2018 Kansas City Development C/O expected Q3 2019 9,968 1,413 8,555 1,324 6/7/2018 Orlando 5 Development C/O expected Q3 2019 12,969 - 12,969 - 6/12/2018 Los Angeles 2 Development C/O expected Q4 2020 9,298 4,424 4,874 4,500 Subtotal Development $566,051 $264,660 $301,391 $286,390
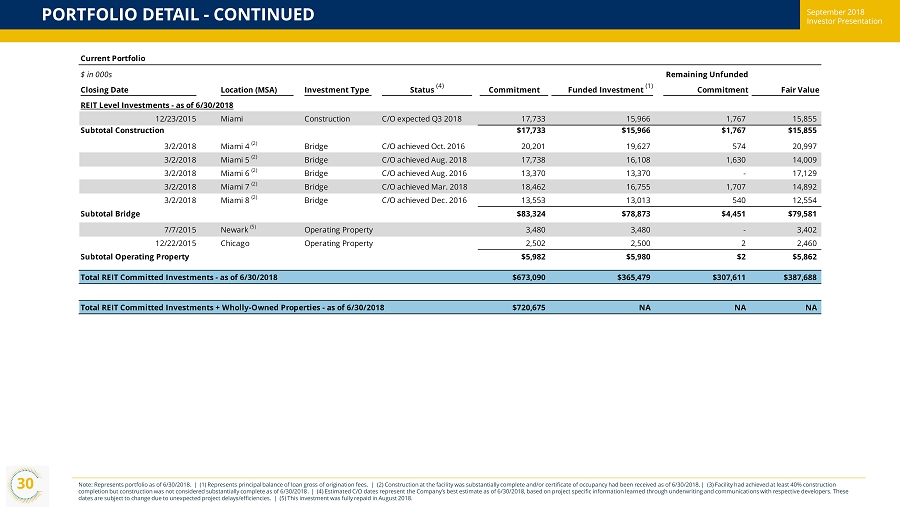
September 2018 Investor Presentation PORTFOLIO DETAIL - CONTINUED September 2018 Investor Presentation 30 Current Portfolio $ in 000s Remaining Unfunded Closing Date Location (MSA) Investment Type Status (4) Commitment Funded Investment (1) Commitment Fair Value REIT Level Investments - as of 6/30/2018 12/23/2015 Miami Construction C/O expected Q3 2018 17,733 15,966 1,767 15,855 Subtotal Construction $17,733 $15,966 $1,767 $15,855 3/2/2018 Miami 4 (2) Bridge C/O achieved Oct. 2016 20,201 19,627 574 20,997 3/2/2018 Miami 5 (2) Bridge C/O achieved Aug. 2018 17,738 16,108 1,630 14,009 3/2/2018 Miami 6 (2) Bridge C/O achieved Aug. 2016 13,370 13,370 - 17,129 3/2/2018 Miami 7 (2) Bridge C/O achieved Mar. 2018 18,462 16,755 1,707 14,892 3/2/2018 Miami 8 (2) Bridge C/O achieved Dec. 2016 13,553 13,013 540 12,554 Subtotal Bridge $83,324 $78,873 $4,451 $79,581 7/7/2015 Newark (5) Operating Property 3,480 3,480 - 3,402 12/22/2015 Chicago Operating Property 2,502 2,500 2 2,460 Subtotal Operating Property $5,982 $5,980 $2 $5,862 Total REIT Committed Investments - as of 6/30/2018 $673,090 $365,479 $307,611 $387,688 Total REIT Committed Investments + Wholly-Owned Properties - as of 6/30/2018 $720,675 NA NA NA Note: Represents portfolio as of 6/30/2018. | (1) Represents principal balance of loan gross of origination fees. | (2) C ons truction at the facility was substantially complete and/or certificate of occupancy had been received as of 6/30/2018. | (3) Fa cility had achieved at least 40% construction completion but construction was not considered substantially complete as of 6/30/2018 . | (4) Estimated C/O dates represent the Company’s best estimate as of 6/30/2018, based on project specific information learned through underwriting and communication s with respective developers. These dates are subject to change due to unexpected project delays/efficiencies . | (5) This investment was fully repaid in August 2018.
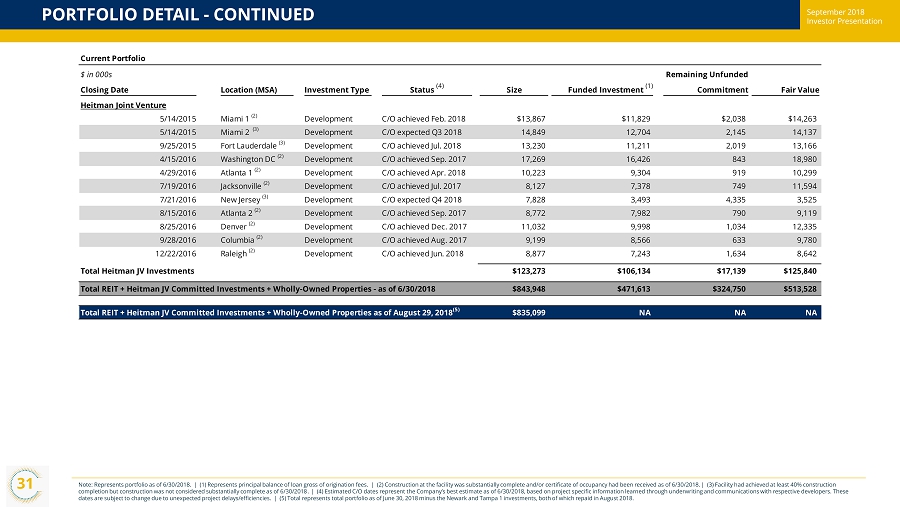
September 2018 Investor Presentation PORTFOLIO DETAIL - CONTINUED September 2018 Investor Presentation Note: Represents portfolio as of 6/30/2018. | (1) Represents principal balance of loan gross of origination fees. | (2) Construction at the facility was substantially complete and/or certificate of occupancy had been received as of 6/30/2018. | (3) Facility had achieved at least 40% construction completion but construction was not considered substantially complete as of 6/30/2018 . | (4) Estimated C/O dates represent the Company’s best estimate as of 6/30/2018 , based on project specific information learned through underwriting and communications with respective developers. These dates are subject to change due to unexpected project delays/efficiencies. | (5) Total represents total portfolio as of June 30, 2018 minus the Newark and Tampa 1 investments, b oth of which repaid in August 2018. 31 Current Portfolio $ in 000s Remaining Unfunded Closing Date Location (MSA) Investment Type Status (4) Size Funded Investment (1) Commitment Fair Value Heitman Joint Venture 5/14/2015 Miami 1 (2) Development C/O achieved Feb. 2018 $13,867 $11,829 $2,038 $14,263 5/14/2015 Miami 2 (3) Development C/O expected Q3 2018 14,849 12,704 2,145 14,137 9/25/2015 Fort Lauderdale (3) Development C/O achieved Jul. 2018 13,230 11,211 2,019 13,166 4/15/2016 Washington DC (2) Development C/O achieved Sep. 2017 17,269 16,426 843 18,980 4/29/2016 Atlanta 1 (2) Development C/O achieved Apr. 2018 10,223 9,304 919 10,299 7/19/2016 Jacksonville (2) Development C/O achieved Jul. 2017 8,127 7,378 749 11,594 7/21/2016 New Jersey (3) Development C/O expected Q4 2018 7,828 3,493 4,335 3,525 8/15/2016 Atlanta 2 (2) Development C/O achieved Sep. 2017 8,772 7,982 790 9,119 8/25/2016 Denver (2) Development C/O achieved Dec. 2017 11,032 9,998 1,034 12,335 9/28/2016 Columbia (2) Development C/O achieved Aug. 2017 9,199 8,566 633 9,780 12/22/2016 Raleigh (2) Development C/O achieved Jun. 2018 8,877 7,243 1,634 8,642 Total Heitman JV Investments $123,273 $106,134 $17,139 $125,840 Total REIT + Heitman JV Committed Investments + Wholly-Owned Properties - as of 6/30/2018 $843,948 $471,613 $324,750 $513,528 Total REIT + Heitman JV Committed Investments + Wholly-Owned Properties as of August 29, 2018 (5) $835,099 NA NA NA
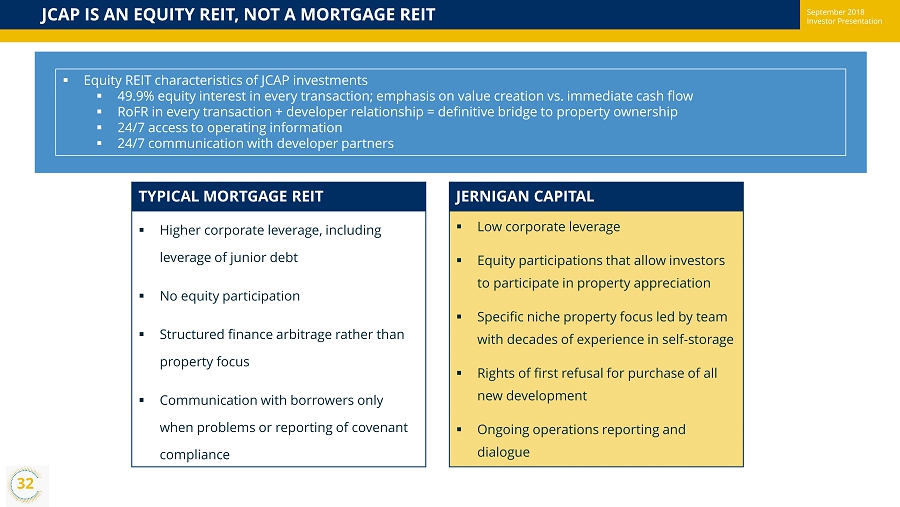
September 2018 Investor Presentation JCAP IS AN EQUITY REIT, NOT A MORTGAGE REIT September 2018 Investor Presentation TYPICAL MORTGAGE REIT ▪ Higher corporate leverage, including leverage of junior debt ▪ No equity participation ▪ Structured finance arbitrage rather than property focus ▪ Communication with borrowers only when problems or reporting of covenant compliance JERNIGAN CAPITAL ▪ Low corporate leverage ▪ Equity participations that allow investors to participate in property appreciation ▪ Specific niche property focus led by team with decades of experience in self - storage ▪ Rights of first refusal for purchase of all new development ▪ Ongoing operations reporting and dialogue ▪ Equity REIT characteristics of JCAP investments ▪ 49.9% equity interest in every transaction; emphasis on value creation vs. immediate cash flow ▪ RoFR in every transaction + developer relationship = definitive bridge to property ownership ▪ 24/7 access to operating information ▪ 24/7 communication with developer partners 32
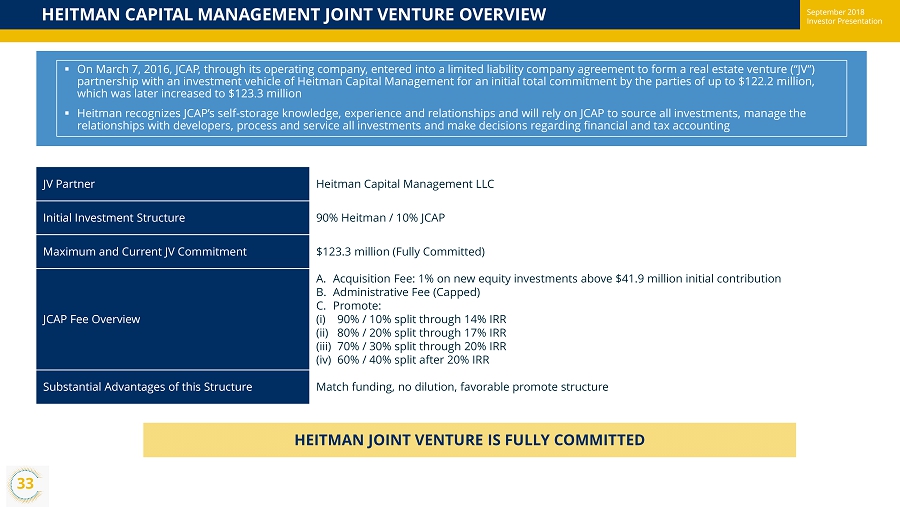
September 2018 Investor Presentation HEITMAN CAPITAL MANAGEMENT JOINT VENTURE OVERVIEW September 2018 Investor Presentation HEITMAN JOINT VENTURE IS FULLY COMMITTED JV Partner Heitman Capital Management LLC Initial Investment Structure 90% Heitman / 10% JCAP Maximum and Current JV Commitment $123.3 million (Fully Committed) JCAP Fee Overview A. Acquisition Fee: 1% on new equity investments above $41.9 million initial contribution B. Administrative Fee (Capped) C. Promote: (i) 90% / 10% split through 14% IRR (ii) 80% / 20% split through 17% IRR (iii) 70% / 30% split through 20% IRR (iv) 60% / 40% split after 20% IRR Substantial Advantages of this Structure Match funding, no dilution, favorable promote structure ▪ On March 7, 2016, JCAP, through its operating company, entered into a limited liability company agreement to form a real esta te venture (“JV”) partnership with an investment vehicle of Heitman Capital Management for an initial total commitment by the parties of up to $12 2.2 million, which was later increased to $123.3 million ▪ Heitman recognizes JCAP’s self - storage knowledge, experience and relationships and will rely on JCAP to source all investments, manage the relationships with developers, process and service all investments and make decisions regarding financial and tax accounting 33
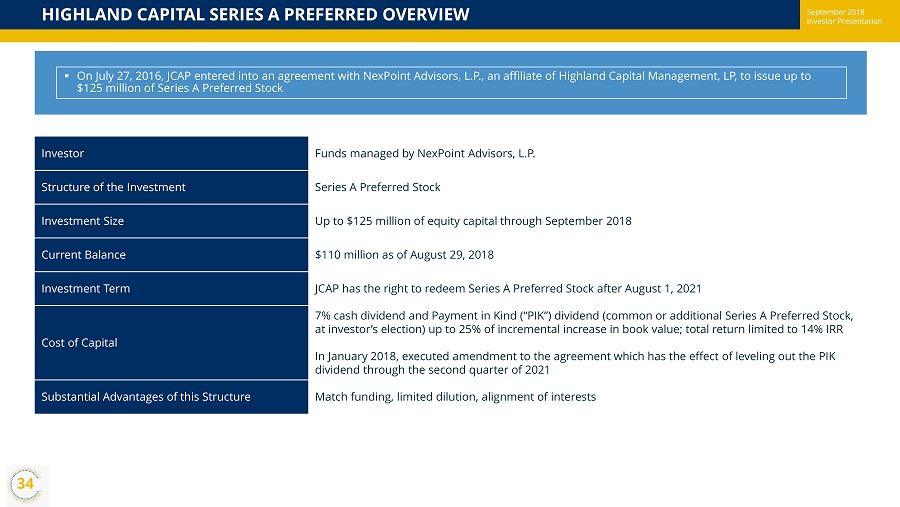
September 2018 Investor Presentation HIGHLAND CAPITAL SERIES A PREFERRED OVERVIEW September 2018 Investor Presentation Investor Funds managed by NexPoint Advisors, L.P. Structure of the Investment Series A Preferred Stock Investment Size Up to $125 million of equity capital through September 2018 Current Balance $110 million as of August 29, 2018 Investment Term JCAP has the right to redeem Series A Preferred Stock after August 1, 2021 Cost of Capital 7% cash dividend and Payment in Kind (“PIK”) dividend (common or additional Series A P referred Stock, at investor’s election) up to 25% of incremental increase in book value; total return limited to 14% IRR In January 2018, executed amendment to the agreement which has the effect of leveling out the PIK dividend through the second quarter of 2021 Substantial Advantages of this Structure Match funding, limited dilution, alignment of interests ▪ On July 27, 2016, JCAP entered into an agreement with NexPoint Advisors, L.P., an affiliate of Highland Capital Management, L P, to issue up to $125 million of Series A Preferred Stock 34
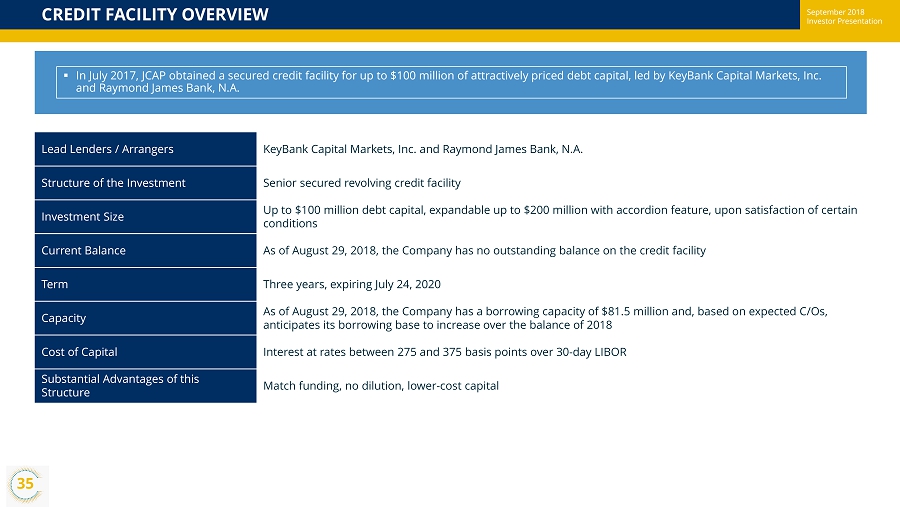
September 2018 Investor Presentation CREDIT FACILITY OVERVIEW September 2018 Investor Presentation Lead Lenders / Arrangers KeyBank Capital Markets, Inc. and Raymond James Bank, N.A. Structure of the Investment Senior secured revolving credit facility Investment Size Up to $100 million debt capital, e xpandable up to $200 million with accordion feature, upon satisfaction of certain conditions Current Balance As of August 29, 2018, the Company has no outstanding balance on the credit facility Term Three years, expiring July 24, 2020 Capacity As of August 29, 2018, the Company has a borrowing capacity of $81.5 million and, based on expected C/Os, anticipates its borrowing base to increase over the balance of 2018 Cost of Capital Interest at rates between 275 and 375 basis points over 30 - day LIBOR Substantial Advantages of this Structure Match funding, no dilution, lower - cost capital ▪ In July 2017, JCAP obtained a secured credit facility for up to $100 million of attractively priced debt capital, led by KeyB ank Capital Markets, Inc. and Raymond James Bank, N.A. 35

September 2018 Investor Presentation TERM LOANS OVERVIEW September 2018 Investor Presentation Lender FirstBank Structure of the Investment Secured by first mortgages on three of JCAP’s wholly - owned self - storage facilities Investment Size $24.9 million Term Three years, expiring August 1, 2021 Cost of Capital Interest at floating variable rate of one - month LIBOR plus 225 basis points, which resets monthly Substantial Advantages of this Structure Match funding, no dilution, lower - cost capital ▪ On August 17, 2018, certain wholly - owned subsidiaries of JCAP entered into loan agreements with FirstBank providing three term loans in the aggregate principal amount of $24.9 million. These term loans are secured by first mortgages on three of the Company’s wholly - ow ned self - storage facilities 36
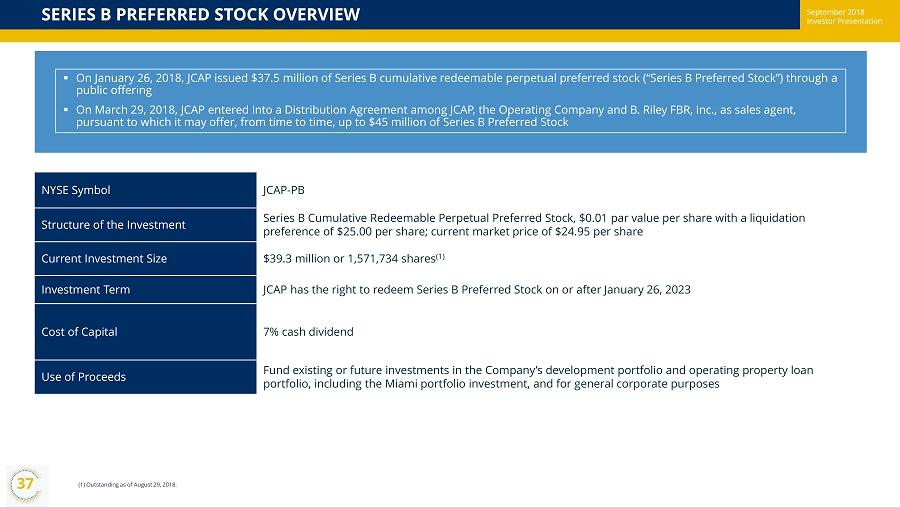
September 2018 Investor Presentation SERIES B PREFERRED STOCK OVERVIEW September 2018 Investor Presentation NYSE Symbol JCAP - PB Structure of the Investment Series B Cumulative Redeemable Perpetual Preferred Stock, $0.01 par value per share with a liquidation preference of $25.00 per share; current market price of $24.95 per share Current Investment Size $ 39.3 million or 1,571,734 shares (1) Investment Term JCAP has the right to redeem Series B Preferred Stock on or after January 26, 2023 Cost of Capital 7% cash dividend Use of Proceeds Fund existing or future investments in the Company’s development portfolio and operating property loan portfolio, including the Miami portfolio investment, and for general corporate purposes (1) Outstanding as of August 29, 2018. ▪ On January 26, 2018, JCAP issued $37.5 million of Series B cumulative redeemable perpetual preferred stock (“Series B Preferr ed Stock”) through a public offering ▪ On March 29, 2018, JCAP entered into a Distribution Agreement among JCAP, the Operating Company and B. Riley FBR, Inc., as sa les agent, pursuant to which it may offer, from time to time, up to $45 million of Series B Preferred Stock 37
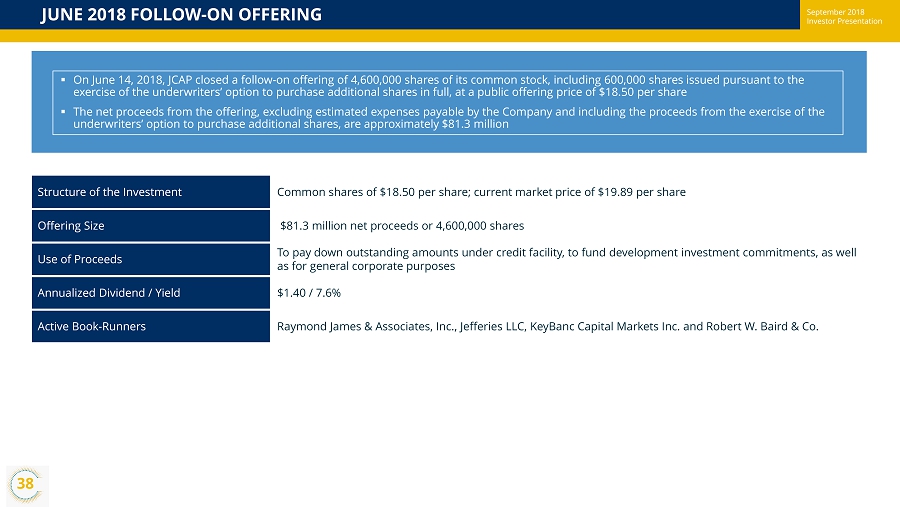
September 2018 Investor Presentation JUNE 2018 FOLLOW - ON OFFERING September 2018 Investor Presentation Structure of the Investment Common shares of $18.50 per share; current market price of $19.89 per share Offering Size $81.3 million ne t proceeds or 4,600,000 shares Use of Proceeds To pay down outstanding amounts under credit facility, to fund development investment commitments, as well as for general corporate purposes Annualized Dividend / Yield $1.40 / 7.6% Active Book - Runners Raymond James & Associates, Inc., Jefferies LLC, KeyBanc Capital Markets Inc. and Robert W. Baird & Co. ▪ On June 14, 2018, JCAP closed a follow - on offering of 4,600,000 shares of its common stock, including 600,000 shares issued purs uant to the exercise of the underwriters’ option to purchase additional shares in full, at a public offering price of $18.50 per share ▪ The net proceeds from the offering, excluding estimated expenses payable by the Company and including the proceeds from the e xer cise of the underwriters’ option to purchase additional shares, are approximately $81.3 million 38