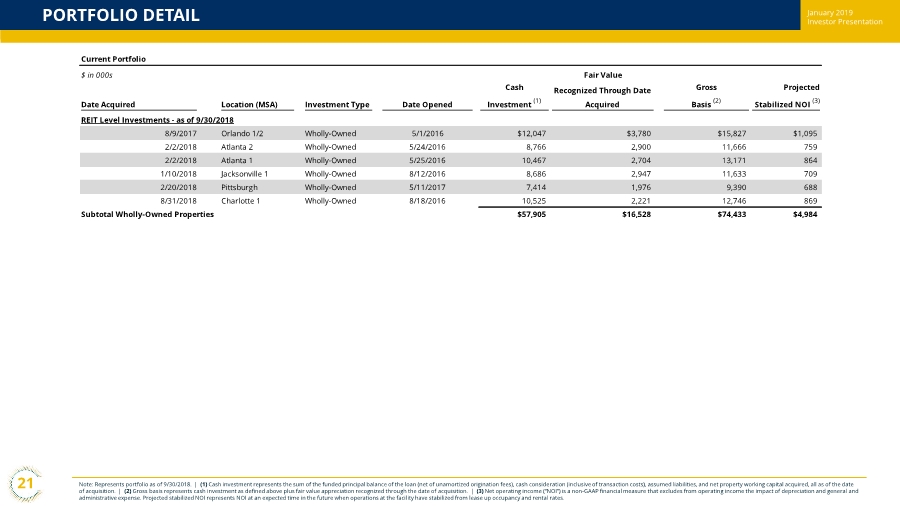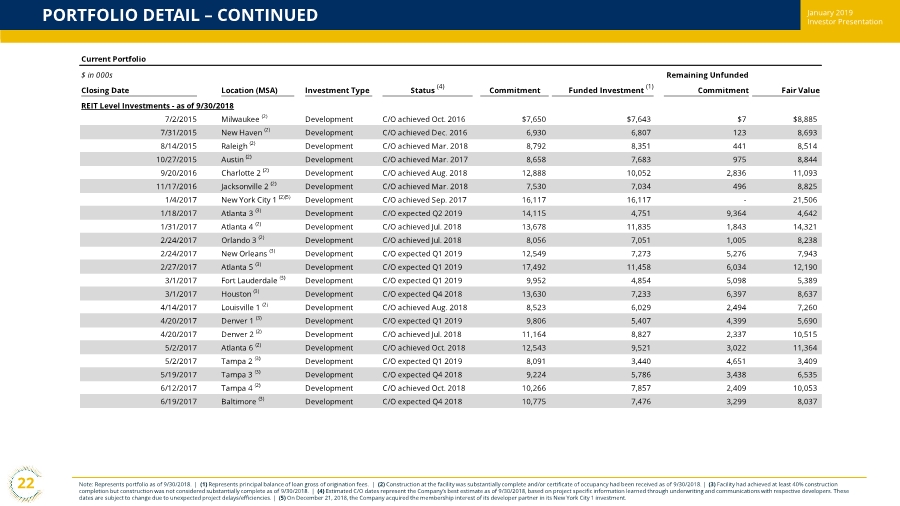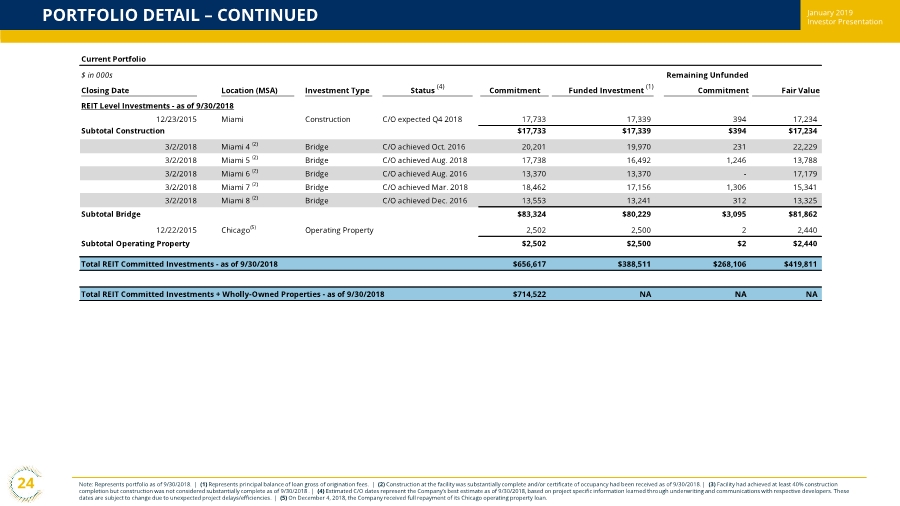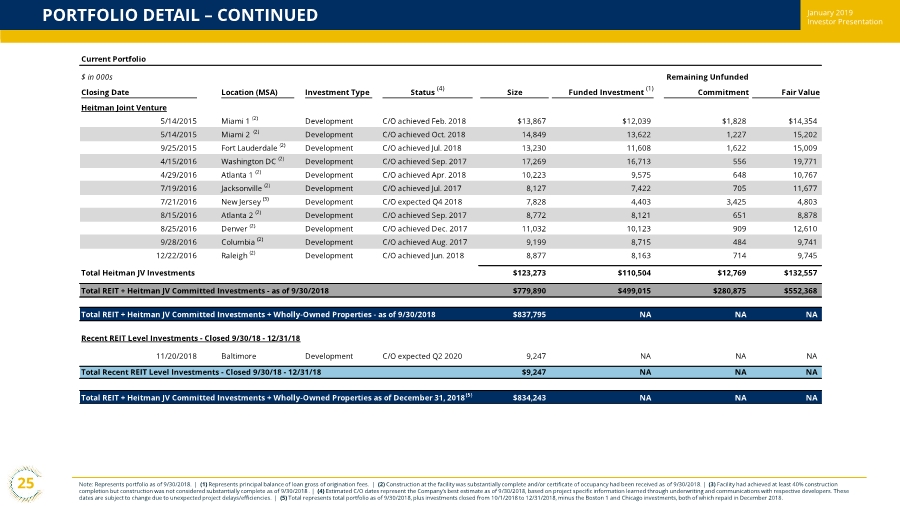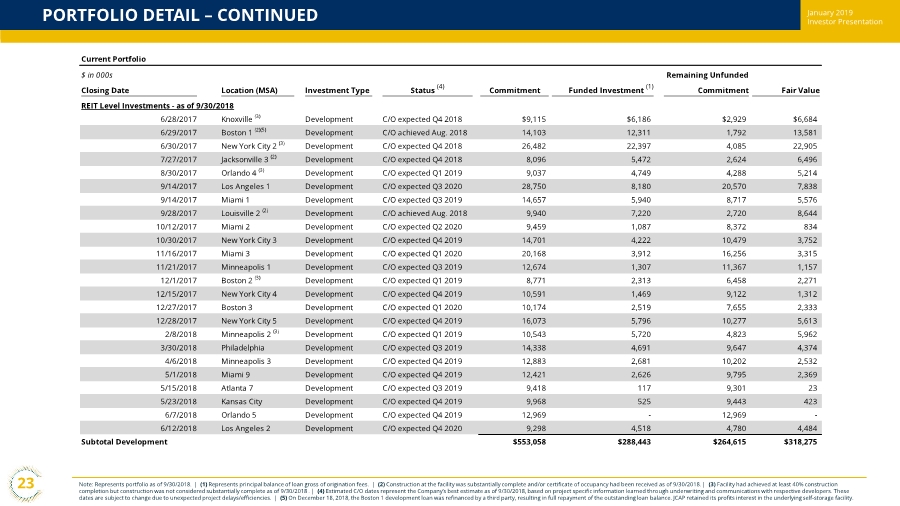
| November 2018 Investor PresentationPORTFOLIO DETAIL – CONTINUED 23 Note: Represents portfolio as of 9/30/2018. | (1) Represents principal balance of loan gross of origination fees. | (2) Construction at the facility was substantially complete and/or certificate of occupancy had been received as of 9/30/2018. | (3) Facility had achieved at least 40% construction completion but construction was not considered substantially complete as of 9/30/2018 . | (4) Estimated C/O dates represent the Company’s best estimate as of 9/30/2018, based on project specific information learned through underwriting and communications with respective developers. These dates are subject to change due to unexpected project delays/efficiencies. | (5) On December 18, 2018, the Boston 1 development loan was refinanced by a third party, resulting in full repayment of the outstanding loan balance. JCAP retained its profits interest in the underlying self-storage facility. January 2019 Investor Presentation Current Portfolio $ in 000s Remaining Unfunded Closing Date Location (MSA) Investment Type Status (4) Commitment Funded Investment (1) Commitment Fair Value REIT Level Investments - as of 9/30/2018 6/28/2017 Knoxville (3) Development C/O expected Q4 2018 $9,115 $6,186 $2,929 $6,684 6/29/2017 Boston 1 (2)(5) Development C/O achieved Aug. 2018 14,103 12,311 1,792 13,581 6/30/2017 New York City 2 (3) Development C/O expected Q4 2018 26,482 22,397 4,085 22,905 7/27/2017 Jacksonville 3 (2) Development C/O expected Q4 2018 8,096 5,472 2,624 6,496 8/30/2017 Orlando 4 (3) Development C/O expected Q1 2019 9,037 4,749 4,288 5,214 9/14/2017 Los Angeles 1 Development C/O expected Q3 2020 28,750 8,180 20,570 7,838 9/14/2017 Miami 1 Development C/O expected Q3 2019 14,657 5,940 8,717 5,576 9/28/2017 Louisville 2 (2) Development C/O achieved Aug. 2018 9,940 7,220 2,720 8,644 10/12/2017 Miami 2 Development C/O expected Q2 2020 9,459 1,087 8,372 834 10/30/2017 New York City 3 Development C/O expected Q4 2019 14,701 4,222 10,479 3,752 11/16/2017 Miami 3 Development C/O expected Q1 2020 20,168 3,912 16,256 3,315 11/21/2017 Minneapolis 1 Development C/O expected Q3 2019 12,674 1,307 11,367 1,157 12/1/2017 Boston 2 (3) Development C/O expected Q1 2019 8,771 2,313 6,458 2,271 12/15/2017 New York City 4 Development C/O expected Q4 2019 10,591 1,469 9,122 1,312 12/27/2017 Boston 3 Development C/O expected Q1 2020 10,174 2,519 7,655 2,333 12/28/2017 New York City 5 Development C/O expected Q4 2019 16,073 5,796 10,277 5,613 2/8/2018 Minneapolis 2 (3) Development C/O expected Q1 2019 10,543 5,720 4,823 5,962 3/30/2018 Philadelphia Development C/O expected Q3 2019 14,338 4,691 9,647 4,374 4/6/2018 Minneapolis 3 Development C/O expected Q4 2019 12,883 2,681 10,202 2,532 5/1/2018 Miami 9 Development C/O expected Q4 2019 12,421 2,626 9,795 2,369 5/15/2018 Atlanta 7 Development C/O expected Q3 2019 9,418 117 9,301 23 5/23/2018 Kansas City Development C/O expected Q4 2019 9,968 525 9,443 423 6/7/2018 Orlando 5 Development C/O expected Q4 2019 12,969 - 12,969 - 6/12/2018 Los Angeles 2 Development C/O expected Q4 2020 9,298 4,518 4,780 4,484 Subtotal Development $553,058 $288,443 $264,615 $318,275 |