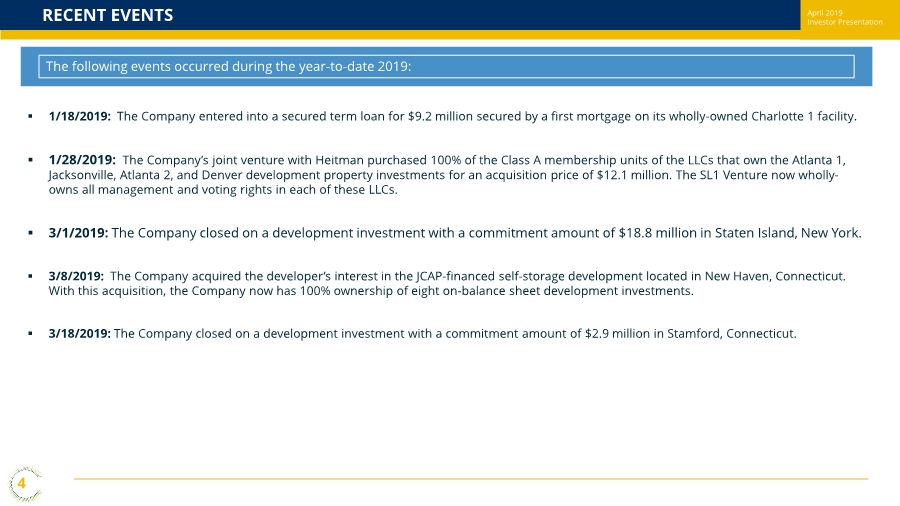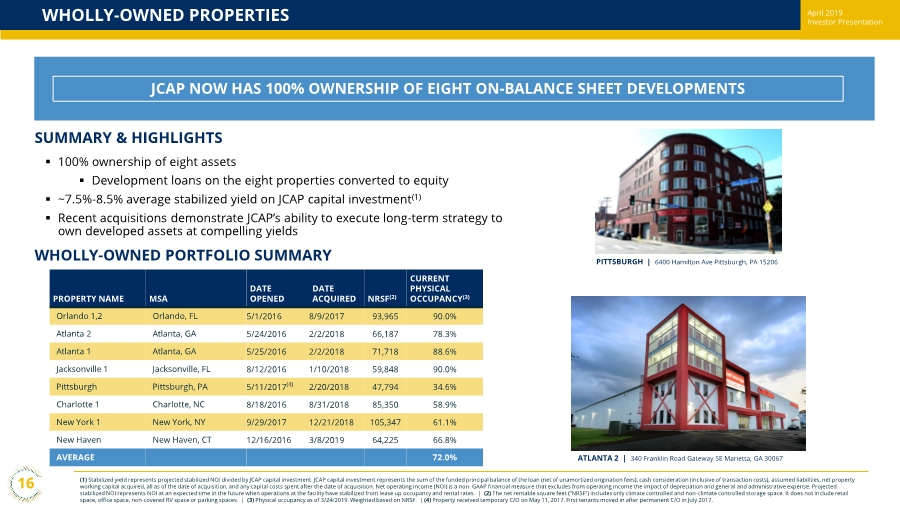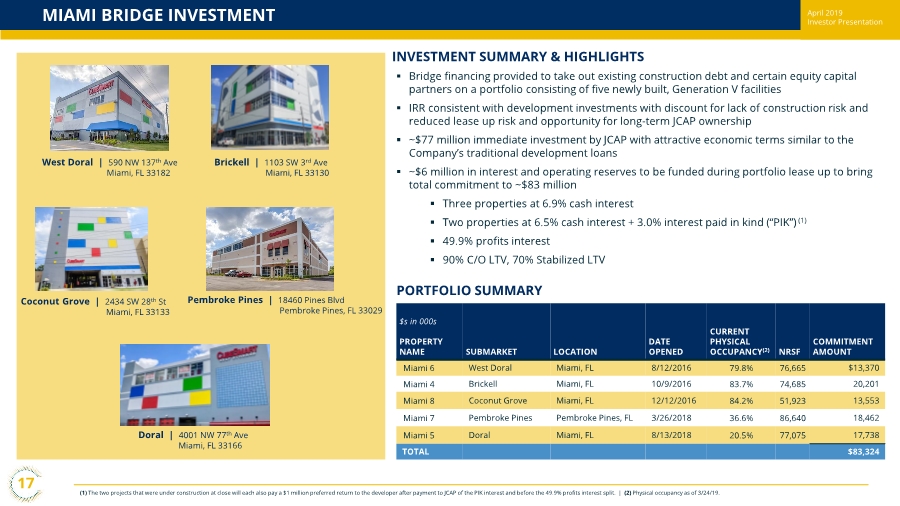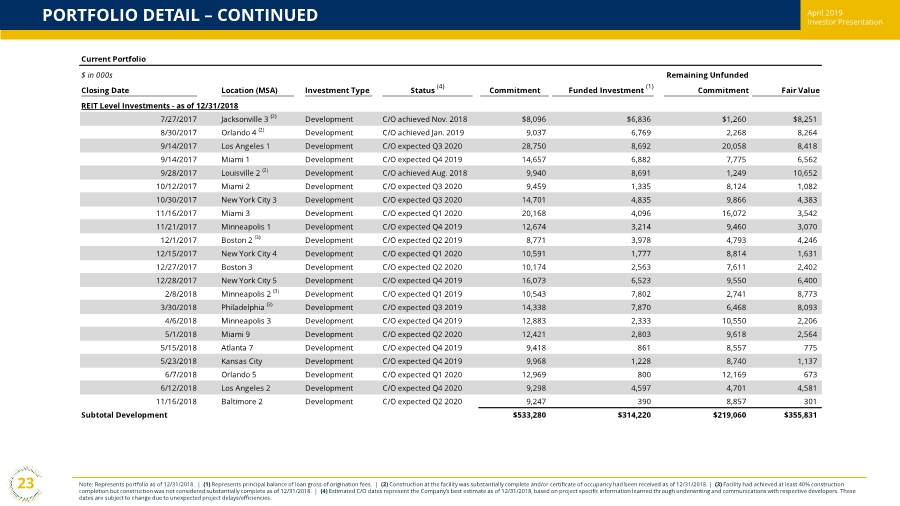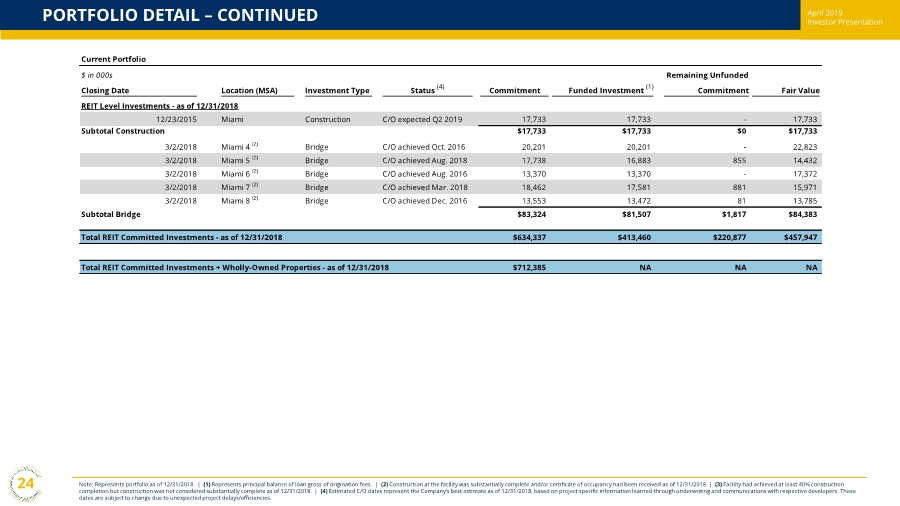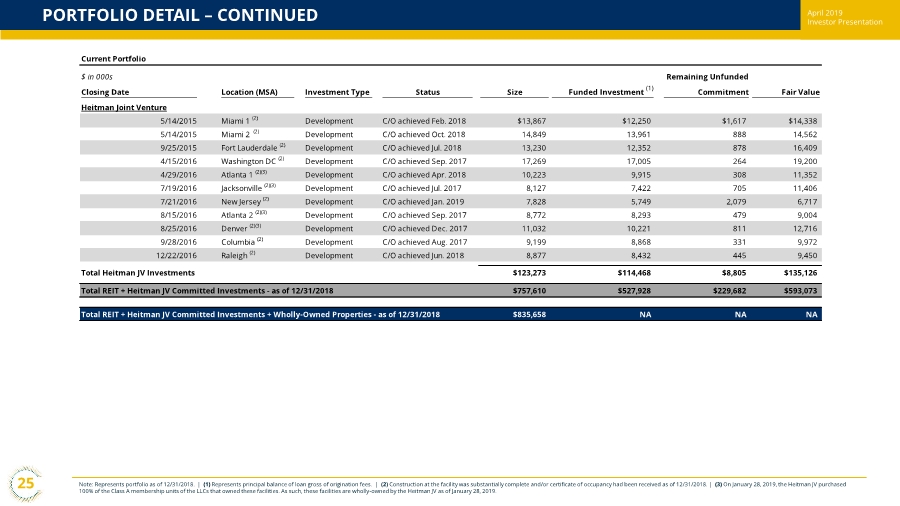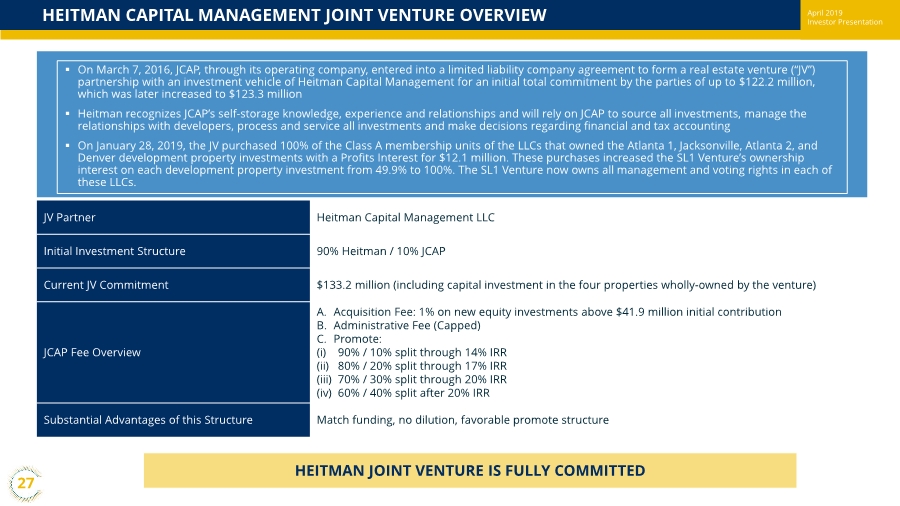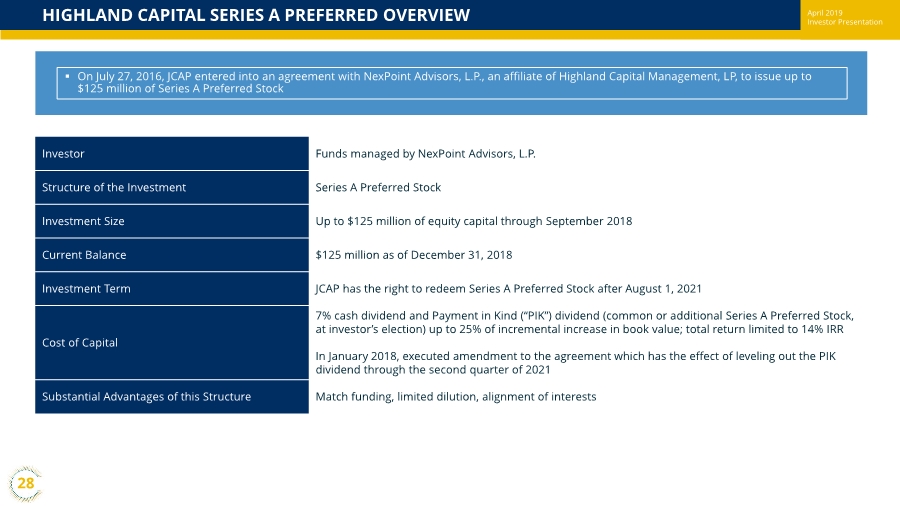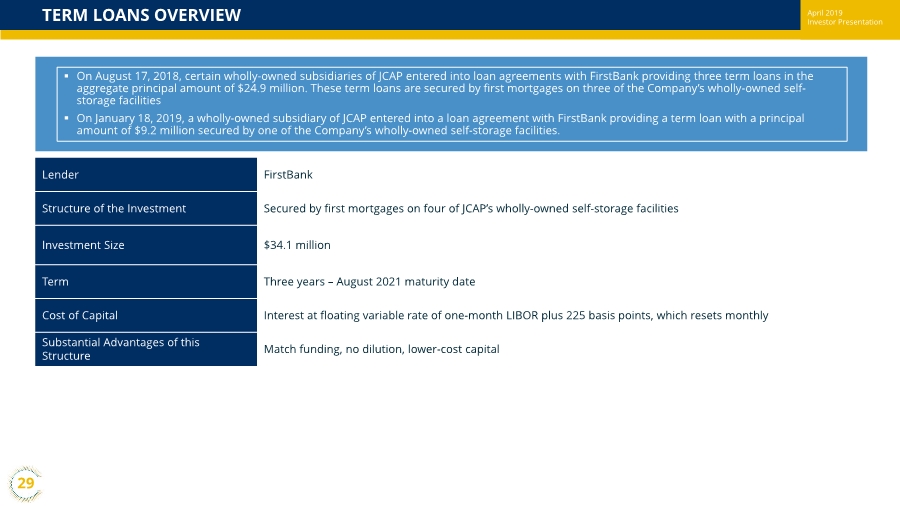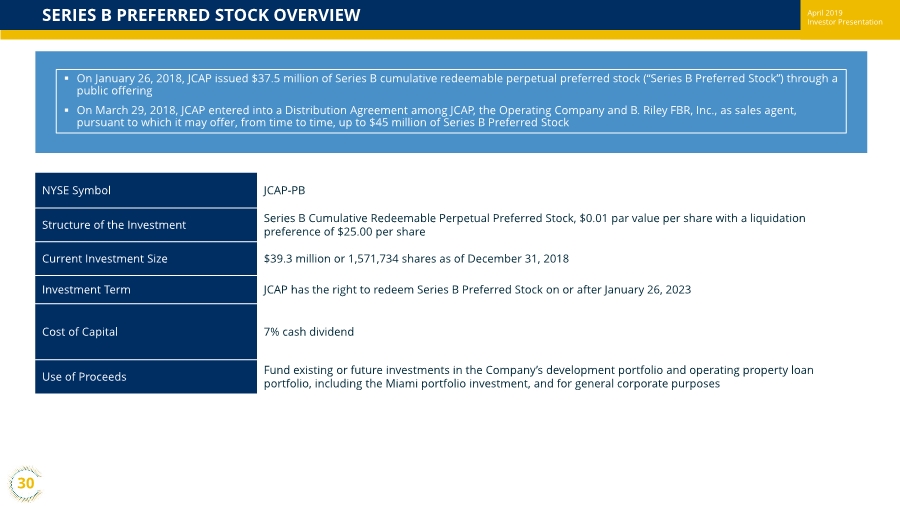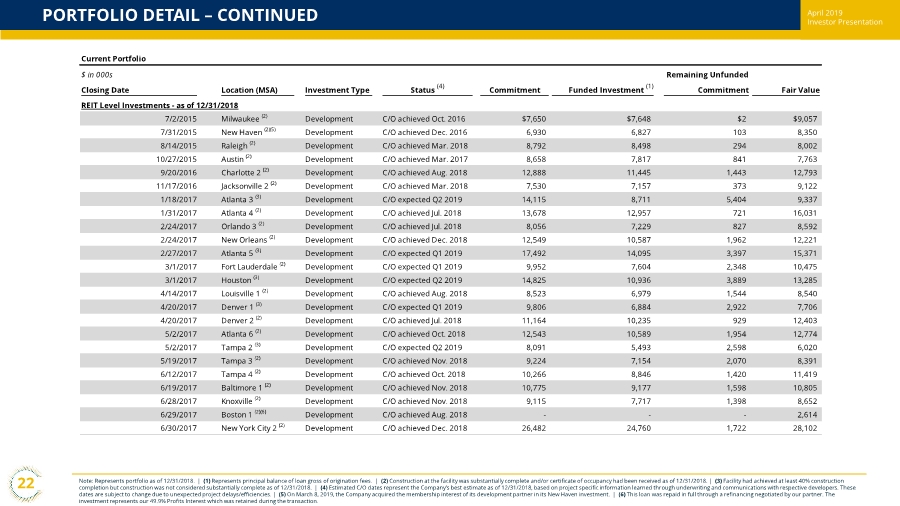
| April 2019 Investor PresentationPORTFOLIO DETAIL – CONTINUED 22 Note: Represents portfolio as of 12/31/2018. | (1) Represents principal balance of loan gross of origination fees. | (2) Construction at the facility was substantially complete and/or certificate of occupancy had been received as of 12/31/2018. | (3) Facility had achieved at least 40% construction completion but construction was not considered substantially complete as of 12/31/2018. | (4) Estimated C/O dates represent the Company’s best estimate as of 12/31/2018, based on project specific information learned through underwriting and communications with respective developers. These dates are subject to change due to unexpected project delays/efficiencies. | (5) On March 8, 2019, the Company acquired the membership interest of its development partner in its New Haven investment. | (6) This loan was repaid in full through a refinancing negotiated by our partner. The investment represents our 49.9% Profits Interest which was retained during the transaction. Current Portfolio $ in 000s Remaining Unfunded Closing Date Location (MSA) Investment Type Status (4) Commitment Funded Investment (1) Commitment Fair Value REIT Level Investments - as of 12/31/2018 7/2/2015 Milwaukee (2) Development C/O achieved Oct. 2016 $7,650 $7,648 $2 $9,057 7/31/2015 New Haven (2)(5) Development C/O achieved Dec. 2016 6,930 6,827 103 8,350 8/14/2015 Raleigh (2) Development C/O achieved Mar. 2018 8,792 8,498 294 8,002 10/27/2015 Austin (2) Development C/O achieved Mar. 2017 8,658 7,817 841 7,763 9/20/2016 Charlotte 2 (2) Development C/O achieved Aug. 2018 12,888 11,445 1,443 12,793 11/17/2016 Jacksonville 2 (2) Development C/O achieved Mar. 2018 7,530 7,157 373 9,122 1/18/2017 Atlanta 3 (3) Development C/O expected Q2 2019 14,115 8,711 5,404 9,337 1/31/2017 Atlanta 4 (2) Development C/O achieved Jul. 2018 13,678 12,957 721 16,031 2/24/2017 Orlando 3 (2) Development C/O achieved Jul. 2018 8,056 7,229 827 8,592 2/24/2017 New Orleans (2) Development C/O achieved Dec. 2018 12,549 10,587 1,962 12,221 2/27/2017 Atlanta 5 (3) Development C/O expected Q1 2019 17,492 14,095 3,397 15,371 3/1/2017 Fort Lauderdale (2) Development C/O expected Q1 2019 9,952 7,604 2,348 10,475 3/1/2017 Houston (3) Development C/O expected Q2 2019 14,825 10,936 3,889 13,285 4/14/2017 Louisville 1 (2) Development C/O achieved Aug. 2018 8,523 6,979 1,544 8,540 4/20/2017 Denver 1 (3) Development C/O expected Q1 2019 9,806 6,884 2,922 7,706 4/20/2017 Denver 2 (2) Development C/O achieved Jul. 2018 11,164 10,235 929 12,403 5/2/2017 Atlanta 6 (2) Development C/O achieved Oct. 2018 12,543 10,589 1,954 12,774 5/2/2017 Tampa 2 (3) Development C/O expected Q2 2019 8,091 5,493 2,598 6,020 5/19/2017 Tampa 3 (2) Development C/O achieved Nov. 2018 9,224 7,154 2,070 8,391 6/12/2017 Tampa 4 (2) Development C/O achieved Oct. 2018 10,266 8,846 1,420 11,419 6/19/2017 Baltimore 1 (2) Development C/O achieved Nov. 2018 10,775 9,177 1,598 10,805 6/28/2017 Knoxville (2) Development C/O achieved Nov. 2018 9,115 7,717 1,398 8,652 6/29/2017 Boston 1 (2)(6) Development C/O achieved Aug. 2018 --- 2,614 6/30/2017 New York City 2 (2) Development C/O achieved Dec. 2018 26,482 24,760 1,722 28,102 |
