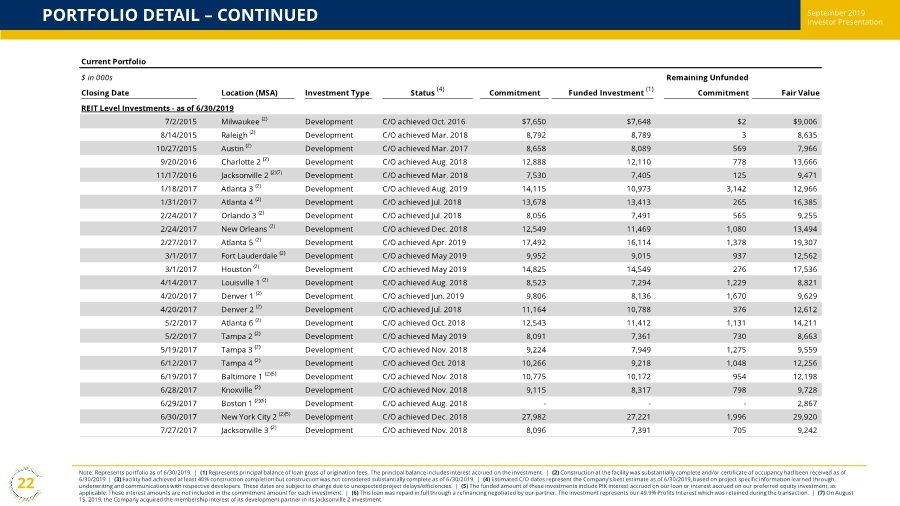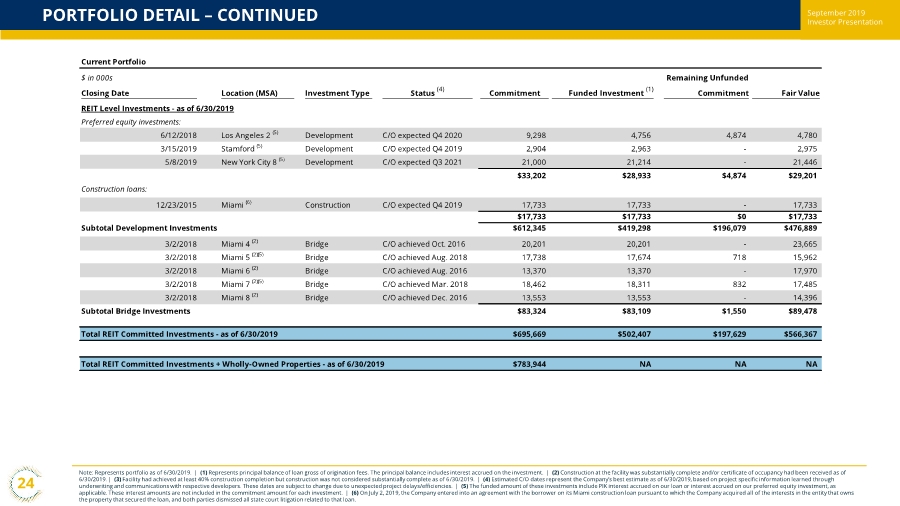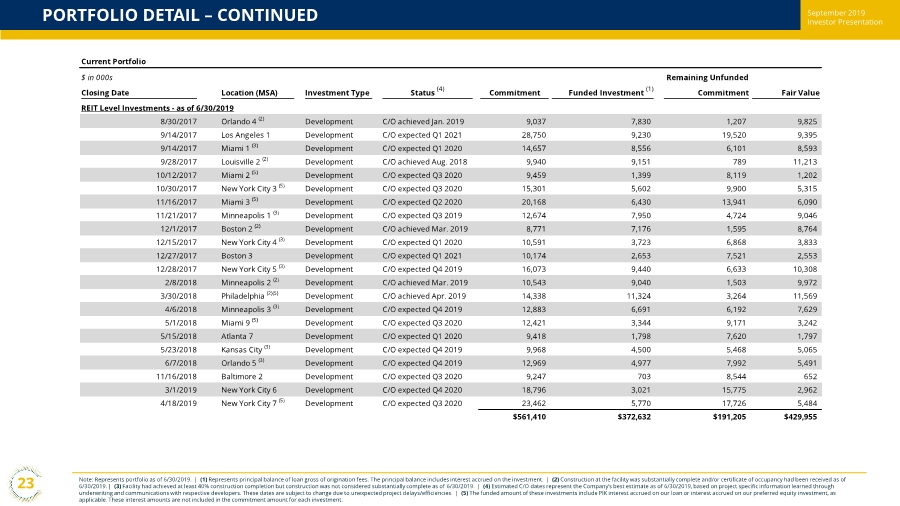
| September 2019 Investor Presentation PORTFOLIO DETAIL – CONTINUED 23 Note: Represents portfolio as of 6/30/2019. | (1) Represents principal balance of loan gross of origination fees. The principal balance includes interest accrued on the investment. | (2) Construction at the facility was substantially complete and/or certificate of occupancy had been received as of 6/30/2019. | (3) Facility had achieved at least 40% construction completion but construction was not considered substantially complete as of 6/30/2019. | (4) Estimated C/O dates represent the Company’s best estimate as of 6/30/2019, based on project specific information learned through underwriting and communications with respective developers. These dates are subject to change due to unexpected project delays/efficiencies. | (5) The funded amount of these investments include PIK interest accrued on our loan or interest accrued on our preferred equity investment, as applicable. These interest amounts are not included in the commitment amount for each investment. Current Portfolio $ in 000s Remaining Unfunded Closing Date Location (MSA) Investment Type Status (4) Commitment Funded Investment (1) Commitment Fair Value REIT Level Investments - as of 6/30/2019 8/30/2017 Orlando 4 (2) Development C/O achieved Jan. 2019 9,037 7,830 1,207 9,825 9/14/2017 Los Angeles 1 Development C/O expected Q1 2021 28,750 9,230 19,520 9,395 9/14/2017 Miami 1 (3) Development C/O expected Q1 2020 14,657 8,556 6,101 8,593 9/28/2017 Louisville 2 (2) Development C/O achieved Aug. 2018 9,940 9,151 789 11,213 10/12/2017 Miami 2 (5) Development C/O expected Q3 2020 9,459 1,399 8,119 1,202 10/30/2017 New York City 3 (5) Development C/O expected Q3 2020 15,301 5,602 9,900 5,315 11/16/2017 Miami 3 (5) Development C/O expected Q2 2020 20,168 6,430 13,941 6,090 11/21/2017 Minneapolis 1 (3) Development C/O expected Q3 2019 12,674 7,950 4,724 9,046 12/1/2017 Boston 2 (2) Development C/O achieved Mar. 2019 8,771 7,176 1,595 8,764 12/15/2017 New York City 4 (3) Development C/O expected Q1 2020 10,591 3,723 6,868 3,833 12/27/2017 Boston 3 Development C/O expected Q1 2021 10,174 2,653 7,521 2,553 12/28/2017 New York City 5 (3) Development C/O expected Q4 2019 16,073 9,440 6,633 10,308 2/8/2018 Minneapolis 2 (2) Development C/O achieved Mar. 2019 10,543 9,040 1,503 9,972 3/30/2018 Philadelphia (2)(5) Development C/O achieved Apr. 2019 14,338 11,324 3,264 11,569 4/6/2018 Minneapolis 3 (3) Development C/O expected Q4 2019 12,883 6,691 6,192 7,629 5/1/2018 Miami 9 (5) Development C/O expected Q3 2020 12,421 3,344 9,171 3,242 5/15/2018 Atlanta 7 Development C/O expected Q1 2020 9,418 1,798 7,620 1,797 5/23/2018 Kansas City (3) Development C/O expected Q4 2019 9,968 4,500 5,468 5,065 6/7/2018 Orlando 5 (3) Development C/O expected Q4 2019 12,969 4,977 7,992 5,491 11/16/2018 Baltimore 2 Development C/O expected Q3 2020 9,247 703 8,544 652 3/1/2019 New York City 6 Development C/O expected Q4 2020 18,796 3,021 15,775 2,962 4/18/2019 New York City 7 (5) Development C/O expected Q3 2020 23,462 5,770 17,726 5,484 $561,410 $372,632 $191,205 $429,955 |