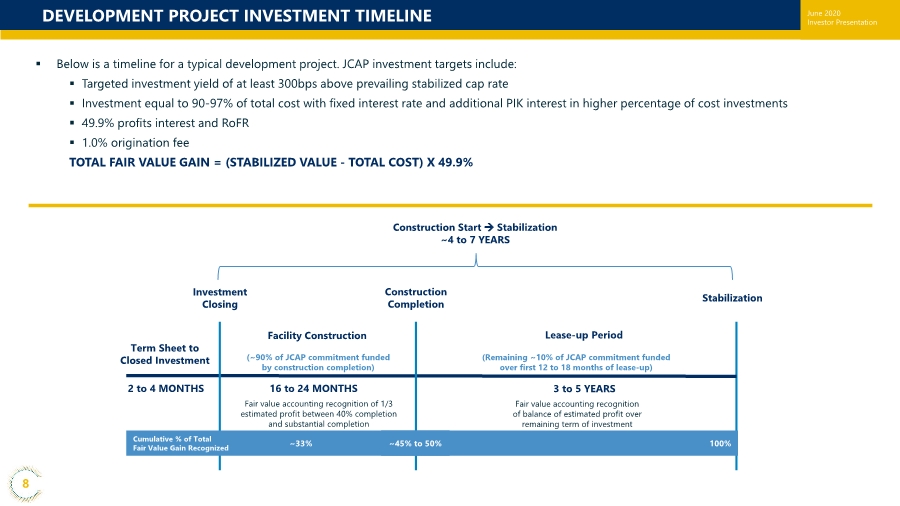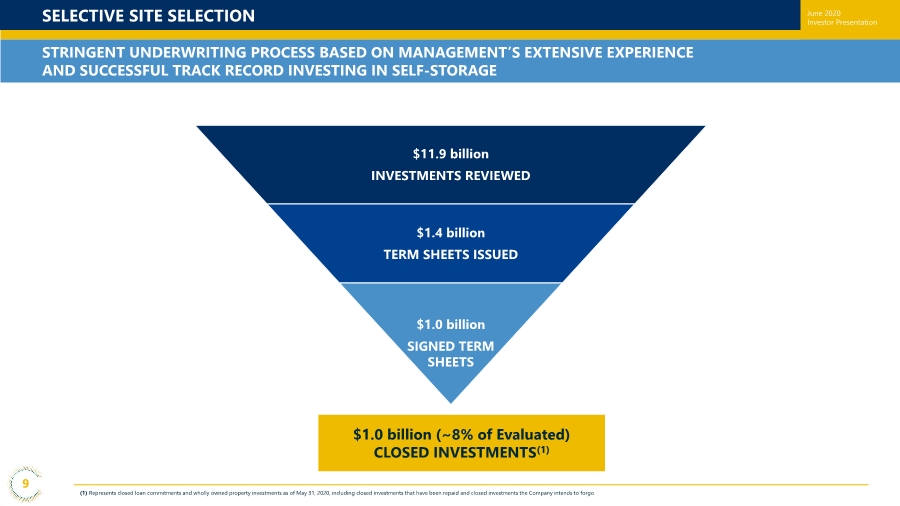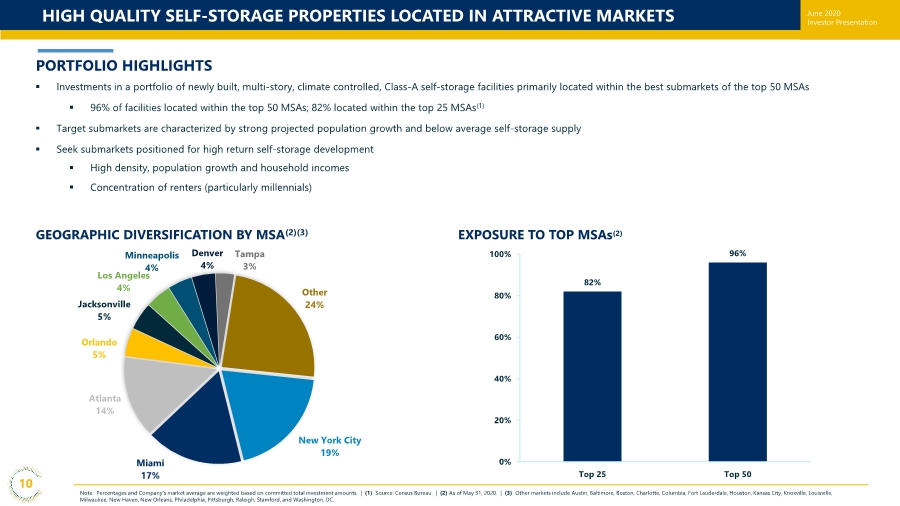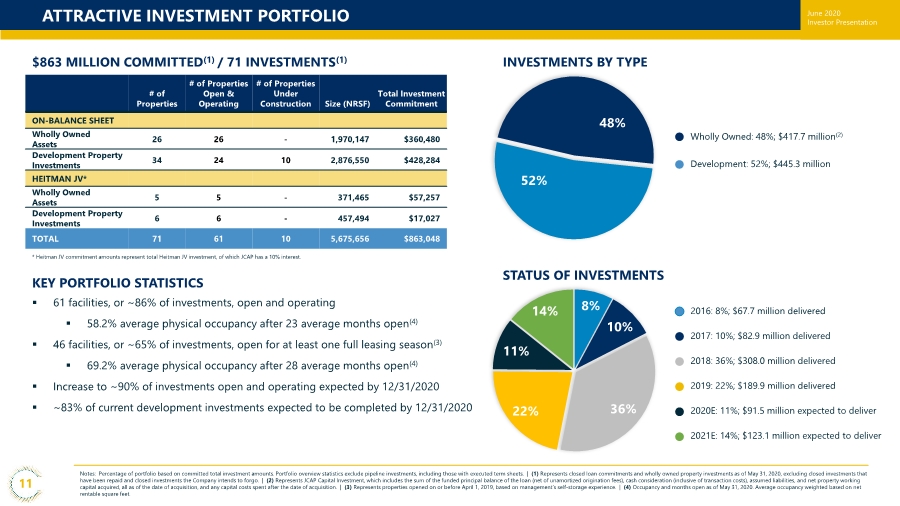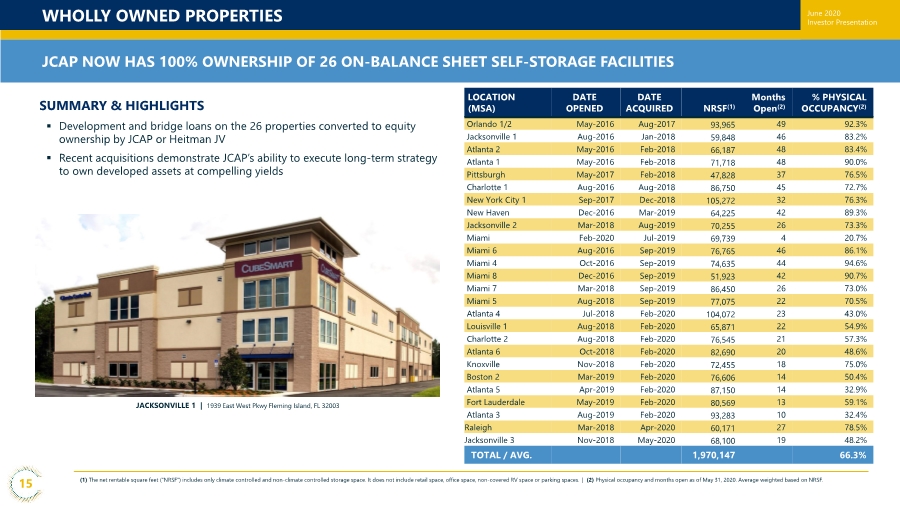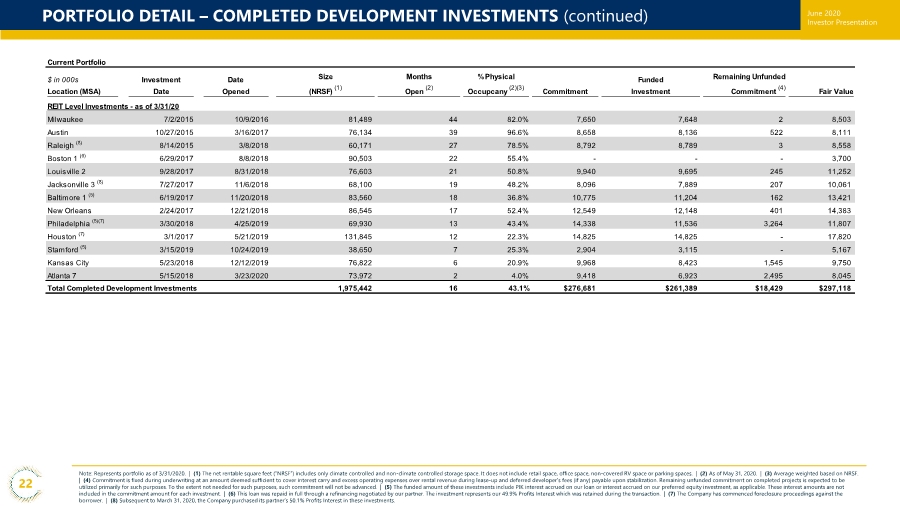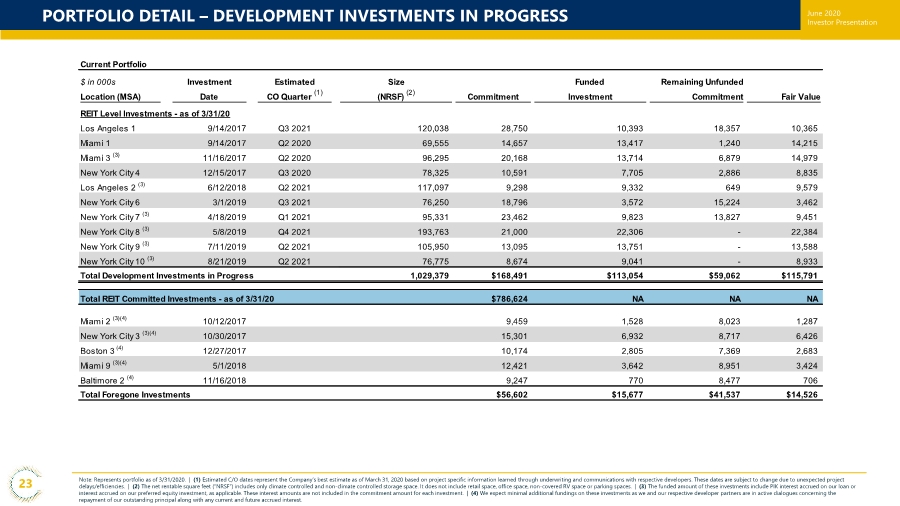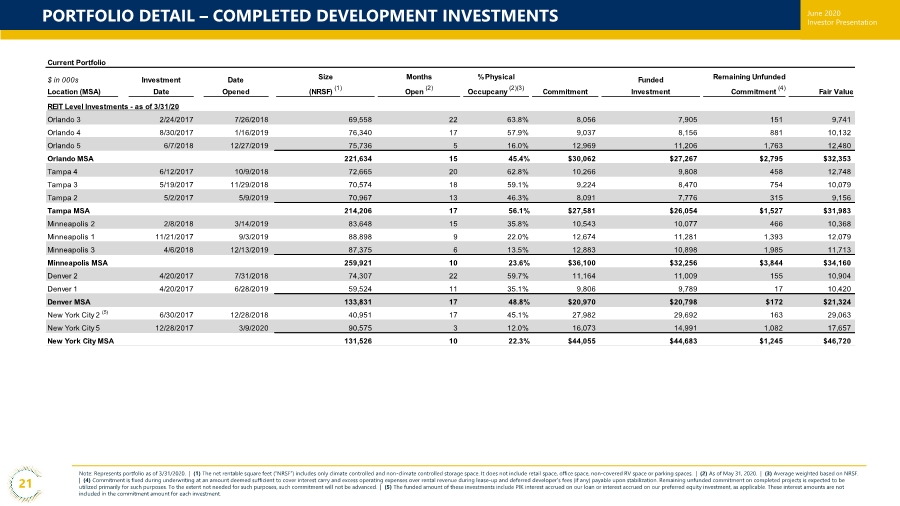
| June 2020 Investor Presentation PORTFOLIO DETAIL – COMPLETED DEVELOPMENT INVESTMENTS 21 Note: Represents portfolio as of 3/31/2020. | (1) The net rentable square feet (“NRSF”) includes only climate controlled and non-climate controlled storage space. It does not include retail space, office space, non-covered RV space or parking spaces. | (2) As of May 31, 2020. | (3) Average weighted based on NRSF. | (4) Commitment is fixed during underwriting at an amount deemed sufficient to cover interest carry and excess operating expenses over rental revenue during lease-up and deferred developer’s fees (if any) payable upon stabilization. Remaining unfunded commitment on completed projects is expected to be utilized primarily for such purposes. To the extent not needed for such purposes, such commitment will not be advanced. | (5) The funded amount of these investments include PIK interest accrued on our loan or interest accrued on our preferred equity investment, as applicable. These interest amounts are not included in the commitment amount for each investment. Current Portfolio $ in 000s Location (MSA) Investment Date Date Opened Size (NRSF) (1) Months Open (2) % Physical Occupcany (2)(3) Commitment Funded Investment Remaining Unfunded Commitment (4) Fair Value REIT Level Investments - as of 3/31/20 Orlando 3 2/24/2017 7/26/2018 69,558 22 63.8% 8,056 7,905 151 9,741 Orlando 4 8/30/2017 1/16/2019 76,340 17 57.9% 9,037 8,156 881 10,132 Orlando 5 6/7/2018 12/27/2019 75,736 5 16.0% 12,969 11,206 1,763 12,480 Orlando MSA 221,634 15 45.4% $30,062 $27,267 $2,795 $32,353 Tampa 4 6/12/2017 10/9/2018 72,665 20 62.8% 10,266 9,808 458 12,748 Tampa 3 5/19/2017 11/29/2018 70,574 18 59.1% 9,224 8,470 754 10,079 Tampa 2 5/2/2017 5/9/2019 70,967 13 46.3% 8,091 7,776 315 9,156 Tampa MSA 214,206 17 56.1% $27,581 $26,054 $1,527 $31,983 Minneapolis 2 2/8/2018 3/14/2019 83,648 15 35.8% 10,543 10,077 466 10,368 Minneapolis 1 11/21/2017 9/3/2019 88,898 9 22.0% 12,674 11,281 1,393 12,079 Minneapolis 3 4/6/2018 12/13/2019 87,375 6 13.5% 12,883 10,898 1,985 11,713 Minneapolis MSA 259,921 10 23.6% $36,100 $32,256 $3,844 $34,160 Denver 2 4/20/2017 7/31/2018 74,307 22 59.7% 11,164 11,009 155 10,904 Denver 1 4/20/2017 6/28/2019 59,524 11 35.1% 9,806 9,789 17 10,420 Denver MSA 133,831 17 48.8% $20,970 $20,798 $172 $21,324 New York City 2 (5) 6/30/2017 12/28/2018 40,951 17 45.1% 27,982 29,692 163 29,063 New York City 5 12/28/2017 3/9/2020 90,575 3 12.0% 16,073 14,991 1,082 17,657 New York City MSA 131,526 10 22.3% $44,055 $44,683 $1,245 $46,720 |

