Exhibit 99.2
Table of Contents
| |
Legal Notices | |
| |
Earnings Release | 4 |
| |
Financial Highlights – Trailing Five Quarters | 9 |
| |
Consolidated Balance Sheets – Trailing Five Quarters | 10 |
| |
Consolidated Statements of Operations | 11 |
| |
Calculation of Adjusted Earnings and Reconciliation to Net Income Attributable to Common Stockholders – Trailing Five Quarters | 12 |
| |
Schedules of Development Projects | 13 |
| |
Closed Investments by Geography | 16 |
| |
Investment Pipeline by Geography | 17 |
| |
Company Information | 18 |
Third Quarter 2017  2
2
Forward Looking Statements
This Supplemental Information package contains forward-looking statements within the meaning of the Private Securities Litigation Reform Act of 1995 (set forth in Section 27A of the Securities Act of 1933, as amended (the “Securities Act”) and Section 21E of the Securities Exchange Act of 1934, as amended (the “Exchange Act”)). These forward-looking statements include, without limitation, statements about our estimates, expectations, predictions and forecasts of our future business plans and financial and operating performance and/or results, including our fourth quarter 2017 earnings guidance, updated full-year 2017 earnings guidance and preliminary 2018 earnings guidance, as well as statements of management’s goals and objectives and other similar expressions concerning matters that are not historical facts. When we use the words “may,” “should,” “could,” “would,” “predicts,” “potential,” “continue,” “expects,” “anticipates,” “future,” “intends,” “plans,” “believes,” “estimates” or similar expressions or their negatives, as well as statements in future tense, we intend to identify forward-looking statements. Although we believe that the expectations reflected in such forward-looking statements are based upon reasonable assumptions, beliefs and expectations, such forward-looking statements are not predictions of future events or guarantees of future performance and our actual financial and operating results could differ materially from those set forth in the forward-looking statements. Some factors that might cause such differences are described in the section entitled “Risk Factors” in our most recent Annual Report on Form 10-K and in other documents that we file from time to time with the SEC, which factors include, without limitation, the following:
| | |
| | our ability to successfully source, structure, negotiate and close investments in self-storage facilities; |
| | changes in our business strategy and the market’s acceptance of our investment terms; |
| | our ability to fund our outstanding and future investment commitments; |
| | our ability to obtain certificates of occupancy at the facilities in which we invest; |
| | the future availability for borrowings under our credit facility (including borrowing base capacity and the availability of the accordion feature); |
| | availability, terms and our rate of deployment of equity and debt capital; |
| | our manager’s ability to hire and retain qualified personnel; |
| | changes in the self-storage industry, interest rates or the general economy; |
| | the degree and nature of our competition; |
| | volatility in the value of our assets carried at fair market value; and |
| | general volatility of the capital markets and the market price of our common stock. |
Given these uncertainties, undue reliance should not be placed on our forward-looking statements. We assume no duty or responsibility to publicly update or revise any forward-looking statement that may be made to reflect future events or circumstances or to reflect the occurrence of unanticipated events. We urge you to review the disclosures concerning risks in the sections entitled “Risk Factors” and “Management’s Discussion and Analysis of Financial Condition and Results of Operations” in our most recent Annual Report on Form 10-K and in other documents that we file from time to time with the SEC.
Non-GAAP Financial Measures
Adjusted Earnings is a non-GAAP measure and is defined as net income attributable to common stockholders plus stock dividends payable to preferred stockholders, stock-based compensation expense, depreciation and amortization on real estate assets, loss on modification of debt, transaction and other expenses, restructuring costs and deferred termination fee to manager. Management uses Adjusted Earnings and Adjusted Earnings per diluted share as key performance indicators in evaluating the operations of the Company's business. The Company is a capital provider to self-storage developers and believes that these measures are useful to management and investors as a starting point in measuring its operational performance because they exclude various equity-based payments (including stock dividends) and other items included in net income that do not relate to or are not indicative of its present and future operating performance, which can make periodic and peer analyses of operating performance more difficult. The Company’s computation of Adjusted Earnings and Adjusted Earnings per share may not be comparable to other key performance indicators reported by other REITs or real estate companies. Reconciliations of Adjusted Earnings and Adjusted Earnings per share to Net income attributable to common stockholders and Earnings per share, respectively, are provided in the attached table entitled “Calculation of Adjusted Earnings.”
Third Quarter 2017 3
Press Release – November 2017
JERNIGAN CAPITAL ANNOUNCES $0.29 EARNINGS PER SHARE AND
$0.35 ADJUSTED EARNINGS PER SHARE FOR THIRD QUARTER 2017
MEMPHIS, Tennessee, November 1, 2017 / Business Wire / Jernigan Capital, Inc. (NYSE: JCAP), a leading capital partner for self-storage entrepreneurs nationwide, today announced results for the quarter ended September 30, 2017, and provided fourth quarter and updated full-year 2017 guidance along with preliminary expectations for 2018.
Highlights for the quarter include:
| | |
| ▪ | Reported earnings per share and adjusted earnings per share of $0.29 and $0.35, respectively; |
| ▪ | Closed $70.5 million of new on-balance sheet development investments through quarter end ($330.3 million year-to-date through November 1, 2017); |
| ▪ | Acquired 100% of developer’s interests in self-storage facility in Orlando MSA; |
| ▪ | Achieved certificates of occupancy for five new self-storage facilities and stabilized physical occupancy at greater than 85% at two facilities; and |
| ▪ | Obtained $100 million revolving credit facility with an accordion feature permitting expansion up to $200 million. |
“We are very pleased with our third quarter and our performance through the first nine months of the year,” Dean Jernigan, Chairman and Chief Executive Officer of Jernigan Capital, Inc. stated. “Our developers continue to find compelling self-storage sites notwithstanding fears of new supply, and our projects that have opened for business continue to track at or above our underwritten performance. In addition, we experienced several milestones this quarter: two self-storage facilities reached underwritten stabilized occupancy levels more than eighteen months ahead of schedule; we purchased our developer partner’s interests in the Ocoee, Florida facility, resulting in our outright ownership of a developed self-storage facility for the first time; four of the 11 facilities in our Heitman joint venture opened for business and have shown strong leasing trends since opening; and we completed an exhaustive study in conjunction with independent third party experts on new supply that we believe provides compelling facts that dispel the supply misperceptions that have pervaded our sector for several quarters. These milestones and strong quarterly results are the direct result of the hard work and dedication of the JCAP team and our development partners, and we are very excited about the growth of the business as we close out 2017 and look ahead to 2018.”
John Good, President and Chief Operating Officer of Jernigan Capital added, “We delivered exceptional growth this quarter, with total revenues and operating income increasing nearly 98% and 486%, respectively, over the third quarter of 2016. These results highlight the effectiveness of our business model and the scalability of our platform. We expect to exceed our initial investment closings guidance of $375 million for 2017. We are currently rolling out a new bridge loan product that we believe will drive significant incremental growth and profitability for the Company and provide us with a pipeline of additional off-market opportunities to acquire well-located latest generation self-storage facilities. This new product will leverage our expertise gained through reviewing more than $8 billion of opportunities over the past three years, our reputation as a leading capital provider to the self-storage sector and our long-standing network of contacts within the sector. From a capital perspective we now have several attractive capital sources that provide us with the flexibility we need to fund the business. As we look forward, we expect 2018 to produce continued strong asset revenue growth, modest expense growth and substantial fair value gains as 2016 and 2017 development projects are completed and enter lease-up, resulting in additional significant returns to shareholders.”
Financial Highlights
Net income attributable to common stockholders for the three months ended September 30, 2017 was $4.1 million, or $0.29 per share, and adjusted earnings were $5.0 million, or $0.35 per share. Net income attributable to common stockholders for the nine months ended September 30, 2017 was $10.4 million, or $0.94 per share, and adjusted earnings were $12.4 million, or $1.12 per share.
Total revenues for the three and nine months ended September 30, 2017 were $3.4 million and $8.3 million, respectively, representing increases of $1.7 million, or 97.9%, and $3.9 million, or 88.9%, over revenues for the comparable periods in 2016. General and administrative expenses decreased 5.3% for the three months and increased 5.7% for the nine months ended September 30, 2017, compared to general and administrative expenses in the same periods in 2016.
Third Quarter 2017 4
General and administrative expenses and stock-based compensation expense (“SBE”), for the three and nine months ended September 30, 2017 and 2016 were as follows (dollars in thousands):
| | | | | | | | | |
| | | | | | | | | |
| | Three months ended September 30, |
| | 2017 | | 2016 | | % inc (dec) |
General and administrative expenses, excluding SBE | | $ | 1,090 | | $ | 1,122 | | (2.9) | % |
Plus: SBE | | | 296 | | | 341 | | (13.2) | % |
General and administrative expenses | | $ | 1,386 | | $ | 1,463 | | (5.3) | % |
| | | | | | | | | |
| | | | | | | | | |
| | Nine months ended September 30, |
| | 2017 | | 2016 | | % inc (dec) |
General and administrative expenses, excluding SBE | | $ | 3,313 | | $ | 3,274 | | 1.2 | % |
Plus: SBE | | | 1,023 | | | 828 | | 23.6 | % |
General and administrative expenses | | $ | 4,336 | | $ | 4,102 | | 5.7 | % |
The increase in SBE for the nine months ended September 30, 2017 was primarily due to additional restricted stock grants to certain officers and employees of the Company’s external manager during the second quarter of 2017.
Net income attributable to common stockholders and adjusted earnings for the three and nine months ended September 30, 2017 also include increases in fair value of investments of $3.4 million and $9.1 million, respectively, compared to increases of $4.9 million and $14.2 million for the three and nine months ended September 30, 2016, respectively. Results reflect the impact of the limited number of on-balance sheet closings in 2016 resulting in modest fair value adjustments in 2017 on the 2016 investments.
Capital Markets Activities
On July 25, 2017, the Company entered into a $100 million senior secured revolving credit facility, which has an accordion feature permitting expansion up to $200 million, subject to syndication. The current borrowing capacity under the credit facility is $33.3 million; however, the Company’s development property investments are eligible to be added to the borrowing base once they receive certificates of occupancy. Based on the Company’s estimate of certificates of occupancy expected to be received between now and the end of 2018, the Company anticipates a borrowing base sufficient to secure the full $200 million by December 31, 2018.
On October 26, 2017, the Company issued $10.0 million of its Series A Preferred Stock.
Dividends
On August 1, 2017, the Company declared cash and stock dividends on its Series A Preferred Stock. The cash dividend of $0.2 million was paid on October 13, 2017. A stock dividend of 6,703 shares of common stock was issued on October 13, 2017 for an aggregate value of $0.1 million pursuant to the terms of the Stock Purchase Agreement.
Additionally, on August 1, 2017, the Company declared a dividend of $0.35 per common share. The dividend was paid on October 13, 2017 to common shareholders of record on October 2, 2017.
Fourth Quarter and Full-Year 2017 Guidance
As the Company previously announced, one of its development investments, a self-storage facility under construction in Jacksonville, sustained wind damage from Hurricane Irma. In addition, its planned development facility in Houston experienced a significant delay in permitting and the beginning of construction due to Hurricane Harvey. As a result, a significant portion of the Company’s anticipated increase in fair value during the fourth quarter of 2017 is now expected to shift to the first and second quarters of 2018. This shift in timing has the effect of reducing the Company’s prior full-year guidance for change in fair value of investments by approximately $5.8 million on the low side and approximately $8.0 million on the high side, with a corresponding decrease in net income and adjusted earnings. The amount of the fourth quarter decrease in estimated change in fair value is captured as corresponding increases in estimated change in fair value in the 2018 guidance presented below.
The following tables reflect earnings per share and adjusted earnings per share guidance for the three months ending December 31, 2017 and updated guidance, reflecting the effect of the timing change caused by the hurricanes discussed above, for the full-year 2017 as compared to the full-year 2017 guidance previously provided. Such guidance is based on management's current expectations of Company investment activity (including fair value appreciation), the self-storage market, and overall economic conditions. Adjusted earnings is a performance measure that
Third Quarter 2017 5
is not specifically defined by accounting principles generally accepted in the United States (“GAAP”) and is defined as net income attributable to common stockholders (computed in accordance with GAAP) plus stock dividends payable to preferred stockholders, stock-based compensation expense, depreciation and amortization on real estate assets, and loss on modification of debt.
| | | | | | |
| | | | | | |
| | Dollars in thousands, |
| | except share and per share data |
| | Three months ending |
| | December 31, 2017 |
| | Low | | High |
Interest income and other revenues | | $ | 3,500 | | $ | 3,610 |
Rental revenue from real estate owned | | | 160 | | | 200 |
JV income | | | 400 | | | 450 |
Total revenues and JV income | | $ | 4,060 | | $ | 4,260 |
G&A expenses (1) | | | (2,840) | | | (2,730) |
Property operating expenses (excl. depreciation and amortization) | | | (120) | | | (100) |
Depreciation and amortization on real estate assets | | | (260) | | | (240) |
Interest expense | | | (310) | | | (290) |
Other interest income | | | 100 | | | 110 |
Change in fair value of investments (2) | | | 1,350 | | | 1,650 |
Loss on modification of debt | | | - | | | - |
Net income | | | 1,980 | | | 2,660 |
Net income attributable to preferred stockholders (3) | | | (480) | | | (430) |
Net income attributable to common stockholders | | | 1,500 | | | 2,230 |
Add: stock dividends | | | 30 | | | 30 |
Add: stock-based compensation | | | 420 | | | 400 |
Add: depreciation and amortization on real estate assets | | | 260 | | | 240 |
Add: loss on modification of debt | | | - | | | - |
Adjusted earnings | | $ | 2,210 | | $ | 2,900 |
Earnings per share – diluted | | $ | 0.10 | | $ | 0.16 |
Adjusted earnings per share - diluted | | $ | 0.15 | | $ | 0.20 |
Average shares outstanding - diluted | | | 14,300,000 | | | 14,300,000 |
| |
(1) | Includes $1.1 million (low and high) of management fees for the three months ending December 31, 2017. |
(2) | Excludes $0.3 million (low and high) of unrealized appreciation in fair value of investments from the real estate venture which is included in JV income for the three months ending December 31, 2017. |
(3) | Represents both cash dividends and stock dividends estimated with respect to outstanding shares of Series A Preferred Stock. |
Third Quarter 2017 6
| | | | | | | | | | | | | | | | | | |
| | | | | | | | | | | | | | | | | | |
| | Dollars in thousands, |
| | except share and per share data |
| | Previous guidance for year ending | | Updated guidance for year ending | | |
| | December 31, 2017 | | December 31, 2017 | | Change |
| | Low | | High | | Low | | High | | Low | | High |
Interest income and other revenues | | $ | 11,180 | | $ | 11,400 | | $ | 11,430 | | $ | 11,540 | | $ | 250 | | $ | 140 |
Rental revenue from real estate owned | | | 390 | | | 420 | | | 490 | | | 530 | | | 100 | | | 110 |
JV income | | | 1,900 | | | 2,125 | | | 2,150 | | | 2,200 | | | 250 | | | 75 |
Total revenues and JV income | | $ | 13,470 | | $ | 13,945 | | $ | 14,070 | | $ | 14,270 | | $ | 600 | | $ | 325 |
G&A expenses (1) | | | (10,070) | | | (9,720) | | | (9,550) | | | (9,440) | | | 520 | | | 280 |
Property operating expenses (excl. depreciation and amortization) (2) | | | (200) | | | (180) | | | (310) | | | (290) | | | (110) | | | (110) |
Depreciation and amortization on real estate assets (2) | | | (155) | | | (135) | | | (490) | | | (470) | | | (335) | | | (335) |
Interest expense | | | (1,200) | | | (1,075) | | | (1,070) | | | (1,050) | | | 130 | | | 25 |
Other interest income | | | 650 | | | 675 | | | 580 | | | 590 | | | (70) | | | (85) |
Change in fair value of investments (3) | | | 16,250 | | | 18,750 | | | 10,420 | | | 10,720 | | | (5,830) | | | (8,030) |
Loss on modification of debt | | | - | | | - | | | (235) | | | (235) | | | (235) | | | (235) |
Net income | | | 18,745 | | | 22,260 | | | 13,415 | | | 14,095 | | | (5,330) | | | (8,165) |
Net income attributable to preferred stockholders (4) | | | (1,800) | | | (1,700) | | | (1,515) | | | (1,465) | | | 285 | | | 235 |
Net income attributable to common stockholders | | | 16,945 | | | 20,560 | | | 11,900 | | | 12,630 | | | (5,045) | | | (7,930) |
Add: stock dividends | | | 475 | | | 475 | | | 535 | | | 535 | | | 60 | | | 60 |
Add: stock-based compensation | | | 1,475 | | | 1,450 | | | 1,445 | | | 1,425 | | | (30) | | | (25) |
Add: depreciation and amortization on real estate assets | | | 155 | | | 135 | | | 490 | | | 470 | | | 335 | | | 335 |
Add: loss on modification of debt | | | - | | | - | | | 235 | | | 235 | | | 235 | | | 235 |
Adjusted earnings | | $ | 19,050 | | $ | 22,620 | | $ | 14,605 | | $ | 15,295 | | $ | (4,445) | | $ | (7,325) |
Earnings per share – diluted | | $ | 1.41 | | $ | 1.71 | | $ | 1.00 | | $ | 1.06 | | $ | (0.41) | | $ | (0.65) |
Adjusted earnings per share - diluted | | $ | 1.58 | | $ | 1.88 | | $ | 1.22 | | $ | 1.28 | | $ | (0.36) | | $ | (0.60) |
Average shares outstanding - diluted | | | 12,050,000 | | | 12,050,000 | | | 11,950,000 | | | 11,950,000 | | | 100,000 | | | 100,000 |
| | | | | | | | | | | | | | | | | | |
| |
(1) | Includes $3.5 million (low and high) and $3.7 million (low) / $3.6 million (high) of management fees for updated guidance and previous guidance for the year ending December 31, 2017, respectively. |
(2) | Adjusted guidance to consider our purchase of 100% of developer’s interests in self-storage facility in Orlando MSA. |
(3) | Excludes $1.3 million (low and high) and $1.4 million (low) / $1.6 million (high) of unrealized appreciation in fair value of investments from the real estate venture which is included in JV income for updated guidance and previous guidance for the year ending December 31, 2017, respectively. |
(4) | Represents both cash dividends and stock dividends estimated with respect to outstanding shares of Series A Preferred Stock. |
The guidance above is based on the following key assumptions regarding the Company’s business activities in the fourth quarter of 2017:
| | |
| ▪ | projected closings on $90 million to $100 million of new development property investments with a profits interest for the fourth quarter of 2017 ($395 million to $405 million for the full-year); |
| ▪ | fundings of approximately $35 million to $40 million on the Company’s investment commitments during the fourth quarter ($155 million to $160 million for the full-year); |
| ▪ | anticipated proceeds of $30 million from the issuance of Series A Preferred Stock during the fourth quarter of 2017, which includes the issuance of $10 million of Series A Preferred Stock on October 26, 2017; and |
| ▪ | no change in the key assumptions used to value the Company’s investments. |
Third Quarter 2017 7
Over 75% of the development property investment commitments closed by the Company in 2016 were made through the Heitman joint venture (“JV”). The Company resumed closing on-balance sheet investments in late 2016. The 2017 guidance reflects the impact of the limited number of on-balance sheet closings in 2016 resulting in modest fair value adjustments in 2017 on the 2016 investments. The Company expects that the substantial increase in on-balance sheet investment activity in 2017 will result in significant increases in interest income and fair value appreciation in 2018.
Preliminary Full-Year 2018 Guidance
The following table reflects preliminary guidance for revenues, JV income, G&A expenses, and fair value appreciation for the full-year 2018. Such guidance is based on management's current expectations of Company investment activity (including fair value appreciation), the operational and new supply dynamics of the self-storage markets in which the Company has invested, and overall economic conditions.
| | | | | | |
| | | | | | |
| | Dollars in thousands |
| | Year ending |
| | December 31, 2018 |
| | Low | | High |
Interest income from investments | | $ | 23,000 | | $ | 25,000 |
Rental and other property-related income from real estate owned | | | 900 | | | 1,000 |
Other income | | | 80 | | | 100 |
Total revenues | | $ | 23,980 | | $ | 26,100 |
| | | | | | |
JV income | | | 1,400 | | | 1,900 |
| | | | | | |
G&A expenses | | | 15,000 | | | 13,500 |
| | | | | | |
Change in fair value of investments(1) | | | 46,000 | | | 56,000 |
| |
(1) | Excludes $0.8 million (low) and $1.2 million (high) of unrealized appreciation in fair value of investments from the real estate venture which is included in JV income. |
The guidance above is based on the following key assumptions regarding the Company’s business activities in the year ending December 31, 2018:
| | |
| ▪ | projected closings on $200 million to $230 million of new development property investments with a profits interest in 2018; |
| ▪ | estimated fundings of approximately $260 million to $300 million on the Company’s closed and projected investment commitments in 2018(1); |
| ▪ | increases in general and administrative expenses largely due to anticipated increases in the Company’s management fees as equity capitalization increases; |
| ▪ | no significant change in the Company’s business model; and |
| ▪ | no additional purchases of developers’ interests. |
| |
(1) | At the time of Certificate of Occupancy of each development project financed by the Company, the amount of the Company’s commitment that is actually funded generally ranges from 88% to 90% of the Company’s total commitment, with the balance of such commitment held to fund interest payments and operating reserves during the initial 18 to 24 months lease-up of the project. The amount of estimated fundings reflect this investment methodology. |
Third Quarter 2017 8
Jernigan Capital, Inc.
Financial Highlights- Trailing Five Quarters
(unaudited, in thousands, except share and per share data)
| | | | | | | | | | | | | | | |
| | | | | | | | | | | | | | | |
| | Three months ended |
| | September 30, | | June 30, | | March 31, | | December 31, | | September 30, |
| | 2017 | | 2017 | | 2017 | | 2016 | | 2016 |
Operating Data: | | | | | | | | | | | | | | | |
Interest income, rental-related income and other revenues | | $ | 3,361 | | $ | 2,599 | | $ | 2,301 | | $ | 2,158 | | $ | 1,698 |
JV income | | | 730 | | | 595 | | | 422 | | | 424 | | | 436 |
Total revenues and JV income | | | 4,091 | | | 3,194 | | | 2,723 | | | 2,582 | | | 2,134 |
General & administrative expenses | | | (2,422) | | | (2,078) | | | (2,208) | | | (1,942) | | | (1,865) |
Property operating expenses of real estate owned | | | (114) | | | (43) | | | (31) | | | - | | | - |
Depreciation and amortization of real estate owned | | | (172) | | | (38) | | | (24) | | | - | | | - |
Transaction and other expenses, restructuring costs, and deferred termination fee to Manager | | | - | | | - | | | - | | | - | | | (2) |
Interest expense | | | (323) | | | (230) | | | (204) | | | (373) | | | (148) |
Loss on modification of debt | | | (232) | | | - | | | - | | | - | | | - |
Subtotal | | | 828 | | | 805 | | | 256 | | | 267 | | | 119 |
Change in fair value of investments | | | 3,384 | | | 4,289 | | | 1,393 | | | 4,185 | | | 4,867 |
Other interest income | | | 245 | | | 100 | | | 134 | | | 37 | | | 8 |
Net income | | | 4,457 | | | 5,194 | | | 1,783 | | | 4,489 | | | 4,994 |
Net income attributable to preferred stockholders | | | (310) | | | (177) | | | (546) | | | (996) | | | - |
Net income attributable to common stockholders | | $ | 4,147 | | $ | 5,017 | | $ | 1,237 | | $ | 3,493 | | $ | 4,994 |
Plus: stock dividends payable to preferred stockholders | | | 132 | | | - | | | 371 | | | 823 | | | - |
Plus: stock-based compensation | | | 296 | | | 435 | | | 292 | | | 252 | | | 341 |
Plus: depreciation and amortization on real estate assets | | | 172 | | | 38 | | | 24 | | | - | | | - |
Plus: loss on modification of debt | | | 232 | | | - | | | - | | | - | | | - |
Plus: transaction and other expenses, restructuring costs, and deferred termination fee to Manager | | | - | | | - | | | - | | | - | | | 2 |
Adjusted Earnings | | $ | 4,979 | | $ | 5,490 | | $ | 1,924 | | $ | 4,568 | | $ | 5,337 |
| | | | | | | | | | | | | | | |
Basic earnings per share attributable to common stockholders | | $ | 0.29 | | $ | 0.50 | | $ | 0.14 | | $ | 0.53 | | $ | 0.84 |
Diluted earnings per share attributable to common stockholders | | $ | 0.29 | | $ | 0.50 | | $ | 0.14 | | $ | 0.53 | | $ | 0.84 |
| | | | | | | | | | | | | | | |
Adjusted Earnings per share attributable to common stockholders - diluted | | $ | 0.35 | | $ | 0.55 | | $ | 0.21 | | $ | 0.69 | | $ | 0.90 |
| | | | | | | | | | | | | | | |
Weighted-average shares of common stock outstanding: | | | | | | | | | | | | | | | |
Basic | | | 14,042,350 | | | 9,850,967 | | | 8,857,030 | | | 6,458,845 | | | 5,831,135 |
Diluted | | | 14,244,345 | | | 10,033,029 | | | 8,993,528 | | | 6,619,848 | | | 5,963,093 |
| | | | | | | | | | | | | | | |
Dividends declared per share of common stock | | $ | 0.35 | | $ | 0.35 | | $ | 0.35 | | $ | 0.35 | | $ | 0.35 |
| | | | | | | | | | | | | | | |
Balance Sheet Data: | | | | | | | | | | | | | | | |
Cash and cash equivalents | | $ | 54,999 | | $ | 100,529 | | $ | 28,252 | | $ | 67,373 | | $ | 13,009 |
Development property investments at fair value | | | 188,540 | | | 163,979 | | | 117,936 | | | 95,102 | | | 84,986 |
Operating property loans at fair value | | | 5,990 | | | 8,790 | | | 9,965 | | | 9,905 | | | 15,090 |
Investment in and advances to real estate venture | | | 12,573 | | | 14,314 | | | 10,812 | | | 5,373 | | | 2,883 |
Self-storage real estate owned, net | | | 15,594 | | | 7,283 | | | 7,350 | | | - | | | - |
Total assets | | | 284,193 | | | 305,127 | | | 192,429 | | | 192,779 | | | 125,826 |
Senior loan participations | | | 668 | | | 20,147 | | | 19,299 | | | 18,582 | | | 17,521 |
Secured revolving credit facility | | | - | | | - | | | - | | | - | | | - |
Total liabilities | | | 8,434 | | | 28,733 | | | 24,873 | | | 24,417 | | | 20,983 |
Total equity | | | 275,759 | | | 276,394 | | | 167,556 | | | 168,362 | | | 104,843 |
Common book value / common shares outstanding | | $ | 18.71 | | $ | 18.75 | | $ | 17.57 | | $ | 17.74 | | $ | 17.59 |
Third Quarter 2017 9
Jernigan Capital, Inc.
Consolidated Balance Sheets- Trailing Five Quarters
(unaudited, in thousands)
| | | | | | | | | | | | | | | |
| | | | | | | | | | | | | | | |
| | As of |
| | September 30, | | June 30, | | March 31, | | December 31, | | September 30, |
| | 2017 | | 2017 | | 2017 | | 2016 | | 2016 |
Assets: | | | | | | | | | | | | | | | |
Cash and cash equivalents | | $ | 54,999 | | $ | 100,529 | | $ | 28,252 | | $ | 67,373 | | $ | 13,009 |
Development property investments at fair value | | | 188,540 | | | 163,979 | | | 117,936 | | | 95,102 | | | 84,986 |
Operating property loans at fair value | | | 5,990 | | | 8,790 | | | 9,965 | | | 9,905 | | | 15,090 |
Investment in and advances to real estate venture | | | 12,573 | | | 14,314 | | | 10,812 | | | 5,373 | | | 2,883 |
Self-storage real estate owned, net | | | 15,594 | | | 7,283 | | | 7,350 | | | - | | | - |
Other loans, at cost | | | 1,754 | | | 6,619 | | | 14,826 | | | 11,752 | | | 6,243 |
Deferred costs | | | 3,813 | | | 2,305 | | | 2,294 | | | 2,207 | | | 2,690 |
Prepaid expenses and other assets | | | 734 | | | 1,119 | | | 809 | | | 868 | | | 727 |
Fixed assets, net | | | 196 | | | 189 | | | 185 | | | 199 | | | 198 |
Total assets | | $ | 284,193 | | $ | 305,127 | | $ | 192,429 | | $ | 192,779 | | $ | 125,826 |
| | | | | | | | | | | | | | | |
Liabilities: | | | | | | | | | | | | | | | |
Senior loan participations | | $ | 668 | | $ | 20,147 | | $ | 19,299 | | $ | 18,582 | | $ | 17,521 |
Secured revolving credit facility | | | - | | | - | | | - | | | - | | | - |
Due to Manager | | | 1,438 | | | 1,027 | | | 839 | | | 1,008 | | | 579 |
Accounts payable, accrued expenses and other liabilities | | | 1,035 | | | 2,399 | | | 1,040 | | | 697 | | | 796 |
Dividends payable | | | 5,293 | | | 5,160 | | | 3,695 | | | 4,130 | | | 2,087 |
Total liabilities | | $ | 8,434 | | $ | 28,733 | | $ | 24,873 | | $ | 24,417 | | $ | 20,983 |
| | | | | | | | | | | | | | | |
Equity: | | | | | | | | | | | | | | | |
Jernigan Capital, Inc. stockholders’ equity: | | | | | | | | | | | | | | | |
Cumulative preferred stock | | $ | 9,445 | | $ | 9,445 | | $ | 9,446 | | $ | 9,448 | | $ | - |
Common stock | | | 142 | | | 142 | | | 90 | | | 90 | | | 60 |
Additional paid-in capital | | | 272,726 | | | 272,525 | | | 163,772 | | | 162,664 | | | 108,982 |
Accumulated deficit | | | (6,554) | | | (5,718) | | | (5,752) | | | (3,840) | | | (4,199) |
Total equity | | | 275,759 | | | 276,394 | | | 167,556 | | | 168,362 | | | 104,843 |
Total liabilities and equity | | $ | 284,193 | | $ | 305,127 | | $ | 192,429 | | $ | 192,779 | | $ | 125,826 |
Third Quarter 2017 10
Jernigan Capital, Inc.
Consolidated Statements of Operations
(unaudited, in thousands, except per share data)
| | | | | | | | | | | | |
| | | | | | | | | | | | |
| | Three months ended | | Nine months ended |
| | September 30, | | September 30, |
| | 2017 | | 2016 | | 2017 | | 2016 |
Revenues: | | | | | | | | | | | | |
Interest income from investments | | $ | 3,173 | | $ | 1,698 | | $ | 7,759 | | $ | 4,374 |
Rental and other property-related income from real estate owned | | | 160 | | | - | | | 328 | | | - |
Other revenues | | | 28 | | | - | | | 174 | | | - |
Total revenues | | | 3,361 | | | 1,698 | | | 8,261 | | | 4,374 |
| | | | | | | | | | | | |
Costs and expenses: | | | | | | | | | | | | |
General and administrative expenses | | | 1,386 | | | 1,463 | | | 4,336 | | | 4,102 |
Management fees to Manager | | | 1,036 | | | 402 | | | 2,373 | | | 1,218 |
Property operating expenses of real estate owned | | | 114 | | | - | | | 188 | | | - |
Depreciation and amortization of real estate owned | | | 172 | | | - | | | 233 | | | - |
Transaction and other expenses | | | - | | | 2 | | | - | | | 2,129 |
Restructuring costs | | | - | | | - | | | - | | | 54 |
Deferred termination fee to Manager | | | - | | | - | | | - | | | 239 |
Total costs and expenses | | | 2,708 | | | 1,867 | | | 7,130 | | | 7,742 |
| | | | | | | | | | | | |
Operating income (loss) | | | 653 | | | (169) | | | 1,131 | | | (3,368) |
| | | | | | | | | | | | |
Other income (expense): | | | | | | | | | | | | |
Equity in earnings from unconsolidated real estate venture | | | 730 | | | 436 | | | 1,747 | | | 854 |
Change in fair value of investments | | | 3,384 | | | 4,867 | | | 9,066 | | | 14,185 |
Interest expense | | | (323) | | | (148) | | | (757) | | | (186) |
Loss on modification of debt | | | (232) | | | - | | | (232) | | | - |
Other interest income | | | 245 | | | 8 | | | 479 | | | 43 |
Total other income | | | 3,804 | | | 5,163 | | | 10,303 | | | 14,896 |
Net income | | | 4,457 | | | 4,994 | | | 11,434 | | | 11,528 |
Net income attributable to preferred stockholders | | | (310) | | | - | | | (1,033) | | | - |
Net income attributable to common stockholders | | $ | 4,147 | | $ | 4,994 | | $ | 10,401 | | $ | 11,528 |
| | | | | | | | | | | | |
Basic earnings per share attributable to common stockholders | | $ | 0.29 | | $ | 0.84 | | $ | 0.94 | | $ | 1.90 |
Diluted earnings per share attributable to common stockholders | | $ | 0.29 | | $ | 0.84 | | $ | 0.94 | | $ | 1.90 |
| | | | | | | | | | | | |
Dividends declared per share of common stock | | $ | 0.35 | | $ | 0.35 | | $ | 1.05 | | $ | 1.05 |
Third Quarter 2017 11
Jernigan Capital, Inc.
Calculation of Adjusted Earnings and Reconciliation to Net Income Attributable to
Common Stockholders – Trailing Five Quarters
(unaudited, in thousands, except share and per share data)
| | | | | | | | | | | | | | | |
| | | | | | | | | | | | | | | |
| | Three months ended |
| | September 30, | | June 30, | | March 31, | | December 31, | | September 30, |
| | 2017 | | 2017 | | 2017 | | 2016 | | 2016 |
| | | | | | | | | | | | | | | |
Net income attributable to common stockholders | | $ | 4,147 | | $ | 5,017 | | $ | 1,237 | | $ | 3,493 | | $ | 4,994 |
| | | | | | | | | | | | | | | |
Plus: stock dividends payable to preferred stockholders | | | 132 | | | - | | | 371 | | | 823 | | | - |
| | | | | | | | | | | | | | | |
Plus: stock-based compensation | | | 296 | | | 435 | | | 292 | | | 252 | | | 341 |
| | | | | | | | | | | | | | | |
Plus: depreciation and amortization on real estate assets | | | 172 | | | 38 | | | 24 | | | - | | | - |
| | | | | | | | | | | | | | | |
Plus: loss on modification of debt | | | 232 | | | - | | | - | | | - | | | - |
| | | | | | | | | | | | | | | |
Plus: transaction and other expenses | | | - | | | - | | | - | | | - | | | 2 |
| | | | | | | | | | | | | | | |
Adjusted Earnings | | $ | 4,979 | | $ | 5,490 | | $ | 1,924 | | $ | 4,568 | | $ | 5,337 |
| | | | | | | | | | | | | | | |
Adjusted Earnings per share attributable to common stockholders - diluted | | $ | 0.35 | | $ | 0.55 | | $ | 0.21 | | $ | 0.69 | | $ | 0.90 |
Weighted average shares of common stock outstanding - diluted | | | 14,244,345 | | | 10,033,029 | | | 8,993,528 | | | 6,619,848 | | | 5,963,093 |
Third Quarter 2017 12
Jernigan Capital, Inc.
Schedule of Completed Development Projects
As of September 30, 2017
(unaudited, dollars in thousands)
| | | | | | | | | | | | | | | | | | | | | | | | | | |
| | | | | | | | | | | | | | | | | | | | | | | | | | |
| | Location | | | | | | | | Remaining | | | | | | | | | | | | | | | |
| | (MSA) | | | | | Funded | | Unfunded | | | | | | Size | | Date | | Months | | % Physical |
Closing Date | | Address | | Commitment | | Investment | | Commitment | | Fair Value | | | (NRSF) (3) | | Opened | | Open (1) | | Occupancy (1) |
6/10/2015 | | Atlanta 1 | | | | | | | | | | | | | | | | | | | | | | | | |
| | 5110 McGinnis Ferry Rd | | | 8,132 | | | 8,010 | | | 122 | | | 10,507 | | | | 71,743 | | 5/25/2016 | | 17 | | | 63.8 | % |
6/19/2015 | | Tampa 1 | | | | | | | | | | | | | | | | | | | | | | | | |
| | 12832 S US Highway 301 | | | 5,369 | | | 5,285 | | | 84 | | | 6,058 | | | | 50,050 | | 4/11/2016 | | 19 | | | 85.7 | % |
6/26/2015 | | Atlanta 2 | | | | | | | | | | | | | | | | | | | | | | | | |
| | 340 Franklin Gateway SE | | | 6,050 | | | 5,754 | | | 296 | | | 8,519 | | | | 66,137 | | 5/24/2016 | | 17 | | | 74.2 | % |
6/29/2015 | | Charlotte 1 | | | | | | | | | | | | | | | | | | | | | | | | |
| | 9323 Wright Hill Rd | | | 7,624 | | | 7,126 | | | 498 | | | 10,551 | | | | 87,430 | | 8/18/2016 | | 14 | | | 42.7 | % |
7/2/2015 | | Milwaukee | | | | | | | | | | | | | | | | | | | | | | | | |
| | 420 W St Paul Ave | | | 7,650 | | | 7,377 | | | 273 | | | 8,762 | | | | 83,154 | | 10/9/2016 | (2) | 13 | | | 28.5 | % |
7/31/2015 | | New Haven | | | | | | | | | | | | | | | | | | | | | | | | |
| | 453 Washington Ave | | | 6,930 | | | 6,412 | | | 518 | | | 8,399 | | | | 64,225 | | 12/16/2016 | | 11 | | | 47.3 | % |
9/30/2015 | | Jacksonville 1 | | | | | | | | | | | | | | | | | | | | | | | | |
| | 1939 East West Pkwy | | | 6,445 | | | 5,988 | | | 457 | | | 8,830 | | | | 59,848 | | 8/12/2016 | | 15 | | | 91.4 | % |
10/27/2015 | | Austin | | | | | | | | | | | | | | | | | | | | | | | | |
| | 251 N AW Grimes Blvd | | | 8,658 | | | 7,000 | | | 1,658 | | | 8,779 | | | | 77,334 | | 3/16/2017 | | 8 | | | 27.8 | % |
8/10/2015 | | Pittsburgh | | | | | | | | | | | | | | | | | | | | | | | | |
| | 6400 Hamilton Ave | | | 5,266 | | | 4,574 | | | 692 | | | 6,591 | | | | 48,024 | | 5/11/2017 | | 6 | | | 15 | % |
1/4/2017 | | New York City 1 | | | | | | | | | | | | | | | | | | | | | | | | |
| | 1775 5th Ave | | | 16,117 | | | 13,165 | | | 2,952 | | | 16,712 | | | | 105,672 | | 9/29/2017 | | 1 | | | 3.6 | % |
Total Completed Development Loans | | $ | 78,241 | | $ | 70,691 | | $ | 7,550 | | $ | 93,708 | | | | | | | | | | | | |
| | | | | | | | | | | | | | | | | | | | | | | | | | |
4/21/2015 | | Orlando 1/2 (4) | | | | | | | | | | | | | | | | | | | | | | | | |
| | 11920 W Colonial Dr. | | | 10,506 | | | N/A | | | N/A | | | N/A | | | | 93,965 | | 5/1/2016 | | 18 | | | 68.7 | % |
Total Owned Properties | | $ | 10,506 | | | | | | | | | | | | | | | | | | | | | |
| | | | | | | | | | | | | | | | | | | | | | | | | | |
Total Completed Investments | | $ | 88,747 | | | | | | | | | | | | | | | | | | | | | |
| |
(1) | As of October 30, 2017. |
(2) | Certificate of Occupancy (“C/O”) was received in August 2016, prior to the property being ready for opening by the manager of the project. Property opened to partial leasing in October 2016. All floors opened to leasing in February 2017. |
(3) | The net rentable square feet (“NRSF”) includes only climate controlled and non-climate controlled storage space. It does not include retail space, office space, non-covered RV space or parking spaces. |
(4) | In August 2017, the Company purchased its partner’s remaining 25.1% profits interest in the Orlando 1 investment and its partner’s 50.1% profits interest in the Orlando 2 investment, the 287-unit addition to the Orlando 1 investment, for $1.6 million. The Orlando facility is now wholly-owned by the Company. Orlando 1 (51,235 NRSF) was at 86.2% physical occupancy on July 18, 2017. On July 19, 2017 the 42,730 NRSF Orlando 2 addition opened for business. Occupancy reflected is for the combined facility. |
Third Quarter 2017 13
Schedule of Development Projects in Progress
As of September 30, 2017
(unaudited, dollars in thousands)
| | | | | | | | | | | | | | | | | | | | | |
| | | | | | | | | | | | | | | | | | | | | |
| | Location | | | | | | | | Remaining | | | | | | | | | | Estimated |
| | (MSA) | | | | | Funded | | Unfunded | | | | | Size | | Construction | | C/O |
Closing Date | | Address | | Commitment | | Investment | | Commitment | | Fair Value | | (NRSF) (2) | | Start Date | | Quarter (1) |
8/14/2015 | | Raleigh | | | | | | | | | | | | | | | | | | | |
| | 1501 Sunrise Ave | | $ | 8,792 | | $ | 4,277 | | $ | 4,515 | | $ | 4,260 | | | 60,785 | | Q4 2016 | | Q1 2018 |
9/20/2016 | | Charlotte 2 | | | | | | | | | | | | | | | | | | | |
| | 1200 E 10th St | | | 12,888 | | | 4,517 | | | 8,371 | | | 4,360 | | | 77,914 | | Q1 2017 | | Q2 2018 |
11/17/2016 | | Jacksonville 2 | | | | | | | | | | | | | | | | | | | |
| | 37 Jefferson Rd | | | 7,530 | | | 3,899 | | | 3,631 | | | 4,453 | | | 70,930 | | Q4 2016 | | Q1 2018 |
1/18/2017 | | Atlanta 3 | | | | | | | | | | | | | | | | | | | |
| | 1484 Northside Dr NW | | | 14,115 | | | 3,471 | | | 10,644 | | | 3,314 | | | 92,935 | | Q3 2017 | | Q1 2019 |
1/31/2017 | | Atlanta 4 | | | | | | | | | | | | | | | | | | | |
| | 4676 S Atlanta Rd | | | 13,678 | | | 5,698 | | | 7,980 | | | 5,667 | | | 103,561 | | Q2 2017 | | Q3 2018 |
2/24/2017 | | Orlando 3 | | | | | | | | | | | | | | | | | | | |
| | 12711 E Colonial Dr | | | 8,056 | | | 1,468 | | | 6,588 | | | 1,409 | | | 71,113 | | Q2 2017 | | Q3 2018 |
2/24/2017 | | New Orleans | | | | | | | | | | | | | | | | | | | |
| | 2709 Severn Ave | | | 12,549 | | | - | | | 12,549 | | | - | | | 90,315 | | Q3 2017 | | Q3 2018 |
2/27/2017 | | Atlanta 5 | | | | | | | | | | | | | | | | | | | |
| | 56 Peachtree Valley Rd NE | | | 17,492 | | | 3,910 | | | 13,582 | | | 3,790 | | | 84,988 | | Q3 2017 | | Q4 2018 |
3/1/2017 | | Fort Lauderdale | | | | | | | | | | | | | | | | | | | |
| | 5601 NE 14th Ave | | | 9,952 | | | 1,945 | | | 8,007 | | | 1,875 | | | 79,279 | | Q1 2017 | | Q4 2018 |
3/1/2017 | | Houston | | | | | | | | | | | | | | | | | | | |
| | 1070 Brittmoore Rd | | | 13,630 | | | 3,382 | | | 10,248 | | | 3,283 | | | 132,967 | | Q4 2017 | | Q2 2018 |
4/14/2017 | | Louisville 1 | | | | | | | | | | | | | | | | | | | |
| | 2801 N Hurstbourne Pkwy | | | 8,523 | | | 1,471 | | | 7,052 | | | 1,394 | | | 66,150 | | Q2 2017 | | Q3 2018 |
4/20/2017 | | Denver 1 | | | | | | | | | | | | | | | | | | | |
| | 6206 W Alameda Ave | | | 9,806 | | | 1,906 | | | 7,900 | | | 1,822 | | | 59,150 | | Q2 2017 | | Q4 2018 |
4/20/2017 | | Denver 2 | | | | | | | | | | | | | | | | | | | |
| | 3110 S Wadsworth Blvd | | | 11,164 | | | 2,877 | | | 8,287 | | | 2,790 | | | 74,615 | | Q2 2017 | | Q2 2018 |
5/2/2017 | | Atlanta 6 | | | | | | | | | | | | | | | | | | | |
| | 2033 Monroe Dr | | | 12,543 | | | 3,117 | | | 9,426 | | | 3,017 | | | 81,120 | | Q2 2017 | | Q3 2018 |
5/2/2017 | | Tampa 2 | | | | | | | | | | | | | | | | | | | |
| | 9185 Ulmerton Rd | | | 8,091 | | | 890 | | | 7,201 | | | 813 | | | 71,400 | | Q3 2017 | | Q3 2018 |
5/19/2017 | | Tampa 3 | | | | | | | | | | | | | | | | | | | |
| | Lot 3B Crossroads Town Center | | | 9,224 | | | 729 | | | 8,495 | | | 639 | | | 70,888 | | Q3 2017 | | Q3 2018 |
6/12/2017 | | Tampa 4 | | | | | | | | | | | | | | | | | | | |
| | 3209 30th Ave S St | | | 10,266 | | | 1,364 | | | 8,902 | | | 1,266 | | | 73,500 | | Q3 2017 | | Q4 2018 |
6/19/2017 | | Baltimore | | | | | | | | | | | | | | | | | | | |
| | 1835 Washington Blvd | | | 10,775 | | | 2,672 | | | 8,103 | | | 2,484 | | | 83,450 | | Q3 2017 | | Q3 2018 |
6/28/2017 | | Knoxville | | | | | | | | | | | | | | | | | | | |
| | 7807 Kingston Pike | | | 9,115 | | | 1,656 | | | 7,459 | | | 1,573 | | | 72,069 | | Q3 2017 | | Q4 2018 |
6/29/2017 | | Boston | | | | | | | | | | | | | | | | | | | |
| | 329 Boston Post Rd | | | 14,103 | | | 2,031 | | | 12,072 | | | 1,898 | | | 93,738 | | Q3 2017 | | Q3 2018 |
6/30/2017 | | New York City 2 | | | | | | | | | | | | | | | | | | | |
| | 465 W 150th St | | | 26,482 | | | 16,712 | | | 9,770 | | | 16,333 | | | 40,593 | | Q4 2017 | | Q3 2018 |
7/27/2017 | | Jacksonville 3 | | | | | | | | | | | | | | | | | | | |
| | 2004 Edison Ave | | | 8,096 | | | 888 | | | 7,208 | | | 810 | | | 68,700 | | Q3 2017 | | Q4 2018 |
8/30/2017 | | Orlando 4 | | | | | | | | | | | | | | | | | | | |
| | 9001 Eastmar Commons | | | 9,037 | | | 1,790 | | | 7,247 | | | 1,698 | | | 77,125 | | Q1 2018 | | Q1 2019 |
9/14/2017 | | Los Angeles | | | | | | | | | | | | | | | | | | | |
| | 943-959 W Hyde Park Blvd | | | 28,750 | | | 7,382 | | | 21,368 | | | 7,284 | | | 120,038 | | Q1 2019 | | Q3 2020 |
9/14/2017 | | Miami | | | | | | | | | | | | | | | | | | | |
| | 4250 SW 8th St | | | 14,657 | | | 5,761 | | | 8,896 | | | 5,644 | | | 69,175 | | Q2 2018 | | Q2 2019 |
9/28/2017 | | Louisville 2 | | | | | | | | | | | | | | | | | | | |
| | 3415 Bardstown Rd | | | 9,940 | | | 2,230 | | | 7,710 | | | 2,139 | | | 74,172 | | Q4 2017 | | Q4 2018 |
Total Development Loan in Progress | | $ | 319,254 | | $ | 86,043 | | $ | 233,211 | | $ | 84,015 | | | | | | | |
| |
(1) | Estimated C/O dates represent the Company’s best estimate as of September 30, 2017 based on project specific information learned through underwriting and communications with respective developers. These dates are subject to change due to unexpected project delays/efficiencies. |
(2) | The NRSF includes only climate controlled and non-climate controlled storage space. It does not include retail space, office space, non-covered RV space or parking spaces. |
Third Quarter 2017 14
Schedule of Heitman JV Development Projects Completed and In Progress
As of September 30, 2017
(unaudited, dollars in thousands)
Development Projects Completed:
| | | | | | | | | | | | | | | | | | | | | | | | | | |
| | | | | | | | | | | | | | | | | | | | | | | | | | |
| | Location | | | | | | | | Remaining | | | | | | | | | | | | | | | |
| | (MSA) | | | | | Funded | | Unfunded | | | | | | Size | | Date | | Months | | % Physical |
Closing Date | | Address | | Commitment | | Investment | | Commitment | | Fair Value | | | (NRSF) (2) | | Opened | | Open (1) | | Occupancy (1) |
7/19/2016 | | Jacksonville | | | | | | | | | | | | | | | | | | | | | | | | |
| | 3211 San Pablo Rd S | | | 8,127 | | | 6,989 | | | 1,138 | | | 10,541 | | | | 80,646 | | 7/26/2017 | | 3 | | | 31.3 | % |
9/28/2016 | | Columbia | | | | | | | | | | | | | | | | | | | | | | | | |
| | 401 Hampton St | | | 9,199 | | | 7,651 | | | 1,548 | | | 8,525 | | | | 70,161 | | 8/23/2017 | | 2 | | | 13.4 | % |
8/15/2016 | | Atlanta 2 | | | | | | | | | | | | | | | | | | | | | | | | |
| | 11220 Medlock Bridge Rd | | | 8,772 | | | 6,535 | | | 2,237 | | | 7,423 | | | | 70,209 | | 9/14/2017 | | 2 | | | 4.7 | % |
4/15/2016 | | Washington DC | | | | | | | | | | | | | | | | | | | | | | | | |
| | 1325 Kenilworth Ave NE | | | 17,269 | | | 14,346 | | | 2,923 | | | 15,937 | | | | 90,500 | | 9/25/2017 | | 1 | | | 5.2 | % |
Total Completed Development Loans | | $ | 43,367 | | $ | 35,521 | | $ | 7,846 | | $ | 42,426 | | | | | | | | | | | | |
| |
(1) | As of October 30, 2017. |
(2) | The NRSF includes only climate controlled and non-climate controlled storage space. It does not include retail space, office space, non-covered RV space or parking spaces. |
Development Projects In Progress:
| | | | | | | | | | | | | | | | | | | | | |
| | | | | | | | | | | | | | | | | | | | | |
| | Location | | | | | | | | Remaining | | | | | | | | | | Estimated |
| | (MSA) | | | | | Funded | | Unfunded | | | | | Size | | Construction | | C/O |
Closing Date | | Address | | Commitment | | Investment | | Commitment | | Fair Value | | (NRSF) (2) | | Start Date | | Quarter (1) |
5/14/2015 | | Miami 1 | | | | | | | | | | | | | | | | | | | |
| | 490 NW 36th St | | $ | 13,867 | | $ | 9,455 | | $ | 4,412 | | $ | 10,929 | | | 75,838 | | Q1 2016 | | Q1 2018 |
5/14/2015 | | Miami 2 | | | | | | | | | | | | | | | | | | | |
| | 1100 NE 79th St | | | 14,849 | | | 8,486 | | | 6,363 | | | 8,947 | | | 74,113 | | Q2 2016 | | Q1 2018 |
9/25/2015 | | Fort Lauderdale | | | | | | | | | | | | | | | | | | | |
| | 812 NW 1st St | | | 13,230 | | | 7,298 | | | 5,932 | | | 7,796 | | | 87,413 | | Q2 2016 | | Q1 2018 |
4/29/2016 | | Atlanta 1 | | | | | | | | | | | | | | | | | | | |
| | 1801 Savoy Dr | | | 10,223 | | | 5,140 | | | 5,083 | | | 5,459 | | | 71,575 | | Q4 2016 | | Q1 2018 |
7/21/2016 | | New Jersey | | | | | | | | | | | | | | | | | | | |
| | 10 Central Ave | | | 7,828 | | | 1,621 | | | 6,207 | | | 1,561 | | | 57,975 | | Q2 2017 | | Q2 2018 |
8/25/2016 | | Denver | | | | | | | | | | | | | | | | | | | |
| | 2225 E 104th Ave | | | 11,032 | | | 7,605 | | | 3,427 | | | 8,678 | | | 85,725 | | Q4 2016 | | Q4 2017 |
12/22/2016 | | Raleigh | | | | | | | | | | | | | | | | | | | |
| | 7620 ACC Blvd | | | 8,877 | | | 2,431 | | | 6,446 | | | 2,398 | | | 65,110 | | Q1 2017 | | Q2 2018 |
Total Development Projects in Progress | | $ | 79,906 | | $ | 42,036 | | $ | 37,870 | | $ | 45,768 | | | | | | | |
| | | | | | | | | | | | | | | | | | | | | |
Total Heitman JV Investments | | $ | 123,273 | | $ | 77,557 | | $ | 45,716 | | $ | 88,194 | | | | | | | |
| |
(1) | Estimated C/O dates represent the Company’s best estimate as of September 30, 2017 based on project specific information learned through underwriting and communications with respective developers. These dates are subject to change due to unexpected project delays/efficiencies. |
(2) | The NRSF includes only climate controlled and non-climate controlled storage space. It does not include retail space, office space, non-covered RV space or parking spaces. |
Third Quarter 2017 15
Closed Investments by Geography
As of September 30, 2017
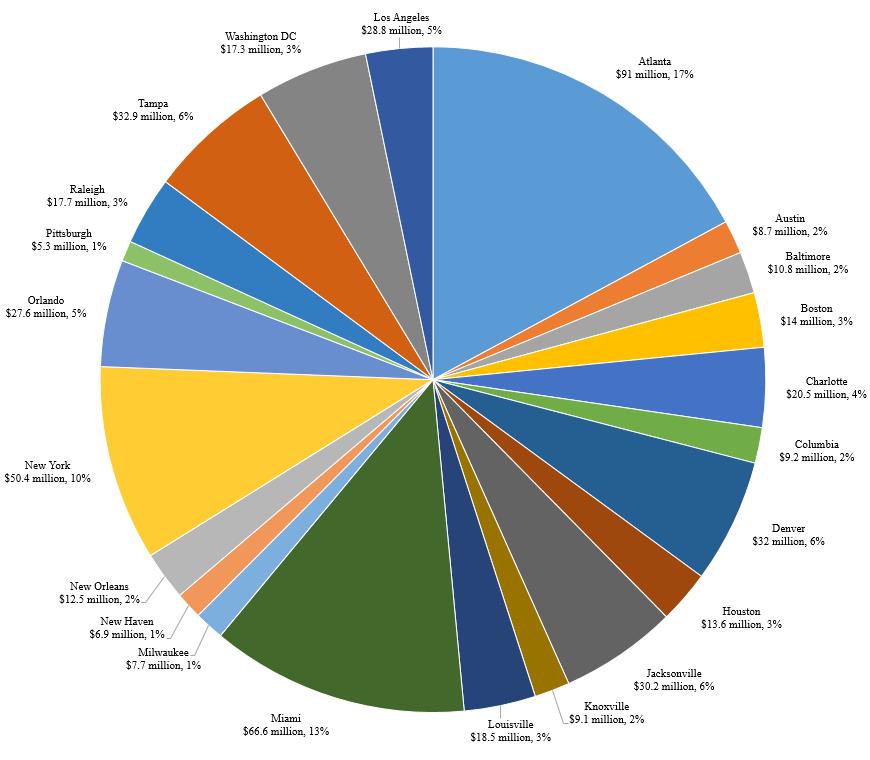
Third Quarter 2017 16
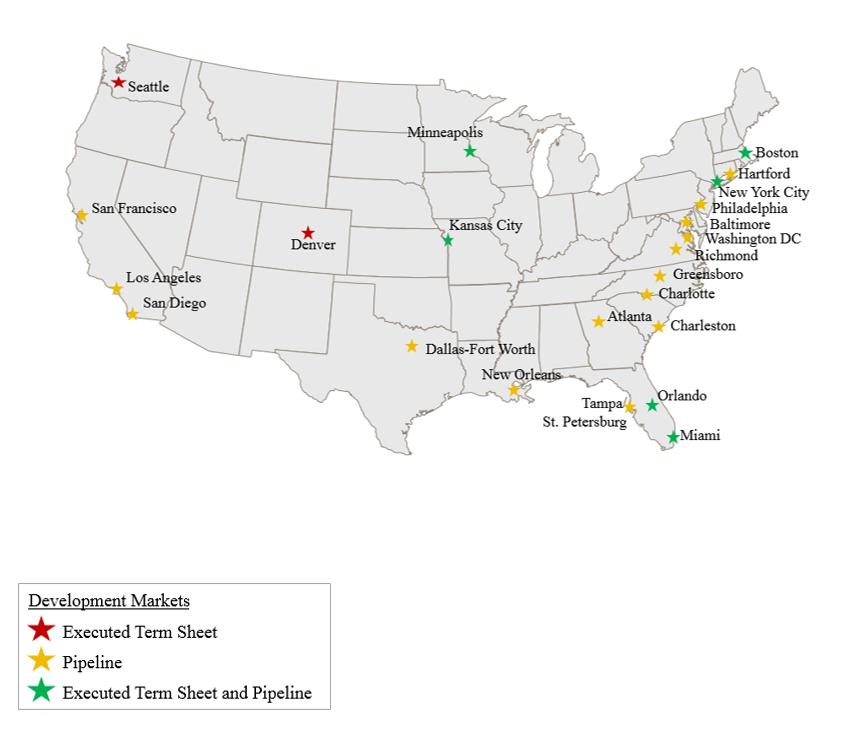
Investment Pipeline by Geography
| | |
| | Executed term sheets for investments in 14 separate self-storage development projects for an aggregate capital commitment of approximately $186 million |
| | |
| | Maintains a robust pipeline in excess of $700 million of additional development investment opportunities in top 50 markets |
Third Quarter 2017 17
Jernigan Capital, Inc.
Company Information
| | | |
Corporate Headquarters | Trading Symbol | Investor Relations | Information Requests |
6410 Poplar Avenue | Common shares: JCAP | 6410 Poplar Avenue | To request an Investor Relations |
Suite 650 | Stock Exchange Listing | Suite 650 | package or annual report, please |
Memphis, TN 38119 | New York Stock Exchange | Memphis, TN 38119 | visit our website at |
901.567.9510 | | 901.567.9510 | www.jernigancapital.com |
Executive Management
| |
Dean Jernigan | John A. Good |
Chairman and Chief Executive Officer | President and Chief Operating Officer |
| |
Kelly P. Luttrell | |
Senior Vice President, Chief Financial Officer, and Treasurer | |
Independent Directors
| |
Mark O. Decker | James D. Dondero |
Director | Director |
| |
Howard A. Silver | Harry J. Thie |
Director | Director |
Equity Research Coverage
| |
Baird Equity Research | FBR Capital Markets |
RJ Milligan | David Corak |
rjmilligan@rwbaird.com | dcorak@fbr.com |
| |
Jefferies LLC | KeyBanc Capital Markets |
George Hoglund | Todd M. Thomas |
gholund@jefferies.com | tthomas@key.com |
| |
Raymond James & Associates | |
Jonathan Hughes | |
jonathan.hughes@raymondjames.com | |
Any opinions, estimates, forecasts or predictions regarding Jernigan Capital’s performance made by these analysts are theirs alone and do not represent opinions, estimates, forecasts or predictions of Jernigan Capital or its management. Jernigan Capital does not by its reference above or distribution imply its endorsement of or concurrence with such opinions, estimates, forecasts or predictions.
Third Quarter 2017 18