Table of Contents
First Quarter 2018  1
1
Forward Looking Statements
This Supplemental Information package contains forward-looking statements within the meaning of the Private Securities Litigation Reform Act of 1995 (set forth in Section 27A of the Securities Act of 1933, as amended (the “Securities Act”) and Section 21E of the Securities Exchange Act of 1934, as amended (the “Exchange Act”)). These forward-looking statements include, without limitation, statements about our estimates, expectations, predictions and forecasts of our future business plans and financial and operating performance and/or results, including our second quarter and full-year 2018 earnings guidance, our ability to successfully source, structure, negotiate and close investments in self-storage facilities, our ability to fund our outstanding future investment commitments, the availability, terms and our rate of deployment of equity capital and our ability to increase borrowing base of our credit facility, as well as statements of management’s goals and objectives and other similar expressions concerning matters that are not historical facts. When we use the words “may,” “should,” “could,” “would,” “predicts,” “potential,” “continue,” “expects,” “anticipates,” “future,” “intends,” “plans,” “believes,” “estimates” or similar expressions or their negatives, as well as statements in future tense, we intend to identify forward-looking statements. Although we believe that the expectations reflected in such forward-looking statements are based upon reasonable assumptions, beliefs and expectations, such forward-looking statements are not predictions of future events or guarantees of future performance and our actual financial and operating results could differ materially from those set forth in the forward-looking statements. Some factors that might cause such differences are described in the section entitled “Risk Factors” in our most recent Annual Report on Form 10-K for the year ended December 31, 2017, and those set forth in our other reports and information filed with the Securities and Exchange Commission (“SEC”), which factors include, without limitation, the following:
| | |
| | our ability to successfully source, structure, negotiate and close investments in self-storage facilities; |
| | changes in our business strategy and the market’s acceptance of our investment terms; |
| | our ability to fund our outstanding and future investment commitments; |
| | our ability to obtain certificates of occupancy at the facilities in which we invest; |
| | the future availability for borrowings under our credit facility (including borrowing base capacity and the availability of the accordion feature); |
| | availability, terms and our rate of deployment of equity and debt capital; |
| | our manager’s ability to hire and retain qualified personnel; |
| | changes in the self-storage industry, interest rates or the general economy; |
| | the degree and nature of our competition; |
| | volatility in the value of our assets carried at fair market value; |
| | potential limitations on our ability to pay dividends at historical rates; |
| | limitations in our existing and future debt agreements on our ability to pay distributions; |
| | the impact of our outstanding preferred stock on our ability to execute our business plan and pay distributions on our common stock; and |
| | general volatility of the capital markets and the market price of our common stock. |
Given these uncertainties, undue reliance should not be placed on our forward-looking statements. We assume no duty or responsibility to publicly update or revise any forward-looking statement that may be made to reflect future events or circumstances or to reflect the occurrence of unanticipated events. We urge you to review the disclosures concerning risks in the sections entitled “Risk Factors” and “Management’s Discussion and Analysis of Financial Condition and Results of Operations” in our most recent Annual Report on Form 10-K for the year ended December 31, 2017 and in other documents that we file from time-to-time with the SEC.
Non-GAAP Financial Measures
Adjusted Earnings is a non-GAAP measure and is defined as net income attributable to common stockholders plus stock dividends payable to preferred stockholders, stock-based compensation expense, depreciation and amortization on real estate assets, loss on modification of debt, and other expenses. Management uses Adjusted Earnings and Adjusted Earnings per diluted share as key performance indicators in evaluating the operations of the Company's business. The Company is a capital provider to self-storage developers and believes that these measures are useful to management and investors as a starting point in measuring its operational performance because they exclude various equity-based payments (including stock dividends) and other items included in net income that do not relate to or are not indicative of its present and future operating performance, which can make periodic and peer analyses of operating performance more difficult. The Company’s computation of Adjusted Earnings and Adjusted Earnings per share may not be comparable to other key performance indicators reported by other REITs or real estate companies. Reconciliations of Adjusted Earnings and Adjusted Earnings per share to Net income attributable to common stockholders and Earnings per share, respectively, are provided in the attached table entitled “Calculation of Adjusted Earnings.”
First Quarter 2018 2
Press Release – May 2018
Jernigan Capital Reports Record First Quarter Results Above Guidance Range
- Reiterates 2018 Earnings per Share and Adjusted Earnings per Share Guidance -
MEMPHIS, Tennessee, May 2, 2018 / Business Wire / Jernigan Capital, Inc. (NYSE: JCAP), a leading capital partner for self-storage entrepreneurs nationwide, today announced results for the quarter ended March 31, 2018, initiated earnings per share and adjusted earnings per share guidance for the second quarter 2018 and reiterated its guidance for full year 2018.
First Quarter Highlights include:
| § | | Quarterly earnings per share and adjusted earnings per share of $0.12 and $0.36, respectively, or $0.15 and $0.17 above the top end of the Company’s quarterly guidance ranges provided with its fourth quarter 2017 earnings release due primarily to additional fair value gains recognized during the quarter; |
| § | | Increased book value per common share to $18.35 at March 31, 2018 from $17.57 at March 31, 2017; and |
| § | | Closed two new on-balance sheet development investments and five new bridge investments during the quarter for a combined total commitment amount of $108.2 million, plus $25.3 million of additional development investments subsequent to quarter end. |
“JCAP is off to an exceptional start in 2018,” stated Dean Jernigan, Chairman and Chief Executive Officer of Jernigan Capital, Inc. “We have followed a record year of development commitments in 2017 with $133.5 million of capital commitments to date in 2018, or 62% of the midpoint of our annual investment guidance, including our initial $83 million bridge refinancing project announced early in the year. Through our traditional development investments and our new bridge refinancing investment, we continue to build a portfolio of state-of-the-art Generation V self-storage development projects in the best micro-markets in some of the best submarkets in the country. We have also launched the next stage of the company’s life cycle, acquiring 100% of developer interests in four development investments during the quarter, which we believe will be the first of many such purchases as we progress toward our oft-stated goal to ultimately own self-storage developments we have financed.”
John Good, President and Chief Operating Officer of Jernigan Capital, Inc. added, “During the quarter, we achieved year-over-year growth in total revenues of 127% and adjusted EPS of 71%. Our 19 development and wholly-owned assets under lease up continue to outperform. Moreover, we received certificates of occupancy on two projects, one in Raleigh, North Carolina and the other in Jacksonville, Florida, while we had forecast only one Certificate of Occupancy during the quarter. Our development investment pipeline stands at approximately $450 million today, intentionally down from prior highs as we look to meticulously underwrite and develop only the best sites in underserved submarkets while transitioning into the property ownership chapter of our Company’s life. Looking forward, we are confident that our innovative investment approach positions us to take advantage of each stage of the real estate cycle.
“From a capital perspective, we continue to be extremely focused on maximizing stockholder value by properly matching investments with the optimal capital sources for those investments, and this will remain a top priority for us in 2018.” Mr. Good added, “We are very excited to have added David Corak to our executive team as Senior Vice President of Corporate Finance. David is very highly regarded in the investment community for his past sell-side self-storage research, as well as his knowledge of and work in our sector. David’s experience, capital markets expertise and industry knowledge should serve us well as the company continues to execute its growth strategy.”
Financial Highlights
Net income attributable to common stockholders for the three months ended March 31, 2018 was $1.8 million, or $0.12 per share, and adjusted earnings were $5.2 million, or $0.36 per share, representing increases of $0.5 million, or 42%, and $3.3 million, or 171%, over the $1.2 million and $1.9 million of earnings and adjusted earnings, respectively, reported for the first quarter of 2017.
Total revenues for the three months ended March 31, 2018 were $5.2 million, representing an increase of $2.9 million, or 127% over revenues for the comparable period in 2017. The increase in revenues is primarily attributed to the increase in the outstanding principal balances on the Company’s investment portfolio.
General and administrative expenses for the three months ended March 31, 2018 were $1.8 million, compared to $1.6 million reported for the comparable 2017 period. Included in these amounts were stock-based compensation expense (“SBE”) of $0.4 million and $0.3 million for the three months ended March 31, 2018 and 2017, respectively. The increase in SBE was primarily due to additional restricted stock grants to certain officers and employees of the Company’s external manager during the second quarter of 2017.
First Quarter 2018 3
The Company also incurred other expenses of $0.3 million during the three months ended March 31, 2018 in conjunction with the termination of an employee contract with an employee of the Company’s external manager.
Net income attributable to common stockholders and adjusted earnings for the three months ended March 31, 2018 also include increases in the fair value of investments of $4.3 million compared to $1.4 million for the comparable period in 2017, a $2.9 million, or 210%, year-over-year increase. During 2017 the Company consummated 32 on-balance sheet development investments totaling $408.8 compared to three on-balance sheet development investments totaling $25.6 million in 2016. The substantial increase in on-balance sheet development investments in 2017 prompted the Company to issue guidance for increases in fair value of investments in the range of $41.0 to $47.0 million for the full year 2018, compared to $10.8 million of increases in actual fair value increases reported for the full year 2017, and also positioned the Company to earn the $4.3 million increase in fair value reported above. The Company’s first quarter change in fair value of investments exceeded its first quarter guidance range of $1.5 million to $2.0 million due to the following factors:
| § | | approximately $0.9 million due primarily to better than expected construction progress during the latter half of the quarter above what was forecast, including the attainment of two certificates of occupancy as compared to the one certificate of occupancy projected at the time first quarter guidance was issued; |
| § | | approximately $0.9 million due to a smaller impact from rising interest rates during the first quarter than initially forecast, as the yield curve flattened during the latter part of the quarter rather than expanding in correlation with the federal funds rate increase in late March; and |
| § | | approximately $0.9 million from fair value changes related to the bridge refinancing investments closed in early March in excess of forecast changes, approximately half of which was attributable to interest rate decreases from the time the initial $76.9 million of principal was funded on March 2, 2018 until the end of the quarter. |
See the Second Quarter Guidance Discussion section below for further discussion regarding fair value guidance for the balance of the year.
Capital Markets Activities
On March 29, 2018, the Company entered into a Distribution Agreement with an investment bank pursuant to which the Company may issue and sell in at-the-market transactions up to an additional $45.0 million of its Series B Preferred Stock from time to time (the “Preferred Stock ATM Program”). No shares were sold under the Preferred Stock ATM Program during the three months ended March 31, 2018. Subsequent to March 31, 2018, the Company issued and sold 38,214 shares of Series B preferred stock at a weighted average price of $23.07, receiving net proceeds after commissions and other offering costs of $0.8 million. Including the 1,500,000 shares of Series B preferred stock issued in January 2018 at a price of $25.00 per share, the Company’s weighted average price per share of Series B preferred stock issued is $24.95 per share. As of May 2, 2018, the Company has approximately $44.1 million available for issuance under the Preferred Stock ATM Program.
As of March 31, 2018, the Company had issued 75,000 shares of its Series A Preferred Stock and received $75.0 million in proceeds pursuant to the terms of a purchase agreement between the Company and Highland Capital Management (the “Purchase Agreement”). On April 9, 2018, the Company issued an additional 15,000 shares of the Series A Preferred Stock and received an additional $15.0 million in proceeds pursuant to the terms of the Purchase Agreement. Accordingly, as of May 2, 2018, the Company has $35.0 million available for issuance under the Purchase Agreement.
As of March 31, 2018, the Company had $30.0 million outstanding under its secured revolving credit facility of its $40.8 million in total availability. The Company expects such availability to increase over the balance of 2018 as the Company’s on-balance sheet self-storage investments continue to achieve certificates of occupancy and commence lease-up.
The Company did not issue or sell any shares of common stock under its common stock at-the-market program (the “Common Stock ATM Program”) between January 1, 2018 and May 2, 2018. As of May 2, 2018, the Company has approximately $21.4 million of its common stock available for issuance under the Common Stock ATM Program.
Dividends
On February 28, 2018, the Company declared cash and stock dividends on its Series A Preferred Stock. The cash dividend of $0.4 million was paid on April 13, 2018 to holders of record on April 1, 2018. A stock dividend of 2,222 shares of common stock was issued on April 13, 2018 to holders of record on April 1, 2018 for an aggregate value of $44,000 pursuant to the terms of the Stock Purchase Agreement.
On February 28, 2018, the Company declared a cash dividend on its Series B Preferred Stock. The cash dividend of $0.6 million was paid on April 13, 2018 to holders of record on April 2, 2018.
First Quarter 2018 4
Additionally, on February 28, 2018, the Company declared a dividend of $0.35 per common share. The dividend was paid on April 13, 2018 to common stockholders of record on April 2, 2018.
Second Quarter 2018 Guidance
The following table reflects earnings per share and adjusted earnings per share guidance ranges for the three months ending June 30, 2018. Such guidance is based on management's current expectations of Company investment activity (including fair value appreciation and the expected timing of construction progress and receipts of certificates of occupancy), the operational and new supply dynamics of the self-storage markets in which the Company has invested, and overall economic conditions. Adjusted earnings is a performance measure that is not specifically defined by accounting principles generally accepted in the United States (“GAAP”) and is defined as net income attributable to common stockholders (computed in accordance with GAAP) plus stock dividends payable to preferred stockholders, stock-based compensation expense, depreciation and amortization on real estate assets, and other expenses. For more information about our calculation of adjusted earnings, see “Non-GAAP Financial Measures” below.
| | | | | | |
| | | | | | |
| | Dollars in thousands, |
| | except share and per share data |
| | Three months ending |
| | June 30, 2018 |
| | Low | | High |
Interest income from investments | | $ | 6,050 | | $ | 6,150 |
Rental revenue from real estate owned | | | 780 | | | 800 |
Other income | | | 20 | | | 25 |
Total revenues | | $ | 6,850 | | $ | 6,975 |
G&A expenses (1) | | | (3,855) | | | (3,640) |
Property operating expenses (excl. depreciation and amortization) | | | (440) | | | (410) |
Depreciation and amortization on real estate assets | | | (900) | | | (885) |
Interest expense | | | (775) | | | (725) |
JV income | | | 500 | | | 530 |
Other interest income | | | 25 | | | 30 |
Change in fair value of investments (2) | | | 6,000 | | | 8,000 |
Net income | | | 7,405 | | | 9,875 |
Net income attributable to preferred stockholders (3) | | | (4,700) | | | (4,665) |
Net income attributable to common stockholders | | | 2,705 | | | 5,210 |
Add: stock dividends | | | 2,125 | | | 2,125 |
Add: stock-based compensation | | | 675 | | | 625 |
Add: depreciation and amortization on real estate assets | | | 900 | | | 885 |
Adjusted earnings | | $ | 6,405 | | $ | 8,845 |
Earnings per share – diluted | | $ | 0.18 | | $ | 0.35 |
Adjusted earnings per share - diluted | | $ | 0.43 | | $ | 0.60 |
Average shares outstanding - diluted | | | 14,800,000 | | | 14,800,000 |
| |
(1) | Includes $1.8 million (low) / $1.6 million (high) of fees due to the Manager for the three months ending June 30, 2018. |
(2) | Excludes $0.3 million (low) / $0.4 million (high) of unrealized appreciation in fair value of investments from the real estate venture which is included in JV income for the three months ending June 30, 2018. |
(3) | Represents both cash dividends and stock dividends (which stock dividends will be paid out in either shares of the Company’s common stock or additional shares of Series A Preferred Stock, at the option of the Series A stockholders) estimated with respect to shares of Series A Preferred Stock, as well as cash dividends estimated with respect to shares of Series B Preferred Stock. |
The Company is also reaffirming its previously issued guidance for full year 2018. Net income attributable to common stockholders is expected to be between $1.76 and $2.54 per share, and adjusted earnings is expected to be between $2.68 and $3.43 per share.
Additionally, the Company continues to monitor its 2018 fair value guidance with updated estimates of construction progress and timing of the receipt of certificates of occupancy from its development partners. Of the estimated $41.0 million to $47.0 million of fair value appreciation in 2018, the Company recognized $4.3 million in the first quarter and expects $6.0 million to $8.0 million to be recognized in the second quarter, $13.1 million to $14.9 million to be recognized in the third quarter, and $17.6 million to $19.8 million to be recognized in the fourth quarter. Timing of fair value appreciation is heavily dependent upon construction progress and the timing of receipt of certificates of occupancy, both of which are subject to factors outside the control of the Company’s development partners. As such, the exact timing of fair value recognition is subject to change.
Refer to the Company’s First Quarter 2018 Supplemental Information Package for more information.
First Quarter 2018 5
Jernigan Capital, Inc.
Financial Highlights- Trailing Five Quarters
(unaudited, in thousands, except share and per share data)
| | | | | | | | | | | | | | | |
| | | | | | | | | | | | | | | |
| | Three months ended |
| | March 31, | | December 31, | | September 30, | | June 30, | | March 31, |
| | 2018 | | 2017 | | 2017 | | 2017 | | 2017 |
Operating Data: | | | | | | | | | | | | | | | |
Interest income, rental-related income and other revenues | | $ | 5,216 | | $ | 3,930 | | $ | 3,361 | | $ | 2,599 | | $ | 2,301 |
JV income | | | 550 | | | 516 | | | 730 | | | 595 | | | 422 |
Total revenues and JV income | | | 5,766 | | | 4,446 | | | 4,091 | | | 3,194 | | | 2,723 |
General & administrative expenses | | | (3,122) | | | (2,597) | | | (2,422) | | | (2,078) | | | (2,208) |
Property operating expenses of real estate owned | | | (311) | | | (83) | | | (114) | | | (43) | | | (31) |
Depreciation and amortization of real estate owned | | | (702) | | | (238) | | | (172) | | | (38) | | | (24) |
Interest expense | | | (416) | | | (296) | | | (323) | | | (230) | | | (204) |
Loss on modification of debt | | | - | | | - | | | (232) | | | - | | | - |
Other expenses | | | (290) | | | - | | | - | | | - | | | - |
Subtotal | | | 925 | | | 1,232 | | | 828 | | | 805 | | | 256 |
Change in fair value of investments | | | 4,320 | | | 1,738 | | | 3,384 | | | 4,289 | | | 1,393 |
Other interest income | | | 109 | | | 155 | | | 245 | | | 100 | | | 134 |
Net income | | | 5,354 | | | 3,125 | | | 4,457 | | | 5,194 | | | 1,783 |
Net income attributable to preferred stockholders | | | (3,595) | | | (423) | | | (310) | | | (177) | | | (546) |
Net income attributable to common stockholders | | $ | 1,759 | | $ | 2,702 | | $ | 4,147 | | $ | 5,017 | | $ | 1,237 |
Plus: stock dividends payable to preferred stockholders | | | 2,125 | | | 44 | | | 132 | | | - | | | 371 |
Plus: stock-based compensation | | | 345 | | | 272 | | | 296 | | | 435 | | | 292 |
Plus: depreciation and amortization on real estate assets | | | 702 | | | 238 | | | 172 | | | 38 | | | 24 |
Plus: loss on modification of debt | | | - | | | - | | | 232 | | | - | | | - |
Plus: other expenses | | | 290 | | | - | | | - | | | - | | | - |
Adjusted Earnings | | $ | 5,221 | | $ | 3,256 | | $ | 4,979 | | $ | 5,490 | | $ | 1,924 |
| | | | | | | | | | | | | | | |
Basic earnings per share attributable to common stockholders | | $ | 0.12 | | $ | 0.19 | | $ | 0.29 | | $ | 0.50 | | $ | 0.14 |
Diluted earnings per share attributable to common stockholders | | $ | 0.12 | | $ | 0.19 | | $ | 0.29 | | $ | 0.50 | | $ | 0.14 |
| | | | | | | | | | | | | | | |
Adjusted Earnings per share attributable to common stockholders - diluted | | $ | 0.36 | | $ | 0.23 | | $ | 0.35 | | $ | 0.55 | | $ | 0.21 |
| | | | | | | | | | | | | | | |
Dividends declared per share of common stock | | $ | 0.35 | | $ | 0.35 | | $ | 0.35 | | $ | 0.35 | | $ | 0.35 |
| | | | | | | | | | | | | | | |
Weighted-average shares of common stock outstanding: | | | | | | | | | | | | | | | |
Basic | | | 14,247,174 | | | 14,108,415 | | | 14,042,350 | | | 9,850,967 | | | 8,857,030 |
Diluted | | | 14,555,337 | | | 14,295,639 | | | 14,244,345 | | | 10,033,029 | | | 8,993,528 |
Shares of common stock outstanding: | | | 14,447,043 | | | 14,429,055 | | | 14,235,848 | | | 14,238,350 | | | 8,997,707 |
| | | | | | | | | | | | | | | |
Balance Sheet Data: | | | | | | | | | | | | | | | |
Cash and cash equivalents | | $ | 15,238 | | $ | 46,977 | | $ | 54,999 | | $ | 100,529 | | $ | 28,252 |
Development property investments at fair value | | | 239,754 | | | 228,233 | | | 188,540 | | | 163,979 | | | 117,936 |
Bridge loan investments at fair value | | | 77,435 | | | - | | | - | | | - | | | - |
Operating property loans at fair value | | | 5,885 | | | 5,938 | | | 5,990 | | | 8,790 | | | 9,965 |
Self-storage real estate owned, net | | | 60,459 | | | 15,355 | | | 15,594 | | | 7,283 | | | 7,350 |
Investment in and advances to self-storage real estate venture | | | 14,759 | | | 13,856 | | | 12,573 | | | 14,314 | | | 10,812 |
Total assets | | | 417,252 | | | 314,634 | | | 284,193 | | | 305,127 | | | 192,429 |
Senior loan participations | | | 732 | | | 718 | | | 668 | | | 20,147 | | | 19,299 |
Secured revolving credit facility | | | 30,000 | | | - | | | - | | | - | | | - |
Total liabilities | | | 43,944 | | | 8,814 | | | 8,434 | | | 28,733 | | | 24,873 |
Total equity | | | 373,308 | | | 305,820 | | | 275,759 | | | 276,394 | | | 167,556 |
Common book value / common shares outstanding | | $ | 18.35 | | $ | 18.58 | | $ | 18.71 | | $ | 18.75 | | $ | 17.57 |
First Quarter 2018 6
Jernigan Capital, Inc.
Consolidated Balance Sheets- Trailing Five Quarters
(unaudited, in thousands)
| | | | | | | | | | | | | | | |
| | | | | | | | | | | | | | | |
| | As of |
| | March 31, | | December 31, | | September 30, | | June 30, | | March 31, |
| | 2018 | | 2017 | | 2017 | | 2017 | | 2017 |
Assets: | | | | | | | | | | | | | | | |
Cash and cash equivalents | | $ | 15,238 | | $ | 46,977 | | $ | 54,999 | | $ | 100,529 | | $ | 28,252 |
Self-Storage Investment Portfolio: | | | | | | | | | | | | | | | |
Development property investments at fair value | | | 239,754 | | | 228,233 | | | 188,540 | | | 163,979 | | | 117,936 |
Bridge loan investments at fair value | | | 77,435 | | | - | | | - | | | - | | | - |
Operating property loans at fair value | | | 5,885 | | | 5,938 | | | 5,990 | | | 8,790 | | | 9,965 |
Self-storage real estate owned, net | | | 60,459 | | | 15,355 | | | 15,594 | | | 7,283 | | | 7,350 |
Investment in and advances to self-storage real estate venture | | | 14,759 | | | 13,856 | | | 12,573 | | | 14,314 | | | 10,812 |
Other loans, at cost | | | 1,103 | | | 1,313 | | | 1,754 | | | 6,619 | | | 14,826 |
Deferred financing costs | | | 1,565 | | | 2,004 | | | 3,813 | | | 2,305 | | | 2,294 |
Prepaid expenses and other assets | | | 884 | | | 776 | | | 734 | | | 1,119 | | | 809 |
Fixed assets, net | | | 170 | | | 182 | | | 196 | | | 189 | | | 185 |
Total assets | | $ | 417,252 | | $ | 314,634 | | $ | 284,193 | | $ | 305,127 | | $ | 192,429 |
| | | | | | | | | | | | | | | |
Liabilities: | | | | | | | | | | | | | | | |
Senior loan participations | | $ | 732 | | $ | 718 | | $ | 668 | | $ | 20,147 | | $ | 19,299 |
Secured revolving credit facility | | | 30,000 | | | - | | | - | | | - | | | - |
Due to Manager | | | 1,405 | | | 1,484 | | | 1,438 | | | 1,027 | | | 839 |
Accounts payable, accrued expenses and other liabilities | | | 3,155 | | | 1,138 | | | 1,035 | | | 2,399 | | | 1,040 |
Dividends payable | | | 8,652 | | | 5,474 | | | 5,293 | | | 5,160 | | | 3,695 |
Total liabilities | | $ | 43,944 | | $ | 8,814 | | $ | 8,434 | | $ | 28,733 | | $ | 24,873 |
| | | | | | | | | | | | | | | |
Equity: | | | | | | | | | | | | | | | |
Series A Cumulative preferred stock | | $ | 72,181 | | $ | 37,764 | | $ | 9,445 | | $ | 9,445 | | $ | 9,446 |
Series B Cumulative preferred stock | | | 35,988 | | | - | | | - | | | - | | | - |
Common stock | | | 144 | | | 144 | | | 142 | | | 142 | | | 90 |
Additional paid-in capital | | | 277,194 | | | 276,814 | | | 272,726 | | | 272,525 | | | 163,772 |
Accumulated deficit | | | (12,199) | | | (8,902) | | | (6,554) | | | (5,718) | | | (5,752) |
Total equity | | | 373,308 | | | 305,820 | | | 275,759 | | | 276,394 | | | 167,556 |
Total liabilities and equity | | $ | 417,252 | | $ | 314,634 | | $ | 284,193 | | $ | 305,127 | | $ | 192,429 |
First Quarter 2018 7
Jernigan Capital, Inc.
Consolidated Statements of Operations
(unaudited, in thousands, except per share data)
| | | | | | |
| | Three months ended |
| | March 31, |
| | 2018 | | 2017 |
Revenues: | | | | | | |
Interest income from investments | | $ | 4,562 | | $ | 2,119 |
Rental and other property-related income from real estate owned | | | 623 | | | 63 |
Other revenues | | | 31 | | | 119 |
Total revenues | | | 5,216 | | | 2,301 |
| | | | | | |
Costs and expenses: | | | | | | |
General and administrative expenses | | | 1,818 | | | 1,578 |
Management fees to Manager | | | 1,304 | | | 630 |
Property operating expenses of real estate owned | | | 311 | | | 31 |
Depreciation and amortization of real estate owned | | | 702 | | | 24 |
Other expenses | | | 290 | | | - |
Total costs and expenses | | | 4,425 | | | 2,263 |
| | | | | | |
Operating income | | | 791 | | | 38 |
| | | | | | |
Other income (expense): | | | | | | |
Equity in earnings from unconsolidated real estate venture | | | 550 | | | 422 |
Change in fair value of investments | | | 4,320 | | | 1,393 |
Interest expense | | | (416) | | | (204) |
Other interest income | | | 109 | | | 134 |
Total other income | | | 4,563 | | | 1,745 |
Net income | | | 5,354 | | | 1,783 |
Net income attributable to preferred stockholders | | | (3,595) | | | (546) |
Net income attributable to common stockholders | | $ | 1,759 | | $ | 1,237 |
| | | | | | |
Basic earnings per share attributable to common stockholders | | $ | 0.12 | | $ | 0.14 |
Diluted earnings per share attributable to common stockholders | | $ | 0.12 | | $ | 0.14 |
| | | | | | |
Dividends declared per share of common stock | | $ | 0.35 | | $ | 0.35 |
First Quarter 2018 8
Jernigan Capital, Inc.
Calculation of Adjusted Earnings and Reconciliation to Net Income Attributable to
Common Stockholders
(unaudited, in thousands, except share and per share data)
| | | | | | | | | | | | | | | |
| | | | | | | | | | | | | | | |
| | Three months ended |
| | March 31, | | December 31, | | September 30, | | June 30, | | March 31, |
| | 2018 | | 2017 | | 2017 | | 2017 | | 2017 |
| | | | | | | | | | | | | | | |
Net income attributable to common stockholders | | $ | 1,759 | | $ | 2,702 | | $ | 4,147 | | $ | 5,017 | | $ | 1,237 |
Plus: stock dividends payable to preferred stockholders | | | 2,125 | | | 44 | | | 132 | | | - | | | 371 |
Plus: stock-based compensation | | | 345 | | | 272 | | | 296 | | | 435 | | | 292 |
Plus: depreciation and amortization on real estate assets | | | 702 | | | 238 | | | 172 | | | 38 | | | 24 |
Plus: loss on modification of debt | | | - | | | - | | | 232 | | | - | | | - |
Plus: other expenses | | | 290 | | | - | | | - | | | - | | | - |
Adjusted Earnings | | $ | 5,221 | | $ | 3,256 | | $ | 4,979 | | $ | 5,490 | | $ | 1,924 |
Adjusted Earnings per share attributable to common stockholders - diluted | | $ | 0.36 | | $ | 0.23 | | $ | 0.35 | | $ | 0.55 | | $ | 0.21 |
Weighted average shares of common stock outstanding - diluted | | | 14,555,337 | | | 14,295,639 | | | 14,244,345 | | | 10,033,029 | | | 8,993,528 |
First Quarter 2018 9
Jernigan Capital, Inc.
Second Quarter and Full Year 2018 Guidance
(in thousands, except share and per share data)
| | | | | | | | | | | | |
| | | | | | | | | | | | |
| | Three months ending | | Year ending |
| | June 30, 2018 | | December 31, 2018 |
| | Low | | High | | Low | | High |
Interest income from investments | | $ | 6,050 | | $ | 6,150 | | $ | 25,200 | | $ | 26,700 |
Rental revenue from real estate owned | | | 780 | | | 800 | | | 3,100 | | | 3,300 |
Other income | | | 20 | | | 25 | | | 80 | | | 100 |
Total revenues | | $ | 6,850 | | $ | 6,975 | | $ | 28,380 | | $ | 30,100 |
G&A expenses (1) | | | (3,855) | | | (3,640) | | | (15,000) | | | (13,500) |
Property operating expenses (excl. depreciation and amortization) | | | (440) | | | (410) | | | (1,600) | | | (1,500) |
Depreciation and amortization on real estate assets | | | (900) | | | (885) | | | (3,600) | | | (3,300) |
Interest expense | | | (775) | | | (725) | | | (4,800) | | | (4,000) |
JV income | | | 500 | | | 530 | | | 1,400 | | | 1,900 |
Other interest income | | | 25 | | | 30 | | | 150 | | | 200 |
Change in fair value of investments (2) | | | 6,000 | | | 8,000 | | | 41,000 | | | 47,000 |
Net income | | | 7,405 | | | 9,875 | | | 45,930 | | | 56,900 |
Net income attributable to preferred stockholders (3) | | | (4,700) | | | (4,665) | | | (19,000) | | | (18,000) |
Net income attributable to common stockholders | | | 2,705 | | | 5,210 | | | 26,930 | | | 38,900 |
Add: stock dividends | | | 2,125 | | | 2,125 | | | 8,500 | | | 8,500 |
Add: stock-based compensation | | | 675 | | | 625 | | | 2,000 | | | 1,800 |
Add: depreciation and amortization on real estate assets | | | 900 | | | 885 | | | 3,600 | | | 3,300 |
Adjusted earnings | | $ | 6,405 | | $ | 8,845 | | $ | 41,030 | | $ | 52,500 |
Earnings per share – diluted | | $ | 0.18 | | $ | 0.35 | | $ | 1.76 | | $ | 2.54 |
Adjusted earnings per share - diluted | | $ | 0.43 | | $ | 0.60 | | $ | 2.68 | | $ | 3.43 |
Average shares outstanding - diluted | | | 14,800,000 | | | 14,800,000 | | | 15,300,000 | | | 15,300,000 |
| |
(1) | Includes $1.8 million (low) / $1.6 million (high) and $7.0 million (low) / $6.2 million (high) of fees due to the Manager for the three months ending June 30, 2018 and for the year ending December 31, 2018, respectively. |
(2) | Excludes $0.3 million (low) / $0.4 million (high) and $0.8 million (low) / $1.2 million (high) of unrealized appreciation in fair value of investments from the real estate venture which is included in JV income for the three months ending June 30, 2018 and for the year ending December 31, 2018, respectively. |
(3) | Represents both cash dividends and stock dividends (which stock dividends will be paid out in either shares of the Company’s common stock or additional shares of Series A Preferred Stock, at the option of the Series A stockholders) estimated with respect to shares of Series A Preferred Stock, as well as cash dividends estimated with respect to shares of Series B Preferred Stock. |
Full-Year Key Assumptions:
| § | | Projected closings on $200 million to $230 million of new self-storage investments with a profits interest for the full-year 2018, including the aforementioned approximately $83 million bridge loan investment closed on March 2, 2018 ($133.5 million closed as of May 1, 2018 and $73.0 million subject to non-binding term sheets with projected closing in 2018); |
| § | | Fundings of approximately $300 million to $340 million on the Company’s closed and projected investment commitments during the full-year 2018 ($120.8 million as of March 31, 2018); and |
| § | | Acquisition of 100% of developer interests in the Company’s Jacksonville 1, Atlanta 1, Atlanta 2, and Pittsburgh development investments in January and February 2018, resulting in a total of five wholly-owned self-storage facilities in 2018. |
| § | | Guidance ranges assume 2018 investment fundings and commitments are financed with long-term capital, with specific impact on 2018 earnings dependent upon the amount, timing, cost, and form of capital raised. |
| · | | Specific assumptions included in guidance are as follows: |
| ž | | Proceeds of $85.0 million from the issuance of Series A Preferred Stock during the first seven months of 2018, which includes the issuance of $50.0 million of Series A Preferred Stock through May 2, 2018; |
| ž | | Impact of the amendment to the Series A Preferred Stock that was executed during the first quarter of 2018 which had the effect of leveling out the quarterly stock dividend through the second quarter of 2021; |
| ž | | Impact of the issuance of $37.5 million of 7% Series B Cumulative Redeemable Perpetual Preferred Stock in January 2018; and |
| ž | | Utilization of the Company’s credit facility over the course of the year as availability increases (expected borrowing base to secure full $200.0 million by the end of 2018, subject to syndication) with expected borrowings at year-end of $160.0 million to $180.0 million. |
| § | | No change in the key assumptions used to value the Company’s investments other than the assumption of four 25 basis points interest rate increases in 2018. |
| § | | The table below shows the current quarterly expected timing of certificates of occupancy for its development property investments and fair value recognition: |
| | | | | | | |
| | | No. of COs | | Aggregate Commitment | | Fair Value Mid-Point |
First quarter (Actual) | | | 2 | $ | 16,322 | $ | 4,320 |
Second quarter (Expected) | | | 3 | | 32,898 | | 7,000 |
Third quarter (Expected) | | | 6 | | 69,098 | | 14,000 |
Fourth quarter (Expected) | | | 8 | | 93,349 | | 18,680 |
Total | | | 19 | $ | 211,667 | $ | 44,000 |
The Company continues to monitor its 2018 fair value guidance with updated estimates of construction progress and timing of the receipt of certificates of occupancy from its development partners. Timing of fair value appreciation is heavily dependent upon construction progress and the timing of receipt of certificates of occupancy, both of which are subject to factors outside the control of the Company’s development partners. As such, the exact timing of fair value recognition is subject to change.
First Quarter 2018 10
Jernigan Capital, Inc.
Schedule of Owned Properties
As of March 31, 2018
(unaudited, dollars in thousands)
| | | | | | | | | | | | | | | | | | | | | | | | | | | | | | | | | |
| | | | | | | | | | | | | | | | | | | | | | | | | | | | | | | | | |
| | | | | | | | | Fair Value | | | | | | | | | | | | | | | | | | | | | | | |
Location | | | | | | | | | Recognized | | | | | Projected | | Stabilized | | Stabilized | | | | | | | | | |
(MSA) | | Date | | Date | | Cash | | Through Date | | Gross | | Stabilized | | Yield on | | Yield on | | Size | | Months | | % Physical |
Address | | Opened | | Acquired | | Basis (1) | | Acquired | | Basis (2) | | NOI (3) | | Cash Basis | | Gross Basis | | (NRSF) (4) | | Open (5) | | Occupancy (5) |
Orlando 1/2 | | | | | | | | | | | | | | | | | | | | | | | | | | | | | | | | | |
11920 W Colonial Dr. | | 5/1/2016 | | 8/9/2017 | | | 12,047 | | | 3,780 | | | 15,827 | | | 1,095 | | | 9.1 | % | | | 6.9 | % | | | 93,965 | | 24 | | | 69.0 | % |
Atlanta 2 | | | | | | | | | | | | | | | | | | | | | | | | | | | | | | | | | |
340 Franklin Gateway SE | | 5/24/2016 | | 2/2/2018 | | | 8,766 | | | 2,900 | | | 11,666 | | | 759 | | | 8.7 | % | | | 6.5 | % | | | 66,137 | | 23 | | | 72.3 | % |
Atlanta 1 | | | | | | | | | | | | | | | | | | | | | | | | | | | | | | | | | |
5110 McGinnis Ferry Rd | | 5/25/2016 | | 2/2/2018 | | | 10,467 | | | 2,704 | | | 13,171 | | | 864 | | | 8.3 | % | | | 6.6 | % | | | 71,718 | | 23 | | | 66.8 | % |
Jacksonville 1 | | | | | | | | | | | | | | | | | | | | | | | | | | | | | | | | | |
1939 East West Pkwy | | 8/12/2016 | | 1/10/2018 | | | 8,686 | | | 2,947 | | | 11,633 | | | 709 | | | 8.2 | % | | | 6.1 | % | | | 59,848 | | 21 | | | 90.5 | % |
Pittsburgh | | | | | | | | | | | | | | | | | | | | | | | | | | | | | | | | | |
6400 Hamilton Ave | | 5/11/2017 | | 2/20/2018 | | | 7,360 | | | 1,976 | | | 9,336 | | | 688 | | | 9.3 | % | | | 7.4 | % | | | 48,024 | | 12 | | | 29.0 | % |
Total Owned Properties | | | | $ | 47,326 | | $ | 14,307 | | $ | 61,633 | | $ | 4,115 | | | 8.7 | % | | | 6.7 | % | | | | | | | | | |
| | |
| (1) | Cash basis represents the sum of the funded principal balance of the loan (net of unamortized origination fees), cash consideration (inclusive of transaction costs), assumed liabilities, and net property working capital acquired, all as of the date of acquisition. |
| (2) | Gross basis represents cash basis as defined above plus fair value appreciation recognized through the date of acquisition. |
| (3) | Net operating income (NOI) is a non- GAAP financial measure that excludes from operating income the impact of depreciation and general and administrative expense. Projected stabilized NOI represents NOI at an expected time in the future when operations at the facility have stabilized from lease up occupancy and rental rates. |
| (4) | The net rentable square feet (“NRSF”) includes only climate controlled and non-climate controlled storage space. It does not include retail space, office space, non-covered RV space or parking spaces. |
| (5) | As of May 1, 2018. |
First Quarter 2018 11
Jernigan Capital, Inc.
Schedule of Completed Projects
As of March 31, 2018
(unaudited, dollars in thousands)
| | | | | | | | | | | | | | | | | | | | | | | | | | |
| | | | | | | | | | | | | | | | | | | | | | | | | | |
| | Location | | | | | | | | Remaining | | | | | | | | | | | | | | | |
| | (MSA) | | | | | Funded | | Unfunded | | | | | | Size | | Date | | Months | | % Physical |
Closing Date | | Address | | Commitment | | Investment | | Commitment (1) | | Fair Value | | | (NRSF) (2) | | Opened | | Open (3) | | Occupancy (3) |
6/19/2015 | | Tampa 1 | | | | | | | | | | | | | | | | | | | | | | | | |
| | 12832 S US Highway 301 | | | 5,369 | | | 5,285 | | | 84 | | | 5,956 | | | | 50,050 | | 4/11/2016 | | 25 | | | 77.8 | % |
6/29/2015 | | Charlotte 1 | | | | | | | | | | | | | | | | | | | | | | | | |
| | 9323 Wright Hill Rd | | | 7,624 | | | 7,320 | | | 304 | | | 10,242 | | | | 87,430 | | 8/18/2016 | | 21 | | | 50.3 | % |
7/2/2015 | | Milwaukee | | | | | | | | | | | | | | | | | | | | | | | | |
| | 420 W St Paul Ave | | | 7,650 | | | 7,641 | | | 9 | | | 9,283 | | | | 83,258 | | 10/9/2016 | (4) | 19 | | | 44.2 | % |
7/31/2015 | | New Haven | | | | | | | | | | | | | | | | | | | | | | | | |
| | 453 Washington Ave | | | 6,930 | | | 6,563 | | | 367 | | | 8,123 | | | | 64,225 | | 12/16/2016 | | 17 | | | 51.9 | % |
10/27/2015 | | Austin | | | | | | | | | | | | | | | | | | | | | | | | |
| | 251 N AW Grimes Blvd | | | 8,658 | | | 7,422 | | | 1,236 | | | 8,821 | | | | 77,334 | | 3/16/2017 | | 14 | | | 53.0 | % |
1/4/2017 | | New York City 1 | | | | | | | | | | | | | | | | | | | | | | | | |
| | 1775 5th Ave | | | 16,117 | | | 15,591 | | | 526 | | | 19,995 | | | | 105,347 | | 9/29/2017 | | 7 | | | 21.4 | % |
8/14/2015 | | Raleigh | | | | | | | | | | | | | | | | | | | | | | | | |
| | 1501 Sunrise Ave | | | 8,792 | | | 7,320 | | | 1,472 | | | 7,893 | | | | 60,546 | | 3/8/2018 | | 2 | | | 3.9 | % |
11/17/2016 | | Jacksonville 2 | | | | | | | | | | | | | | | | | | | | | | | | |
| | 37 Jefferson Rd | | | 7,530 | | | 5,437 | | | 2,093 | | | 6,689 | | | | 70,930 | | 3/27/2018 | | 1 | | | 6.4 | % |
Total Completed Development Loans | | $ | 68,670 | | $ | 62,579 | | $ | 6,091 | | $ | 77,002 | | | | | | | | | | | | |
| | | | | | | | | | | | | | | | | | | | | | | | | | |
3/2/2018 | | Miami 6 | | | | | | | | | | | | | | | | | | | | | | | | |
| | 590 NW 137th Ave | | | 13,370 | | | 13,161 | | | 209 | | | 16,691 | | | | 76,665 | | 8/12/2016 | | 21 | | | 77.9 | % |
3/2/2018 | | Miami 4 | | | | | | | | | | | | | | | | | | | | | | | | |
| | 1103 SW 3rd Ave | | | 20,201 | | | 19,293 | | | 908 | | | 20,461 | | | | 74,685 | | 10/9/2016 | | 19 | | | 72.5 | % |
3/2/2018 | | Miami 8 | | | | | | | | | | | | | | | | | | | | | | | | |
| | 2434 West 28th Lane | | | 13,553 | | | 12,792 | | | 761 | | | 12,181 | | | | 51,923 | | 12/12/2016 | | 17 | | | 72.4 | % |
3/2/2018 | | Miami 7 | | | | | | | | | | | | | | | | | | | | | | | | |
| | 18460 Pines Blvd | �� | | 18,462 | | | 16,366 | | | 2,096 | | | 14,465 | | | | 85,280 | | 3/26/2018 | | 1 | | | 7.9 | % |
Total Completed Bridge Loans | | $ | 65,586 | | $ | 61,612 | | $ | 3,974 | | $ | 63,798 | | | | | | | | | | | | |
| | | | | | | | | | | | | | | | | | | | | | | | | | |
| | | | | | | | | | | | | | | | | | | | | | | | | | |
Total Completed Projects | | $ | 134,256 | | | | | | | | | | | | | | | | | | | | | |
| | |
| (1) | Commitment is fixed during underwriting at an amount deemed sufficient to cover interest carry and excess operating expenses over rental revenue during lease-up and deferred developer’s fees (if any) payable upon stabilization. Remaining unfunded commitment on completed projects is expected to be utilized primarily for such purposes. To the extent not needed for such purposes, such commitment will not be advanced. |
| | |
| (2) | The net rentable square feet (“NRSF”) includes only climate controlled and non-climate controlled storage space. It does not include retail space, office space, non-covered RV space or parking spaces. |
| | |
| (3) | As of May 1, 2018. |
| (4) | Certificate of Occupancy (“C/O”) was received in August 2016, prior to the property being ready for opening by the manager of the project. Property opened to partial leasing in October 2016. All floors opened to leasing in February 2017. |
| | |
| | |
First Quarter 2018 12
Schedule of Projects in Progress
As of March 31, 2018
(unaudited, dollars in thousands)
| | | | | | | | | | | | | | | | | | | | | |
| | | | | | | | | | | | | | | | | | | | | |
| | Location | | | | | | | | Remaining | | | | | | | | | | Estimated |
| | (MSA) | | | | | Funded | | Unfunded | | | | | Size | | Construction | | C/O |
Closing Date | | Address | | Commitment | | Investment | | Commitment | | Fair Value | | (NRSF) (2) | | Start Date | | Quarter (1) |
9/20/2016 | | Charlotte 2 | | | | | | | | | | | | | | | | | | | |
| | 1200 E 10th St | | | 12,888 | | | 7,448 | | | 5,440 | | | 8,196 | | | 77,915 | | Q1 2017 | | Q3 2018 |
1/18/2017 | | Atlanta 3 | | | | | | | | | | | | | | | | | | | |
| | 1484 Northside Dr NW | | | 14,115 | | | 2,886 | | | 11,229 | | | 2,698 | | | 92,935 | | Q4 2017 | | Q1 2019 |
1/31/2017 | | Atlanta 4 | | | | | | | | | | | | | | | | | | | |
| | 4676 S Atlanta Rd | | | 13,678 | | | 8,556 | | | 5,122 | | | 9,107 | | | 105,288 | | Q2 2017 | | Q2 2018 |
2/24/2017 | | Orlando 3 | | | | | | | | | | | | | | | | | | | |
| | 12711 E Colonial Dr | | | 8,056 | | | 4,565 | | | 3,491 | | | 5,210 | | | 70,625 | | Q3 2017 | | Q2 2018 |
2/24/2017 | | New Orleans | | | | | | | | | | | | | | | | | | | |
| | 2709 Severn Ave | | | 12,549 | | | 2,115 | | | 10,434 | | | 1,934 | | | 90,315 | | Q3 2017 | | Q1 2019 |
2/27/2017 | | Atlanta 5 | | | | | | | | | | | | | | | | | | | |
| | 56 Peachtree Valley Rd NE | | | 17,492 | | | 6,146 | | | 11,346 | | | 5,882 | | | 84,988 | | Q3 2017 | | Q1 2019 |
3/1/2017 | | Fort Lauderdale | | | | | | | | | | | | | | | | | | | |
| | 5601 NE 14th Ave | | | 9,952 | | | 1,948 | | | 8,004 | | | 1,860 | | | 79,279 | | Q1 2018 | | Q1 2019 |
3/1/2017 | | Houston | | | | | | | | | | | | | | | | | | | |
| | 1070 Brittmoore Rd | | | 13,630 | | | 4,529 | | | 9,101 | | | 4,388 | | | 132,967 | | Q4 2017 | | Q4 2018 |
4/14/2017 | | Louisville 1 | | | | | | | | | | | | | | | | | | | |
| | 2801 N Hurstbourne Pkwy | | | 8,523 | | | 4,008 | | | 4,515 | | | 4,471 | | | 66,150 | | Q2 2017 | | Q3 2018 |
4/20/2017 | | Denver 1 | | | | | | | | | | | | | | | | | | | |
| | 6206 W Alameda Ave | | | 9,806 | | | 2,500 | | | 7,306 | | | 2,406 | | | 59,150 | | Q1 2018 | | Q1 2019 |
4/20/2017 | | Denver 2 | | | | | | | | | | | | | | | | | | | |
| | 3110 S Wadsworth Blvd | | | 11,164 | | | 6,947 | | | 4,217 | | | 7,746 | | | 74,615 | | Q2 2017 | | Q2 2018 |
5/2/2017 | | Atlanta 6 | | | | | | | | | | | | | | | | | | | |
| | 2033 Monroe Dr | | | 12,543 | | | 6,310 | | | 6,233 | | | 6,558 | | | 81,120 | | Q2 2017 | | Q3 2018 |
5/2/2017 | | Tampa 2 | | | | | | | | | | | | | | | | | | | |
| | 9185 Ulmerton Rd | | | 8,091 | | | 1,610 | | | 6,481 | | | 1,524 | | | 71,400 | | Q1 2018 | | Q4 2018 |
5/19/2017 | | Tampa 3 | | | | | | | | | | | | | | | | | | | |
| | Lot 3B Crossroads Town Center | | | 9,224 | | | 2,578 | | | 6,646 | | | 2,478 | | | 70,888 | | Q3 2017 | | Q4 2018 |
6/12/2017 | | Tampa 4 | | | | | | | | | | | | | | | | | | | |
| | 3209 30th Ave S St | | | 10,266 | | | 3,697 | | | 6,569 | | | 3,821 | | | 73,500 | | Q4 2017 | | Q3 2018 |
6/19/2017 | | Baltimore | | | | | | | | | | | | | | | | | | | |
| | 1835 Washington Blvd | | | 10,775 | | | 4,410 | | | 6,365 | | | 4,194 | | | 83,450 | | Q3 2017 | | Q3 2018 |
6/28/2017 | | Knoxville | | | | | | | | | | | | | | | | | | | |
| | 7807 Kingston Pike | | | 9,115 | | | 2,738 | | | 6,377 | | | 2,642 | | | 72,069 | | Q3 2017 | | Q4 2018 |
6/29/2017 | | Boston 1 | | | | | | | | | | | | | | | | | | | |
| | 329 Boston Post Rd | | | 14,103 | | | 7,453 | | | 6,650 | | | 8,109 | | | 93,738 | | Q3 2017 | | Q3 2018 |
6/30/2017 | | New York City 2 | | | | | | | | | | | | | | | | | | | |
| | 465 W 150th St | | | 26,482 | | | 18,657 | | | 7,825 | | | 18,093 | | | 40,593 | | Q4 2017 | | Q4 2018 |
7/27/2017 | | Jacksonville 3 | | | | | | | | | | | | | | | | | | | |
| | 2004 Edison Ave | | | 8,096 | | | 2,658 | | | 5,438 | | | 2,640 | | | 68,700 | | Q4 2017 | | Q4 2018 |
8/30/2017 | | Orlando 4 | | | | | | | | | | | | | | | | | | | |
| | 9001 Eastmar Commons | | | 9,037 | | | 2,446 | | | 6,591 | | | 2,335 | | | 77,125 | | Q1 2018 | | Q1 2019 |
9/14/2017 | | Los Angeles | | | | | | | | | | | | | | | | | | | |
| | 943-959 W Hyde Park Blvd | | | 28,750 | | | 7,695 | | | 21,055 | | | 7,472 | | | 120,038 | | Q1 2019 | | Q3 2020 |
9/14/2017 | | Miami 1 | | | | | | | | | | | | | | | | | | | |
| | 4250 SW 8th St | | | 14,657 | | | 6,429 | | | 8,228 | | | 6,268 | | | 69,175 | | Q2 2018 | | Q3 2019 |
9/28/2017 | | Louisville 2 | | | | | | | | | | | | | | | | | | | |
| | 3415 Bardstown Rd | | | 9,940 | | | 3,241 | | | 6,699 | | | 3,129 | | | 74,172 | | Q4 2017 | | Q4 2018 |
10/12/2017 | | Miami 2 | | | | | | | | | | | | | | | | | | | |
| | 880 W Prospect Rd | | | 9,459 | | | 1,038 | | | 8,421 | | | 837 | | | 58,000 | | Q3 2018 | | Q2 2019 |
10/30/2017 | | New York City 3 | | | | | | | | | | | | | | | | | | | |
| | 5203 Kennedy Blvd | | | 14,701 | | | 3,557 | | | 11,144 | | | 3,237 | | | 68,660 | | Q4 2017 | | Q1 2019 |
11/16/2017 | | Miami 3 | | | | | | | | | | | | | | | | | | | |
| | 120-132 NW 27th Ave | | | 20,168 | | | 3,773 | | | 16,395 | | | 3,332 | | | 96,295 | | Q2 2018 | | Q3 2019 |
11/21/2017 | | Minneapolis 1 | | | | | | | | | | | | | | | | | | | |
| | 2109 University Ave W | | | 12,674 | | | 1,202 | | | 11,472 | | | 1,065 | | | 88,838 | | Q2 2018 | | Q3 2019 |
12/1/2017 | | Boston 2 | | | | | | | | | | | | | | | | | | | |
| | 10 Hampshire Rd | | | 8,771 | | | 1,661 | | | 7,110 | | | 1,568 | | | 74,625 | | Q4 2017 | | Q4 2018 |
12/15/2017 | | New York City 4 | | | | | | | | | | | | | | | | | | | |
| | 6 Commerce Center Dr | | | 10,591 | | | 1,000 | | | 9,591 | | | 887 | | | 78,425 | | Q2 2018 | | Q3 2019 |
First Quarter 2018 13
12/27/2017 | | Boston 3 | | | | | | | | | | | | | | | | | | | |
| | 19 Coolidge Hill Rd | | | 10,174 | | | 2,398 | | | 7,776 | | | 2,295 | | | 62,700 | | Q4 2018 | | Q4 2019 |
12/28/2017 | | New York City 5 | | | | | | | | | | | | | | | | | | | |
| | 375 River St | | | 16,073 | | | 4,765 | | | 11,308 | | | 4,612 | | | 90,200 | | Q3 2018 | | Q3 2019 |
2/8/2018 | | Minneapolis 2 | | | | | | | | | | | | | | | | | | | |
| | 3216 Winnetka Ave N | | | 10,543 | | | 4,599 | | | 5,944 | | | 4,534 | | | 83,114 | | Q2 2018 | | Q2 2019 |
3/2/2018 | | Miami 5 (3) | | | | | | | | | | | | | | | | | | | |
| | 4001 NW 77th Ave | | | 17,738 | | | 15,734 | | | 2,004 | | | 13,637 | | | 77,237 | | Q4 2016 | | Q2 2018 |
3/30/2018 | | Philadelphia | | | | | | | | | | | | | | | | | | | |
| | 550 Allendale Rd | | | 14,338 | | | 2,787 | | | 11,551 | | | 2,508 | | | 69,383 | | Q2 2018 | | Q3 2019 |
Total Projects in Progress | | $ | 448,162 | | $ | 164,084 | | $ | 284,078 | | $ | 161,673 | | | | | | | |
| | |
| (1) | Estimated C/O dates represent the Company’s best estimate as of March 31, 2018 based on project specific information learned through underwriting and communications with respective developers. These dates are subject to change due to unexpected project delays/efficiencies. |
| (2) | The NRSF includes only climate controlled and non-climate controlled storage space. It does not include retail space, office space, non-covered RV space or parking spaces. |
| (3) | This investment is a bridge loan. |
First Quarter 2018 14
Schedule of Heitman JV Development Projects Completed and in Progress
As of March 31, 2018
(unaudited, dollars in thousands)
Development Projects Completed:
| | | | | | | | | | | | | | | | | | | | | | | | | |
| | | | | | | | | | | | | | | | | | | | | | | | | |
| | Location | | | | | | | | Remaining | | | | | | | | | | | | | | |
| | (MSA) | | | | | Funded | | Unfunded | | | | | Size | | Date | | Months | | % Physical |
Closing Date | | Address | | Commitment | | Investment | | Commitment (1) | | Fair Value | | (NRSF) (2) | | Opened | | Open (3) | | Occupancy (3) |
7/19/2016 | | Jacksonville | | | | | | | | | | | | | | | | | | | | | | | |
| | 3211 San Pablo Rd S | | | 8,127 | | | 7,253 | | | 874 | | | 11,241 | | | 80,621 | | 7/26/2017 | | 9 | | | 55.7 | % |
9/28/2016 | | Columbia | | | | | | | | | | | | | | | | | | | | | | | |
| | 401 Hampton St | | | 9,199 | | | 8,419 | | | 780 | | | 9,405 | | | 70,925 | | 8/23/2017 | | 8 | | | 37.3 | % |
8/15/2016 | | Atlanta 2 | | | | | | | | | | | | | | | | | | | | | | | |
| | 11220 Medlock Bridge Rd | | | 8,772 | | | 7,846 | | | 926 | | | 9,077 | | | 70,289 | | 9/14/2017 | | 8 | | | 19.4 | % |
4/15/2016 | | Washington DC | | | | | | | | | | | | | | | | | | | | | | | |
| | 1325 Kenilworth Ave NE | | | 17,269 | | | 16,146 | | | 1,123 | | | 18,539 | | | 89,785 | | 9/25/2017 | | 7 | | | 22.2 | % |
8/25/2016 | | Denver | | | | | | | | | | | | | | | | | | | | | | | |
| | 2225 E 104th Ave | | | 11,032 | | | 9,105 | | | 1,927 | | | 11,009 | | | 85,575 | | 12/14/2017 | | 5 | | | 27.2 | % |
5/14/2015 | | Miami 1 | | | | | | | | | | | | | | | | | | | | | | | |
| | 490 NW 36th St | | | 13,867 | | | 11,571 | | | 2,296 | | | 14,227 | | | 75,770 | | 2/23/2018 | | 2 | | | 13.8 | % |
Total Completed Development Projects | | $ | 68,266 | | $ | 60,340 | | $ | 7,926 | | $ | 73,498 | | | | | | | | | | | |
| | |
| (1) | Commitment is fixed during underwriting at an amount deemed sufficient to cover interest carry and excess operating expenses over rental revenue during lease-up and deferred developer’s fees (if any) payable upon stabilization. Remaining unfunded commitment on completed projects is expected to be utilized primarily for such purposes. To the extent not needed for such purposes, such commitment will not be advanced. |
| | |
| (2) | The net rentable square feet (“NRSF”) includes only climate controlled and non-climate controlled storage space. It does not include retail space, office space, non-covered RV space or parking spaces. |
| | |
| (3) | As of May 1, 2018. |
| | |
| | |
Development Projects In Progress:
| | | | | | | | | | | | | | | | | | | | | |
| | | | | | | | | | | | | | | | | | | | | |
| | Location | | | | | | | | Remaining | | | | | | | | | | Estimated |
| | (MSA) | | | | | Funded | | Unfunded | | | | | Size | | Construction | | C/O |
Closing Date | | Address | | Commitment | | Investment | | Commitment | | Fair Value | | (NRSF) (2) | | Start Date | | Quarter (1) |
5/14/2015 | | Miami 2 | | | | | | | | | | | | | | | | | | | |
| | 1100 NE 79th St | | | 14,849 | | | 11,640 | | | 3,209 | | | 12,805 | | | 74,113 | | Q2 2016 | | Q2 2018 |
9/25/2015 | | Fort Lauderdale | | | | | | | | | | | | | | | | | | | |
| | 812 NW 1st St | | | 13,230 | | | 9,982 | | | 3,248 | | | 11,598 | | | 87,413 | | Q2 2016 | | Q2 2018 |
4/29/2016 | | Atlanta 1 | | | | | | | | | | | | | | | | | | | |
| | 1801 Savoy Dr | | | 10,223 | | | 8,332 | | | 1,891 | | | 9,094 | | | 71,150 | | Q4 2016 | | Q2 2018 |
7/21/2016 | | New Jersey | | | | | | | | | | | | | | | | | | | |
| | 10 Central Ave | | | 7,828 | | | 2,383 | | | 5,445 | | | 2,228 | | | 57,975 | | Q2 2017 | | Q4 2018 |
12/22/2016 | | Raleigh | | | | | | | | | | | | | | | | | | | |
| | 7620 ACC Blvd | | | 8,877 | | | 5,798 | | | 3,079 | | | 6,657 | | | 65,110 | | Q1 2017 | | Q2 2018 |
Total Development Projects in Progress | | $ | 55,007 | | $ | 38,135 | | $ | 16,872 | | $ | 42,382 | | | | | | | |
| | | | | | | | | | | | | | | | | | | | | |
Total Heitman JV Investments | | $ | 123,273 | | $ | 98,475 | | $ | 24,798 | | $ | 115,880 | | | | | | | |
| | |
| (1) | Estimated C/O dates represent the Company’s best estimate as of March 31, 2018 based on project specific information learned through underwriting and communications with respective developers. These dates are subject to change due to unexpected project delays/efficiencies. |
| (2) | The NRSF includes only climate controlled and non-climate controlled storage space. It does not include retail space, office space, non-covered RV space or parking spaces. |
First Quarter 2018 15
Closed Investments by Geography
As of March 31, 2018
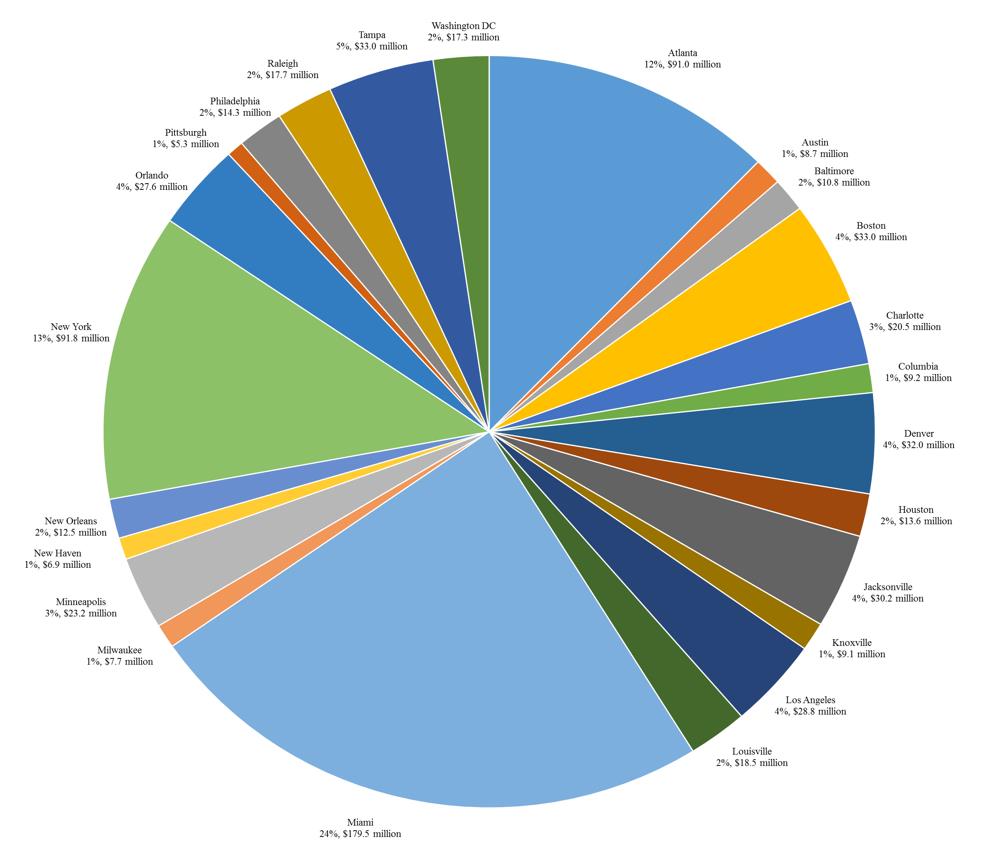
First Quarter 2018 16
Sources and Uses for Development
As of March 31, 2018
(dollars in millions)
| | | |
| | | |
Estimated Capital Uses: | | | Remaining Capital Needs |
Contractual investment obligations | | | |
Development property investments | | $ | 291 |
Bridge loan investments | | | 6 |
Self-storage real estate venture | | | 2 |
Total Committed Uses | | $ | 299 |
Remaining Prospective Commitments per FY 2018 guidance: | | | 110 |
Total to Fund Investments | | $ | 409 |
| | | |
| | | |
Estimated Sources: | | | Capital Sources |
Cash and Cash Equivalents as of March 31, 2018 | | $ | 15 |
Remaining Series A Preferred Stock to be Issued (expected in Q2 2018) | | | 50 |
Identified loan repayment (expected in Q2 2018) | | | 17 |
Identified asset sale (expected in Q2 or Q3 2018) | | | 6 |
Remaining credit facility capacity | | | 170 |
Remaining capital needs | | | 151 |
Total Sources | | $ | 409 |
The company may use any combination of the following capital sources to fund its $151 million of remaining capital needs:
| · | | Refinancing of JCAP mortgage (49.9% profits interest and ROFR retained) |
| · | | Sales of assets that JCAP does not wish to own or acquire |
| · | | Series B preferred ATM issuances |
| · | | Common stock issuances (ATM or underwritten offerings) |
| · | | Secured debt on individual properties |
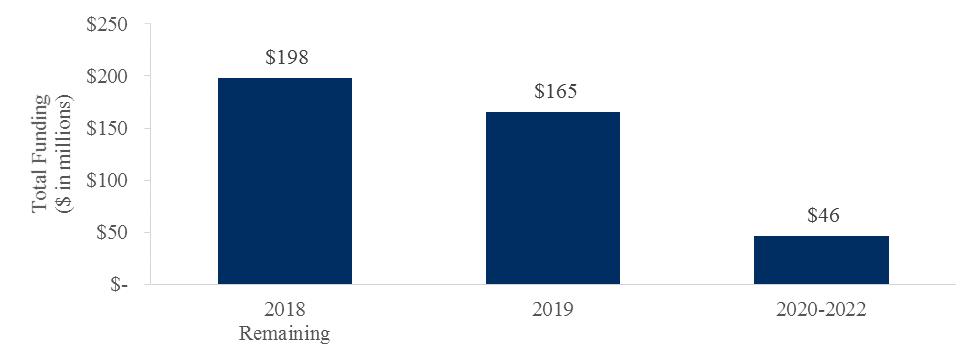
Timing of Funding $409 million of Remaining Commitments
First Quarter 2018 17
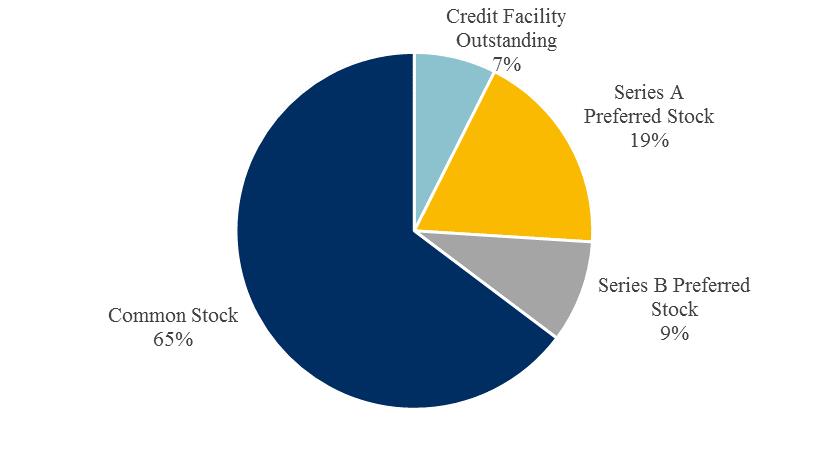
Capital Structure
As of March 31, 2018
| | | |
| | | |
Credit Facility Outstanding | | $ | 30,000 |
Series A Preferred Stock | | | 75,000 |
Series B Preferred Stock | | | 37,500 |
Common Stock | | | 261,491 |
Total Capital | | $ | 403,991 |
First Quarter 2018 18
Jernigan Capital, Inc.
Company Information
| | | |
Corporate Headquarters | Trading Symbol | Investor Relations | Information Requests |
6410 Poplar Avenue | Common shares: JCAP | 6410 Poplar Avenue | To request an Investor Relations |
Suite 650 | 7.00% Series B Preferred Stock: JCAP- | Suite 650 | package or annual report, please |
Memphis, TN 38119 | PR B | Memphis, TN 38119 | visit our website at |
901.567.9510 | Stock Exchange Listing | 901.567.9510 | www.jernigancapital.com |
| New York Stock Exchange | | |
Executive Management
| |
Dean Jernigan | John A. Good |
Chairman and Chief Executive Officer | President and Chief Operating Officer |
| |
Kelly P. Luttrell | David Corak |
Senior Vice President, Chief Financial Officer, Treasurer and Corporate Secretary | Senior Vice President of Corporate Finance |
Independent Directors
| |
Mark O. Decker | James D. Dondero |
Director | Director |
| |
Howard A. Silver | Harry J. Thie |
Director | Director |
Equity Research Coverage
| |
Baird Equity Research | B. Riley FBR |
RJ Milligan | Tim Hayes |
rjmilligan@rwbaird.com | timothyhayes@brileyfbr.com |
| |
Jefferies LLC | KeyBanc Capital Markets |
George Hoglund | Todd M. Thomas |
gholund@jefferies.com | tthomas@key.com |
| |
Raymond James & Associates | |
Jonathan Hughes | |
jonathan.hughes@raymondjames.com | |
Any opinions, estimates, forecasts or predictions regarding Jernigan Capital’s performance made by these analysts are theirs alone and do not represent opinions, estimates, forecasts or predictions of Jernigan Capital or its management. Jernigan Capital does not by its reference above or distribution imply its endorsement of or concurrence with such opinions, estimates, forecasts or predictions.
First Quarter 2018 19