| FREE WRITING PROSPECTUS | ||
| FILED PURSUANT TO RULE 433 | ||
| REGISTRATION FILE NO.: 333-197550-02 | ||
 |  |
Free Writing Prospectus
Structural and Collateral Term Sheet
$875,766,284
(Approximate Aggregate Cut-off Date Balance of Mortgage Pool)
(Approximate Aggregate Cut-off Date Balance of Mortgage Pool)
$754,253,000
(Approximate Aggregate Principal Balance of Offered Certificates)
WFRBS Commercial Mortgage Trust 2014-C25
as Issuing Entity
RBS Commercial Funding Inc.
as Depositor
Wells Fargo Bank, National Association
The Royal Bank of Scotland plc
Rialto Mortgage Finance, LLC
Silverpeak Real Estate Finance LLC
Basis Real Estate Capital II, LLC
C-III Commercial Mortgage LLC
Liberty Island Group I LLC
as Sponsors and Mortgage Loan Sellers
Commercial Mortgage Pass-Through Certificates
Series 2014-C25
November 12, 2014
RBS | WELLS FARGO SECURITIES | |
Co-Lead Manager and Co-Bookrunner | Co-Lead Manager and Co-Bookrunner | |
Deutsche Bank Securities | ||
| Co-Manager | ||
STATEMENT REGARDING THIS FREE WRITING PROSPECTUS
The depositor has filed a registration statement (including a prospectus) with the Securities and Exchange Commission (‘‘SEC’’) (SEC File No. 333-197550) for the offering to which this communication relates. Before you invest, you should read the prospectus in the registration statement and other documents the depositor has filed with the SEC for more complete information about the depositor, the issuing entity and this offering. You may get these documents for free by visiting EDGAR on the SEC Web site at www.sec.gov. Alternatively, the depositor, any underwriter, or any dealer participating in the offering will arrange to send you the prospectus after filing if you request it by calling toll free 1-866-884-2071 (8 a.m. – 5 p.m. EST) or by emailing rbscmbs@rbs.com.
Nothing in this document constitutes an offer to sell or a solicitation to buy securities in any jurisdiction where such offer, solicitation or sale is not permitted. The information contained herein is preliminary as of the date hereof, supersedes any such information previously delivered to you and will be superseded by any information subsequently delivered and ultimately by the final prospectus relating to the securities. These materials are subject to change, completion, supplement or amendment from time to time.
STATEMENT REGARDING ASSUMPTIONS AS TO SECURITIES, PRICING ESTIMATES AND OTHER INFORMATION
The attached information contains certain tables and other statistical analyses (the “Computational Materials”) which have been prepared in reliance upon information furnished by the Mortgage Loan Sellers. Numerous assumptions were used in preparing the Computational Materials, which may or may not be reflected herein. As such, no assurance can be given as to the Computational Materials’ accuracy, appropriateness or completeness in any particular context; or as to whether the Computational Materials and/or the assumptions upon which they are based reflect present market conditions or future market performance. The Computational Materials should not be construed as either projections or predictions or as legal, tax, financial or accounting advice. You should consult your own counsel, accountant and other advisors as to the legal, tax, business, financial and related aspects of a purchase of these securities. Any weighted average lives, yields and principal payment periods shown in the Computational Materials are based on prepayment and/or loss assumptions, and changes in such prepayment and/or loss assumptions may dramatically affect such weighted average lives, yields and principal payment periods. In addition, it is possible that prepayments or losses on the underlying assets will occur at rates higher or lower than the rates shown in the attached Computational Materials. The specific characteristics of the securities may differ from those shown in the Computational Materials due to differences between the final underlying assets and the preliminary underlying assets used in preparing the Computational Materials. The principal amount and designation of any security described in the Computational Materials are subject to change prior to issuance. None of RBS Securities Inc. (“RBSSI”), Wells Fargo Securities, LLC (“WFS”), any other underwriter or dealer participating in this offering, or any of their respective affiliates make any representation or warranty as to the actual rate or timing of payments or losses on any of the underlying assets or the payments or yield on the securities. The information in this presentation is based upon management forecasts and reflects prevailing conditions and management’s views as of this date, all of which are subject to change. In preparing this presentation, we have relied upon and assumed, without independent verification, the accuracy and completeness of all information available from public sources or which was provided to us by or on behalf of the Mortgage Loan Sellers or which was otherwise reviewed by us.
This free writing prospectus contains certain forward-looking statements. If and when included in this free writing prospectus, the words “expects”, “intends”, “anticipates”, “estimates” and analogous expressions and all statements that are not historical facts, including statements about our beliefs or expectations, are intended to identify forward-looking statements. Any forward-looking statements are made subject to risks and uncertainties which could cause actual results to differ materially from those stated. Those risks and uncertainties include, among other things, declines in general economic and business conditions, increased competition, changes in demographics, changes in political and social conditions, regulatory initiatives and changes in customer preferences, many of which are beyond our control and the control of any other person or entity related to this offering. The forward-looking statements made in this free writing prospectus are made as of the date stated on the cover. We have no obligation to update or revise any forward-looking statement.
RBS is a trade name for the investment banking business of RBSSI. Securities, syndicated loan arranging, financial advisory and other investment banking activities are performed by RBSSI and their securities affiliates. Lending, derivatives and other commercial banking activities are performed by The Royal Bank of Scotland plc and their banking affiliates. RBSSI is a member of SIPC, FINRA and the NYSE.
Wells Fargo Securities is the trade name for the capital markets and investment banking services of Wells Fargo & Company and its subsidiaries, including but not limited to Wells Fargo Securities, LLC, a member of NYSE, FINRA, NFA and SIPC, Wells Fargo Institutional Securities, LLC, a member of FINRA and SIPC, Wells Fargo Prime Services, LLC, a member of FINRA, NFA and SIPC, and Wells Fargo Bank, N.A. Wells Fargo Securities, LLC carries and provides clearing services for Wells Fargo Institutional Securities, LLC customer accounts. Wells Fargo Securities, LLC, Wells Fargo Institutional Securities, LLC, and Wells Fargo Prime Services, LLC are distinct entities from affiliated banks and thrifts.
IMPORTANT NOTICE REGARDING THE OFFERED CERTIFICATES
The offered certificates referred to in these materials and the asset pool backing them are subject to modification or revision (including the possibility that one or more classes of certificates may be split, combined or eliminated at any time prior to issuance or availability of a final prospectus) and are offered on a “when, as and if issued” basis. Prospective investors should understand that, when considering the purchase of the offered certificates, a contract of sale will come into being no sooner than the date on which the relevant class of certificates has been priced and the underwriters have confirmed the allocation of certificates to be made to investors; any “indications of interest” expressed by any prospective investor, and any “soft circles” generated by the underwriters, will not create binding contractual obligations for such prospective investors, on the one hand, or the underwriters, the depositor or any of their respective agents or affiliates, on the other hand.
As a result of the foregoing, a prospective investor may commit to purchase certificates that have characteristics that may change, and each prospective investor is advised that all or a portion of the certificates referred to in these materials may be issued that differ from the characteristics described in these materials. The underwriters’ obligation to sell certificates to any prospective investor is conditioned on the certificates and the transaction having the characteristics described in these materials. If the underwriters determine that a condition is not satisfied in any material respect, such prospective investor will be notified, and neither the depositor nor the underwriters will have any obligation to such prospective investor to deliver any portion of the offered certificates which such prospective investor has committed to purchase, and there will be no liability between the underwriters, the depositor or any of their respective agents or affiliates, on the one hand, and such prospective investor, on the other hand, as a consequence of the non-delivery.
Each prospective investor has requested that the underwriters provide to such prospective investor information in connection with such prospective investor’s consideration of the purchase of the certificates described in these materials. These materials are being provided to each prospective investor for informative purposes only in response to such prospective investor’s specific request. The underwriters described in these materials may from time to time perform investment banking services for, or solicit investment banking business from, any company named in these materials. The underwriters and/or their affiliates or respective employees may from time to time have a long or short position in any security or contract discussed in these materials.
The information contained herein supersedes any previous such information delivered to any prospective investor and will be superseded by information delivered to such prospective investor prior to the time of sale.
IMPORTANT NOTICE RELATING TO AUTOMATICALLY-GENERATED EMAIL DISCLAIMERS
Any legends, disclaimers or other notices that may appear at the bottom of, or attached to, any email communication to which this free writing prospectus is attached relating to (1) these materials not constituting an offer (or a solicitation of an offer), (2) no representation that these materials are accurate or complete and may not be updated or (3) these materials possibly being confidential, are not applicable to these materials and should be disregarded. Such legends, disclaimers or other notices have been automatically generated as a result of these materials having been sent via Bloomberg or another system.
THE INFORMATION IN THIS STRUCTURAL AND COLLATERAL TERM SHEET IS NOT COMPLETE AND MAY BE AMENDED PRIOR TO THE TIME OF SALE. THIS TERM SHEET IS NOT AN OFFER TO SELL THESE SECURITIES AND IT IS NOT A SOLICITATION OF AN OFFER TO BUY THESE SECURITIES IN ANY JURISDICTION WHERE THE OFFER OR SALE IS NOT PERMITTED.
2
WFRBS Commercial Mortgage Trust 2014-C25 | Characteristics of the Mortgage Pool |
I. Certificate Structure
| Class | Expected Ratings (DBRS/Moody’s/Morningstar)(1) | Approximate Initial Certificate Principal Balance or Notional Amount(2) | Approx. Initial Credit Support(3) | Pass-Through Rate Description | Weighted Average Life (Years)(4) | Expected Principal Window(4) | Certificate Principal to Value Ratio(5) | Certificate Principal U/W NOI Debt Yield(6) | |||||||||
| Offered Certificates | |||||||||||||||||
| A-1 | AAA(sf)/Aaa(sf)/AAA | $31,829,000 | 30.000% | (7) | 3.02 | 01/15 - 11/19 | 39.3% | 16.1% | |||||||||
| A-2 | AAA(sf)/Aaa(sf)/AAA | $42,727,000 | 30.000% | (7) | 4.96 | 11/19 - 12/19 | 39.3% | 16.1% | |||||||||
| A-3 | AAA(sf)/Aaa(sf)/AAA | $35,436,000 | 30.000% | (7) | 6.93 | 11/21 - 11/21 | 39.3% | 16.1% | |||||||||
| A-4 | AAA(sf)/Aaa(sf)/AAA | $210,000,000 | 30.000% | (7) | 9.82 | 09/24 - 11/24 | 39.3% | 16.1% | |||||||||
| A-5 | AAA(sf)/Aaa(sf)/AAA | $235,917,000 | 30.000% | (7) | 9.93 | 11/24 - 11/24 | 39.3% | 16.1% | |||||||||
| A-SB | AAA(sf)/Aaa(sf)/AAA | $57,127,000 | 30.000% | (7) | 7.44 | 12/19 - 9/24 | 39.3% | 16.1% | |||||||||
A-S(8) | AAA(sf)/Aa1(sf)/AAA | $73,345,000 | 21.625% | (7) | 9.93 | 11/24 - 11/24 | 44.0% | 14.4% | |||||||||
B(8) | AA(low)(sf)/Aa3(sf)/AA- | $38,315,000 | 17.250% | (7) | 9.93 | 11/24 - 11/24 | 46.4% | 13.6% | |||||||||
C(8) | A(low)(sf)/A3(sf)/A- | $29,557,000 | 13.875% | (7) | 9.93 | 11/24 - 11/24 | 48.3% | 13.1% | |||||||||
PEX(8) | A(low)(sf)/A1(sf)/A- | $141,217,000 | 13.875% | (7) | 9.93 | 11/24 - 11/24 | 48.3% | 13.1% | |||||||||
| X-A | AAA(sf)/Aaa(sf)/AAA | $686,381,000(9) | N/A | Variable(10) | N/A | N/A | N/A | N/A | |||||||||
| X-B | AAA(sf)/NR/AAA | $129,176,000(11) | N/A | Variable(12) | N/A | N/A | N/A | N/A | |||||||||
| Non-Offered Certificates | |||||||||||||||||
| X-C | AAA(sf)/NR/AAA | $10,947,000(13) | N/A | Variable(14) | N/A | N/A | N/A | N/A | |||||||||
| X-D | AAA(sf)/NR/AAA | $20,799,000(15) | N/A | Variable(16) | N/A | N/A | N/A | N/A | |||||||||
| X-E | AAA(sf)/NR/AAA | $28,463,284(17) | N/A | Variable(18) | N/A | N/A | N/A | N/A | |||||||||
| D | BBB(low)(sf)/NR/BBB- | $61,304,000 | 6.875% | (7) | 9.95 | 11/24 - 12/24 | 52.3% | 12.1% | |||||||||
| E | BB(sf)/NR/BB | $10,947,000 | 5.625% | (7) | 10.01 | 12/24 - 12/24 | 53.0% | 11.9% | |||||||||
| F | B(sf)/NR/B | $20,799,000 | 3.250% | (7) | 10.01 | 12/24 - 12/24 | 54.3% | 11.6% | |||||||||
| G | NR/NR/NR | $28,463,284 | 0.000% | (7) | 10.01 | 12/24 - 12/24 | 56.1% | 11.3% | |||||||||
Notes: | |||||||||||||||||
| (1) | The expected ratings presented are those of DBRS, Inc. (“DBRS”), Moody’s Investors Service, Inc. (“Moody’s”), and Morningstar Credit Ratings, LLC (“Morningstar”) which the depositor hired to rate the rated offered certificates. One or more other nationally recognized statistical rating organizations, as defined in Section 3(a)(62) of the Securities Exchange Act of 1934, as amended (the “Exchange Act”), that were not hired by the depositor may use information they receive pursuant to Rule 17g-5 under the Securities Exchange Act or otherwise to rate or provide market reports and/or published commentary related to the offered certificates. We cannot assure you as to what ratings a non-hired nationally recognized statistical rating organization would assign or that its reports will not express differing, possibly negative, views of the mortgage loans and/or the offered certificates. See “Risk Factors—Risks Related to the Offered Certificates—Nationally Recognized Statistical Rating Organizations May Assign Different Ratings to the Certificates; Ratings of the Certificates Reflect Only the Views of the Applicable Rating Agencies as of the Dates Such Ratings Were Issued; Ratings May Affect ERISA Eligibility; Ratings May Be Downgraded” in the free writing prospectus, dated November 12, 2014 (the “Free Writing Prospectus”). | ||||||||||||||||
| (2) | The principal balances and notional amounts set forth in the table are approximate. The actual initial principal balances and notional amounts may be larger or smaller depending on the aggregate cut-off date principal balance of the mortgage loans definitively included in the pool of mortgage loans, which aggregate cut-off date principal balance may be as much as 5% larger or smaller than the amount presented in the Free Writing Prospectus. | ||||||||||||||||
| (3) | The approximate initial credit support with respect to the Class A-1, A-2, A-3, A-4, A-5 and A-SB Certificates represents the approximate credit enhancement for the Class A-1, A-2, A-3, A-4, A-5 and A-SB Certificates in the aggregate. The approximate initial credit support with respect to each of the Class C Certificates and Class PEX Certificates is equal to the approximate initial credit support of the Class C regular interest, which will have an initial outstanding principal balance of the closing date of $29,557,000. | ||||||||||||||||
| (4) | Weighted Average Lives and Expected Principal Windows are calculated based on an assumed prepayment rate of 0% CPR and the “Structuring Assumptions” described on Annex D to the Free Writing Prospectus. | ||||||||||||||||
| (5) | The Certificate Principal to Value Ratio for each Class of Certificates (other than the Class A-1, A-2, A-3, A-4, A-5 and A-SB Certificates and other than the Exchangeable Certificates) is calculated by dividing the aggregate principal balance of such class of certificates and all classes of certificates (other than the Exchangeable Certificates and other than the Class X-A, X-B, X-C, X-D and, X-E Certificates, which are notional amount certificates and will not have principal balances), if any, that are senior to such class by the aggregate appraised value of approximately $1,560,217,380 (calculated as described in the Free Writing Prospectus) of the mortgaged properties securing the mortgage loans (excluding, with respect to each pari passu loan combination, a pro rata portion of the related appraised value allocated to the related companion loan based on its cut-off date principal balance). The Certificate Principal to Value Ratio for each of the Class A-1, A-2, A-3, A-4, A-5 and A-SB Certificates are calculated by dividing the aggregate principal balance of the Class A-1, A-2, A-3, A-4, A-5 and A-SB Certificates by such aggregate appraised value (excluding, with respect to each pari passu loan combination, a pro rata portion of the related appraised value allocated to the related companion loan based on its cut-off date principal balance). The Certificate Principal to Value Ratio for each of the Class A-S, B and C Certificates is calculated by dividing the aggregate principal balance of the Class A-S regular interest, the Class B regular interest or the Class C regular interest, as applicable, and all other classes of certificates (other than the Exchangeable Certificates) and the regular interests that are senior to such class, by such aggregate appraised value (excluding, with respect to each pari passu loan combination, a pro rata portion of the related appraised value allocated to the related companion loan based on its cut-off date principal balance). The Certificate Principal to Value Ratio of the Class PEX Certificates is equal to the Certificate Principal to Value Ratio of the Class C Certificates. In any event, however, excess mortgaged property value associated with a mortgage loan will not be available to offset losses on any other mortgage loan. | ||||||||||||||||
| (6) | The Certificate Principal U/W NOI Debt Yield for each Class of Certificates (other than the Class A-1, A-2, A-3, A-4, A-5 and A-SB Certificates and other than the Exchangeable Certificates) is calculated by dividing the underwritten net operating income (which excludes, with respect to each pari passu loan combination, a pro rata portion of the related underwritten net operating income allocated to the related companion loan based on its cut-off date principal balance) for the mortgage pool of approximately $98,663,486 (calculated as described in the Free Writing Prospectus) by the aggregate principal balance of such class of certificates and all classes of certificates (other than the Class X-A, X-B, X-C, X-D, and X-E Certificates, which are notional amount certificates and will not have principal balances, and other than the Exchangeable Certificates), if any, that are senior to such class of certificates. The Certificate Principal U/W NOI Debt Yield for each of the Class A-1, A-2, A-3, A-4, A-5 and A-SB Certificates is calculated by dividing such mortgage pool underwritten net operating income (which excludes, with respect to each pari passu loan combination, a pro rata portion of the related underwritten net operating income allocated to the related companion loan based on its cut-off date principal balance) by the aggregate principal balance of the Class A-1, A-2, A-3, A-4, A-5 and A-SB Certificates. The Certificate Principal U/W NOI Debt Yield for each of the Class A-S, B and C Certificates is calculated by dividing the underwritten net operating income (which excludes, with respect to each pari passu loan combination, a pro rata portion of the related underwritten net operating income allocated to the related companion loan based on its cut-off date principal balance) for the mortgage pool of approximately $98,663,486 (calculated as described in the Free Writing Prospectus) by the aggregate principal balance of the Class A-S regular interest, the Class B regular interest or the Class C regular interest, as applicable, and all other classes of certificates (other than the Exchangeable Certificates) and the regular interests that are senior to such class. The Certificate Principal U/W NOI Debt Yield of the Class PEX Certificates is equal to the Certificate Principal U/W NOI Debt Yield for the Class C Certificates. In any event, however, cash flow from each mortgaged property supports only the related mortgage loan and will not be available to support any other mortgage loan. | ||||||||||||||||
THE INFORMATION IN THIS STRUCTURAL AND COLLATERAL TERM SHEET IS NOT COMPLETE AND MAY BE AMENDED PRIOR TO THE TIME OF SALE. THIS TERM SHEET IS NOT AN OFFER TO SELL THESE SECURITIES AND IT IS NOT A SOLICITATION OF AN OFFER TO BUY THESE SECURITIES IN ANY JURISDICTION WHERE THE OFFER OR SALE IS NOT PERMITTED.
3
WFRBS Commercial Mortgage Trust 2014-C25 | Characteristics of the Mortgage Pool |
| (7) | The pass-through rates for the Class A-1, A-2, A-3, A-4, A-5, A-SB, D, E, F and G Certificates and the Class A-S, B and C regular interests, in each case, will be one of the following: (i) a fixed rate per annum, (ii) the WAC Rate (as defined in the Free Writing Prospectus) for the related distribution date, (iii) a variable rate per annum equal to the lesser of (a) a fixed rate and (b) the WAC Rate for the related distribution date or (iv) a variable rate per annum equal to the WAC Rate for the related distribution date minus a specified percentage. For purposes of the calculation of the weighted average of the net mortgage interest rates on the mortgage loans for each distribution date, the mortgage interest rates will be adjusted as necessary to a 30/360 basis. The Class PEX Certificates will not have a pass-through rate, but will be entitled to receive the sum of the interest distributable on the percentage interests of the Class A-S, B and C regular interests represented by the Class PEX Certificates. The pass-through rates on the Class A-S, B and C Certificates will at all times be the same as the pass-through rates of the Class A-S, B and C regular interests. | ||
| (8) | The Class A-S, B, C and PEX Certificates are “Exchangeable Certificates”. On the closing date, the upper-tier REMIC of the issuing entity will issue the Class A-S, B and C regular interests (each a “regular interest”) which will have outstanding principal balances on the closing date of $73,345,000, $38,315,000 and $29,557,000, respectively. The regular interests will be held in a grantor trust for the benefit of the holders of the Class A-S, B, C and PEX Certificates. The Class A-S, B, C and PEX Certificates will, at all times, represent undivided beneficial ownership interests in a grantor trust that will hold those regular interests. Each class of the Class A-S, B and C Certificates will, at all times, represent an undivided beneficial ownership interest in a percentage of the outstanding certificate principal balance of the regular interest with the same alphabetical class designation. The Class PEX Certificates will, at all times, represent an undivided beneficial ownership interest in the remaining percentages of the outstanding certificate principal balances of the Class A-S, B and C regular interests and which portions of those regular interests are referred to in this Term Sheet as the Class PEX Component A-S, Class PEX Component B and Class PEX Component C (collectively, the “Class PEX Components”). Following any exchange of Class A-S, B and C Certificates for Class PEX Certificates or any exchange of Class PEX Certificates for Class A-S, B and C Certificates as described in the Free Writing Prospectus, the percentage interest of the outstanding certificate principal balances of the Class A-S, B and C regular interest that is represented by the Class A-S, B, C and PEX Certificates will be increased or decreased accordingly. The initial certificate principal balance of each of the Class A-S, B and C Certificates shown in the table represents the maximum certificate principal balance of such class without giving effect to any exchange. The initial certificate principal balance of the Class PEX Certificates is equal to the aggregate of the initial certificate principal balance of the Class A-S, B and C Certificates and represents the maximum certificate principal balance of the Class PEX Certificates that could be issued in an exchange. The certificate principal balances of the Class A-S, B and C Certificates to be issued on the closing date will be reduced, in required proportions, by an amount equal to the certificate principal balance of the Class PEX Certificates issued on the closing date. Distributions and allocations of payments and losses with respect to the Exchangeable Certificates are described in this Term Sheet under “Allocations and Distributions on the Class A-S, B, C and PEX Certificates” and under “Description of the Offered Certificates—Distributions” in the Free Writing Prospectus. The maximum certificate principal balance of the Class PEX Certificates is set forth in the table but is not included in the certificate principal balance of the certificates set forth on the cover page of this Term Sheet or on the top of the cover page of the Free Writing Prospectus. | ||
| (9) | The Class X-A Certificates are notional amount certificates. The Notional Amount of the Class X-A Certificates will be equal to the aggregate principal balance of the Class A-1, A-2, A-3, A-4, A-5 and A-SB Certificates and the Class A-S regular interest outstanding from time to time. The Class X-A Certificates will not be entitled to distributions of principal. | ||
| (10) | The pass-through rate for the Class X-A Certificates for any distribution date will be a per annum rate equal to the excess, if any, of (a) the weighted average of the net mortgage interest rates on the mortgage loans for the related distribution date, over (b) the weighted average of the pass-through rates on the Class A-1, A-2, A-3, A-4, A-5 and A-SB Certificates and the Class A-S regular interest for the related distribution date, weighted on the basis of their respective aggregate principal balances outstanding immediately prior to that distribution date. For purposes of the calculation of the weighted average of the net mortgage interest rates on the mortgage loans for each distribution date, the mortgage interest rates will be adjusted as necessary to a 30/360 basis. | ||
| (11) | The Class X-B Certificates are notional amount certificates. The Notional Amount of the Class X-B Certificates will be equal to the aggregate principal balance of the Class B and C regular interests and the Class D Certificates outstanding from time to time. The Class X-B Certificates will not be entitled to distributions of principal. | ||
| (12) | The pass-through rate for the Class X-B certificates for any distribution date will be a per annum rate equal to the excess, if any, of (a) the weighted average of the net mortgage interest rates on the mortgage loans for the related distribution date, over (b) the weighted average of the pass-through rates on the Class D certificates and the Class B and Class C regular interests for the related distribution date, weighted on the basis of their respective aggregate certificate principal balances outstanding immediately prior to that distribution date. For purposes of the calculation of the weighted average of the net mortgage interest rates on the mortgage loans for each distribution date, the mortgage interest rates will be adjusted as necessary to a 30/360 basis and. | ||
| (13) | The Class X-C Certificates are notional amount certificates. The Notional Amount of the Class X-C Certificates will be equal to the principal balance of the Class E Certificates outstanding from time to time. The Class X-C Certificates will not be entitled to distributions of principal. | ||
| (14) | The pass-through rate for the Class X-C Certificate for any distribution date will be a per annum rate equal to the excess, if any, of (a) the weighted average of the net mortgage interest rates on the mortgage loans for the related distribution date, over (b) the pass-through rate on the Class E Certificates for the related distribution date. For purposes of the calculation of the weighted average of the net mortgage interest rates on the mortgage loans for each distribution date, the mortgage interest rates will be adjusted as necessary to a 30/360 basis. | ||
| (15) | The Class X-D Certificates are notional amount certificates. The Notional Amount of the Class X-D Certificates will be equal to the aggregate principal balance of the Class F Certificates outstanding from time to time. The Class X-D Certificates will not be entitled to distributions of principal. | ||
| (16) | The pass-through rate for the Class X-D Certificates for any distribution date will be a per annum rate equal to the excess, if any, of (a) the weighted average of the net mortgage interest rates on the mortgage loans for the related distribution date, over (b) the pass-through rate on the Class F Certificates for the related distribution date. For purposes of the calculation of the weighted average of the net mortgage interest rates on the mortgage loans for each distribution date, the mortgage interest rates will be adjusted as necessary to a 30/360 basis. | ||
| (17) | The Class X-E Certificates are notional amount certificates. The Notional Amount of the Class X-E Certificates will be equal to the aggregate principal balance of the Class G Certificates outstanding from time to time. The Class X-E Certificates will not be entitled to distributions of principal. | ||
| (18) | The pass-through rate for the Class X-E Certificates for any distribution date will be a per annum rate equal to the excess, if any, of (a) the weighted average of the net mortgage interest rates on the mortgage loans for the related distribution date, over (b) the pass-through rate on the Class G Certificates for the related distribution date. For purposes of the calculation of the weighted average of the net mortgage interest rates on the mortgage loans for each distribution date, the mortgage interest rates will be adjusted as necessary to a 30/360 basis. |
THE INFORMATION IN THIS STRUCTURAL AND COLLATERAL TERM SHEET IS NOT COMPLETE AND MAY BE AMENDED PRIOR TO THE TIME OF SALE. THIS TERM SHEET IS NOT AN OFFER TO SELL THESE SECURITIES AND IT IS NOT A SOLICITATION OF AN OFFER TO BUY THESE SECURITIES IN ANY JURISDICTION WHERE THE OFFER OR SALE IS NOT PERMITTED.
4
WFRBS Commercial Mortgage Trust 2014-C25 | Characteristics of the Mortgage Pool |
II. Transaction Highlights
Mortgage Loan Sellers:
Mortgage Loan Seller | Number of Mortgage Loans | Number of Mortgaged Properties | Aggregate Cut-off Date Balance | % of Cut-off Date Pool Balance | ||||||
| Wells Fargo Bank, National Association | 17 | 20 | $373,046,122 | 42.6 | % | |||||
| The Royal Bank of Scotland plc | 4 | 4 | 148,750,000 | 17.0 | ||||||
| Rialto Mortgage Finance, LLC | 13 | 17 | 147,165,654 | 16.8 | ||||||
| Silverpeak Real Estate Finance, LLC | 9 | 15 | 105,911,164 | 12.1 | ||||||
| Basis Real Estate Capital II, LLC | 6 | 6 | 55,865,402 | 6.4 | ||||||
| C-III Commercial Mortgage LLC | 9 | 10 | 35,777,944 | 4.1 | ||||||
Liberty Island Group I LLC | 1 | 1 | 9,250,000 | 1.1 | ||||||
| Total | 59 | 73 | $875,766,284 | 100.0 | % | |||||
Loan Pool:
| Cut-off Date Balance: | $875,766,284 | |
| Number of Mortgage Loans: | 59 | |
| Average Cut-off Date Balance per Mortgage Loan: | $14,843,496 | |
| Number of Mortgaged Properties: | 73 | |
Average Cut-off Date Balance per Mortgaged Property(1): | $11,996,798 | |
| Weighted Average Mortgage Interest Rate: | 4.411% | |
| Ten Largest Mortgage Loans as % of Cut-off Date Pool Balance: | 56.4% | |
| Weighted Average Original Term to Maturity or ARD (months): | 115 | |
| Weighted Average Remaining Term to Maturity or ARD (months): | 114 | |
Weighted Average Original Amortization Term (months)(2): | 358 | |
Weighted Average Remaining Amortization Term (months)(2): | 357 | |
| Weighted Average Seasoning (months): | 1 | |
| (1) | Information regarding mortgage loans secured by multiple properties is based on an allocation according to relative appraised values or the allocated loan amounts or property-specific release prices set forth in the related loan documents or such other allocation as the related mortgage loan seller deemed appropriate. | |
| (2) | Excludes any mortgage loan that does not amortize. | |
Credit Statistics:
Weighted Average U/W Net Cash Flow DSCR(1): | 1.91x | |
Weighted Average U/W Net Operating Income Debt Yield Ratio(1): | 11.3% | |
Weighted Average Cut-off Date Loan-to-Value Ratio(1): | 62.0% | |
Weighted Average Balloon Loan-to-Value Ratio(1): | 55.0% | |
| % of Mortgage Loans with Additional Subordinate Debt: | 16.2% | |
% of Mortgage Loans with Single Tenants(2): | 6.9% | |
| (1) | With respect to each of the St. Johns Town Center mortgage loan, the Colorado Mills mortgage loan and the AMCP Portfolio mortgage loan, with respect to each of which the related mortgaged property secures one or more pari passu companion loans, and, in the case of the St. Johns Town Center mortgage loan, a related trust subordinate companion loan, loan-to-value ratio, debt service coverage ratio and debt yield calculations include the related pari passu companion loan(s) (unless otherwise stated) in total debt but do not include the trust subordinate companion loan. The debt service coverage ratio and debt yield calculations for each residential cooperative mortgage loan are calculated using underwritten net cash flow for the related residential cooperative property, which is the projected net cash flow reflected in the most recent appraisal obtained by or otherwise in the possession of the related mortgage loan seller as of the cut-off date, and the loan-to value ratio information for each residential cooperative mortgage loan is based upon the appraised value of the residential cooperative property determined as if such residential cooperative property is operated as a residential cooperative. See Annex A to the Free Writing Prospectus. Debt service coverage ratio, debt yield and loan-to-value ratio information does not take into account any subordinate debt (whether or not secured by the mortgaged property) that is allowed under the terms of any mortgage loan. | |
| (2) | Excludes mortgage loans that are secured by multiple single-tenant properties. | |
THE INFORMATION IN THIS STRUCTURAL AND COLLATERAL TERM SHEET IS NOT COMPLETE AND MAY BE AMENDED PRIOR TO THE TIME OF SALE. THIS TERM SHEET IS NOT AN OFFER TO SELL THESE SECURITIES AND IT IS NOT A SOLICITATION OF AN OFFER TO BUY THESE SECURITIES IN ANY JURISDICTION WHERE THE OFFER OR SALE IS NOT PERMITTED.
5
WFRBS Commercial Mortgage Trust 2014-C25 | Characteristics of the Mortgage Pool |
Loan Structural Features:
Amortization: Based on the Cut-off Date Pool Balance, 79.5% of the mortgage pool (55 mortgage loans) have scheduled amortization, as follows:
27.5% (28 mortgage loans) require amortization during the entire loan term
52.0% (27 mortgage loans) provide for an interest-only period followed by an amortization period
Interest-Only: Based on the Cut-off Date Pool Balance, 20.5% of the mortgage pool (4 mortgage loans) provides for interest-only payments during the entire loan term. The Weighted Average Cut-off Date Loan-to-Value Ratio and Weighted Average U/W Net Cash Flow DSCR for those mortgage loans is 43.5% and 3.03x, respectively.
Hard Lockboxes: Based on the Cut-off Date Pool Balance, 46.4% of the mortgage pool (17 mortgage loans) have hard lockboxes in place.
Reserves: The mortgage loans require amounts to be escrowed monthly as follows (excluding any mortgage loans with springing provisions):
| Real Estate Taxes: | 62.3% of the pool |
| Insurance Premiums: | 52.3% of the pool |
| Capital Replacements: | 73.8% of the pool |
| TI/LC: | 18.7% of the pool(1) |
| (1) The percentage of the Cut-off Date Balance for loans with TI/LC reserves is based on the aggregate principal balance allocable to office, retail, industrial, other, and mixed use properties. | |
Call Protection/Defeasance: Based on the Cut-off Date Pool Balance, the mortgage pool has the following call protection and defeasance features:
96.8% of the mortgage pool (54 mortgage loans) features a lockout period, then defeasance only until an open period;
3.2% of the mortgage pool (five mortgage loans) feature a lockout period, then require greater of yield maintenance or prepayment premium for a period until an open period;
Please refer to Annex A to the Free Writing Prospectus for further description of individual loan call protection.
THE INFORMATION IN THIS STRUCTURAL AND COLLATERAL TERM SHEET IS NOT COMPLETE AND MAY BE AMENDED PRIOR TO THE TIME OF SALE. THIS TERM SHEET IS NOT AN OFFER TO SELL THESE SECURITIES AND IT IS NOT A SOLICITATION OF AN OFFER TO BUY THESE SECURITIES IN ANY JURISDICTION WHERE THE OFFER OR SALE IS NOT PERMITTED.
6
| WFRBS Commercial Mortgage Trust 2014-C25 | Characteristics of the Mortgage Pool |
| III. | Issue Characteristics | |
| Securities Offered: | $754,253,000 approximate monthly pay, multi-class, commercial mortgage REMIC pass-through certificates consisting of twelve classes (Classes A-1, A-2, A-3, A-4, A-5, A-SB, A-S, B, C, PEX, X-A and X-B), which are offered pursuant to a registration statement filed with the SEC. | |
| Mortgage Loan Sellers: | Wells Fargo Bank, National Association (“WFB”); The Royal Bank of Scotland plc (“RBS”); Rialto Mortgage Finance, LLC (“RMF); Silverpeak Real Estate Finance LLC (SPREF); Basis Real Estate Capital II, LLC (“Basis”); C-III Commercial Mortgage LLC (“CIIICM”); and Liberty Island Group I LLC (“LIG I”) | |
| Co-lead Bookrunning Managers: | RBS Securities Inc. and Wells Fargo Securities, LLC | |
| Co-Managers: | Deutsche Bank Securities Inc. | |
| Rating Agencies: | DBRS, Inc., Moody’s Investors Service, Inc., and Morningstar Credit Ratings, LLC | |
| Master Servicer: | Wells Fargo Bank, National Association | |
| Special Servicer: | CWCapital Asset Management, LLC | |
| Certificate Administrator: | Wells Fargo Bank, National Association | |
| Trustee: | Wilmington Trust, National Association | |
| Trust Advisor: | Trimont Real Estate Advisors, Inc. | |
| Initial Majority Subordinate Certificateholder: | An affiliate of Seer Capital Management, LP | |
| Cut-off Date: | The Cut-off Date with respect to each mortgage loan is the due date for the monthly debt service payment that is due in December 2014 (or, in the case of any mortgage loan that has its first due date in January 2015, the date that would have been its due date in December 2014 under the terms of that mortgage loan if a monthly debt service payment were scheduled to be due in that month). | |
| Expected Closing Date: | On or about December 12, 2014. | |
| Determination Dates: | The eleventh day of each month (or if that day is not a business day, the next succeeding business day), commencing in January 2015. | |
| Distribution Dates: | The fourth business day following the Determination Date in each month, commencing in January 2015. | |
| Rated Final Distribution Date: | The Distribution Date in November 2047. | |
| Interest Accrual Period: | With respect to any Distribution Date, the calendar month preceding the month in which such Distribution Date occurs. | |
| Day Count: | The Offered Certificates will accrue interest on a 30/360 basis. | |
| Minimum Denominations: | $10,000 for each Class of Offered Certificates (other than the Class X-A and Class X-B Certificates) and $1,000,000 for the Class X-A and Class X-B Certificates. Investments may also be made in any whole dollar denomination in excess of the applicable minimum denomination. | |
| Clean-up Call: | 1% | |
| Delivery: | DTC, Euroclear and Clearstream Banking | |
| ERISA/SMMEA Status: | Each Class of Offered Certificates is expected to be eligible for exemptive relief under ERISA. No Class of Offered Certificates will be SMMEA eligible. | |
| Risk Factors: | THE CERTIFICATES INVOLVE CERTAIN RISKS AND MAY NOT BE SUITABLE FOR ALL INVESTORS. SEE THE “RISK FACTORS” SECTION OF THE FREE WRITING PROSPECTUS. | |
| Bond Analytics Information: | The Certificate Administrator will be authorized to make distribution date settlements, CREFC® reports and certain supplemental reports (other than confidential information) available to certain financial modeling and data provision services, including Bloomberg Financial Markets L.P., Trepp LLC, Intex Solutions, Inc., Markit Group Limited, Interactive Data Corp., BlackRock Financial Management, Inc. and CMBS.com, Inc. |
THE INFORMATION IN THIS STRUCTURAL AND COLLATERAL TERM SHEET IS NOT COMPLETE AND MAY BE AMENDED PRIOR TO THE TIME OF SALE. THIS TERM SHEET IS NOT AN OFFER TO SELL THESE SECURITIES AND IT IS NOT A SOLICITATION OF AN OFFER TO BUY THESE SECURITIES IN ANY JURISDICTION WHERE THE OFFER OR SALE IS NOT PERMITTED.
7
| WFRBS Commercial Mortgage Trust 2014-C25 | Characteristics of the Mortgage Pool |
IV. Characteristics of the Mortgage Pool(1)
A. Ten Largest Mortgage Loans
Mortgage Loan Seller | Mortgage Loan Name | City | State | Number of Mortgage Loans / Mortgaged Properties | Mortgage Loan Cut-off Date Balance ($) | % of Cut- off Date Pool Balance (%) | Property Type | Number of SF, Rooms, or Units | Cut-off Date Balance Per Unit of Measure($) | Cut-off Date LTV Ratio (%) | Balloon LTV Ratio (%) | U/W NCF DSCR (x) | U/W NOI Debt Yield (%) | |||||
| WFB | St. Johns Town Center | Jacksonville | FL | 1 / 1 | $100,000,000 | 11.4 | % | Retail | 981,157 | $207 | 26.8 | % | 26.8 | % | 3.81 | x | 15.4 | % |
| RBS | Colorado Mills | Lakewood | CO | 1 / 1 | 100,000,000 | 11.4 | Retail | 918,448 | 148 | 63.3 | 55.1 | 1.91 | 12.0 | |||||
| WFB | Plaza Vista | Kansas City | MO | 1 / 1 | 67,600,000 | 7.7 | Office | 253,720 | 266 | 64.6 | 64.6 | 2.10 | 9.9 | |||||
| WFB | Four Seasons Hotel – Seattle | Seattle | WA | 1 / 1 | 42,000,000 | 4.8 | Hospitality | 147 | 285,714 | 52.9 | 45.8 | 1.88 | 15.1 | |||||
| WFB | 529 Bryant Street | Palo Alto | CA | 1 / 1 | 38,600,000 | 4.4 | Other | 45,319 | 852 | 70.2 | 64.9 | 1.33 | 8.3 | |||||
| RMF | Granada Gardens | Warrensville Heights | OH | 1 / 1 | 34,500,000 | 3.9 | Multifamily | 940 | 36,702 | 73.4 | 64.4 | 1.50 | 9.9 | |||||
| SPREF | Tobin Lofts | San Antonio | TX | 1 / 1 | 34,457,384 | 3.9 | Multifamily | 552 | 62,423 | 69.5 | 56.9 | 1.37 | 8.9 | |||||
| WFB | Madison Park Office Portfolio | Winston-Salem | NC | 1 / 4 | 29,000,000 | 3.3 | Various | 482,835 | 60 | 72.5 | 63.6 | 1.31 | 10.0 | |||||
| RBS | Brookstone Park Apartments | Covington | LA | 1 / 1 | 24,500,000 | 2.8 | Multifamily | 240 | 102,083 | 74.2 | 67.7 | 1.35 | 8.1 | |||||
| RMF | Clarkwood Greens | Warrensville Heights | OH | 1 / 1 | 23,600,000 | 2.7 | Multifamily | 568 | 41,549 | 74.9 | 65.7 | 1.45 | 9.5 | |||||
| Top Three Total/Weighted Average | 3 / 3 | $267,600,000 | 30.6 | % | 50.0 | % | 46.9 | % | 2.67 | x | 12.7 | % | ||||||
| Top Five Total/Weighted Average | 5 / 5 | $348,200,000 | 39.8 | % | 52.6 | % | 48.8 | % | 2.42 | x | 12.5 | % | ||||||
| Top Ten Total/Weighted Average | 10 / 13 | $494,257,384 | 56.4 | % | 58.5 | % | 53.1 | % | 2.12 | x | 11.6 | % | ||||||
| Non-Top Ten Total/Weighted Average | 49 / 60 | $381,508,900 | 43.6 | % | 66.6 | % | 57.5 | % | 1.64 | x | 10.8 | % | ||||||
| (1) | With respect to the St. Johns Town Center mortgage loan, the Colorado Mills mortgage loan and the AMCP Portfolio mortgage loan, for which the related mortgaged properties secure one or more pari passu companion loans, and, in the case of the St. Johns Town Center mortgage loan, which also has a non-trust related subordinate companion loan, Cut-off Date Balance per unit of measure, loan-to-value ratio, debt service coverage ratio and debt yield calculations include the related pari passu companion loan (unless otherwise stated) in total debt but do not include the related non-trust subordinate companion loan. With respect to each mortgage loan, debt service coverage ratio, debt yield and loan-to-value ratio information takes no account of subordinate debt (whether or not secured by the related mortgaged property), if any, that is allowed under the terms of any mortgage loan. |
THE INFORMATION IN THIS STRUCTURAL AND COLLATERAL TERM SHEET IS NOT COMPLETE AND MAY BE AMENDED PRIOR TO THE TIME OF SALE. THIS TERM SHEET IS NOT AN OFFER TO SELL THESE SECURITIES AND IT IS NOT A SOLICITATION OF AN OFFER TO BUY THESE SECURITIES IN ANY JURISDICTION WHERE THE OFFER OR SALE IS NOT PERMITTED.
8
| WFRBS Commercial Mortgage Trust 2014-C25 | Characteristics of the Mortgage Pool |
B. Summary of Pari Passu Split Loan Structures
| Mortgage Loan Name | Mortgage Loan Seller | Related Notes in Loan Group (Original Balance) | Holder of Note | Whether Note is Lead Servicing for the Entire Loan Combination | Current Master Servicer Under Related Securitization PSA | Current Special Servicer Under Related Securitization PSA |
St. Johns Town Center(1) | WFB | $100,000,000 | WFRBS 2014-C25 | No | Wells Fargo Bank, National Association | CWCapital Asset Management, LLC |
| WFB | $103,500,000 | WFRBS 2014-C24(2) | Yes(3) | Rialto Capital Management | Rialto Capital Advisors, LLC | |
| Colorado Mills | RBS | $100,000,000 | WFRBS 2014-C25 | Yes | Wells Fargo Bank, National Association | CWCapital Asset Management, LLC |
| RBS | $36,000,000 | (4) | No | TBD | TBD | |
AMCP Portfolio(5) | SPREF | $8,000,000 | WFRBS 2014-C25 | (5) | Wells Fargo Bank, National Association | CWCapital Asset Management, LLC |
| SPREF | $16,050,000 | (6) | (5) | TBD | TBD |
(1) | St. Johns Town Center also includes a non-trust subordinate companion loan. See “C. Mortgage Loans with Additional Secured and Mezzanine Financing” below. |
(2) | The WFRBS 2014-C24 transaction is scheduled to close on November 18, 2014. |
(3) | The St. Johns Town Center note included in the WFRBS 2014-C24 trust fund and the related subordinate companion loan note, which is an asset of the WFRBS 2014-C24 trust fund together constitute the lead servicing note for the St Johns Center loan combination. |
(4) | The related pari passu companion loan Note A-2 is expected to be contributed to a future securitization. No assurance can be provided that Note A-2 will not be split further. |
(5) | The AMCP Portfolio will be serviced under the WFRBS 2014-C25 pooling and servicing agreement until the securitization of the related pari passu companion loan, after which such loan combination will be serviced under the pooling and servicing agreement related to the securitization of the pari passu companion loan. The master servicer under the latter pooling and servicing agreement will be identified in a notice, report or statement to holders of the WFRBS 2014-C25 certificates after the securitization of the pari passu companion loan. |
(6) | The related pari passu companion loan Note A-2 is expected to be contributed to a future securitization. No assurance can be provided that Note A-2 will not be split further. |
C. Mortgage Loans with Additional Secured and Mezzanine Financing
| Loan No. | Mortgage Loan Seller | Mortgage Loan Name | Mortgage Loan Cut-off Date Balance ($) | % of Cut- off Date Balance (%) | Sub Debt Cut-off Date Balance ($) | Mezzanine Debt Cut-off Date Balance ($) | Total Debt Interest Rate (%)(1) | Mortgage Loan U/W NCF DSCR (x) | Total Debt U/W NCF DSCR (x) | Mortgage Loan Cut-off Date U/W NOI Debt Yield (%) | Total Debt Cut-off Date U/W NOI Debt Yield (%) | Mortgage Loan Cut-off Date LTV Ratio (%) | Total Debt Cut-off Date LTV Ratio (%) | |
| 1 | WFB | St. Johns Town Center | $100,000,000 | 11.4% | $146,500,000 | $0 | 3.819% | 3.81x | 2.22x | 15.4% | 8.9% | 26.8% | 46.1% | |
| 4 | WFB | Four Seasons Hotel – Seattle(2) | 42,000,000 | 4.8 | 21,050,000(3) | 9,450,000(3) | 5.457 | 1.88 | 1.04 | 15.1 | 6.6 | 52.9 | 91.3 | |
| Total/Weighted Average | $142,000,000 | 16.2% | $167,550,000 | $9,450,000 | 4.303% | 3.24x | 1.87x | 15.3% | 8.2% | 34.5% | 59.5% | |||
(1) | Total Debt Interest Rate for any specified mortgage loan reflects the weighted average of the interest rates on the respective components of the total debt. |
(2) | The Four Seasons Hotel - Seattle Property has a subordinate second mortgage and the equity interests in the Four Seasons Hotel - Seattle Mortgage Loan borrowers and certain affiliates have been pledged to secure additional subordinate indebtedness. All subordinate debt payments are currently accruing and are only required to be paid to the extent there is excess cash flow after payment of debt service on the Four Seasons Hotel – Seattle Mortgage Loan. |
(3) | Subordinate debt cut-off balances for the Four Seasons Hotel – Seattle are as of 6/30/2014. |
THE INFORMATION IN THIS STRUCTURAL AND COLLATERAL TERM SHEET IS NOT COMPLETE AND MAY BE AMENDED PRIOR TO THE TIME OF SALE. THIS TERM SHEET IS NOT AN OFFER TO SELL THESE SECURITIES AND IT IS NOT A SOLICITATION OF AN OFFER TO BUY THESE SECURITIES IN ANY JURISDICTION WHERE THE OFFER OR SALE IS NOT PERMITTED.
9
| WFRBS Commercial Mortgage Trust 2014-C25 | Characteristics of the Mortgage Pool |
D. Previous Securitization History(1)
Loan No. | Mortgage Loan Seller | Mortgage Loan or Mortgaged Property Name | City | State | Property Type | Mortgage Loan or Mortgaged Property Cut-off Date Balance ($) | % of Cut-off Date Pool Balance (%) | Previous Securitization |
| 1 | WFB | St. Johns Town Center | Jacksonville | FL | Retail | $100,000,000 | 11.4% | CSFB 2005-C5 |
| 12 | RBS | All Storage Keller Haslet & Katy | Keller | TX | Self Storage | 19,850,000 | 2.3 | JPMCC 2004-CBX |
| 16.01 | RMF | Hunteridge | Jonesboro | GA | Manufactured Housing Community | 10,224,885 | 1.2 | BALL 2007-BMB1; MLCFC 2007-8; MLCFC 2007-9; MLMT 2008-C1 |
| 16.02 | RMF | Riverdale | Riverdale | GA | Manufactured Housing Community | 5,410,527 | 0.6 | BALL 2007-BMB1; MLCFC 2007-8; MLCFC 2007-9; MLMT 2008-C1 |
| 16.03 | RMF | Jonesboro | Jonesboro | GA | Manufactured Housing Community | 843,637 | 0.1 | BALL 2007-BMB1; MLCFC 2007-8; MLCFC 2007-9; MLMT 2008-C1 |
| 18 | Basis | Six Trails Apartments | Saline | MI | Multifamily | 13,125,000 | 1.5 | WFRBS 2012-C6 |
| 25 | LIG I | The Village at Mirror Lake | Villa Rica | GA | Retail | 9,250,000 | 1.1 | WBCMT 2005-C16 |
| 28 | SPREF | 276 Post Road West | Westport | CT | Office | 8,750,000 | 1.0 | CSFB 2002-CP3 |
| 30 | WFB | Abbey Park Apartments | Grand Blanc | MI | Multifamily | 7,957,705 | 0.9 | MSC 2005-T17 |
| 31 | RMF | Hawthorne 40 Shopping Center | Kansas City | MO | Retail | 7,715,156 | 0.9 | JPMCC 2005-LDP1 |
| 50.02 | CIIICM | Mooresville II & III | Mooresville | IN | Retail | 1,605,000 | 0.2 | MSC 2005-IQ9 |
| 56 | Basis | Shops at Bay City Mall | Bay City | MI | Retail | 2,147,255 | 0.2 | JPMCC 2004-CBX |
| 59 | CIIICM | Honeydale MHP | Brownsville | TX | Manufactured Housing Community | 1,498,241 | 0.2 | JPMCC 2005-LDP1 |
| Total | $188,377,406 | 21.5% | ||||||
(1) The table above represents the most recent securitization with respect to the mortgaged property securing the related mortgage loan, based on information provided by the related borrower or obtained through searches of a third-party database. While the above mortgage loans may have been securitized multiple times in prior transactions, mortgage loans are only listed in the above chart if the mortgage loan paid off a mortgage loan in another securitization. The information in the table above has not otherwise been confirmed by the mortgage loan sellers.
THE INFORMATION IN THIS STRUCTURAL AND COLLATERAL TERM SHEET IS NOT COMPLETE AND MAY BE AMENDED PRIOR TO THE TIME OF SALE. THIS TERM SHEET IS NOT AN OFFER TO SELL THESE SECURITIES AND IT IS NOT A SOLICITATION OF AN OFFER TO BUY THESE SECURITIES IN ANY JURISDICTION WHERE THE OFFER OR SALE IS NOT PERMITTED.
10
| WFRBS Commercial Mortgage Trust 2014-C25 | Characteristics of the Mortgage Pool |
E. Mortgage Loans with Scheduled Balloon Payments and Related Classes
Class A-2(1) | ||||||||||||||||
| Loan No. | Mortgage Loan Seller | Mortgage Loan Name | State | Property Type | Mortgage Loan Cut-off Date Balance ($) | % of Cut-off Date Pool Balance (%) | Mortgage Loan Balance at Maturity ($) | % of Class A-2 Certificate Principal Balance (%)(2) | Units/SF /Rooms | Loan per Unit/SF/ Room ($) | U/W NCF DSCR (x) | U/W NOI Debt Yield (%) | Cut-off Date LTV Ratio (%) | Balloon LTV Ratio (%) | Rem. IO Period (mos.) | Rem. Term to Maturity (mos.) |
| 17 | SPREF | Sharon Park | TX | Multifamily | $16,475,328 | 1.9% | $14,920,148 | 34.9% | 636 | $25,905 | 1.98x | 12.2% | 59.9% | 54.3% | 0 | 59 |
| 20 | Basis | Elsinore Courtyard Apartments | DC | Multifamily | 12,200,000 | 1.4 | 11,303,174 | 26.5 | 152 | 80,263 | 1.24 | 8.7 | 69.3 | 64.2 | 0 | 60 |
| 21 | RMF | Kensington Commons | OH | Multifamily | 12,000,000 | 1.4 | 11,413,322 | 26.7 | 264 | 45,455 | 1.43 | 9.2 | 69.6 | 66.2 | 23 | 59 |
| 50 | CIIICM | Stones Crossing II & Mooresville II & III | IN | Retail | 3,725,000 | 0.4 | 3,316,907 | 7.8 | 36,516 | 102 | 1.43 | 10.9 | 70.3 | 62.6 | 0 | 60 |
| Total/Weighted Average | $44,400,328 | 5.1% | $40,953,551 | 95.8% | 1.58x | 10.3% | 66.0% | 60.9% | 6 | 59 | ||||||
| (1) | The table above presents the mortgage loans whose balloon payments would be applied to pay down the principal balance of the Class A-2 Certificates, assuming a 0% CPR and applying the “Structuring Assumptions” described in the Free Writing Prospectus, including the assumptions that (i) none of the mortgage loans in the pool experience prepayments, defaults or losses; (ii) there are no extensions of maturity dates of any mortgage loans in the pool; and (iii) each mortgage loan in the pool is paid in full on its stated maturity date. Each class of Certificates, including the Class A-2 Certificates, evidences undivided ownership interests in the entire pool of mortgage loans. |
| (2) | Reflects the Mortgage Loan Balance at Maturity divided by the initial Class A-2 Certificate Principal Balance expressed as a percentage. |
Class A-3(1) | ||||||||||||||||
| Loan No. | Mortgage Loan Seller | Mortgage Loan Name | State | Property Type | Mortgage Loan Cut-off Date Balance ($) | % of Cut-off Date Pool Balance (%) | Mortgage Loan Balance at Maturity ($) | % of Class A-3 Certificate Principal Balance (%)(2) | Units/SF /Pads | Loan per Unit/SF/ Pads ($) | U/W NCF DSCR (x) | U/W NOI Debt Yield (%) | Cut-off Date LTV Ratio (%) | Balloon LTV Ratio (%) | Rem. IO Period (mos.) | Rem. Term to Maturity (mos.) |
| 15 | WFB | Vista Verde Apartments | FL | Multifamily | $16,650,000 | 1.9% | $15,807,961 | 44.6% | 200 | $83,250 | 1.26x | 7.8% | 74.3% | 70.6% | 47 | 83 |
| 23 | WFB | The Falls at Tampa Bay | FL | Multifamily | 11,000,000 | 1.3 | 10,422,432 | 29.4 | 241 | 45,643 | 1.44 | 8.9 | 75.9 | 71.9 | 47 | 83 |
| 24 | RMF | Creekside Village of Fairfield | OH | Multifamily | 9,800,000 | 1.1 | 9,206,162 | 26.0 | 229 | 42,795 | 1.62 | 10.5 | 73.7 | 69.2 | 35 | 83 |
| Total/Weighted Average | $37,450,000 | 4.3% | $35,436,354 | 100.0% | 1.41x | 8.8% | 74.6% | 70.6% | 44 | 83 | ||||||
| (1) | The table above presents the mortgage loans whose balloon payments would be applied to pay down the principal balance of the Class A-3 Certificates, assuming a 0% CPR and applying the “Structuring Assumptions” described in the Free Writing Prospectus, including the assumptions that (i) none of the mortgage loans in the pool experience prepayments, defaults or losses; (ii) there are no extensions of maturity dates of any mortgage loans in the pool; and (iii) each mortgage loan in the pool is paid in full on its stated maturity date. Each class of Certificates, including the Class A-3 Certificates, evidences undivided ownership interests in the entire pool of mortgage loans. |
| (2) | Reflects the Mortgage Loan Balance at Maturity divided by the initial Class A-3 Certificate Principal Balance expressed as a percentage. |
THE INFORMATION IN THIS STRUCTURAL AND COLLATERAL TERM SHEET IS NOT COMPLETE AND MAY BE AMENDED PRIOR TO THE TIME OF SALE. THIS TERM SHEET IS NOT AN OFFER TO SELL THESE SECURITIES AND IT IS NOT A SOLICITATION OF AN OFFER TO BUY THESE SECURITIES IN ANY JURISDICTION WHERE THE OFFER OR SALE IS NOT PERMITTED.
11
| WFRBS Commercial Mortgage Trust 2014-C25 | Characteristics of the Mortgage Pool |
F. Property Type Distribution(1)
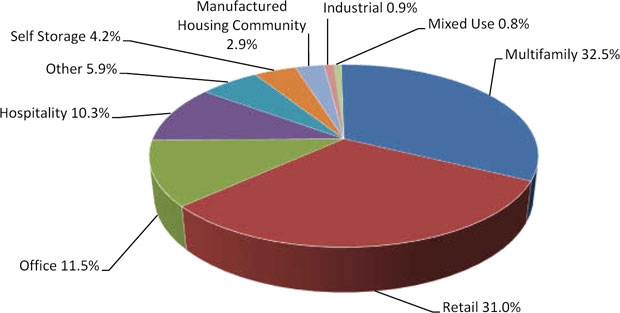
| Property Type | Number of Mortgaged Properties | Aggregate Cut- off Date Balance ($) | % of Cut- off Date Pool Balance (%) | Weighted Average Cut-off Date LTV Ratio (%) | Weighted Average Balloon LTV Ratio (%) | Weighted Average U/W NCF DSCR (x) | Weighted Average U/W NOI Debt Yield (%) | Weighted Average U/W NCF Debt Yield (%) | Weighted Average Mortgage Rate (%) | ||
| Multifamily | 24 | $284,937,132 | 32.5% | 69.2% | 61.1% | 1.53x | 10.0% | 9.4% | 4.517% | ||
| Garden | 18 | 202,386,770 | 23.1 | 71.3 | 63.9 | 1.53 | 9.8 | 9.2 | 4.454 | ||
| Student Housing | 2 | 51,307,384 | 5.9 | 69.7 | 59.2 | 1.36 | 8.7 | 8.5 | 4.653 | ||
| Low Rise | 2 | 14,197,366 | 1.6 | 67.7 | 61.7 | 1.25 | 8.7 | 8.3 | 5.196 | ||
| Mid Rise | 1 | 9,087,907 | 1.0 | 58.1 | 47.0 | 1.31 | 8.2 | 7.9 | 4.450 | ||
| Senior Housing | 1 | 7,957,705 | 0.9 | 28.9 | 17.7 | 3.41 | 25.7 | 25.1 | 4.100 | ||
| Retail | 16 | 271,532,792 | 31.0 | 51.0 | 45.2 | 2.52 | 12.9 | 12.2 | 4.198 | ||
| Regional Mall | 2 | 200,000,000 | 22.8 | 45.1 | 41.0 | 2.86 | 13.7 | 13.1 | 4.051 | ||
| Anchored | 7 | 46,336,248 | 5.3 | 69.6 | 57.7 | 1.54 | 10.8 | 9.7 | 4.643 | ||
| Shadow Anchored | 4 | 16,891,544 | 1.9 | 63.9 | 53.9 | 1.58 | 10.5 | 9.6 | 4.520 | ||
| Unanchored | 2 | 4,705,000 | 0.5 | 73.2 | 63.4 | 1.38 | 9.4 | 8.8 | 4.701 | ||
| Single Tenant | 1 | 3,600,000 | 0.4 | 52.2 | 52.2 | 2.24 | 10.3 | 10.2 | 4.500 | ||
| Office | 6 | 100,700,000 | 11.5 | 66.7 | 64.3 | 1.89 | 10.0 | 8.8 | 4.400 | ||
| Suburban | 5 | 96,550,000 | 11.0 | 66.5 | 64.7 | 1.90 | 9.8 | 8.8 | 4.387 | ||
| CBD | 1 | 4,150,000 | 0.5 | 69.2 | 56.3 | 1.60 | 13.5 | 10.0 | 4.700 | ||
| Hospitality | 7 | 90,293,374 | 10.3 | 58.0 | 49.3 | 1.80 | 13.5 | 11.1 | 4.551 | ||
| Full Service | 2 | 62,000,000 | 7.1 | 55.0 | 47.8 | 1.82 | 14.1 | 11.1 | 4.468 | ||
| Limited Service | 5 | 28,293,374 | 3.2 | 64.6 | 52.7 | 1.75 | 12.4 | 11.0 | 4.732 | ||
| Other | 3 | 51,657,500 | 5.9 | 70.1 | 63.8 | 1.34 | 8.7 | 8.2 | 4.476 | ||
| Data Center | 2 | 47,400,000 | 5.4 | 70.6 | 64.7 | 1.33 | 8.6 | 8.1 | 4.494 | ||
| Leased Fee | 1 | 4,257,500 | 0.5 | 64.5 | 54.7 | 1.53 | 9.2 | 9.1 | 4.270 | ||
| Self Storage | 5 | 36,733,924 | 4.2 | 69.6 | 56.5 | 1.62 | 10.2 | 9.9 | 4.561 | ||
| Self Storage | 5 | 36,733,924 | 4.2 | 69.6 | 56.5 | 1.62 | 10.2 | 9.9 | 4.561 | ||
| Manufactured Housing Community | 6 | 25,070,500 | 2.9 | 62.2 | 50.7 | 1.96 | 13.1 | 12.2 | 4.659 | ||
| Manufactured Housing Community | 6 | 25,070,500 | 2.9 | 62.2 | 50.7 | 1.96 | 13.1 | 12.2 | 4.659 | ||
| Industrial | 5 | 8,000,000 | 0.9 | 70.7 | 64.6 | 1.63 | 10.5 | 9.8 | 4.394 | ||
| Warehouse | 5 | 8,000,000 | 0.9 | 70.7 | 64.6 | 1.63 | 10.5 | 9.8 | 4.394 | ||
| Mixed Use | 1 | 6,841,061 | 0.8 | 71.3 | 57.8 | 1.39 | 9.4 | 8.5 | 4.550 | ||
| Retail/Office | 1 | 6,841,061 | 0.8 | 71.3 | 57.8 | 1.39 | 9.4 | 8.5 | 4.550 | ||
| Total/Weighted Average | 73 | $875,766,284 | 100.0% | 62.0% | 55.0% | 1.91x | 11.3% | 10.4% | 4.411% | ||
| (1) | Because this table presents information relating to the mortgaged properties and not the mortgage loans, the information for mortgage loans secured by more than one mortgaged property is based on allocated amounts (allocating the mortgage loan principal balance to each of those properties according to the relative appraised values of the mortgaged properties or the allocated loan amounts or property-specific release prices set forth in the related mortgage loan documents or such other allocation as the related mortgage loan seller deemed appropriate). Debt service coverage ratio, debt yield and loan-to-value ratio information takes no account of subordinate debt (whether or not secured by the mortgaged property), if any, that is allowed under the terms of any mortgage loan. With respect to the St. Johns Town Center mortgage loan, the Colorado Mills mortgage loan and the AMCP Portfolio mortgage loan, loan-to-value ratio, debt service coverage ratio and debt yield calculations include the related pari passu companion loan (unless otherwise stated) in total debt but, with respect to the St. Johns Town Center mortgage loan, do not include the related non-trust subordinate companion loan (unless otherwise stated). |
THE INFORMATION IN THIS STRUCTURAL AND COLLATERAL TERM SHEET IS NOT COMPLETE AND MAY BE AMENDED PRIOR TO THE TIME OF SALE. THIS TERM SHEET IS NOT AN OFFER TO SELL THESE SECURITIES AND IT IS NOT A SOLICITATION OF AN OFFER TO BUY THESE SECURITIES IN ANY JURISDICTION WHERE THE OFFER OR SALE IS NOT PERMITTED.
12
| WFRBS Commercial Mortgage Trust 2014-C25 | Characteristics of the Mortgage Pool |
G. Geographic Distribution(1)(2)
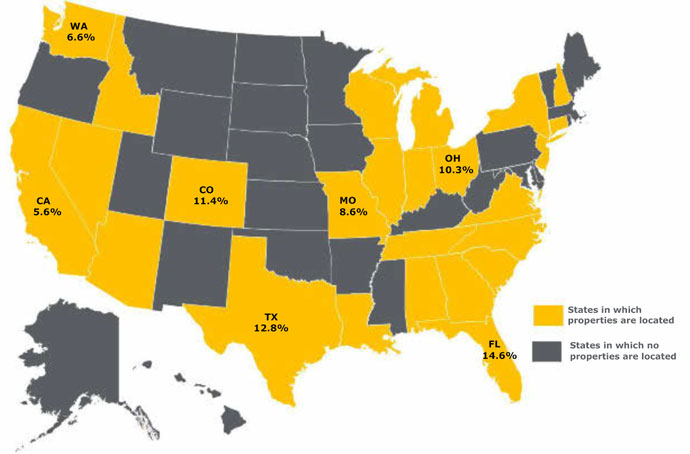
Location(3) | Number of Mortgaged Properties | Aggregate Cut-off Date Balance ($) | % of Cut-off Date Pool Balance | Weighted Average Cut-off Date LTV Ratio (%) | Weighted Average Balloon LTV Ratio (%) | Weighted Average U/W NCF DSCR (x) | Weighted Average U/W NOI Debt Yield (%) | Weighted Average U/W NCF Debt Yield (%) | Weighted Average Mortgage Rate (%) | ||||||||
| Florida | 3 | $127,650,000 | 14.6% | 37.2% | 36.4% | 3.27x | 13.8% | 13.3% | 3.901% | ||||||||
| Texas | 13 | 111,742,561 | 12.8 | 67.9 | 56.9 | 1.57 | 10.2 | 9.6 | 4.547 | ||||||||
| Colorado | 1 | 100,000,000 | 11.4 | 63.3 | 55.1 | 1.91 | 12.0 | 11.3 | 4.282 | ||||||||
| Ohio | 6 | 90,393,210 | 10.3 | 72.6 | 64.6 | 1.50 | 9.8 | 9.2 | 4.594 | ||||||||
| Missouri | 2 | 75,315,156 | 8.6 | 65.7 | 64.2 | 2.04 | 10.0 | 9.1 | 4.330 | ||||||||
| Washington | 4 | 57,629,549 | 6.6 | 53.6 | 45.6 | 1.79 | 13.8 | 10.9 | 4.512 | ||||||||
| California | 3 | 49,116,215 | 5.6 | 70.0 | 63.0 | 1.34 | 8.5 | 8.2 | 4.483 | ||||||||
| Northern | 2 | 45,441,061 | 5.2 | 70.4 | 63.8 | 1.34 | 8.5 | 8.2 | 4.482 | ||||||||
| Southern | 1 | 3,675,154 | 0.4 | 65.7 | 53.2 | 1.33 | 8.6 | 8.1 | 4.500 | ||||||||
Other States(4) | 41 | 263,919,593 | 30.1 | 66.7 | 57.8 | 1.63 | 11.0 | 10.1 | 4.573 | ||||||||
| Total/Weighted Average | 73 | $875,766,284 | 100.0% | 62.0% | 55.0% | 1.91x | 11.3% | 10.4% | 4.411% | ||||||||
(1) | The mortgaged properties are located in 25 states and the District of Columbia. |
(2) | Because this table presents information relating to the mortgaged properties and not the mortgage loans, the information for mortgage loans secured by more than one mortgaged property is based on allocated amounts (allocating the mortgage loan principal balance to each of those properties according to the relative appraised values of the mortgaged properties or the allocated loan amounts or property-specific release prices set forth in the related mortgage loan documents or such other allocation as the related mortgage loan seller deemed appropriate). Debt service coverage ratio, debt yield and loan-to-value ratio information takes no account of subordinate debt (whether or not secured by the mortgaged property), if any, that is allowed under the terms of any mortgage loan. With respect to the St. Johns Town Center mortgage loan, the Colorado Mills mortgage loan and the AMCP Portfolio mortgage loan, loan-to-value ratio, debt service coverage ratio and debt yield calculations include the related pari passu companion loan in total debt but, with respect to the St. Johns Town Center mortgage loan, do not include the related non-trust subordinate companion loan (unless otherwise stated). |
(3) | For purposes of determining whether a mortgaged property is in Northern California or Southern California, Northern California includes areas with zip codes above 93600 and Southern California includes areas with zip codes of 93600 and below. |
(4) | Includes 18 other states and the District of Columbia. |
THE INFORMATION IN THIS STRUCTURAL AND COLLATERAL TERM SHEET IS NOT COMPLETE AND MAY BE AMENDED PRIOR TO THE TIME OF SALE. THIS TERM SHEET IS NOT AN OFFER TO SELL THESE SECURITIES AND IT IS NOT A SOLICITATION OF AN OFFER TO BUY THESE SECURITIES IN ANY JURISDICTION WHERE THE OFFER OR SALE IS NOT PERMITTED.
13
| WFRBS Commercial Mortgage Trust 2014-C25 | Characteristics of the Mortgage Pool |
H. Characteristics of the Mortgage Pool(1)
CUT-OFF DATE BALANCE
Range of Cut-off Date Balances ($) | Number of Mortgage Loans | Aggregate Cut- off Date Balance ($) | % of Cut-off Date Pool Balance |
| 1,498,241 - 2,000,000 | 2 | $3,495,607 | 0.4% |
| 2,000,001 - 3,000,000 | 3 | 7,134,255 | 0.8 |
| 3,000,001 - 4,000,000 | 6 | 20,952,154 | 2.4 |
| 4,000,001 - 5,000,000 | 11 | 48,522,730 | 5.5 |
| 5,000,001 - 6,000,000 | 4 | 22,013,647 | 2.5 |
| 6,000,001 - 7,000,000 | 2 | 13,091,061 | 1.5 |
| 7,000,001 - 8,000,000 | 3 | 23,672,861 | 2.7 |
| 8,000,001 - 9,000,000 | 2 | 17,733,388 | 2.0 |
| 9,000,001 - 10,000,000 | 3 | 28,137,907 | 3.2 |
| 10,000,001 - 15,000,000 | 6 | 71,994,962 | 8.2 |
| 15,000,001 - 20,000,000 | 7 | 124,760,329 | 14.2 |
| 20,000,001 - 30,000,000 | 3 | 77,100,000 | 8.8 |
| 30,000,001 - 50,000,000 | 4 | 149,557,384 | 17.1 |
| 50,000,001 - 90,000,000 | 1 | 67,600,000 | 7.7 |
| 90,000,001 - 100,000,000 | 2 | 200,000,000 | 22.8 |
| Total | 59 | $875,766,284 | 100% |
| Average | $14,843,496 |
| UNDERWRITTEN NOI DEBT SERVICE COVERAGE RATIO | |||
Range of U/W NOI DSCRs (x) | Number of Mortgage Loans | Aggregate Cut- off Date Balance ($) | % of Cut-off Date Pool Balance |
| 1.21 - 1.30 | 1 | $12,200,000 | 1.4% |
| 1.31 - 1.40 | 8 | 151,126,045 | 17.3 |
| 1.41 - 1.50 | 6 | 34,448,395 | 3.9 |
| 1.51 - 1.60 | 9 | 72,905,381 | 8.3 |
| 1.61 - 1.70 | 9 | 127,489,424 | 14.6 |
| 1.71 - 1.80 | 5 | 33,788,537 | 3.9 |
| 1.81 - 1.90 | 5 | 40,120,363 | 4.6 |
| 1.91 - 2.00 | 3 | 30,293,147 | 3.5 |
| 2.01 - 2.25 | 6 | 142,804,378 | 16.3 |
| 2.26 - 2.75 | 3 | 114,144,275 | 13.0 |
| 2.76 – 3.00 | 1 | 4,194,667 | 0.5 |
| 3.01 – 3.50 | 1 | 7,957,705 | 0.9 |
| 3.51 – 3.97 | 2 | 104,293,968 | 11.9 |
| Total: | 59 | $875,766,284 | 100.0% |
| Weighted Average: | 2.06x | ||
| UNDERWRITTEN NCF DEBT SERVICE COVERAGE RATIO | |||
Range of U/W NCF DSCRs (x) | Number of Mortgage Loans | Aggregate Cut- off Date Balance ($) | % of Cut-off Date Pool Balance |
| 1.24 - 1.30 | 3 | $37,833,388 | 4.3% |
| 1.31 - 1.40 | 14 | 196,176,933 | 22.4 |
| 1.41 - 1.50 | 8 | 97,012,000 | 11.1 |
| 1.51 - 1.60 | 7 | 36,878,156 | 4.2 |
| 1.61 - 1.70 | 12 | 123,334,458 | 14.1 |
| 1.71 - 1.80 | 2 | 10,286,356 | 1.2 |
| 1.81 - 1.90 | 2 | 47,000,000 | 5.4 |
| 1.91 - 2.00 | 2 | 116,475,328 | 13.3 |
| 2.01 - 2.25 | 5 | 94,323,325 | 10.8 |
| 2.26 - 2.50 | 1 | 4,194,667 | 0.5 |
| 2.51 - 3.50 | 2 | 12,251,674 | 1.4 |
| 3.51 - 3.81 | 1 | 100,000,000 | 11.4 |
| Total: | 59 | $875,766,284 | 100.0% |
| Weighted Average: | 1.91x | ||
| LOAN PURPOSE | |||
| Loan Purpose | Number of Mortgage Loans | Aggregate Cut- off Date Balance ($) | % of Cut-off Date Pool Balance |
| Refinance | 40 | $674,122,201 | 77.0% |
| Acquisition | 19 | 201,644,083 | 23.0 |
| Total: | 59 | $875,766,284 | 100.0% |
| MORTGAGE RATE | |||
Range of Mortgage Rates (%) | Number of Mortgage Loans | Aggregate Cut- off Date Balance ($) | % of Cut-off Date Pool Balance |
| 3.791 - 4.000 | 2 | $116,475,328 | 13.3% |
| 4.001 - 4.250 | 5 | 64,601,674 | 7.4 |
| 4.251 - 4.500 | 16 | 345,613,814 | 39.5 |
| 4.501 - 4.750 | 25 | 242,658,035 | 27.7 |
| 4.751 - 5.000 | 7 | 85,194,193 | 9.7 |
| 5.001 - 5.250 | 3 | 9,023,241 | 1.0 |
| 5.251 - 5.310 | 1 | 12,200,000 | 1.4 |
| Total: | 59 | $875,766,284 | 100.0% |
| Weighted Average: | 4.411% | ||
| UNDERWRITTEN NOI DEBT YIELD | |||
Range of U/W NOI Debt Yields (%) | Number of Mortgage Loans | Aggregate Cut- off Date Balance ($) | % of Cut-off Date Pool Balance |
| 7.8 - 8.9 | 14 | $203,242,812 | 23.2% |
| 9.0 - 9.9 | 12 | 174,562,009 | 19.9 |
| 10.0 - 10.9 | 13 | 117,476,924 | 13.4 |
| 11.0 - 11.9 | 8 | 73,289,547 | 8.4 |
| 12.0 - 12.9 | 3 | 121,475,328 | 13.9 |
| 13.0 - 13.9 | 1 | 4,150,000 | 0.5 |
| 14.0 - 14.9 | 3 | 23,123,325 | 2.6 |
| 15.0 - 16.9 | 2 | 142,000,000 | 16.2 |
| 17.0 - 17.9 | 1 | 4,194,667 | 0.5 |
| 18.0 - 25.7 | 2 | 12,251,674 | 1.4 |
| Total: | 59 | $875,766,284 | 100.0% |
| Weighted Average: | 11.3% | ||
| UNDERWRITTEN NCF DEBT YIELD | |||
Range of U/W NCF Debt Yields (%) | Number of Mortgage Loans | Aggregate Cut- off Date Balance ($) | % of Cut-off Date Pool Balance |
| 7.5 - 7.9 | 3 | $50,237,907 | 5.7% |
| 8.0 - 8.9 | 18 | 243,124,172 | 27.8 |
| 9.0 - 9.9 | 15 | 180,472,685 | 20.6 |
| 10.0 - 10.9 | 12 | 98,886,525 | 11.3 |
| 11.0 - 11.9 | 4 | 163,475,328 | 18.7 |
| 12.0 - 12.9 | 1 | 16,479,050 | 1.9 |
| 13.0 - 13.9 | 2 | 6,644,275 | 0.8 |
| 14.0 - 25.1 | 4 | 116,446,341 | 13.3 |
| Total: | 59 | $875,766,284 | 100.0% |
| Weighted Average: | 10.4% | ||
| (1) | The information in this “Characteristics of the Mortgage Pool” section has been calculated in accordance with the methodologies specified in footnote (1) to the table captioned “Credit Statistics” under the “Transaction Highlights” section above. |
THE INFORMATION IN THIS STRUCTURAL AND COLLATERAL TERM SHEET IS NOT COMPLETE AND MAY BE AMENDED PRIOR TO THE TIME OF SALE. THIS TERM SHEET IS NOT AN OFFER TO SELL THESE SECURITIES AND IT IS NOT A SOLICITATION OF AN OFFER TO BUY THESE SECURITIES IN ANY JURISDICTION WHERE THE OFFER OR SALE IS NOT PERMITTED.
14
| WFRBS Commercial Mortgage Trust 2014-C25 | Characteristics of the Mortgage Pool |
| ORIGINAL TERM TO MATURITY | |||
Range of Original Terms to Maturity (months) | Number of Mortgage Loans | Aggregate Cut- off Date Balance ($) | % of Cut-off Date Pool Balance |
| 60 | 4 | $44,400,328 | 5.1% |
| 84 | 3 | 37,450,000 | 4.3 |
| 120 | 52 | 793,915,956 | 90.7 |
| Total: | 59 | $875,766,284 | 100.0% |
| Weighted Average: | 115 months | ||
| REMAINING TERM TO MATURITY | |||
| Range of Remaining Terms to Maturity (months) | Number of Mortgage Loans | Aggregate Cut- off Date Balance ($) | % of Cut-off Date Pool Balance |
| 59 - 60 | 4 | $44,400,328 | 5.1% |
| 61 - 84 | 3 | 37,450,000 | 4.3 |
| 85 - 120 | 52 | 793,915,956 | 90.7 |
| Total: | 59 | $875,766,284 | 100.0% |
| Weighted Average: | 114 months | ||
ORIGINAL AMORTIZATION TERM(2) | |||
Range of Original Amortization Terms (months) | Number of Mortgage Loans | Aggregate Cut- off Date Balance ($) | % of Cut-off Date Pool Balance |
| Non-Amortizing | 4 | $179,950,000 | 20.5% |
| 240 | 1 | 7,957,705 | 0.9 |
| 241 - 300 | 2 | 12,708,388 | 1.5 |
| 301 - 360 | 52 | 675,150,192 | 77.1 |
| Total: | 59 | $875,766,284 | 100.0% |
Weighted Average(3): | 358 months | ||
(2) The original amortization term shown for any mortgage loan that is interest-only for part of its term does not include the number of months in its interest-only period and reflects only the number of months as of the commencement of amortization remaining from the end of such interest-only period. (3) Excludes the non-amortizing loans. | |||
REMAINING AMORTIZATION TERM(4) | |||
Range of Remaining Amortization Terms (months) | Number of Mortgage Loans | Aggregate Cut- off Date Balance ($) | % of Cut-off Date Pool Balance |
| Non-Amortizing | 4 | $179,950,000 | 20.5% |
| 238 | 1 | 7,957,705 | 0.9 |
| 241 - 300 | 2 | 12,708,388 | 1.5 |
| 301 - 360 | 52 | 675,150,192 | 77.1 |
| Total: | 59 | $875,766,284 | 100.0% |
Weighted Average(5): | 357 months | ||
(4) The remaining amortization term shown for any mortgage loan that is interest-only for part of its term does not include the number of months in its interest-only period and reflects only the number of months as of the commencement of amortization remaining from the end of such interest-only period. (5) Excludes the non-amortizing loans. | |||
LOCKBOXES
| Type of Lockbox | Number of Mortgage Loans | Aggregate Cut- off Date Balance ($) | % of Cut-off Date Pool Balance |
| Springing (W/Out Estab Account) | 31 | $307,516,207 | 35.1% |
| Hard/Springing Cash Management | 13 | 287,530,793 | 32.8 |
| Hard/Upfront Cash Management | 4 | 118,550,000 | 13.5 |
| Soft/Upfront Cash Management | 2 | 76,457,384 | 8.7 |
| Soft/Springing Cash Management | 4 | 57,673,871 | 6.6 |
| None | 4 | 22,744,884 | 2.6 |
| Springing (With Estab. Account) | 1 | 5,293,147 | 0.6 |
| Total: | 59 | $875,766,284 | 100.0% |
PREPAYMENT PROVISION SUMMARY
| Prepayment Provision | Number of Mortgage Loans | Aggregate Cut- off Date Balance ($) | % of Cut-off Date Pool Balance |
| Lockout/Defeasance/Open | 54 | $847,901,038 | 96.8% |
| Lockout/GRTR 1% or YM%/Open | 5 | 27,865,246 | 3.2 |
| Total: | 59 | $875,766,284 | 100.0% |
| CUT-OFF DATE LOAN-TO-VALUE RATIO | |||
Range of Cut-off Date LTV Ratios (%) | Number of Mortgage Loans | Aggregate Cut- off Date Balance ($) | % of Cut-off Date Pool Balance |
| 26.8 - 40.0 | 2 | $107,957,705 | 12.3% |
| 40.1 - 45.0 | 1 | 4,293,968 | 0.5 |
| 45.1 - 50.0 | 2 | 8,738,943 | 1.0 |
| 50.1 - 55.0 | 2 | 45,600,000 | 5.2 |
| 55.1 - 60.0 | 7 | 60,903,811 | 7.0 |
| 60.1 - 65.0 | 9 | 208,097,226 | 23.8 |
| 65.1 - 70.0 | 13 | 148,080,707 | 16.9 |
| 70.1 - 75.0 | 20 | 267,915,717 | 30.6 |
| 75.1 - 75.9 | 3 | 24,178,207 | 2.8 |
| Total: | 59 | $875,766,284 | 100.0% |
| Weighted Average: | 62.0% | ||
| BALLOON OR ARD LOAN-TO-VALUE RATIO | |||
| Range of Balloon LTV Ratios (%) | Number of Mortgage Loans | Aggregate Cut- off Date Balance ($) | % of Cut-off Date Pool Balance |
| 17.7 - 35.0 | 2 | $107,957,705 | 12.3% |
| 35.1 - 45.0 | 3 | 13,032,911 | 1.5 |
| 45.1 - 50.0 | 5 | 63,078,484 | 7.2 |
| 50.1 - 55.0 | 13 | 94,928,351 | 10.8 |
| 55.1 - 60.0 | 10 | 215,624,359 | 24.6 |
| 60.1 - 65.0 | 16 | 249,582,475 | 28.5 |
| 65.1 - 70.0 | 8 | 103,912,000 | 11.9 |
| 70.1 - 71.9 | 2 | 27,650,000 | 3.2 |
| Total: | 59 | $875,766,284 | 100.0% |
| Weighted Average: | 55.0% | ||
| AMORTIZATION TYPE | |||
| Type of Amortization | Number of Mortgage Loans | Aggregate Cut- off Date Balance ($) | % of Cut-off Date Pool Balance |
| Interest-only, Amortizing Balloon | 26 | $447,367,000 | 51.1% |
| Amortizing Balloon | 28 | 240,449,284 | 27.5 |
| Interest-only, Balloon | 4 | 179,950,000 | 20.5 |
| Interest-only, Amortizing ARD | 1 | 8,000,000 | 0.9 |
| Total: | 59 | $875,766,284 | 100.0% |
| ORIGINAL TERM OF INTEREST-ONLY PERIOD FOR PARTIAL IO LOANS | |||
| IO Term (months) | Number of Mortgage Loans | Aggregate Cut- off Date Balance ($) | % of Cut-off Date Pool Balance |
| 12 | 1 | $2,100,000 | 0.2% |
| 13 - 24 | 5 | 29,407,500 | 3.4 |
| 25 - 36 | 13 | 296,122,500 | 33.8 |
| 37 - 48 | 2 | 27,650,000 | 3.2 |
| 49 - 60 | 5 | 61,487,000 | 7.0 |
| 61 - 66 | 1 | 38,600,000 | 4.4 |
| Total: | 27 | $455,367,000 | 52.0% |
| Weighted Average: | 41 months | ||
| SEASONING | |||
| Seasoning (months) | Number of Mortgage Loans | Aggregate Cut- off Date Balance ($) | % of Cut-off Date Pool Balance |
| 0 | 11 | $118,050,000 | 13.5% |
| 1 - 3 | 48 | 757,716,284 | 86.5 |
| Total: | 59 | $875,766,284 | 100.0% |
| Weighted Average: | 1 month | ||
THE INFORMATION IN THIS STRUCTURAL AND COLLATERAL TERM SHEET IS NOT COMPLETE AND MAY BE AMENDED PRIOR TO THE TIME OF SALE. THIS TERM SHEET IS NOT AN OFFER TO SELL THESE SECURITIES AND IT IS NOT A SOLICITATION OF AN OFFER TO BUY THESE SECURITIES IN ANY JURISDICTION WHERE THE OFFER OR SALE IS NOT PERMITTED.
15
WFRBS Commercial Mortgage Trust 2014-C25 | Certain Terms and Conditions |
V. Certain Terms and Conditions
| Interest Entitlements: | The interest entitlement of each Class of Offered Certificates on each Distribution Date generally will be the interest accrued during the related Interest Accrual Period on the related Certificate Principal Balance or Notional Amount at the related pass-through rate, net of any prepayment interest shortfalls allocated to that Class for such Distribution Date as described below. If prepayment interest shortfalls arise from voluntary prepayments (without Special Servicer consent) on particular non-specially serviced mortgage loans during any collection period, the Master Servicer is required to make a compensating interest payment to offset those shortfalls, generally up to an amount equal to the portion of its master servicing fees that accrue at one basis point per annum. The remaining amount of prepayment interest shortfalls will be allocated to reduce the interest entitlement on all Classes of Certificates (other than the Class X-A, X-B, X-C, X-D, and X-E Certificates), pro rata, based on their respective amounts of accrued interest for the related Distribution Date (except with respect to the allocation among the Class A-S, B, C and PEX Certificates as described below under “Allocations and Distributions on the Class A-S, B, C and PEX Certificates”). If a Class receives less than the entirety of its interest entitlement on any Distribution Date, then the shortfall, excluding any shortfall due to prepayment interest shortfalls, will be added to its interest entitlement for the next succeeding Distribution Date. Interest entitlements on the Class E and D Certificates and the Class C and B regular interests, in that order, may be reduced by certain Trust Advisor expenses (subject to the discussion below under “Allocations and Distributions on the Class A-S, B, C and PEX Certificates”). | |
| Principal Distribution Amount: | The Principal Distribution Amount for each Distribution Date generally will be the aggregate amount of principal received or advanced in respect of the mortgage loans, net of any non-recoverable advances and interest thereon that are reimbursed to the Master Servicer, the Special Servicer or the Trustee during the related collection period. Non-recoverable advances and interest thereon are reimbursable from principal collections and advances before reimbursement from other amounts. The Principal Distribution Amount may also be reduced, with a corresponding loss, to the Class E and D Certificates and the Class C, B and A-S regular interests, then to the Class A-1, A-2, A-3, A-4, A-5 and A-SB Certificates (with any losses on the Class A-1, A-2, A-3, A-4, A-5 and A-SB Certificates allocated pro rata according to their respective Certificate Principal Balances immediately prior to that Distribution Date), in that order, in connection with certain Trust Advisor expenses to the extent that interest entitlements on the Class B and C regular interests and the Class D and E Certificates are insufficient to absorb the effect of the expense on any particular Distribution Date. For a discussion on the allocation of amounts distributable in respect of the Class A-S, B and C regular interests, see “Allocations and Distributions on the Class A-S, B, C and PEX Certificates” below. | |
| Distributions: | On each Distribution Date, funds available for distribution from the mortgage loans, net of specified trust fees, expenses and reimbursements will generally be distributed in the following amounts and order of priority (in each case to the extent of remaining available funds): | |
1. Class A-1, A-2, A-3, A-4, A-5, A-SB, X-A, X-B, X-C, X-D, and X-E Certificates: To interest on the Class A-1, A-2, A-3, A-4, A-5, A-SB, X-A, X-B, X-C, X-D, and X-E Certificates, pro rata, according to their respective interest entitlements. | ||
| 2. Class A-1, A-2, A-3, A-4, A-5 and A-SB Certificates: To principal on the Class A-1, A-2, A-3, A-4, A-5 and A-SB Certificates in the following amounts and order of priority: (i) first, to principal on the Class A-SB Certificates, in an amount up to the Principal Distribution Amount for such Distribution Date until their Certificate Principal Balance is reduced to the Class A-SB Planned Principal Balance for such Distribution Date; (ii) second, to principal on the Class A-1 Certificates until their Certificate Principal Balance is reduced to zero, up to the remainder of the Principal Distribution Amount for such Distribution Date; (iii) third, to principal on the Class A-2 Certificates until their Certificate Principal Balance is reduced to zero, up to the remainder of the Principal Distribution Amount for such Distribution Date; (iv) fourth, to principal on the Class A-3 Certificates until their Certificate Principal Balance is reduced to zero, up to the remainder of the Principal Distribution Amount for such Distribution Date; (v) fifth, to principal on the Class A-4 Certificates until their Certificate Principal Balance is reduced to zero, up to the remainder of the Principal Distribution Amount for such Distribution Date; (vi) sixth, to principal on the Class A-5 Certificates until their Certificate Principal Balance is reduced to zero, up to the remainder of the Principal Distribution Amount for such Distribution Date; and (vii) seventh, to principal on the Class A-SB Certificates until their Certificate Principal Balance is reduced to zero, up to the remainder of the Principal Distribution Amount for such Distribution Date. However, if the Certificate Principal Balance of each and every Class of Principal Balance Certificates, other than the Class A-1, A-2, A-3, A-4, A-5 and A-SB Certificates, has been reduced to zero as a result of the allocation of Mortgage Loan |
THE INFORMATION IN THIS STRUCTURAL AND COLLATERAL TERM SHEET IS NOT COMPLETE AND MAY BE AMENDED PRIOR TO THE TIME OF SALE. THIS TERM SHEET IS NOT AN OFFER TO SELL THESE SECURITIES AND IT IS NOT A SOLICITATION OF AN OFFER TO BUY THESE SECURITIES IN ANY JURISDICTION WHERE THE OFFER OR SALE IS NOT PERMITTED. |
16
WFRBS Commercial Mortgage Trust 2014-C25 | Certain Terms and Conditions |
losses and expenses and any of the Class A-1, A-2, A-3, A-4, A-5 and A-SB Certificates remains outstanding, then the Principal Distribution Amount will be distributed on the Class A-1, A-2, A-3, A-4, A-5 and A-SB Certificates, pro rata, based on their respective outstanding Certificate Principal Balances, until their Certificate Principal Balances have been reduced to zero. | ||
3. Class A-1, A-2, A-3, A-4, A-5 and A-SB Certificates: To reimburse the holders of the Class A-1, A-2, A-3, A-4, A-5 and A-SB Certificates, pro rata, for any previously unreimbursed losses (other than certain Trust Advisor expenses) on the mortgage loans that were previously allocated in reduction of the Certificate Principal Balances of such Classes. | ||
4. Class A-S regular interest: To make distributions on the Class A-S regular interest as follows: (a) first, to interest on Class A-S regular interest in the amount of the interest entitlement for that Class; (b) next, to the extent of the portion of the Principal Distribution Amount remaining after distributions in respect of principal to each Class with a higher distribution priority (in this case, the Class A-1, A-2, A-3, A-4, A-5 and A-SB Certificates), to principal on the Class A-S regular interest until its principal balance is reduced to zero; and (c) next, to reimburse the holders of the Class A-S regular interest for any previously unreimbursed losses (other than certain Trust Advisor expenses) on the mortgage loans that were previously allocated to that Class in reduction of its principal balance. 5. Class B regular interest: To make distributions on the Class B regular interest as follows: (a) first, to interest on Class B regular interest in the amount of the interest entitlement for that Class; (b) next, to the extent of the portion of the Principal Distribution Amount remaining after distributions in respect of principal to each Class with a higher distribution priority (in this case, the Class A-1, A-2, A-3, A-4, A-5 and A-SB Certificates and the Class A-S regular interest), to principal on the Class B regular interest until its principal balance is reduced to zero; and (c) next, to reimburse the holders of the Class B regular interest for any previously unreimbursed losses (other than certain Trust Advisor expenses) on the mortgage loans that were previously allocated to that Class in reduction of its principal balance. 6. Class C regular interest: To make distributions on the Class C regular interest as follows: (a) first, to interest on Class C regular interest in the amount of the interest entitlement for that Class; (b) next, to the extent of the portion of the Principal Distribution Amount remaining after distributions in respect of principal to each Class with a higher distribution priority (in this case, the Class A-1, A-2, A-3, A-4, A-5 and A-SB Certificates and the Class A-S and B regular interests), to principal on the Class C regular interest until its principal balance is reduced to zero; and (c) next, to reimburse the holders of the Class C regular interest for any previously unreimbursed losses (other than certain Trust Advisor expenses) on the mortgage loans that were previously allocated to that Class in reduction of its principal balance. | ||
7. Class D Certificates: To make distributions on the Class D Certificates as follows: (a) first, to interest on Class D Certificates in the amount of the interest entitlement for that Class; (b) next, to the extent of the portion of the Principal Distribution Amount remaining after distributions in respect of principal to each Class with a higher distribution priority (in this case, the Class A-1, A-2, A-3, A-4, A-5 and A-SB Certificates and the Class A-S, B and C regular interests), to principal on the Class D Certificates until its principal balance is reduced to zero; and (c) next, to reimburse the holders of the Class D Certificates for any previously unreimbursed losses (other than certain Trust Advisor expenses) on the mortgage loans that were previously allocated to that Class in reduction of its principal balance. | ||
8. After the Class A-1, A-2, A-3, A-4, A-5 and A-SB Certificates, the Class A-S, B and C regular interests and the Class D Certificates are paid all amounts to which they are entitled, the remaining funds available for distribution will be used to pay interest, principal and loss reimbursement amounts (other than certain Trust Advisor expenses) on the Class E, F and G Certificates sequentially in that order in a manner analogous to the Class D Certificates. |
THE INFORMATION IN THIS STRUCTURAL AND COLLATERAL TERM SHEET IS NOT COMPLETE AND MAY BE AMENDED PRIOR TO THE TIME OF SALE. THIS TERM SHEET IS NOT AN OFFER TO SELL THESE SECURITIES AND IT IS NOT A SOLICITATION OF AN OFFER TO BUY THESE SECURITIES IN ANY JURISDICTION WHERE THE OFFER OR SALE IS NOT PERMITTED. |
17
WFRBS Commercial Mortgage Trust 2014-C25 | Certain Terms and Conditions |
| Allocations and Distributions on the Class A-S, B, C and PEX Certificates: | On the closing date, the upper-tier REMIC of the issuing entity will issue the Class A-S, Class B and Class C regular interests (each a “regular interest”) which will have outstanding principal balances on the closing date of $73,345,000, $38,315,000 and $29,557,000, respectively. The regular interests will be held in a grantor trust for the benefit of the holders of the Class A-S, B, C and PEX Certificates. The Class A-S, B, C and PEX Certificates will, at all times, represent undivided beneficial ownership interests in a grantor trust that will hold those regular interests. Each class of the Class A-S, B and C Certificates will, at all times, represent an undivided beneficial ownership interest in a percentage of the outstanding principal balance of the regular interest with the same alphabetical class designation. The Class PEX Certificates will, at all times, represent an undivided beneficial ownership interest in the remaining percentages of the outstanding principal balances of the Class A-S, B and C regular interests and which percentage interests are referred to in this Term Sheet as the “Class PEX Component A-S, Class PEX Component B and Class PEX Component C” (collectively, the “Class PEX Components”). Interest, principal, prepayment premiums, yield maintenance charges and voting rights that are allocated to the Class A-S, B or C regular interest will be distributed or allocated, as applicable, as between the Class A-S, B or C Certificates, as applicable, on the one hand, and Class PEX Component A-S, Class PEX Component B or Class PEX Component C, as applicable (and correspondingly, the Class PEX Certificates), on the other hand, pro rata, based on their respective percentage interests in the Class A-S, Class B or Class C regular interest, as applicable. In addition, any losses (including, without limitation, as a result of Trust Advisor expenses) that are allocated to the Class A-S, Class B or Class C regular interest will correspondingly be allocated as between the Class A-S, B or C Certificates, as applicable, on the one hand, and Class PEX Component A-S, Class PEX Component B or Class PEX Component C, as applicable (and correspondingly, the Class PEX Certificates), on the other hand, pro rata, based on their respective percentage interests in the Class A-S, Class B or Class C regular interest, as applicable. For a complete description of the allocations and distributions with respect to the Class A-S regular interest, the Class B regular interest and the Class C regular interest (and correspondingly the Class A-S, B, C and PEX Certificates and the Class PEX Component A-S, Class PEX Component B and Class PEX Component C), see “Description of the Offered Certificates” in the Free Writing Prospectus. See “Material Federal Income Tax Consequences” in the Free Writing Prospectus for a discussion of the tax treatment of the Exchangeable Certificates. | |
Exchanging Certificates through Combination and Recombination: | If you own Class A-S, B and C Certificates, you will be able to exchange them for a proportionate interest in the Class PEX Certificates, and vice versa, as described in the Free Writing Prospectus. You can exchange your Exchangeable Certificates by notifying the Certificate Administrator. If Exchangeable Certificates are outstanding and held by certificateholders, those certificates will receive principal and interest that would otherwise have been payable on the same proportion of certificates exchanged therefor if those certificates were outstanding and held by certificateholders. Any such allocations of principal and interest between classes of Exchangeable Certificates will have no effect on the principal or interest entitlements of any other class of certificates. The Free Writing Prospectus describes the available combinations of Exchangeable Certificates eligible for exchange. | |
| Allocation of Yield Maintenance and Prepayment Premiums: | If any yield maintenance charges and prepayment premiums are collected during any particular collection period with respect to any mortgage loan, then on the distribution date corresponding to that collection period, the certificate administrator will pay a portion of the yield maintenance charges and prepayment premiums (net of liquidation fees payable therefrom) in the following manner: (1) pro rata, between (x) the group (“YM Group A”) of the Class A-1, A-2, A-3, A-4, A-5, A-SB and X-A Certificates and the Class A-S regular interest and (y) the group (“YM Group B” and, collectively with the YM Group A, the “YM Groups”) of Class B and C regular interests and the Class D and Class X-B Certificates, based upon the aggregate amount of principal distributed to the applicable classes of principal balance certificates (other than the Class A-S, B, C and PEX Certificates) and the Class A-S, B and C regular interests, as applicable, in each YM Group for that distribution date, and (2) among the classes of certificates and regular interest(s) in each YM Group, in the following manner, up to an amount equal to the product of (a) the yield maintenance or prepayment premium allocated to such YM Group, (b) the related Base Interest Fraction (as defined in the Free Writing Prospectus), and (c) a fraction, which in no event may be greater than 1.0, the numerator of which is equal to the amount of principal distributed to the holder(s) of such class or regular interest for that distribution date, and the denominator of which is the aggregate amount of principal distributed to all the certificates and the regular interests in that YM Group for that distribution date. Any yield maintenance charges or prepayment premium allocated to such YM Group remaining after such distributions to Principal Balance Certificates or regular interest(s) described above will be distributed to the Class X-A or Class X-B Certificates as applicable, in such YM Group. |
THE INFORMATION IN THIS STRUCTURAL AND COLLATERAL TERM SHEET IS NOT COMPLETE AND MAY BE AMENDED PRIOR TO THE TIME OF SALE. THIS TERM SHEET IS NOT AN OFFER TO SELL THESE SECURITIES AND IT IS NOT A SOLICITATION OF AN OFFER TO BUY THESE SECURITIES IN ANY JURISDICTION WHERE THE OFFER OR SALE IS NOT PERMITTED. |
18
WFRBS Commercial Mortgage Trust 2014-C25 | Certain Terms and Conditions |
No prepayment premiums or yield maintenance charges will be distributed to the holders of the Class X-C, X-D, X-E, E, F, G, V or R Certificates. The holders of the Class X-B Certificates will be entitled to receive all yield maintenance charges and prepayment premiums after the Class A-1, A-2, A-3, A-4, A-5, X-A, A-SB and D Certificates and the Class A-S, B and C regular interests (and, therefore, the Class A-S, B, C and PEX Certificates) have been retired. For a description of when prepayment premiums and yield maintenance charges are generally required on the mortgage loans, see Annex A to the Free Writing Prospectus. See also “Risk Factors—The Timing of Prepayments and Repurchases and Other Liquidations May Change Your Anticipated Yield” in the prospectus attached to the Free Writing Prospectus. Prepayment premiums and yield maintenance charges will be distributed on each Distribution Date only to the extent they are actually received on the mortgage loans as of the related Determination Date. | ||
| Realized Losses: | The Certificate Principal Balances of the Class A-1, A-2, A-3, A-4, A-5, A-SB, D, E, F and G Certificates, and the Class A-S, B and C regular interests will be reduced without distribution on any Distribution Date as a write-off to the extent of any losses realized on the mortgage loans allocated to such Class or regular interest on such Distribution Date. Such losses (other than certain Trust Advisor expenses) will be applied in the following order, in each case until the related Certificate Principal Balance is reduced to zero: first, to Class G; second, to Class F; third, to Class E; fourth, to Class D; fifth, to the Class C regular interest; sixth, to the Class B regular interest; seventh, to the Class A-S regular interest; and, finally, pro rata, to Classes A-1, A-2, A-3, A-4, A-5 and A-SB based on their outstanding Certificate Principal Balances. Certain Trust Advisor expenses (if not absorbed by reductions of interest entitlements on the Class E and D Certificates and the Class C and B regular interests) will be applied as write-offs in a similar manner, except that such write-offs will be applied only to the Class E and D Certificates, the Class C, B and A-S regular interests, and the Class A-1, A-2, A-3, A-4, A-5 and A-SB Certificates (with any write-offs on the Class A-1, A-2, A-3, A-4, A-5 and A-SB Certificates to be allocated pro rata according to their respective Certificate Principal Balances immediately prior to that Distribution Date), in that order. Any realized losses allocated to the Class A-S, B and C regular interests will, in turn, be allocated to the Class A-S, B, C and PEX Certificates as described above in “Allocations and Distributions on the Class A-S, B, C and PEX Certificates”. The notional amount of the Class X-A Certificates will be reduced by the amount of all losses that are allocated to the Class A-1, A-2, A-3, A-4, A-5 or A-SB Certificates or the Class A-S regular interest as write-offs in reduction of their Certificate Principal Balances. The notional amount of the Class X-B Certificates will be reduced by the amount of all losses that are allocated to the Class B and C regular interests and the Class D Certificates as write-offs in reduction of their Certificate Principal Balances. The notional amount of the Class X-C Certificates will be reduced by the amount of all losses that are allocated to the Class E Certificates as write-offs in reduction of its Certificate Principal Balance. The notional amount of the Class X-D Certificates will be reduced by the amount of all losses that are allocated to the Class F Certificates as write-offs in reduction of its Certificate Principal Balance. The notional amount of the Class X-E Certificates will be reduced by the amount of all losses that are allocated to the Class G Certificates as write-offs in reduction of its Certificate Principal Balance. | |
| Debt Service Advances: | The Master Servicer or, if the Master Servicer fails to do so, the Trustee, will be obligated to advance delinquent debt service payments (other than balloon payments and default interest) and assumed debt service payments on the mortgage loans (including each pari passu mortgage loan but not its related pari passu companion loans), except to the extent any such advance is deemed non-recoverable from collections on the related mortgage loan. In addition, if an Appraisal Reduction Amount exists for a given mortgage loan, the interest portion of any debt service advance for such mortgage loan will be reduced, which will have the effect of reducing the amount of interest available for distribution to the Certificates in reverse alphabetical order of their Class designations (except that interest payments on the Class A-1, A-2, A-3, A-4, A-5, A-SB, X-A, X-B, X-C, X-D, and X-E Certificates would be affected on a pari passu basis). | |
| Servicing Advances: | The Master Servicer or, if the Master Servicer fails to do so, the Trustee, will be obligated to make servicing advances with respect to each mortgage loan it services, including the payment of delinquent property taxes, insurance premiums and ground rent, except to the extent that those advances are deemed non-recoverable from collections on the related mortgage loan. The applicable master servicer under the WFRBS 2014-C24 securitization will have the primary obligation to make any servicing advances with respect to the St. Johns Town Center loan combination. After any securitization of the AMCP Portfolio pari passu companion loan, the master servicer under that securitization will have the primary obligation to make any servicing advances with respect to the related loan combination. | |
| Appraisal Reduction Amounts: | An Appraisal Reduction Amount generally will be created in the amount, if any, by which the principal balance of a required appraisal loan (which is a mortgage loan with respect to which certain defaults, modifications or insolvency events have occurred as further described in the Free |
THE INFORMATION IN THIS STRUCTURAL AND COLLATERAL TERM SHEET IS NOT COMPLETE AND MAY BE AMENDED PRIOR TO THE TIME OF SALE. THIS TERM SHEET IS NOT AN OFFER TO SELL THESE SECURITIES AND IT IS NOT A SOLICITATION OF AN OFFER TO BUY THESE SECURITIES IN ANY JURISDICTION WHERE THE OFFER OR SALE IS NOT PERMITTED. |
19
WFRBS Commercial Mortgage Trust 2014-C25 | Certain Terms and Conditions |
Writing Prospectus) plus other amounts overdue or advanced in connection with such mortgage loan exceeds 90% of the appraised value of the related mortgaged property plus certain escrows and reserves (including letters of credit) held with respect to the mortgage loan. A mortgage loan will cease to be a required appraisal loan when the same has ceased to be a specially serviced mortgage loan (if applicable), has been brought current for at least three consecutive months and no other circumstances exist that would cause such mortgage loan to be a required appraisal loan. Appraisal Reduction Amounts will affect the amount of debt service advances on the related mortgage loan. Appraisal Reduction Amounts will also be taken into account in the determination of the identity of the Class whose majority constitutes the “majority subordinate certificateholder” and is entitled to appoint the subordinate class representative. | ||
| Clean-Up Call and Exchange Termination: | On each Distribution Date occurring after the aggregate unpaid principal balance of the mortgage loans is reduced below 1% of the initial aggregate principal balance of the mortgage loans as of the Cut-off Date, certain specified persons will have the option to purchase all of the remaining mortgage loans (and the trust’s interest in all property acquired through exercise of remedies in respect of any mortgage loan) at the price specified in the Free Writing Prospectus. Exercise of the option will terminate the trust and retire the then-outstanding certificates. If the aggregate Certificate Principal Balances of each of the Class A-1, A-2, A-3, A-4, A-5, A-SB, PEX and D Certificates and the Class A-S, B and C regular interests have been reduced to zero, the trust may also be terminated in connection with an exchange of all the then-outstanding certificates, for the mortgage loans and REO properties then remaining in the issuing entity, but all of the holders of those Classes of outstanding certificates would have to voluntarily participate in the exchange. | |
| Liquidated Loan Waterfall: | Following the liquidation of any loan or property, the net liquidation proceeds generally will be applied (after reimbursement of advances and certain trust fund expenses), first, as a recovery of accrued interest, other than delinquent interest that was not advanced as a result of Appraisal Reduction Amounts, second, as a recovery of principal until all principal has been recovered, and then as a recovery of delinquent interest that was not advanced as a result of Appraisal Reduction Amounts. Please see “Description of the Offered Certificates—Distributions—Application of Mortgage Loan Collections” in the Free Writing Prospectus. | |
| Majority Subordinate Certificateholder and Subordinate Class Representative: | A subordinate class representative may be appointed by the “majority subordinate certificate-holder”, which will be the holder(s) of a majority of: (a) during a “subordinate control period”, the most subordinate class among the Class F and G Certificates that has a Certificate Principal Balance, as notionally reduced by any Appraisal Reduction Amounts allocable to that class, that is at least equal to 25% of its total initial principal balance and (b) during a “collective consultation period”, the most subordinate class among the Class F and G Certificates that has a total principal balance, without regard to Appraisal Reduction Amounts, that is at least equal to 25% of its initial Certificate Principal Balance. The majority subordinate certificateholder will have a continuing right to appoint, remove or replace the subordinate class representative in its sole discretion. This right may be exercised at any time and from time to time. See “The Pooling and Servicing Agreement—The Majority Subordinate Certificateholder and the Subordinate Class Representative” in the Free Writing Prospectus. | |
| Control and Consultation: | The rights of various parties to replace the Special Servicer and approve or consult with respect to major actions of the Special Servicer will vary according to defined periods. A “subordinate control period” will exist as long as the Class F Certificates have a Certificate Principal Balance, net of any Appraisal Reduction Amounts allocable to that class, that is not less than 25% of the initial principal balance of that class (unless a senior consultation period is deemed to occur generally or with respect to a particular mortgage loan, pursuant to clause (ii) of the definition of “senior consultation period”). In general, during a subordinate control period, (i) the subordinate class representative will be entitled to grant or withhold approval of asset status reports prepared, and material servicing actions proposed, by the Special Servicer, and (ii) the majority subordinate certificateholder, or the subordinate class representative on its behalf, will be entitled to terminate and replace the Special Servicer with or without cause, and appoint itself or another person as the successor special servicer (other than with respect to the St. Johns Town Center and AMCP Portfolio loan combinations). It will be a condition to such appointment that DBRS, Moody’s and Morningstar confirm that the appointment would not result in a qualification, downgrade or withdrawal of any of their then-current ratings of certificates. A “collective consultation period” will exist as long as the Class F Certificates have a Certificate Principal Balance that both (i) as notionally reduced by any Appraisal Reduction Amounts allocable to that class, is less than 25% of its initial principal balance and (ii) without regard to any Appraisal Reduction Amounts allocable to that class, is 25% or more of its initial Certificate Principal Balance (unless a senior consultation period is deemed to occur generally or with respect to a particular mortgage loan, pursuant to |
THE INFORMATION IN THIS STRUCTURAL AND COLLATERAL TERM SHEET IS NOT COMPLETE AND MAY BE AMENDED PRIOR TO THE TIME OF SALE. THIS TERM SHEET IS NOT AN OFFER TO SELL THESE SECURITIES AND IT IS NOT A SOLICITATION OF AN OFFER TO BUY THESE SECURITIES IN ANY JURISDICTION WHERE THE OFFER OR SALE IS NOT PERMITTED. |
20
WFRBS Commercial Mortgage Trust 2014-C25 | Certain Terms and Conditions |
clause (ii) of the definition of “senior consultation period”). In general, during a collective consultation period, the Special Servicer will be required to consult with the Trust Advisor (in addition to the subordinate class representative, during a collective consultation period) in connection with asset status reports and material special servicing actions. A “senior consultation period” will exist as long as either (i) the Class F certificates have an aggregate principal balance, without regard to any Appraisal Reduction Amounts allocable to that class, that is less than 25% of its initial principal balance or (ii) during such time as the Class F certificates are the most subordinate class of control-eligible certificates that have a then outstanding principal balance, net of Appraisal Reduction Amounts, at least equal to 25% of its initial principal balance, the then-majority subordinate certificateholder has irrevocably waived its right to appoint a subordinate class representative and to exercise any of the rights of the majority subordinate certificateholder or cause the exercise of the rights of the subordinate class representative and such rights have not been reinstated to a successor majority subordinate certificateholder as set forth in the pooling and servicing agreement. In general, during a senior consultation period, the Special Servicer must seek to consult with the Trust Advisor in connection with asset status reports and material special servicing actions, and, in general, no subordinate class representative will be recognized or have any right to terminate the Special Servicer or approve, direct or consult with respect to servicing matters. Furthermore, notwithstanding any contrary description set forth above, with respect to the St. Johns Town Center mortgage loan, in general the loan combination will be serviced under the WFRBS 2014-C24 pooling and servicing agreement, which grants to a designated loan-specific subordinate class representative control rights that include the right to approve or disapprove various material servicing actions involving the loan combination. With respect to the St. Johns Town Center loan combination, the Class SJ-A, SJ-B, SJ-C and SJ-D certificates issued under the WFRBS 2014-C24 pooling and servicing agreement are the “control-eligible loan-specific certificates”. The holders of a majority of the principal amount of the most subordinate class of the control-eligible loan-specific certificates that has an aggregate principal balance, net of appraisal reduction amounts allocable thereto, that is at least equal to 25% of its total initial principal balance, will have the right to appoint a designated loan-specific subordinate class representative. So long as a control appraisal period has not occurred with respect to such class, the representative will have the right to direct the replacement of the special servicer for the St. Johns Town Center loan combination. In addition, prior to the occurrence and continuance of a control appraisal period with respect to the senior-most class of control-eligible loan specific certificates, the designated loan-specific subordinate class representative will generally have the same rights with respect to the St. Johns Town Center loan combination as the WFRBS 2014-C24 subordinate class representative has during the continuance of a subordinate control period with respect to the other mortgage loans in the WFRBS 2014-C24 mortgage pool, which are similar, but not identical to the rights as the subordinate class representative for this securitization will have under the pooling and servicing agreement for this transaction. After the occurrence and during the continuance of a control appraisal period with respect to the senior-most class of control-eligible loan-specific certificates, the loan-specific subordinate class representative will no longer have any such rights with respect to the St. Johns Town Center loan combination and all of those rights will be exercisable by the subordinate class representative for the WFRBS 2014-C24 transaction. Furthermore, notwithstanding any contrary description set forth above, with respect to the AMCP Portfolio mortgage loan, in general (a) for as long as the loan combination is serviced under the pooling and servicing agreement for this securitization, the initial holder of the related pari passu companion loan will have control rights that include the right to approve or disapprove various material servicing actions involving the loan combination and the subordinate class representative for this securitization will have the right to be consulted on a non-binding basis with respect to such actions, and (b) in connection with any securitization of the related pari passu companion loan, after which the loan combination will be serviced under the pooling and servicing agreement for that other securitization, that pooling and servicing agreement may grant to a subordinate or controlling class representative or other third party control rights that include the right to approve or disapprove various material servicing actions involving the loan combination but the subordinate class representative for this securitization will nonetheless have the right to be consulted on a non-binding in basis with respect to such actions. For purposes of the servicing of the applicable loan combination, the occurrence and continuance of a collective consultation period or senior consultation period with respect to the subordinate class representative under this securitization will not limit the control or other rights of the initial holder of the pari passu companion loan or of a subordinate or controlling class representative or other third party under any securitization thereof, and any collective consultation period or senior consultation period or similar period under that other securitization will not limit the consultation rights of the subordinate class representative under this securitization. Other than with respect to the St. Johns Town Center and AMCP Portfolio loan combinations, loan combination control rights also include the right, in certain circumstances, to direct the |
THE INFORMATION IN THIS STRUCTURAL AND COLLATERAL TERM SHEET IS NOT COMPLETE AND MAY BE AMENDED PRIOR TO THE TIME OF SALE. THIS TERM SHEET IS NOT AN OFFER TO SELL THESE SECURITIES AND IT IS NOT A SOLICITATION OF AN OFFER TO BUY THESE SECURITIES IN ANY JURISDICTION WHERE THE OFFER OR SALE IS NOT PERMITTED. |
21
WFRBS Commercial Mortgage Trust 2014-C25 | Certain Terms and Conditions |
Replacement of Special Servicer by General Vote of Certificateholders: | replacement of the special servicer for the related loan combination only. During any “collective consultation period” or “senior consultation period”, the Special Servicer (other than with respect to the St. Johns Town Center and AMCP Portfolio loan combinations) may be terminated and replaced upon the affirmative direction of certificate owners holding not less than 75% of the appraisal-reduced voting rights of all certificates, following a proposal from certificate owners holding not less than 25% of the appraisal-reduced voting rights of all certificates. The certificateholders who initiate a vote on a termination and replacement of the Special Servicer without cause must cause DBRS, Moody’s and Morningstar to confirm the then-current ratings of the certificates (or decline to review the matter) and cause the payment of the fees and expenses incurred in the replacement. | |
| Appraisal Remedy: | Solely for purposes of determining whether a “subordinate control period” is in effect, whenever the Special Servicer obtains an appraisal or updated appraisal under the pooling and servicing agreement, the subordinate class representative, with respect to the mortgage loans (other than, the St Johns Town Center and AMCP Portfolio mortgage loans) serviced by the Special Servicer will have the right (at its or their expense) to direct the Special Servicer to hire a qualified appraiser to prepare a second appraisal of the mortgaged property. The Special Servicer must thereafter determine whether, based on its assessment of such second appraisal, any recalculation of the Appraisal Reduction Amount is warranted. The Appraisal Reduction Amount, whether based on the first or the second appraisal, will become effective following the second appraisal, except that the Appraisal Reduction Amount based on the first appraisal shall become effective if the subordinate class representative declines to demand a second appraisal within a specified number of business days, or if a second appraisal is not received within 90 days after the direction of the subordinate class representative. In addition, for the same purposes, if there is a material change in the mortgaged property securing any mortgage loan for which an Appraisal Reduction Amount has been calculated, the majority certificateholder of the Class F or G Certificates or other designed certificateholders will be entitled (at its expense) to present an additional appraisal to the Special Servicer, which will generally be required to recalculate the Appraisal Reduction Amount based upon such additional appraisal. This latter right may not be exercised more frequently than once in any 12-month period for each mortgage loan for which an Appraisal Reduction Amount was calculated and can only be exercised during a subordinate control period or a collective consultation period as further described in the Free Writing Prospectus. | |
| Sale of Defaulted Assets: | There will be no “fair value” purchase option. Instead, the pooling and servicing agreement will authorize the Special Servicer to sell defaulted mortgage loans serviced by the Special Servicer to the highest bidder in a manner generally similar to sales of REO properties. Subject to certain limitations set forth in the related intercreditor agreement, the loan combination serviced under the WFRBS 2014-C25 pooling and servicing agreement may be sold only if that mortgage loan and the related pari passu companion loans are sold together as one whole loan. The sale of a defaulted loan (other than a non-serviced mortgage loan) for less than par plus accrued interest and certain other fees and expenses owed on the loan will be subject to consent or consultation rights of the subordinate class representative and/or Trust Advisor. In the case of the St. Johns Town Center mortgage loan, pursuant to the applicable intercreditor agreement and the WFRBS 2014-C24 pooling and servicing agreement, the WFRBS 2014-C24 special servicer may offer to sell to any person (or may offer to purchase) for cash such loan combination during such time as such loan combination constitutes a defaulted mortgage loan, and, in connection with any such sale, the WFRBS 2014-C24 special servicer is required to sell the pari passu mortgage loan, the related pari passu companion loan and the related trust subordinate companion loan as a whole loan. The subordinate class representative will have consultation rights as the holder of an interest in the related pari passu mortgage loan, as described in the Free Writing Prospectus. In the case of the AMCP Portfolio mortgage loan, the sale will be subject to the consent and/or consultation rights of the holders of the related pari passu companion loan, as described in the Free Writing Prospectus. After the securitization of the AMCP Portfolio pari passu companion loan, pursuant to the respective intercreditor agreement, the party acting as special servicer with respect to the AMCP Portfolio loan combination pursuant to the pooling and servicing agreement of that securitization, may offer to sell to any person (or may offer to purchase) for cash such loan combination during such time as such loan combination constitutes a defaulted mortgage loan, and, in connection with any such sale, that special servicer is required to sell both the pari passu mortgage loan and related pari passu companion loan in any such loan combination as a whole loan. The subordinate class representative will have consultation rights as the holder of an interest in the related loan combination, as described in the Free Writing Prospectus. |
THE INFORMATION IN THIS STRUCTURAL AND COLLATERAL TERM SHEET IS NOT COMPLETE AND MAY BE AMENDED PRIOR TO THE TIME OF SALE. THIS TERM SHEET IS NOT AN OFFER TO SELL THESE SECURITIES AND IT IS NOT A SOLICITATION OF AN OFFER TO BUY THESE SECURITIES IN ANY JURISDICTION WHERE THE OFFER OR SALE IS NOT PERMITTED. |
22
WFRBS Commercial Mortgage Trust 2014-C25 | Certain Terms and Conditions |
| “As-Is” Appraisals: | Appraisals must be conducted on an “as-is” basis, and must be no more than 9 months old, for purposes of determining Appraisal Reduction Amounts, market value in connection with REO sales, etc. Required appraisals may consist of updates of prior appraisals. Internal valuations by the Special Servicer are permitted if the principal balance of a mortgage loan is less than $2,000,000. | |
| Trust Advisor: | The Trust Advisor will perform certain review duties that will generally include a limited annual review of and report regarding the Special Servicer to the Certificate Administrator. The review and report generally will be based on: (a) during a collective consultation period or senior consultation period, any asset status reports and additional information delivered to the Trust Advisor by the Special Servicer with respect to any mortgage loan serviced by the Special Servicer, and/or (b) during a senior consultation period, in addition to the applicable information described above, a meeting with the Special Servicer to conduct a limited review of the Special Servicer’s operational practices on a platform basis in light of the servicing standard. In addition, during any collective consultation period or senior consultation period, the Special Servicer must seek to consult with the Trust Advisor (in addition to the subordinate class representative during a collective consultation period) in connection with material special servicing actions with respect to specially serviced mortgage loans serviced by the Special Servicer. Furthermore, under certain circumstances, but only during a senior consultation period, the Trust Advisor may recommend the replacement of the Special Servicer, in which case the Certificate Administrator will deliver notice of such recommendation to the certificateholders, and certificateholders with specified percentages of the voting rights may direct the replacement of the Special Servicer at their expense. Notwithstanding any contrary provision described above, the Trust Advisor will have no rights or duties in connection with the St. Johns Town Center and AMCP Portfolio mortgage loans. The Trust Advisor may be removed and replaced without cause upon the affirmative direction of certificates owners holding not less than 75% of the appraisal-reduced voting rights of all certificates, following a proposal from certificate owners holding not less than 25% of the appraisal-reduced voting rights of all certificates. The certificateholders who initiate a vote on a termination and replacement of the Trust Advisor without cause must cause DBRS, Moody’s and Morningstar to confirm the then-current ratings of the certificates (or decline to review the matter) and cause the payment of the fees and expenses incurred in the replacement. During any “subordinate control period”, the proposed replacement trust advisor will be subject to the subordinate class representative’s consent (such consent not to be unreasonably withheld). If a proposed termination and replacement of the Trust Advisor is not consummated within 180 days following the initial request of the certificateholders who requested a vote, the proposed termination and replacement shall have no further force or effect. The Trust Advisor generally may be discharged from its duties if and when the Class A-1, A-2, A-3, A-4, A-5, A-SB, A-S, B, C, PEX, D and E Certificates are retired. | |
| Certain Fee Offsets: | If a workout fee is earned by the Special Servicer following a loan default with respect to any mortgage loan that it services, then certain limitations will apply to the collection and retention of a modification fee from the borrower. The modification fee generally must not exceed 1% of the principal balance of the loan as modified. In addition, if the loan re-defaults within a specified period of months and other conditions are satisfied, any subsequent workout or liquidation fee on that loan must be reduced by a portion of the previously-collected modification fee. Furthermore, workout fees, liquidation fees and modification fees collected with respect to any workout, liquidation and/or partial liquidation of a mortgage loan or loan combination that is serviced by the Special Servicer will be subject to an aggregate cap equal to the greater of (i) $1,000,000 and (ii) 1.00% of the stated principal balance of the subject mortgage loan or loan combination. | |
| Deal Website: | The Certificate Administrator will be required to maintain a deal website which will include, among other items: (a) summaries of asset status reports prepared by the Special Servicer, (b) inspection reports, (c) appraisals, (d) various “special notices” described in the Free Writing Prospectus, (e) the “Investor Q&A Forum” and (f) a voluntary “Investor Registry”. Investors may access the deal website following execution of a certification and confidentiality agreement. | |
| Initial Majority Subordinate Certificateholder: | It is expected that an affiliates of Seer Capital Management, L.P. will be the initial majority subordinate certificateholders. | |
| Loan Combinations: | Each of the mortgaged properties identified on Annex A to the Free Writing Prospectus as St. Johns Town Center, Colorado Mills, and AMCP Portfolio secure a mortgage loan to be included in the trust fund and one or more other mortgage loans that will not be included in the trust fund, which will be pari passu in right of payment with the trust mortgage loan and, with respect to the St. Johns Town Center mortgage loan, a trust subordinate companion loan. With respect to each group of mortgage loans that we refer to as a “loan combination”, the Colorado Mills and AMCP Portfolio loan combinations will be principally serviced under the pooling and servicing agreement. |
THE INFORMATION IN THIS STRUCTURAL AND COLLATERAL TERM SHEET IS NOT COMPLETE AND MAY BE AMENDED PRIOR TO THE TIME OF SALE. THIS TERM SHEET IS NOT AN OFFER TO SELL THESE SECURITIES AND IT IS NOT A SOLICITATION OF AN OFFER TO BUY THESE SECURITIES IN ANY JURISDICTION WHERE THE OFFER OR SALE IS NOT PERMITTED. |
23
WFRBS Commercial Mortgage Trust 2014-C25 | Certain Terms and Conditions |
| The St. Johns Town Center loan combination will be serviced under the WFRBS 2014-C24 pooling and servicing agreement. The Colorado Mills loan combination will be principally serviced under the WFRBS 2014-C25 pooling and servicing agreement. The AMCP Portfolio will be serviced under the WFRBS 2014-C25 pooling and servicing agreement until the securitization of the related pari passu loan, after which date such loan combination will serviced under the pooling and servicing agreement for the securitization of the related pari passu companion loan. |
THE INFORMATION IN THIS STRUCTURAL AND COLLATERAL TERM SHEET IS NOT COMPLETE AND MAY BE AMENDED PRIOR TO THE TIME OF SALE. THIS TERM SHEET IS NOT AN OFFER TO SELL THESE SECURITIES AND IT IS NOT A SOLICITATION OF AN OFFER TO BUY THESE SECURITIES IN ANY JURISDICTION WHERE THE OFFER OR SALE IS NOT PERMITTED. |
24
(THIS PAGE INTENTIONALLY LEFT BLANK)
25
| ST. JOHNS TOWN CENTER |
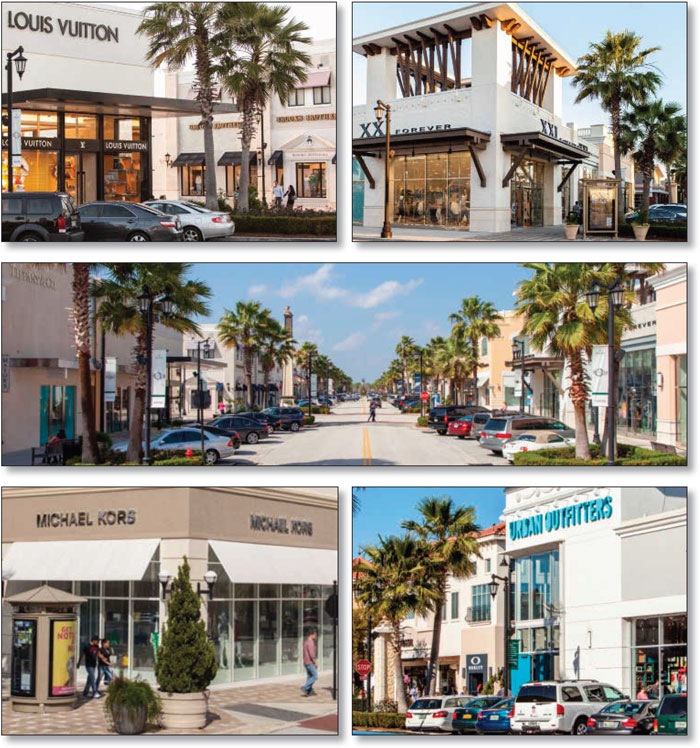
THE INFORMATION IN THIS STRUCTURAL AND COLLATERAL TERM SHEET IS NOT COMPLETE AND MAY BE AMENDED PRIOR TO THE TIME OF SALE. THIS TERM SHEET IS NOT AN OFFER TO SELL THESE SECURITIES AND IT IS NOT A SOLICITATION OF AN OFFER TO BUY THESE SECURITIES IN ANY JURISDICTION WHERE THE OFFER OR SALE IS NOT PERMITTED.
26
| ST. JOHNS TOWN CENTER |
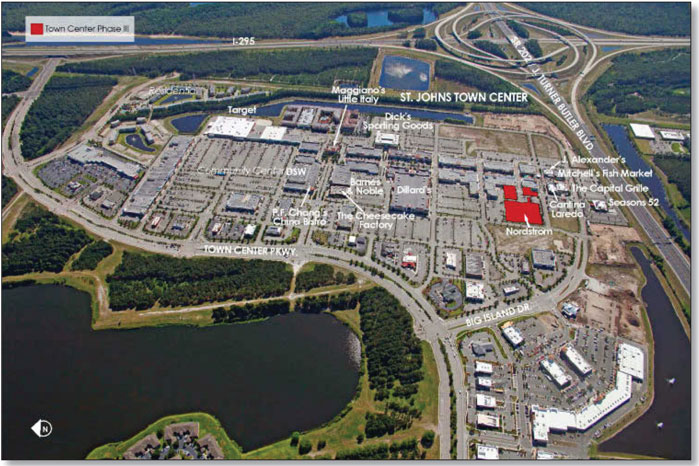
THE INFORMATION IN THIS STRUCTURAL AND COLLATERAL TERM SHEET IS NOT COMPLETE AND MAY BE AMENDED PRIOR TO THE TIME OF SALE. THIS TERM SHEET IS NOT AN OFFER TO SELL THESE SECURITIES AND IT IS NOT A SOLICITATION OF AN OFFER TO BUY THESE SECURITIES IN ANY JURISDICTION WHERE THE OFFER OR SALE IS NOT PERMITTED.
27
| ST. JOHNS TOWN CENTER |
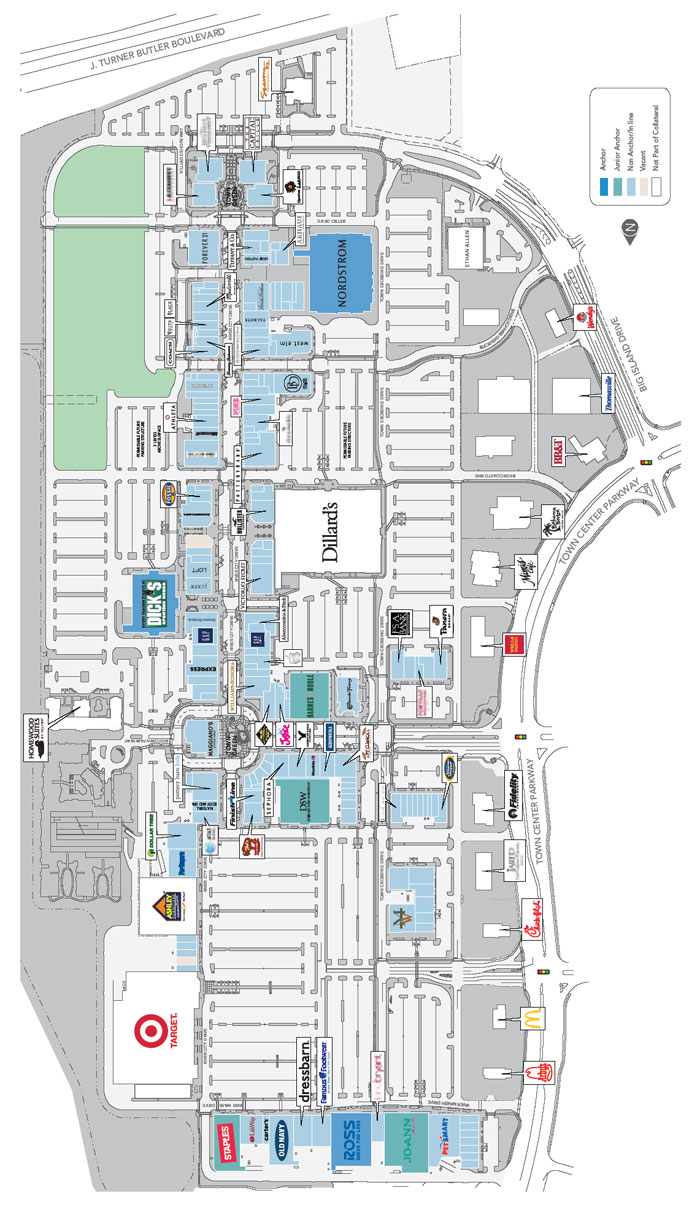
THE INFORMATION IN THIS STRUCTURAL AND COLLATERAL TERM SHEET IS NOT COMPLETE AND MAY BE AMENDED PRIOR TO THE TIME OF SALE. THIS TERM SHEET IS NOT AN OFFER TO SELL THESE SECURITIES AND IT IS NOT A SOLICITATION OF AN OFFER TO BUY THESE SECURITIES IN ANY JURISDICTION WHERE THE OFFER OR SALE IS NOT PERMITTED.
28
| ST. JOHNS TOWN CENTER |
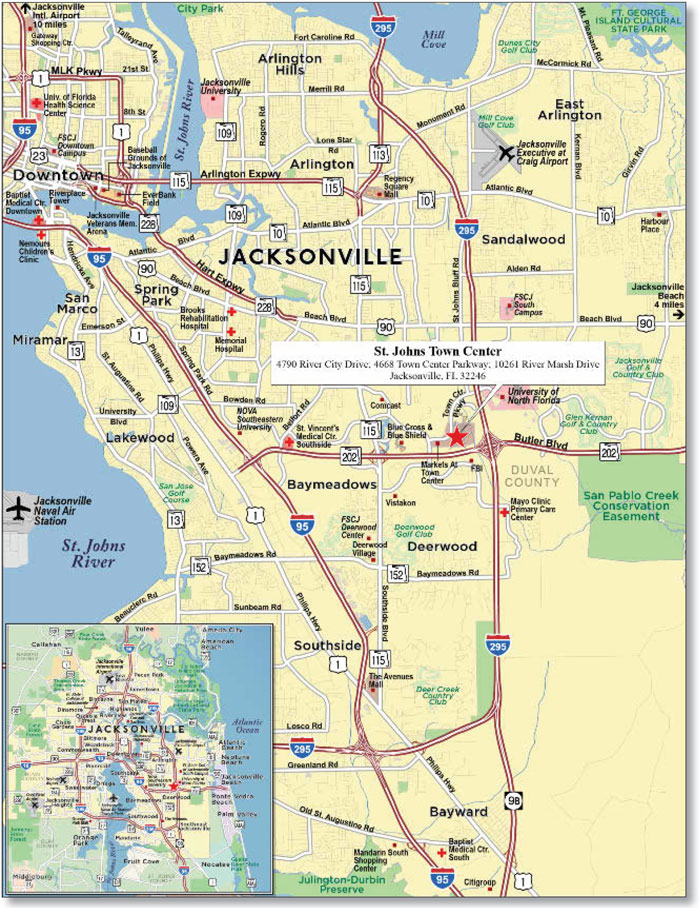
THE INFORMATION IN THIS STRUCTURAL AND COLLATERAL TERM SHEET IS NOT COMPLETE AND MAY BE AMENDED PRIOR TO THE TIME OF SALE. THIS TERM SHEET IS NOT AN OFFER TO SELL THESE SECURITIES AND IT IS NOT A SOLICITATION OF AN OFFER TO BUY THESE SECURITIES IN ANY JURISDICTION WHERE THE OFFER OR SALE IS NOT PERMITTED.
29
| No. 1 – St. Johns Town Center | ||||||||
| Loan Information | Property Information | |||||||
| Mortgage Loan Seller: | Wells Fargo Bank, National Association | Single Asset/Portfolio: | Single Asset | |||||
Credit Assessment (DBRS/Moody’s/Morningstar): | AA-/aaa (sca.pd)/AA | Property Type: | Retail | |||||
Original Principal Balance(1): | $100,000,000 | Specific Property Type: | Regional Mall | |||||
Cut-off Date Principal Balance(1): | $100,000,000 | Location: | Jacksonville, FL | |||||
| % of Initial Pool Balance: | 11.4% | Size: | 981,157 SF | |||||
| Loan Purpose: | Refinance | Cut-off Date Principal Balance Per SF(1): | $207.41 | |||||
| Borrower Names: | Shops at St. Johns, LLC; STJTC II, LLC | Year Built/Renovated: | 2005/2014 | |||||
| Sponsors: | Simon Property Group; Deutsche Bank Asset & Wealth Management | Title Vesting: | Fee | |||||
| Mortgage Rate: | 3.819% | Property Manager: | Self-managed | |||||
| Note Date: | September 11, 2014 | 3rd Most Recent Occupancy (As of): | 99.0% (12/31/2011) | |||||
| Anticipated Repayment Date: | NAP | 2nd Most Recent Occupancy (As of): | 99.0% (12/31/2012) | |||||
| Maturity Date: | September 11, 2024 | Most Recent Occupancy (As of): | 100.0% (12/31/2013) | |||||
| IO Period: | 120 months | Current Occupancy (As of): | 99.3% (10/10/2014) | |||||
| Loan Term (Original): | 120 months | |||||||
| Seasoning: | 3 months | Underwriting and Financial Information: | ||||||
| Amortization Term (Original): | NAP | |||||||
| Loan Amortization Type: | Interest-only, Balloon | 3rd Most Recent NOI (As of): | $27,001,907 (12/31/2012) | |||||
| Interest Accrual Method: | Actual/360 | 2nd Most Recent NOI (As of): | $27,453,672 (12/31/2013) | |||||
| Call Protection: | L(27),D(86),O(7) | Most Recent NOI (As of)(4): | $28,338,050 (TTM 9/30/2014) | |||||
| Lockbox Type: | Hard/Springing Cash Management | |||||||
Additional Debt(1)(2): | Yes | |||||||
Additional Debt Type(1)(2): | Pari Passu and Subordinate Debt | U/W Revenues: | $42,131,308 | |||||
| U/W Expenses: | $10,850,053 | |||||||
U/W NOI(4): | $31,281,255 | |||||||
| U/W NCF: | $30,054,599 | |||||||
U/W NOI DSCR(1): | 3.97x | |||||||
Escrows and Reserves(3): | U/W NCF DSCR(1): | 3.81x | ||||||
U/W NOI Debt Yield(1): | 15.4% | |||||||
Type: | Initial | Monthly | Cap (If Any) | U/W NCF Debt Yield(1): | 14.8% | |||
| Taxes | $0 | Springing | NAP | As-Is Appraised Value: | $760,000,000 | |||
| Insurance | $0 | Springing | NAP | As-Is Appraisal Valuation Date: | August 21, 2014 | |||
| Replacement Reserves | $0 | Springing | NAP | Cut-off Date LTV Ratio(1): | 26.8% | |||
| TI/LC Reserve | $0 | Springing | NAP | LTV Ratio at Maturity or ARD(1): | 26.8% | |||
| (1) | The St. Johns Town Center Loan Combination, totaling $350,000,000, is comprised of six pari passu notes totaling $203,500,000 (Notes A-1, A-2, A-3, A-4, A-5 and A-6) and three subordinate non-pooled notes totaling $146,500,000 (Notes B-1, B-2 and B-3). Notes A-4, A-5 and A-6 (collectively, the “St. Johns Town Center Mortgage Loan”) had an original principal balance of $100,000,000, have an outstanding principal balance of $100,000,000 as of the Cut-off Date and will be contributed to the WFRBS 2014-C25 Trust. Notes A-1, A-2 and A-3 (collectively, the “St. Johns Town Center Pari Passu Companion Loan”), had an original principal balance of $103,500,000 and will be contributed WFRBS 2014-C24 Trust. Notes B-1, B-2 and B-3 (collectively, the “Subordinate Loan”) had an original principal balance of $146,500,000, and will be contributed to the WFRBS 2014-C24 Trust. See “Description of the Mortgage Pool—Additional Indebtedness—The Loan Combinations—St. Johns Town Center Loan Combination” in the Free Writing Prospectus. All statistical information related to balances per square foot, loan-to-value ratios, debt service coverage ratios and debt yields are based on the St. Johns Town Center Pooled Loan Combination. As of the Cut-off Date, the U/W NCF DSCR, U/W NCF debt yield and the LTV for the St. Johns Town Center Loan Combination were 2.22x, 8.6% and 46.1%, respectively. |
| (2) | See “Subordinate and Mezzanine Indebtedness” section. |
| (3) | See “Escrows” section. |
| (4) | See “Cash Flow Analysis” section. |
The Mortgage Loan. The mortgage loan (the “St. Johns Town Center Loan Combination”) is evidenced by six pari passu promissory notes (Notes A-1, A-2, A-3, A-4, A-5 and A-6, collectively, the “St. Johns Town Center Pooled Loan Combination”) and three subordinate non-pooled notes totaling $146,500,000 (Notes B-1, B-2 and B-3, collectively the “Subordinate Loan”) secured by a first mortgage encumbering a super-regional mall located in Jacksonville, Florida (the “St. Johns Town Center Property”). The St. Johns Town Center Loan Combination was originated on September 11, 2014 by Wells Fargo Bank, National Association. The St. Johns Town Center Loan Combination had an original principal balance of $350,000,000, has an outstanding principal balance as of the Cut-off Date of $350,000,000 and accrues interest at an interest rate of 3.819% per annum. The St. Johns Town Center Loan Combination had an initial term of 120 months, has a remaining term of 117 months as of the Cut-off Date and requires interest-only payments through the term of the St. Johns Town Center Loan Combination. The St. Johns Town Center Loan Combination matures on September 11, 2024.
THE INFORMATION IN THIS STRUCTURAL AND COLLATERAL TERM SHEET IS NOT COMPLETE AND MAY BE AMENDED PRIOR TO THE TIME OF SALE. THIS TERM SHEET IS NOT AN OFFER TO SELL THESE SECURITIES AND IT IS NOT A SOLICITATION OF AN OFFER TO BUY THESE SECURITIES IN ANY JURISDICTION WHERE THE OFFER OR SALE IS NOT PERMITTED.
30
| ST. JOHNS TOWN CENTER |
Notes A-4, A-5 and A-6 (collectively, the “St. Johns Town Center Mortgage Loan”) had an original principal balance of $100,000,000, have an outstanding principal balance of $100,000,000 as of the Cut-off Date and will be contributed to the WFRBS 2014-C25 Trust. Notes A-1, A-2 and A-3 (collectively, the “St. Johns Town Center Pari Passu Companion Loan”) had an original principal balance of $103,500,000 and will be contributed to the WFRBS 2014-C24 Trust. Notes B-1, B-2 and B-3 will be the initial controlling interest in the St. Johns Town Center Loan Combination and had an original principal balance of $146,500,000 and will be contributed to the WFRBS 2014-C24 Trust. See “Description of the Mortgage Pool—Additional Indebtedness—The Loan Combinations—St. Johns Town Center Loan Combination” in the Free Writing Prospectus.
Following the lockout period, the borrowers have the right to defease the St. Johns Town Center Loan Combination in whole, but not in part, on any date before March 11, 2024. In addition, the St. Johns Town Center Loan Combination is prepayable without penalty on or after March 11, 2024.
Sources and Uses
| Sources | Uses | |||||||
| Original loan combination amount | $350,000,000 | 100.0% | Loan payoffs(1) | $254,574,535 | 72.7% | |||
| Closing costs | 4,728,252 | 1.4 | ||||||
| Return of equity | 90,697,213 | 25.9 | ||||||
| Total Sources | $350,000,000 | 100.0% | Total Uses | $350,000,000 | 100.0% |
| (1) | Phase I of the St. Johns Town Center Property was securitized in CSFB 2005-C5. The phase I loan payoff was approximately $159.6 million, phase II loan payoff was approximately $76.8 million and the phase III loan payoff was approximately $18.2 million. |
The Property. The St. Johns Town Center Property is an outdoor super-regional mall located in Jacksonville, Florida. The St. Johns Town Center Property contains approximately 1.4 million square feet of retail space, of which 981,157 square feet (the “St. Johns Center Mortgaged Property”) serve as collateral for the St. Johns Town Center Loan Combination. The St. Johns Town Center Property is situated on a 151.0-acre parcel of land and is anchored by Target (not part of the collateral), Dillard’s (not part of the collateral), Ashley Furniture (not part of the collateral), Nordstrom and Dick’s Sporting Goods. Other major tenants include Jo-Ann Fabrics, Ross Dress For Less, DSW Shoe Warehouse, Staples, PetSmart, Old Navy, Apple and XXI Forever. The St. Johns Town Center Property was built in three Phases beginning in 2004. The initial phase of the project (“Phase I”) was completed in March 2005 and comprises approximately 1.0 million square feet. The Phase I comprises an approximately 600,000 square foot lifestyle center anchored by Dillard’s and Dick’s Sporting Goods in addition to approximately 100 shops including Anthropologie, Apple and Williams Sonoma. Phase I also includes a community center anchored by Target, Ashley Furniture, Jo-Ann Fabric and Ross Dress For Less. The community center creates cross shopping opportunities within the project, providing customers with a mix of both discount and moderate-priced retailers. In 2007, the second phase of the project (“Phase II”) was completed and consists of a luxury wing with approximately 200,000 square feet of small shops and restaurants occupied by tenants that include Louis Vuitton, West Elm, Lululemon, Pottery Barn and Tiffany & Co. The final phase of the development (“Phase III”) opened in October 2014 and includes a Nordstrom anchor and approximately 33,000 square feet of additional in-line square footage. Other Phase III tenants consist of a two-level Arhaus Furniture store, the Disney Store, Free People, Boston Proper and Yankee Candle. The Nordstrom at the St. Johns Town Center Property is the first location for this retailer in northeast Florida and the nearest previous Nordstrom location, 130 miles south in Orlando, Florida, closed in August 2014. The total development cost of Phase III was approximately $27.0 million and as of October 10, 2014, the St. Johns Town Center Mortgaged Property was 99.3% occupied by 182 tenants.
THE INFORMATION IN THIS STRUCTURAL AND COLLATERAL TERM SHEET IS NOT COMPLETE AND MAY BE AMENDED PRIOR TO THE TIME OF SALE. THIS TERM SHEET IS NOT AN OFFER TO SELL THESE SECURITIES AND IT IS NOT A SOLICITATION OF AN OFFER TO BUY THESE SECURITIES IN ANY JURISDICTION WHERE THE OFFER OR SALE IS NOT PERMITTED.
31
| ST. JOHNS TOWN CENTER |
The following table presents certain information relating to the tenancy at the St. Johns Town Center Property:
Major Tenants
| Tenant Name | Credit Rating (Fitch/Moody’s/ S&P)(1) | Tenant NRSF | % of NRSF | Annual U/W Base Rent PSF(2) | Annual U/W Base Rent(2) | % of Total Annual U/W Base Rent | Sales PSF(3) | Occupancy Cost(3) | Lease Expiration Date |
| Anchor Tenant – Not Part of Collateral | |||||||||
| Target | A-/A2/A | ANCHOR OWNED – NOT PART OF THE COLLATERAL | |||||||
| Dillard’s | BBB-/Ba2/BB+ | ANCHOR OWNED – NOT PART OF THE COLLATERAL | |||||||
| Ashley Furniture | NR/NR/NR | ANCHOR OWNED – NOT PART OF THE COLLATERAL | |||||||
| Anchor Tenants | |||||||||
| Dick’s Sporting Goods | NR/NR/NR | 66,000 | 6.7% | $14.50 | $957,000 | 3.5% | $278 | 6.6% | 1/31/2021(4) |
Nordstrom(5) | A-/Baa1/A- | 124,587 | 12.7% | $4.41 | $550,000 | 2.0% | NAV(6) | NAV(6) | 2/28/2030 |
| Total Anchor Tenants | 190,587 | 19.4% | $7.91 | $1,507,000 | 5.5% | ||||
| Major Tenants | |||||||||
| XXI Forever | NR/NR/NR | 14,470 | 1.5% | $62.95 | $910,867 | 3.3% | $338 | 20.3% | 7/31/2020(7) |
| DSW Shoe Warehouse | NR/NR/NR | 30,000 | 3.1% | $17.00 | $510,000 | 1.9% | $281 | 6.1% | 1/31/2016 |
| Barnes & Noble | NR/NR/NR | 25,000 | 2.5% | $19.80 | $495,000 | 1.8% | $268 | 7.4% | 4/30/2015 |
| Arhaus Furniture | NR/NR/NR | 16,000 | 1.6% | $28.25 | $452,000 | 1.6% | NAV | NAV | 1/31/2025 |
| Urban Outfitters | NR/NR/NR | 12,139 | 1.2% | $37.00 | $449,143 | 1.6% | $376 | 15.2% | 10/31/2017 |
| Maggiano’s Little Italy | BBB-/Ba2/BBB- | 14,832 | 1.5% | $27.60 | $409,363 | 1.5% | $603 | 6.5% | 3/31/2015 |
| Cheesecake Factory | NR/NR/NR | 10,500 | 1.1% | $38.70 | $406,350 | 1.5% | $1,067 | 4.8% | 1/31/2026 |
| West Elm | NR/NR/NR | 11,462 | 1.2% | $31.18 | $357,396 | 1.3% | $322 | 16.2% | 3/31/2020 |
| Ballard Design | NR/NR/NR | 10,347 | 1.1% | $34.45 | $356,454 | 1.3% | $334 | 16.4% | 1/31/2018 |
| JoAnn Fabrics | NR/Caa1/B | 35,000 | 3.6% | $10.00 | $350,000 | 1.3% | $167 | 6.9% | 1/31/2016 |
| Anthropologie | NR/NR/NR | 10,736 | 1.1% | $32.00 | $343,552 | 1.2% | $444 | 11.3% | 1/31/2016 |
| Ross Dress For Less | NR/A3/A+ | 30,187 | 3.1% | $11.00 | $332,057 | 1.2% | NAV | NAV | 1/31/2016 |
| Pottery Barn | NR/NR/NR | 12,221 | 1.2% | $26.56 | $324,603 | 1.2% | $623 | 7.0% | 3/31/2020 |
| PetSmart | NR/NR/B+ | 19,107 | 1.9% | $14.50 | $277,052 | 1.0% | $405 | 3.8% | 5/31/2020 |
| Old Navy | BBB-/Baa3/BBB- | 16,953 | 1.7% | $15.73 | $266,671 | 1.0% | $523 | 3.5% | 3/31/2020 |
| Total Major Tenants | 268,954 | 27.4% | $23.20 | $6,240,508 | 22.7% | ||||
| Non-Major Tenants | 514,682 | 52.5% | $38.38 | $19,752,242 | 71.8% | ||||
| Occupied Collateral Total | 974,223 | 99.3% | $28.23 | $27,499,750 | 100.0% | ||||
| Vacant Space | 6,934 | 0.7% | |||||||
| Collateral Total | 981,157 | 100.0% | |||||||
| (1) | Certain ratings are those of the parent company whether or not the parent guarantees the lease. |
| (2) | Annual U/W Base Rent PSF and Annual U/W Base Rent include contractual rent steps through September 2015. |
| (3) | Sales and Occupancy Costs are based on the trailing 12-month period ending December 31, 2013 and Annual U/W Base Rent, respectively. |
| (4) | Dick’s Sporting Goods has three, 5-year renewal options |
| (5) | Nordstrom is a fashion specialty retailer offering clothing, shoes and accessories for men, women and children. |
| (6) | Sales figures for Nordstrom are not available as the tenant opened for business in October 2014. |
| (7) | XXI Forever may terminate its lease 60 days after August 1, 2015 if gross sales between August 1, 2014 and August 1, 2015 are less than $4.8 million. Gross sales as of year-end 2013 were approximately $4.9 million. |
THE INFORMATION IN THIS STRUCTURAL AND COLLATERAL TERM SHEET IS NOT COMPLETE AND MAY BE AMENDED PRIOR TO THE TIME OF SALE. THIS TERM SHEET IS NOT AN OFFER TO SELL THESE SECURITIES AND IT IS NOT A SOLICITATION OF AN OFFER TO BUY THESE SECURITIES IN ANY JURISDICTION WHERE THE OFFER OR SALE IS NOT PERMITTED.
32
| ST. JOHNS TOWN CENTER |
The following table presents certain information relating to the historical sales and occupancy costs at the St. Johns Town Center Mortgaged Property:
Historical Sales (PSF) and Occupancy Costs(1)
| Tenant Name | 2011 | 2012 | 2013 | Occupancy Cost(2) |
| Dick’s Clothing & Sport | $289 | $293 | $278 | 6.6% |
| XXI Forever | $365 | $370 | $338 | 20.3% |
| DSW Shoe Warehouse | $250 | $270 | $281 | 6.1% |
| Barnes & Noble | $324 | $287 | $268 | 7.4% |
| Urban Outfitters | $310 | $289 | $376 | 15.2% |
| Magginano’s Little Italy | $561 | $582 | $603 | 6.5% |
| Cheesecake Factory | $1,038 | $1,042 | $1,067 | 4.8% |
| Ballard Design | $262 | $302 | $334 | 16.4% |
| West Elm | $271 | $315 | $322 | 16.2% |
| Jo-Ann Fabrics | $179 | $172 | $167 | 6.9% |
| Anthropologie | $443 | $416 | $444 | 11.3% |
| Pottery Barn | $430 | $577 | $623 | 7.0% |
| PetSmart | $352 | $377 | $405 | 3.8% |
| Old Navy | $445 | $500 | $523 | 3.5% |
Total Comparable Sales(3) | $559 | $593 | $603 | |
Occupancy Costs(4) | 9.8% | 8.8% | 9.4% |
| (1) | Historical Sales (PSF) and Occupancy Costs were provided by the borrowers and include tenants occupying less than 10,000 square feet and report full 12-month sales for the periods ending 2011, 2012 and 2013. |
| (2) | Occupancy Costs are based on the Annual U/W Base Rent and year-end 2013 reimbursements and sales for tenants occupying less than 10,000 square feet. |
| (3) | Excluding Apple, 2011, 2012 and 2013 Comparable Sales were $458 per square foot, $485 per square foot and $502 per square foot, respectively. |
| (4) | Excluding Apple, 2011, 2012 and 2013 Occupancy Costs were 11.2%, 10.2% and 10.8%, respectively. |
The following table presents certain information relating to the lease rollover schedule at the St. Johns Town Center Mortgaged Property:
Lease Expiration Schedule(1)(2)
Year Ending December 31, | No. of Leases Expiring | Expiring NRSF | % of Total NRSF | Cumulative Expiring NRSF | Cumulative % of Total NRSF | Annual U/W Base Rent | % of Annual U/W Base Rent | Annual U/W Base Rent PSF(3) | |
| MTM | 0 | 0 | 0.0% | 0 | 0.0% | $0 | 0.0% | $0.00 | |
| 2014 | 0 | 0 | 0.0% | 0 | 0.0% | $0 | 0.0% | $0.00 | |
| 2015 | 29 | 144,907 | 14.8% | 144,907 | 14.8% | $4,048,771 | 14.7% | $27.94 | |
| 2016 | 37 | 213,970 | 21.8% | 358,877 | 36.6% | $4,704,807 | 17.1% | $21.99 | |
| 2017 | 15 | 63,569 | 6.5% | 422,446 | 43.1% | $2,812,710 | 10.2% | $44.25 | |
| 2018 | 25 | 90,699 | 9.2% | 513,145 | 52.3% | $4,225,433 | 15.4% | $46.59 | |
| 2019 | 7 | 28,370 | 2.9% | 541,515 | 55.2% | $944,586 | 3.4% | $33.30 | |
| 2020 | 13 | 126,976 | 12.9% | 668,491 | 68.1% | $3,615,939 | 13.1% | $28.48 | |
| 2021 | 6 | 86,005 | 8.8% | 754,496 | 76.9% | $1,901,404 | 6.9% | $22.11 | |
| 2022 | 4 | 5,297 | 0.5% | 759,793 | 77.4% | $553,843 | 2.0% | $104.56 | |
| 2023 | 10 | 25,586 | 2.6% | 785,379 | 80.0% | $1,152,381 | 4.2% | $45.04 | |
| 2024 | 10 | 25,940 | 2.6% | 811,319 | 82.7% | $1,554,791 | 5.7% | $59.94 | |
| Thereafter | 26 | 162,904 | 16.6% | 974,223 | 99.3% | $1,985,085 | 7.2% | $12.19 | |
| Vacant | 0 | 6,934 | 0.7% | 981,157 | 100.0% | $0 | 0.0% | $0.00 | |
| Total/Weighted Average | 182 | 981,157 | 100.0% | $27,499,750 | 100.0% | $28.23 | |||
(1) Information obtained from the underwritten rent roll.
(2) Certain tenants may have lease termination options that are exercisable prior to the originally stated expiration date of the subject lease and that are not considered in the Lease Expiration Schedule.
(3) Weighted Average Annual U/W Base Rent PSF excludes vacant space.
THE INFORMATION IN THIS STRUCTURAL AND COLLATERAL TERM SHEET IS NOT COMPLETE AND MAY BE AMENDED PRIOR TO THE TIME OF SALE. THIS TERM SHEET IS NOT AN OFFER TO SELL THESE SECURITIES AND IT IS NOT A SOLICITATION OF AN OFFER TO BUY THESE SECURITIES IN ANY JURISDICTION WHERE THE OFFER OR SALE IS NOT PERMITTED.
33
| ST. JOHNS TOWN CENTER |
The following table presents historical occupancy percentages at the St. Johns Town Center Mortgaged Property:
Historical Occupancy
12/31/2009(1) | 12/31/2010(1) | 12/31/2011(1) | 12/31/2012(1) | 12/31/2013(1) | 10/10/2014(2) | |||||
| 99.0% | 99.0% | 99.0% | 99.0% | 100.0% | 99.3% |
| (1) | Information obtained from the borrowers and occupancy was based on only the Phase I & Phase II square footage. |
| (2) | Information obtained from the underwritten rent roll and includes the Phase III development. |
The following table presents historical base rent per square foot at St. Johns Town Center Mortgaged Property:
Historical Average Base Rent (PSF)(1)
12/31/2011 | 12/31/2012 | 12/31/2013 | 9/30/2014 | |||
| $43.51 | $44.35 | $45.16 | $41.15 |
| (1) | Information obtained from borrower operating statements. The average base rent is based on the gross potential rent divided by the total square footage. The 2011, 2012 and 2013 Historical Average Base Rent was based on only the Phase I and Phase II square footage. |
Operating History and Underwritten Net Cash Flow. The following table presents certain information relating to the historical operating performance and the Underwritten Net Cash Flow at the St. Johns Town Center Mortgaged Property:
Cash Flow Analysis
| 2011 | 2012 | 2013 | TTM 9/30/2014 | U/W(1) | Market Adjusted U/W | U/W $ per SF | ||||||||
| Base Rent | $23,135,423 | $23,121,892 | $23,565,999 | $24,393,090 | $26,340,833 | $26,340,833 | $26.85 | |||||||
| Grossed Up Vacant Space | 0 | 0 | 0 | 0 | 211,282 | 211,282 | $0.22 | |||||||
| Rent Steps | 0 | 0 | 0 | 0 | 710,092 | 710,092 | $0.72 | |||||||
| Rent Averaging | 0 | 0 | 0 | 0 | 149,411 | 149,411 | $0.15 | |||||||
| Near Term Roll Benefit | 0 | 0 | 0 | 0 | 448,824 | 0 | $0.46 | |||||||
| Occ. Cost Mark-to-Market | 0 | 0 | 0 | 0 | 0 | 2,915,084(2) | $0.00 | |||||||
| Percentage Rent | 938,210 | 1,108,480 | 1,103,226 | 1,144,549 | 1,352,750 | 1,352,750 | $1.38 | |||||||
| Total Reimbursables | 11,265,366 | 11,687,660 | 11,968,065 | 14,392,005 | 13,108,151 | 13,108,151 | $13.36 | |||||||
| Other Income | 560,777 | 608,968 | 675,593 | 693,831 | 685,748 | 685,748 | $0.70 | |||||||
| Specialty Leasing | 515,632 | 623,416 | 576,544 | 448,050 | 482,268 | 482,268 | $0.49 | |||||||
| Less Vac & Credit Loss | (256,477) | 30,619 | (23,061) | (62,908) | (1,358,052)(3) | (1,336,056)(3) | ($1.38) | |||||||
| Effective Gross Income | $36,158,931 | $37,181,035 | $37,866,366 | $41,008,617 | $42,131,307 | $44,619,564 | $42.94 | |||||||
| Total Operating Expenses | $9,907,668 | $10,179,128 | $10,412,694 | $12,670,567 | $10,850,053 | $10,850,053 | $11.06 | |||||||
| Net Operating Income | $26,251,263 | $27,001,907 | $27,453,672 | $28,338,050 | $31,281,254 | $33,769,511 | $31.88 | |||||||
| TI/LC | 0 | 0 | 0 | 0 | 1,108,917 | 1,108,917 | $1.13 | |||||||
| Capital Expenditures | 0 | 0 | 0 | 0 | 117,739 | 117,739 | $0.12 | |||||||
| Net Cash Flow | $26,251,263 | $27,001,907 | $27,453,672 | $28,338,050 | $30,054,599 | $32,542,855 | $30.63 | |||||||
NOI DSCR(4) | 3.33x | 3.43x | 3.48x | 3.60x | 3.97x | 4.29x | ||||||||
NCF DSCR(4) | 3.33x | 3.43x | 3.48x | 3.60x | 3.81x | 4.13x | ||||||||
NOI DY(4) | 12.9% | 13.3% | 13.5% | 13.9% | 15.4% | 16.6% | ||||||||
NCF DY(4) | 12.9% | 13.3% | 13.5% | 13.9% | 14.8% | 16.0% |
| (1) | The increase in Base Rent from the TTM 9/30/2014 to U/W is mostly attributed to the opening of the 157,164 square feet Phase III development that opened in October 2014. The Phase III tenants account for approximately $1.8 million of U/W Base Rent. |
| (2) | A mark-to-market rental adjustment was made for all Phase I original tenants that have leases that expire in 2015 and 2016, excluding Apple and tenants who occupy over 10,000 square feet. The following assumptions were made: (i) rent for any tenants with an occupancy cost greater than 20.0% were decreased to a rental rate that would achieve a 20.0% occupancy cost based on year-end 2013 sales and recoveries (-$149,967); (ii) rent for any tenants with an occupancy cost less than 15.0% were increased to a rental rate that would achieve a 15.0% occupancy cost based on year-end 2013 sales and recoveries ($2,858,729); (iii) rent adjustments were not made for any tenant with an occupancy cost between 15.0% and 20.0% based on year-end 2013 sales and recoveries; and (iv) tenants with leases that expire in 2015 or 2016 that have automatic predetermined rental rate renewals were assumed to renew at the predetermined rental rates ($206,323). |
| (3) | The underwritten economic vacancy is 3.2%. The St. Johns Town Center Mortgaged Property was 99.3% occupied as of October 10, 2014. |
| (4) | DSCRs and debt yields are based on the St. Johns Town Center Pooled Loan Combination. |
Appraisal. As of the appraisal valuation date of August 21, 2014, the St. Johns Town Center Mortgaged Property had an “as-is” appraised value of $760,000,000.
Environmental Matters. According to a Phase I environmental site assessment dated August 22, 2014, there was no evidence of any recognized environmental conditions at the St. Johns Town Center Mortgaged Property.
Market Overview and Competition. The St. Johns Town Center Property is located approximately 12.0 miles southeast of the Jacksonville central business district, approximately 2.1 miles west of the University of North Florida, approximately one mile east of
THE INFORMATION IN THIS STRUCTURAL AND COLLATERAL TERM SHEET IS NOT COMPLETE AND MAY BE AMENDED PRIOR TO THE TIME OF SALE. THIS TERM SHEET IS NOT AN OFFER TO SELL THESE SECURITIES AND IT IS NOT A SOLICITATION OF AN OFFER TO BUY THESE SECURITIES IN ANY JURISDICTION WHERE THE OFFER OR SALE IS NOT PERMITTED.
34
| ST. JOHNS TOWN CENTER |
the Florida Blue Cross and Blue Shields headquarters and approximately 1.5 mile east of a Merrill Lynch campus. In addition, there are several million square feet of multi-tenant Class A office space in low and mid-rise buildings, primarily west and southwest of the St. Johns Town Center Property. Jacksonville is the largest city in Florida and the largest city in land area in the contiguous United States. With a population of nearly 1.4 million residents, Jacksonville is the most populous city in Florida and the third most populous city on the east coast, behind New York City and Philadelphia. Jacksonville is home to the Mayo Clinic, Nemours Children’s Clinic and UF Health Jacksonville (a teaching hospital for the University of Florida Health Science Center) and the headquarters for the surgical technologies division for Medtronic and other life science firms with headquarters that are located in the Jacksonville area, including vision-care products manufacturer Vistakon and the United States headquarters for Ranbaxy Pharmaceuticals. As of April 2014, Jacksonville’s unemployment rate of 5.6% remains lower than both the national rate of 6.3% and the state rate at 6.2% and year-over-year, the unemployment rate is down 1.2%. Additionally, Jacksonville is home to three Fortune 500 corporations: CSX, Fidelity National Financial and Fidelity National Information Services. According to the appraisal, The St. Johns Town Center Property’s primary trade area is defined as the Jacksonville core based statistical area (“CBSA”) with an estimated residential population of 1.4 million people as of year-end 2014. The estimated population within a five and ten-mile radius of the St. Johns Town Center Property is 157,124 and 511,747, respectively, with an average household income within the same radii of $68,440 and $69,635, respectively. The appraiser estimated market rent to be $43.38 per square foot on a triple-net basis for in-line tenants. The appraiser concluded to a vacancy rate of 3.0% for the St. Johns Town Center Mortgaged Property and the primary competitive set vacancy is approximately 3.1%.
The following table presents certain information relating to comparable properties to the St. Johns Town Center Property:
Competitive Set(1)
St. Johns Town Center (Subject) | Avenues Mall | Orange Park Mall | River City Marketplace | Markets at Town Center | |
| Location | Jacksonville, FL | Jacksonville, FL | Orange Park, FL | Jacksonville, FL | Jacksonville, FL |
| Distance from Subject | -- | 5.0 miles | 13.5 miles | 16.0 miles | 0.7 miles |
| Property Type | Super Regional Mall | Super Regional Mall | Super Regional Mall | Regional Center | Power Center |
| Year Built/Renovated | 2005/2014 | 1964/2005 | 1975/1991 | 2005/NAP | 2008/NAP |
| Anchors | Various(2) | Dillard’s, Belk, JC Penney, Sears, Books A Million, Forever 21 | Dillard’s, Belk, JC Penney, Sears, Dick’s Sporting Goods | WalMart Supercenter, Lowe’s, Gander Mountain, Best Buy, Ashley Furniture | Toys R Us, Nordstrom Rack, Best Buy, West Marine |
| Total GLA | 981,157 SF | 1,116,480 SF | 944,255 SF | 943,505 SF | 317,295 SF |
| Total Occupancy | 99% | 96% | 100% | 99% | 91% |
| (1) | Information obtained from the appraisal. |
| (2) | See “Major Tenants” section. |
The Borrowers. The borrowers are Shops at St. Johns, LLC and STJTC II, LLC, each a Delaware limited liability company and single purpose entity with two independent directors. Legal counsel to the borrowers delivered a non-consolidation opinion in connection with the origination of the St. Johns Town Center Loan Combination. Simon Property Group, L.P. (“Simon”) is the guarantor of certain nonrecourse carveouts up to 10.0% of the principal balance of the St. Johns Town Center Loan Combination.
The Sponsors. The sponsors are Simon and Deutsche Bank Asset & Wealth Management (“DeAWM”). Simon is an S&P 100 company with total market capitalization of $88.0 billion as of June 30, 2014 and Simon owns or has an interest in 228 retail commercial properties totaling approximately 189.0 million square feet. DeAWM, formerly known as RREEF, has been investing in real estate for over 40 years with a current portfolio of approximately €35.2 billion of assets under management as of June 30, 2014. Simon has sponsored other real estate projects over the last 10 years that have been the subject of mortgage loan defaults, foreclosure proceedings and deed-in-lieu of foreclosure. See “Description of the Mortgage Pool—Certain Terms of the Mortgage Loans—Non-Recourse Carveout Limitations” and “Description of the Mortgage Pool—Statistical Characteristics of the Mortgage Loans—Default History, Prior Bankruptcy Issues and Other Proceedings” in the Free Writing Prospectus.
Escrows. The loan documents do not require monthly escrows for real estate tax payments provided (i) no event of default has occurred and is continuing; (ii) the borrowers provide the lender with timely proof of payment; or (iii) the trailing 12-month debt service coverage ratio is not less than 1.20x for two consecutive calendar quarters. The loan documents do not require monthly escrows for insurance provided (i) no event of default has occurred and is continuing; (ii) the insurance required to be maintained by the borrowers is maintained pursuant to one or more blanket insurance policies approved by the lender; (iii) the borrowers provide the lender with timely proof of payment of insurance premiums; and (iv) the borrowers provide evidence of renewal of insurance policies. The loan documents do not require monthly deposits for replacement reserves or tenant improvements or leasing commissions as long as (i) no event of default has occurred and is continuing; or (ii) the trailing 12-month debt service coverage ratio is not less than 1.20x. If an event of default has occurred and is continuing or the trailing 12-month debt service coverage ratio is less than 1.20x for two consecutive calendar quarters, then monthly deposits of $20,441 (subject to a cap of $490,578) will be required for replacement reserves and $81,763 (subject to a cap of $1,962,314) will be required for tenant improvements and leasing commissions.
THE INFORMATION IN THIS STRUCTURAL AND COLLATERAL TERM SHEET IS NOT COMPLETE AND MAY BE AMENDED PRIOR TO THE TIME OF SALE. THIS TERM SHEET IS NOT AN OFFER TO SELL THESE SECURITIES AND IT IS NOT A SOLICITATION OF AN OFFER TO BUY THESE SECURITIES IN ANY JURISDICTION WHERE THE OFFER OR SALE IS NOT PERMITTED.
35
| ST. JOHNS TOWN CENTER |
Lockbox and Cash Management. The St. Johns Town Center Loan Combination requires a lender-controlled lockbox account, which is already in place, and that the borrowers direct tenants to pay their rents directly into such lockbox account. The loan documents also require that all rents received by the borrowers or the property manager be deposited into the lockbox account within two business days of receipt. Prior to the occurrence of a Lockbox Event Period (as defined below), all excess funds on deposit in the lockbox account are disbursed to the borrowers. During a Lockbox Event Period, all excess cash flow is swept to a lender-controlled cash management account on a monthly basis.
A “Lockbox Event Period” will commence upon the earlier of (i) the occurrence and continuance of an event of default; (ii) the borrowers or property manager declares bankruptcy; or (iii) for the trailing-twelve month period, the net cash flow debt service coverage ratio is less than 1.10x for two consecutive calendar quarters. A Cash Trap Event Period will be cured, with regard to clause (i), upon the cure of such event of default; with regard to clause (ii)(a) if the borrowers replace the sponsor with a Qualified Manager (as defined below) within 60 days of the bankruptcy or (b) the bankruptcy is discharged or dismissed within 90 days; or with regard to clause (iii), for the trailing-twelve month period, the net cash flow debt service coverage ratio is equal to or greater than 1.20x for two consecutive calendar quarters. The borrowers will have the right to cure a Lockbox Event Period no more than five times (in aggregate).
A “Qualified Manager” is a reputable and experienced professional management organization which is not subject to a bankruptcy, insolvency or similar proceeding that manages, together with its affiliates, (i) at least five retail properties containing at least 750,000 square feet of gross leasable area per property; and (ii) retail properties and shopping centers other than the St. Johns Town Center Property totaling at least in the aggregate 5,000,000 square feet of gross leasable area.
Property Management. The St. Johns Town Center Mortgaged Property is managed by an affiliate of Simon other than the borrower.
Assumption. The borrowers have the right to transfer the St. Johns Town Center Mortgaged Property provided that certain conditions are satisfied, including (i) no event of default has occurred and is continuing; (ii) the lender reasonably determined that the proposed transferee and guarantor satisfy the lender’s credit review and underwriting standards, taking into consideration transferee experience, financial strength and general business standing; and (iii) the lender has received confirmation from DBRS, Moody’s and Morningstar that such assumption will not result in a downgrade, withdrawal or qualification of the respective ratings assigned to the Series 2014-C25 Certificates, and similar confirmations with respect to the ratings of any securities backed by the St. Johns Town Center Pooled Companion Loan.
Free Release. Provided no event of default has occurred and is continuing, the borrowers are permitted to a free release of immaterial or a non-income producing portions of the St. Johns Town Center Mortgaged Property to third parties or affiliates of the borrowers.
Real Estate Substitution. Not permitted.
Subordinate and Mezzanine Indebtedness. The St. Johns Town Center Loan Combination includes a Subordinate Companion Loan, a subordinate interest in the St. Johns Town Center Loan Combination totaling $146,500,000. See “Description of the Mortgage Pool—Additional Indebtedness—The Loan Combinations—St. Johns Town Center Loan Combination” in the Free Writing Prospectus.
Ground Lease. None.
Terrorism Insurance. The loan documents require that the “all risk” insurance policy required to be maintained by the borrower provides coverage for terrorism in an amount equal to the full replacement cost of the St Johns Town Center Mortgaged Property. The loan documents also require business interruption insurance covering no less than the 24-month period following the occurrence of a casualty event, together with an 12-month extended period of indemnity.
Windstorm Insurance. The loan documents require windstorm insurance covering the full replacement cost of the St. Johns Town Center Mortgaged Property. At the time of loan closing, the St. Johns Town Center Mortgaged Property had insurance coverage for windstorm.
THE INFORMATION IN THIS STRUCTURAL AND COLLATERAL TERM SHEET IS NOT COMPLETE AND MAY BE AMENDED PRIOR TO THE TIME OF SALE. THIS TERM SHEET IS NOT AN OFFER TO SELL THESE SECURITIES AND IT IS NOT A SOLICITATION OF AN OFFER TO BUY THESE SECURITIES IN ANY JURISDICTION WHERE THE OFFER OR SALE IS NOT PERMITTED.
36
(THIS PAGE INTENTIONALLY LEFT BLANK)
37
| COLORADO MILLS |
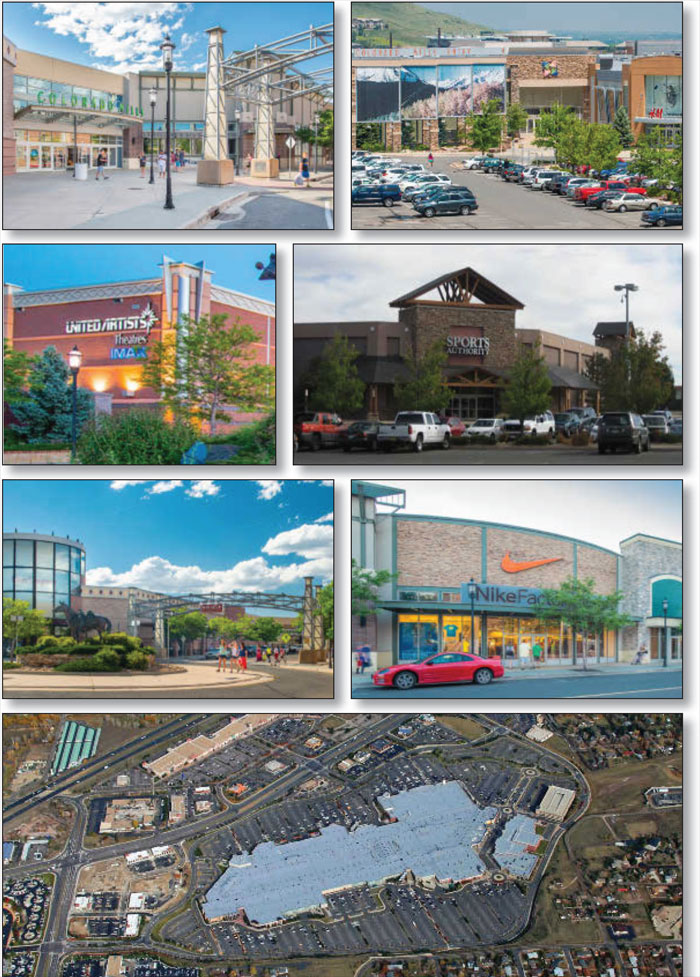
THE INFORMATION IN THIS STRUCTURAL AND COLLATERAL TERM SHEET IS NOT COMPLETE AND MAY BE AMENDED PRIOR TO THE TIME OF SALE. THIS TERM SHEET IS NOT AN OFFER TO SELL THESE SECURITIES AND IT IS NOT A SOLICITATION OF AN OFFER TO BUY THESE SECURITIES IN ANY JURISDICTION WHERE THE OFFER OR SALE IS NOT PERMITTED.
38
| COLORADO MILLS |
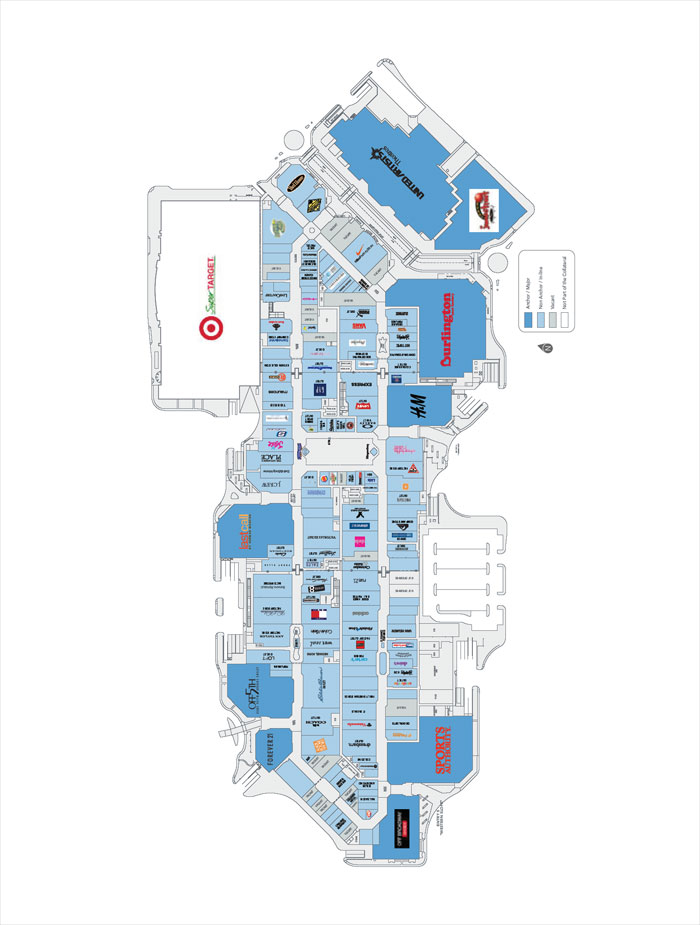
THE INFORMATION IN THIS STRUCTURAL AND COLLATERAL TERM SHEET IS NOT COMPLETE AND MAY BE AMENDED PRIOR TO THE TIME OF SALE. THIS TERM SHEET IS NOT AN OFFER TO SELL THESE SECURITIES AND IT IS NOT A SOLICITATION OF AN OFFER TO BUY THESE SECURITIES IN ANY JURISDICTION WHERE THE OFFER OR SALE IS NOT PERMITTED.
39
| COLORADO MILLS |
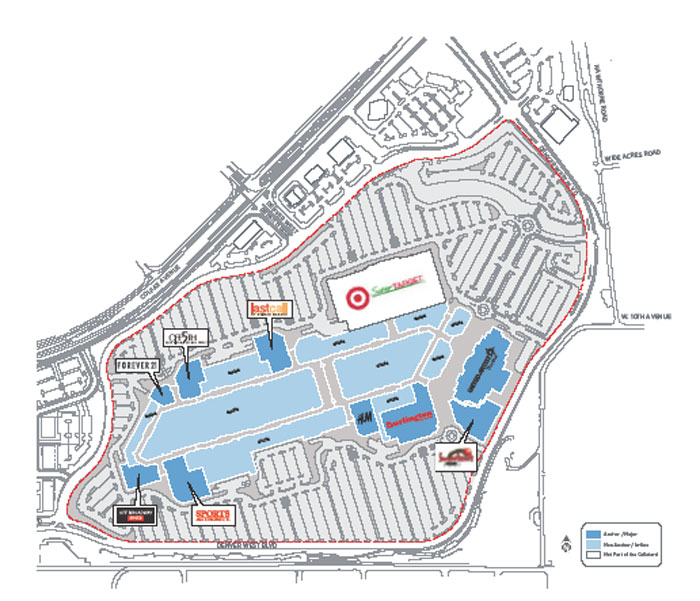
THE INFORMATION IN THIS STRUCTURAL AND COLLATERAL TERM SHEET IS NOT COMPLETE AND MAY BE AMENDED PRIOR TO THE TIME OF SALE. THIS TERM SHEET IS NOT AN OFFER TO SELL THESE SECURITIES AND IT IS NOT A SOLICITATION OF AN OFFER TO BUY THESE SECURITIES IN ANY JURISDICTION WHERE THE OFFER OR SALE IS NOT PERMITTED.
40
| COLORADO MILLS |

THE INFORMATION IN THIS STRUCTURAL AND COLLATERAL TERM SHEET IS NOT COMPLETE AND MAY BE AMENDED PRIOR TO THE TIME OF SALE. THIS TERM SHEET IS NOT AN OFFER TO SELL THESE SECURITIES AND IT IS NOT A SOLICITATION OF AN OFFER TO BUY THESE SECURITIES IN ANY JURISDICTION WHERE THE OFFER OR SALE IS NOT PERMITTED.
41
| No. 2 – Colorado Mills | |||||||
| Loan Information | Property Information | ||||||
| Mortgage Loan Seller: | The Royal Bank of Scotland plc | Single Asset/Portfolio: | Single Asset | ||||
Credit Assessment (DBRS/Moody’s/Morningstar): | NR/NR/NR | Property Type: | Retail | ||||
Original Principal Balance(1): | $100,000,000 | Specific Property Type: | Regional Mall | ||||
Cut-off Date Principal Balance(1): | $100,000,000 | Location: | Lakewood, CO | ||||
| % of Initial Pool Balance: | 11.4% | Size: | 918,448 SF | ||||
| Loan Purpose: | Refinance | Cut-off Date Principal Balance Per SF(1): | $148.08 | ||||
| Borrower Name: | Colorado Mills Mall Limited Partnership | Year Built/Renovated: | 2002/2013 | ||||
| Sponsor: | Simon Property Group | Title Vesting: | Fee | ||||
| Mortgage Rate: | 4.282% | Property Manager: | Self-managed | ||||
| Note Date: | October 30, 2014 | 3rd Most Recent Occupancy (As of)(3): | 86.5% (12/31/2011) | ||||
| Anticipated Repayment Date: | NAP | 2nd Most Recent Occupancy (As of)(3): | 91.6% (12/31/2012) | ||||
| Maturity Date: | November 1, 2024 | Most Recent Occupancy (As of)(3): | 94.0% (12/31/2013) | ||||
| IO Period: | 36 months | Current Occupancy (As of)(3): | 93.8% (10/1/2014) | ||||
| Loan Term (Original): | 120 months | ||||||
| Seasoning: | 1 month | Underwriting and Financial Information: | |||||
| Amortization Term (Original): | 360 months | ||||||
| Loan Amortization Type: | Interest-only, Amortizing Balloon | 3rd Most Recent NOI (As of): | $15,015,941 (12/31/2012) | ||||
| Interest Accrual Method: | Actual/360 | 2nd Most Recent NOI (As of): | $15,058,036 (12/31/2013) | ||||
| Call Protection: | L(25),D(88),O(7) | Most Recent NOI (As of): | $16,310,359 (TTM 9/30/2014) | ||||
| Lockbox Type: | Hard/Springing Cash Management | ||||||
Additional Debt(1): | Yes | U/W Revenues: | $28,139,377 | ||||
Additional Debt Type(1): | Pari Passu | U/W Expenses: | $11,755,768 | ||||
| U/W NOI: | $16,383,609 | ||||||
| U/W NCF: | $15,409,630 | ||||||
U/W NOI DSCR(1): | 2.03x | ||||||
Escrows and Reserves(2): | U/W NCF DSCR(1): | 1.91x | |||||
U/W NOI Debt Yield(1): | 12.0% | ||||||
Type: | Initial | Monthly | Cap (If Any) | U/W NCF Debt Yield(1): | 11.3% | ||
| Taxes | $0 | Springing | NAP | As-Is Appraised Value: | $215,000,000 | ||
| Insurance | $0 | Springing | NAP | As-Is Appraisal Valuation Date: | October 1, 2014 | ||
| Replacement Reserves | $0 | Springing | $460,000 | Cut-off Date LTV Ratio(1): | 63.3% | ||
| TI/LC Reserve | $0 | Springing | $3,000,000 | LTV Ratio at Maturity or ARD(1): | 55.1% | ||
| (1) | The Colorado Mills Loan Combination, totaling $136,000,000, is comprised of two pari passu notes (Notes A-1 and A-2). The controlling Note A-1 had an original principal balance of $100,000,000, has an outstanding principal balance of $100,000,000 as of the Cut-off Date and will be contributed to the WFRBS 2014-C25 Trust. The non-controlling Note A-2 had an original principal balance of $36,000,000 and is expected to be contributed to a future trust. All statistical financial information related to balances per square foot, loan-to-value ratios, debt service coverage ratios and debt yields are based on the Colorado Mills Loan Combination. |
| (2) | See “Escrows” section. |
| (3) | Historical and current occupancy includes temporary and seasonal tenants. The Colorado Mills Property was 86.0% occupied by permanent tenants as of October 1, 2014. |
The Mortgage Loan. The mortgage loan (the “Colorado Mills Loan Combination”) is evidenced by two pari passu notes (Notes A-1 and A-2) secured by a first mortgage encumbering a regional mall located in Lakewood, Colorado (the “Colorado Mills Property”). The Colorado Mills Loan Combination was originated on October 30, 2014 by The Royal Bank of Scotland plc. The Colorado Mills Loan Combination had an original principal balance of $136,000,000, has an outstanding principal balance as of the Cut-off Date of $136,000,000 and accrues interest at an interest rate of 4.282% per annum. The Colorado Mills Loan Combination had an initial term of 120 months, has a remaining term of 119 months as of the Cut-off Date and requires interest-only payments for the first 36 payments following origination and, thereafter, requires payments of principal and interest based on a 30-year amortization schedule. The Colorado Mills Loan Combination matures on November 1, 2024.
Note A-1, which represents the controlling interest in the Colorado Mills Loan Combination and will be contributed to the WFRBS 2014-C25 Trust, had an original principal balance of $100,000,000 and has an outstanding principal balance as of the Cut-off Date of $100,000,000. Note A-2 (the “Colorado Mills Companion Loan”), which represents a non-controlling interest in the Colorado Mills Loan Combination, had an original principal balance of $36,000,000, and is expected to be contributed to a future trust. See “Description of the Mortgage Pool—Additional Indebtedness—The Loan Combinations—The Colorado Mills Loan Combination” and “The Pooling and Servicing Agreement—Servicing of the Loan Combinations” in the Free Writing Prospectus.
THE INFORMATION IN THIS STRUCTURAL AND COLLATERAL TERM SHEET IS NOT COMPLETE AND MAY BE AMENDED PRIOR TO THE TIME OF SALE. THIS TERM SHEET IS NOT AN OFFER TO SELL THESE SECURITIES AND IT IS NOT A SOLICITATION OF AN OFFER TO BUY THESE SECURITIES IN ANY JURISDICTION WHERE THE OFFER OR SALE IS NOT PERMITTED.
42
| COLORADO MILLS |
Following the lockout period, the borrower has the right to defease the Colorado Mills Loan Combination in whole, but not in part, on any due date before May 1, 2024. In addition, the Colorado Mills Loan Combination is prepayable without penalty on or after May 1, 2024.
Sources and Uses
| Sources | Uses | |||||||
| Original loan combination amount | $136,000,000 | 100.0% | Loan payoff | $113,748,969 | 83.6% | |||
| Closing costs | 518,866 | 0.4 | ||||||
| Return of equity | 21,732,165 | 16.0 | ||||||
| Total Sources | $136,000,000 | 100.0% | Total Uses | $136,000,000 | 100.0% |
The Property. The Colorado Mills Property is a single-story regional outlet mall and entertainment center located at the intersection of West Colfax Avenue and Indiana Street, adjacent to Interstate-70, in Lakewood, Colorado, approximately 10 miles west of downtown Denver. The Colorado Mills Property contains 1,099,545 square feet of retail space, of which 918,448 square feet (the “Colorado Mills Mortgaged Property”) serve as collateral for the Colorado Mills Loan Combination. The Colorado Mills Property was constructed in 2002 and is situated on a 122.0-acre parcel of land, of which 90.2-acres serve as collateral. The Colorado Mills Property is anchored by Target (not part of the collateral), a 16-screen United Artists Theatre (a movie theater) and Burlington Coat Factory (an apparel and home product retailer). Junior anchors at the Colorado Mills Property include Sports Authority, Last Call Neiman Marcus, Off 5th Saks Fifth Avenue, H&M, and Forever 21 (each are national retailers). In-line tenants at the Colorado Mills Property include Pier 1 Imports (ground lease), Nike Factory Store, Victoria’s Secret, Gap Outlet, Express, and Coach Factory. In 2013, approximately $7.0 million of capital was invested by the sponsor to remodel ten stores, secure 12 new tenants, and relocate five existing tenants. In 2014, the Colorado Mills Property added new tenants including J. Crew, Adidas, Michael Kors, Calvin Klein and five new food court tenants. The Colorado Mills Property contains 7,038 parking spaces, resulting in a parking ratio of 6.4 spaces per 1,000 square feet of rentable area. As of June 30, 2014, tenants occupying 10,000 square feet or less had trailing 12-month in-line sales of $324 per square foot with an average occupancy cost of 11.8%. As of October 1, 2014, the Colorado Mills Mortgaged Property was 93.8% occupied by 165 tenants (including temporary tenants).
Tenants at the Colorado Mills Property are required to remit an amount equal to 1.4% of all sales (“PIF”) to the City of Lakewood, Colorado to support certain bonds. Neither the borrower nor the sponsor has any obligation to fund any portion of the PIF due by the tenants and the failure of a tenant to pay such amounts will not result in a lien against the Colorado Mills Mortgaged Property. See “Description of the Mortgage Pool—Tenant or Other Third Party Issues” in the Free Writing Prospectus.
THE INFORMATION IN THIS STRUCTURAL AND COLLATERAL TERM SHEET IS NOT COMPLETE AND MAY BE AMENDED PRIOR TO THE TIME OF SALE. THIS TERM SHEET IS NOT AN OFFER TO SELL THESE SECURITIES AND IT IS NOT A SOLICITATION OF AN OFFER TO BUY THESE SECURITIES IN ANY JURISDICTION WHERE THE OFFER OR SALE IS NOT PERMITTED.
43
| COLORADO MILLS |
The following table presents certain information relating to tenancy at the Colorado Mills Property:
Major Tenants
| Tenant Name | Credit Rating (Fitch/Moody’s/ S&P)(1) | Tenant NRSF | % of NRSF | Annual U/W Base Rent PSF(2) | Annual U/W Base Rent(2) | % of Total Annual U/W Base Rent | Sales PSF(3) | Occupancy Cost(3)(4) | Lease Expiration Date | |
| Anchor Tenant - Not Part of Collateral | ||||||||||
| Target | A-/A2/A | 181,039 | ANCHOR OWNED - NOT PART OF THE COLLATERAL | |||||||
| Anchor Tenants - Collateral | ||||||||||
| United Artists Theatre | B+/B3/B+ | 82,451 | 9.0% | $10.50 | $865,736 | 6.2% | $371,648(5) | 14.6% | 12/17/2017(6) | |
| Burlington Coat Factory | NR/NR/NR | 63,145 | 6.9% | $8.05 | $508,317 | 3.7% | $123 | 6.2% | 1/31/2016(7) | |
| Total Anchor Tenants - Collateral | 145,596 | 15.9% | $9.44 | $1,374,053 | 9.9% | |||||
| Other Major Tenants – Collateral | ||||||||||
| Sports Authority | NR/NR/NR | 43,568 | 4.7% | $16.94 | $738,042 | 5.3% | $198 | 10.3% | 1/31/2018 | |
| Off Broadway Shoes | NR/NR/NR | 23,051 | 2.5% | $24.50 | $564,750 | 4.1% | $204 | 15.6% | 6/30/2020 | |
| Last Call Neiman Marcus | NR/Caa2/B | 32,143 | 3.5% | $15.75 | $506,252 | 3.6% | $221 | 9.2% | 1/31/2018 | |
| Forever 21 | NR/NR/NR | 21,975 | 2.4% | $15.12 | $332,313 | 2.4% | $160 | 9.3% | 8/31/2023 | |
| Jumpstreet | NR/NR/NR | 40,217 | 4.4% | $7.09 | $285,000 | 2.0% | $38 | 18.6% | 7/31/2017 | |
Off 5th Saks Fifth Ave | NR/NR/NR | 28,003 | 3.0% | $0.00(8) | $0(8) | 0.0% | $108 | 3.5% | 1/31/2016 | |
| H&M | NR/NR/NR | 23,464 | 2.6% | $0.00(9) | $0(9) | 0.0% | $213 | 9.0% | 1/31/2024 | |
| Total Other Major Tenants - Collateral | 212,421 | 23.1% | $15.07 | $2,426,356 | 17.4% | |||||
Non-Major Retail Tenants(10) – Collateral | 503,604 | 54.8% | $25.40 | $10,124,044 | 72.7% | |||||
Total Occupied Collateral(10) | 861,621 | 93.8% | $19.75 | $13,924,453 | 100.0% | |||||
| Total Vacant Space | 56,827 | 6.2% | ||||||||
| Collateral Total | 918,448 | 100.0% | ||||||||
| (1) | Certain ratings are those of the parent company whether or not the parent guarantees the lease. |
| (2) | Annual U/W Base Rent PSF and Annual U/W Base Rent include contractual rent steps through August 2015. |
| (3) | Sales PSF and Occupancy Costs are for the trailing 12-month period ending June 30, 2014. |
| (4) | Occupancy Costs include base rent, reimbursements and percentage rent, as applicable. |
| (5) | United Artists Theatre operates 16 screens and reported sales of $371,648 per screen for the trailing 12-month period ending June 30, 2014. |
| (6) | United Artists Theatre has three, 5-year lease renewal options. |
| (7) | Burlington Coat Factory has four, 5-year lease renewal options. |
| (8) | Off 5th Saks Fifth Ave pays percentage rent in-lieu of base rent in an amount equal to 3.5% of gross sales. |
| (9) | H&M pays percentage rent in-lieu of base rent in an amount equal to 9.0% of gross sales. |
| (10) | Includes 71,555 square feet attributed to temporary tenants that were not included in the Annual U/W Base Rent, along with 84,967 square feet attributed to certain tenants paying percentage rent in-lieu of base rent, for a total of 156,522 square feet. The Annual U/W Base Rent PSF for Non-Major Retail Tenants and Total Occupied Collateral exclude the square footage attributed to these tenants. |
THE INFORMATION IN THIS STRUCTURAL AND COLLATERAL TERM SHEET IS NOT COMPLETE AND MAY BE AMENDED PRIOR TO THE TIME OF SALE. THIS TERM SHEET IS NOT AN OFFER TO SELL THESE SECURITIES AND IT IS NOT A SOLICITATION OF AN OFFER TO BUY THESE SECURITIES IN ANY JURISDICTION WHERE THE OFFER OR SALE IS NOT PERMITTED.
44
| COLORADO MILLS |
The following table presents certain information relating to the historical sales and occupancy costs at the Colorado Mills Mortgaged Property:
Historical Sales (PSF) and Occupancy Costs(1)
Tenant Name | 2011 | 2012 | 2013 | TTM 6/30/2014 |
| Burlington Coat Factory | $97 | $107 | $122 | $123 |
Forever 21(2) | $344 | $292 | $163 | $160 |
| H&M | NAV | NAV | $219 | $213 |
| Jumpstreet | NAV | $64 | $40 | $38 |
| Last Call Neiman Marcus | $229 | $241 | $221 | $221 |
Off 5th Saks Fifth Ave | $121 | $110 | $106 | $108 |
| Off Broadway Shoes | $182 | $178 | $189 | $204 |
| Sports Authority | $174 | $180 | $183 | $198 |
United Artists Theatre(3) | $295,250 | $371,875 | $388,375 | $371,648 |
| Total In-line (<10,000 square feet) | $289 | $306 | $312 | $324 |
| Occupancy Costs | 14.5% | 13.5% | 12.5% | 11.8% |
| (1) | Historical Sales (PSF) and Occupancy Costs were provided by the borrower. |
| (2) | Forever 21 expanded its space in August 2013 from 3,688 square feet to 21,975 square feet. |
| (3) | Represents sales per screen. United Artists Theatre operates 16 screens. |
The following table presents certain information relating to the lease rollover schedule at the Colorado Mills Mortgaged Property:
Lease Expiration Schedule(1)(2)
Year Ending December 31, | No. of Leases Expiring | Expiring NRSF | % of Total NRSF | Cumulative of Total NRSF | Cumulative % of Total NRSF | Annual U/W Base Rent | % of Annual U/W Base Rent | Annual U/W Base Rent PSF(3) | |
MTM(4) | 35 | 71,555 | 7.8% | 71,555 | 7.8% | $0 | 0.0% | $0.00 | |
| 2014 | 4 | 21,608 | 2.4% | 93,163 | 10.1% | $366,298 | 2.6% | $16.95 | |
| 2015 | 20 | 63,861 | 7.0% | 157,024 | 17.1% | $1,278,564 | 9.2% | $21.25 | |
| 2016 | 18 | 139,043 | 15.1% | 296,067 | 32.2% | $1,826,487 | 13.1% | $16.83 | |
| 2017 | 12 | 157,532 | 17.2% | 453,599 | 49.4% | $1,730,393 | 12.4% | $11.81 | |
| 2018 | 13 | 102,678 | 11.2% | 556,277 | 60.6% | $2,161,491 | 15.5% | $21.05 | |
| 2019 | 9 | 50,934 | 5.5% | 607,211 | 66.1% | $860,002 | 6.2% | $20.14 | |
| 2020 | 6 | 45,493 | 5.0% | 652,704 | 71.1% | $1,098,612 | 7.9% | $24.15 | |
| 2021 | 3 | 10,923 | 1.2% | 663,627 | 72.3% | $243,466 | 1.7% | $22.29 | |
| 2022 | 6 | 20,923 | 2.3% | 684,550 | 74.5% | $542,386 | 3.9% | $25.92 | |
| 2023 | 15 | 71,821 | 7.8% | 756,371 | 82.4% | $1,802,655 | 12.9% | $25.10 | |
| 2024 | 20 | 90,135 | 9.8% | 846,506 | 92.2% | $1,584,454 | 11.4% | $27.05 | |
| Thereafter | 4 | 15,115 | 1.6% | 861,621 | 93.8% | $429,644 | 3.1% | $28.43 | |
Vacant(5) | 0 | 56,827 | 6.2% | 918,448 | 100.0% | $0 | 0.0% | $0.00 | |
| Total/Weighted Average | 165 | 918,448 | 100.0% | $13,924,453 | 100.0% | $19.75 | |||
| (1) | Information obtained from the underwritten rent roll. |
| (2) | Certain tenants may have lease termination options that are exercisable prior to the originally stated expiration date of the subject lease and that are not considered in the Lease Expiration Schedule. |
| (3) | The Annual U/W Base Rent PSF and Total/Weighted Average Annual U/W Base Rent PSF exclude vacant space, square feet attributed to tenants paying percentage rent in lieu of base rent and square footage attributed to temporary tenants. These rents were included in the underwritten percentage rent and other income. |
| (4) | Includes 35 temporary tenants. The rent for temporary tenants has been included in the underwritten other income. |
| (5) | Occupancy includes temporary and seasonal tenants. |
The following table presents historical occupancy percentages at the Colorado Mills Mortgaged Property:
Historical Occupancy(1)
12/31/2009 (2) | 12/31/2010(2) | 12/31/2011(2) | 12/31/2012(2) | 12/31/2013(2) | 10/1/2014(3) | |||||
| 83.1% | 86.9% | 86.5% | 91.6% | 94.0% | 93.8% |
| (1) | Occupancy includes temporary and seasonal tenants. The Colorado Mills Property was 86.0% occupied by permanent tenants as of October 1, 2014. |
| (2) | Information obtained from the borrower. |
| (3) | Information obtained from underwritten rent roll. |
THE INFORMATION IN THIS STRUCTURAL AND COLLATERAL TERM SHEET IS NOT COMPLETE AND MAY BE AMENDED PRIOR TO THE TIME OF SALE. THIS TERM SHEET IS NOT AN OFFER TO SELL THESE SECURITIES AND IT IS NOT A SOLICITATION OF AN OFFER TO BUY THESE SECURITIES IN ANY JURISDICTION WHERE THE OFFER OR SALE IS NOT PERMITTED.
45
| COLORADO MILLS |
The following table presents historical base rent per square foot at the Colorado Mills Mortgaged Property:
Historical Average Base Rent (PSF)(1)
12/31/2011 | 12/31/2012 | 12/31/2013 | TTM 9/30/2014 | |||
| $16.50 | $15.89 | $14.99 | $15.05 |
| (1) | Information obtained from the borrower’s operating statements. The average base rent is based on the gross potential rent divided by the occupied square footage and does not take into account temporary tenants or tenants paying percentage rent in lieu of base rent. |
Operating History and Underwritten Net Cash Flow. The following table presents certain information relating to the historical operating performance and the Underwritten Net Cash Flow at the Colorado Mills Mortgaged Property:
Cash Flow Analysis
| 2012 | 2013 | TTM 9/30/2014 | U/W | U/W $ per SF | |||||||||
| Base Rent | $13,369,544 | $12,938,317 | $13,061,074 | $13,924,453 | $15.16 | ||||||||
| Grossed Up Vacant Space | 0 | 0 | 0 | 4,816,331 | 5.24 | ||||||||
| Percentage Rent | 1,453,601 | 1,752,830 | 2,223,477 | 1,919,172 | 2.09 | ||||||||
| Total Reimbursables | 7,772,047 | 8,015,759 | 8,809,946 | 8,467,168 | 9.22 | ||||||||
| Other Income | 3,894,530 | 3,860,076 | 3,828,584 | 3,828,584 | 4.17 | ||||||||
| Less Vacancy & Credit Loss | (18,201) | (45,059) | 7,738 | (4,816,331)(1) | (5.24) | ||||||||
| Effective Gross Income | $26,471,521 | $26,521,923 | $27,930,819 | $28,139,377 | $30.64 | ||||||||
| Total Operating Expenses | $11,455,580 | $11,463,887 | $11,620,460 | $11,755,768 | $12.80 | ||||||||
| Net Operating Income | $15,015,941 | $15,058,036 | $16,310,359 | $16,383,609 | $17.84 | ||||||||
| TI/LC | 0 | 0 | 0 | 744,367 | 0.81 | ||||||||
| Replacement Reserves | 0 | 0 | 0 | 229,612 | 0.25 | ||||||||
| Net Cash Flow | $15,015,941 | $15,058,036 | $16,310,359 | $15,409,630 | $16.78 | ||||||||
NOI DSCR(2) | 1.86x | 1.87x | 2.02x | 2.03x | |||||||||
NCF DSCR(2) | 1.86x | 1.87x | 2.02x | 1.91x | |||||||||
NOI DY(2) | 11.0% | 11.1% | 12.0% | 12.0% | |||||||||
NCF DY(2) | 11.0% | 11.1% | 12.0% | 11.3% | |||||||||
| (1) | The underwritten economic vacancy is 15.8%. The Colorado Mills Mortgaged Property was 86.0% physically occupied by permanent tenants (93.8% occupied including temporary and seasonal tenants) as of October 1, 2014. |
| (2) | DSCRs and debt yields are based on the Colorado Mills Loan Combination. |
Appraisal. As of the appraisal valuation date of October 1, 2014, the Colorado Mills Mortgaged Property had an “as-is” appraised value of $215,000,000.
Environmental Matters. According to a Phase I environmental site assessment dated October 10, 2014, there was no evidence of any recognized environmental conditions at the Colorado Mills Mortgaged Property.
Market Overview and Competition. The Colorado Mills Property is located at the intersection of West Colfax Avenue and Indiana Street, adjacent to Interstate-70 in Lakewood, Colorado. The Colorado Mills Property is located in the western portion of the Denver metropolitan statistical area, situated approximately 10 miles west of downtown Denver. According to the appraisal, the Colorado Mills Property is located in the west Denver submarket and has a primary trade area that encompasses a seven-mile radius. The 2014 population within a seven- and 10-mile radius were reported at approximately 375,029 and 764,500, respectively, and average household income within the same seven- and 10-mile radius were reported at approximately $71,817 and $70,906, respectively.
The appraiser estimated market rent for in-line tenants in the west Denver submarket to be $17.89 per square foot on a triple net basis and concluded to an estimate of $12.50 per square foot on a triple net basis for anchor tenants comprising less than 40,000 square feet and $9.00 per square foot on a triple net basis for anchor tenants comprising more than 40,000 square feet. The appraiser concluded a vacancy rate of 5.0% and a third party market research report indicated a second quarter 2014 west Denver retail submarket vacancy rate of 4.3%.
THE INFORMATION IN THIS STRUCTURAL AND COLLATERAL TERM SHEET IS NOT COMPLETE AND MAY BE AMENDED PRIOR TO THE TIME OF SALE. THIS TERM SHEET IS NOT AN OFFER TO SELL THESE SECURITIES AND IT IS NOT A SOLICITATION OF AN OFFER TO BUY THESE SECURITIES IN ANY JURISDICTION WHERE THE OFFER OR SALE IS NOT PERMITTED.
46
| COLORADO MILLS |
The following table presents certain information relating to some comparable retail centers provided in the appraisal for the Colorado Mills Property:
Competitive Set(1)
| Colorado Mills (Subject) | Belmar | Denver Pavilions | Southwest Plaza | Cherry Creek | Flatiron Crossing | |||||||
| Market | Lakewood, CO | Lakewood, CO | Denver, CO | Littleton, CO | Denver, CO | Broomfield, CO | ||||||
| Distance from Subject | -- | 7 miles | 12 miles | 14 miles | 13 miles | 21 miles | ||||||
| Property Type | Super Regional Mall | Lifestyle Center | Lifestyle Center | Super Regional Mall | Super Regional Mall | Super Regional Mall | ||||||
| Year Built/Renovated | 2002/2013 | 2006/NAP | 1998/NAP | 1983/1994/2001/ 2005/2007 | 1990/1998 | 2000/2009/2013 | ||||||
| Anchors | Target, United Artists Theatre, Burlington Coat Factory | Target, Century Theatres, Whole Foods, Nordstrom Rack | United Artists Theatres, Barnes & Noble, Nike, Forever 21 | Dillard’s, Macy’s, Sears, JC Penney | Saks Fifth Avenue, Neiman Marcus, Nordstrom, Macy’s | Nordstrom, Dillard’s, Macy’s, Cinemas | ||||||
| Total GLA | 1,099,545 SF | 715,000 SF | 411,527 SF | 1,390,720 SF | 1,032,000 SF | 1,435,000 SF | ||||||
| Total Occupancy | 94% | 93% | 91% | 86% | 99% | 94% |
| (1) | Information obtained from the appraisal and underwritten rent roll. |
The Borrower. The borrower is Colorado Mills Mall Limited Partnership, a Delaware limited partnership and a single purpose entity with two independent directors. Legal counsel to the borrower delivered a non-consolidation opinion in connection with the origination of the Colorado Mills Loan Combination. Simon Property Group, L.P. (“Simon”) is the guarantor of certain nonrecourse carveouts up to 10.0% of the Colorado Mills Loan Combination.
The Sponsor. The sponsor, Simon (NYSE: SPG), is an S&P 100 company with total market capitalization of $88.0 billion as of June 30, 2014 and owns or has an interest in 228 retail commercial properties totaling approximately 189.0 million square feet. Simon has sponsored other real estate projects over the last 10 years that have been the subject of mortgage loan defaults, foreclosure proceedings and deed-in-lieu of foreclosure. See “Description of the Mortgage Pool—Certain Terms of the Mortgage Loans—Non-Recourse Carveout Limitations” and “Description of the Mortgage Pool—Statistical Characteristics of the Mortgage Loans—Default History, Prior Bankruptcy Issues and Other Proceedings” in the Free Writing Prospectus.
Escrows. No ongoing monthly escrows are required for real estate taxes, insurance, replacement or tenant improvement and leasing commissions reserves so long as no Debt Service Coverage Ratio Trigger Period (as defined below) has occurred and is continuing under the Colorado Mills Loan Combination. In the event that a Debt Service Coverage Ratio Trigger Period has occurred, the borrower is required to make monthly deposits: (i) for the payment of real estate taxes in an amount equal to one-twelfth of the estimated annual taxes payable and for the payment of insurance in an amount equal to one-twelfth of the estimated annual insurance premiums payable; provided that so long as no event of default has occurred and is continuing, the borrower will not be required to make such deposits for so long as the borrower provides satisfactory evidence to the lender that the taxes have been paid prior to delinquency and the insurance policies are being maintained as part of a reasonably acceptable blanket insurance policy providing coverage to substantially all of the other properties managed by the property manager or its affiliates; (ii) for replacements and repairs in an amount equal to $19,167 (subject to a cap of $460,000); and (iii) for tenant improvements and leasing commissions in an amount equal to $125,000 (subject to a cap of $3,000,000).
A “Debt Service Coverage Ratio Trigger Period” will commence if, as of the date of determination, the amortizing debt service coverage ratio based on the trailing four-calendar quarters falls below 1.20x for two consecutive calendar quarters. A Debt Service Coverage Ratio Trigger Period will end when an amortizing debt service coverage ratio of at least 1.20x has been achieved for two consecutive calendar quarters.
Lockbox and Cash Management. The Colorado Mills Loan Combination requires a lender controlled lockbox, which is already in place, and that the borrower direct tenants to deposit all rents directly into the lockbox account and that the borrower and the property manager deposit all rents received into the lockbox account within two business days of receipt. Prior to the occurrence of a Lockbox Event (as defined below), all funds on deposit in the lockbox account will be released to the borrower on a weekly basis. Upon the occurrence and continuance of a Lockbox Event, funds on deposit in the lockbox account will be swept on a weekly basis (or on each business day, during the continuance of an event of default) into a lender controlled cash management account.
A “Lockbox Event” will commence upon the occurrence of (i) an event of default; (ii) any bankruptcy or insolvency proceeding of the borrower or the property manager (if the property manager is an affiliate of the borrower); or (iii) the amortizing debt service coverage ratio based on the trailing four-calendar quarters falls below 1.20x for two consecutive calendar quarters. A Lockbox Event will end with respect to clause (i), upon the acceptance by the lender of a cure of such event of default; with respect to clause (ii), if the borrower replaces the property manager pursuant to a replacement management agreement, each pursuant to the terms of the Colorado Mills Loan Combination documents, or such bankruptcy or insolvency proceeding of the property manager is discharged or dismissed within 90 days; or with respect to clause (iii), when an amortizing debt service coverage ratio based on the trailing four-calendar quarters of at least 1.20x has been achieved for two consecutive calendar quarters; provided, however, that (x) no event of default has occurred and is continuing under the loan agreement or any of the other Colorado Mills Loan Combination documents; (y) the borrower has paid all of the lender’s reasonable out-of-pocket expenses actually incurred in connection with such Lockbox Event, including reasonable attorney’s fees and expenses; and (z) a Lockbox Event may not be cured more than five times in the aggregate during the term of the Colorado Mills Loan Combination.
THE INFORMATION IN THIS STRUCTURAL AND COLLATERAL TERM SHEET IS NOT COMPLETE AND MAY BE AMENDED PRIOR TO THE TIME OF SALE. THIS TERM SHEET IS NOT AN OFFER TO SELL THESE SECURITIES AND IT IS NOT A SOLICITATION OF AN OFFER TO BUY THESE SECURITIES IN ANY JURISDICTION WHERE THE OFFER OR SALE IS NOT PERMITTED.
47
| COLORADO MILLS |
Property Management. The Colorado Mills Mortgaged Property is managed by an affiliate of Simon other than the borrower.
Assumption. The borrower has the right to transfer the Colorado Mills Mortgaged Property, or greater than 50% of the aggregate interests in the borrower, in one or a series of related transactions to one or more Qualified Transferees (as defined below) (other than a transfer to a Key Principal (as defined below) or any person wholly owned by one or more Key Principals, so long as such Key Principals owned 49% of the aggregate interests in the borrower prior to such transfer), 61 days after the Series 2014-C25 Trust closing date, provided that no event of default has occurred and is continuing and certain other conditions are satisfied, including, but not limited to delivery of an additional insolvency opinion.
The borrower also has the right to transfer the Colorado Mills Mortgaged Property or 100% of the aggregate interests in the borrower to a transferee that is not a Qualified Transferee, provided that no event of default has occurred and is continuing, the conditions with respect to transfers to a transferee that is not a Qualified Transferee and certain additional conditions are satisfied, including, but not limited to receipt of a rating agency confirmation from DBRS, Moody’s and Morningstar that the transfer will not result in a downgrade, withdrawal or qualification of the respective ratings assigned to the Series 2014-C25 Certificates and similar confirmations with respect to the ratings of any securities backed by the Colorado Mills Companion Loan.
A “Qualified Transferee” is (a) any person or its affiliate (provided such person owns, directly or indirectly, not less than 51% of such affiliate) who owns and operates (i) at least five shopping centers and (ii) retail properties and shopping centers totaling in the aggregate at least 3,000,000 square feet of gross area; (b) any person who has a net worth in excess of $250,000,000; or (c) any person, provided the lender has received written confirmation from each of DBRS, Moody’s and Morningstar that the transfer to such person will not, in and of itself, cause a downgrade, withdrawal or qualification of the then current ratings of the Series 2014-C25 Certificates and similar confirmations with respect to ratings of any securities backed by the Colorado Mills Companion Loan; provided, however, that no person will be deemed to be a Qualified Transferee if such person (x) is an embargoed person, (y) except for General Growth Properties or its affiliates, is or has during the previous seven years been the subject of a bankruptcy or insolvency proceeding or (z) has been convicted in a criminal proceeding for a felony or any crime involving moral turpitude or is an organized crime figure or is reputed to have substantial business or other affiliations with any organized crime figure.
“Key Principal” means any of Simon Property Group, L.P., Simon Property Group, Inc. or Kan Am USA XX Limited Partnership.
Free Release. Provided that no event of default has occurred and is continuing, the borrower may (i) make transfers of immaterial or non-income producing portions of the Colorado Mills Mortgaged Property in connection with takings or condemnations of any portion of the Colorado Mills Mortgaged Property; (ii) make transfers of non-income producing portions of the Colorado Mills Mortgaged Property to third parties or affiliates of the borrower; and (iii) dedicate portions of the Colorado Mills Mortgaged Property or grant easements, restrictions, covenants, reservations and rights of way in the ordinary course of business; subject to certain conditions, including, with respect to any of the transfers described in (ii) and (iii), delivery of an officer’s certificate evidencing that such transfer, conveyance or encumbrance will not result in a material adverse effect on the value of the Colorado Mills Mortgaged Property, the business operations or financial condition of the borrower or the ability of the borrower to repay the Colorado Mills Loan Combination.
Real Estate Substitution. Not Permitted.
Subordinate and Mezzanine Indebtedness. Not Permitted.
Ground Lease. None.
Terrorism Insurance. The loan documents require that the “all risk” insurance policy required to be maintained by the borrower provides coverage for terrorism in an amount equal to the full replacement cost of the Colorado Mills Mortgaged Property or if the Terrorism Risk Insurance Program Reauthorization Act is no longer in effect, the borrower will be required to obtain a stand alone policy providing the same coverage for terrorism; provided, however (a) that the borrower will not be required to pay annual premiums in excess of two times the then-current annual premiums for the “all risk” insurance policy (excluding the catastrophic coverage of flood, earthquake and wind) and (b) that such stand-alone policy may have a deductible that is reasonable for such stand-alone policies with respect to properties similar to and reasonable for the geographic region where the Colorado Mills Mortgaged Property is located, so long as in no event shall such deductible exceed 5% of the total insured values. The loan documents also require business interruption insurance covering no less than the 18-month period following the occurrence of a casualty event, together with an extended period of indemnity, which shall continue for the lesser of (i) the period of time until income returns to the same level as it was prior to loss and (ii) 365 days from the date that the Colorado Mills Mortgaged Property is repaired or replaced and operations are resumed.
THE INFORMATION IN THIS STRUCTURAL AND COLLATERAL TERM SHEET IS NOT COMPLETE AND MAY BE AMENDED PRIOR TO THE TIME OF SALE. THIS TERM SHEET IS NOT AN OFFER TO SELL THESE SECURITIES AND IT IS NOT A SOLICITATION OF AN OFFER TO BUY THESE SECURITIES IN ANY JURISDICTION WHERE THE OFFER OR SALE IS NOT PERMITTED.
48
(THIS PAGE INTENTIONALLY LEFT BLANK)
49
| PLAZA VISTA |
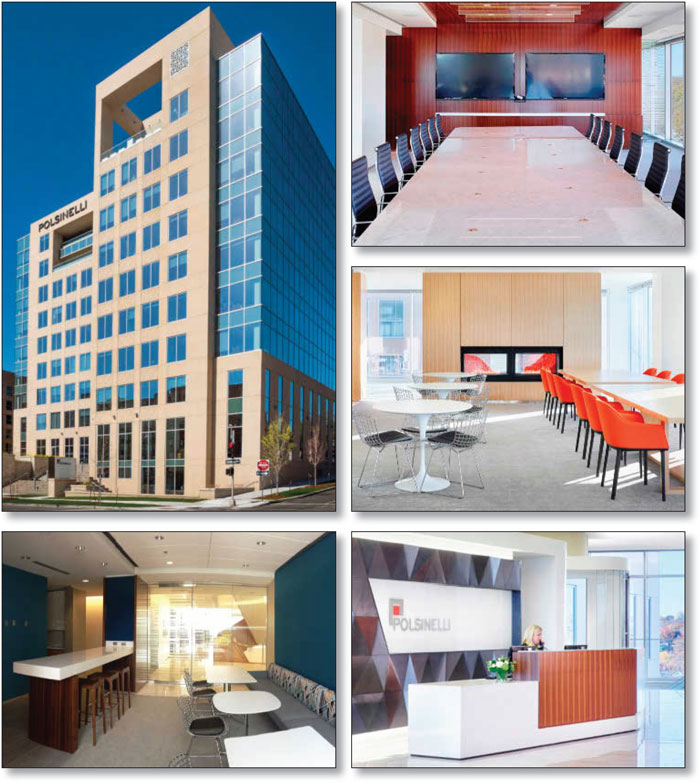
THE INFORMATION IN THIS STRUCTURAL AND COLLATERAL TERM SHEET IS NOT COMPLETE AND MAY BE AMENDED PRIOR TO THE TIME OF SALE. THIS TERM SHEET IS NOT AN OFFER TO SELL THESE SECURITIES AND IT IS NOT A SOLICITATION OF AN OFFER TO BUY THESE SECURITIES IN ANY JURISDICTION WHERE THE OFFER OR SALE IS NOT PERMITTED.
50
| PLAZA VISTA |

THE INFORMATION IN THIS STRUCTURAL AND COLLATERAL TERM SHEET IS NOT COMPLETE AND MAY BE AMENDED PRIOR TO THE TIME OF SALE. THIS TERM SHEET IS NOT AN OFFER TO SELL THESE SECURITIES AND IT IS NOT A SOLICITATION OF AN OFFER TO BUY THESE SECURITIES IN ANY JURISDICTION WHERE THE OFFER OR SALE IS NOT PERMITTED.
51
| No. 3 – Plaza Vista | |||||||
| Loan Information | Property Information | ||||||
| Mortgage Loan Seller: | Wells Fargo Bank, National Association | Single Asset/Portfolio: | Single Asset | ||||
| Credit Assessment (DBRS/Moody’s/Morningstar): | NR/NR/NR | Property Type: | Office | ||||
| Original Principal Balance: | $67,600,000 | Specific Property Type: | Suburban | ||||
| Cut-off Date Principal Balance: | $67,600,000 | Location: | Kansas City, MO | ||||
| % of Initial Pool Balance: | 7.7% | Size: | 253,720 SF | ||||
| Loan Purpose: | Acquisition | Cut-off Date Principal Balance Per SF: | $266.44 | ||||
| Borrower Name: | 48th Place Associates, LLC | Year Built/Renovated: | 2013/NAP | ||||
| Sponsor: | EverWest, LLC | Title Vesting(2): | Leasehold | ||||
| Mortgage Rate: | 4.290% | Property Manager: | Self-managed | ||||
| Note Date: | November 3, 2014 | 3rd Most Recent Occupancy (As of)(3): | NAP | ||||
| Anticipated Repayment Date: | NAP | 2nd Most Recent Occupancy (As of)(3): | NAP | ||||
| Maturity Date: | November 11, 2024 | Most Recent Occupancy (As of): | 92.6% (12/31/2013) | ||||
| IO Period: | 120 months | Current Occupancy (As of): | 98.6% (10/30/2014) | ||||
| Loan Term (Original): | 120 months | ||||||
| Seasoning: | 1 month | Underwriting and Financial Information: | |||||
| Amortization Term (Original): | NAP | ||||||
| Loan Amortization Type: | Interest-only, Balloon | 3rd Most Recent NOI (As of)(3): | NAP | ||||
| Interest Accrual Method: | Actual/360 | 2nd Most Recent NOI (As of)(3): | NAP | ||||
| Call Protection: | L(25),D(91),O(4) | Most Recent NOI (As of): | $7,113,846 (Annualized T8 8/31/2014) | ||||
| Lockbox Type: | Hard/Upfront Cash Management | ||||||
| Additional Debt: | None | ||||||
| Additional Debt Type: | NAP | U/W Revenues: | $8,700,730 | ||||
| U/W Expenses: | $1,984,957 | ||||||
| U/W NOI: | $6,715,773 | ||||||
| U/W NCF: | $6,177,285 | ||||||
Escrows and Reserves(1): | U/W NOI DSCR: | 2.28x | |||||
| U/W NCF DSCR: | 2.10x | ||||||
Type: | Initial | Monthly | Cap (If Any) | U/W NOI Debt Yield: | 9.9% | ||
| Taxes | $0 | Springing | NAP | U/W NCF Debt Yield: | 9.1% | ||
| Insurance | $0 | Springing | NAP | As-Is Appraised Value: | $104,700,000 | ||
| Replacement Reserves | $100,000 | $4,229 | $100,000 | As-Is Appraisal Valuation Date: | September 12, 2014 | ||
| Office Lease Rent Reserve | $340,000 | $340,000 | $340,000 | Cut-off Date LTV Ratio: | 64.6% | ||
| Tenant Specific TI/LC Reserve | $86,467 | $0 | NAP | LTV Ratio at Maturity or ARD: | 64.6% | ||
| (1) | See “Escrows” section. |
| (2) | See “Ground Leases” section. |
| (3) | Historical occupancy and financial statements are not available, as the Plaza Vista Property was completed in November 2013. |
The Mortgage Loan. The mortgage loan (the “Plaza Vista Mortgage Loan”) is evidenced by a single promissory note that is secured by a first mortgage encumbering the leasehold interest in two condominium units in an office tower and adjacent parking garage located in Kansas City, Missouri (the “Plaza Vista Property”). The Plaza Vista Mortgage Loan was originated on November 3, 2014 by Wells Fargo Bank, National Association. The Plaza Vista Mortgage Loan had an original principal balance of $67,600,000, has an outstanding principal balance as of the Cut-off Date of $67,600,000 and accrues interest at an interest rate of 4.290% per annum. The Plaza Vista Mortgage Loan had an initial term of 120 months, has a remaining term of 119 months as of the Cut-off Date and requires interest-only payments though the term of the Plaza Vista Mortgage Loan. The Plaza Vista Mortgage Loan matures on November 11, 2024.
Following the lockout period, the borrowers have the right to defease the Plaza Vista Mortgage Loan in whole, but not in part, on any date before August 11, 2024. In addition, the Plaza Vista Mortgage Loan is prepayable without penalty on or after August 11, 2024.
Sources and Uses
| Sources | Uses | ||||||||||||||||||
| Original loan amount | $67,600,000 | 64.1% | Purchase price | $103,600,000 | 98.2 | % | |||||||||||||
| Sponsor’s new cash contribution | 37,855,871 | 35.9 | Reserves | 526,467 | 0.5 | ||||||||||||||
| Closing costs | 1,329,404 | 1.3 | |||||||||||||||||
| Total Sources | $105,455,871 | 100.0% | Total Uses | $105,455,871 | 100.0 | % | |||||||||||||
THE INFORMATION IN THIS STRUCTURAL AND COLLATERAL TERM SHEET IS NOT COMPLETE AND MAY BE AMENDED PRIOR TO THE TIME OF SALE. THIS TERM SHEET IS NOT AN OFFER TO SELL THESE SECURITIES AND IT IS NOT A SOLICITATION OF AN OFFER TO BUY THESE SECURITIES IN ANY JURISDICTION WHERE THE OFFER OR SALE IS NOT PERMITTED.
52
| PLAZA VISTA |
The Property. The Plaza Vista Property is comprised of two condominium units consisting of a 10-story, class A, office tower and a six-level subterranean parking garage located in Kansas City, Missouri. The Plaza Vista Property is situated on 1.9 acres and consists of 253,720 square feet of net rentable area. At the time of acquisition by the prior owner in a November 2010 bankruptcy auction, the improvements were partially constructed. See “Description of the Mortgage Pool—Statistical Characteristics of the Mortgage Loans—Default History, Prior Bankruptcy Issues and Other Proceedings” in the Free Writing Prospectus. Redevelopment incentives were arranged through the Missouri Development Finance Board to defray the costs of dismantling the prior office tower construction, and additional tax incentives were provided by the City of Kansas City. See “Chapter 100 Bonds/Tax Abatement/Redirected Tax Incentives” section. In 2011, a lease was executed with Polsinelli for 234,876 square feet (92.6% of net rentable area) and construction of the Plaza Vista Property was completed in November 2013. The Plaza Vista Property serves as Polsinelli’s corporate headquarters, and they have been headquartered in the Country Club Plaza district of Kansas City since 1972. According to a third party legal publication, Polsinelli is ranked number 93 among the top 100 law firms nationally in gross revenues. For the period between 2008 and 2012, Polsinelli’s gross revenue increased 142.7% from $113.5 million to $275.5 million. Polsinelli has more than 740 attorneys in 19 offices in the United States. Polsinelli focuses on healthcare, financial services, real estate, life sciences and technology, energy and business litigation, and has depth of experience in 100 service areas and 70 industries. Building amenities include three exterior balconies along the top floor, black terrazzo floors, chenille white stone walls and floor-to-ceiling windows with expansive view of the Kansas City skyline.
The Plaza Vista Property contains 18,844 square feet (7.4% of net rentable area) of first and second floor retail space, which includes the relocated JJ’s Bar & Grill, a popular Kansas City restaurant in business since 1985. Further, the Plaza Vista Property is located adjacent to the Hotel Sorella, a 132-room luxury boutique hotel that also opened in November 2013. The hotel features nine regular suites, one presidential suite, 5,700 square feet of meeting space, a 4,000-square-foot restaurant/bar and an 1,800-square-foot pool and terrace. The six-level subterranean parking garage at the Plaza Vista Property offers 940 spaces (120 of which are dedicated exclusively for the Hotel Sorella and 28 for the adjacent residential cooperative), resulting in a parking ratio of approximately 3.7 spaces per 1,000 square feet of rentable area. As of October 30, 2014 the Plaza Vista Property was 98.6% occupied by four tenants.
Condominium. The Plaza Vista Property is comprised of two condominium units: the office unit and garage unit of the 4840 Roanoke Condominium Association, Inc. (the “Master Association”). The Master Association also includes a third condominium unit – a hotel unit comprised of 132 hotel rooms. The Plaza Vista Mortgage Loan borrowers have a combined 71.4% voting interest in the Master Association and the ability to control operational decisions, along with the right to vote or appoint directors on behalf of the office and garage units.
The following table presents certain information relating to the tenancy at the Plaza Vista Property:
Major Tenants
| % of Total | ||||||||||||||||||||||
| Credit Rating | Annual U/W | Annual | Lease | |||||||||||||||||||
| (Fitch/Moody’s/ | Tenant | % of | Base Rent | Annual | U/W Base | Expiration | ||||||||||||||||
| Tenant Name | S&P) | NRSF | NRSF | PSF | U/W Base Rent | Rent | Date | |||||||||||||||
| Major Tenants | ||||||||||||||||||||||
Polsinelli | NR/NR/NR | 234,876 | 92.6% | $34.85(1) | $8,186,294(1) | 93.6% | 10/31/2033(2) | |||||||||||||||
Jax Fish House and Oyster Bar | NR/NR/NR | 5,200 | 2.0% | $40.00 | $208,000 | 2.4% | 9/30/2024 | |||||||||||||||
JJ’s Bar & Grill, Inc. | NR/NR/NR | 4,888 | 1.9% | $36.00 | $175,968 | 2.0% | 10/31/2024 | |||||||||||||||
Waddell & Reed | NR/NR/NR | 5,197 | 2.0% | $33.75 | $175,399 | 2.0% | 11/30/2020 | |||||||||||||||
| Total Major Tenants | 250,161 | 98.6% | $34.96 | $8,745,661 | 100.0% | |||||||||||||||||
| Occupied Collateral Total | 250,161 | 98.6% | $34.96 | $8,745,661 | 100.0% | |||||||||||||||||
| Vacant Space | 3,559 | 1.4% | ||||||||||||||||||||
| Collateral Total | 253,720 | 100.0% | ||||||||||||||||||||
| (1) | Polsinelli pays $35.51 per square foot on 221,644 square feet (87.4% of net rentable area) and $23.86 per square foot on 13,232 square feet (5.2% of net rentable area). |
| (2) | Polsinelli has a one-time right to terminate its lease with 24 months’ notice effective October 31, 2028 and payment of a termination fee of $5.0 million. |
THE INFORMATION IN THIS STRUCTURAL AND COLLATERAL TERM SHEET IS NOT COMPLETE AND MAY BE AMENDED PRIOR TO THE TIME OF SALE. THIS TERM SHEET IS NOT AN OFFER TO SELL THESE SECURITIES AND IT IS NOT A SOLICITATION OF AN OFFER TO BUY THESE SECURITIES IN ANY JURISDICTION WHERE THE OFFER OR SALE IS NOT PERMITTED.
53
| PLAZA VISTA |
The following table presents certain information relating to the lease rollover schedule at the Plaza Vista Property:
Lease Expiration Schedule(1)(2)
Year Ending December 31, | No. of Leases Expiring | Expiring NRSF | % of Total NRSF | Cumulative Expiring NRSF | Cumulative % of Total NRSF | Annual U/W Base Rent | Annual U/W Base Rent PSF(3) | ||
| MTM | 0 | 0 | 0.0% | 0 | 0.0% | $0 | $0.00 | ||
| 2014 | 0 | 0 | 0.0% | 0 | 0.0% | $0 | $0.00 | ||
| 2015 | 0 | 0 | 0.0% | 0 | 0.0% | $0 | $0.00 | ||
| 2016 | 0 | 0 | 0.0% | 0 | 0.0% | $0 | $0.00 | ||
| 2017 | 0 | 0 | 0.0% | 0 | 0.0% | $0 | $0.00 | ||
| 2018 | 0 | 0 | 0.0% | 0 | 0.0% | $0 | $0.00 | ||
| 2019 | 0 | 0 | 0.0% | 0 | 0.0% | $0 | $0.00 | ||
| 2020 | 1 | 5,197 | 2.0% | 5,197 | 2.0% | $175,399 | $33.75 | ||
| 2021 | 0 | 0 | 0.0% | 5,197 | 2.0% | $0 | $0.00 | ||
| 2022 | 0 | 0 | 0.0% | 5,197 | 2.0% | $0 | $0.00 | ||
| 2023 | 0 | 0 | 0.0% | 5,197 | 2.0% | $0 | $0.00 | ||
| 2024 | 2 | 10,088 | 4.0% | 15,285 | 6.0% | $383,968 | $38.06 | ||
| Thereafter | 1 | 234,876 | 92.6% | 250,161 | 98.6% | $8,186,294 | $34.85 | ||
| Vacant | 0 | 3,559 | 1.4% | 253,720 | 100.0% | $0 | $0.00 | ||
| Total/Weighted Average | 4 | 253,720 | 100.0% | $8,745,661 | $34.96 |
| (1) | Information obtained from the underwritten rent roll. | |
| (2) | Certain tenants may have lease termination options that are exercisable prior to the originally stated expiration date of the subject lease and that are not considered in the Lease Expiration Schedule. | |
| (3) | Weighted Average Annual U/W Base Rent PSF excludes vacant space. |
The following table presents historical occupancy percentages at the Plaza Vista Property:
Historical Occupancy
12/31/2011(1) | 12/31/2012(1) | 12/31/2013(2) | 10/30/2014(3) | |||
| NAP | NAP | 92.6% | 98.6% |
(1) Historical occupancy is not available as the Plaza Vista Property was completed in 2013.
(2) Information obtained from the borrower.
(3) Information obtained from the underwritten rent roll.
THE INFORMATION IN THIS STRUCTURAL AND COLLATERAL TERM SHEET IS NOT COMPLETE AND MAY BE AMENDED PRIOR TO THE TIME OF SALE. THIS TERM SHEET IS NOT AN OFFER TO SELL THESE SECURITIES AND IT IS NOT A SOLICITATION OF AN OFFER TO BUY THESE SECURITIES IN ANY JURISDICTION WHERE THE OFFER OR SALE IS NOT PERMITTED.
54
| PLAZA VISTA |
Operating History and Underwritten Net Cash Flow. The following table presents certain information relating to the historical operating performance and the Underwritten Net Cash Flow at the Plaza Vista Property:
Cash Flow Analysis
Annualized T8 8/31/2014 | U/W | U/W $ per SF | |||||||||||
| Base Rent | $8,186,294 | $8,745,661 | $34.47 | ||||||||||
| Grossed Up Vacant Space | 0 | 142,360 | 0.56 | ||||||||||
| Total Reimbursables | 139,976 | 183,273 | 0.72 | ||||||||||
| Parking Income | 327,140 | 225,023 | 0.89 | ||||||||||
| Other Income | 78,888 | 26,574 | 0.10 | ||||||||||
| Less Vacancy | 0 | (622,161)(1) | (2.45) | ||||||||||
| Effective Gross Income | $8,732,297 | $8,700,730 | $34.29 | ||||||||||
| Total Operating Expenses | $1,618,451(2) | $1,984,957(2) | $7.82 | ||||||||||
| Net Operating Income | $7,113,846 | $6,715,773 | $26.47 | ||||||||||
| TI/LC | 0 | 487,744 | 1.92 | ||||||||||
| Capital Expenditures | 0 | 50,744 | 0.20 | ||||||||||
| Net Cash Flow | $7,113,846 | $6,177,285 | $24.30 | ||||||||||
| NOI DSCR | 2.42x | 2.28x | |||||||||||
| NCF DSCR | 2.42x | 2.10x | |||||||||||
| NOI DY | 10.5% | 9.9% | |||||||||||
| NCF DY | 10.5% | 9.1% | |||||||||||
| (1) | The underwritten economic vacancy is 7.0%. The Plaza Vista Property was 98.6% physically occupied as of October 30, 2014. |
| (2) | See “Chapter 100 Bonds/Tax Abatement/Redirected Tax Incentives” section. The Plaza Vista Property is currently exempt from property taxes |
Appraisal. As of the appraisal valuation date of September 12, 2014, the Plaza Vista Property had an “as-is” appraised value of $104,700,000.
Environmental Matters. According to a Phase I environmental site assessment dated September 24, 2014, there was no evidence of any recognized environmental conditions at the Plaza Vista Property.
Market Overview and Competition. The Plaza Vista Property is located at the intersection of Madison Avenue and 48th Street, approximately 4.6 miles south of the Kansas City central business district in the Country Club Plaza district (often referred to as “The Plaza”). The Kansas City metropolitan area is the most centrally located of any principal city in the United States, and is undergoing a significant redevelopment, with more than $9.0 billion in major improvements recently completed or currently under construction.
The Plaza is accessible by US Highway 71. Located approximately 2.2 miles east of the Plaza Vista Property, US Highway 71 is a six-lane, north-south highway connecting The Plaza to the Kansas City central business district to the north and the cities of Lee’s Summit, Grandview, and Belton to the southeast. Established in 1922 by J. C. Nichols and designed architecturally after Seville, Spain, The Plaza comprises office space, high-end retail establishments, restaurants, and entertainment venues. It was the first shopping area in the world designed to accommodate shoppers arriving by car, and offers a year-round calendar of music and special events, including the famous Plaza Lights and the renowned Plaza Art Fair. In addition to Polsinelli, The Plaza is home to the headquarters locations for American Century Investments, Bartlett Grain Company, Bernstein-Rein Advertising, Lockton, and Russell Stover, and its tenants include two other high profile law firms (Husch Blackwell Sanders and Dentons). The Plaza offers a full complement of walkable amenities, including more than 150 upscale retail shops, dozens of restaurants and nearly 2,000 hotel rooms and suites. According to the appraisal, as of 2014, the residential population within a three- and five-mile radius of the Plaza Vista Property is 108,503 and 255,679, respectively, with an average household income within the same radii of $69,792 and $60,044, respectively. According to the appraisal, the Plaza Vista Property is located in the Country Club Plaza office submarket of the Kansas City office market. As of the second quarter 2014, the Country Club Plaza office submarket had a total inventory of 5.1 million square feet in 117 buildings and exhibited a vacancy rate of 10.9%, with year-to-date net absorption of 68,907 square feet. No buildings are currently under construction in the submarket. The appraiser’s five-building competitive set had an average occupancy rate of 93.2%, with full-service gross asking rents ranging from $23.50 to $34.00 per square foot (excluding parking; parking fees typically range from $2.00 to $4.00 per square foot). The appraiser assumed a market rent conclusion of $33.00 per square foot, full-service gross (excluding parking) for the Plaza Vista Property.
THE INFORMATION IN THIS STRUCTURAL AND COLLATERAL TERM SHEET IS NOT COMPLETE AND MAY BE AMENDED PRIOR TO THE TIME OF SALE. THIS TERM SHEET IS NOT AN OFFER TO SELL THESE SECURITIES AND IT IS NOT A SOLICITATION OF AN OFFER TO BUY THESE SECURITIES IN ANY JURISDICTION WHERE THE OFFER OR SALE IS NOT PERMITTED.
55
| PLAZA VISTA |
The following table presents certain information relating to comparable properties to the Plaza Vista Property:
Competitive Set(1)
Plaza Vista (Subject) | Plaza Colonnade | Valencia Place | American Century – Tower II | Plaza West | Plaza Steppes Building | |
Location | Kansas City, MO | Kansas City, MO | Kansas City, MO | Kansas City, MO | Kansas City, MO | Kansas City, MO |
Distance from Subject | -- | 0.7 miles | 0.3 miles | 0.8 miles | 0.3 miles | 0.2 miles |
Property Type | Office | Office | Office | Office | Office | Office |
Year Built/Renovated | 2013/NAP | 2004/NAV | 2000/NAV | 1994/NAV | 1986/NAV | 1990/NAV |
Stories | 10 | 9 | 12 | 15 | 16 | 11 |
Total GLA | 253,720 SF | 278,000 SF | 251,335 SF | 246,451 SF | 279,602 SF | 225,000 SF |
Total Occupancy | 99% | 97% | 100% | 87% | 84% | 98% |
| (1) | Information obtained from the appraisal. |
The Borrower. The borrower is 48th Place Associates, LLC, a single purpose entity with two independent directors. Legal counsel to the borrower delivered a non-consolidation opinion in connection with the origination of the Plaza Vista Mortgage Loan. EverWest, LLC is the guarantor of certain nonrecourse carveouts under the Plaza Vista Mortgage Loan.
The Sponsor. The sponsor is EverWest, LLC (“EverWest”), formerly known as Alliance Capital Partners. Founded in 1997 and headquartered in Denver, Colorado, EverWest is a privately held real estate operating and investment company with over 100 years of combined commercial real estate experience from its management team. As of July 2014, EverWest’s commercial real estate portfolio comprised 33 office, industrial, retail and multifamily properties located in 10 states and totaling approximately 5.2 million square feet. EverWest and its affiliates have been involved with multiple loan workouts related to commercial and residential real estate investments. See “Description of the Mortgage Pool—Statistical Characteristics of the Mortgage Loans—Default History, Prior Bankruptcy Issues and Other Proceedings” in the Free Writing Prospectus.
Escrows. The loan documents provide for upfront reserves in the amount of $100,000 for replacement reserves, $340,000 related to the outstanding Chapter 100 Bonds (as defined below; see “Chapter 100 Bonds/Tax Abatement/Redirected Tax Incentives” section) and $86,467 for outstanding tenant improvement costs associated with Jax Fish House.
The loan documents require monthly deposits of $4,229 for replacement reserves, provided the balance of the replacement reserve is less than $100,000. Monthly replacement reserve deposits will continue until the balance reaches $100,000. The loan documents do not require monthly escrows for taxes provided the Plaza Vista Property remains exempt from property taxes. The loan documents do not require monthly escrows for insurance provided (i) no event of default has occurred and is continuing; (ii) the insurance required to be maintained by the borrower is maintained pursuant to one or more blanket insurance policies; and (iii) the borrower provides the lender with timely proof of payment of insurance premiums.
Lockbox and Cash Management. The Plaza Vista Mortgage Loan requires a lender-controlled lockbox account, which is already in place, and that the borrower direct tenants to pay their rents directly into such lockbox account. The loan documents also require that all rents received by the borrowers or the property manager be deposited into the lockbox account within one business day of receipt. Prior to the occurrence of a Cash Trap Event Period (as defined below), all excess cash flow is distributed to the borrower. During a Cash Trap Event Period, all cash flow is swept to a lender controlled cash management account.
A “Cash Trap Event Period” will commence upon the earlier of (i) the occurrence and continuance of an event of default; (ii) the net cash flow debt service coverage ratio is less than 1.55x at the end of any calendar quarter; (iii) a default under the Polsinelli lease; (iv) Polsinelli going dark or vacating substantially all of its leased space or (v) Polsinelli’s failure to maintain a minimum paid in capital and minimum adjusted net income above fiscal year 2011 amounts, as further described in the loan documents.
A Cash Trap Event Period will be cured, with regard to clause (i), upon the cure of such event of default; with regard to clause (ii), upon the net cash flow debt service coverage ratio being equal to or greater than 1.55x for two consecutive calendar quarters; with regard to clause (iii), upon the cure of such default; with regard to clause (iv), upon Polsinelli recommencing business operations in its entire space and paying full contractual rent or an acceptable replacement tenant (as determined by the lender) is in occupancy, open for business and paying rent; and with regard to clause (v), upon the lender’s receipt of an officer’s certificate from the borrower certifying that Polsinelli now maintains minimum paid in capital and minimum adjusted net income above fiscal year 2011 amounts.
Property Management. The Plaza Vista Property is managed by an affiliate of the borrower.
Assumption. The borrower has a two-time right to transfer the Plaza Vista Property provided that certain conditions are satisfied, including (i) no event of default has occurred and is continuing; (ii) the lender has reasonably determined that the proposed transferee and guarantor satisfy the lender’s credit review and underwriting standards, taking into consideration transferee experience, financial strength and general business standing; and (iii) the lender has received confirmation from DBRS, Moody’s
THE INFORMATION IN THIS STRUCTURAL AND COLLATERAL TERM SHEET IS NOT COMPLETE AND MAY BE AMENDED PRIOR TO THE TIME OF SALE. THIS TERM SHEET IS NOT AN OFFER TO SELL THESE SECURITIES AND IT IS NOT A SOLICITATION OF AN OFFER TO BUY THESE SECURITIES IN ANY JURISDICTION WHERE THE OFFER OR SALE IS NOT PERMITTED.
56
| PLAZA VISTA |
and Morningstar that such assumption will not result in a downgrade, withdrawal or qualification of the respective ratings assigned to the Series 2014-C25 Certificates.
Partial Release. Not permitted.
Real Estate Substitution. Not permitted.
Subordinate and Mezzanine Indebtedness. Not permitted.
Ground Leases. To achieve property tax abatement objectives, the Plaza Vista Property is subject to two ground leases with the City of Kansas City, Missouri (the “City”): the “Plaza Vista Office Ground Lease” and the “Plaza Vista Garage Ground Lease”. The Plaza Vista Office Ground Lease has an expiration date of December 1, 2037, and the Plaza Vista Garage Ground Lease has an expiration date of June 14, 2040. The annual rent payment due from the borrower to the City under the Plaza Vista Office Ground Lease is $4,080,000, which equals the annual interest payment due under the Chapter 100 Bonds. See “Chapter 100 Bonds/Tax Abatement/Redirected Tax Incentives” section below. The amount on deposit in the Office Lease Rent Reserve will be disbursed on a recurring, monthly basis to the City, to fund the borrower’s lease payments to the City under the Plaza Vista Ground Lease; the City will then remit that amount to the bond trustee for the benefit of the borrower/bondholder to pay interest on the Chapter 100 Bonds; and amounts received by the borrower from the bond trustee as payments under the Chapter 100 Bonds will be deposited pursuant to loan document requirements back into the Office Lease Rent Reserve account to be available for the following month’s lease payment. The annual rent payment due under the Plaza Vista Garage Ground Lease is $1.00. The fee interest in the Plaza Vista Office Ground Lease will revert to the borrower in December 2037 for nominal consideration and surrender of the Chapter 100 Bonds for redemption. The fee interest in the Plaza Vista Garage Ground Lease will revert to the borrower in June 2040 for nominal consideration. The borrower has the option to purchase the garage portion of the Plaza Vista Property for the lesser of (i) fair market value or (ii) a fixed price, $9,500,000 currently, that decreases by $475,000 effective January 1st of each calendar year. Effective January 1, 2034, the purchase price for the garage portion will be $100.00.
Chapter 100 Bonds/Tax Abatement/Redirected Tax Incentives. The development of the office portion of the Plaza Vista Property was financed by the issuance of $90.0 million of industrial development revenue bonds (“Chapter 100 Bonds”) arranged by the Missouri Development Finance Board and issued by the City. The borrower owns the related Chapter 100 Bonds. Disbursements from the Office Lease Rent Reserve will fund the borrower’s lease payments to the City under the Plaza Vista Office Ground Lease; the City will remit that amount to the bond trustee for the benefit of the borrower/bondholder to pay interest on the Chapter 100 Bonds; and amounts received by the borrower from the bond trustee as payments under the Chapter 100 Bonds will be deposited pursuant to loan document requirements back into the Office Lease Rent Reserve account to be available for the following month’s lease payment. The City, as issuer of the Chapter 100 Bonds, also authorized a property tax abatement for the Plaza Vista Property for the duration of the borrower’s ownership of the Chapter 100 Bonds. See “Ground Leases” section above. The Chapter 100 Bonds were pledged as collateral for the Plaza Vista Mortgage Loan. The Chapter 100 Bonds mature on December 1, 2037 and the tax abatement will expire at that time. Therefore, property taxes were not underwritten. In addition, the related development agreement provides that the City pay the borrower a redirected tax incentive derived from the earnings tax, sales tax and tourism tax-related revenue generated by the Plaza Vista Property, subject to Polsinelli substantially occupying its leased space, for a period of 20 years. See “Description of the Mortgage Pool—Tenant or Other Third Party Issues” in the Free Writing Prospectus.
Terrorism Insurance. The loan documents require that the “all risk” insurance policy required to be maintained by the borrower provides coverage for terrorism in an amount equal to the full replacement cost of the Plaza Vista Property. The loan documents also require business interruption insurance covering no less than the 18-month period following the occurrence of a casualty event, together with a six-month extended period of indemnity.
THE INFORMATION IN THIS STRUCTURAL AND COLLATERAL TERM SHEET IS NOT COMPLETE AND MAY BE AMENDED PRIOR TO THE TIME OF SALE. THIS TERM SHEET IS NOT AN OFFER TO SELL THESE SECURITIES AND IT IS NOT A SOLICITATION OF AN OFFER TO BUY THESE SECURITIES IN ANY JURISDICTION WHERE THE OFFER OR SALE IS NOT PERMITTED.
57
| FOUR SEASONS HOTEL - SEATTLE |

THE INFORMATION IN THIS STRUCTURAL AND COLLATERAL TERM SHEET IS NOT COMPLETE AND MAY BE AMENDED PRIOR TO THE TIME OF SALE. THIS TERM SHEET IS NOT AN OFFER TO SELL THESE SECURITIES AND IT IS NOT A SOLICITATION OF AN OFFER TO BUY THESE SECURITIES IN ANY JURISDICTION WHERE THE OFFER OR SALE IS NOT PERMITTED.
58
| FOUR SEASONS HOTEL - SEATTLE |
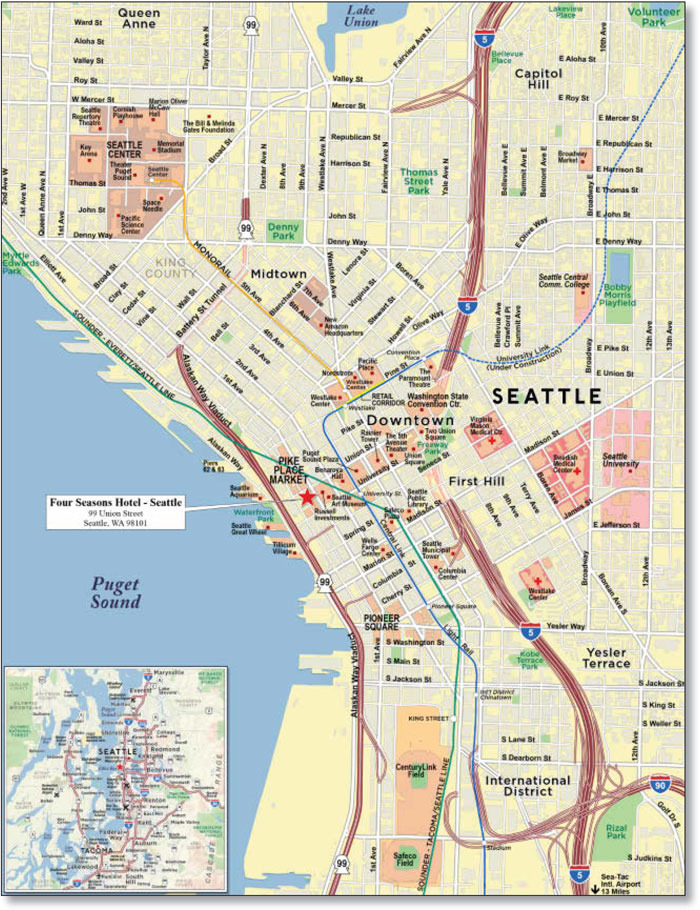
THE INFORMATION IN THIS STRUCTURAL AND COLLATERAL TERM SHEET IS NOT COMPLETE AND MAY BE AMENDED PRIOR TO THE TIME OF SALE. THIS TERM SHEET IS NOT AN OFFER TO SELL THESE SECURITIES AND IT IS NOT A SOLICITATION OF AN OFFER TO BUY THESE SECURITIES IN ANY JURISDICTION WHERE THE OFFER OR SALE IS NOT PERMITTED.
59
| No. 4 – Four Seasons Hotel - Seattle | |||||||
| Loan Information | Property Information | ||||||
| Mortgage Loan Seller: | Wells Fargo Bank, National Association | Single Asset/Portfolio: | Single Asset | ||||
Credit Assessment (DBRS/Moody’s/Morningstar): | NR/NR/NR | Property Type: | Hospitality | ||||
| Original Principal Balance: | $42,000,000 | Specific Property Type: | Full Service | ||||
| Cut-off Date Principal Balance: | $42,000,000 | Location: | Seattle, WA | ||||
| % of Initial Pool Balance: | 4.8% | Size: | 147 Rooms | ||||
| Loan Purpose: | Refinance | Cut-off Date Principal Balance Per Room: | $285,714 | ||||
Borrower Names(1): | Various | Year Built/Renovated: | 2009/NAP | ||||
| Sponsor: | The Seattle Hotel Group, LLC | Title Vesting: | Fee | ||||
| Mortgage Rate: | 4.500% | Property Manager: | Four Seasons Hotels Limited | ||||
| Note Date: | October 2, 2014 | 3rd Most Recent Occupancy (As of)(4): | 73.3% (12/31/2011) | ||||
| Anticipated Repayment Date: | NAP | 2nd Most Recent Occupancy (As of)(4): | 77.1% (12/31/2012) | ||||
| Maturity Date: | October 11, 2024 | Most Recent Occupancy (As of): | 82.2% (12/31/2013) | ||||
| IO Period: | 30 months | Current Occupancy (As of): | 84.3% (8/31/2014) | ||||
| Loan Term (Original): | 120 months | ||||||
| Seasoning: | 2 months | Underwriting and Financial Information: | |||||
| Amortization Term (Original): | 360 months | ||||||
| Loan Amortization Type: | Interest-only, Amortizing Balloon | 3rd Most Recent NOI (As of)(4): | $3,858,265 (12/31/2012) | ||||
| Interest Accrual Method: | Actual/360 | 2nd Most Recent NOI (As of)(4): | $5,563,926 (12/31/2013) | ||||
| Call Protection: | L(26),D(90),O(4) | Most Recent NOI (As of): | $6,299,917 (TTM 8/31/2014) | ||||
| Lockbox Type: | Soft/Upfront Cash Management | ||||||
Additional Debt(2): | Yes | ||||||
Additional Debt Type(2): | Subordinate Debt | ||||||
| U/W Revenues: | $30,485,999 | ||||||
| U/W Expenses: | $24,147,466 | ||||||
| U/W NOI: | $6,338,534 | ||||||
| U/W NCF: | $4,809,809 | ||||||
Escrows and Reserves(3): | U/W NOI DSCR(2): | 2.48x | |||||
U/W NCF DSCR(2): | 1.88x | ||||||
U/W NOI Debt Yield(2): | 15.1% | ||||||
Type: | Initial | Monthly | Cap (If Any) | U/W NCF Debt Yield(2): | 11.5% | ||
| Taxes | $31,970 | $31,970 | NAP | As-Is Appraised Value(5): | $79,400,000 | ||
| Insurance | $0 | Springing | NAP | As-Is Appraisal Valuation Date(5): | June 25, 2014 | ||
| FF&E Reserve | $0 | $127,000 | NAP | Cut-off Date LTV Ratio(2)(5): | 52.9% | ||
| Seasonality Reserve | $0 | Springing | $540,000 | LTV Ratio at Maturity or ARD(2)(5): | 45.8% | ||
| (1) | See “The Borrowers” section. |
| (2) | See “Subordinate and Mezzanine Indebtedness” section. The Four Seasons Hotel - Seattle Property has a subordinate second mortgage with a balance as of June 30, 2014 of $21,050,000 along with $5,434,671 of accrued interest (the “Four Seasons Hotel - Seattle Second Mortgage”). The Four Seasons Hotel – Seattle Second Mortgage is fully subordinate to the Four Seasons Hotel – Seattle Mortgage Loan and the lender has obtained a subordination and standstill agreement. Further, the equity interests in the Four Seasons Hotel - Seattle Mortgage Loan borrowers and certain affiliates have been pledged to secure additional subordinate indebtedness with a balance as of June 30, 2014 of $9,450,000 along with $3,530,208 of accrued interest. The LTV, DSCR, debt yield and Cut-off Date Balance per room numbers shown in the chart above are based solely on the Four Seasons Hotel – Seattle Mortgage Loan. As of the Cut-off Date, the combined U/W NCF DSCR, the combined LTV ratio and the combined U/W NCF Debt Yield are 1.04x, 91.3% and 6.6%, respectively. However, all subordinate debt payments are currently accruing and are only required to be paid to the extent there is excess cash flow after payment of debt service on the Four Seasons Hotel – Seattle Mortgage Loan. |
| (3) | See “Escrows” section. |
| (4) | See “Cash Flow Analysis” section. |
| (5) | The appraiser concluded to an “as stabilized” appraised value of $84,400,000, which assumes that the Four Seasons Hotel - Seattle Property will have stabilized as of June 25, 2016. Based on the “as stabilized” appraised value, the Cut-off Date LTV Ratio and LTV Ratio at Maturity would be 49.8% and 43.0%, respectively. |
The Mortgage Loan. The mortgage loan (the “Four Seasons Hotel - Seattle Mortgage Loan”) is evidenced by a single promissory note that is secured by a first mortgage encumbering the fee interest in three condominium units that comprise a full-service hotel located in the central business district of Seattle, Washington (the “Four Seasons Hotel - Seattle Property”). The Four Seasons Hotel - Seattle Mortgage Loan was originated on October 2, 2014 by Wells Fargo Bank, National Association. The Four Seasons Hotel - Seattle Mortgage Loan had an original principal balance of $42,000,000, has an outstanding principal balance as of the Cut-off Date of $42,000,000 and accrues interest at an interest rate of 4.500% per annum. The Four Seasons Hotel - Seattle Mortgage Loan had an initial term of 120 months, has a remaining term of 118 months as of the Cut-off Date and requires interest-only payments for the first 30 payments following origination and, thereafter, requires payments of principal and interest payments based on a 30-year amortization schedule. The Four Seasons Hotel - Seattle Mortgage Loan matures on October 11, 2024.
THE INFORMATION IN THIS STRUCTURAL AND COLLATERAL TERM SHEET IS NOT COMPLETE AND MAY BE AMENDED PRIOR TO THE TIME OF SALE. THIS TERM SHEET IS NOT AN OFFER TO SELL THESE SECURITIES AND IT IS NOT A SOLICITATION OF AN OFFER TO BUY THESE SECURITIES IN ANY JURISDICTION WHERE THE OFFER OR SALE IS NOT PERMITTED.
60
| FOUR SEASONS HOTEL - SEATTLE |
Following the lockout period, the borrowers have the right to defease the Four Seasons Hotel - Seattle Mortgage Loan in whole, but not in part, on any date before July 11, 2024. In addition, the Four Seasons Hotel - Seattle Mortgage Loan is prepayable without penalty on or after July 11, 2024.
Sources and Uses
| Sources | Uses | ||||||||
| Original loan amount | $42,000,000 | 100.0% | Loan payoff | $39,200,839 | 93.3 | % | |||
| Reserves | 31,970 | 0.1 | |||||||
| Closing costs | 623,065 | 1.5 | |||||||
| Return of equity | 2,144,126 | 5.1 | |||||||
| Total Sources | $42,000,000 | 100.0% | Total Uses | $42,000,000 | 100.0 | % |
The Property. The Four Seasons Hotel - Seattle Property is a 147-room, 20-story, full-service luxury hotel located in the central business district of Seattle, Washington, one block south of Pike Place Market. The Four Seasons Hotel – Seattle Property is comprised of three condominium units: (i) the 147-room hotel on floors 3-10, (ii) the 130-space parking garage on three underground levels and (iii) approximately 2,885 square feet of ground-floor retail space. The meeting and event space is situated on the second floor. Further, there are 36 private residential condominium units located on floors 11-20, which are not part of the collateral for the Four Seasons Hotel Mortgage Loan. See “Condominium” section. The Four Seasons Hotel - Seattle Property and the residential condominium units were built in 2009 by the borrowers for a reported cost of approximately $180.0 million. The Four Seasons Hotel – Seattle Property comprises 108 king-rooms, 20 double-rooms, 13 suites, and six handicap accessible rooms. Guestrooms typically feature 42-inch plasma televisions, 130 square foot bathrooms with separate cast iron tubs and glass showers, built-in private bar and refrigerator and built-in television screens in the vanity mirror. All suites feature unobstructed views of Elliot Bay, Puget Sound and/or the Olympic Mountains and offer separate bedroom and living rooms, with some offering separate dining areas. Situated on the Four Seasons Hotel – Seattle Property’s top floor, the 2,480 square foot presidential suite includes a spacious living room, built-in fireplace, formal dining room for 10 people, butler’s pantry and private study.
Amenities at the Four Seasons Hotel - Seattle Property include valet parking, 24-hour concierge service, 24-hour fitness center, infinity-edge pool, outdoor fireplace and terrace, whirlpool overlooking Elliot Bay, 6,000 square foot spa, 84-seat upscale restaurant (ART Restaurant), 58-seat bar and grill, 21-seat raw bar and 10,570 square feet of meeting and event space, including a 4,940 square foot ballroom with capacity for 500 guests. In the near future, the bar and grill will be reconfigured to offer a more inviting appearance and expand seating capacity by approximately 30 seats at a cost of approximately $1.5 million. The borrowers under the Four Seasons Hotel - Seattle Mortgage Loan entered into a franchise agreement with Four Seasons Hotels Limited (the “Hotel Manager”) that expires in December 2028, with three 20-year renewal options.
Condominium. The Four Seasons Hotel – Seattle Property is comprised of three condominium units: the hotel unit, garage unit, and the retail unit of the 99 Union Street Condominium Master Association (the “Master Association”). The Master Association also includes a fourth condominium unit - a residential unit comprised of 36 privately owned residences. The residential unit is restricted from leasing or renting any of its residences for transient purposes or for a period of less than 30 days. Thirty of the 36 units are owned by third party owners unaffiliated with the borrowing entity. The Four Seasons Hotel – Seattle Mortgage Loan borrowers have a combined 75% voting interest in the Master Association and the ability to control all operational decisions.
THE INFORMATION IN THIS STRUCTURAL AND COLLATERAL TERM SHEET IS NOT COMPLETE AND MAY BE AMENDED PRIOR TO THE TIME OF SALE. THIS TERM SHEET IS NOT AN OFFER TO SELL THESE SECURITIES AND IT IS NOT A SOLICITATION OF AN OFFER TO BUY THESE SECURITIES IN ANY JURISDICTION WHERE THE OFFER OR SALE IS NOT PERMITTED.
61
| FOUR SEASONS HOTEL - SEATTLE |
Operating History and Underwritten Net Cash Flow. The following table presents certain information relating to the historical operating performance and the Underwritten Net Cash Flow at the Four Seasons Hotel - Seattle Property:
Cash Flow Analysis
| 2011 | 2012(1) | 2013(1) | TTM 8/31/2014 | U/W | U/W $ per Room | ||||||||
| Occupancy | 73.3% | 77.1% | 82.2% | 84.3% | 84.3% | ||||||||
| ADR | $325.78 | $343.28 | $365.64 | $391.66 | $391.66 | ||||||||
| RevPAR | $238.92 | $264.68 | $300.51 | $330.18 | $330.18 | ||||||||
| Total Revenue | $23,007,620 | $25,135,650 | $28,202892 | $30,485,999 | $30,485,999 | $207,388 | |||||||
| Total Department Expenses | 12,109,028 | 13,013,693 | 13,909,884 | 14,771,408 | 14,771,408 | $100,486 | |||||||
| Gross Operating Profit | $10,898,591 | $12,121,957 | $14,293,009 | $15,714,592 | $15,714,592 | $106,902 | |||||||
| Total Undistributed Expenses | 6,960,300 | 7,321,600 | 7,878,900 | 8,511,100 | 8,330,003 | $56,667 | |||||||
| Profit Before Fixed Charges | $3,938,291 | $4,800,357 | $6,414,109 | $7,203,492 | $7,384,588 | $50,235 | |||||||
| Total Fixed Charges | 848,830 | 942,092 | 850,183 | 903,575 | 1,046,055 | $7,116 | |||||||
| Net Operating Income | $3,089,461 | $3,858,265 | $5,563,926 | $6,299,917 | $6,338,534 | $43,119 | |||||||
| FF&E | 0 | 0 | 0 | 0 | 1,528,725(2) | $10,399 | |||||||
| Net Cash Flow | $3,089,461 | $3,858,265 | $5,563,926 | $6,299,917 | $4,809,809 | $32,720 | |||||||
| NOI DSCR | 1.21x | 1.51x | 2.18x | 2.47x | 2.48x | ||||||||
| NCF DSCR | 1.21x | 1.51x | 2.18x | 2.47x | 1.88x | ||||||||
| NOI DY | 7.4% | 9.2% | 13.2% | 15.0% | 15.1% | ||||||||
| NCF DY | 7.4% | 9.2% | 13.2% | 15.0% | 11.5% | ||||||||
| (1) | The increase in occupancy, ADR and RevPAR and Net Operating Income is due to the Four Seasons Hotel – Seattle Property’s continued stabilization since construction in 2009. |
| (2) | U/W FF&E includes tenant improvement costs of $4,425 associated with the ground floor retail space. |
Appraisal. As of the appraisal valuation date of June 25, 2014, the Four Seasons Hotel - Seattle Property had an “as-is” appraised value of $79,400,000 and an “as stabilized” value of $84,400,000, which assumes that the Four Seasons Hotel – Seattle Property will have stabilized as of June 25, 2016.
Environmental Matters. According to the Phase I environmental site assessment dated July 23, 2014, there was no evidence of any recognized environmental conditions at the Four Seasons Hotel - Seattle Property.
Market Overview and Competition. The Four Seasons Hotel - Seattle Property is located in Seattle, Washington, at the intersection of Union Street and First Avenue. The Four Seasons Hotel – Seattle Property is located in the central business district, one block south of Pike Place Market, one of Seattle’s top tourist attractions and the oldest public farmers’ market in the United States. The Four Seasons Hotel – Seattle Property’s location provides convenient access to the financial center, the Seattle Art Museum, the Seattle Aquarium, Lake Union, the Puget Sound central waterfront, and the central business district’s retail core.
The Four Seasons Hotel – Seattle Property is located immediately adjacent to the Russell Investments Center, an 880,000 square foot class A office tower occupied by such tenants as Russell Investments, JPMorgan Chase, Goldman Sachs, Morgan Stanley and Nordstrom. Within a one-mile radius of the Four Seasons Hotel – Seattle Property, there are 454 office buildings, totaling 48.8 million square feet, with an average occupancy of 88.8%. Further, there is 5.3 million square feet of office space currently under construction in the Seattle central business district, which includes the first phase (1.1 million square feet) of Amazon.com’s planned 3.3 million square foot corporate headquarters, with an additional 10.4 million square feet in various stages of planning. The Washington State Convention and Trade Center, which is located 0.4 miles east of the Four Seasons Hotel – Seattle Property, plans to expand the facility by approximately 310,000 square feet of exhibit spaces (plus meeting space), with construction tentatively scheduled to begin in 2017. According to a marketing organization, in the past five years, Seattle has turned away more than 300 conventions representing nearly $1.6 billion in future business primarily because the Washington State Convention and Trade Center is undersized for a market of Seattle’s size and appeal; it is the smallest primary convention center of any large city on the West Coast and ranks 55th in size nationally. Additional demand drivers include the cruise line industry, which, according to a third party agency, attracted 870,994 passengers and generated approximately $381.0 million for Seattle in 2013, weddings and board of director groups. According to the appraisal, the Seattle hospitality market contained approximately 5,675 hotel rooms as of year-end 2013 exhibiting a RevPAR of $153.91, a 10.4% increase from year-end 2012.
THE INFORMATION IN THIS STRUCTURAL AND COLLATERAL TERM SHEET IS NOT COMPLETE AND MAY BE AMENDED PRIOR TO THE TIME OF SALE. THIS TERM SHEET IS NOT AN OFFER TO SELL THESE SECURITIES AND IT IS NOT A SOLICITATION OF AN OFFER TO BUY THESE SECURITIES IN ANY JURISDICTION WHERE THE OFFER OR SALE IS NOT PERMITTED.
62
| FOUR SEASONS HOTEL - SEATTLE |
The following table presents certain information relating to the Four Seasons Hotel - Seattle Property’s competitive set:
Subject and Market Historical Occupancy, ADR and RevPAR(1)
Competitive Set | Four Seasons Hotel - Seattle | Penetration Factor | ||||||||||||||
Year | Occupancy | ADR | RevPAR | Occupancy | ADR | RevPAR | Occupancy | ADR | RevPAR | |||||||
| 9/30/2014 TTM | 83.7% | $218.84 | $183.13 | 83.1% | $405.23 | $336.75 | 99.3% | 185.2% | 183.9% | |||||||
| 9/30/2013 TTM | 80.4% | $203.50 | $163.71 | 79.2% | $366.99 | $290.49 | 98.4% | 180.3% | 177.4% | |||||||
| 9/30/2012 TTM | 75.7% | $196.63 | $148.87 | 74.4% | $344.60 | $256.22 | 98.2% | 175.3% | 172.1% | |||||||
| (1) | Information obtained from a third party hospitality report dated October 17, 2014. The competitive set includes the following hotels: Fairmont Olympic Hotel, Inn @ The Market, Kimpton Hotel Monaco Seattle, W Hotel Seattle, Grand Hyatt Seattle and Hotel 1000. |
The Borrowers. The borrowers are SHG Hotel SPE, LLC, SHG Garage SPE, LLC and SHG Retail SPE, LLC, each a Delaware limited liability company and single purpose entity with one independent director. Each borrower owns the respective hotel, parking garage and retail condominium unit of the Four Seasons Hotel – Seattle Property. See “Condominium” section. Legal counsel to the borrowers delivered a non-consolidation opinion in connection with the origination of the Four Seasons Hotel - Seattle Mortgage Loan.
The Sponsor. The sponsor is The Seattle Hotel Group, LLC (“SHG”), which was formed to develop the project in 2004 and effectively owns 100% of each borrower. In addition to the Four Seasons Hotel – Seattle Property, SHG also owns the six remaining unsold residential condominium units. Due to the economic recession and sluggish residential condominium sales, the borrowers defaulted on and ultimately restructured the prior construction financing. See “Description of the Mortgage Pool—Statistical Characteristics of the Mortgage Loans-Default History, Prior Bankruptcy Issues and Other Proceedings” in the Free Writing Prospectus.
Escrows. The loan documents provide for upfront escrows in the amount of $31,970 for real estate taxes. The loan documents provide for monthly escrows in the amount of $31,970 for real estate taxes and FF&E reserves in an amount equal to the greatest of (i) $127,000; (ii) 1/12 of 5.0% of operating income for the prior fiscal year (estimated to be $127,000 currently) or (iii) the aggregate monthly amount required to be reserved for FF&E under the hotel management agreement (a monthly amount equal to 1/12 of 5.0% of operating income for the prior fiscal year). However, the required monthly FF&E reserve will be reduced (on a dollar-for-dollar basis) by any amounts the borrower is required to reserve with the Hotel Manager pursuant to the hotel management agreement.
If at any time the seasonality reserve balance is less than $540,000 on the monthly payment date occurring in June through November, the borrower must deposit $90,000 until the capped amount of $540,000 has been achieved. Both the capped amount and the monthly deposit will be subject to adjustment annually, based on the trailing 12-month operating period. Funds may only be disbursed to the borrower on the monthly payment dates occurring in February and March of each applicable year, and only to the extent there is insufficient cash flow from the Four Seasons Hotel – Seattle Property to make debt service payments. However, the capped amount and monthly payment will be reduced (on a dollar-for-dollar basis) by any amount the borrowers are required to reserve in the Hotel Manager-held working capital reserve, in accordance with the hotel management agreement. Provided the balance in the working capital reserve, which has a minimum balance requirement of $500,000, is within 10% of the capped amount ($540,000 currently) and no Cash Trap Event Period (as defined below) has occurred and is continuing, the monthly seasonality deposit will be waived. Ongoing monthly reserves for insurance are not required as long as (i) no event of default has occurred and is continuing; (ii) the Four Seasons Hotel - Seattle Property is covered by an acceptable blanket insurance policy; and (iii) the borrower provides the lender with evidence of renewal of the policies and timely proof of payment of insurance premiums.
Lockbox and Cash Management. The Four Seasons Hotel – Seattle Mortgage Loan requires a lender-controlled lockbox account, which is already in place, and that the borrower or property manager cause all hotel revenue payable with respect to the Four Seasons Hotel – Seattle Mortgage Loan to be deposited into a lockbox account. The loan documents also require that all hotel revenue received by the borrower or the Hotel Manager be deposited into the lockbox account within one business day of receipt. All amounts on deposit in the lockbox account are swept on a daily basis into a lender-controlled cash management account. Prior to the occurrence of a Cash Trap Event Period, all excess funds after application in accordance with the loan documents are distributed to the borrower. During a Cash Trap Event Period, all excess cash flow is retained in the lender-controlled cash management account.
A “Cash Trap Event Period” will commence upon the earlier of (i) the occurrence and continuance of an event of default or (ii) the amortizing debt service coverage ratio being less than 1.30x at the end of any calendar month based on the trailing 12-month operating period. A Cash Trap Event Period will end, with regard to clause (i), upon the cure of such event of default; and with regard to clause (ii), upon the amortizing debt service coverage ratio being equal to or greater than 1.40x for two consecutive calendar quarters.
Property Management. The Four Seasons Hotel - Seattle Property is managed by Four Seasons Hotels Limited.
Assumption. The borrower has the two-time right to transfer the Four Seasons Hotel - Seattle Property provided that certain conditions are satisfied, including (i) no event of default has occurred and is continuing; (ii) the lender reasonably determines that the proposed transferee and guarantor satisfy the lender’s credit review and underwriting standards, taking into consideration
THE INFORMATION IN THIS STRUCTURAL AND COLLATERAL TERM SHEET IS NOT COMPLETE AND MAY BE AMENDED PRIOR TO THE TIME OF SALE. THIS TERM SHEET IS NOT AN OFFER TO SELL THESE SECURITIES AND IT IS NOT A SOLICITATION OF AN OFFER TO BUY THESE SECURITIES IN ANY JURISDICTION WHERE THE OFFER OR SALE IS NOT PERMITTED.
63
| FOUR SEASONS HOTEL - SEATTLE |
transferee experience, financial strength and general business standing; and (iii) the lender has received confirmation from DBRS, Moody’s and Morningstar that such assumption will not result in a downgrade, withdrawal or qualification of the respective ratings assigned to the Series 2014-C25 Certificates.
Partial Release. Not permitted.
Real Estate Substitution. Not permitted.
Subordinate and Mezzanine Indebtedness. The Four Seasons Hotel - Seattle Property, along with the six unsold residential condominium units, secure the non-pooled subordinate second mortgage (the “Four Seasons Hotel - Seattle Second Mortgage”), which has a balance as of June 30, 2014 of $21,050,000 along with $5,434,671 of accrued interest, totaling $26,484,671. The Four Seasons Hotel - Seattle Second Mortgage has an interest rate of 7.000% per annum on $19,083,592 and 9.000% per annum on $1,966,408 of the Four Seasons Hotel – Seattle Second Mortgage, and matures on December 31, 2016; monthly interest payments are only required to the extent there is excess cash flow after payment of debt service on the Four Seasons Hotel - Seattle Mortgage Loan and will accrue. The Four Seasons Hotel – Seattle Second Mortgage is not included in the trust and is held by an affiliate of SHG, the owner of the borrowers. The borrowers will apply all net sale proceeds from the sale of residential condominiums to pay down the Four Seasons Hotel – Seattle Second Mortgage. The Four Seasons Hotel – Seattle Second Mortgage is fully subordinate to the Four Seasons Hotel – Seattle Mortgage Loan and the lender has obtained a subordination and standstill agreement.
Further, the Four Seasons Hotel - Seattle Mortgage Loan borrowers and certain affiliates (including the parent of the Four Seasons Hotel – Seattle Mortgage Loan borrower) have incurred non-pooled subordinate indebtedness with a balance as of June 30, 2014 of $9,450,000 along with $3,530,208 of accrued interest, totaling $12,980,208 and held by the Hotel Manager (the “Four Seasons Hotel – Seattle Operator Loans”). The Four Seasons Hotel - Seattle Operator Loans have an interest rate of 6.000% per annum on $6,562,500 and interest payments equal to 0.525% of effective gross income for the Four Seasons Hotel – Seattle Property on $2,887,500 of the Four Seasons Hotel – Seattle Operator Loans, and both have a term of 80 years. Principal payments are not required unless the management agreement is terminated. Interest payments shall accrue annually, but are only payable to the extent there is sufficient cash flow remaining after payment of debt service on the Four Seasons Hotel – Seattle Mortgage Loan. The Four Seasons Hotel – Seattle Operator Loans are secured by the equity interests in the Four Seasons Hotel - Seattle Mortgage Loan borrowers and the owner of the unsold residential condominium units. A subordination and standstill agreement was obtained that provides, among other things, that upon foreclosure, neither the lender nor successors will be liable for the Four Seasons Hotel – Seattle Operator Loans and any transfer resulting from the pledge may only be exercised in accordance with terms of Four Seasons Hotel – Seattle Mortgage Loan documents. The rights of the lenders under the Four Seasons Hotel – Seattle Second Mortgage and the Four Seasons Hotel – Seattle Operator Loans are further described under “Description of the Mortgage Pool—Additional Indebtedness—Existing (Secured Financing and Mezzanine and Similar Financing)” in the Free Writing Prospectus. The borrower is not permitted to incur any future subordinate debt.
Ground Lease. None.
Terrorism Insurance. The loan documents require that the “all risk” insurance policy required to be maintained by the borrower provide coverage for terrorism in an amount equal to the full replacement cost of the Four Seasons Hotel - Seattle Property, as well as business interruption insurance covering no less than the 18-month period following the occurrence of a casualty event, together with a six-month extended period of indemnity.
Earthquake Insurance: The loan documents do not require earthquake insurance. The seismic report indicated a probable maximum loss of 8.0%.
THE INFORMATION IN THIS STRUCTURAL AND COLLATERAL TERM SHEET IS NOT COMPLETE AND MAY BE AMENDED PRIOR TO THE TIME OF SALE. THIS TERM SHEET IS NOT AN OFFER TO SELL THESE SECURITIES AND IT IS NOT A SOLICITATION OF AN OFFER TO BUY THESE SECURITIES IN ANY JURISDICTION WHERE THE OFFER OR SALE IS NOT PERMITTED.
64
(THIS PAGE INTENTIONALLY LEFT BLANK)
65
| 529 BRYANT STREET |
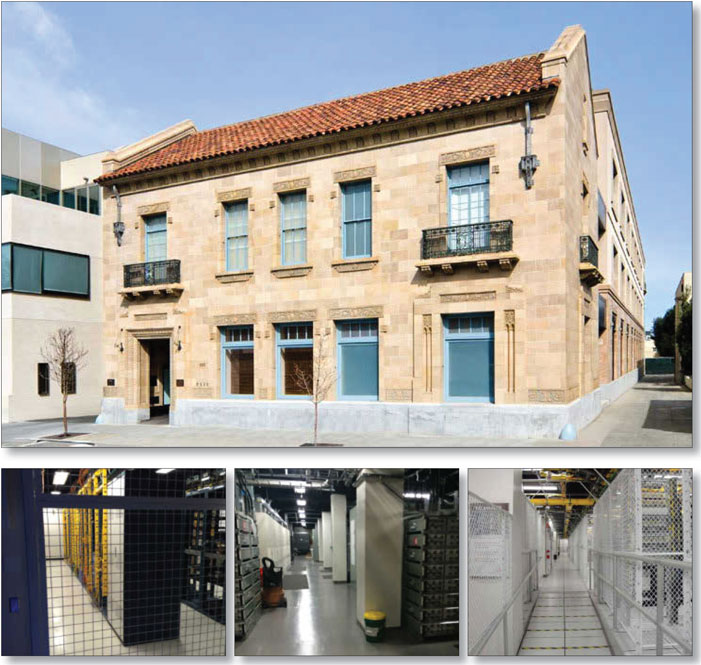
THE INFORMATION IN THIS STRUCTURAL AND COLLATERAL TERM SHEET IS NOT COMPLETE AND MAY BE AMENDED PRIOR TO THE TIME OF SALE. THIS TERM SHEET IS NOT AN OFFER TO SELL THESE SECURITIES AND IT IS NOT A SOLICITATION OF AN OFFER TO BUY THESE SECURITIES IN ANY JURISDICTION WHERE THE OFFER OR SALE IS NOT PERMITTED.
66
| 529 BRYANT STREET |
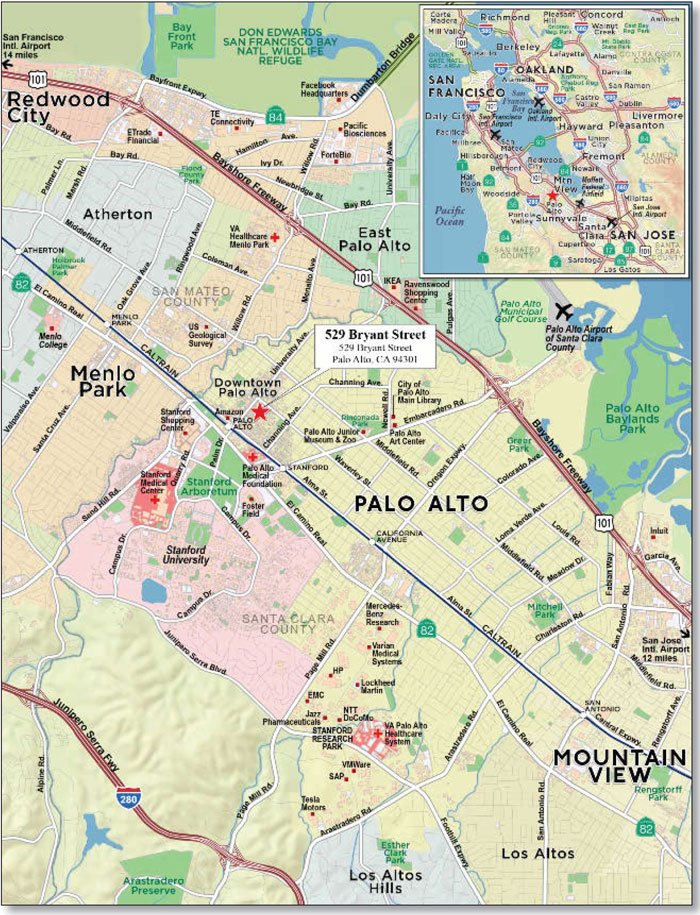
THE INFORMATION IN THIS STRUCTURAL AND COLLATERAL TERM SHEET IS NOT COMPLETE AND MAY BE AMENDED PRIOR TO THE TIME OF SALE. THIS TERM SHEET IS NOT AN OFFER TO SELL THESE SECURITIES AND IT IS NOT A SOLICITATION OF AN OFFER TO BUY THESE SECURITIES IN ANY JURISDICTION WHERE THE OFFER OR SALE IS NOT PERMITTED.
67
| No. 5 – 529 Bryant Street | |||||||
| Loan Information | Property Information | ||||||
| Mortgage Loan Seller: | Wells Fargo Bank, National Association | Single Asset/Portfolio: | Single Asset | ||||
Credit Assessment (DBRS/Moody’s/Morningstar): | NR/NR/NR | Property Type: | Other | ||||
| Original Principal Balance: | $38,600,000 | Specific Property Type: | Data Center | ||||
| Cut-off Date Principal Balance: | $38,600,000 | Location: | Palo Alto, CA | ||||
| % of Initial Pool Balance: | 4.4% | Size: | 45,319 SF | ||||
| Loan Purpose: | Refinance | Cut-off Date Principal Balance Per SF: | $851.74 | ||||
| Borrower Name: | 529 Bryant Street Partners LLC | Year Built/Renovated: | 1928/2004 | ||||
| Sponsor: | Menlo Equities LLC | Title Vesting: | Fee | ||||
| Mortgage Rate: | 4.470% | Property Manager: | Self-managed | ||||
| Note Date: | November 6, 2014 | 3rd Most Recent Occupancy (As of): | 100.0% (12/31/2011) | ||||
| Anticipated Repayment Date: | NAP | 2nd Most Recent Occupancy (As of): | 100.0% (12/31/2012) | ||||
| Maturity Date: | November 11, 2024 | Most Recent Occupancy (As of): | 100.0% (12/31/2013) | ||||
| IO Period: | 66 months | Current Occupancy (As of): | 100.0% (12/1/2014) | ||||
| Loan Term (Original): | 120 months | ||||||
| Seasoning: | 1 month | Underwriting and Financial Information: | |||||
| Amortization Term (Original): | 360 months | ||||||
| Loan Amortization Type: | Interest-only, Amortizing Balloon | 3rd Most Recent NOI (As of): | $2,967,302 (12/31/2012) | ||||
| Interest Accrual Method: | Actual/360 | 2nd Most Recent NOI (As of): | $2,976,351 (12/31/2013) | ||||
| Call Protection: | L(25),D(91),O(4) | Most Recent NOI (As of): | $2,980,148 (TTM 6/30/2014) | ||||
| Lockbox Type: | Hard/Upfront Cash Management | ||||||
| Additional Debt: | None | ||||||
| Additional Debt Type: | NAP | U/W Revenues(2): | $3,973,846 | ||||
| U/W Expenses: | $757,449 | ||||||
U/W NOI(2): | $3,216,397 | ||||||
U/W NCF(2): | $3,108,181 | ||||||
U/W NOI DSCR(2): | 1.38x | ||||||
U/W NCF DSCR(2): | 1.33x | ||||||
Escrows and Reserves(1): | U/W NOI Debt Yield(2): | 8.3% | |||||
U/W NCF Debt Yield(2): | 8.1% | ||||||
Type: | Initial | Monthly | Cap (If Any) | Appraised Value: | $55,000,000 | ||
| Taxes | $96,412 | $48,206 | NAP | Appraisal Valuation Date: | September 26, 2014 | ||
| Insurance | $0 | Springing | NAP | Cut-off Date LTV Ratio: | 70.2% | ||
| Replacement Reserve | $0 | $760 | $18,000 | LTV Ratio at Maturity or ARD: | 64.9% | ||
| (1) | See “Escrows” section. |
| (2) | See “Cash Flow Analysis” section. |
The Mortgage Loan. The mortgage loan (the “529 Bryant Street Mortgage Loan”) is evidenced by a single promissory note that is secured by a first mortgage encumbering a single-tenant data center located in Palo Alto, California (the “529 Bryant Street Property”). The 529 Bryant Street Mortgage Loan was originated on November 6, 2014 by Wells Fargo Bank, National Association. The 529 Bryant Street Mortgage Loan had an original principal balance of $38,600,000, has an outstanding principal balance as of the Cut-off Date of $38,600,000 and accrues interest at an interest rate of 4.470% per annum. The 529 Bryant Street Mortgage Loan had an initial term of 120 months, has a remaining term of 119 months as of the Cut-off Date and requires payments of interest-only for the first 66 payments following origination and, thereafter, requires payments of principal and interest based on a 30-year amortization schedule. The 529 Bryant Street Mortgage Loan matures on November 11, 2024.
Following the lockout period, the borrower has the right to defease the 529 Bryant Street Mortgage Loan in whole, but not in part, on any date before August 11, 2024. In addition, the 529 Bryant Street Mortgage Loan is prepayable without penalty on or after August 11, 2024.
THE INFORMATION IN THIS STRUCTURAL AND COLLATERAL TERM SHEET IS NOT COMPLETE AND MAY BE AMENDED PRIOR TO THE TIME OF SALE. THIS TERM SHEET IS NOT AN OFFER TO SELL THESE SECURITIES AND IT IS NOT A SOLICITATION OF AN OFFER TO BUY THESE SECURITIES IN ANY JURISDICTION WHERE THE OFFER OR SALE IS NOT PERMITTED.
68
| 529 BRYANT STREET |
Sources and Uses
| Sources | Uses | |||||||
| Original loan amount | $38,600,000 | 100.0% | Loan payoff | $21,735,052 | 56.3% | |||
| Reserves | 96,412 | 0.2% | ||||||
| Closing costs | 655,352 | 1.7% | ||||||
| Return of equity | 16,113,184 | 41.7% | ||||||
| Total Sources | $38,600,000 | 100.0% | Total Uses | $38,600,000 | 100.0% | |||
The Property. The 529 Bryant Street Property is a three-story (plus basement) internet exchange and colocation data center facility containing approximately 45,319 square feet located in downtown Palo Alto, California. The 529 Bryant Street Property was constructed in 1928 as a multi-tenant office building and was established as the first major carrier-neutral internet exchange in the United States in 1996. In 2004 and 2005, the 529 Bryant Street Property underwent a significant renovation, expanding data center operations to the entire building. In 2010, Equinix acquired Switch and Data (the prior tenant) for $689.0 million with the 529 Bryant Street Property’s colocation operations (also commonly referred to as the Palo Alto Internet Exchange) constituting a large percentage of the sale price. The 529 Bryant Street Property houses equipment for nearly 100 providers exchanging network traffic. The 529 Bryant Street Property is the primary “peering” point (where two internet networks connect and exchange traffic) between Asia and the United States, providing access for Silicon Valley’s largest internet service providers. As a carrier-neutral facility, it hosts all major internet carriers and is one of the primary fiber optic terminal and interconnection points for most major data centers in Silicon Valley. Many firms use Equinix facilities like the 529 Bryant Street Property because of the access it provides to fast interconnectivity with other providers in prime locations around the world.
The 529 Bryant Street Property has a dedicated power line from Palo Alto’s private power plant and multiple fiber lines are concentrated in and around the building. The 529 Bryant Street Property currently contains two 2.0 Megawatt (“MW”) generators and Equinix is reportedly installing another 1.5 MW generator. Building systems feature ample chilled water capacity, an uninterruptable power supply, backup generation capacity and enhanced security. The 529 Bryant Street Property does not contain any onsite parking, but street parking, surface parking lots and parking garages are available within the area.
The 529 Bryant Street Property is 100.0% leased to an Equinix subsidiary and Equinix guarantees the lease. Equinix then subleases colocation / connection space to subtenants under colocation agreements. Equinix is the world’s largest International Business Exchange data center and colocation provider, connecting more than 4,500 companies directly to their customers and partners inside the world’s most networked data centers. Businesses leverage the Equinix interconnection platform in 32 markets across 15 countries worldwide. As of year-end 2013, Equinix reported total revenue of $2.2 billion (an increase of 14.1% from 2012 levels), total assets of $7.5 billion and total stockholder’s equity of $2.5 billion. Equinix’s absolute, triple net lease contains a 15.0% rent increase in 2020 and one ten-year lease renewal option. As of December 1, 2014, the 529 Bryant Street Property was 100.0% leased by Equinix.
The following table presents certain information relating to the tenant at the 529 Bryant Street Property:
Major Tenant
| Tenant Name | Credit Rating (Fitch/Moody’s/ S&P) | Tenant NRSF | % of NRSF | Annual U/W Base Rent PSF | Annual U/W Base Rent | % of Total Annual U/W Base Rent | Lease Expiration Date |
| Major Tenant | |||||||
Equinix(1) | NR/Ba3/BB | 45,319 | 100.0% | $76.41(2) | $3,462,743(2) | 100.0% | 5/3/2025(3) |
| Total Major Tenant | 45,319 | 100.0% | $76.41(2) | $3,462,743(2) | 100.0% | ||
| Vacant Space | 0 | 0.0% | |||||
| Collateral Total | 45,319 | 100.0% | |||||
| (1) | Equinix, Inc. is the guarantor of the lease between Switch and Data CA Nine LLC (an Equinix subsidiary) and the borrower. |
| (2) | Equinix’s current in-place annual rent is $3,050,875 ($67.32 per square foot); Annual U/W Base Rent PSF and Annual U/W Base Rent are based on the May 1, 2015 contractual rent increase. Equinix’s contractual rent increases to $3,982,155 ($87.87 per square foot) on May 1, 2020. See “Cash Flow Analysis” section. |
| (3) | Equinix has one, 10-year lease extension option. |
THE INFORMATION IN THIS STRUCTURAL AND COLLATERAL TERM SHEET IS NOT COMPLETE AND MAY BE AMENDED PRIOR TO THE TIME OF SALE. THIS TERM SHEET IS NOT AN OFFER TO SELL THESE SECURITIES AND IT IS NOT A SOLICITATION OF AN OFFER TO BUY THESE SECURITIES IN ANY JURISDICTION WHERE THE OFFER OR SALE IS NOT PERMITTED.
69
| 529 BRYANT STREET |
The following table presents certain information relating to the lease rollover schedule at the 529 Bryant Street Property:
Lease Expiration Schedule(1)
Year Ending December 31, | No. of Leases Expiring | Expiring NRSF | % of Total NRSF | Cumulative Expiring NRSF | Cumulative % of Total NRSF | Annual U/W Base Rent | Annual U/W Base Rent PSF | |
| MTM | 0 | 0 | 0.0% | 0 | 0.0% | $0 | $0.00 | |
| 2014 | 0 | 0 | 0.0% | 0 | 0.0% | $0 | $0.00 | |
| 2015 | 0 | 0 | 0.0% | 0 | 0.0% | $0 | $0.00 | |
| 2016 | 0 | 0 | 0.0% | 0 | 0.0% | $0 | $0.00 | |
| 2017 | 0 | 0 | 0.0% | 0 | 0.0% | $0 | $0.00 | |
| 2018 | 0 | 0 | 0.0% | 0 | 0.0% | $0 | $0.00 | |
| 2019 | 0 | 0 | 0.0% | 0 | 0.0% | $0 | $0.00 | |
| 2020 | 0 | 0 | 0.0% | 0 | 0.0% | $0 | $0.00 | |
| 2021 | 0 | 0 | 0.0% | 0 | 0.0% | $0 | $0.00 | |
| 2022 | 0 | 0 | 0.0% | 0 | 0.0% | $0 | $0.00 | |
| 2023 | 0 | 0 | 0.0% | 0 | 0.0% | $0 | $0.00 | |
| 2024 | 0 | 0 | 0.0% | 0 | 0.0% | $0 | $0.00 | |
| Thereafter | 1 | 45,319 | 100.0% | 45,319 | 100.0% | $3,462,743 | $76.41 | |
| Vacant | 0 | 0 | 0.0% | 45,319 | 100.0% | $0 | $0.00 | |
| Total/Weighted Average | 1 | 45,319 | 100.0% | $3,462,743 | $76.41 |
| (1) | Information obtained from the underwritten rent roll. |
The following table presents historical occupancy percentages at the 529 Bryant Street Property:
Historical Occupancy
12/31/2011(1) | 12/31/2012(1) | 12/31/2013(1) | 12/1/2014(2) | |||
| 100.0% | 100.0% | 100.0% | 100.0% |
| (1) | Information obtained from the borrower. |
| (2) | Information obtained from the underwritten rent roll. |
Operating History and Underwritten Net Cash Flow. The following table presents certain information relating to the Underwritten Net Cash Flow at the 529 Bryant Street Property:
Cash Flow Analysis
| 2012 | 2013 | TTM 6/30/2014 | U/W | U/W $ per SF | ||||||
| Base Rent | $3,050,875 | $3,050,875 | $3,050,875 | $3,462,743(1) | $76.41 | |||||
| Grossed Up Vacant Space | 0 | 0 | 0 | 0 | 0.00 | |||||
| Total Reimbursables | 573,357 | 695,062 | 711,244 | 684,241 | 15.10 | |||||
| Other Income | 47,966 | 0 | 0 | 0 | 0.00 | |||||
| Less Vacancy & Credit Loss | 0 | 0 | 0 | (173,137)(2) | (3.82) | |||||
| Effective Gross Income | $3,672,198 | $3,745,937 | $3,762,119 | $3,973,846 | $87.69 | |||||
| Total Operating Expenses | $704,896 | $769,586 | $781,971 | $757,449 | $16.71 | |||||
| Net Operating Income | $2,967,302 | $2,976,351 | $2,980,148 | $3,216,397 | $70.97 | |||||
| TI/LC | 0 | 0 | 0 | 99,152 | 2.19 | |||||
| Capital Expenditures | 0 | 0 | 0 | 9,064 | 0.20 | |||||
| Net Cash Flow | $2,967,302 | $2,976,351 | $2,980,148 | $3,108,181 | $68.58 | |||||
| NOI DSCR | 1.27x | 1.27x | 1.27x | 1.38x | ||||||
| NCF DSCR | 1.27x | 1.27x | 1.27x | 1.33x | ||||||
| NOI DY | 7.7% | 7.7% | 7.7% | 8.3% | ||||||
| NCF DY | 7.7% | 7.7% | 7.7% | 8.1% |
| (1) | U/W Base Rent is based on the contractual rent increase occurring on May 1, 2015. Current in-place rent is $3,050,875 ($67.32 per square foot). Equinix’s contractual rent increases to $3,982,155 ($87.87 per square foot) on May 1, 2020. |
| (2) | The underwritten economic vacancy is 5.0%. The 529 Bryant Street Property was 100.0% physically occupied as of December 1, 2014. |
Appraisal. As of the appraisal valuation date of September 26, 2014, the 529 Bryant Street Property has an “as-is” appraised value of $55,000,000.
Environmental Matters. According to the Phase I environmental assessment dated October 6, 2014, there was no evidence of any recognized environmental conditions at the 529 Bryant Street Property.
THE INFORMATION IN THIS STRUCTURAL AND COLLATERAL TERM SHEET IS NOT COMPLETE AND MAY BE AMENDED PRIOR TO THE TIME OF SALE. THIS TERM SHEET IS NOT AN OFFER TO SELL THESE SECURITIES AND IT IS NOT A SOLICITATION OF AN OFFER TO BUY THESE SECURITIES IN ANY JURISDICTION WHERE THE OFFER OR SALE IS NOT PERMITTED.
70
| 529 BRYANT STREET |
Market Overview and Competition. The 529 Bryant Street Property is located in the central business district of Palo Alto, California, less than one-mile northeast of Stanford University and approximately 30.7 miles south of San Francisco. The 529 Bryant Street Property is located 0.8 miles east of the Stanford Shopping Center, a major northern California shopping and dining destination anchored by Bloomingdales, Macy’s, Nordstrom, Neiman Marcus and Wilkes Bashford, among others. The immediate area is predominantly commercial in nature, with many restaurants, office buildings, shops and mixed-use projects. Further, the nearby Stanford University campus houses the Stanford Research Park (a 700-acre, 10.0 million square foot business park housing over 150 companies), which includes headquarters for Hewlett-Packard, Tesla Motors and VMware Inc. Construction is expected to start in 2014 on 260 residential units at the Stanford Research Park, the first housing ever built there. As of 2014, the city of Palo Alto has a population of 67,747 residents, a labor force of roughly 34,000 employees and a median household income of $170,000. As of 2014, the population within a three- and five-mile radius of the 529 Bryant Street Property was 147,654 and 270,531, respectively. The estimated average household income within the same three- and five-mile radii was $150,911 and $137,036, respectively.
According to the appraiser, the top five data center markets in the United States are (1) New York / New Jersey, (2) Los Angeles, California, (3) Chicago, Illinois, (4) San Francisco/Oakland/San Jose (Silicon Valley) and (5) Washington, D.C./Arlington. Availability of power, optical fiber routing the existence of one or more major Internet Exchange Points, along with major centers of population are the key characteristics driving data center demand in each of these markets. Silicon Valley is an attractive colocation area because of lower energy pricing (no utility tax and low, stable electricity rates), proximity to major corporations and robust connectivity. Santa Clara has its own power company (Silicon Valley Power) which serves Palo Alto and offers one of the lowest rates in the San Francisco area. The drivers of telecommunication and data center space are diverse, with e-commerce driving significant co-location demand in the market. According to a data center research company, “the inevitable movement of transactions toward e-commerce will continue to drive data center demand in the area.”
There are primarily three types of telecommunications infrastructure buildings: (a) data centers, such as the Bloomberg Data Center Property in Orangeburg, New York, which are physical locations designed to store redundant copies of data that can be continuously updated, (b) telecommunications facilities, such as One Wilshire in Los Angeles, which are used primarily for switching and connecting two or more parties, but can support data storage and (c) carrier-neutral hotels, such as the 529 Bryant Street Property and 60 Hudson in New York, which provide both of these services, typically on a multi-tenant basis – they allow any fiber carrier to connect into the facility and to connect to other third parties in the facility. According to the appraiser, the competitive “data center” (used generically to refer to all three types of buildings) market is more national in scale, as users are more interested in the available infrastructure and layout of a data center asset rather than its specific location. The lease rates for this type of space vary based on the infrastructure of the building, the availability of power in the building and the cost of power in the market (power is one of the key occupancy expense drivers for data center tenants), and the connectivity available in the building. Rental rates for turnkey space are well in excess of typical rents for other types of real estate. The appraiser analyzed recent (the majority were signed in 2013) leases negotiated in competitive turnkey data centers. The comparables generally average a monthly rent of $100.60 per kilowatt, triple-net (ranging from $97.50 to $110.00 per kilowatt). Equinix pays a current monthly rent of approximately $109.72 per kilowatt. The appraiser estimates a market rent of $80.00 to $100.00 per kilowatt per month. However, the 529 Bryant Street Property commands higher rents due to the mission critical nature of the facility and irreplaceable access to Asia and other major data center providers.
The Borrower. The borrower is 529 Bryant Street Partners LLC, a limited liability company and single purpose entity with one independent director. Legal counsel to the borrower provided a non-consolidation opinion in connection with the origination of the 529 Bryant Street Mortgage Loan. Menlo Equities LLC is the guarantor of certain nonrecourse carveouts under the 529 Bryant Street Mortgage Loan.
The Sponsor. The sponsor is Menlo Equities LLC (“Menlo”). Founded in 1994, Menlo is a vertically integrated commercial real estate company engaged in the acquisition, development and operation of properties in select technology markets in the western U.S. Since inception, Menlo has acquired or developed over 80 properties for a total cost of approximately $1.4 billion, and has developed and built over 3.2 million square feet of office, R&D and engineering commercial real estate properties.
Escrows. The loan documents provide for upfront reserves in the amount of $96,412 for taxes. The loan documents require monthly deposits of $48,206 for real estate taxes and $760 for replacement reserves (subject to a cap of $18,000). Ongoing monthly reserves for insurance are not required provided (i) no event of default has occurred and is continuing; (ii) the insurance required to be maintained by the borrower is maintained pursuant to one or more blanket insurance policies approved by lender; and (iii) the borrower provides the lender with evidence of renewal of the policy and with timely proof of payment of insurance premiums.
Lockbox and Cash Management. The 529 Bryant Street Mortgage Loan requires a lender-controlled lockbox account, which is already in place, and the borrower to direct the tenant to pay its rent directly into such lockbox account. The loan documents also require that all rents and other income received by the borrower be deposited in the lockbox account within two business days of receipt. Funds are then swept to a cash management account controlled by the lender and, prior to the occurrence of a Cash Trap Event Period (as defined below), all excess cash flow after application in accordance with the loan documents is distributed to the borrower’s operating account. During a Cash Trap Event Period, all excess cash flow is retained in the cash management account.
A “Cash Trap Event Period” will commence upon the earlier of (i) the occurrence and continuance of an event of default; (ii) the amortizing debt service coverage ratio being less than 1.20x at the end of any calendar month (based on the trailing-12 month operating period); or (iii) the occurrence of an Equinix Cash Trap Event Period (as defined below). A Cash Trap Event Period will expire, with regard to clause (i), upon the cure of such event of default; with regard to clause (ii), upon the date that the amortizing debt service coverage ratio is equal to or greater than 1.25x for two consecutive calendar quarters; and with regard to clause (iii), upon the cure of the Equinix Cash Trap Event Period, as outlined below (provided that a Cash Trap Event Period with regard to clause (i) has not occurred).
THE INFORMATION IN THIS STRUCTURAL AND COLLATERAL TERM SHEET IS NOT COMPLETE AND MAY BE AMENDED PRIOR TO THE TIME OF SALE. THIS TERM SHEET IS NOT AN OFFER TO SELL THESE SECURITIES AND IT IS NOT A SOLICITATION OF AN OFFER TO BUY THESE SECURITIES IN ANY JURISDICTION WHERE THE OFFER OR SALE IS NOT PERMITTED.
71
| 529 BRYANT STREET |
An “Equinix Cash Trap Event Period” will commence upon the earlier of (i) August 1, 2024; (ii) the occurrence and continuance of an event of default under the Equinix lease; (iii) a reduction in rent payable under the Equinix lease; (iv) a material modification to the Equinix lease affecting the economics of the lease to the detriment of the borrower; (v) Equinix filing bankruptcy or otherwise being subject to an insolvency proceeding; and (vi) Equinix going dark, vacating or ceasing operations for longer than 45 days.
An Equinix Cash Trap Event Period will expire, with regard to clause (i), upon the payoff of the 529 Bryant Street Mortgage Loan; with regard to clause (ii), upon the cure of such lease default; with regard to clauses (iii) and (iv), upon Equinix recommencing all obligations under the current or amended Equinix lease and bringing current all sums due and payable; with regard to clause (v), upon Equinix no longer being subject to any bankruptcy or insolvency proceeding and affirming the lease; and with regard to clause (vi), upon Equinix (or a replacement tenant acceptable to the lender) continuously operating its business for 45 consecutive days and is paying full rent as required under the lease.
Property Management. The 529 Bryant Street Property is managed by an affiliate of the borrower.
Assumption. The borrower has a two-time right to transfer the 529 Bryant Street Property, provided that no event of default has occurred and is continuing and certain other conditions are satisfied, including (i) the lender’s reasonable determination that the proposed transferee and guarantor satisfy the lender’s credit review and underwriting standards, taking into consideration transferee experience, financial strength and general business standing; (ii) execution of a recourse guaranty and an environmental indemnity by an affiliate of the transferee; and (iii) if requested by the lender, rating agency confirmation from DBRS, Moody’s and Morningstar that the transfer will not result in a downgrade, withdrawal or qualification of the respective ratings assigned to the Series 2014-C25 Certificates.
Right of First Offer. Equinix has a right of first offer (“ROFO”) to purchase the 529 Bryant Street Property. The ROFO is not extinguished by a foreclosure of the 529 Bryant Street Property; however, the ROFO does not apply to a foreclosure or deed-in-lieu thereof.
Partial Release. Not Permitted.
Real Estate Substitution. Not Permitted.
Subordinate and Mezzanine Indebtedness. Not permitted.
Ground Lease. None.
Terrorism Insurance. The loan documents require that the “all risk” insurance policy required to be maintained by the borrower provide coverage for terrorism in an amount equal to the full replacement cost of the 529 Bryant Street Property; provided, however, that the borrower will not be required to spend more than 200.0% of the cost of property coverage immediately prior to the date that the Terrorism Risk Insurance Act or a similar government backstop is no longer in effect. The loan documents also require business interruption insurance covering no less than the 18-month period following the occurrence of a casualty event, together with a six-month extended period of indemnity.
Earthquake Insurance: The loan documents do not require earthquake insurance. The seismic report indicated a probable maximum loss of 18%.
THE INFORMATION IN THIS STRUCTURAL AND COLLATERAL TERM SHEET IS NOT COMPLETE AND MAY BE AMENDED PRIOR TO THE TIME OF SALE. THIS TERM SHEET IS NOT AN OFFER TO SELL THESE SECURITIES AND IT IS NOT A SOLICITATION OF AN OFFER TO BUY THESE SECURITIES IN ANY JURISDICTION WHERE THE OFFER OR SALE IS NOT PERMITTED.
72
(THIS PAGE INTENTIONALLY LEFT BLANK)
73
GRANADA GARDENS |
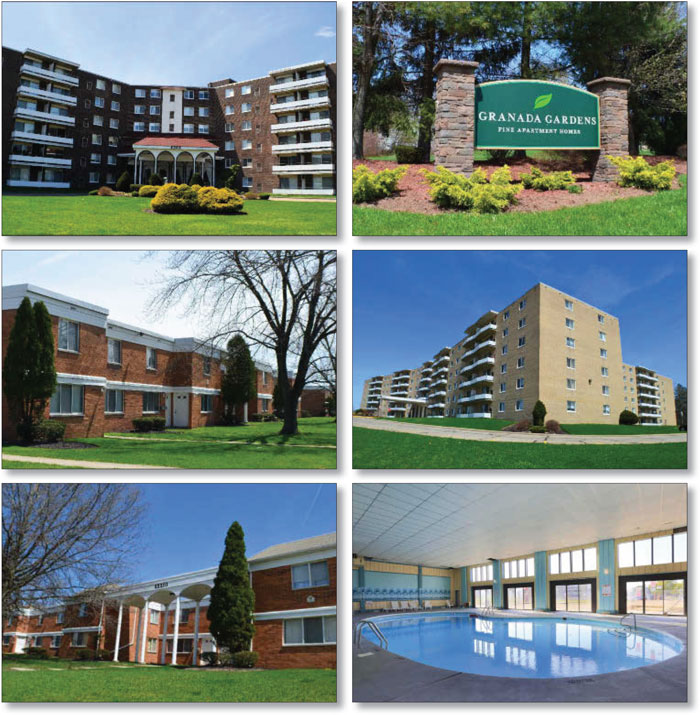
THE INFORMATION IN THIS STRUCTURAL AND COLLATERAL TERM SHEET IS NOT COMPLETE AND MAY BE AMENDED PRIOR TO THE TIME OF SALE. THIS TERM SHEET IS NOT AN OFFER TO SELL THESE SECURITIES AND IT IS NOT A SOLICITATION OF AN OFFER TO BUY THESE SECURITIES IN ANY JURISDICTION WHERE THE OFFER OR SALE IS NOT PERMITTED.
74
GRANADA GARDENS |

THE INFORMATION IN THIS STRUCTURAL AND COLLATERAL TERM SHEET IS NOT COMPLETE AND MAY BE AMENDED PRIOR TO THE TIME OF SALE. THIS TERM SHEET IS NOT AN OFFER TO SELL THESE SECURITIES AND IT IS NOT A SOLICITATION OF AN OFFER TO BUY THESE SECURITIES IN ANY JURISDICTION WHERE THE OFFER OR SALE IS NOT PERMITTED.
75
| (1) | See “Escrows” section. |
| (2) | The sponsor acquired the Granada Gardens Property in September 2013 and historical occupancy information was not available. |
| (3) | See “Cash Flow Analysis” section. |
The Mortgage Loan. The mortgage loan (the “Granada Gardens Mortgage Loan”) is evidenced by a single promissory note that is secured by a first mortgage encumbering a garden-style multifamily property located in Warrensville Heights, Ohio (the “Granada Gardens Property”). The Granada Gardens Mortgage Loan was originated on October 31, 2014 by Rialto Mortgage Finance, LLC. The Granada Gardens Mortgage Loan had an original principal balance of $34,500,000, has an outstanding principal balance as of the Cut-off Date of $34,500,000 and accrues interest at an interest rate of 4.580% per annum. The Granada Gardens Mortgage Loan had an initial term of 120 months, has a remaining term of 119 months as of the Cut-off Date and requires payments of interest-only for the first 36 payments following origination and, thereafter, requires payments of principal and interest based on a 30-year amortization schedule. The Granada Gardens Mortgage Loan matures on November 6, 2024.
Following the lockout period, the borrower has the right to defease the Granada Gardens Mortgage Loan in whole, but not in part, on any date before August 6, 2024. In addition, the Granada Gardens Mortgage Loan is prepayable without penalty on or after August 6, 2024.
Sources and Uses
| Sources | Uses | ||||||||
| Original loan amount | Loan payoff | % | |||||||
| Total Sources | 100.0% | Total Uses | 100.0 | % |
THE INFORMATION IN THIS STRUCTURAL AND COLLATERAL TERM SHEET IS NOT COMPLETE AND MAY BE AMENDED PRIOR TO THE TIME OF SALE. THIS TERM SHEET IS NOT AN OFFER TO SELL THESE SECURITIES AND IT IS NOT A SOLICITATION OF AN OFFER TO BUY THESE SECURITIES IN ANY JURISDICTION WHERE THE OFFER OR SALE IS NOT PERMITTED.
76
GRANADA GARDENS |
The Property. The Granada Gardens Property is a class B, garden-style multifamily property located in Warrensville Heights, Ohio, approximately 10 miles southeast of the Cleveland central business district. The Granada Gardens Property is situated on approximately 37.9 acres and comprises 940 units in 13 buildings. The improvements were built in 1966 and were recently renovated in 2013 and 2014. Since the acquisition of the Granada Gardens Property in 2013, the borrower has reportedly invested approximately $680,000 in capital expenditures. Common area amenities include controlled access, indoor pool, covered parking, playground, on-site laundry facilities and storage lockers. The Granada Gardens Property contains 1,750 parking spaces, reflecting an overall parking ratio of 1.9 spaces per unit. As of October 7, 2014, the Granada Gardens Property was 91.9% occupied.
The following table presents certain information relating to the unit mix of the Granada Gardens Property:
Unit Mix Summary(1)
| Unit Type | No. of Units | % of Total Units | Average Unit Size (SF) | Average U/W Monthly Rent per Unit |
| 254 | ||||
| 2 Bedroom | 523 | 55.6% | 893 | $722 |
| 3 Bedroom | 155 | 16.5% | 1,151 | $866 |
| Total/Weighted Average | 100.0% |
| (1) | Information obtained from the underwritten rent roll. |
Historical Occupancy
(1) The sponsor acquired the Granada Gardens Property in September 2013 and historical occupancy information was not available. | ||||||
(2) Information obtained from the borrower. | ||||||
(3) Information obtained from the underwritten rent roll. | ||||||
THE INFORMATION IN THIS STRUCTURAL AND COLLATERAL TERM SHEET IS NOT COMPLETE AND MAY BE AMENDED PRIOR TO THE TIME OF SALE. THIS TERM SHEET IS NOT AN OFFER TO SELL THESE SECURITIES AND IT IS NOT A SOLICITATION OF AN OFFER TO BUY THESE SECURITIES IN ANY JURISDICTION WHERE THE OFFER OR SALE IS NOT PERMITTED.
77
GRANADA GARDENS |
Operating History and Underwritten Net Cash Flow. The following table presents certain information relating to the historical operating performance and Underwritten Net Cash Flow at the Granada Gardens Property:
Cash Flow Analysis
| (1) | The increase in Net Operating Income and Net Cash Flow from 2013 to the U/W is primarily due to the sponsor’s reduction of both operating expenses and concessions offered at the property. |
| (2) | The underwritten economic vacancy is 12.9%. The Granada Gardens Property was 91.9% physically occupied as of October 7, 2014. |
Appraisal. As of the appraisal valuation date of September 23, 2014, the Granada Gardens Property had an “as-is” appraised value of $47,000,000.
Environmental Matters. According to a Phase I environmental assessment dated September 18, 2014, there was no evidence of any recognized environmental conditions at the Granada Gardens Property.
Market Overview and Competition. The Granada Gardens Property is located in Warrensville Heights, Ohio, approximately 10 miles southeast of the Cleveland central business district. Regional access to the area is provided by Interstate 71, Interstate 77, and Interstate 90. Interstates 71 and 77 are major north-south thoroughfares providing access to the Cleveland central business district to the north and through Columbus and Akron, Ohio, respectively, to the south. Interstate 90 is a major east-west thoroughfare providing access to Toledo, Ohio to the west and Buffalo, New York to the east. Approximately two miles northeast of the Granada Gardens Property is the University Hospital’s Ahuja Medical Center, a $300 million medical center that opened in 2011. The corporate headquarters of Eaton Corporation is located just west of the medical center. Thistledown Race Track, which underwent an $88 million renovation before re-opening in 2013, is located within one mile of the Granada Gardens Property. The renovated track now offers over 1,150 video lottery terminals, seasonal live racing as well as year-round simulcast racing. The 2014 estimated population within a one-, three- and five-mile radius of the Granada Gardens Property was 8,787, 79,983 and 226,186, respectively. The average household income within the same one-, three- and five-mile radius was $37,403, $59,698 and $63,060, respectively. The appraisal identified a competitive set of seven multifamily properties, which exhibit a 5.5% average vacancy rate. According to a third party market research report, the Granada Gardens Property is located in the Bedford/Garfield Heights/Bedford Heights submarket, which reported a second quarter 2014 average vacancy rate of 3.0%.
THE INFORMATION IN THIS STRUCTURAL AND COLLATERAL TERM SHEET IS NOT COMPLETE AND MAY BE AMENDED PRIOR TO THE TIME OF SALE. THIS TERM SHEET IS NOT AN OFFER TO SELL THESE SECURITIES AND IT IS NOT A SOLICITATION OF AN OFFER TO BUY THESE SECURITIES IN ANY JURISDICTION WHERE THE OFFER OR SALE IS NOT PERMITTED.
78
GRANADA GARDENS |
The following table presents certain information relating to some comparable multifamily properties for the Granada Gardens Property:
Competitive Set(1)
Granada Gardens (Subject) | Trinity Towers Property | Highland Woods Property | Rockside Park Property | Clarkwood Greens Property | Columbus Park Property | Emerick Manor Property | Huntington Green Property | ||||||||||
| Location | Warrensville Heights | Bedford Heights | Warrensville Heights | Bedford Heights | Warrensville Heights | Bedford Heights | Warrensville Heights | University Heights | |||||||||
| Distance to Subject | -- | 3 miles | 2 miles | 3 miles | 1 miles | 3 miles | 1 mile | 6 miles | |||||||||
| Property Type | Garden | Mid-Rise | Mid-Rise | Mid-Rise | Garden | Mid-Rise | Mid-Rise | Mid-Rise | |||||||||
| Number of Units | 940 | 499 | 663 | 536 | 568 | 623 | 133 | 426 | |||||||||
| Average Monthly Rent (per unit) | |||||||||||||||||
| 0-1 Bedroom | $636 | $612 | $605 | $690 | $690 | $514 | $645 | $705-$920 | |||||||||
| 2 Bedroom | $722 | $769 | $724 | $797-$832 | $705-$809 | $662 | $710 | $760-$1,170 | |||||||||
| 3 Bedroom | $866 | $904 | $860 | $974-$992 | $789-$879 | $899 | $843 | $1,340 | |||||||||
| 4 Bedroom | $927 | N/A | N/A | N/A | $886 | N/A | N/A | N/A | |||||||||
| Utilities | Some Incl. | Some Incl. | Some Incl. | Some Incl. | Some Incl. | Not Incl. | Some Incl. | Some Incl. | |||||||||
| Total Occupancy | 92% | 98% | 89% | 96% | 93% | 97% | 96% | 94% |
| (1) | Information obtained from the appraisal and underwritten rent roll. |
The Borrower. The borrower is Granada Apartments Ltd., a single purpose entity with two independent directors. Legal counsel to the borrower delivered a non-consolidation opinion in connection with the origination of the Granada Gardens Mortgage Loan. Michael E. Gibbons is the guarantor of certain nonrecourse carveouts under the Granada Gardens Mortgage Loan. Michael E. Gibbons also serves as the guarantor of certain nonrecourse carveouts for the Clarkwood Greens Mortgage Loan, which has a cut-off date principal balance of $23,600,000 and will be contributed to the WFRBS 2014-C25 Trust. See “Description of the Mortgage Pool—Statistical Characteristics of the Mortgage Loans—Multi-Property Mortgage Loans and Related Borrower Mortgage Loans” in the Free Writing Prospectus.
The Sponsor. The sponsor, Michael E. Gibbons, is a senior managing director and principal of Brown Gibbons Lang & Company, an independent investment bank serving middle market companies worldwide. He is also on the board of directors for Associated Estates Realty Corporation, a publically traded REIT specializing in owning and managing apartment communities. Associated Estates Realty Corporation currently owns a portfolio of 53 properties totaling more than 13,908 apartment units in eight states. Over the past 30 years, Mr. Gibbons has purchased, managed and sold approximately 7,000 apartment units.
Escrows. The loan documents provide for upfront escrows in the amount of $328,702 for real estate taxes and $61,994 for insurance. The loan documents also provide for ongoing monthly reserves in the amount of $62,610 for taxes, $14,760 for insurance and $19,583 for replacement reserves (subject to a cap of $705,000).
Lockbox and Cash Management. Upon the occurrence of a Cash Management Trigger Event (as defined below), the Granada Gardens Mortgage Loan requires the borrower to (i) establish a lender-controlled lockbox account and (ii) direct the manager to deliver all receipts payable (and other amounts received) with respect to the Granada Gardens Property directly into the lockbox account within two business days of receipt.
In the absence of any Cash Sweep Event (as defined below), all funds in the cash management account will be applied by the lender to payments of debt service, required reserves, approved operating expenses and other items required under the loan documents and the remaining cash flow (the “Remaining Cash Flow”) will be released to the borrower. Upon the occurrence and during the continuation of any Cash Sweep Event (other than an event of default), the Remaining Cash Flow will be held by the lender as additional collateral for the Granada Gardens Mortgage Loan.
A “Cash Management Trigger Event” will commence (i) upon the occurrence and continuance of an event of default; (ii) upon the bankruptcy or insolvency of the borrower, guarantor or property manager; or (iii) upon the amortizing debt service coverage ratio falling below 1.20x based on the trailing 12 month period. A Cash Management Trigger Event will end, with respect to clause (i) above, upon the cure of such event of default; with respect to clause (ii) above, upon the date such bankruptcy petition has been discharged, stayed, or dismissed among other conditions; or with respect to clause (iii) above, upon the amortizing debt service coverage ratio being above 1.20x based on the trailing twelve month period.
A “Cash Sweep Event” will commence (i) upon the occurrence and continuance of an event of default; (ii) upon the bankruptcy or insolvency of borrower, guarantor or property manager; or (iii) upon the amortizing debt service coverage ratio falling below 1.20x based on the trailing 12 month period. A Cash Sweep Event will end, with respect to clause (i) above, upon the cure of such event of default; with respect to clause (ii) above, upon the date such bankruptcy petition has been discharged, stayed, or dismissed among other conditions; or with respect to clause (iii) above, upon the amortizing debt service coverage ratio being above 1.20x based on the trailing 12 month period.
THE INFORMATION IN THIS STRUCTURAL AND COLLATERAL TERM SHEET IS NOT COMPLETE AND MAY BE AMENDED PRIOR TO THE TIME OF SALE. THIS TERM SHEET IS NOT AN OFFER TO SELL THESE SECURITIES AND IT IS NOT A SOLICITATION OF AN OFFER TO BUY THESE SECURITIES IN ANY JURISDICTION WHERE THE OFFER OR SALE IS NOT PERMITTED.
79
GRANADA GARDENS |
Assumption. The borrower has the right to transfer the Granada Gardens Property, provided that no event of default has occurred and is continuing and certain other conditions are satisfied, including (i) the lender’s reasonable determination that the proposed transferee and guarantor satisfy the lender’s credit review and underwriting standards, taking into consideration transferee experience, financial strength and general business standing; (ii) execution of a recourse guaranty and an environmental indemnity by an affiliate of the transferee; and (iii) if requested by the lender, rating agency confirmation from DBRS, Moody’s and Morningstar that the transfer will not result in a downgrade, withdrawal or qualification of the respective ratings assigned to the Series 2014-C25 Certificates.
Partial Release. Not permitted.
Real Estate Substitution. Not permitted.
Subordinate and Mezzanine Indebtedness. Not permitted.
Ground Lease. None
Terrorism Insurance. The loan documents require that the “all risk” insurance policy required to be maintained by the borrower provides coverage for terrorism in an amount equal to the full replacement cost of the Granada Gardens Property, as well as business interruption insurance covering no less than the 12-month period following the occurrence of a casualty event, together with a 12 month extended period of indemnity.
THE INFORMATION IN THIS STRUCTURAL AND COLLATERAL TERM SHEET IS NOT COMPLETE AND MAY BE AMENDED PRIOR TO THE TIME OF SALE. THIS TERM SHEET IS NOT AN OFFER TO SELL THESE SECURITIES AND IT IS NOT A SOLICITATION OF AN OFFER TO BUY THESE SECURITIES IN ANY JURISDICTION WHERE THE OFFER OR SALE IS NOT PERMITTED.
80
(THIS PAGE INTENTIONALLY LEFT BLANK)
81
| TOBIN LOFTS |
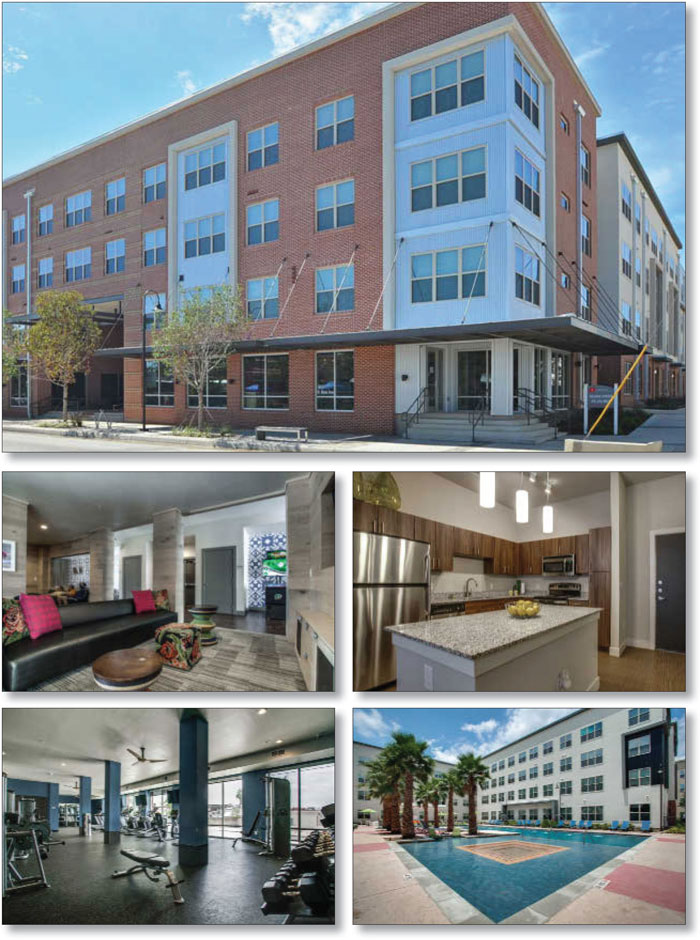
THE INFORMATION IN THIS STRUCTURAL AND COLLATERAL TERM SHEET IS NOT COMPLETE AND MAY BE AMENDED PRIOR TO THE TIME OF SALE. THIS TERM SHEET IS NOT AN OFFER TO SELL THESE SECURITIES AND IT IS NOT A SOLICITATION OF AN OFFER TO BUY THESE SECURITIES IN ANY JURISDICTION WHERE THE OFFER OR SALE IS NOT PERMITTED.
82
| TOBIN LOFTS |

THE INFORMATION IN THIS STRUCTURAL AND COLLATERAL TERM SHEET IS NOT COMPLETE AND MAY BE AMENDED PRIOR TO THE TIME OF SALE. THIS TERM SHEET IS NOT AN OFFER TO SELL THESE SECURITIES AND IT IS NOT A SOLICITATION OF AN OFFER TO BUY THESE SECURITIES IN ANY JURISDICTION WHERE THE OFFER OR SALE IS NOT PERMITTED.
83
| No. 7 – Tobin Lofts | |||||||
| Loan Information | Properties Information | ||||||
| Mortgage Loan Seller: | Silverpeak Real Estate Finance LLC | Single Asset/Portfolio: | Single Asset | ||||
| Credit Assessment (DBRS/Moody’s/Morningstar): | NR/NR/NR | Property Type: | Multifamily | ||||
| Original Principal Balance: | $34,500,000 | Specific Property Type: | Student Housing | ||||
| Cut-off Date Principal Balance: | $34,457,384 | Location: | San Antonio, TX | ||||
| % of Initial Pool Balance: | 3.9% | Size: | 552 beds | ||||
| Loan Purpose: | Refinance | Cut-off Date Principal Balance Per Bed: | $62,423 | ||||
| Borrower Name: | Tobin Lofts, LLC | Year Built/Renovated: | 2013/NAP | ||||
| Sponsor: | The NRP Group | Title Vesting(2): | Leasehold | ||||
| Mortgage Rate: | 4.850% | Property Manager: | Campus Advantage, Inc. | ||||
| Note Date: | October 9, 2014 | 3rd Most Recent Occupancy (As of): | NAP | ||||
| Anticipated Repayment Date: | NAP | 2nd Most Recent Occupancy (As of): | NAP | ||||
| Maturity Date: | November 6, 2024 | Most Recent Occupancy (As of): | NAP | ||||
| IO Period: | None | Current Physical Occupancy (As of): | 99.8% (8/28/2014) | ||||
| Loan Term (Original): | 120 months | ||||||
| Seasoning: | 1 month | Underwriting and Financial Information: | |||||
| Amortization Term (Original): | 360 months | ||||||
| Loan Amortization Type: | Amortizing Balloon | 3rd Most Recent NOI (As of): | NAP | ||||
| Interest Accrual Method: | Actual/360 | 2nd Most Recent NOI (As of): | NAP | ||||
| Call Protection: | L(25),D(92),O(3) | Most Recent NOI (As of)(3): | $1,293,527 (Annualized T11 7/31/2014) | ||||
| Lockbox Type: | Soft/Upfront Cash Management | ||||||
| Additional Debt: | None | U/W Revenues: | $4,501,564 | ||||
| Additional Debt Type: | NAP | U/W Expenses: | $1,451,218 | ||||
U/W NOI(3): | $3,050,346 | ||||||
U/W NCF(3): | $2,982,450 | ||||||
| U/W NOI DSCR: | 1.40x | ||||||
| U/W NCF DSCR: | 1.37x | ||||||
| U/W NOI Debt Yield: | 8.9% | ||||||
Escrows and Reserves(1): | U/W NCF Debt Yield: | 8.7% | |||||
| As-Is Appraised Value: | $49,600,000 | ||||||
| Type: | Initial | Monthly | Cap (If Any) | As-Is Appraisal Valuation Date: | September 1, 2014 | ||
| Insurance | $32,171 | Springing | NAP | Cut-off Date LTV Ratio: | 69.5% | ||
| Replacement Reserves | $5,658 | $5,658 | NAP | LTV Ratio at Maturity or ARD: | 56.9% | ||
| (1) | See “Escrows” section. |
| (2) | See “Ground Lease and Condominium” section. |
| (3) | See “Cash Flow Analysis” section. |
The Mortgage Loan. The mortgage loan (the “Tobin Lofts Mortgage Loan”) is evidenced by a single promissory note that is secured by a deed of trust encumbering a leasehold interest in two condominium units consisting of a student housing complex located in San Antonio, Texas (the “Tobin Lofts Property”). The Tobin Lofts Mortgage Loan was originated on October 9, 2014 by Silverpeak Real Estate Finance LLC. The Tobin Lofts Mortgage Loan had an original principal balance of $34,500,000, has an outstanding principal balance as of the Cut-off Date of $34,457,384 and accrues interest at an interest rate of 4.850% per annum. The Tobin Lofts Mortgage Loan had an initial term of 120 months, has a remaining term of 119 months as of the Cut-off Date and requires payments of principal and interest based on a 30-year amortization schedule. The Tobin Lofts Mortgage Loan matures on November 6, 2024.
Following the lockout period, the borrower has the right to defease the Tobin Lofts Mortgage Loan in whole, but not in part on any due date before September 6, 2024. In addition, the Tobin Lofts Mortgage Loan is prepayable without penalty on or after September 6, 2024.
THE INFORMATION IN THIS STRUCTURAL AND COLLATERAL TERM SHEET IS NOT COMPLETE AND MAY BE AMENDED PRIOR TO THE TIME OF SALE. THIS TERM SHEET IS NOT AN OFFER TO SELL THESE SECURITIES AND IT IS NOT A SOLICITATION OF AN OFFER TO BUY THESE SECURITIES IN ANY JURISDICTION WHERE THE OFFER OR SALE IS NOT PERMITTED.
84
| TOBIN LOFTS |
Sources and Uses
| Sources | Uses | ||||||||
| Original loan amount | $34,500,000 | 100.0% | Loan payoff | $31,261,036 | 91.5 | % | |||
| Reserves | 37,829 | 0.1 | |||||||
| Closing costs | 860,803 | 2.5 | |||||||
Return of equity(1) | 2,340,332 | 6.9 | |||||||
| Total Sources | $34,500,000 | 100.0% | Total Uses | $34,500,000 | 100.0 | % |
| (1) | Return of equity included $867,630 to NRP Holdings LLC and $867,630 to the borrower for a total of $1,735,259. The remaining funds were used to pay development fees to affiliates of the borrower and the sponsor. |
The Property. The Tobin Lofts Property consists of 225 units (552 beds) and 13,359 square feet of ground floor retail in two buildings located in San Antonio, Texas. The Tobin Lofts Property was built in two phases, Phase I was completed in 2013 and Phase II was completed in 2014. The unit mix is comprised of 19 one-bedroom units (19 beds), 66 two-bedroom units (132 beds), and 79 four-bedroom units (316 beds) completed in Phase I, and 37 one-bedroom units (37 beds), and 24 two-bedroom units (48 beds) completed in Phase II. As of the August 28, 2014 rent roll, the Tobin Lofts Property was 99.8% occupied.
Rents for Phase I at the Tobin Lofts Property include all utilities (water, sewer, electricity, cable and internet). Rents for Phase II at the Tobin Lofts Property do not include utilities other than cable and internet. Unit amenities include fully-furnished units (Phase I only), high speed internet, walk-in closets, courtyard / pool views, fully-equipped modern kitchens, individual bedrooms, individual baths, and full size washer and dryer in every unit. The Tobin Lofts Property includes the following community amenities: a resort style pool, café, business center, fitness club, tanning room, 24 hour on-call maintenance and street-level retail space.
Ground Lease and Condominium. The Tobin Lofts Property is comprised of the borrower’s leasehold interest in two units in a three-unit condominium. The third unit in the three unit condominium is the parking garage, which is owned by Alamo Community College District. Pursuant to the condominium declaration, the third unit is required to provide parking to units one and two. The ground lease is between ACCD Public Facility Corporation (“ACCD”) and the borrower. ACCD is the 100.0% owner of the borrower. There are no monthly rental obligations of the borrower under the ground lease. The ground lease expires in July 2087. Pursuant to the ground lease, all rights of ACCD, including voting rights and the right to appoint directors, in and to the condominium are controlled by the borrower. The condominium is controlled by the board of directors, which is comprised of three directors, with one director being appointed by each unit owner. Decisions of the board of directors require a majority vote. The borrower controls the decisions of the board of directors and the condominium association.
The following table presents certain information relating to the unit mix of the Tobin Lofts Property:
Unit Mix Summary(1)
| Unit Type | No. of Beds | % of Total Beds | Average Unit Size (SF) | Average U/W Monthly Rent Per Bed | ||
| 1 Bedroom | 212 | 38.4% | 561 | $669 | ||
| 2 Bedroom | 136 | 24.6% | 1,032 | $787 | ||
| 4 Bedroom | 204 | 37.0% | 1,282 | $597 | ||
| Total/Weighted Average | 552 | 100.0% | 944 | $671 | ||
| (1) | Information obtained from the underwritten rent roll. |
THE INFORMATION IN THIS STRUCTURAL AND COLLATERAL TERM SHEET IS NOT COMPLETE AND MAY BE AMENDED PRIOR TO THE TIME OF SALE. THIS TERM SHEET IS NOT AN OFFER TO SELL THESE SECURITIES AND IT IS NOT A SOLICITATION OF AN OFFER TO BUY THESE SECURITIES IN ANY JURISDICTION WHERE THE OFFER OR SALE IS NOT PERMITTED.
85
| TOBIN LOFTS |
Operating History and Underwritten Net Cash Flow. The following table presents certain information relating to the historical operating performance and Underwritten Net Cash Flow at the Tobin Lofts Property:
Cash Flow Analysis
T11 Annualized 7/31/2014 | U/W | U/W $ per Unit | |||||||
| Base Rent | $4,471,537 | $4,631,405 | $8,390 | ||||||
Other Income(1) | 95,997 | 157,493 | 285 | ||||||
| Less Vacancy & Credit Loss | (1,997,607 | ) | (287,334 | )(2) | (521) | ||||
| Effective Gross Income | $2,569,927 | $4,501,564 | $8,155 | ||||||
| Total Operating Expenses | $1,276,400 | (3) | $1,451,218 | (3) | $2,629 | ||||
| Net Operating Income | $1,293,527 | (4) | $3,050,346 | (4) | $5,526 | ||||
| Capital Expenditures | 6,849 | 67,896 | 123 | ||||||
| Net Cash Flow | $1,280,652 | $2,982,450 | $5,403 | ||||||
| NOI DSCR | 0.59 | x | 1.40x | ||||||
| NCF DSCR | 0.59 | x | 1.37x | ||||||
| NOI DY | 3.8 | % | 8.9% | ||||||
| NCF DY | 3.7 | % | 8.7% | ||||||
(1) U/W Other Income includes rent and reimbursements from Luther’s Café, Inc., a 5,327 square foot retail tenant which pays $15.00 per square foot (on a triple-net basis) through April 2020 and Alamo Community College District, a 7,000 square foot tenant which pays $12.62 per square foot (on a triple-net basis) through August 2019. | |||||||||
(2) The underwritten economic vacancy is 5.0% and underwritten collection loss is 1.0%. The Tobin Lofts Property was 99.8% physically occupied as of August 28, 2014. | |||||||||
(3) The Tobin Lofts Property benefits from a tax exemption as long as the borrower owns the property. The U/W Total Operating Expenses includes the full benefit of the tax exemption. See “Development Agreement” section for further description of the tax exemption and lender’s remedies upon foreclosure. | |||||||||
(4) The increase in T11 annualized NOI to U/W NOI is a result of the lease-up of the Tobin Lofts Property as constriction finished in 2014. Gross Potential Rent is based on all units leased at contract rates, per the most recent leasing report. | |||||||||
Appraisal. As of the appraisal valuation date of September 1, 2014, Tobin Lofts had an “as-is” appraised value of $49,600,000.
Environmental Matters. According to a Phase I environmental assessment dated August 18, 2014, there was evidence of a recognized environmental condition (“REC”) at the Tobin Lofts Property relating to a leaking petroleum storage tank (“LPST”) at the northeast corner of the southern portion of the Tobin Lofts Property where the former Luther’s Café was located (prior to the reconstruction at the Tobin Lofts Property). Alamo College (an affiliate of the borrower, but not the guarantor) has been identified as the responsible party for liability and costs associated with groundwater monitoring and remediation, if required. The LPST is considered a REC based on the low levels of identified groundwater impact and the ongoing groundwater monitoring; however, the Phase I environmental assessment does not consider the ground water impacts a vapor encroachment condition. The Phase I environmental assessment recommended no further investigation, however it recommends the borrower continue to provide site access to environmental consultants performing the ongoing groundwater monitoring. See “Risk Factors—Adverse Environmental Conditions at or Near Mortgaged Properties May Result in Losses” in the Free Writing Prospectus and “Risk Factors—Environmental Law Considerations” and “Certain Legal Aspects of the Mortgage Loans—Environmental Risks” in the accompanying Prospectus.
Market Overview. The Tobin Lofts Property is located immediately southeast of San Antonio College (“SAC”) and is the main student housing accommodation for SAC because there is no on-campus housing at SAC. The Tobin Lofts Property is located on SAC’s land and is advertised on the campus website as the only student housing option. While the primary demand generator is SAC, the Tobin Lofts Property benefits from its location within just a few miles from several other colleges: Trinity University, University of Texas San Antonio Downtown (“UTSA-Downtown”) and University of Incarnate Word. SAC has a fall 2013 enrollment of 23,004 students, with approximately 25.0% of the total enrollment represented by full time students. Trinity University has a fall 2013 enrollment of 2,353 students, of which only seniors (estimated to be 20% of total enrollment, or 471 students) can reside off campus. UTSA-Downtown (an extension of the University of Texas San Antonio, located about 15 miles northwest of downtown San Antonio) has a fall 2013 enrollment of 2,358, of which 1,651 are estimated to be full time – representing additional potential demand for the Tobin Lofts Property. University of Incarnate Word has a fall 2013 total enrollment of 6,099 students, of which 4,458 are reported to be living off campus. According to the appraisal, the San Antonio market contains eleven student housing projects, ten of which were built after 2004. The average occupancy is 95.0%. The average monthly rent is $1,732 per unit and $1.42 per square foot. All student housing properties lease by the bed, as does most of the Tobin Lofts Property. The Tobin Lofts Property’s rent, at monthly rent of $1,620 per unit and $1.64 per square foot, is within the San Antonio indicated range.
THE INFORMATION IN THIS STRUCTURAL AND COLLATERAL TERM SHEET IS NOT COMPLETE AND MAY BE AMENDED PRIOR TO THE TIME OF SALE. THIS TERM SHEET IS NOT AN OFFER TO SELL THESE SECURITIES AND IT IS NOT A SOLICITATION OF AN OFFER TO BUY THESE SECURITIES IN ANY JURISDICTION WHERE THE OFFER OR SALE IS NOT PERMITTED.
86
| TOBIN LOFTS |
The following table presents certain information relating to comparable properties to the Tobin Lofts Property:
Competitive Set(1)
Tobin Lofts (Subject) | Villas at Babcock | Avalon Place | Estates at San Antonio | Luxx | |
| Location | San Antonio, TX | San Antonio, TX | San Antonio, TX | San Antonio, TX | San Antonio, TX |
| Distance to Subject | -- | 8 miles | 14 miles | 14 miles | 14 miles |
| Property Type | Student Housing | Student Housing | Student Housing | Student Housing | Student Housing |
| Year Built | 2013-2014 | 2010 | 2009 | 2010 | 2013 |
| Number of Beds | 552 | 792 | 680 | 326 | 662 |
| Average Rent (per bed) | |||||
| 1 Bedroom | $979 | $969 | $926 | N/A | $969 |
| 2 Bedroom | $773 | N/A | $721 | $669 | $679 |
| 3 Bedroom | N/A | N/A | N/A | $605 | N/A |
| 4 Bedroom | $559 | $529 | $654 | $646 | $575-$620 |
| Total Occupancy | 99% | 94% | 98% | 98% | 95% |
| (1) | Information obtained from the appraisal. |
The Borrower. The borrower is Tobin Lofts, LLC, a Texas limited liability single purpose entity, with one independent director. The borrower is 100% owned by ACCD Public Facility Corporation, which is 100% owned by Alamo Community College District, a Texas junior college district. Alamo Community College District is a San Antonio based community college system consisting of San Antonio College, St. Phillip’s College, Palo Alto College, Northwest Vista College and Northeast Lakeview College. The Alamo Community College District was established as a public community college through a public election in 1945 and operates as a political subdivision under the laws of the State of Texas. NRP Investment Corp., an Ohio corporation, is the guarantor of certain nonrecourse carveouts under the Tobin Lofts Mortgage Loan.
The Sponsor. The sponsor is the NRP Group. The NRP Group is a full-service developer, contractor, and manager of multifamily, senior and student housing properties throughout the United States. Since its founding in 1995, NRP Group has developed more than 22,000 multifamily units in 13 states, and closed more than $3.5 billion in real estate ($1.5 billion since 2009). NRP Group currently manages over 12,500 residential units and has more than 500 employees across its platform. Revenues from NRP Group’s buildings exceed $250.0 million per year.
Escrows. The loan documents provide for upfront reserves in the amount of $5,658 for replacement reserves and $32,171 for insurance (which represents 50% of the annual insurance premiums due under the policies covering the Tobin Lofts Property). The loan documents also provide for ongoing monthly reserves in the amount of $5,658 for replacement reserves. In lieu of the borrower’s obligations to make monthly insurance deposits, borrower must maintain a balance equal to 50% of the annual insurance premiums due under the policies covering the Tobin Lofts Property.
Lockbox and Cash Management. The loan documents require a lender-controlled lockbox account, which is already in place, and that all cash revenues and all other monies received by the borrower or the property manager be deposited into the lockbox account within one business day of receipt. All amounts on deposit in the lockbox account are swept on a daily basis into a lender-controlled cash management account. Prior to the occurrence of a Cash Trap Event (as defined below), all excess funds remaining on deposit in the cash management account after application to debt service and other expenses in accordance with the cash management agreement will be swept to the borrowers’ operating account. Upon the occurrence of a Cash Trap Event, all such excess funds will be swept into the excess cash flow account and held as additional collateral for the Tobin Lofts Mortgage Loan.
A “Cash Trap Event” will commence (i) upon the occurrence of an event of default, or (ii) if the debt service coverage ratio at the end of any calendar quarter is less than 1.05x. A Cash Trap Event will be cured with respect to clause (i), upon the cure of such event of default, and with respect to clause (ii) upon the date that the debt service coverage ratio is at least 1.10x at the end of any calendar quarter.
Property Management. The Tobin Lofts Property is managed by Campus Advantage, Inc.
Assumption. Not permitted.
Partial Release. Not permitted.
Real Estate Substitution. Not permitted.
Subordinate and Mezzanine Indebtedness. Not permitted.
Development Agreement. The Tobin Lofts Property benefits from a 100.0% real estate tax exemption for so long as ACCD is the equity owner of the Tobin Lofts Property. NRP Tobin LLC (the “Developer”), an affiliate of the sponsor, is entitled to 50% of the revenue from the Tobin Lofts Property pursuant to a development agreement (the “Development Agreement”). As additional collateral for the Tobin Lofts Mortgage Loan, the sole member of the Developer pledged to the lender its 100.0% equity interest in the Developer and the Developer’s rights under the Development Agreement pursuant to a pledge and security agreement (the
THE INFORMATION IN THIS STRUCTURAL AND COLLATERAL TERM SHEET IS NOT COMPLETE AND MAY BE AMENDED PRIOR TO THE TIME OF SALE. THIS TERM SHEET IS NOT AN OFFER TO SELL THESE SECURITIES AND IT IS NOT A SOLICITATION OF AN OFFER TO BUY THESE SECURITIES IN ANY JURISDICTION WHERE THE OFFER OR SALE IS NOT PERMITTED.
87
| TOBIN LOFTS |
“Pledge”). In the event of a default under the Tobin Lofts Mortgage Loan, as an alternative to foreclosing on the mortgage (which will remain available as a subsequent remedy for 36 months following the completion of the foreclosure of the Pledge), the lender will have the option to foreclose on the Pledge and become the equity owner of the Developer. In so doing, ACCD will remain the equitable owner of the Tobin Lofts Property and the tax exemption benefiting the Tobin Lofts Property will be preserved. See “Risk Factors—Other Risks—Tax Matters and Changes in Tax Law May Adversely Impact the Mortgage Loan or Your Investment—Tax Considerations Relating to Foreclosure” in the Free Writing Prospectus.
Pursuant to the Development Agreement and the amendments thereto, from and after a foreclosure of the Pledge, the revenue from the Tobin Lofts Property will be applied as follows: (i) first, 100% to the lender (as the 100% owner of the Developer) until the entirety of the Tobin Lofts Mortgage Loan (including all costs, expenses and default interest) has been retired, (ii) second, to the lender (as the 100% owner of the Developer) until the lender receives a 20% return on the Tobin Lofts Mortgage Loan (the “Preferred Return”), (iii) third, during the Revenue Sharing Period (as defined below), 50% cash flow to the lender (as the 100% owner of the Developer) and 50% cash flow to ACCD, and (iv) thereafter, all remaining amounts to the borrower. In addition, during the Developer Exclusive Control Period (as defined below), the Developer will have rights to control all matters related to the Tobin Lofts Property, including the right to replace the property manager (with ACCD maintaining non-binding consultation rights with respect to all such decisions).
The “Revenue Sharing Period” means the period of time equal to the earlier to occur of (a) 10 years from the completion of the foreclosure of the Pledge and (b) five years from the payment of the Preferred Return in full. The “Developer Exclusive Control Period” means the period ending as of the later to occur of (a) the end of the Revenue Sharing Period and (b) the payment of the Preferred Return in full.
Terrorism Insurance. The loan documents require that the “all risk” insurance policy required to be maintained by the borrower provide coverage for terrorism in an amount equal to the full replacement cost of the Tobin Lofts Property. The loan documents also require business interruption insurance covering no less than the 18-month period following the occurrence of a casualty event.
THE INFORMATION IN THIS STRUCTURAL AND COLLATERAL TERM SHEET IS NOT COMPLETE AND MAY BE AMENDED PRIOR TO THE TIME OF SALE. THIS TERM SHEET IS NOT AN OFFER TO SELL THESE SECURITIES AND IT IS NOT A SOLICITATION OF AN OFFER TO BUY THESE SECURITIES IN ANY JURISDICTION WHERE THE OFFER OR SALE IS NOT PERMITTED.
88
(THIS PAGE INTENTIONALLY LEFT BLANK)
89
(THIS PAGE INTENTIONALLY LEFT BLANK)
90
| MADISON PARK OFFICE PORTFOLIO |
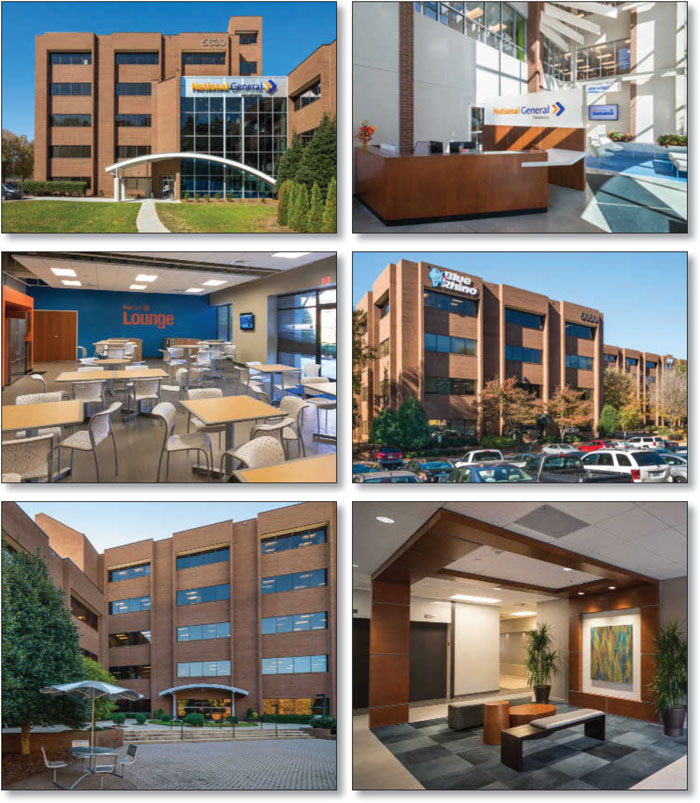
THE INFORMATION IN THIS STRUCTURAL AND COLLATERAL TERM SHEET IS NOT COMPLETE AND MAY BE AMENDED PRIOR TO THE TIME OF SALE. THIS TERM SHEET IS NOT AN OFFER TO SELL THESE SECURITIES AND IT IS NOT A SOLICITATION OF AN OFFER TO BUY THESE SECURITIES IN ANY JURISDICTION WHERE THE OFFER OR SALE IS NOT PERMITTED.
91
| MADISON PARK OFFICE PORTFOLIO |
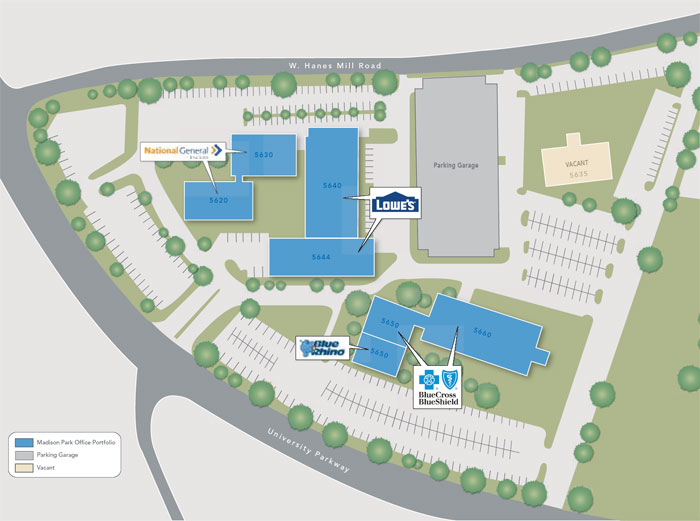
THE INFORMATION IN THIS STRUCTURAL AND COLLATERAL TERM SHEET IS NOT COMPLETE AND MAY BE AMENDED PRIOR TO THE TIME OF SALE. THIS TERM SHEET IS NOT AN OFFER TO SELL THESE SECURITIES AND IT IS NOT A SOLICITATION OF AN OFFER TO BUY THESE SECURITIES IN ANY JURISDICTION WHERE THE OFFER OR SALE IS NOT PERMITTED.
92
| MADISON PARK OFFICE PORTFOLIO |
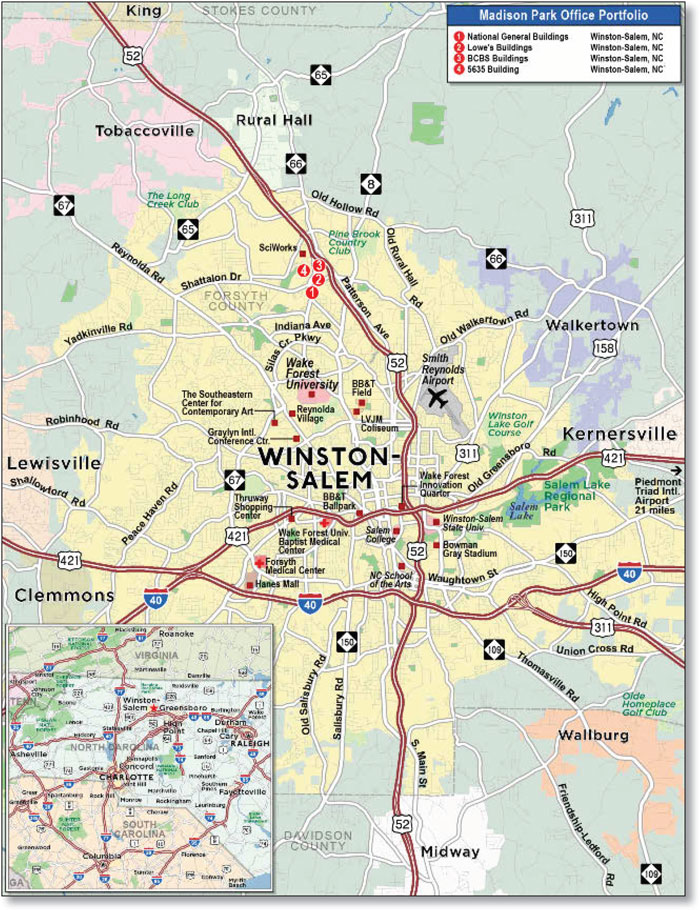
THE INFORMATION IN THIS STRUCTURAL AND COLLATERAL TERM SHEET IS NOT COMPLETE AND MAY BE AMENDED PRIOR TO THE TIME OF SALE. THIS TERM SHEET IS NOT AN OFFER TO SELL THESE SECURITIES AND IT IS NOT A SOLICITATION OF AN OFFER TO BUY THESE SECURITIES IN ANY JURISDICTION WHERE THE OFFER OR SALE IS NOT PERMITTED.
93
| No. 8 – Madison Park Office Portfolio | |||||||
| Loan Information | Property Information | ||||||
| Mortgage Loan Seller: | Wells Fargo Bank, National Association | Single Asset/Portfolio: | Portfolio | ||||
Credit Assessment (DBRS/ Moody’s/Morningstar): | NR/NR/NR | Property Type: | Various – See Table | ||||
| Original Principal Balance: | $29,000,000 | Specific Property Type: | Various – See Table | ||||
| Cut-off Date Principal Balance: | $29,000,000 | Location: | Winston-Salem, NC | ||||
| % of Initial Pool Balance: | 3.3% | Size: | 482,835 SF | ||||
| Loan Purpose: | Refinance | Cut-off Date Principal Balance Per SF: | $60.06 | ||||
| Borrower Name: | KBR-LRC Madison Park, LLC | Year Built/Renovated: | Various – See Table | ||||
| Sponsors: | Howard Lavitt and Edward J. Kulik, Jr. | Title Vesting: | Fee | ||||
| Mortgage Rate: | 4.600% | Property Manager: | Cassidy Turley Commercial Real Estate Services, Inc. | ||||
| Note Date: | October 21, 2014 | 3rd Most Recent Occupancy (As of)(2): | 46.7% (12/31/2011) | ||||
| Anticipated Repayment Date: | NAP | 2nd Most Recent Occupancy (As of)(2): | 52.3% (12/31/2012) | ||||
| Maturity Date: | November 11, 2024 | Most Recent Occupancy (As of)(2): | 66.6% (12/31/2013) | ||||
| IO Period: | 36 months | Current Occupancy (As of)(2): | 90.6% (7/31/2014) | ||||
| Loan Term (Original): | 120 months | ||||||
| Seasoning: | 1 month | Underwriting and Financial Information: | |||||
| Amortization Term (Original): | 360 months | ||||||
| Loan Amortization Type: | Interest-only, Amortizing Balloon | 3rd Most Recent NOI (As of): | $970,822 (12/31/2012) | ||||
| Interest Accrual Method: | Actual/360 | 2nd Most Recent NOI (As of): | $1,016,049 (12/31/2013) | ||||
| Call Protection: | L(25),D(91),O(4) | Most Recent NOI (As of)(3): | $1,352,554 (TTM 7/31/2014) | ||||
| Lockbox Type: | Hard/Springing Cash Management | ||||||
| Additional Debt: | None | U/W Revenues: | $3,892,215 | ||||
| Additional Debt Type: | NAP | U/W Expenses: | $988,347 | ||||
U/W NOI(3): | $2,903,868 | ||||||
U/W NCF(3): | $2,339,629 | ||||||
| U/W NOI DSCR: | 1.63x | ||||||
Escrows and Reserves(1): | U/W NCF DSCR: | 1.31x | |||||
| U/W NOI Debt Yield: | 10.0% | ||||||
Type: | Initial | Monthly | Cap (If Any) | U/W NCF Debt Yield: | 8.1% | ||
| Taxes | $140,170 | $13,441 | NAP | As-Is Appraised Value: | $40,000,000 | ||
| Insurance | $16,819 | $5,606 | NAP | As-Is Appraisal Valuation Date: | September 17, 2014 | ||
| Replacement Reserves | $0 | $10,059 | NAP | Cut-off Date LTV Ratio: | 72.5% | ||
| TI/LC Reserves | $0 | Springing | NAP | LTV Ratio at Maturity or ARD: | 63.6% | ||
| (1) | See “Escrows” section. |
| (2) | See “Historical Occupancy” section. |
| (3) | See “Cash Flow Analysis” section. |
The Mortgage Loan. The mortgage loan (the “Madison Park Office Portfolio Mortgage Loan”) is evidenced by a single promissory note that is secured by a first mortgage encumbering a seven building office park and adjacent six-story parking garage located in Winston-Salem, North Carolina (the “Madison Park Office Portfolio Properties”). The Madison Park Office Portfolio Mortgage Loan was originated on October 21, 2014 by Wells Fargo Bank, National Association. The Madison Park Office Portfolio Mortgage Loan had an original principal balance of $29,000,000, has an outstanding principal balance as of the Cut-off Date of $29,000,000 and accrues interest at an interest rate of 4.600% per annum. The Madison Park Office Portfolio Mortgage Loan had an initial term of 120 months, has a remaining term of 119 months as of the Cut-off Date and requires interest-only payments for the first 36 payments following origination and, thereafter, requires payments of principal and interest based on a 30-year amortization schedule. The Madison Park Office Portfolio Mortgage Loan matures on November 11, 2024.
Following the lockout period, the borrower has the right to defease the Madison Park Office Portfolio Mortgage Loan in whole, or in part, on any date before August 11, 2024. In addition, the Madison Park Office Portfolio Mortgage Loan is prepayable without penalty on or after August 11, 2024.
THE INFORMATION IN THIS STRUCTURAL AND COLLATERAL TERM SHEET IS NOT COMPLETE AND MAY BE AMENDED PRIOR TO THE TIME OF SALE. THIS TERM SHEET IS NOT AN OFFER TO SELL THESE SECURITIES AND IT IS NOT A SOLICITATION OF AN OFFER TO BUY THESE SECURITIES IN ANY JURISDICTION WHERE THE OFFER OR SALE IS NOT PERMITTED.
94
| MADISON PARK OFFICE PORTFOLIO |
Sources and Uses
| Sources | Uses | ||||||
| Original loan amount | $29,000,000 | 73.6% | Loan payoff | $20,530,715 | 52.1% | ||
Sponsor’s new cash contribution(1) | 10,397,565 | 26.4% | Reserves | 156,989 | 0.4 | ||
| Closing Costs | 1,192,028 | 3.0 | |||||
| Return of equity | 17,517,833 | 44.5 | |||||
| Total Sources | $39,397,565 | 100.0% | Total Uses | $39,397,565 | 100.0% |
| (1) | The Sponsor’s new cash contribution is from Red Starr Investments, LLC. |
The Property. The Madison Park Office Portfolio Properties are comprised of seven, three- to five-story office buildings totaling 482,835 square feet and a six-story parking garage located in Winston-Salem, North Carolina. The sponsor acquired the Madison Park Office Portfolio Properties in June 2010 and has increased occupancy from 46.7% as of December 2011 to 90.6% as of July 2014 due to expansions by Lowe’s Home Improvements (“Lowe’s”) and Blue Cross Blue Shield NC (“BCBS”), along with new leases by National General Insurance and Blue Rhino. Two buildings are 100.0% leased to National General Insurance (“National General Buildings”), two buildings are 100.0% leased to Lowe’s (“Lowe’s Buildings”), two buildings are 100.0% leased to BCBS and Blue Rhino (“BCBS Buildings”) and the seventh building is currently vacant (“5635 Building”). Built in 1985 and renovated in 2006, the Lowe’s Buildings house one of the company’s two U.S. data centers (the other data center is located in San Antonio, Texas) and Lowe’s has reportedly invested in excess of $50.0 million in the space. In addition, the National General Buildings serve as the tenant’s headquarters. The Madison Park Office Portfolio Properties offer 3,250 parking spaces, including a six-story parking garage that contains 1,600 spaces, resulting in a parking ratio of 6.7 spaces per 1,000 square feet of rentable area. As of July 31, 2014 the Madison Park Office Portfolio Properties were 90.6% occupied by four tenants.
The following table presents certain information relating to the Madison Park Office Portfolio Properties:
| Property Name | Specific Property Type | Allocated Cut-off Date Principal Balance | % of Portfolio Cut-off Date Principal Balance | Occupancy | Year Built/ Renovated | Net Rentable Area (SF) | Appraised Value |
| National General Buildings | Suburban Office | $10,400,000 | 35.9% | 100.0% | 1983/2014 | 116,048 | $10,460,000 |
Lowe’s Buildings | Data Center | $8,800,000 | 30.3% | 100.0% | 1985/2006 | 169,810 | $9,690,000 |
| BCBS Buildings | Suburban Office | $6,400,000 | 22.1% | 100.0% | 1984/2014 | 151,774 | $14,680,000 |
| 5635 Building | Suburban Office | $3,400,000 | 11.7% | 0.0% | 1986/2006 | 45,203 | $5,170,000 |
| Total/Weighted Average | $29,000,000 | 100.0% | 90.6% | 482,835 | $40,000,000 |
The following table presents certain information relating to the tenants at the Madison Park Office Portfolio Properties:
Major Tenants
| Tenant Name | Credit Rating (Fitch/Moody’s/ S&P(1) | Tenant NRSF | % of NRSF | Annual U/W Base Rent PSF | Annual U/W Base Rent | % of Total Annual U/W Base Rent | Lease Expiration Date | |||||||
| Major Tenants | ||||||||||||||
| Blue Cross Blue Shield NC | NR/NR/NR | 136,733 | 28.3% | $9.67(2) | $1,322,463 | 36.2% | 12/31/2018 | |||||||
| National General Insurance | NR/NR/NR | 116,048(3) | 24.0% | $11.00 | $1,276,528 | 34.9% | 9/30/2024(4) | |||||||
| Lowe’s | NR/A3/A- | 169,810 | 35.2% | $5.31(5) | $900,884 | 24.6% | 12/31/2025 | |||||||
| Blue Rhino | NR/B3/B+ | 15,041 | 3.1% | $10.44 | $156,975 | 4.3% | 4/30/2024(6) | |||||||
| Total Major Tenants | 437,632 | 90.6% | $8.36 | $3,656,850 | 100.0% | |||||||||
| Vacant Space | 45,203 | 9.4% | ||||||||||||
| Collateral Total | 482,835 | 100.0% | ||||||||||||
| (1) | Certain ratings are those of the parent company whether or not the parent guarantees the lease. | |
| (2) | The Annual U/W Base Rent PSF for Blue Cross Blue Shield NC represents the weighted average rent of the tenant’s space in the 5650 building (40,494 square feet; 8.4% of the net rentable area), which has an Annual U/W Base Rent of $9.49 per square foot and the 5660 building (96,239 square feet; 19.9% of the net rentable area), which has an Annual U/W Base Rent of $9.75 per square foot. | |
| (3) | National General Insurance has the right to reduce its total square footage by returning 14,365 square feet (3.0% of the net rentable area) or 28,740 square feet (6.0% of the net rentable area) on October 1, 2021 with one years notice and payment of a fee, equal to the sum of the unamortized tenant improvement allowance and brokerage commissions allocated on a per rentable square foot basis of the returned space by April 1, 2021. | |
| (4) | National General Insurance has the right to terminate its lease on September 30, 2020 with one years notice and payment of a termination fee, equal to approximately $4.5 million, by March 31, 2021. National General Insurance has two 5-year lease renewal options. | |
| (5) | The Annual U/W Base Rent PSF for Lowe’s represents the weighted average rent of the tenant’s space in the 5644 building (86,013 square feet; 17.8% of the net rentable area) which has an Annual U/W Base Rent of $5.12 per square foot and the 5640 building (83,797 square feet; 17.4% of the net rentable area) which has an Annual U/W Base Rent of $5.50 per square foot. | |
| (6) | Blue Rhino has the right to terminate its lease on April 30, 2020 with payment of a termination fee of $191,098; on April 30, 2021 with payment of a termination fee of $143,324; on April 30, 2022 with payment of a termination fee of $95,549; and on April 30, 2023 with payment of a termination fee of $47,775. The tenant must provide notice at least 180 days prior to the termination date and pay a termination fee at least 30 days prior to the termination date. |
THE INFORMATION IN THIS STRUCTURAL AND COLLATERAL TERM SHEET IS NOT COMPLETE AND MAY BE AMENDED PRIOR TO THE TIME OF SALE. THIS TERM SHEET IS NOT AN OFFER TO SELL THESE SECURITIES AND IT IS NOT A SOLICITATION OF AN OFFER TO BUY THESE SECURITIES IN ANY JURISDICTION WHERE THE OFFER OR SALE IS NOT PERMITTED.
95
| MADISON PARK OFFICE PORTFOLIO |
The following table presents certain information relating to the lease rollover schedule at the Madison Park Office Portfolio Properties:
Lease Expiration Schedule(1)(2)
Year Ending December 31, | No. of Leases Expiring | Expiring NRSF | % of Total NRSF | Cumulative Expiring NRSF | Cumulative % of Total NRSF | Annual U/W Base Rent | Annual U/W Base Rent PSF(3) | |||||||
| MTM | 0 | 0 | 0.0% | 0 | 0.0% | $0 | $0.00 | |||||||
| 2014 | 0 | 0 | 0.0% | 0 | 0.0% | $0 | $0.00 | |||||||
| 2015 | 0 | 0 | 0.0% | 0 | 0.0% | $0 | $0.00 | |||||||
| 2016 | 0 | 0 | 0.0% | 0 | 0.0% | $0 | $0.00 | |||||||
| 2017 | 0 | 0 | 0.0% | 0 | 0.0% | $0 | $0.00 | |||||||
| 2018 | 2 | 136,733 | 28.3% | 136,733 | 28.3% | $1,322,463 | $9.67 | |||||||
| 2019 | 0 | 0 | 0.0% | 136,733 | 28.3% | $0 | $0.00 | |||||||
| 2020 | 0 | 0 | 0.0% | 136,733 | 28.3% | $0 | $0.00 | |||||||
| 2021 | 0 | 0 | 0.0% | 136,733 | 28.3% | $0 | $0.00 | |||||||
| 2022 | 0 | 0 | 0.0% | 136,733 | 28.3% | $0 | $0.00 | |||||||
| 2023 | 0 | 0 | 0.0% | 136,733 | 28.3% | $0 | $0.00 | |||||||
| 2024 | 2 | 131,089 | 27.1% | 267,822 | 55.5% | $1,433,503 | $10.94 | |||||||
| Thereafter | 4 | 169,810 | 35.2% | 437,632 | 90.6% | $900,884 | $5.31 | |||||||
| Vacant | 0 | 45,203 | 9.4% | 482,835 | 100.0% | $0 | $0.00 | |||||||
| Total/Weighted Average | 8(4) | 482,835 | 100.0% | $3,656,850 | $8.36 |
| (1) | Information obtained from the underwritten rent roll. |
| (2) | Certain tenants may have lease termination options that are exercisable prior to the originally stated expiration date of the subject lease and that are not considered in the Lease Expiration Schedule. |
| (3) | Weighted Average Annual U/W Base Rent PSF excludes vacant space. |
| (4) | The Madison Park Portfolio Properties are leased to four tenants on eight leases. |
The following table presents historical occupancy percentages at the Madison Park Office Portfolio Properties:
Historical Occupancy
12/31/2011(1)(2) | 12/31/2012(1)(2) | 12/31/2013(1)(2) | 7/31/2014(3)(4) | |||
| 46.7% | 52.3% | 66.6% | 90.6% |
| (1) | Information obtained from the borrower. |
| (2) | The sponsors acquired the Madison Park Office Portfolio Properties in June 2010 when they were approximately 51.0% occupied. |
| (3) | Information obtained from the underwritten rent roll. |
| (4) | The increase in occupancy is due to National General Insurance (24.0% of net rentable area) taking occupancy in April 2014. |
THE INFORMATION IN THIS STRUCTURAL AND COLLATERAL TERM SHEET IS NOT COMPLETE AND MAY BE AMENDED PRIOR TO THE TIME OF SALE. THIS TERM SHEET IS NOT AN OFFER TO SELL THESE SECURITIES AND IT IS NOT A SOLICITATION OF AN OFFER TO BUY THESE SECURITIES IN ANY JURISDICTION WHERE THE OFFER OR SALE IS NOT PERMITTED.
96
| MADISON PARK OFFICE PORTFOLIO |
Operating History and Underwritten Net Cash Flow. The following table presents certain information relating to the historical operating performance and Underwritten Net Cash Flow at the Madison Park Office Portfolio Properties:
Cash Flow Analysis
| 2012 | 2013 | TTM 7/31/2014 | U/W | U/W $ per SF | |||||||
| Base Rent | $1,800,263 | $1,953,955 | $2,669,010 | $3,656,850 | $7.57 | ||||||
| Grossed Up Vacant Space | 0 | 0 | 0 | 587,639 | $1.22 | ||||||
| Total Reimbursables | 117,249 | 133,213 | 154,254 | 235,365 | $0.49 | ||||||
| Free Rent Adjustment | (87,195) | (193,582) | (543,240) | 0 | $0.00 | ||||||
| Less Vacancy & Credit Loss | 0 | 0 | 0 | (587,639)(2) | ($1.22) | ||||||
| Effective Gross Income | $1,830,317 | $1,893,586 | $2,280,024(1) | $3,892,215(3) | $8.06 | ||||||
| Total Operating Expenses | $859,495 | $877,537 | $927,470 | $988,347 | $2.05 | ||||||
| Net Operating Income | $970,822 | $1,016,049 | $1,352,554 | $2,903,868(2) | $6.01 | ||||||
| TI/LC | 0 | 0 | 0 | 443,530 | $0.92 | ||||||
| Capital Expenditures | 0 | 0 | 0 | 120,709 | $0.25 | ||||||
| Net Cash Flow | $970,822 | $1,016,049 | $1,352,554 | $2,339,629 | $4.85 | ||||||
| NOI DSCR | 0.54x | 0.57x | 0.76x | 1.63x | |||||||
| NCF DSCR | 0.54x | 0.57x | 0.76x | 1.31x | |||||||
| NOI DY | 3.3% | 3.5% | 4.7% | 10.0% | |||||||
| NCF DY | 3.3% | 3.5% | 4.7% | 8.1% |
| (1) | The increase in the TTM 7/31/2014 Effective Gross Income from 2013 is attributed to the BSBS expansion (approximately $196,000), Lowe’s expansion (approximately $87,000) and the expiration of Blue Rhino’s rent abatement period in April 2014 (approximately $39,000). |
| (2) | The underwritten economic vacancy is 13.8%. Madison Park Office Portfolio Properties were 90.6% physically occupied as of July 31, 2014. |
| (3) | The increase in U/W Effective Gross Income and Net Operating Income from the TTM 7/31/2014 is primarily due to the expiration of National General Insurance’s rent abatement period in September 2014 (approximately $1,277,000). |
Appraisal. As of the appraisal valuation date of September 17, 2014, the Madison Park Office Portfolio Properties had an “as-is” appraised value of $40,000,000.
Environmental Matters. The Phase I environmental report dated September 24, 2014 noted an open case associated with an active leaking underground storage tank located at the Lowe’s Buildings. According to information obtained from the North Carolina Department of Environment and Natural Resources (“NCDENR”), a 10,000-gallon diesel underground storage tank (“UST”) was removed on November 9, 2011. Soil samples were taken and one monitoring well was installed during the UST excavation. The soil samples were reported to be clean; however, the groundwater contained petroleum constituents greater than the North Carolina groundwater action limit but less than the gross contamination limits. The NCDENR identified Lowe’s Companies Inc. as the responsible party. The case remains open as long as Lowe’s operates a well onsite to be used for data center cooling water in the event that the Winston-Salem water supply is interrupted. As of January 31, 2014, Lowe’s Companies, Inc. reported total assets of $32.7 billion. See “Description of the Mortgage Pool—Assessments of Property Value and Condition” in the Free Writing Prospectus.
Market Overview and Competition. The Madison Park Office Portfolio Properties are located at the intersection of West Hanes Mill Road and University Parkway, less than one mile from US Route 52 in Winston-Salem, North Carolina. University Parkway is a primary north/south commuter thoroughfare in north Winston-Salem. Wake Forest University, located approximately 2.8 miles south of the Madison Park Office Portfolio Properties, significantly influences the area and is Winston-Salem’s largest employer with approximately 13,430 employees. According to the appraisal, the Madison Park Office Portfolio Properties are located within the Forsyth County market which reported approximately 19.6 million square feet of total office space and a vacancy rate of 8.0% as of second quarter 2014, an improvement over the first quarter vacancy rate of 8.4%. Average asking rental rates in Forsyth County market increased from $13.82 per square foot gross in first quarter 2014 to $14.39 per square foot gross in second quarter 2014. The Madison Park Office Portfolio Properties are located within the Northwest Forsyth submarket which reported an inventory of approximately 3.5 million square feet, vacancy rate of 14.5% and average asking rental rate of $12.85 per square foot gross as of the second quarter 2014.
THE INFORMATION IN THIS STRUCTURAL AND COLLATERAL TERM SHEET IS NOT COMPLETE AND MAY BE AMENDED PRIOR TO THE TIME OF SALE. THIS TERM SHEET IS NOT AN OFFER TO SELL THESE SECURITIES AND IT IS NOT A SOLICITATION OF AN OFFER TO BUY THESE SECURITIES IN ANY JURISDICTION WHERE THE OFFER OR SALE IS NOT PERMITTED.
97
| MADISON PARK OFFICE PORTFOLIO |
The following table presents certain information relating to comparable properties to the Madison Park Office Portfolio Properties:
Competitive Set(1)
Madison Park Office Portfolio (Subject) | 7628 Thorndike Road | 190 Oak Plaza Boulevard | 150 Oak Plaza Boulevard | 1100 Reynolds Boulevard | 7823 National Service Road | 7825 National Service Road | |
| Location | Winston-Salem, NC | Greensboro, NC | Winston-Salem, NC | Winston-Salem, NC | Winston-Salem, NC | Greensboro, NC | Greensboro, NC |
| Distance from Subject | -- | 24.9 miles | 2.1 miles | 2.2 miles | 3.7 miles | 25.1 miles | 25.2 miles |
| Property Type | Various | Office | Office | Office | Office | Office | Office |
| Year Built/Renovated | Various/Various | 1999/NAP | 1997/2012 | 2000/NAP | 1978/NAP | 1984/NAP | 1984/NAP |
| Stories | Various | 2 | 3 | 2 | 5 | 3 | 3 |
| Total GLA | 482,835 SF | 100,000 SF | 90,264 SF | 37,775 SF | 205,000 SF | 45,600 SF | 60,000 SF |
| Total Occupancy | 91% | 100% | 100% | 100% | 100% | 100% | 100% |
| (1) | Information obtained from the appraisal. |
The Borrower. The borrower is KBR-LRC Madison Park, LLC, which is a single purpose entity with one independent director. KBR-LRC Madison Park, LLC is owned by a subsidiary of LCR Properties, LLC and Red Starr Investments, LLC. LRC Opportunity Fund, LLC and Arthur Samberg are the guarantors of certain nonrecourse carveouts under the Madison Park Office Portfolio Mortgage Loan.
The Sponsors. The sponsors are Howard Lavitt and Edward J. Kulik, Jr. as principals of LRC Properties, LLC. LRC Properties, LLC is an investment manager focused on commercial real estate investments located on the east coast that has recently acquired six office and industrial properties totaling approximately 2.4 million square feet. Arthur Samberg is a principal investor in the LRC Opportunity Fund, LLC. Mr. Samberg settled a lawsuit with the Securities and Exchange Commission in May 2010 in connection with possible insider trading. Please see “Description of the Mortgage Pool—Litigation Considerations” in the Free Writing Prospectus.
Escrows. The loan documents provide for upfront reserves in the amount of $140,170 for taxes and $16,819 for insurance. The loan documents require monthly deposits of $13,441 for real estate taxes, $5,606 for insurance and $10,059 for replacement reserves. Upon the occurrence of a Tenant Cash Trap Event Period (as defined below), the borrower must deposit all excess cash flow into a TI/LC reserve account. To the extent the borrower is required to deposit the Required Release Deposit Amount (see “Partial Release” section), such amounts will be part of the TI/LC reserve.
Lockbox and Cash Management. The Madison Park Office Portfolio Mortgage Loan requires a lender-controlled lockbox account, which is already in place, and that the borrower direct tenants to pay their rents directly into such lockbox account. The loan documents also require that all rents received by the borrower or the property manager be deposited into the lockbox account within one business day of receipt. Prior to the occurrence of a Cash Trap Event Period (as defined below), all excess funds on deposit in the lockbox account are disbursed to the borrower. During a Cash Trap Event Period, all excess cash flow is swept to a lender-controlled cash management account.
A “Cash Trap Event Period” will commence upon the earlier of (i) the occurrence and continuance of an event of default; (ii) the amortizing net cash flow debt service coverage ratio is less than 1.20x; (iii) the occurrence of a Tenant Cash Trap Event Period (as defined below); and (iv) the occurrence of a 2024 Tenant Cash Trap Event Period (as defined below). A Cash Trap Event Period will expire, with regard to clause (i), upon the cure of such event of default; with regard to clause (ii), upon the amortizing net cash flow debt service ratio being equal to or greater than 1.20x for two consecutive calendar quarters; with regard to clause (iii), the termination of a Tenant Cash Trap Event Period; and with regard to clause (iv), the termination of a 2024 Tenant Cash Trap Event Period.
A “Tenant Cash Trap Event Period” will commence upon the earlier of (i) BCBS fails to extend or renew its lease for at least a three year term on or prior to December 31, 2017; or (ii) National General Insurance gives notice of its intent to terminate its lease early. A Tenant Cash Trap Event Period will expire, with regard to clause (i), the occurrence of the earlier of (a) a BCBS Cure Event (as defined below); (b) a BCBS DSCR Cure Event (as defined below); or (c) the borrower leasing all or a substantial portion of the BCBS space to acceptable replacement tenants on leases acceptable to lender and the replacement tenants are in occupancy, open for business and paying full rent due under the lease; with regard to clause (ii), the occurrence of the earlier of (I) National General Insurance revoking or rescinding all termination or cancellation notices and re-affirming its lease; (II) the borrower leasing all or a substantial portion of the National General Insurance space to acceptable replacement tenants on leases acceptable to lender and the replacement tenants are in occupancy, open for business and paying full rent due under the lease; or (III) the borrower leasing all or a substantial portion of the National General Insurance space to acceptable replacement tenants on leases acceptable to lender and upon the lease taking effect, the amortizing net cash flow debt service coverage ratio is equal to or greater than either (A) 1.30x for one calendar quarter or (B) 1.20x for two consecutive calendar quarters.
A “BSCS Cure Event” will commence upon BCBS having renewed or extended its lease for a term of at least three years at a rental rate acceptable to lender.
THE INFORMATION IN THIS STRUCTURAL AND COLLATERAL TERM SHEET IS NOT COMPLETE AND MAY BE AMENDED PRIOR TO THE TIME OF SALE. THIS TERM SHEET IS NOT AN OFFER TO SELL THESE SECURITIES AND IT IS NOT A SOLICITATION OF AN OFFER TO BUY THESE SECURITIES IN ANY JURISDICTION WHERE THE OFFER OR SALE IS NOT PERMITTED.
98
| MADISON PARK OFFICE PORTFOLIO |
A “BCBS DSCR Cure Event” will commence upon (i) the borrower leasing all or a substantial portion of the BSCS space to acceptable replacement tenants on leases acceptable to lender; or (ii) the amortizing net cash flow debt service coverage ratio is equal to or greater than either (a) 1.30x for one calendar quarter or (b) 1.20x for two consecutive calendar quarters.
A “2024 Cash Trap Event Period” will commence on December 11, 2020 and will expire upon (i) each of Lowe’s, National General Insurance and Blue Rhino having renewed or extended their leases on terms acceptable to lender; (ii) the borrower leasing all or a substantial portion of the applicable tenant space to an acceptable replacement tenant on terms acceptable to lender; or (iii) the amortizing net cash flow debt service coverage is greater than or equal to 1.30x for one quarter. During a 2024 Cash Trap Event Period, all excess cash flow must be deposited into the leasing reserve subaccount in an amount equal to (i) $4,513,485 or (ii) if one or more of the Lowe’s, National General Insurance or Blue Rhino spaces have been re-leased, an amount equal to the difference between $4,513,485 and the amount of square feet re-leased multiplied by $15.00.
Property Management. The Madison Park Office Portfolio Properties are managed by Cassidy Turley Commercial Real Estate Services, Inc.
Assumption. The borrower has a two-time right to transfer the Madison Park Office Portfolio Properties provided that certain conditions are satisfied, including (i) no event of default has occurred and is continuing; (ii) the lender has reasonably determined that the proposed transferee and guarantor satisfy the lender’s credit review and underwriting standards, taking into consideration transferee experience, financial strength and general business standing; and (iii) the lender has received confirmation from DBRS, Moody’s and Morningstar that such assumption will not result in a downgrade, withdrawal or qualification of the respective ratings assigned to the Series 2014-C25 Certificates.
The loan documents also provide that, following 12 months from the closing date of the Madison Park Office Portfolio Mortgage Loan, lender will not unreasonably withhold consent to a single property sale involving the National General Buildings, Lowe’s Buildings or the 5635 Building and related partial assumption of the loan, subject to certain conditions, including (i) the post-sale amortizing net cash flow debt service coverage ratio for the remaining properties will be greater than the greater of (A) 1.25x or (B) the amortizing net cash flow debt service coverage ratio of all properties prior to the sale; (ii) the post-sale assumed debt service coverage ratio (based on an imputed interest rate of 10.0%) for the remaining properties will be greater than the greater of (A) 0.80x or (B) the assumed amortizing net cash flow debt service coverage ratio of all properties prior to the sale; and (iii) the post-sale loan-to-value ratio for the remaining properties is not greater than 70%.
Right of First Refusal. The tenant (Lowe’s) has a right of first refusal (“ROFR”) to purchase the Lowe’s Buildings if a bona fide offer is received that the borrower is otherwise willing to accept. The lease is not subject to a subordination, non-disturbance and attornment agreement. The ROFR is not extinguished by foreclosure; however, the ROFR does not apply to foreclosure or deed in lieu thereof.
Partial Release. Following the lockout period, the borrower is permitted to partially release any of the National General Buildings, Lowe’s Buildings or the 5635 Building in connection with a partial defeasance, subject to certain conditions including (i) the principal is reduced by an amount equal to 110% of the released property’s allocated loan balance; (ii) borrower has delivered evidence that the release property is not necessary for the uses of the remaining properties and sufficient parking remains on the remaining properties; (iii) borrower has delivered a copy of a new easement or amendment to any applicable reciprocal easement agreement addressing shared facilities, cross-indemnification and other matters reasonably requested by lender; (iv) rating agency confirmation from DBRS, Moody’s and Morningstar that the release will not result in a downgrade, withdrawal or qualification of the respective ratings assigned to the Series 2014-C25 Certificates; (v) the amortizing net cash flow debt service coverage ratio of the remaining properties is greater than the greater of (x) the amortizing net cash flow debt service coverage ratio prior to the release and (y) 1.25x; (vi) the loan-to-value ratio following the release is not greater than 70.0%; (vii) if a Tenant Cash Trap Event Period has occurred or is continuing with regard to BCBS, prior to the occurrence of a BCBS Cure Event or a BCBS DSCR Cure Event, if the lender determines that the projected remaining net cash flow during the last three years of the loan term is insufficient to sweep an amount equal to $20.00 per square foot for any remaining space, the borrower must deposit the difference; (viii) after a BCBS Cure Event or BCBS DSCR Cure Event, if the lender determines that the projected remaining net cash flow during the last three years of the loan term is insufficient to sweep an amount equal to $15.00 per square foot for any remaining space, the borrower must deposit the difference for any remaining space scheduled to expire in 2024 and 2025; and (ix) if, prior to BCBS’ lease expiration in December 31, 2018, BCBS has not renewed or extended its lease or an acceptable replacement tenant has not executed a lease, borrower may release the National General Buildings or the Lowe’s Buildings, but not both.
Notwithstanding the foregoing, any time prior to BCBS Cure Event or BCBS DSCR Cure Event, the borrower has the right to utilize a portion of the amount on deposit, as outlined in the loan documents, to be applied toward the next monthly debt service payment provided the revenue from the Madison Park Office Portfolio Properties is not sufficient to pay such monthly debt service payment.
Real Estate Substitution. Not permitted.
Subordinate and Mezzanine Indebtedness. Not permitted.
Additional Indebtedness. The loan documents permit the pledge of equity interests by the controlling owner of the borrower to secure an operating debt facility to parties satisfying “qualified pledgee” criteria (generally, total assets in excess of $400 million and, except for pension advisory firms or similar fiduciaries, $150 million in capital/statutory surplus or shareholder equity), involving multiple underlying real estate assets.
Ground Lease. None.
THE INFORMATION IN THIS STRUCTURAL AND COLLATERAL TERM SHEET IS NOT COMPLETE AND MAY BE AMENDED PRIOR TO THE TIME OF SALE. THIS TERM SHEET IS NOT AN OFFER TO SELL THESE SECURITIES AND IT IS NOT A SOLICITATION OF AN OFFER TO BUY THESE SECURITIES IN ANY JURISDICTION WHERE THE OFFER OR SALE IS NOT PERMITTED.
99
| MADISON PARK OFFICE PORTFOLIO |
Terrorism Insurance. The loan documents require that the “all risk” insurance policy required to be maintained by the borrower provides coverage for terrorism in an amount equal to the full replacement cost of the Madison Park Office Portfolio Properties. The loan documents also require business interruption insurance covering no less than the 12-month period following the occurrence of a casualty event, together with a 120 day extended period of indemnity. However, the borrower’s obligation to provide the foregoing coverages shall be suspended with respect to the Lowe’s Buildings to the extent that such coverages are maintained by the tenant in accordance with terms of its lease. Lowe’s currently maintains its own insurance coverage.
THE INFORMATION IN THIS STRUCTURAL AND COLLATERAL TERM SHEET IS NOT COMPLETE AND MAY BE AMENDED PRIOR TO THE TIME OF SALE. THIS TERM SHEET IS NOT AN OFFER TO SELL THESE SECURITIES AND IT IS NOT A SOLICITATION OF AN OFFER TO BUY THESE SECURITIES IN ANY JURISDICTION WHERE THE OFFER OR SALE IS NOT PERMITTED.
100
(THIS PAGE INTENTIONALLY LEFT BLANK)
101
| BROOKSTONE PARK APARTMENTS |
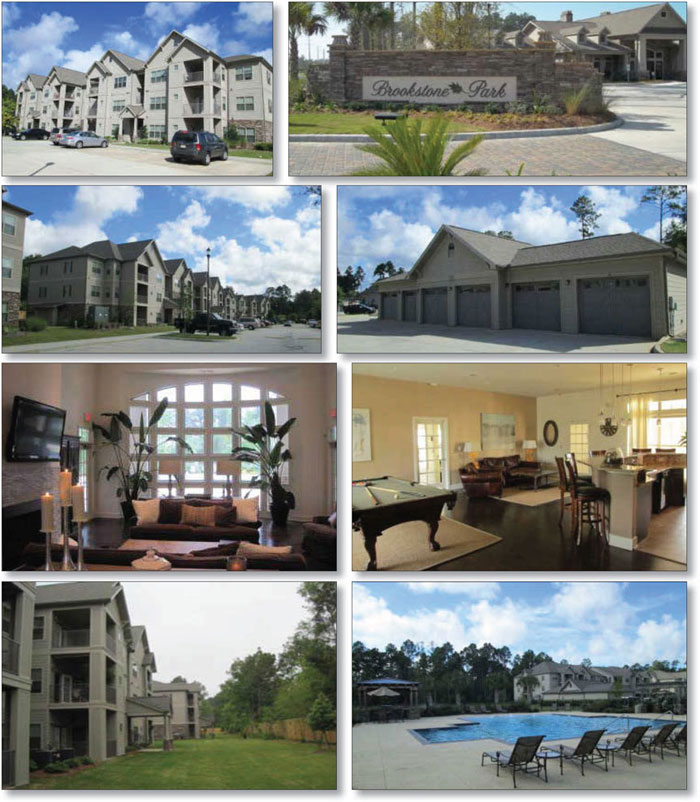
THE INFORMATION IN THIS STRUCTURAL AND COLLATERAL TERM SHEET IS NOT COMPLETE AND MAY BE AMENDED PRIOR TO THE TIME OF SALE. THIS TERM SHEET IS NOT AN OFFER TO SELL THESE SECURITIES AND IT IS NOT A SOLICITATION OF AN OFFER TO BUY THESE SECURITIES IN ANY JURISDICTION WHERE THE OFFER OR SALE IS NOT PERMITTED.
102
| BROOKSTONE PARK APARTMENTS |
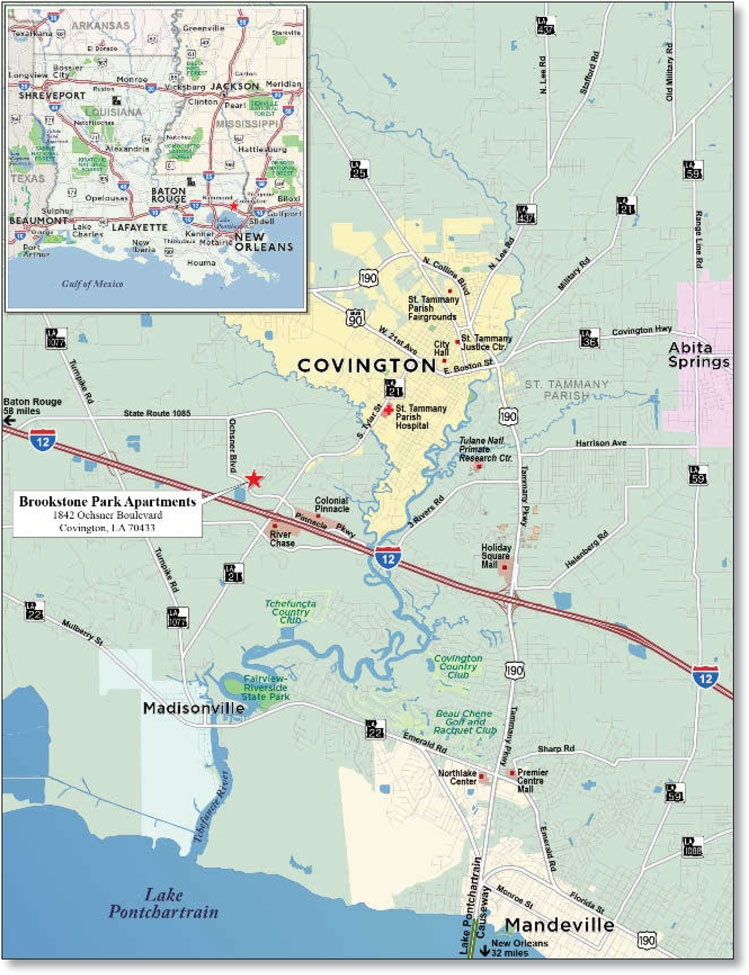
THE INFORMATION IN THIS STRUCTURAL AND COLLATERAL TERM SHEET IS NOT COMPLETE AND MAY BE AMENDED PRIOR TO THE TIME OF SALE. THIS TERM SHEET IS NOT AN OFFER TO SELL THESE SECURITIES AND IT IS NOT A SOLICITATION OF AN OFFER TO BUY THESE SECURITIES IN ANY JURISDICTION WHERE THE OFFER OR SALE IS NOT PERMITTED.
103
| No. 9 – Brookstone Park Apartments | |||||||
| Loan Information | Property Information | ||||||
| Mortgage Loan Seller: | The Royal Bank of Scotland plc | Single Asset/Portfolio: | Single Asset | ||||
| Credit Assessment (DBRS/Moody’s/Morningstar): | NR/NR/NR | Property Type: | Multifamily | ||||
| Original Principal Balance: | $24,500,000 | Specific Property Type: | |||||
| Cut-off Date Principal Balance: | $24,500,000 | Location: | Covington, LA | ||||
| % of Initial Pool Balance: | 2.8% | Size: | 240 units | ||||
| Loan Purpose: | Refinance | Cut-off Date Principal Balance Per Unit: | $102,083 | ||||
| Borrower Name: | PPQ Northshore L.L.C. | Year Built/Renovated(2): | 2011 and 2014/NAP | ||||
| Sponsors: | Quentin Dastugue, Paul Dastugue and Gerald Pratt Provosty | Title Vesting: | Fee | ||||
| Mortgage Rate: | 4.240% | Property Manager: | Self-Managed | ||||
| Note Date: | November 5, 2014 | 3rd Most Recent Occupancy (As of): | NAV | ||||
| Anticipated Repayment Date: | NAP | 2nd Most Recent Occupancy (As of)(2): | 97.7% (10/17/2012) | ||||
| Maturity Date: | December 1, 2024 | Most Recent Occupancy (As of)(2): | 93.0% (12/31/2013) | ||||
| IO Period: | 60 months | Current Occupancy (As of)(2): | 94.6% (10/20/2014) | ||||
| Loan Term (Original): | 120 months | ||||||
| Seasoning: | 0 months | Underwriting and Financial Information: | |||||
| Amortization Term (Original): | 360 months | ||||||
| Loan Amortization Type: | Interest-only, Amortizing Balloon | 3rd Most Recent NOI (As of)(2): | NAV | ||||
| Interest Accrual Method: | Actual/360 | 2nd Most Recent NOI (As of)(2): | $901,954 (12/31/2013) | ||||
| Call Protection: | L(24),D(92),O(4) | Most Recent NOI (As of)(2): | |||||
| Lockbox Type: | Soft/Springing Cash Management | ||||||
| Additional Debt: | None | U/W Revenues(3): | $2,994,671 | ||||
| Additional Debt Type: | NAP | U/W Expenses(3): | $1,001,653 | ||||
U/W NOI(3): | $1,993,018 | ||||||
U/W NCF(3): | $1,945,018 | ||||||
| U/W NOI DSCR: | 1.38x | ||||||
| U/W NCF DSCR: | 1.35x | ||||||
Escrows and Reserves(1): | U/W NOI Debt Yield: | 8.1% | |||||
| U/W NCF Debt Yield: | 7.9% | ||||||
Type: | Initial | Monthly | Cap (If Any) | As-Is Appraised Value: | $33,000,000 | ||
| Taxes | $198,902 | $24,161 | NAP | As-Is Appraisal Valuation Date: | October 9, 2014 | ||
| Insurance | $67,230 | $8,404 | NAP | Cut-off Date LTV Ratio: | 74.2% | ||
| Replacement Reserves | $4,000 | $4,000 | NAP | LTV Ratio at Maturity or ARD: | 67.7% | ||
| (1) | See “Escrows” section. |
| (2) | The sponsors developed the Brookstone Park Apartments Property in two phases. Phase I, consisting of 128 units, was completed at the end of 2011 and Phase II, consisting of 112 units, was completed in early 2014. Year-end occupancies for 2012 and 2013 include only Phase I. |
| (3) | See “Cash Flow Analysis” Section. |
The Mortgage Loan. The mortgage loan (the “Brookstone Park Apartments Mortgage Loan”) is evidenced by a single promissory note that is secured by a first mortgage encumbering a 10 building, class A, garden-style multifamily property located in Covington, Louisiana (the “Brookstone Park Apartments Property”). The Brookstone Park Apartments Mortgage Loan was originated on November 5, 2014 by the Royal Bank of Scotland plc. The Brookstone Park Apartments Mortgage Loan had an original principal balance of $24,500,000, has an outstanding principal balance as of the Cut-off Date of $24,500,000 and accrues interest at an interest rate of 4.240% per annum. The Brookstone Park Apartments Mortgage Loan had an initial term of 120 months, has a remaining term of 120 months as of the Cut-off Date and requires payments of interest-only for the first 60 payments following origination and, thereafter, requires payments of principal and interest based on a 30-year amortization schedule. The Brookstone Park Apartments Mortgage Loan matures on December 1, 2024.
Following the lockout period, the borrower has the right to defease the Brookstone Park Apartments Mortgage Loan in whole, but not in part, on any date before September 1, 2024. In addition, the Brookstone Park Apartments Mortgage Loan is prepayable without penalty on or after September 1, 2024.
THE INFORMATION IN THIS STRUCTURAL AND COLLATERAL TERM SHEET IS NOT COMPLETE AND MAY BE AMENDED PRIOR TO THE TIME OF SALE. THIS TERM SHEET IS NOT AN OFFER TO SELL THESE SECURITIES AND IT IS NOT A SOLICITATION OF AN OFFER TO BUY THESE SECURITIES IN ANY JURISDICTION WHERE THE OFFER OR SALE IS NOT PERMITTED.
104
| BROOKSTONE PARK APARTMENTS |
Sources and Uses
| Sources | Uses | |||||||
| Original loan amount | $24,500,000 | 100.0% | Loan payoff | $19,805,367 | 80.8% | |||
| Closing costs | 376,760 | 0.6 | ||||||
| Reserves | 270,132 | 1.1 | ||||||
| Return of equity | 4,047,741 | 17.5 | ||||||
| Total Sources | $24,500,000 | 100.0% | Total Uses | $24,500,000 | 100.0% |
The Property. The Brookstone Park Apartments Property is a class A, garden-style multifamily property located in Covington, Louisiana, situated on approximately 14.7 acres and comprising 240 units in 10 buildings. The improvements were built in two phases at a total cost of $23,462,145. Phase I, consisting of 128 units, was completed at the end of 2011 and Phase II, consisting of 112 units, was completed in early 2014. The unit mix is comprised of 122 one-bedroom units, 106 two-bedroom units and 12 three-bedroom units. Unit amenities include fully equipped kitchens with all electric appliances, large walk-in closets and enclosed patios with outside storage closets. Common area amenities include a community pool, a 5,090 square foot office/clubhouse building with fitness center, business center and a lounge, and gated entry. The Brookstone Park Apartments Property contains 407 parking spaces, including 62 parking garage spaces available to residents at an additional monthly fee, reflecting an overall parking ratio of 1.7 spaces per unit. As of October 20, 2014, the Brookstone Park Apartments Property was 94.6% occupied.
The following table presents certain information relating to the unit mix of the Brookstone Park Apartments Property:
Unit Mix Summary(1)
| Unit Type | No. of Units | % of Total Units | Average Unit Size (SF) | Average U/W Monthly Rent Per Unit | ||||
| 122 | 744 | |||||||
| 106 | 1,113 | |||||||
| 3 Bedroom | 12 | 5.0% | 1,287 | $1,419 | ||||
| Total/Weighted Average | 240 | 100.0% | 934 | $1,070 | ||||
| (1) | Information obtained from the appraisal. |
The following table presents historical occupancy percentages at the Brookstone Park Apartments Property:
Historical Occupancy(1)
12/31/2011 | 10/17/2012(2) | 12/31/2013(2) | 10/20/2014(3) | |||
| NAV | 97.7% | 93.0% | 94.6% |
| (1) | The sponsors developed the Brookstone Park Apartments Property in two phases. Phase I, consisting of 128 units, was completed at the end of 2011 and Phase II, consisting of 112 units, was completed in early 2014. |
| (2) | Information obtained from the borrower. Year-end occupancies for 2012 and 2013 include only Phase I. |
| (3) | Information obtained from the underwritten rent roll. |
THE INFORMATION IN THIS STRUCTURAL AND COLLATERAL TERM SHEET IS NOT COMPLETE AND MAY BE AMENDED PRIOR TO THE TIME OF SALE. THIS TERM SHEET IS NOT AN OFFER TO SELL THESE SECURITIES AND IT IS NOT A SOLICITATION OF AN OFFER TO BUY THESE SECURITIES IN ANY JURISDICTION WHERE THE OFFER OR SALE IS NOT PERMITTED.
105
| BROOKSTONE PARK APARTMENTS |
Operating History and Underwritten Net Cash Flow. The following table presents certain information relating to the historical operating performance and Underwritten Net Cash Flow at the Brookstone Park Apartments Property:
Cash Flow Analysis
2013(1) | TTM 9/30/2014(1) | U/W(1) | U/W $ per Unit | |||||||
| Unit Count | 128 | 203 | 240 | |||||||
| Base Rent | $1,720,010 | $2,862,194 | $3,081,864 | $12,841 | ||||||
| Loss to Lease & Concessions | (81,379) | (94,625) | (50,844 | ) | (212 | ) | ||||
| Other Income | 88,828 | 117,443 | 143,835 | 599 | ||||||
| Less Vacancy & Credit Loss | (251,102) | (913,317) | (180,184 | )(2) | (751 | ) | ||||
| Effective Gross Income | $1,476,357 | $1,971,695 | $2,994,671 | $12,478 | ||||||
| Total Operating Expenses | $574,403 | $826,430 | $1,001,653 | $4,174 | ||||||
| Net Operating Income | $901,954 | $1,145,265 | $1,993,018 | $8,304 | ||||||
| Capital Expenditures | 0 | 0 | 48,000 | 200 | ||||||
| Net Cash Flow | $901,954 | $1,145,265 | $1,945,018 | $8,104 | ||||||
| NOI DSCR | 0.62x | 0.79x | 1.38x | |||||||
| NCF DSCR | 0.62x | 0.79x | 1.35x | |||||||
| NOI DY | 3.7% | 4.7% | 8.1% | |||||||
| NCF DY | 3.7% | 4.7% | 7.9% |
| (1) | The sponsors developed the Brookstone Park Apartments Property in two phases. Phase I, consisting of 128 units, was completed at the end of 2011 and Phase II, consisting of 112 units, was completed in early 2014. |
| (2) | The underwritten economic vacancy is 5.6%. The Brookstone Park Apartments Property was 94.6% physically occupied as of October 20, 2014. |
Appraisal. As of the appraisal valuation date of October 9, 2014, the Brookstone Park Apartments Property had an “as-is” appraised value of $33,000,000.
Environmental Matters. According to a Phase I environmental assessment dated October 16, 2014, there was no evidence of any recognized environmental conditions at the Brookstone Park Apartments Property.
Market Overview and Competition. The Brookstone Park Apartments Property is located in Covington, Louisiana, which is part of the New Orleans metropolitan statistical area, approximately 40 miles north of New Orleans. Regional access to the local area is provided by Highway 21, a four-lane roadway that extends north towards US 190 and veers westward to Baton Rouge and Interstate 12 which is the major east-west thoroughfare in the St. Tammany Parish. Since Hurricane Katrina, Highway 21 has seen a substantial amount of new retail development and has become the primary growth corridor within western St. Tammany Parish. New developments include the River Chase Center, a 253-acre master planned, mixed-use development with 605,000 square feet of retail space anchored by Target and Sam’s Club, and the Pinnacle Nor du Lac, a 300,000 square foot shopping plaza, anchored by Kohl’s and Hobby Lobby. Western St. Tammany Parish has seen a number of companies relocate to the area and, according to the appraisal, 5,243 jobs have been added to the parish between 2010 and 2013. The 2014 estimated population within a one-, three- and five-mile radius of the Brookstone Park Apartments Property was 2,523, 16,523 and 45,775, respectively. The average household income within the same one-, three- and five-mile radius was $116,329, $93,040 and $95,292, respectively. The appraisal identified a competitive set of six multifamily properties, which exhibit a 5.6% average vacancy rate and average asking rents range of $832-$999 per month for one-bedroom units, $1,158-$1,310 per month for two-bedroom units and $1,419 per month for three-bedroom units.
The following table presents certain information relating to some comparable multifamily properties for the Brookstone Park Apartments Property:
Competitive Set(1)
| Brookstone Park Apartments (Subject) | Chenier | Brewster Apartments | Abita View | Ibis Trail at Covington | Chapel Creek | Botanica | |
| Location | Covington, LA | Mandeville, LA | Covington, LA | Covington, LA | Covington, LA | Mandeville, LA | Mandeville, LA |
| Distance to Subject | -- | 7 miles | 1 mile | 4 miles | 5 miles | 4 miles | 6 miles |
| Property Type | Garden | Garden | Garden | Garden | Garden | Garden | Garden |
| Number of Units | 240 | 288 | 240 | 140 | 264 | 168 | 228 |
| Average Rent (per unit) | |||||||
| 1 Bedroom | $832-$999 | $895-$1,795 | $938-$993 | $945 | $969 | $920-$1,025 | $860-$935 |
| 2 Bedroom | $1,158-$1,310 | $1,265-$1,510 | $1,235-$1,350 | $1,085 | $1,132 | $1,175-$1,480 | $1,039-$1,109 |
| 3 Bedroom | $1,419 | NAP | $1,413-$1,475 | $1,340 | $1,208 | $1,650 | $1,409-$1,459 |
| Utilities | Paid by tenant | Trash, Pest | Water/Sewer, Trash, Pest | Trash, Pest | Trash, Pest | Trash, Pest | Trash, Pest |
| Total Occupancy | 95% | 95% | 95% | 92% | 90% | 95% | 98% |
| (1) | Information obtained from the appraisal and underwritten rent roll. |
THE INFORMATION IN THIS STRUCTURAL AND COLLATERAL TERM SHEET IS NOT COMPLETE AND MAY BE AMENDED PRIOR TO THE TIME OF SALE. THIS TERM SHEET IS NOT AN OFFER TO SELL THESE SECURITIES AND IT IS NOT A SOLICITATION OF AN OFFER TO BUY THESE SECURITIES IN ANY JURISDICTION WHERE THE OFFER OR SALE IS NOT PERMITTED.
106
| BROOKSTONE PARK APARTMENTS |
The Borrower. The borrower is PPQ Northshore L.L.C., a special purpose entity. Quentin Dastugue, Paul Dastugue and Pratt Provosty are the guarantors of certain nonrecourse carveouts under the Brookstone Park Apartments Mortgage Loan.
The Sponsors. The sponsors are Quentin Dastugue, Paul Dastugue and Pratt Provosty. Over his 20-plus year career, Pratt Provosty has experience as a commercial real estate broker, operator, asset manager, loan underwriter and originator. In 2001, Mr. Provosty teamed up with the Dastugue brothers and formed PPQ Development, LLC (“PPQ”). Since joining PPQ, Mr. Provosty has been responsible for the acquisition and/or development of approximately 800 apartment units and several of the complexes have been either sold or converted to condominiums. Paul Dastugue has been involved in commercial property development, leasing, and property management since 1973 and co-founded Property One, Inc. with his brother in 1985. Quentin Dastugue is CEO and co-founder of Property One, Inc., the property manager of the Brookstone Park Apartments Property. Mr. Dastugue has more than 24 years of experience in the commercial real estate industry, including leasing, investment deals, development, property management, construction project management, and consulting. During the same period, Mr. Dastugue served four consecutive terms as a Louisiana State Representative.
Escrows. The loan documents provide for upfront reserves in the amount of $198,902 for taxes, $67,230 for insurance and $4,000 for replacement reserves. The loan documents also provide for ongoing monthly reserves in the amount of $24,161 for taxes, $8,404 for insurance and $4,000 for replacement reserves.
Lockbox and Cash Management. The Brookstone Park Apartments Mortgage Loan requires a lender-controlled lockbox account, which is already in place, and that all rents received by the borrower or the property manager be deposited into the lockbox account within two business days after receipt. Upon the occurrence of a Cash Management Trigger Event (as defined below), all funds on deposit in the lockbox account are swept to a lender-controlled cash management account each business day. Upon the occurrence and during the continuation of any Cash Management Trigger Event, the remaining cash flow will be held by the lender as additional collateral for the Brookstone Park Apartments Mortgage Loan.
A “Cash Management Trigger Event” will commence (i) December 1, 2024; (ii) upon the occurrence and continuance of an event of default; or (iii) after the first six months of the loan, upon the amortizing debt service coverage ratio falling below 1.10x. A Cash Management Trigger Event will end, with respect to clause (i), the Brookstone Park Apartments Mortgage Loan and all other obligations under the loan documents have been repaid in full; (ii), upon the cure of such event of default; and with respect to clause (iii), upon the date that the amortizing debt service coverage ratio is greater than 1.10x for two consecutive quarters.
Property Management. The Brookstone Park Apartments Property is managed by an affiliate of the borrower.
Assumption. The borrower has a right to transfer the Brookstone Park Apartments Property, provided that no event of default has occurred and is continuing and certain other conditions are satisfied, including (i) the lender’s reasonable determination that the proposed transferee and guarantor satisfy the lender’s credit review and underwriting standards, taking into consideration transferee experience, financial strength and creditworthiness; (ii) the execution of a recourse guaranty and an environmental indemnity by an affiliate of the transferee; and (iii) if requested by the lender, the receipt of a rating agency confirmation from DBRS, Moody’s and Morningstar that the transfer will not result in a downgrade, withdrawal or qualification of the respective ratings assigned to the Series 2014-C25 Certificates.
Partial Release. Not permitted.
Real Estate Substitution. Not permitted.
Subordinate and Mezzanine Indebtedness. Not permitted.
Ground Lease. None
Terrorism Insurance. The loan documents require that the “all risk” insurance policy required to be maintained by the borrower provides coverage for terrorism in an amount equal to the full replacement cost of the Brookstone Park Apartments Property, as well as business interruption insurance covering no less than the 18-month period following the occurrence of a casualty event, together with a six month extended period of indemnity.
Windstorm Insurance. The loan documents require windstorm insurance covering the full replacement cost of the Brookstone Park Apartments Property. At the time of loan closing, the Brookstone Park Apartments Property had insurance coverage for windstorm.
THE INFORMATION IN THIS STRUCTURAL AND COLLATERAL TERM SHEET IS NOT COMPLETE AND MAY BE AMENDED PRIOR TO THE TIME OF SALE. THIS TERM SHEET IS NOT AN OFFER TO SELL THESE SECURITIES AND IT IS NOT A SOLICITATION OF AN OFFER TO BUY THESE SECURITIES IN ANY JURISDICTION WHERE THE OFFER OR SALE IS NOT PERMITTED.
107
| CLARKWOOD GREENS |
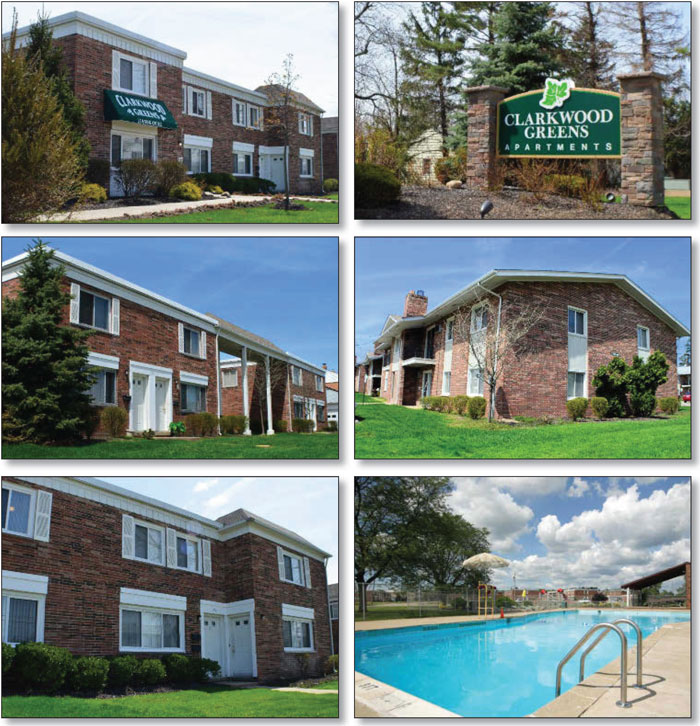
THE INFORMATION IN THIS STRUCTURAL AND COLLATERAL TERM SHEET IS NOT COMPLETE AND MAY BE AMENDED PRIOR TO THE TIME OF SALE. THIS TERM SHEET IS NOT AN OFFER TO SELL THESE SECURITIES AND IT IS NOT A SOLICITATION OF AN OFFER TO BUY THESE SECURITIES IN ANY JURISDICTION WHERE THE OFFER OR SALE IS NOT PERMITTED.
108
| CLARKWOOD GREENS |
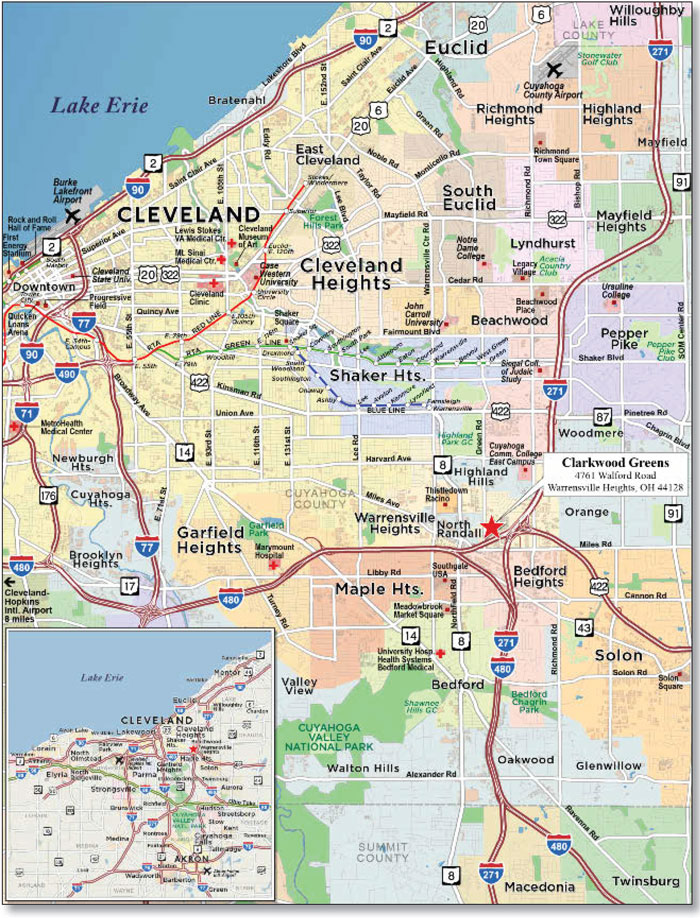
THE INFORMATION IN THIS STRUCTURAL AND COLLATERAL TERM SHEET IS NOT COMPLETE AND MAY BE AMENDED PRIOR TO THE TIME OF SALE. THIS TERM SHEET IS NOT AN OFFER TO SELL THESE SECURITIES AND IT IS NOT A SOLICITATION OF AN OFFER TO BUY THESE SECURITIES IN ANY JURISDICTION WHERE THE OFFER OR SALE IS NOT PERMITTED.
109
| No. 10 - Clarkwood Greens | ||||
| Loan Information | Property Information | |||
| Mortgage Loan Seller: | Rialto Mortgage Finance, LLC | Single Asset/Portfolio: | Single Asset | |
| Credit Assessment (DBRS/Moody’s/Morningstar): | NR/NR/NR | Property Type: | Multifamily | |
| Original Principal Balance: | $23,600,000 | Specific Property Type: | Garden | |
| Cut-off Date Principal Balance: | $23,600,000 | Location: | Warrensville Heights, OH | |
| % of Initial Pool Balance: | 2.7% | Size: | 568 Units | |
| Loan Purpose: | Refinance | Cut-off Date Principal Balance Per Unit: | $41,549 | |
| Borrower Name: | Clarkwood Apartments Ltd. | Year Built/Renovated: | 1963/2014 | |
| Sponsor: | Michael Gibbons | Title Vesting: | Fee | |
| Mortgage Rate: | 4.580% | Property Manager: | AIY Properties, Inc. | |
| Note Date: | November 5, 2014 | 3rd Most Recent Occupancy(2): | NAV | |
| Anticipated Repayment Date: | NAP | 2nd Most Recent Occupancy(2): | NAV | |
| Maturity Date: | Most Recent Occupancy (As of): | 93.0% (7/31/2013) | ||
| IO Period: | 36 months | Current Occupancy (As of): | 93.1% (10/7/2014) | |
| Loan Term (Original): | 120 months | |||
| Seasoning: | 1 month | Underwriting and Financial Information: | ||
| Amortization Term (Original): | 360 months | |||
| Loan Amortization Type: | Interest-only, Amortizing Balloon | 3rd Most Recent NOI (As of): | $1,525,985 (12/31/2012) | |
| Interest Accrual Method: | Actual/360 | 2nd Most Recent NOI (As of): | $1,773,214 (12/31/2013) | |
| Call Protection: | L(25),D(91),O(4) | Most Recent NOI (As of) (3): | $2,137,372 (TTM 9/30/2014) | |
| Lockbox Type: | ||||
| Additional Debt: | None | U/W Revenues: | $4,870,459 | |
| Additional Debt Type: | NAP | U/W Expenses: | $2,633,309 | |
U/W NOI(3): | $2,237,150 | |||
U/W NCF(3): | $2,095,150 | |||
| U/W NOI DSCR: | 1.54x | |||
Escrows and Reserves(1): | U/W NCF DSCR: | 1.45x | ||
| U/W NOI Debt Yield: | 9.5% | |||
Type: | Initial | Monthly | Cap (If Any) | U/W NCF Debt Yield: | 8.9% | |
| Taxes | $229,842 | $43,779 | NAP | As-Is Appraised Value: | $31,500,000 | |
| Insurance | $11,859 | NAP | As-Is Appraisal Valuation Date: | September 22, 2014 | ||
| Replacement Reserves | $0 | $11,833 | $426,000 | Cut-off Date LTV Ratio: | 74.9% | |
| Deferred Maintenance | $18,480 | NAP | LTV Ratio at Maturity or ARD: | 65.7% | ||
| (1) | See “Escrows” section. |
| (2) | The sponsor acquired the Clarkwood Greens Property in September 2013 and historical occupancy information was not available. |
| (3) | See “Cash Flow Analysis” section. |
The Mortgage Loan. The mortgage loan (the “Clarkwood Greens Mortgage Loan”) is evidenced by a single promissory note that is secured by a first mortgage encumbering a garden-style multifamily property located in Warrensville Heights, Ohio (the “Clarkwood Greens Property”). The Clarkwood Greens Mortgage Loan was originated on November 5, 2014 by Rialto Mortgage Finance, LLC. The Clarkwood Greens Mortgage Loan had an original principal balance of $23,600,000, has an outstanding principal balance as of the Cut-off Date of $23,600,000 and accrues interest at an interest rate of 4.580% per annum. The Clarkwood Greens Mortgage Loan had an initial term of 120 months, has a remaining term of 119 months as of the Cut-off Date and requires payments of interest-only for the first 36 payments following origination and, thereafter, requires payments of principal and interest based on a 30-year amortization schedule. The Clarkwood Greens Mortgage Loan matures on November 6, 2024.
Following the lockout period, the borrower has the right to defease the Clarkwood Greens Mortgage Loan in whole, but not in part, on any date before August 6, 2024. In addition, the Clarkwood Greens Mortgage Loan is prepayable without penalty on or after August 6, 2024.
Sources and Uses
| Sources | Uses | |||||||
| Original loan amount | $23,600,000 | 100.0% | Loan payoff | $19,082,435 | 80.9% | |||
| Reserves | 285,678 | 1.2 | ||||||
| Closing costs | 372,553 | 1.6 | ||||||
| Return of equity | 3,859,334 | 16.4 | ||||||
| Total Sources | $23,600,000 | 100.0% | Total Uses | $23,600,000 | 100.0% |
THE INFORMATION IN THIS STRUCTURAL AND COLLATERAL TERM SHEET IS NOT COMPLETE AND MAY BE AMENDED PRIOR TO THE TIME OF SALE. THIS TERM SHEET IS NOT AN OFFER TO SELL THESE SECURITIES AND IT IS NOT A SOLICITATION OF AN OFFER TO BUY THESE SECURITIES IN ANY JURISDICTION WHERE THE OFFER OR SALE IS NOT PERMITTED.
110
| CLARKWOOD GREENS |
The Property. The Clarkwood Greens Property is a class B, garden-style multifamily property located in Warrensville Heights, Ohio, approximately 10 miles southeast of the Cleveland central business district. The Clarkwood Greens Property is situated on approximately 30.9 acres and comprises 568 units in 25 buildings. The improvements were built in 1963 and were recently renovated in 2013 and 2014. Since the acquisition of the Clarkwood Greens Property in 2013, the borrower reportedly invested approximately $449,196 in capital expenditures. Common area amenities include an outdoor swimming pool, a picnic area, covered parking, a playground, on-site laundry, storage lockers and on-site management. The Clarkwood Greens Property contains 763 parking spaces, reflecting an overall parking ratio of 1.3 spaces per unit. As of October 7, 2014, the Clarkwood Greens Property was 93.1% occupied.
The following table presents certain information relating to the unit mix of the Clarkwood Greens Property:
Unit Mix Summary(1)
| Unit Type | No. of Units | % of Total Units | Average Unit Size (SF) | Average U/W Monthly Rent per Unit |
| 1 Bedroom | 56 | 9.9% | 700 | $656 |
| 2 Bedroom | 245 | 43.1% | 804 | $686 |
| 3 Bedroom | 235 | 41.4% | 1,146 | $819 |
| Total/Weighted Average | 568 | 100.0% | 965 | $750 |
| (1) | Information obtained from the underwritten rent roll. |
The following table presents historical occupancy percentages at the Clarkwood Greens Property:
Historical Occupancy
12/31/2011(1) | 12/31/2012(1) | 7/31/2013(2) | 10/7/2014(3) | |||
| NAV | NAV | 93.0% | 93.1% |
| (1) | The sponsor acquired the Clarkwood Greens Property in September 2013 and historical occupancy information was not available. |
| (2) | Information obtained from the borrower. |
| (3) | Information obtained from the underwritten rent roll. |
THE INFORMATION IN THIS STRUCTURAL AND COLLATERAL TERM SHEET IS NOT COMPLETE AND MAY BE AMENDED PRIOR TO THE TIME OF SALE. THIS TERM SHEET IS NOT AN OFFER TO SELL THESE SECURITIES AND IT IS NOT A SOLICITATION OF AN OFFER TO BUY THESE SECURITIES IN ANY JURISDICTION WHERE THE OFFER OR SALE IS NOT PERMITTED.
111
| CLARKWOOD GREENS |
Operating History and Underwritten Net Cash Flow. The following table presents certain information relating to the historical operating performance and Underwritten Net Cash Flow at the Clarkwood Greens Property:
Cash Flow Analysis
| 2012 | 2013 | TTM 9/30/2014 | U/W(1) | U/W $ per Unit | |||||||
| Base Rent | $4,878,810 | $5,203,976 | $5,365,972 | $4,753,692 | $8,369 | ||||||
| Grossed Up Vacant Space | 0 | 0 | 0 | 360,828 | 635 | ||||||
| Concessions | 0 | (218,742) | (360,576) | (107,736) | (190) | ||||||
| Other Income | 380,625 | 381,576 | 456,310 | 380,503 | 670 | ||||||
| Less Vacancy & Credit Loss | (752,055) | (554,044) | (541,312) | (516,828)(2) | (910) | ||||||
| Effective Gross Income | $4,507,380 | $4,812,767 | $4,920,392 | $4,870,459 | $8,575 | ||||||
| Total Operating Expenses | $2,981,395 | $3,039,553 | $2,783,020 | $2,633,309 | $4,636 | ||||||
| Net Operating Income | $1,525,985 | $1,773,214 | $2,137,372 | $2,237,150 | $3,939 | ||||||
| Capital Expenditures | 0 | 0 | 0 | 142,000 | 250 | ||||||
| Net Cash Flow | $1,525,985 | $1,773,214 | $2,137,372 | $2,095,150 | $3,689 | ||||||
| NOI DSCR | 1.05x | 1.22x | 1.48x | 1.54x | |||||||
| NCF DSCR | 1.05x | 1.22x | 1.48x | 1.45x | |||||||
| NOI DY | 6.5% | 7.5% | 9.1% | 9.5% | |||||||
| NCF DY | 6.5% | 7.5% | 9.1% | 8.9% |
| (1) | The increase in Net Operating Income and Net Cash Flow from TTM 9/30/2014 to the U/W is primarily due to the sponsor’s reduction of both operating expenses and concessions offered at the property |
| (2) | The underwritten economic vacancy is 12.2%. The Clarkwood Greens Property was 93.1% physically occupied as of October 7, 2014. |
Appraisal. As of the appraisal valuation date of September 22, 2014, the Clarkwood Greens Property had an “as-is” appraised value of $31,500,000.
Environmental Matters. According to a Phase I environmental assessment dated September 18, 2014, there was no evidence of any recognized environmental conditions at the Clarkwood Greens Property.
Market Overview and Competition. The Clarkwood Greens Property is located in Warrensville Heights, Ohio, approximately 10 miles southeast of the Cleveland central business district. Regional access to the area is provided by Interstate 71, Interstate 77, and Interstate 90. Interstates 71 and 77 are major north-south thoroughfares providing access to the Cleveland central business district to the north and through Columbus and Akron, Ohio, respectively, to the south. Interstate 90 is a major east-west thoroughfare. Approximately two miles northeast of the Clarkwood Greens Property is the University Hospital’s Ahuja Medical Center, a $300 million medical center that opened in 2011. The corporate headquarters of Eaton Corporation is located just west of the medical center. After an $88 million renovation the Thistledown Race Track re-opened in 2013 and now offers over 1,150 video lottery terminals, seasonal live racing as well as year-round simulcast racing. The 2014 population within a one-, three- and five-mile radius of the property was 8,281, 68,169 and 188,856, respectively. The average household income within the same one-, three- and five-mile radius was $37,336, $56,425 and $67,149, respectively. The appraisal identified a competitive set of seven multifamily properties, which exhibit a 5.3% average vacancy rate. According to a third party market research report, the Clarkwood Greens Property is located in the Bedford/Garfield Heights/Bedford Heights submarket, which reported a second quarter 2014 average vacancy rate of 3.0%.
The following table presents certain information relating to some comparable multifamily properties for the Clarkwood Greens Property:
Competitive Set(1)
Clarkwood Greens Property (Subject) | Trinity Towers Property | Granada Gardens Property | Highland Woods Property | Rockside Park Property | Columbus Park Property | Emerick Manor Property | Huntington Green Property | |
| Location | Warrensville Heights | Bedford Heights | Warrensville Heights | Warrensville Heights | Bedford Heights | Bedford Heights | Warrensville Heights | University Heights |
| Distance to Subject | -- | 2 miles | 1 mile | <1 mile | 3 miles | 4 miles | 1 mile | 6 miles |
| Property Type | Garden | Mid-Rise | Garden | Mid-Rise | Mid-Rise | Mid-Rise | Mid-Rise | Mid-Rise |
| Number of Units | 568 | 499 | 940 | 663 | 536 | 623 | 131 | 426 |
| Average Monthly Rent (per unit) | ||||||||
| 0-1 Bedroom | $656 | $612 | $629-$654 | $605 | $690 | $514 | $645 | $705-$920 |
| 2 Bedroom | $655-$759 | $769 | $739-$819 | $724 | $797-$832 | $662 | $710 | $760-$1,170 |
| 3 Bedroom | $776-$829 | $904 | $805-$934 | $860 | $974-$992 | $899 | $843 | $1,340 |
| 4 Bedroom | $909 | N/A | $869 | N/A | N/A | N/A | N/A | N/A |
| Utilities | Some Incl. | Some Incl. | Some Incl. | Some Incl. | Some Incl. | Some Incl. | Some Incl. | Some Incl. |
| Total Occupancy | 93% | 98% | 95% | 89% | 96% | 97% | 96% | 94% |
| (1) | Information obtained from the appraisal and underwritten rent roll. |
THE INFORMATION IN THIS STRUCTURAL AND COLLATERAL TERM SHEET IS NOT COMPLETE AND MAY BE AMENDED PRIOR TO THE TIME OF SALE. THIS TERM SHEET IS NOT AN OFFER TO SELL THESE SECURITIES AND IT IS NOT A SOLICITATION OF AN OFFER TO BUY THESE SECURITIES IN ANY JURISDICTION WHERE THE OFFER OR SALE IS NOT PERMITTED.
112
| CLARKWOOD GREENS |
The Borrower. The borrower is Clarkwood Apartments Ltd., a single purpose entity with one independent director. Legal counsel to the borrower delivered a non-consolidation opinion in connection with the origination of the Clarkwood Greens Mortgage Loan. Michael E. Gibbons is the guarantor of certain nonrecourse carveouts under the Clarkwood Greens Mortgage Loan. Michael E. Gibbons also serves as the guarantor of certain nonrecourse carveouts for the Granada Gardens Mortgage Loan, which has a cut-off date principal balance of $34,500,000 and will be contributed to the WFRBS 2014-C25 Trust. See “Description of the Mortgage Pool—Statistical Characteristics of the Mortgage Loans—Multi-Property Mortgage Loans and Related Borrower Mortgage Loans” in the Free Writing Prospectus.
The Sponsor. The sponsor, Michael E. Gibbons, is a senior managing director and principal of Brown Gibbons Lang & Company, an independent investment bank serving middle market companies worldwide. He is also on the board of directors for Associated Estates Realty Corporation, a publically traded REIT specializing in owning and managing apartment communities. Associated Estates Realty Corporation currently owns a portfolio of 53 properties totaling more than 13,908 apartment units in eight states. Over the past 30 years, Mr. Gibbons has purchased, managed and sold approximately 7,000 apartment units.
Escrows. The loan documents provide for upfront escrows in the amount of $229,842 for real estate taxes, $37,356 for insurance and $18,480 for deferred maintenance. The loan documents also provide for ongoing monthly reserves in the amount of $43,779 for taxes, $11,859 for insurance and $11,833 for replacement reserves (subject to a cap of $426,000).
Lockbox and Cash Management. Upon the occurrence of a Cash Management Trigger Event (as defined below), the Clarkwood Greens Mortgage Loan requires the borrower to (i) establish a lender-controlled lockbox account and (ii) direct the manager to deliver all receipts payable (and other amounts received) with respect to the Clarkwood Greens Property directly into the lockbox account within two business days of receipt.
In the absence of any Cash Sweep Event (as defined below), all funds in the cash management account will be applied by the lender to payments of debt service, required reserves, approved operating expenses and other items required under the loan documents and the remaining cash flow (the “Remaining Cash Flow”) will be released to the borrower. Upon the occurrence and during the continuation of any Cash Sweep Event (other than an event of default), the Remaining Cash Flow will be held by the lender as additional collateral for the Clarkwood Greens Mortgage Loan.
A “Cash Management Trigger Event” will commence (i) upon the occurrence and continuance of an event of default; (ii) upon the bankruptcy or insolvency of the borrower, guarantor or property manager; or (iii) upon the amortizing debt service coverage ratio falling below 1.20x based on the trailing 12 month period. A Cash Management Trigger Event will end, with respect to clause (i) above, upon the cure of such event of default; with respect to clause (ii) above, upon the date such bankruptcy petition has been discharged, stayed, or dismissed among other conditions; or with respect to clause (iii) above, upon the amortizing debt service coverage ratio being above 1.20x based on the trailing 12 month period.
A “Cash Sweep Event” will commence (i) upon the occurrence and continuance of an event of default; (ii) upon the bankruptcy or insolvency of borrower, guarantor or property manager; or (iii) upon the amortizing debt service coverage ratio falling below 1.20x based on the trailing 12 month period. A Cash Sweep Event will end, with respect to clause (i) above, upon the cure of such event of default; with respect to clause (ii) above, upon the date such bankruptcy petition has been discharged, stayed, or dismissed among other conditions; or with respect to clause (iii) above, upon the amortizing debt service coverage ratio being above 1.20x based on the trailing 12 month period.
Property Management. The Clarkwood Greens Property is managed by AIY Properties, Inc.
Assumption. The borrower has the right to transfer the Clarkwood Greens Property, provided that no event of default has occurred and is continuing and certain other conditions are satisfied, including (i) the payment of a 1% assumption fee, (ii) the lender’s reasonable determination that the proposed transferee and guarantor satisfy the lender’s credit review and underwriting standards, taking into consideration transferee experience, financial strength and general business standing; (iii) execution of a recourse guaranty and an environmental indemnity by an affiliate of the transferee; and (iv) if requested by the lender, rating agency confirmation from DBRS, Moody’s and Morningstar that the transfer will not result in a downgrade, withdrawal or qualification of the respective ratings assigned to the Series 2014-C25 Certificates.
Partial Release. Not permitted.
Real Estate Substitution. Not permitted.
Subordinate and Mezzanine Indebtedness. Not permitted.
Ground Lease. None
Terrorism Insurance. The loan documents require that the “all risk” insurance policy required to be maintained by the borrower provides coverage for terrorism in an amount equal to the full replacement cost of the Clarkwood Greens Property, as well as business interruption insurance covering no less than the 12-month period following the occurrence of a casualty event, together with a 12 month extended period of indemnity.
THE INFORMATION IN THIS STRUCTURAL AND COLLATERAL TERM SHEET IS NOT COMPLETE AND MAY BE AMENDED PRIOR TO THE TIME OF SALE. THIS TERM SHEET IS NOT AN OFFER TO SELL THESE SECURITIES AND IT IS NOT A SOLICITATION OF AN OFFER TO BUY THESE SECURITIES IN ANY JURISDICTION WHERE THE OFFER OR SALE IS NOT PERMITTED.
113
| No. 11 – DoubleTree - Virginia Beach | |||||||
| Loan Information | Property Information | ||||||
| Mortgage Loan Seller: | Basis Real Estate Capital II, LLC | Single Asset/Portfolio: | Single Asset | ||||
Credit Assessment (DBRS/Moody’s/Morningstar): | NR/NR/NR | Property Type: | Hospitality | ||||
| Original Principal Balance: | $20,000,000 | Specific Property Type: | Full Service | ||||
| Cut-off Date Principal Balance: | $20,000,000 | Location: | Virginia Beach, VA | ||||
| % of Initial Pool Balance: | 2.3% | Size: | 292 rooms | ||||
| Loan Purpose: | Refinance | Cut-off Date Principal Balance Per Room: | $68,493 | ||||
| Borrower Name: | 1900 Pavilion, LLC | Year Built/Renovated: | 1983/2014 | ||||
| Sponsor: | Mark F. Garcea and Page S. Johnson, II | Title Vesting: | Fee | ||||
| Mortgage Rate: | 4.400% | Property Manager: | Harmony Hospitality Inc. | ||||
| Note Date: | November 5, 2014 | 3rd Most Recent Occupancy (As of): | 83.3% (12/31/2011) | ||||
| Anticipated Repayment Date: | NAP | 2nd Most Recent Occupancy (As of)(6): | 64.6% (12/31/2012) | ||||
| Maturity Date: | December 1, 2024 | Most Recent Occupancy (As of)(6): | 49.4% (12/31/2013) | ||||
| IO Period: | 36 months | Current Occupancy (As of): | 53.2% (9/30/2014) | ||||
| Loan Term (Original): | 120 months | ||||||
| Seasoning: | 0 months | ||||||
| Amortization Term (Original): | 360 months | Underwriting and Financial Information: | |||||
| Loan Amortization Type: | Interest-only, Amortizing Balloon | ||||||
| Interest Accrual Method: | Actual/360 | 3rd Most Recent NOI (As of): | $2,751,975 (12/31/2012) | ||||
| Call Protection: | L(24),D(93),O(3) | 2nd Most Recent NOI (As of)(6): | $1,624,316 (12/31/2013) | ||||
| Lockbox Type: | Springing (Without Established Account) | Most Recent NOI (As of): | $2,397,590 (TTM 9/30/2014) | ||||
| Additional Debt: | None | ||||||
| Additional Debt Type: | NAP | U/W Revenues: | $8,230,169 | ||||
| U/W Expenses: | $5,858,148 | ||||||
| U/W NOI: | $2,372,021 | ||||||
Escrows and Reserves: | U/W NCF: | $2,042,814 | |||||
| U/W NOI DSCR: | 1.97x | ||||||
Type: | Initial | Monthly | Cap (If Any) | U/W NCF DSCR: | 1.70x | ||
| Taxes | $92,199 | (1) | NAP | U/W NOI Debt Yield: | 11.9% | ||
| Insurance | $164,638 | (1) | NAP | U/W NCF Debt Yield: | 10.2% | ||
Renovation Reserve(2) | $2,110,000 | $0 | NAP | As-Is Appraised Value: | $33,600,000 | ||
| FF&E Reserve | $0 | (3) | NAP | As-Is Appraisal Valuation Date: | October 14, 2014 | ||
Seasonality Reserve(4) | $500,000 | Springing | $500,000 | Cut-off Date LTV Ratio: | 59.5% | ||
Case Goods Reserve(5) | $0 | Springing | NAP | LTV Ratio at Maturity or ARD: | 52.0% | ||
| (1) | Ongoing escrows for taxes and insurance will be payable each year on June 1, July 1, August 1, and September 1. These collections are sufficient to cover the full year’s tax and insurance escrow obligation. |
| (2) | A Renovation Reserve of $2,110,000 was deposited at closing. This reserve will be used to upgrade the exterior and lobby of the DoubleTree - Virginia Beach Property. |
| (3) | Collections of the FF&E Reserve will be suspended for the first year of the mortgage loan. Starting in 2016, the FF&E reserves will be due each year in June, July, August and September (based on 4% of the hotel’s total revenues achieved in the previous year of the mortgage loan, but never less than $82,500 per month). |
| (4) | A Seasonality Reserve of $500,000 was deposited at closing, which will be used to cover projected debt service shortfalls during the non-summer months. The reserve must be replenished to $500,000 from available excess cash flow in June, July, August, and September of each year. |
| (5) | A Case Goods Reserve of $350,000 will be taken during the first year of the mortgage loan based on four monthly payments of $87,500 in June, July, August, and September of 2015. The funds will be used no later than December 2016 to fund the purchase of new case goods for half of the hotel’s guest rooms. The borrower is then obligated to replenish the account by an additional $350,000 in order to fund the purchase of new case goods for the remainder of the hotel’s guest rooms no later than December 2017. The borrower is obligated under the loan documents to replace the case goods. The Case Goods Reserve is guaranteed by the guarantors (Mark F. Garcea and Page S. Johnson II). |
| (6) | See “Cash Flow Analysis” section. |
The DoubleTree - Virginia Beach mortgage loan is evidenced by a single promissory note that is secured by a first mortgage encumbering a 12-story, full service hotel located in Virginia Beach, Virginia (the “DoubleTree - Virginia Beach Property”). Built in 1983, the DoubleTree - Virginia Beach Property comprises 292 guestrooms and was last renovated in 2013-2014 at a cost of $2.5 million (inclusive of a $1.98 million property improvement plan (“PIP”)). The DoubleTree - Virginia Beach Property is located adjacent to the Virginia Beach Convention Center, with immediate access to Interstate 264 East. The DoubleTree - Virginia Beach Property is an approximately 15 minute drive southeast to the nearest airport and eight blocks west of Virginia Beach. Guest rooms include either one king size bed or two double beds. Hotel amenities include a pool, fitness room, business center and self-service guest laundry facilities. All rooms include 37” flat screen televisions, refrigerators, microwaves and work desks. The DoubleTree - Virginia Beach Property underwent a renovation in 2013-2014 that included the installation of new carpeting and vinyl flooring and painting of all guestrooms. The renovation also included new chairs, new vanities, mirrors and bathroom fixtures in each of the guestroom bathrooms, new light fixtures, furniture drapes, carpeting and vinyl flooring in the public spaces and upgrades to the elevators. The DoubleTree - Virginia Beach Property operates under a franchise agreement with Hilton, which expires in June 2025.
THE INFORMATION IN THIS STRUCTURAL AND COLLATERAL TERM SHEET IS NOT COMPLETE AND MAY BE AMENDED PRIOR TO THE TIME OF SALE. THIS TERM SHEET IS NOT AN OFFER TO SELL THESE SECURITIES AND IT IS NOT A SOLICITATION OF AN OFFER TO BUY THESE SECURITIES IN ANY JURISDICTION WHERE THE OFFER OR SALE IS NOT PERMITTED.
114
| DOUBLETREE - VIRGINIA BEACH |
Sources and Uses
| Sources | Uses | ||||||||
| Original loan amount | $20,000,000 | 100.0% | Loan payoff | $12,608,470 | 63.0 | % | |||
| Reserves | 2,866,837 | 14.3 | |||||||
| Closing costs | 448,786 | 2.2 | |||||||
| Return of equity | 4,075,907 | 20.4 | |||||||
| Total Sources | $20,000,000 | 100.0% | Total Uses | $20,000,000 | 100.0 | % |
Subject and Market Historical Occupancy, ADR and RevPAR(1)
Competitive Set | DoubleTree - Virginia Beach | Penetration Factor | |||||||||||||||
Year | Occupancy | ADR | RevPAR | Occupancy | ADR | RevPAR | Occupancy | ADR | RevPAR | ||||||||
| 8/31/2014 TTM | 60.3% | $121.17 | $73.10 | 53.0% | $115.61 | $61.22 | 87.8% | 95.4% | 83.7% | ||||||||
| 8/31/2013 TTM | 60.3% | $117.32 | $70.76 | 50.8% | $108.71 | $55.19 | 84.2% | 92.7% | 78.0% | ||||||||
| 8/31/2012 TTM | 61.6% | $113.84 | $70.13 | 74.5% | $97.29 | $72.44 | 120.9% | 85.5% | 103.3% | ||||||||
| (1) | Information obtained from a third party hospitality report dated September 18, 2014. The competitive set includes the following hotels: Holiday Inn Virginia Beach Norfolk, Sheraton Virginia Beach Oceanfront, Crown Plaza Virginia Beach Town Center, Wyndham Virginia Beach and Hilton Garden Inn Virginia Beach Town Center. |
Operating History and Underwritten Net Cash Flow. The following table presents certain information relating to the historical operating performance and the Underwritten Net Cash Flow at the DoubleTree - Virginia Beach Property:
Cash Flow Analysis
2012(1) | 2013(1) | TTM 9/30/2014(1) | U/W | U/W $ per Room | ||||||
| Occupancy | 64.6% | 49.4% | 53.2% | 53.2% | ||||||
| ADR | $99.83 | $108.98 | $114.23 | $114.23 | ||||||
| RevPAR | $64.52 | $64.52 | $60.77 | $60.77 | ||||||
| Total Revenue | $8,819,003 | $7,264,845 | $8,230,169 | $8,230,169 | $28,186 | |||||
| Total Department Expenses | 2,814,460 | 2,458,538 | 2,529,838 | 2,529,838 | 8,664 | |||||
| Gross Operating Profit | $6,004,543 | $4,806,307 | $5,700,331 | $5,700,331 | $19,522 | |||||
| Total Undistributed Expenses | 2,941,995 | 2,827,070 | 2,918,940 | 2,934,606 | 10,050 | |||||
| Profit Before Fixed Charges | $3,062,548 | $1,979,237 | $2,781,391 | $2,765,725 | $9,472 | |||||
| Total Fixed Charges | 310,573 | 354,921 | 383,801 | 393,705 | 1,348 | |||||
| Net Operating Income | $2,751,975 | $1,624,316 | $2,397,590 | $2,372,021 | $8,123 | |||||
| FF&E | 342,743 | 0 | 329,207 | 329,207 | 1,127 | |||||
| Net Cash Flow | $2,409,232 | $1,624,316 | $2,068,383 | $2,042,814 | $6,996 | |||||
| NOI DSCR | 2.29x | 1.35x | 1.99x | 1.97x | ||||||
| NCF DSCR | 2.00 x | 1.35x | 1.72x | 1.70x | ||||||
| NOI DY | 13.8% | 8.1% | 12.0% | 11.9% | ||||||
| NCF DY | 12.0% | 8.1% | 10.3% | 10.2% | ||||||
| (1) | The decrease in occupancy and Net Operating Income from 2012 to 2013 and TTM 9/30/2014 at the DoubleTree - Virginia Beach Property is attributed to the non-renewal of contract with the Military Sea Lift Command, part of the U.S. Navy, in early 2012 and major renovation work that commenced in 2013. Upon completion of the renovation work in early 2014, occupancy and Net Operating Income began to stabilize. |
THE INFORMATION IN THIS STRUCTURAL AND COLLATERAL TERM SHEET IS NOT COMPLETE AND MAY BE AMENDED PRIOR TO THE TIME OF SALE. THIS TERM SHEET IS NOT AN OFFER TO SELL THESE SECURITIES AND IT IS NOT A SOLICITATION OF AN OFFER TO BUY THESE SECURITIES IN ANY JURISDICTION WHERE THE OFFER OR SALE IS NOT PERMITTED.
115
| No. 12 – All Storage Keller Haslet & Katy | |||||||
| Loan Information | Property Information | ||||||
| Mortgage Loan Seller: | The Royal Bank of Scotland plc | Single Asset/Portfolio: | Single Asset | ||||
| Credit Assessment (DBRS/Moody’s/Morningstar): | NR/NR/NR | Property Type: | Self Storage | ||||
| Original Principal Balance: | $19,850,000 | Specific Property Type: | Self Storage | ||||
| Cut-off Date Principal Balance: | $19,850,000 | Location: | Keller, TX | ||||
| % of Initial Pool Balance: | 2.3% | Size: | 302,996 SF | ||||
| Loan Purpose: | Refinance | Cut-off Date Principal Balance Per SF: | $65.51 | ||||
| Borrower Name: | K&K All Storage, Ltd. | Year Built/Renovated: | 2003/NAP | ||||
Sponsor(1): | Jay Schuminsky | Title Vesting: | Fee | ||||
| Mortgage Rate: | 4.526% | Property Manager: | Regional Management Co., Inc. | ||||
| Note Date: | November 6, 2014 | 3rd Most Recent Occupancy (As of)(2): | 88.2% (12/31/2011) | ||||
| Anticipated Repayment Date: | NAP | 2nd Most Recent Occupancy (As of)(2): | 92.4% (12/31/2012) | ||||
| Maturity Date: | December 1, 2024 | Most Recent Occupancy (As of)(2): | 93.9% (12/31/2013) | ||||
| IO Period: | None | Current Occupancy (As of): | 89.6% (8/31/2014) | ||||
| Loan Term (Original): | 120 months | ||||||
| Seasoning: | 0 months | Underwriting and Financial Information: | |||||
| Amortization Term (Original): | 360 months | ||||||
| Loan Amortization Type: | Amortizing Balloon | 3rd Most Recent NOI (As of): | $1,689,786 (12/31/2012) | ||||
| Interest Accrual Method: | Actual/360 | 2nd Most Recent NOI (As of): | $1,910,516 (12/31/2013) | ||||
| Call Protection: | L(24),D(92),O(4) | Most Recent NOI (As of): | $2,073,731 (TTM 8/31/2014) | ||||
| Lockbox Type: | Springing (Without Established Account) | ||||||
| Additional Debt: | None | U/W Revenues: | $2,829,665 | ||||
| Additional Debt Type: | NAP | U/W Expenses: | $818,400 | ||||
| U/W NOI: | $2,011,265 | ||||||
| U/W NCF: | $1,965,816 | ||||||
| U/W NOI DSCR: | 1.66x | ||||||
| U/W NCF DSCR: | 1.62x | ||||||
Escrows and Reserves: | U/W NOI Debt Yield: | 10.1% | |||||
| U/W NCF Debt Yield: | 9.9% | ||||||
Type: | Initial | Monthly | Cap (If Any) | As-Is Appraised Value: | $28,500,000 | ||
| Taxes | $0 | $32,703 | NAP | As-Is Appraisal Valuation Date: | September 26, 2014 | ||
| Insurance | $29,104 | $3,234 | NAP | Cut-off Date LTV Ratio: | 69.6% | ||
| Replacement Reserves | $0 | $3,787 | 136,348 | LTV Ratio at Maturity or ARD: | 56.4% | ||
| (1) | Jay Schuminsky also serves as the loan sponsor for the All Storage Old Denton mortgage loan, which has a Cut-off Date Principal Balance of $4,400,000 and is being contributed to the WFRBS 2014-C25 Trust. See “Description of the Mortgage Pool—Statistical Characteristics of the Mortgage Pool—Multi-Property Mortgage Loans and Related Borrower Mortgage Loans” in the Free Writing Prospectus. |
| (2) | Occupancy based on per unit, inclusive of 883 open parking/carport spaces utilized for RV/boat storage. Historical occupancy based on net rentable square footage is unavailable. |
The All Storage Keller Haslet & Katy mortgage loan is evidenced by a single promissory note that is secured by a first mortgage encumbering a 302,996 square foot self storage facility located in Keller, Texas (the “All Storage Keller Haslet & Katy Property”), approximately 18 miles northeast of the Fort Worth central business district. The All Storage Keller Haslet & Katy Property is comprised of 28 single-story buildings, 17 carport buildings and one two-story building. In total, the All Storage Keller Haslet & Katy Property comprises 1,318 storage units, including 552 (41.9%) climate controlled units and 883 parking units. The All Storage Keller Haslet & Katy Property amenities include surveillance cameras, two elevators and two service lifts that provide access to the second level units, key pad entry and a two-story leasing office/apartment unit. As of August 31, 2014, the All Storage Keller Haslet & Katy Property was 89.6% occupied.
THE INFORMATION IN THIS STRUCTURAL AND COLLATERAL TERM SHEET IS NOT COMPLETE AND MAY BE AMENDED PRIOR TO THE TIME OF SALE. THIS TERM SHEET IS NOT AN OFFER TO SELL THESE SECURITIES AND IT IS NOT A SOLICITATION OF AN OFFER TO BUY THESE SECURITIES IN ANY JURISDICTION WHERE THE OFFER OR SALE IS NOT PERMITTED.
116
| All STORAGE KELLER HASLET & KATY |
Sources and Uses
| Sources | Uses | ||||||||
| Original loan amount | $19,850,000 | 100.0% | Loan payoff(1) | $7,422,590 | 37.4 | % | |||
| Reserves | 29,104 | 0.1 | |||||||
| Closing costs | 518,528 | 2.6 | |||||||
| Return of equity | 11,879,778 | 59.8 | |||||||
| Total Sources | $19,850,000 | 100.0% | Total Uses | $19,850,000 | 100.0 | % |
| (1) | The All Storage Keller Haslet & Katy Property was previously securitized in JPMCC 2004-CBX. In addition to paying off the previous CMBS loan, proceeds were used to retire a loan from a regional bank. |
The following table presents information relating to the historical occupancy for the All Storage Keller Haslet & Katy Property:
Historical Occupancy(1)
12/31/2011(2) | 12/31/2012(2) | 12/31/2013(2) | 8/31/2014 | |||
| 88.2% | 92.4% | 93.9% | 89.6% | |||
(1) Information obtained from the underwritten rent roll. | ||||||
(2) Occupancy based on per unit, inclusive of 883 open parking/carport spaces utilized for RV/boat storage. Historical occupancy based on net rentable square footage is unavailable. | ||||||
Operating History and Underwritten Net Cash Flow. The following table presents certain information relating to the historical operating performance and the Underwritten Net Cash Flow at the All Storage Keller Haslet & Katy Property:
Cash Flow Analysis
| 2012 | 2013 | TTM 8/31/2014 | U/W | U/W $ per SF | ||||||
| Base Rent | $2,408,070 | $2,637,200 | $3,356,784 | $3,356,784 | $11.08 | |||||
| Loss to Lease & Concessions | 0 | 0 | (458,471) | (429,456) | (1.42) | |||||
| Other Income | 113,175 | 111,139 | 106,125 | 106,125 | 0.35 | |||||
| Less Vacancy & Credit Loss | 0 | 0 | (212,071) | (203,788)(1) | (0.67) | |||||
| Effective Gross Income | $2,521,245 | $2,748,339 | $2,792,367 | $2,829,665 | $9.34 | |||||
| Total Operating Expenses | $831,459 | $837,823 | $718,636 | $818,400 | $2.70 | |||||
| Net Operating Income | $1,689,786 | $1,910,516 | $2,073,731 | $2,011,265 | $6.64 | |||||
| Replacement Reserves | 0 | 0 | 0 | 45,449 | 0.15 | |||||
| Net Cash Flow | $1,689,786 | $1,910,516 | $2,073,731 | $1,965,816 | $6.49 | |||||
| NOI DSCR | 1.40x | 1.58x | 1.71x | 1.66x | ||||||
| NCF DSCR | 1.40x | 1.58x | 1.71x | 1.62x | ||||||
| NOI DY | 8.5% | 9.6% | 10.4% | 10.1% | ||||||
| NCF DY | 8.5% | 9.6% | 10.4% | 9.9% | ||||||
(1) The underwritten economic Vacancy & Credit Loss is 7.0%. The All Storage Keller Haslet & Katy Property was 89.6% physically occupied by net rentable square footage as of August 31, 2014. | ||||||||||
THE INFORMATION IN THIS STRUCTURAL AND COLLATERAL TERM SHEET IS NOT COMPLETE AND MAY BE AMENDED PRIOR TO THE TIME OF SALE. THIS TERM SHEET IS NOT AN OFFER TO SELL THESE SECURITIES AND IT IS NOT A SOLICITATION OF AN OFFER TO BUY THESE SECURITIES IN ANY JURISDICTION WHERE THE OFFER OR SALE IS NOT PERMITTED.
117
| No. 13 – Twin Falls Portfolio | ||||||||
| Loan Information | Property Information | |||||||
| Mortgage Loan Seller: | Silverpeak Real Estate Finance LLC | Single Asset/Portfolio: | Portfolio | |||||
Credit Assessment (DBRS/Moody’s/Morningstar): | NR/NR/NR | Property Type: | Hospitality | |||||
| Original Principal Balance: | $18,500,000 | Specific Property Type: | Limited Service | |||||
| Cut-off Date Principal Balance: | $18,455,952 | Location: | Various – See Table | |||||
| % of Initial Pool Balance: | 2.1% | Size: | 277 Rooms | |||||
| Loan Purpose: | Refinance | Cut-off Date Principal Balance Per Room: | $66,628 | |||||
| Borrower Names: | Twin Falls Hotels, LLC | Year Built/Renovated: | Various – See Table | |||||
| Sponsor: | James Burgess; Jeff Burgess | Title Vesting: | Fee | |||||
| Mortgage Rate: | 4.766% | Property Manager: | Safari Hospitality, Inc. | |||||
| Note Date: | September 30, 2014 | 3rd Most Recent Occupancy (As of): | 58.7% (12/31/2011) | |||||
| Anticipated Repayment Date: | NAP | 2nd Most Recent Occupancy (As of): | 66.0% (12/31/2012) | |||||
| Maturity Date: | October 6, 2024 | Most Recent Occupancy (As of): | 62.5% (12/31/2013) | |||||
| IO Period: | None | Current Occupancy (As of): | 63.9% (7/31/2014) | |||||
| Loan Term (Original): | 120 months | |||||||
| Seasoning: | 2 months | Underwriting and Financial Information: | ||||||
| Amortization Term (Original): | 360 months | |||||||
| Loan Amortization Type: | Amortizing Balloon | 3rd Most Recent NOI (As of): | $2,078,546 (12/31/2012) | |||||
| Interest Accrual Method: | Actual/360 | 2nd Most Recent NOI (As of): | $2,148,007 (12/31/2013) | |||||
| Call Protection: | L(26),D(90),O(4) | Most Recent NOI (As of): | $2,263,835 (TTM 7/31/2014) | |||||
| Lockbox Type: | Springing (Without Established Account) | |||||||
| Additional Debt: | None | |||||||
| Additional Debt Type: | NAP | U/W Revenues: | $6,163,210 | |||||
| U/W Expenses: | $3,968,739 | |||||||
| U/W NOI: | $2,194,471 | |||||||
| U/W NCF: | $1,947,942 | |||||||
Escrows and Reserves: | U/W NOI DSCR: | 1.89x | ||||||
| U/W NCF DSCR: | 1.68x | |||||||
Type: | Initial | Monthly | Cap (If Any) | U/W NOI Debt Yield: | 11.9% | |||
| Taxes | $109,429 | $21,885 | NAP | U/W NCF Debt Yield: | 10.6% | |||
| Insurance | $22,500 | $4,500 | NAP | As-Is Appraised Value: | $26,700,000 | |||
| FF&E Reserve | $20,544 | $20,544 | NAP | As-Is Appraisal Valuation Date: | Various | |||
| Deferred Maintenance | $46,250 | NAP | NAP | Cut-off Date LTV Ratio: | 69.1% | |||
Seasonality Reserve(1) | $122,991 | 15,374 | 122,991 | LTV Ratio at Maturity or ARD: | 56.5% | |||
| (1) | A Seasonality Reserve of $122,991 was deposited at closing, which will be used to cover debt service shortfalls during the months of November, December, January and February. This reserve must be replenished to $122,991 from available cash flow on each payment date from March through October. |
The Twin Falls Portfolio mortgage loan is evidenced by a single promissory note that is secured by a first mortgage encumbering three limited service hotels: the Holiday Inn Express Twin Falls property, the Hampton Inn - Twin Falls property, and the Quality Inn - Twin Falls property, each located in Twin Falls, Idaho (the “Twin Falls Portfolio Properties”). The Holiday Inn Express Twin Falls was constructed in 2009, consists of one, three-story building, is situated on a 2.2 acre site and comprises a total building area of approximately 53,494 square feet. The Hampton Inn - Twin Falls was constructed in 2004, consists of one, three-story building, is situated on a 1.6 acre site and comprises a total building area of approximately 43,500 square feet. The Quality Inn - Twin Falls was constructed in 1992, expanded in 1999 and renovated in 2014, consists of two buildings, one three-story building and one two-story building, is situated on a 2.1 acre site and comprises a total building area of approximately 56,105 square feet. Amenities and services provided at the Twin Falls Portfolio Properties include indoor pools, whirlpools, complimentary breakfasts and Wi-Fi, business centers and fitness facilities. The Holiday Inn Express Twin Falls and Hampton Inn - Twin Falls have 1,100 square feet and 750 square feet of meeting space, respectively. Demand generators in Twin Falls include, the College of Southern Idaho, St. Luke’s Magic Valley Medical Center, food companies such as Glanbia Foods, Chobani, Clif Bar, Falls Brand, Amalgamated Sugar Company and Lamb Weston.
THE INFORMATION IN THIS STRUCTURAL AND COLLATERAL TERM SHEET IS NOT COMPLETE AND MAY BE AMENDED PRIOR TO THE TIME OF SALE. THIS TERM SHEET IS NOT AN OFFER TO SELL THESE SECURITIES AND IT IS NOT A SOLICITATION OF AN OFFER TO BUY THESE SECURITIES IN ANY JURISDICTION WHERE THE OFFER OR SALE IS NOT PERMITTED.
118
| TWIN FALLS PORTFOLIO |
Sources and Uses
| Sources | Uses | ||||||||||||||||
| Original loan amount | $18,500,000 | 100.0% | Loan payoff | $13,328,258 | 72.0 | % | |||||||||||
| Reserves | 321,713 | 1.7 | |||||||||||||||
| Closing costs | 385,137 | 2.1 | |||||||||||||||
| Return of equity | 4,464,891 | 24.1 | |||||||||||||||
| Total Sources | $18,500,000 | 100.0% | Total Uses | $18,500,000 | 100.0 | % | |||||||||||
The following table presents certain information relating to the Twin Falls Portfolio Properties:
| Property Name – Location | Specific Property Type | Allocated Cut-off Date Principal Balance | % of Portfolio Cut-off Date Principal Balance | Rooms | Cut-off Date Balance Per Room | Year Built/ Renovated | Appraised Value |
| Holiday Inn Express – Twin Falls, ID | Limited Service | $7,881,190 | 42.7% | 91 | $86,606 | 2009/NAP | $11,400,000 |
| Hampton Inn – Twin Falls, ID | Limited Service | $5,945,809 | 32.2% | 75 | $79,277 | 2004/2013 | $8,600,000 |
| Quality Inn – Twin Falls, ID | Limited Service | $4,628,952 | 25.1% | 111 | $41,702 | 1992/2014 | $6,700,000 |
| Total/Weighted Average | $18,455,952 | 100.0% | 277 | $66,628 | $26,700,000 |
Subject and Market Historical Occupancy, ADR and RevPAR
(Holiday Inn Express Twin Falls)(1)
Competitive Set | Holiday Inn Express | Penetration Factor | ||||||||||||||||
Year | Occupancy | ADR | RevPAR | Occupancy | ADR | RevPAR | Occupancy | ADR | RevPAR | |||||||||
| 7/31/2014 TTM | 62.4% | $88.39 | $55.13 | 69.1% | $102.61 | $70.95 | 110.9% | 116.1% | 128.7% | |||||||||
| 12/31/2013 | 62.5% | $86.57 | $54.09 | 70.6% | $100.54 | $70.94 | 112.9% | 116.1% | 131.2% | |||||||||
| 12/31/2012 | 59.8% | $82.93 | $49.62 | 69.5% | $96.58 | $67.15 | 116.2% | 116.5% | 135.3% | |||||||||
| (1) | Information obtained from third party hospitality research reports dated January 17, 2013, January 17, 2014, and August 19, 2014 for 12/31/2012, 12/31/2013, and 7/31/2014 TTM, respectively. The competitive set includes the following hotels: Red Lion Hotel Canyon Springs Twin Falls, Best Western Plus Twin Falls Hotel, Shilo Inn Suites Twin Falls, La Quinta Inns & Suites Twin Falls, Comfort Inn & Suites Jerome, and Hilton Garden Inn Twin Falls. |
Subject and Market Historical Occupancy, ADR and RevPAR
(Hampton Inn - Twin Falls)(1)
Competitive Set | Hampton Inn | Penetration Factor | |||||||||||||||
Year | Occupancy | ADR | RevPAR | Occupancy | ADR | RevPAR | Occupancy | ADR | RevPAR | ||||||||
| 7/31/2014 TTM | 62.4% | $88.39 | $55.13 | 68.1% | $104.42 | $71.10 | 109.2% | 118.1% | 129.0% | ||||||||
| 12/31/2013 | 62.5% | $86.57 | $54.09 | 64.0% | $100.09 | $64.01 | 102.4% | 115.6% | 118.3% | ||||||||
| 12/31/2012 | 59.8% | $82.93 | $49.62 | 66.4% | $92.30 | $61.32 | 111.0% | 111.3% | 123.6% | ||||||||
| (1) | Information obtained from third party hospitality research reports dated January 17, 2013, January 17, 2014, and August 20, 2014 for 12/31/2012, 12/31/2013, and 7/31/2014 TTM, respectively. The competitive set includes the following hotels: Red Lion Hotel Canyon Springs Twin Falls, Best Western Plus Twin Falls Hotel, Shilo Inn Suites Twin Falls, La Quinta Inns & Suites Twin Falls, Comfort Inn & Suites Jerome, and Hilton Garden Inn Twin Falls. |
Subject and Market Historical Occupancy, ADR and RevPAR
(Quality Inn - Twin Falls)(1)
Competitive Set | Quality Inn | Penetration Factor | |||||||||||||||
Year | Occupancy | ADR | RevPAR | Occupancy | ADR | RevPAR | Occupancy | ADR | RevPAR | ||||||||
| 7/31/2014 TTM | 58.9% | $83.46 | $49.20 | 57.0% | $77.20 | $44.02 | 96.7% | 92.5% | 89.5% | ||||||||
| 12/31/2013 | 59.4% | $81.78 | $48.60 | 54.2% | $76.99 | $41.73 | 91.2% | 94.2% | 85.9% | ||||||||
| 12/31/2012 | 57.3% | $78.80 | $45.15 | 62.1% | $65.79 | $40.86 | 108.4% | 83.5% | 90.5% | ||||||||
| (1) | Information obtained from third party hospitality research reports dated January 18, 2013, January 17, 2014, and August 20, 2014 for 12/31/2012, 12/31/2013, and 7/31/2014 TTM, respectively. The competitive set includes the following hotels: Red Lion Hotel Canyon Springs Twin Falls, Best Western Plus Twin Falls Hotel, Shilo Inn Suites Twin Falls, La Quinta Inns & Suites Twin Falls, and Comfort Inn & Suites Jerome. |
THE INFORMATION IN THIS STRUCTURAL AND COLLATERAL TERM SHEET IS NOT COMPLETE AND MAY BE AMENDED PRIOR TO THE TIME OF SALE. THIS TERM SHEET IS NOT AN OFFER TO SELL THESE SECURITIES AND IT IS NOT A SOLICITATION OF AN OFFER TO BUY THESE SECURITIES IN ANY JURISDICTION WHERE THE OFFER OR SALE IS NOT PERMITTED.
119
| TWIN FALLS PORTFOLIO |
Operating History and Underwritten Net Cash Flow. The following table presents certain information relating to the historical operating performance and Underwritten Net Cash Flow at the Twin Falls Portfolio Properties:
Cash Flow Analysis
| 2012 | 2013 | TTM 7/31/2014 | U/W | U/W $ per Room | ||||||
| Occupancy | 66.0% | 62.5% | 63.9% | 63.9% | ||||||
| ADR | $83.46 | $91.75 | $94.25 | $94.25 | ||||||
| RevPAR | $55.06 | $57.34 | $60.20 | $60.20 | ||||||
| Total Revenue | $5,628,659 | $5,876,782 | $6,163,050 | $6,163,210 | $22,250 | |||||
| Total Department Expenses | 1,528,742 | 1,646,542 | 1,742,010 | 1,742,055 | 6,289 | |||||
| Gross Operating Profit | $4,099,917 | $4,230,240 | $4,421,040 | $4,421,154 | $15,961 | |||||
| Total Undistributed Expenses | 1,720,924 | 1,779,143 | 1,851,593 | 1,913,244 | 6,907 | |||||
| Profit Before Fixed Charges | $2,378,993 | $2,451,097 | $2,569,447 | $2,507,910 | $9,054 | |||||
| Total Fixed Charges | 300,447 | 303,090 | 305,612 | 313,439 | 1,132 | |||||
| Net Operating Income | $2,078,546 | $2,148,007 | $2,263,835 | $2,194,471 | $7,922 | |||||
| FF&E | 168,860 | 235,072 | 246,522 | 246,528 | 890 | |||||
| Net Cash Flow | $1,909,686 | $1,912,935 | $2,017,313 | $1,947,942 | $7,032 | |||||
| NOI DSCR | 1.79x | 1.85x | 1.95x | 1.89x | ||||||
| NCF DSCR | 1.65x | 1.65x | 1.74x | 1.68x | ||||||
| NOI DY | 11.3% | 11.6% | 12.3% | 11.9% | ||||||
| NCF DY | 10.3% | 10.4% | 10.9% | 10.6% | ||||||
THE INFORMATION IN THIS STRUCTURAL AND COLLATERAL TERM SHEET IS NOT COMPLETE AND MAY BE AMENDED PRIOR TO THE TIME OF SALE. THIS TERM SHEET IS NOT AN OFFER TO SELL THESE SECURITIES AND IT IS NOT A SOLICITATION OF AN OFFER TO BUY THESE SECURITIES IN ANY JURISDICTION WHERE THE OFFER OR SALE IS NOT PERMITTED.
120
(THIS PAGE INTENTIONALLY LEFT BLANK)
121
| No. 14 – Residences at 865 East | ||||||
| Loan Information | Property Information | |||||
| Mortgage Loan Seller: | Wells Fargo Bank, National Association | Single Asset/Portfolio: | Single Asset | |||
| Credit Assessment (DBRS/Moody’s/Morningstar): | NR/NR/NR | Property Type: | Multifamily | |||
| Original Principal Balance: | $16,850,000 | Specific Property Type: | Student Housing | |||
| Cut-off Date Principal Balance: | $16,850,000 | Location: | Harrisonburg, VA | |||
| % of Initial Pool Balance: | 1.9% | Size(3): | 274 Beds | |||
| Loan Purpose: | Refinance | Cut-off Date Principal Balance Per Bed: | $61,496 | |||
| Borrower Name: | 865 East, LLC | Year Built/Renovated: | 2009/NAP | |||
Sponsor(1): | Various | Title Vesting: | Fee | |||
| Mortgage Rate: | 4.250% | Property Manager: | Self-managed | |||
| Note Date: | October 30, 2014 | 3rd Most Recent Occupancy (As of): | 86.4% (9/30/2011) | |||
| Anticipated Repayment Date: | NAP | 2nd Most Recent Occupancy (As of): | 100.0% (8/1/2012) | |||
| Maturity Date: | November 11, 2024 | Most Recent Occupancy (As of): | 97.8% (9/1/2013) | |||
| IO Period: | 60 months | Current Occupancy (As of): | 99.3% (9/12/2014) | |||
| Loan Term (Original): | 120 months | |||||
| Seasoning: | 1 month | Underwriting and Financial Information: | ||||
| Amortization Term (Original): | 360 months | |||||
| Loan Amortization Type: | Interest-only, Amortizing Balloon | 3rd Most Recent NOI (As of): | $1,237,840 (12/31/2012) | |||
| Interest Accrual Method: | Actual/360 | 2nd Most Recent NOI (As of): | $1,412,767 (12/31/2013) | |||
| Call Protection: | L(25),D(91),O(4) | Most Recent NOI (As of): | $1,369,190 (TTM 8/31/2014) | |||
| Lockbox Type: | Springing (Without Established Account) | |||||
| Additional Debt: | None | U/W Revenues: | $2,044,859 | |||
| Additional Debt Type: | NAP | U/W Expenses: | $654,026 | |||
| U/W NOI: | $1,390,834 | |||||
| U/W NCF: | $1,343,188 | |||||
Escrows and Reserves: | U/W NOI DSCR: | 1.40x | ||||
| U/W NCF DSCR: | 1.35x | |||||
Type: | Initial | Monthly | Cap (If Any) | U/W NOI Debt Yield: | 8.3% | |
| Taxes | $0 | $8,404 | NAP | U/W NCF Debt Yield: | 8.0% | |
| Insurance | $12,062 | $3,017 | NAP | As-Is Appraised Value: | $24,000,000 | |
| Replacement Reserves | $0 | $3,435 | NAP | As-Is Appraisal Valuation Date: | September 3, 2014 | |
| TI/LC Reserve | $455 | NAP | Cut-off Date LTV Ratio: | 70.2% | ||
Tenant Reserve(2) | $87,600 | $0 | NAP | LTV Ratio at Maturity or ARD: | 64.0% | |
| (1) | The sponsors are Janis J. Brown, Dain T. Hammond, and The Janis J. Brown Revocable Trust. |
| (2) | The Tenant Reserve represents 125.0% of the amount of future rent credits and outstanding TI/LCs owed by the landlord for two of the retail tenants. |
| (3) | There are 274 beds in 96 units. |
The Residences at 865 East mortgage loan is evidenced by a single promissory note that is secured by a first mortgage encumbering a six-story, 274-bed student housing project located in Harrisonburg, Virginia (the “Residences at 865 East Property”) located less than one mile south of the James Madison University campus. Built in 2009, the Residences at 865 East Property offers ten one-bedroom units, 34 two-bedroom units, 12 three-bedroom units and 40 four-bedroom units and has four retail tenants located on the first floor. Amenities at the Residences at 865 East Property include a leasing office, game room, media room, fitness center, computer lab and 378 parking spaces, reflecting a parking ratio of 1.4 spaces per bed. James Madison University reported a total undergraduate enrollment of 18,431 as of Fall 2013 with approximately 67.0% of students living off campus. As of September 12, 2014, the Residences at 865 East Property was 99.3% occupied.
Sources and Uses
| Sources | Uses | |||||||
| Original loan amount | $16,850,000 | 100.0% | Loan payoff | $15,573,567 | 92.4% | |||
| Reserves | 99,662 | 0.6 | ||||||
| Closing costs | 555,967 | 3.3 | ||||||
| Return of equity | 620,804 | 3.7 | ||||||
| Total Sources | $16,850,000 | 100.0% | Total Uses | $16,850,000 | 100.0% |
THE INFORMATION IN THIS STRUCTURAL AND COLLATERAL TERM SHEET IS NOT COMPLETE AND MAY BE AMENDED PRIOR TO THE TIME OF SALE. THIS TERM SHEET IS NOT AN OFFER TO SELL THESE SECURITIES AND IT IS NOT A SOLICITATION OF AN OFFER TO BUY THESE SECURITIES IN ANY JURISDICTION WHERE THE OFFER OR SALE IS NOT PERMITTED.
122
| RESIDENCES AT 865 EAST |
The following table presents certain information relating to the unit and bed mix of the Residences at 865 East Property:
Unit/Bed Mix Summary(1)
| Unit Type | No. of Units | No. of Beds | % of Total Units | Average Unit Size (SF) | Average U/W Monthly Base Rent per Unit |
| 1 Bedroom | 10 | 10 | 3.6% | 583 | $982 |
| 2 Bedroom | 34 | 68 | 24.8% | 812 | $1,150 |
| 3 Bedroom | 12 | 36 | 13.1% | 1,056 | $1,716 |
| 4 Bedroom | 40 | 160 | 58.4% | 1,437 | $2,184 |
| Total/Weighted Average | 96 | 274 | 100.0% | 1,079 | $1,634 |
| (1) | Information obtained from the underwritten rent roll and appraisal. |
The following table presents historical occupancy percentages at the Residences at 865 East Property:
Historical Occupancy
9/30/2011(1) | 8/1/2012(1) | 9/1/2013(1) | 9/12/2014(2) | |||
| 86.4% | 100.0% | 97.8% | 99.3% | |||
(1) Information obtained from the borrower. | ||||||
(2) Information obtained from the underwritten rent roll. | ||||||
Operating History and Underwritten Net Cash Flow. The following table presents certain information relating to the historical operating performance and Underwritten Net Cash Flow at the Residences at 865 East Property:
Cash Flow Analysis
| 2012 | 2013 | TTM 8/31/2014 | U/W | U/W $ per Bed | ||||||
| Base Rent | $1,667,712 | $1,835,074 | $1,817,379 | $1,868,400 | $6,819 | |||||
| Grossed Up Vacant Space | 0 | 0 | 0 | 13,800 | 50 | |||||
Other Income(1) | 256,938 | 280,154 | 272,569 | 256,770 | 937 | |||||
| Less Vacancy & Credit Loss | 0 | (40,372) | (13,267) | (94,110)(2) | (343) | |||||
| Effective Gross Income | $1,924,650 | $2,074,856 | $2,076,681 | $2,044,859 | $7,463 | |||||
| Total Operating Expenses | $686,809 | $662,089 | $707,491 | $654,026 | $2,387 | |||||
| Net Operating Income | $1,237,840 | $1,412,767 | $1,369,190 | $1,390,834 | $5,076 | |||||
| Capital Expenditures | 0 | 0 | 0 | 47,646 | 174 | |||||
| Net Cash Flow | $1,237,840 | $1,412,767 | $1,369,190 | $1,343,188 | $4,902 | |||||
| NOI DSCR | 1.24x | 1.42x | 1.38x | 1.40x | ||||||
| NCF DSCR | 1.24x | 1.42x | 1.38x �� | 1.35x | ||||||
| NOI DY | 7.3% | 8.4% | 8.1% | 8.3% | ||||||
| NCF DY | 7.3% | 8.4% | 8.1% | 8.0% |
| (1) | Other Income includes revenue derived from four retail tenants ($198,339), a rooftop antenna ($15,600) and miscellaneous other income ($44,712). |
| (2) | The underwritten economic vacancy is 5.0%. The Residences at 865 East Property was 99.3% physically occupied as of September 12, 2014. |
THE INFORMATION IN THIS STRUCTURAL AND COLLATERAL TERM SHEET IS NOT COMPLETE AND MAY BE AMENDED PRIOR TO THE TIME OF SALE. THIS TERM SHEET IS NOT AN OFFER TO SELL THESE SECURITIES AND IT IS NOT A SOLICITATION OF AN OFFER TO BUY THESE SECURITIES IN ANY JURISDICTION WHERE THE OFFER OR SALE IS NOT PERMITTED.
123
| No. 15 – Vista Verde Apartments | ||||||
| Loan Information | Property Information | |||||
| Mortgage Loan Seller: | Wells Fargo Bank, National Association | Single Asset/Portfolio: | Single Asset | |||
| Credit Assessment (DBRS/Moody’s/Morningstar): | NR/NR/NR | Property Type: | Multifamily | |||
| Original Principal Balance: | $16,650,000 | Specific Property Type: | Garden | |||
| Cut-off Date Principal Balance: | $16,650,000 | Location: | Orlando, FL | |||
| % of Initial Pool Balance: | 1.9% | Size: | 200 units | |||
| Loan Purpose: | Acquisition | Cut-off Date Principal Balance Per Unit: | $83,250 | |||
| Borrower Name: | Moncler Vista Verde LLC | Year Built/Renovated(2): | 1990/2007 | |||
Sponsors(1): | Erwin Sredni; Luis Delgado | Title Vesting: | Fee | |||
| Mortgage Rate: | 4.280% | Property Manager: | Michaelson Real Estate Group, LLC | |||
| Note Date: | October 29, 2014 | 3rd Most Recent Occupancy (As of)(2): | 96.2% (12/31/2012) | |||
| Anticipated Repayment Date: | NAP | 2nd Most Recent Occupancy (As of)(2): | 97.6% (12/31/2013) | |||
| Maturity Date: | November 11, 2021 | Most Recent Occupancy (As of)(2): | 95.9% (8/31/2014) | |||
| IO Period: | 48 months | Current Occupancy (As of): | 97.5% (10/3/2014) | |||
| Loan Term (Original): | 84 months | |||||
| Seasoning: | 1 month | Underwriting and Financial Information: | ||||
| Amortization Term (Original): | 360 months | |||||
| Loan Amortization Type: | Interest-only, Amortizing Balloon | 3rd Most Recent NOI (As of): | $953,933 (12/31/2012) | |||
| Interest Accrual Method: | Actual/360 | 2nd Most Recent NOI (As of): | $1,171,144 (12/31/2013) | |||
| Call Protection: | L(25),D(55),O(4) | Most Recent NOI (As of): | $1,138,182 (TTM 8/31/2014) | |||
| Lockbox Type: | Springing (Without Established Account) | |||||
| Additional Debt: | None | |||||
| Additional Debt Type: | NAP | U/W Revenues: | $2,357,576 | |||
| U/W Expenses: | $1,064,209 | |||||
U/W NOI(3): | $1,293,366 | |||||
| U/W NCF: | $1,243,366 | |||||
| U/W NOI DSCR: | 1.31x | |||||
| U/W NCF DSCR: | 1.26x | |||||
Escrows and Reserves: | U/W NOI Debt Yield: | 7.8% | ||||
| U/W NCF Debt Yield: | 7.5% | |||||
Type: | Initial | Monthly | Cap (If Any) | As-Is Appraised Value: | $22,400,000 | |
| Taxes | $0 | $22,999 | NAP | As-Is Appraisal Valuation Date: | September 12, 2014 | |
| Insurance | $7,708 | $7,711 | NAP | Cut-off Date LTV Ratio: | 74.3% | |
| Replacement Reserves | $0 | $4,167 | $150,000 | LTV Ratio at Maturity or ARD: | 70.6% | |
| (1) | Erwin Sredni and Luis Delgado also serve as loan sponsors for the The Falls at Tampa Bay mortgage loan, which has a Cut-off Date Principal Balance of $11,000,000 and is being contributed to the WFRBS 2014-C25 Trust. See “Description of the Mortgage Pool—Statistical Characteristics of the Mortgage Pool—Multi-Property Mortgage Loans and Related Borrower Mortgage Loans” in the Free Writing Prospectus. |
| (2) | See “Historical Occupancy” section. |
| (3) | See “Cash Flow Analysis” section. |
The Vista Verde Apartments mortgage loan is evidenced by a single promissory note that is secured by a first mortgage encumbering a two-story, garden-style multifamily property containing 200 units and located in Orlando, Florida, approximately eight miles southwest of the central business district (the “Vista Verde Apartments Property”). Built in 1990 and renovated in 2007, the Vista Verde Apartments Property is situated on a 16.1-acre parcel and comprises 27 buildings with a mixture of one- and two-bedroom units, including 12 one-bedroom bungalows units. Amenities at the Vista Verde Apartments Property include a swimming pool, fitness center, community clubhouse, controlled entry and a car wash area. Units at the Vista Verde Apartments Property feature a patio or balcony, full kitchen appliance package with dishwasher and microwave, washer/dryer, fireplace and air conditioning. The Vista Verde Apartments Property contains 375 parking spaces, resulting in a parking ratio of 1.9 spaces per unit. As of October 3, 2014, the Vista Verde Apartments Property was 97.5% occupied.
THE INFORMATION IN THIS STRUCTURAL AND COLLATERAL TERM SHEET IS NOT COMPLETE AND MAY BE AMENDED PRIOR TO THE TIME OF SALE. THIS TERM SHEET IS NOT AN OFFER TO SELL THESE SECURITIES AND IT IS NOT A SOLICITATION OF AN OFFER TO BUY THESE SECURITIES IN ANY JURISDICTION WHERE THE OFFER OR SALE IS NOT PERMITTED.
124
| VISTA VERDE APARTMENTS |
Sources and Uses
| Sources | Uses | |||||||
| Original loan amount | $16,650,000 | 73.1% | Purchase price | $22,200,000 | 97.5% | |||
| Sponsor’s new cash contribution | 6,121,629 | 26.9 | Reserves | 7,708 | 0.0 | |||
| Closing costs | 563,921 | 2.5 | ||||||
| Total Sources | $22,771,629 | 100.0% | Total Uses | $22,771,629 | 100.0% |
The following table presents certain information relating to the unit mix of the Vista Verde Apartments Property:
Unit Mix Summary(1)
| Unit Type | No. of Units | % of Total Units | Average Unit Size (SF) | Average U/W Monthly Base Rent Per Unit | |
| 1 Bedroom/1 Bathroom | 68 | 34.0% | 740 | $858 | |
| 1 Bedroom/1 Bathroom (Bungalow) | 12 | 6.0% | 740 | $905 | |
| 2 Bedroom/2 Bathroom | 120 | 60.0% | 1,040 | $1,040 | |
| Total/Weighted Average | 200 | 100.0% | 920 | $971 | |
| (1) | Information obtained from the underwritten rent roll. |
The following table presents historical occupancy percentages at the Vista Verde Apartments Property:
Historical Occupancy
12/31/2012(1)(2) | 12/31/2013(1)(2) | 8/31/2014(1)(2) | 10/3/2014(3) | |||
| 96.2% | 97.6% | 95.9% | 97.5% |
| (1) Information obtained from the borrower. |
| (2) Represents the average economic occupancy over the trailing 12-month period. |
| (3) Information obtained from the underwritten rent roll. |
Operating History and Underwritten Net Cash Flow. The following table presents certain information relating to the historical operating performance and the Underwritten Net Cash Flow at the Vista Verde Apartments Property:
Cash Flow Analysis
| 2012 | 2013 | TTM 8/31/2014 | U/W(1) | U/W $ per Unit | |||||||||||
| Base Rent | $2,125,782 | $2,211,651 | $2,270,687 | $2,331,480 | $11,657 | ||||||||||
| Less Concessions | (111,126) | (60,060) | (67,402) | (44,175) | (221) | ||||||||||
| Other Income | 222,323 | 229,571 | 222,283 | 222,283 | 1,111 | ||||||||||
| Less Vacancy & Credit Loss | (109,374) | (95,917) | (128,219) | (152,012)(2) | (760) | ||||||||||
| Effective Gross Income | $2,127,605 | $2,285,245 | $2,297,349 | $2,357,576 | $11,788 | ||||||||||
| Total Operating Expenses | $1,173,672 | $1,114,101 | $1,159,167 | $1,064,209 | $5,321 | ||||||||||
| Net Operating Income | $953,933 | $1,171,144 | $1,138,182 | $1,293,366 | $6,467 | ||||||||||
| Replacement Reserves | 0 | 0 | 0 | 50,000 | 250 | ||||||||||
| Net Cash Flow | $953,933 | $1,171,144 | $1,138,182 | $1,243,366 | $6,217 | ||||||||||
| NOI DSCR | 0.97x | 1.19x | 1.15x | 1.31x | |||||||||||
| NCF DSCR | 0.97x | 1.19x | 1.15x | 1.26x | |||||||||||
| NOI DY | 5.7% | 7.0% | 6.8% | 7.8% | |||||||||||
| NCF DY | 5.7% | 7.0% | 6.8% | 7.5% | |||||||||||
(1) The U/W Net Operating Income is higher than the historical Net Operating Income primarily due to increases in underwritten base rent and decreases in operating expenses. U/W base rent is based on the rent roll dated October 3, 2014 and is higher than the base rent for the trailing 12-month period ending August 31, 2014. U/W Total Operating Expenses are lower than historical Total Operating Expenses primarily due to underwritten amounts for general & administrative, payroll and repairs & maintenance, which are areas where the sponsor expects to achieve cost savings compared to the prior owner. | |||||||||||||||
(2) The underwritten economic vacancy is 5.0%. The Vista Verde Apartments Property was 97.5% physically occupied as of October 3, 2014. | |||||||||||||||
THE INFORMATION IN THIS STRUCTURAL AND COLLATERAL TERM SHEET IS NOT COMPLETE AND MAY BE AMENDED PRIOR TO THE TIME OF SALE. THIS TERM SHEET IS NOT AN OFFER TO SELL THESE SECURITIES AND IT IS NOT A SOLICITATION OF AN OFFER TO BUY THESE SECURITIES IN ANY JURISDICTION WHERE THE OFFER OR SALE IS NOT PERMITTED.
125
| WFRBS Commercial Mortgage Trust 2014-C25 | Transaction Contact Information |
VI. Transaction Contact Information
Questions regarding this Structural and Collateral Term Sheet may be directed to any of the following individuals:
| RBS Securities Inc. | Wells Fargo Securities, LLC | ||
| Todd Jaeger - Trading | Tel. (203) 897-2900 | Brigid Mattingly | Tel. (312) 269-3062 |
| Fax (312) 658-0140 | |||
| Adam Ansaldi | Tel. (203) 897-0881 | A.J. Sfarra | Tel. (212) 214-5613 |
| Fax (203) 873-3542 | Fax (212) 214-8970 | ||
| Jim Barnard | Tel. (203) 897-4417 | Alex Wong | Tel. (212) 214-5615 |
| Fax (203) 873-4310 | Fax (212) 214-8970 | ||
THE INFORMATION IN THIS STRUCTURAL AND COLLATERAL TERM SHEET IS NOT COMPLETE AND MAY BE AMENDED PRIOR TO THE TIME OF SALE. THIS TERM SHEET IS NOT AN OFFER TO SELL THESE SECURITIES AND IT IS NOT A SOLICITATION OF AN OFFER TO BUY THESE SECURITIES IN ANY JURISDICTION WHERE THE OFFER OR SALE IS NOT PERMITTED.
126