Mark Gilreath Founder & CEO David Gill Chief Financial Officer A Platform GI Company November 2015 Exhibit 99.1
Safe Harbor This presentation contains forward‐looking statements. You should not rely upon forward‐looking statements as predictions of future events. All statements other than statements of historical facts contained in this presentation, including information concerning our possible or assumed future results of operations and expenses, business strategies and plans, competitive position, business environment and potential growth opportunities, are forward-looking statements. Forward-looking statements involve known and unknown risks, uncertainties and other factors that may cause our actual results, performance or achievements to be materially different from any future results, performance or achievements expressed or implied by the forward-looking statements. These risks and uncertainties are described in our filings with the SEC, including the Registration Statement on Form S-1, as amended, for our initial public offering and our Form 10-Q for the period ended September 30, 2015. Given these uncertainties, you should not place undue reliance on any forward-looking statements in this presentation. Except as required by law, we disclaim any obligation to update any forward‐looking statements for any reason after the date of this presentation. This presentation shall not constitute an offer to sell or the solicitation of an offer to buy, nor shall there be any sale of securities in any state or jurisdiction in which such offer, solicitation or sale would be unlawful prior to registration or qualification under the securities laws of any such state or jurisdiction.
The Company
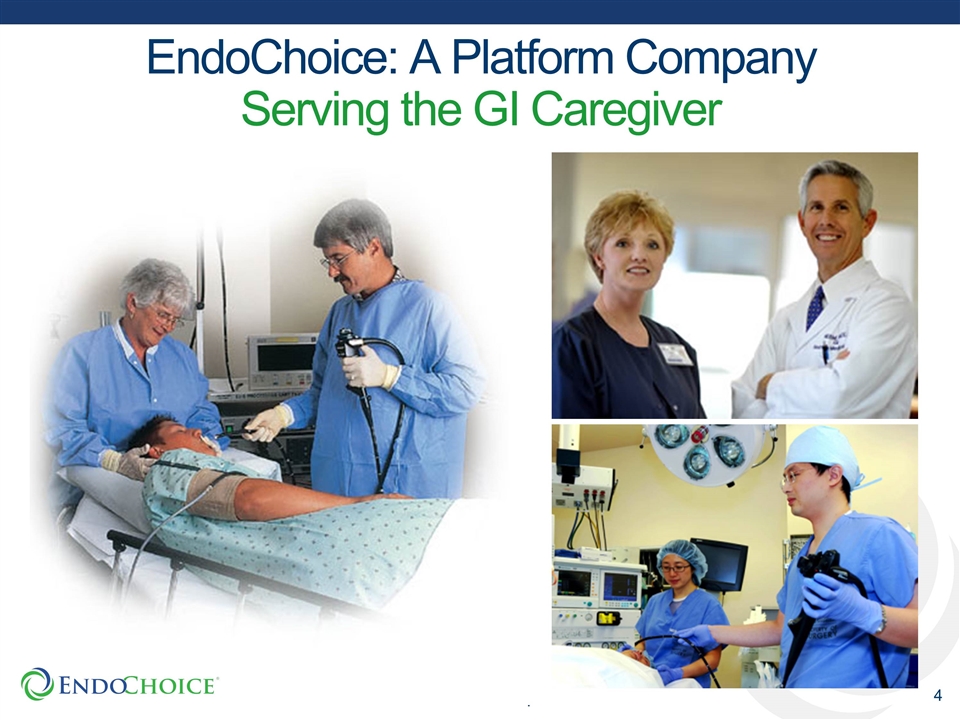
EndoChoice: A Platform Company Serving the GI Caregiver
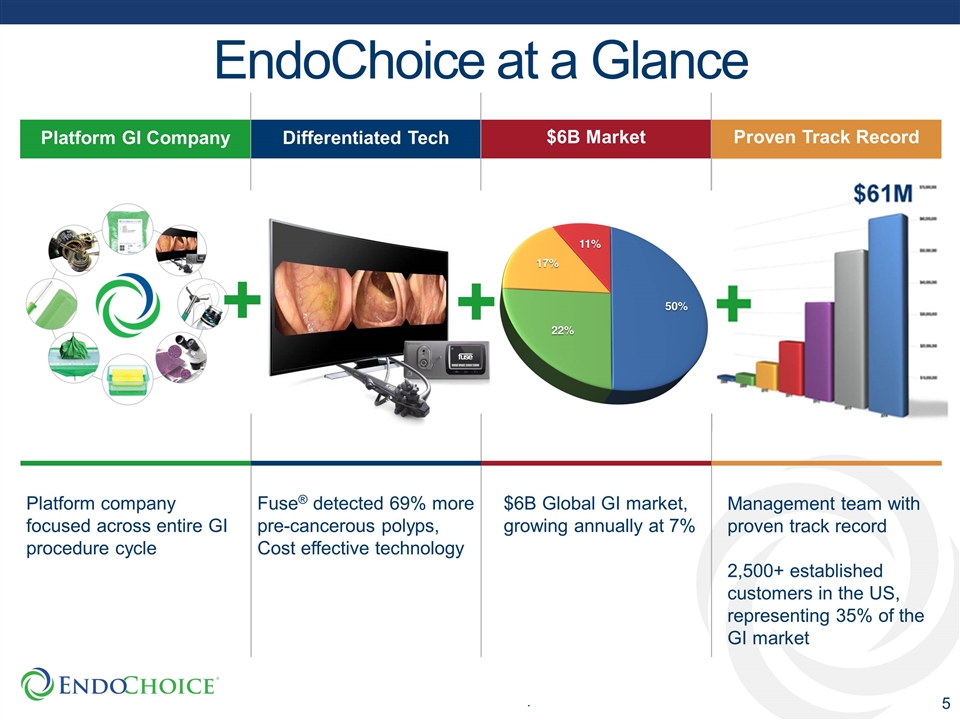
Platform GI Company Differentiated Tech $6B Market Proven Track Record + + Platform company focused across entire GI procedure cycle Fuse® detected 69% more pre-cancerous polyps, Cost effective technology $6B Global GI market, growing annually at 7% Management team with proven track record 2,500+ established customers in the US, representing 35% of the GI market EndoChoice at a Glance
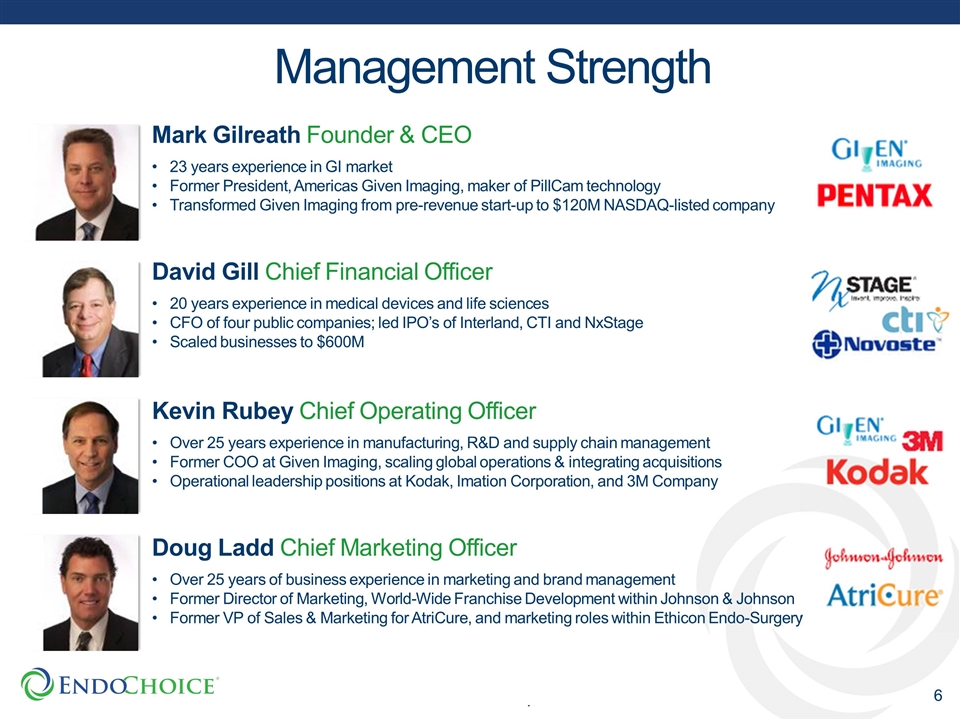
Management Strength Mark Gilreath Founder & CEO 23 years experience in GI market Former President, Americas Given Imaging, maker of PillCam technology Transformed Given Imaging from pre-revenue start-up to $120M NASDAQ-listed company David Gill Chief Financial Officer 20 years experience in medical devices and life sciences CFO of four public companies; led IPO’s of Interland, CTI and NxStage Scaled businesses to $600M Kevin Rubey Chief Operating Officer Over 25 years experience in manufacturing, R&D and supply chain management Former COO at Given Imaging, scaling global operations & integrating acquisitions Operational leadership positions at Kodak, Imation Corporation, and 3M Company Doug Ladd Chief Marketing Officer Over 25 years of business experience in marketing and brand management Former Director of Marketing, World-Wide Franchise Development within Johnson & Johnson Former VP of Sales & Marketing for AtriCure, and marketing roles within Ethicon Endo-Surgery
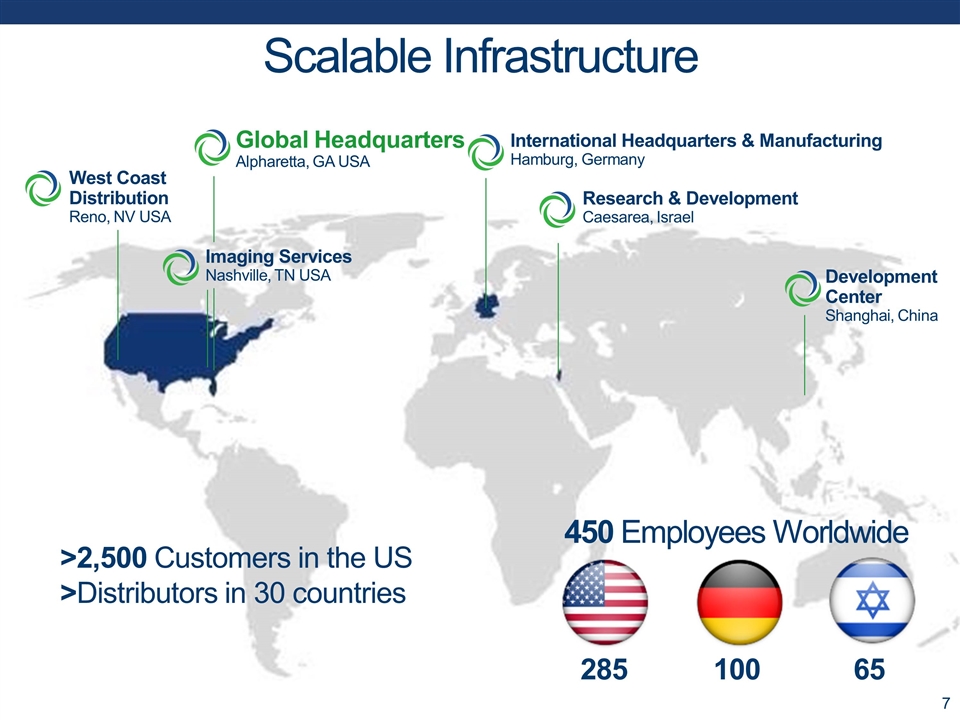
>2,500 Customers in the US >Distributors in 30 countries 450 Employees Worldwide 285 100 65 Scalable Infrastructure Global Headquarters Alpharetta, GA USA West Coast Distribution Reno, NV USA Imaging Services Nashville, TN USA International Headquarters & Manufacturing Hamburg, Germany Research & Development Caesarea, Israel Development Center Shanghai, China
GI Market Opportunity
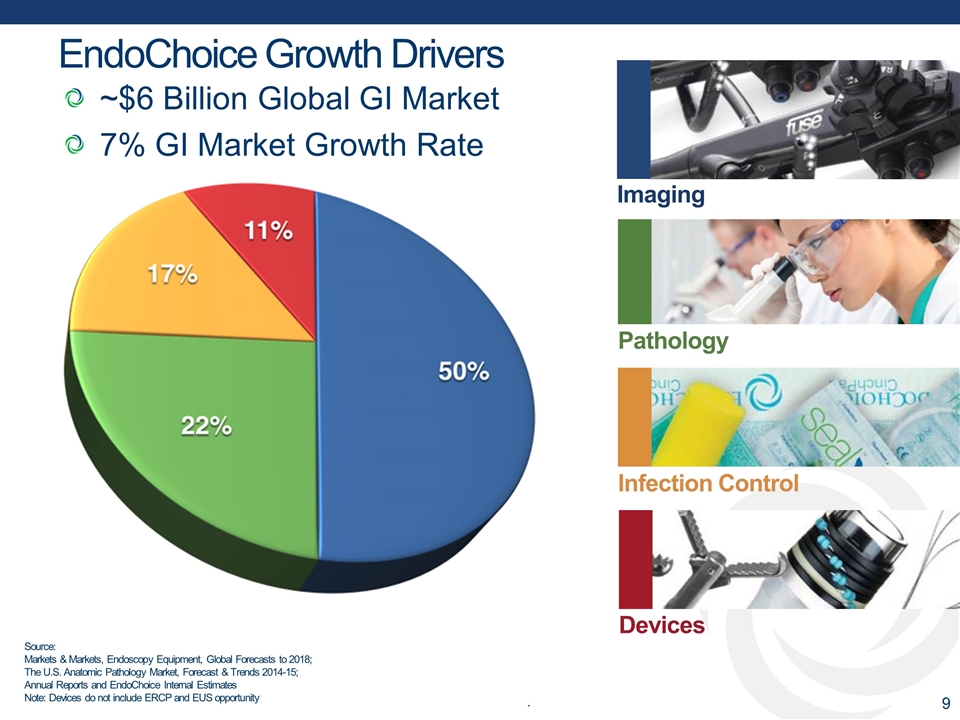
Imaging Devices Pathology Infection Control Source: Markets & Markets, Endoscopy Equipment, Global Forecasts to 2018; The U.S. Anatomic Pathology Market, Forecast & Trends 2014-15; Annual Reports and EndoChoice Internal Estimates Note: Devices do not include ERCP and EUS opportunity EndoChoice Growth Drivers ~$6 Billion Global GI Market 7% GI Market Growth Rate
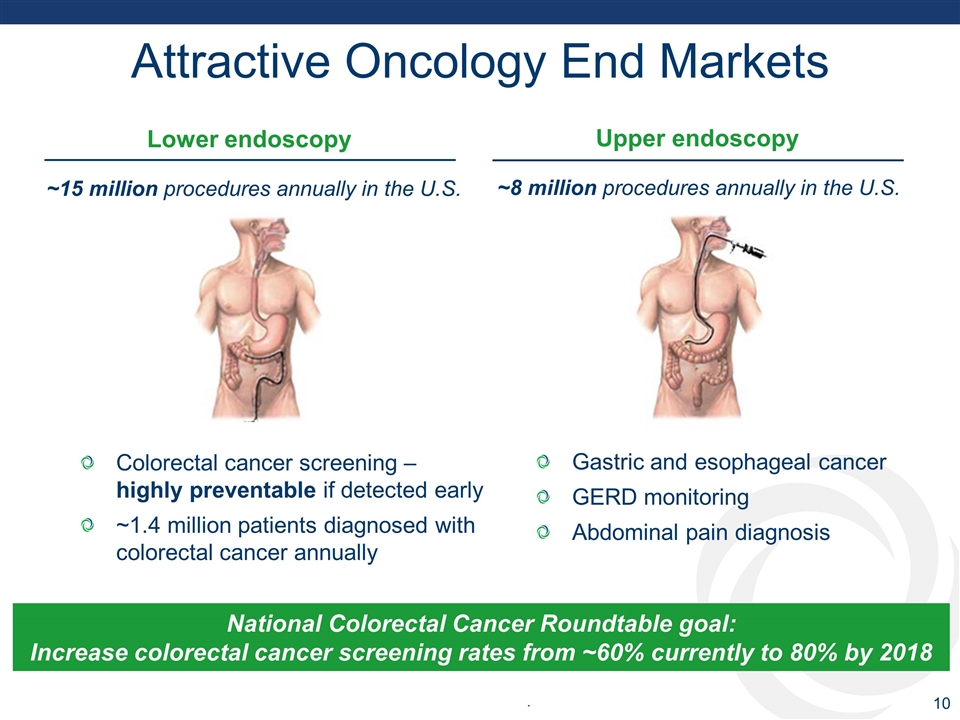
Attractive Oncology End Markets Gastric and esophageal cancer GERD monitoring Abdominal pain diagnosis National Colorectal Cancer Roundtable goal: Increase colorectal cancer screening rates from ~60% currently to 80% by 2018 Colorectal cancer screening – highly preventable if detected early ~1.4 million patients diagnosed with colorectal cancer annually Upper endoscopy Lower endoscopy ~8 million procedures annually in the U.S. ~15 million procedures annually in the U.S.
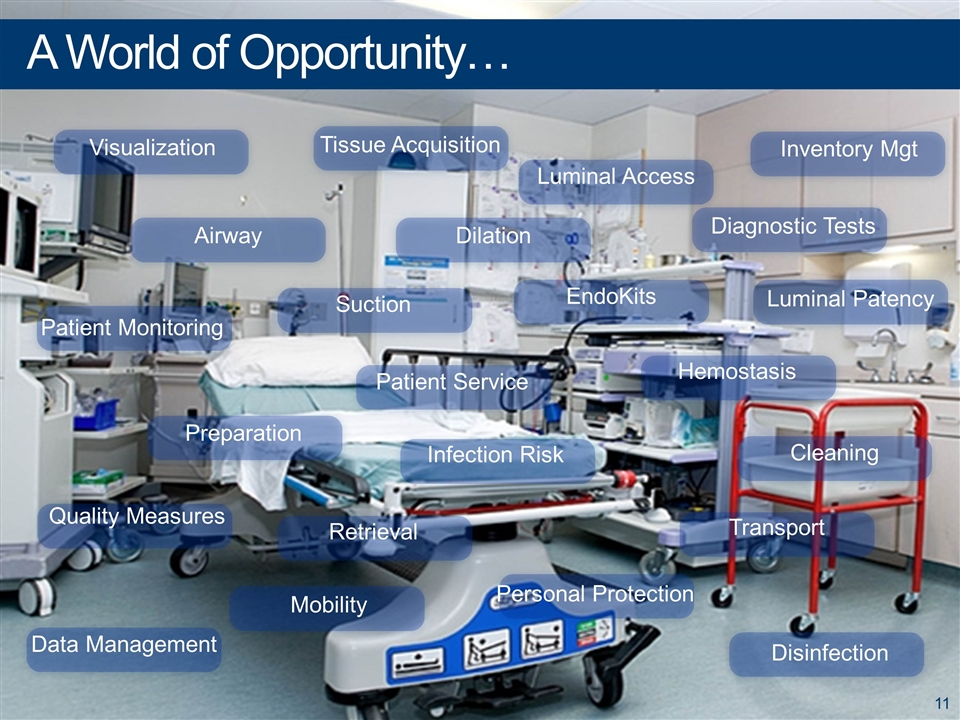
Dilation Visualization Airway Personal Protection Inventory Mgt Diagnostic Tests Luminal Access Tissue Acquisition Patient Monitoring Luminal Patency Data Management EndoKits Preparation Suction Patient Service Hemostasis Cleaning Retrieval Transport Mobility Quality Measures Infection Risk A World of Opportunity… Disinfection
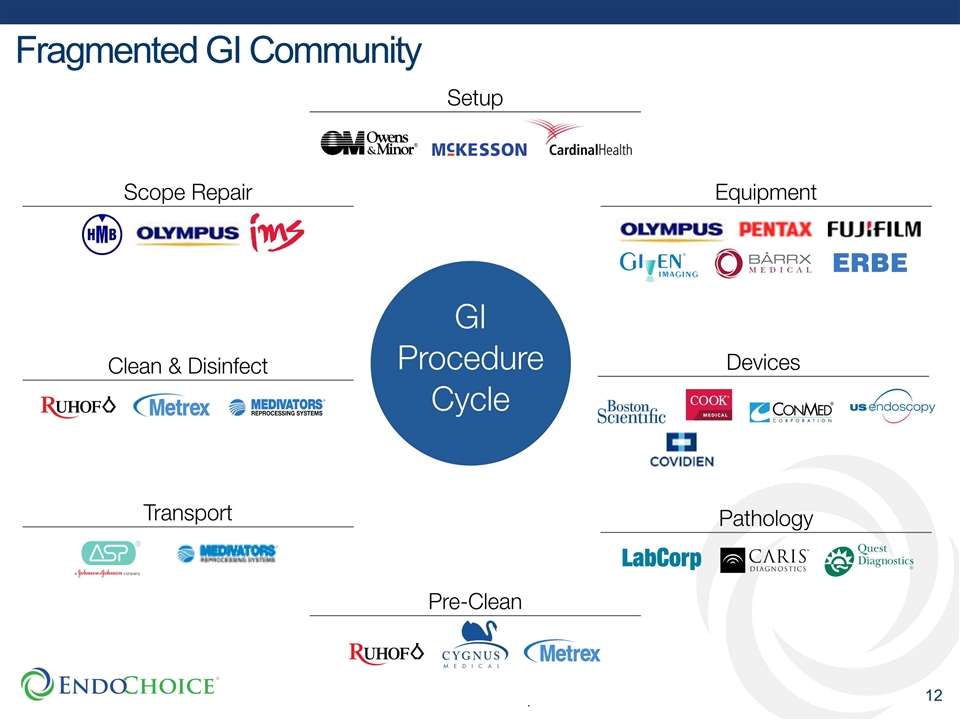
Fragmented GI Community
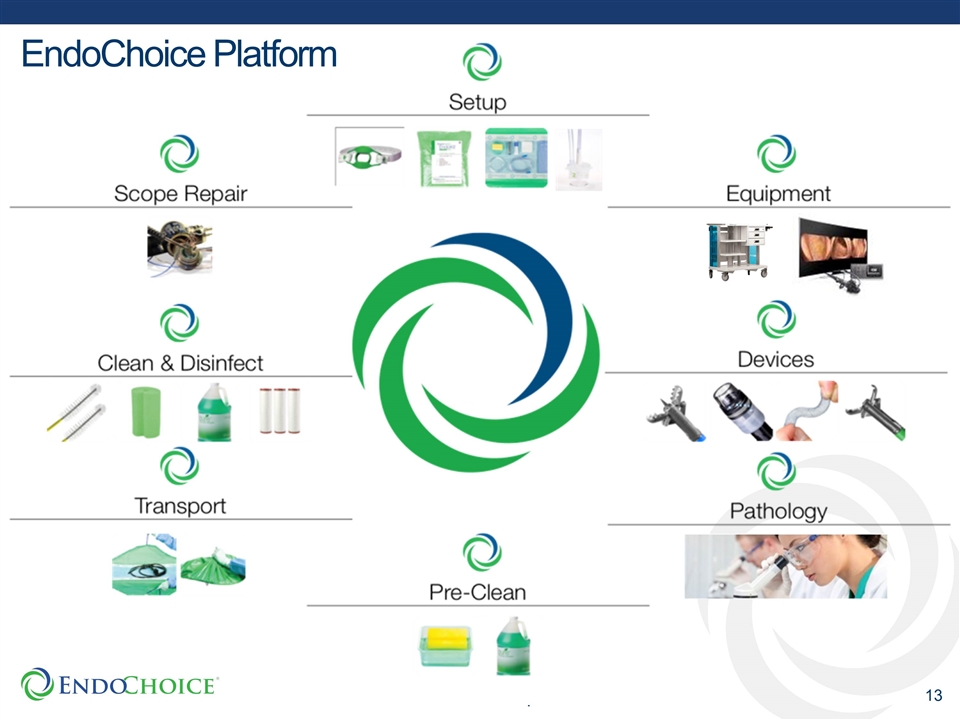
EndoChoice Platform
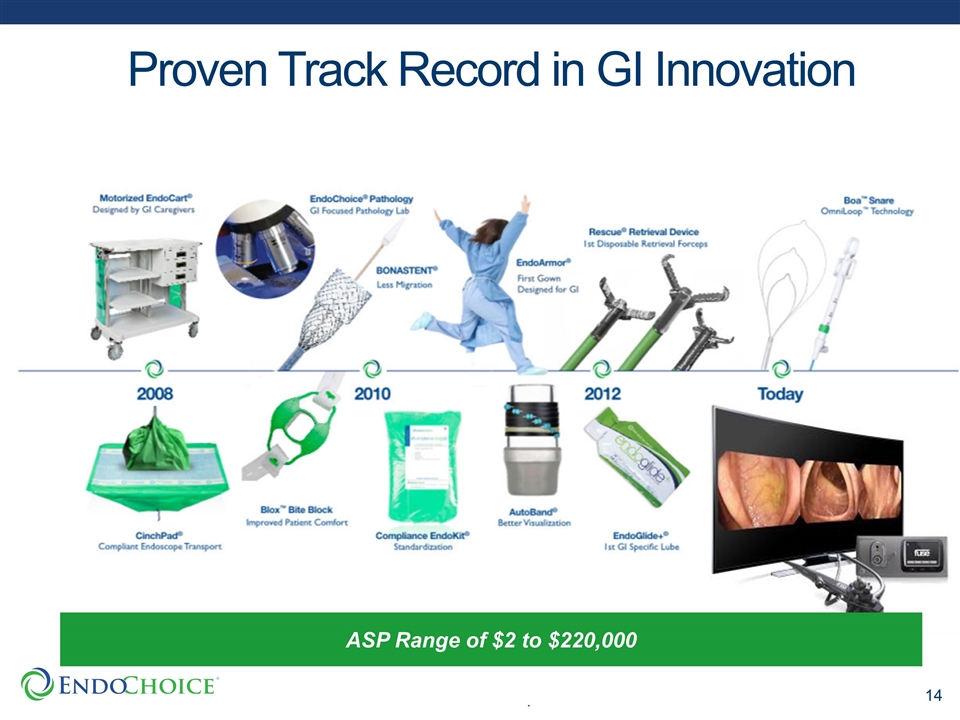
Proven Track Record in GI Innovation ASP Range of $2 to $220,000
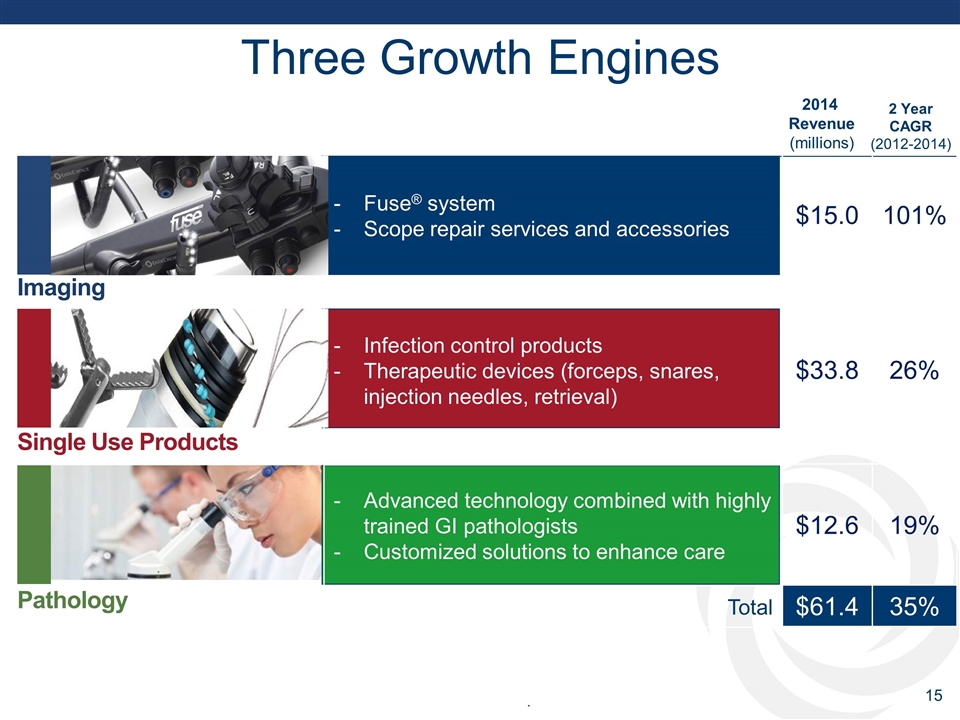
Fuse® system Scope repair services and accessories Infection control products Therapeutic devices (forceps, snares, injection needles, retrieval) Advanced technology combined with highly trained GI pathologists Customized solutions to enhance care Total Imaging Single Use Products Pathology 2014 Revenue (millions) $15.0 101% $33.8 26% $12.6 19% $61.4 35% 2 Year CAGR (2012-2014) Three Growth Engines
Fuse® Full Spectrum Endoscopy
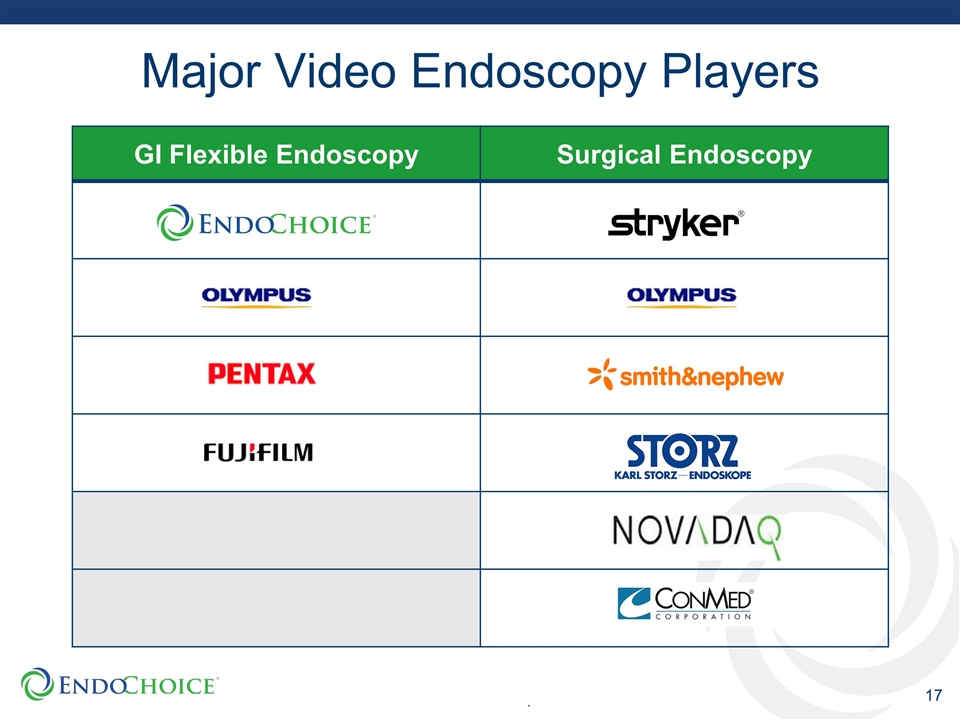
Major Video Endoscopy Players GI Flexible Endoscopy Surgical Endoscopy
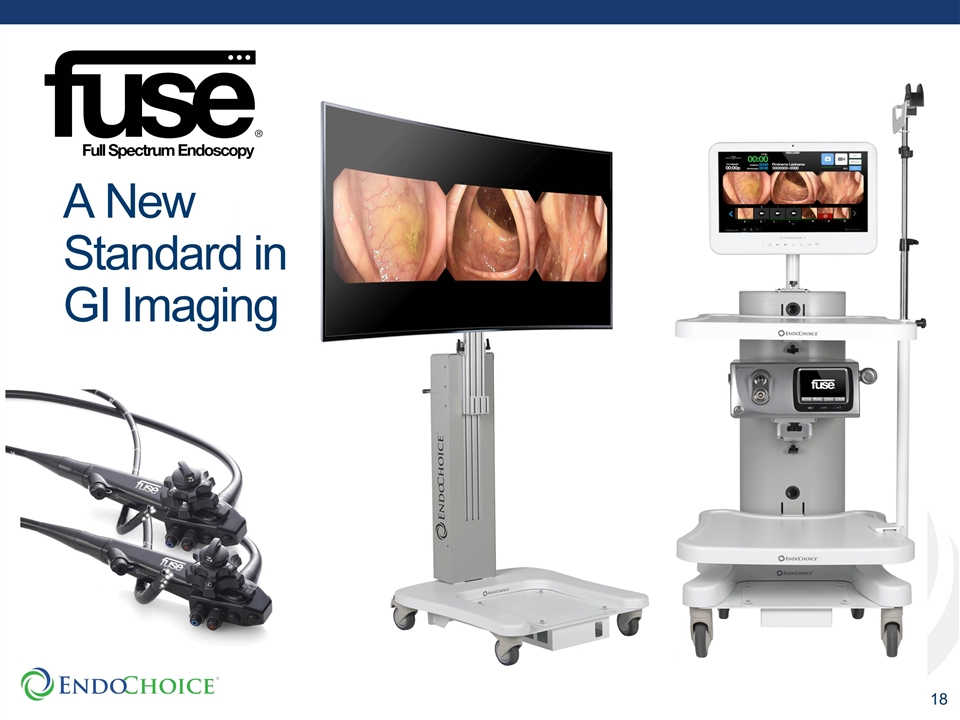
A New Standard in GI Imaging
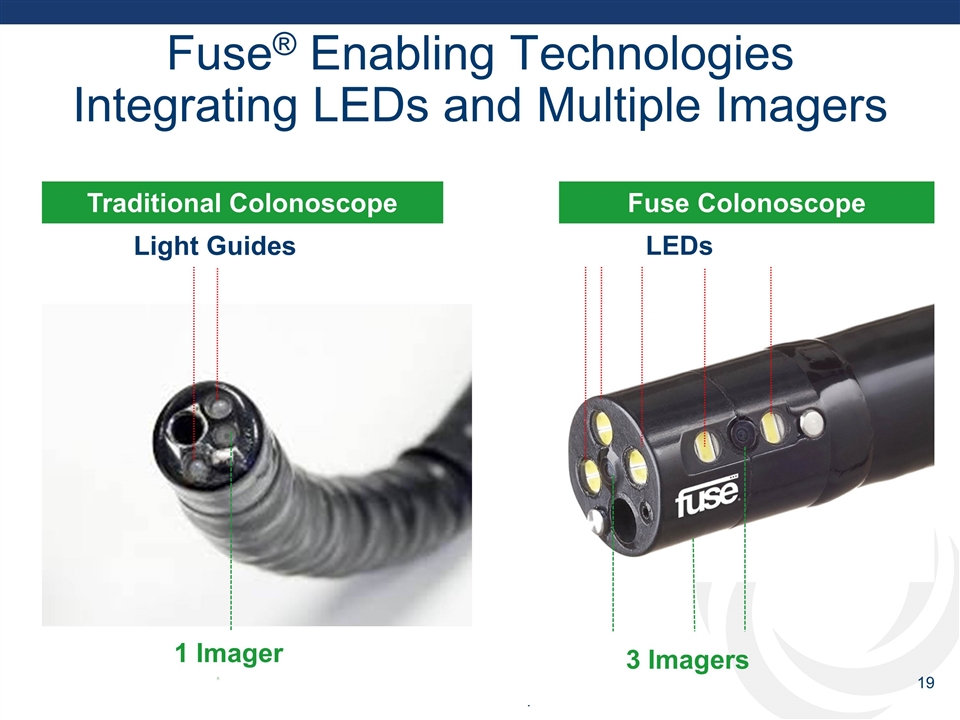
LEDs Fuse® Enabling Technologies Integrating LEDs and Multiple Imagers 3 Imagers Light Guides 1 Imager Traditional Colonoscope Fuse Colonoscope
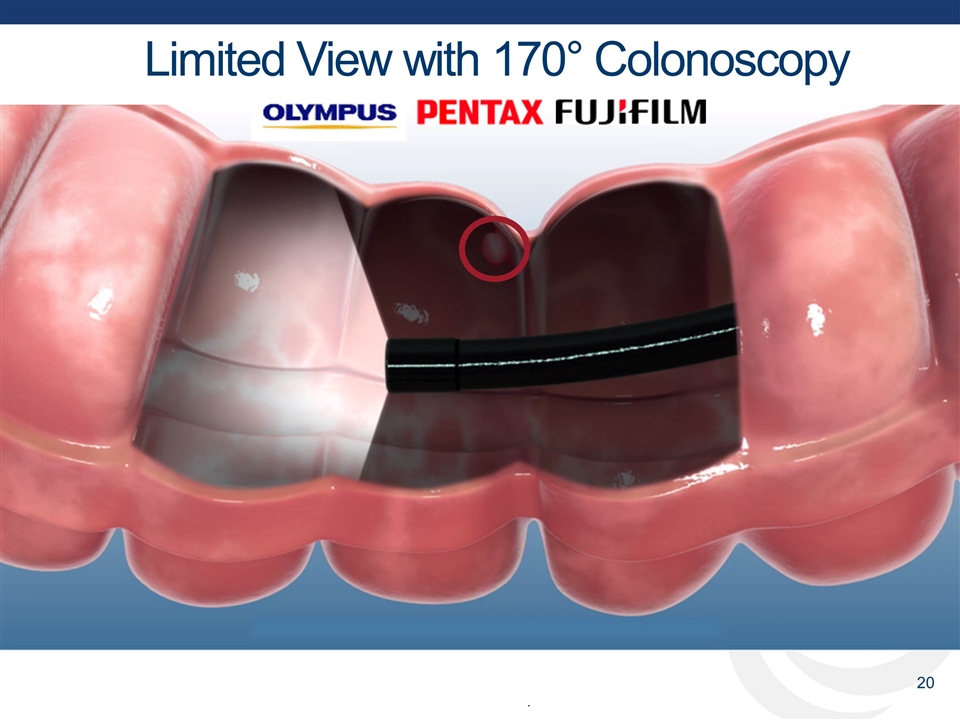
Limited View with 170° Colonoscopy
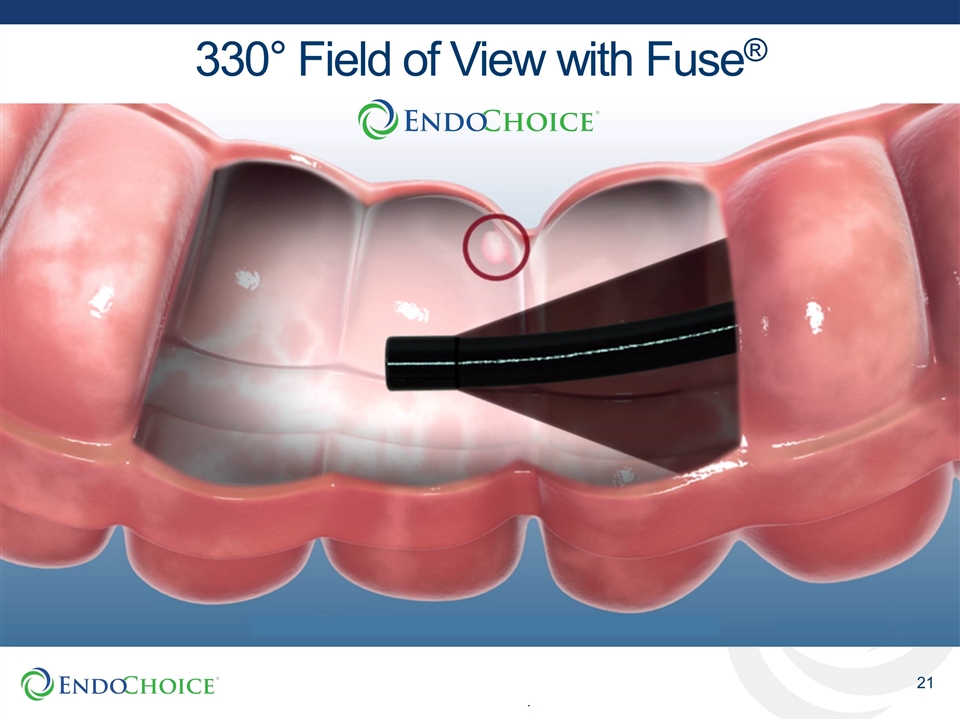
330° Field of View with Fuse®
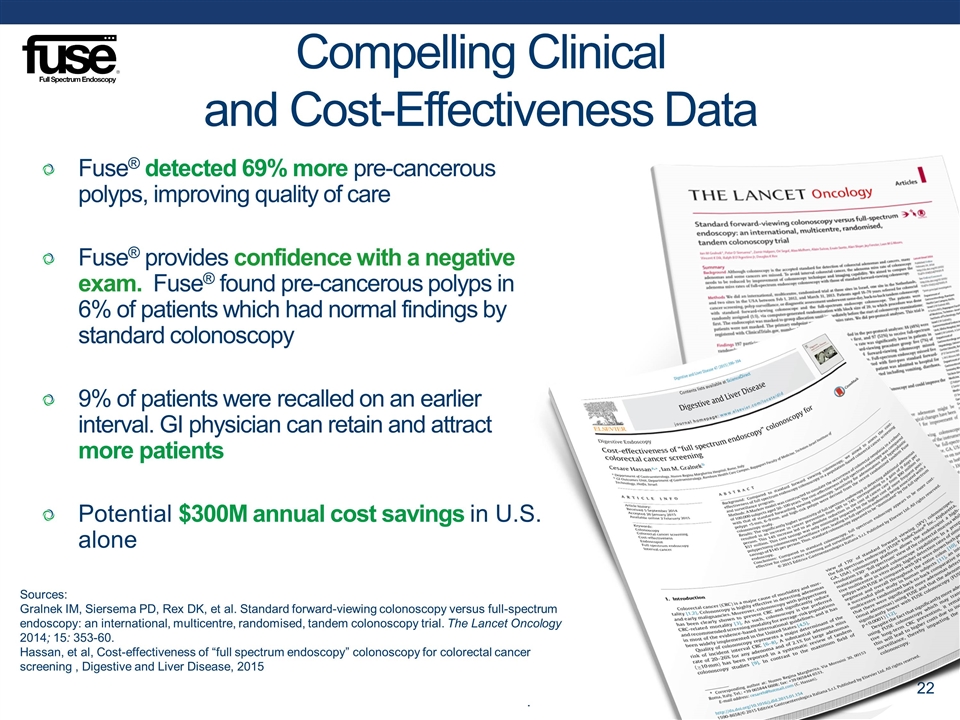
Compelling Clinical and Cost-Effectiveness Data Sources: Gralnek IM, Siersema PD, Rex DK, et al. Standard forward-viewing colonoscopy versus full-spectrum endoscopy: an international, multicentre, randomised, tandem colonoscopy trial. The Lancet Oncology 2014; 15: 353-60. Hassan, et al, Cost-effectiveness of “full spectrum endoscopy” colonoscopy for colorectal cancer screening , Digestive and Liver Disease, 2015 Fuse® detected 69% more pre-cancerous polyps, improving quality of care Fuse® provides confidence with a negative exam. Fuse® found pre-cancerous polyps in 6% of patients which had normal findings by standard colonoscopy 9% of patients were recalled on an earlier interval. GI physician can retain and attract more patients Potential $300M annual cost savings in U.S. alone
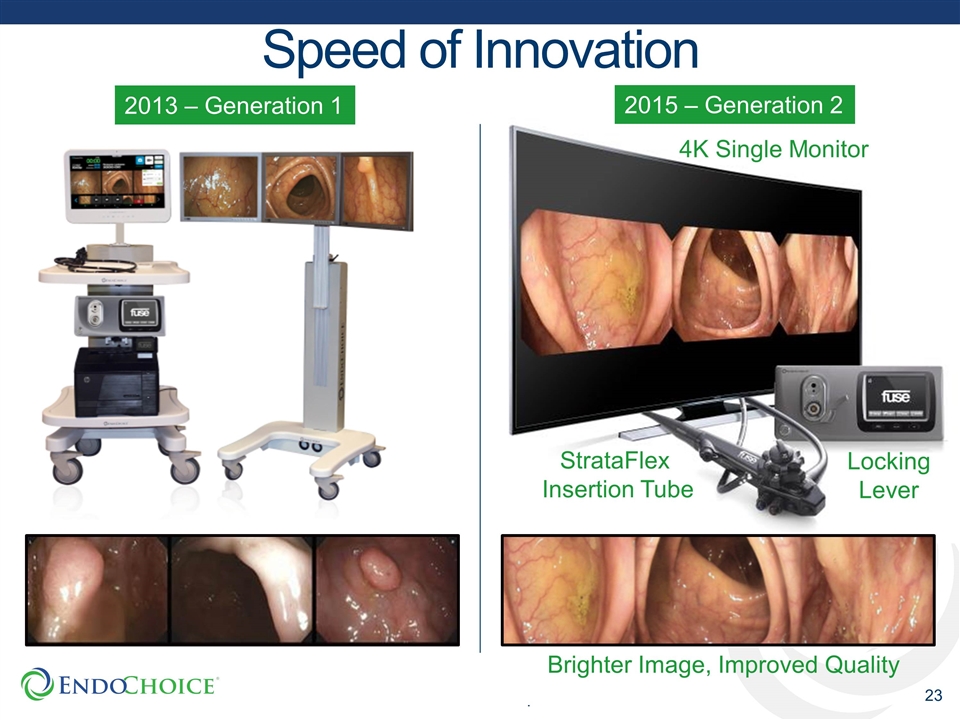
Speed of Innovation 4K Single Monitor Locking Lever Brighter Image, Improved Quality StrataFlex Insertion Tube 2013 – Generation 1 2015 – Generation 2
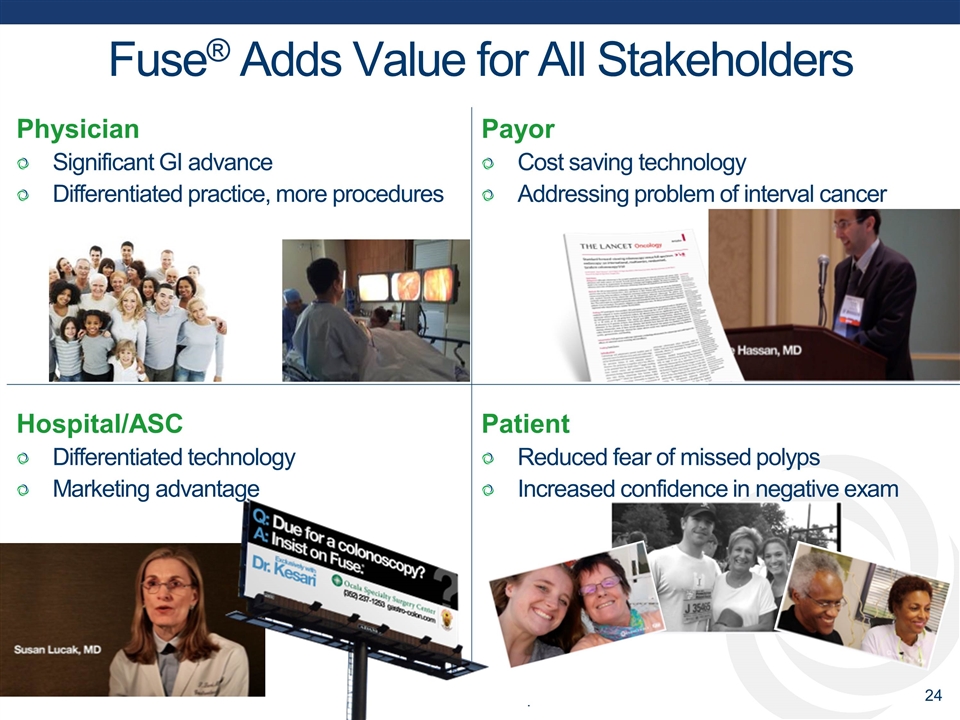
Physician Significant GI advance Differentiated practice, more procedures Payor Cost saving technology Addressing problem of interval cancer Hospital/ASC Differentiated technology Marketing advantage Patient Reduced fear of missed polyps Increased confidence in negative exam Fuse® Adds Value for All Stakeholders

Driving Commercial Success
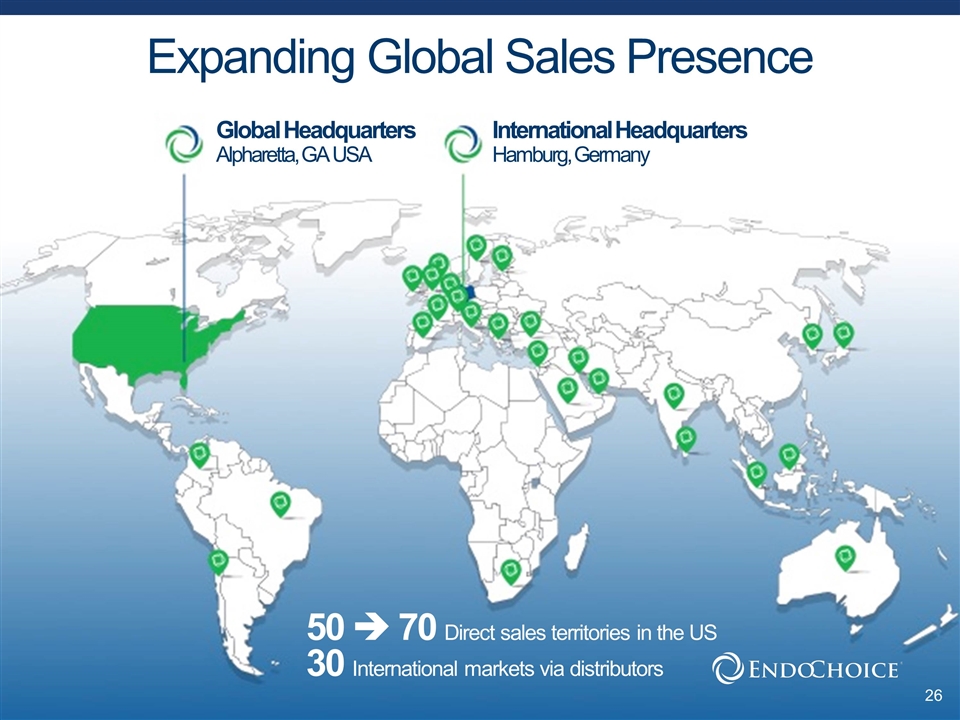
Global Headquarters Alpharetta, GA USA International Headquarters Hamburg, Germany 50 è 70 Direct sales territories in the US 30 International markets via distributors Expanding Global Sales Presence
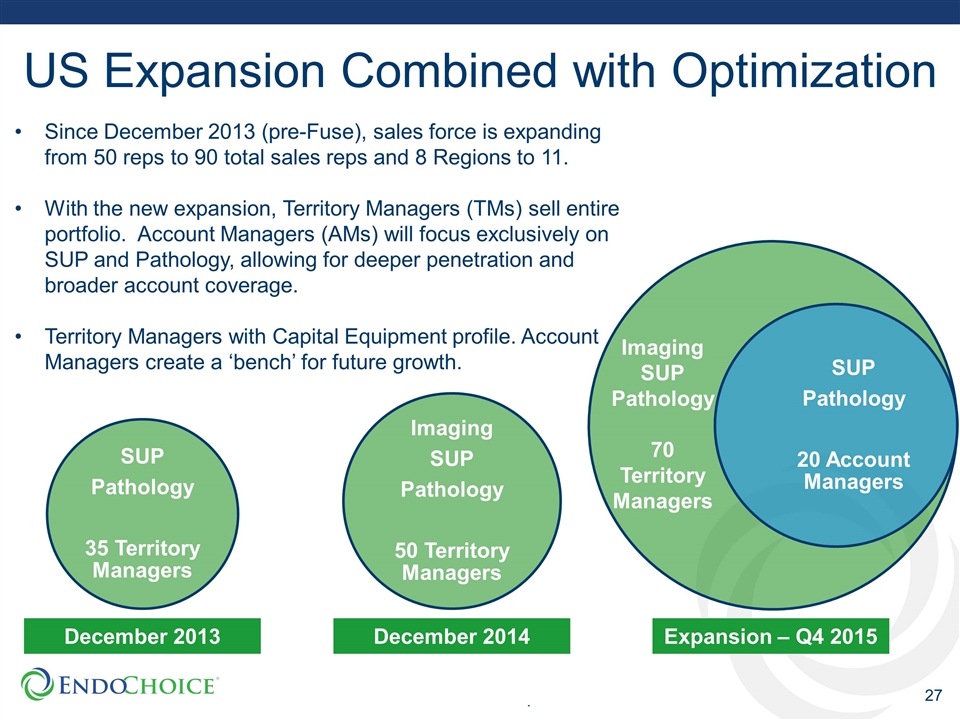
US Expansion Combined with Optimization Expansion – Q4 2015 Imaging SUP Pathology 70 Territory Managers December 2014 December 2013 Since December 2013 (pre-Fuse), sales force is expanding from 50 reps to 90 total sales reps and 8 Regions to 11. With the new expansion, Territory Managers (TMs) sell entire portfolio. Account Managers (AMs) will focus exclusively on SUP and Pathology, allowing for deeper penetration and broader account coverage. Territory Managers with Capital Equipment profile. Account Managers create a ‘bench’ for future growth. SUP Pathology 20 Account Managers SUP Pathology 35 Territory Managers Imaging SUP Pathology 50 Territory Managers
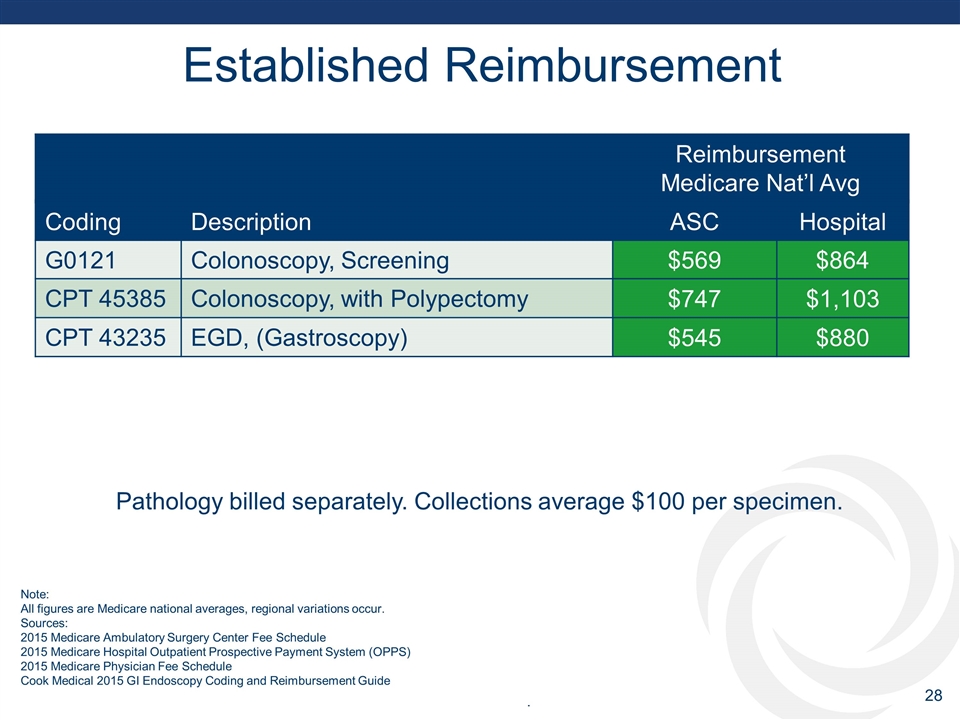
Established Reimbursement Reimbursement Medicare Nat’l Avg Coding Description ASC Hospital G0121 Colonoscopy, Screening $569 $864 CPT 45385 Colonoscopy, with Polypectomy $747 $1,103 CPT 43235 EGD, (Gastroscopy) $545 $880 Pathology billed separately. Collections average $100 per specimen. Note: All figures are Medicare national averages, regional variations occur. Sources: 2015 Medicare Ambulatory Surgery Center Fee Schedule 2015 Medicare Hospital Outpatient Prospective Payment System (OPPS) 2015 Medicare Physician Fee Schedule Cook Medical 2015 GI Endoscopy Coding and Reimbursement Guide
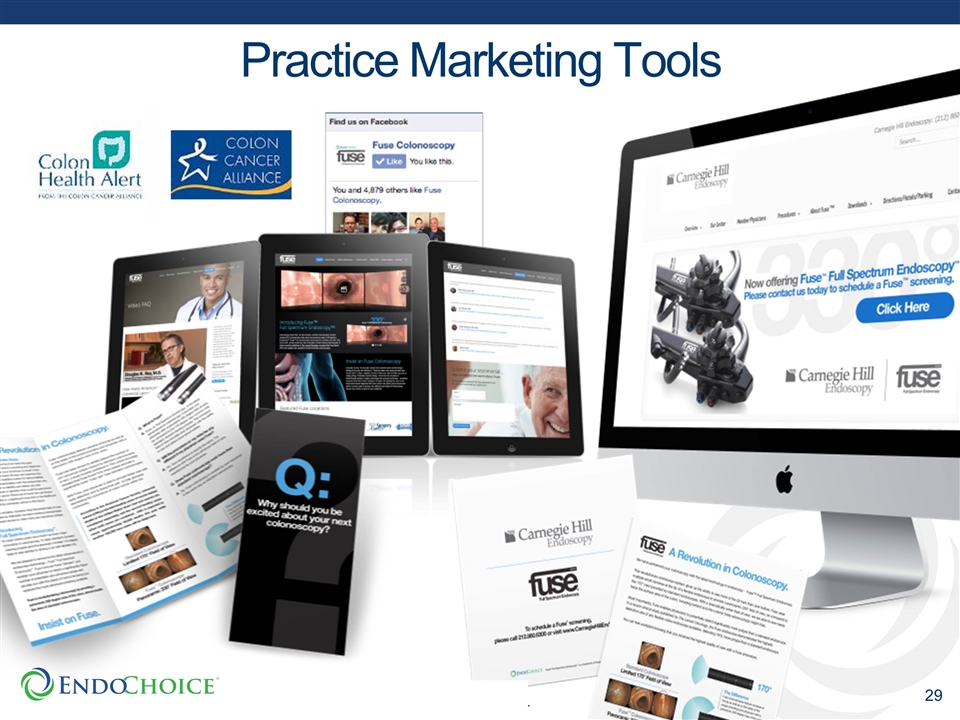
Practice Marketing Tools
Strong Financial Profile
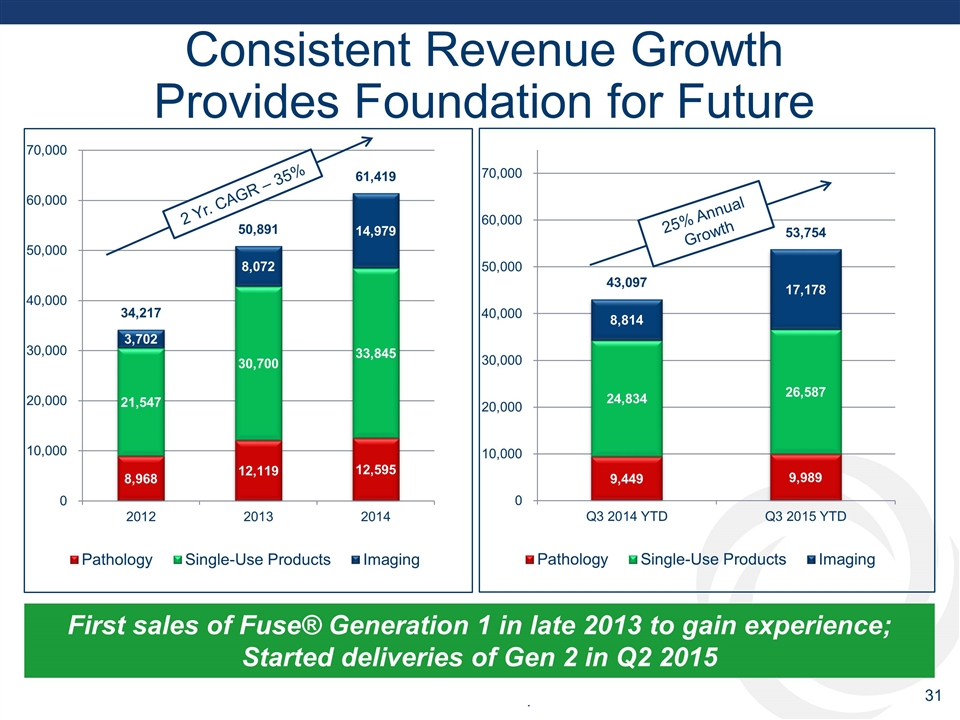
Consistent Revenue Growth Provides Foundation for Future First sales of Fuse® Generation 1 in late 2013 to gain experience; Started deliveries of Gen 2 in Q2 2015
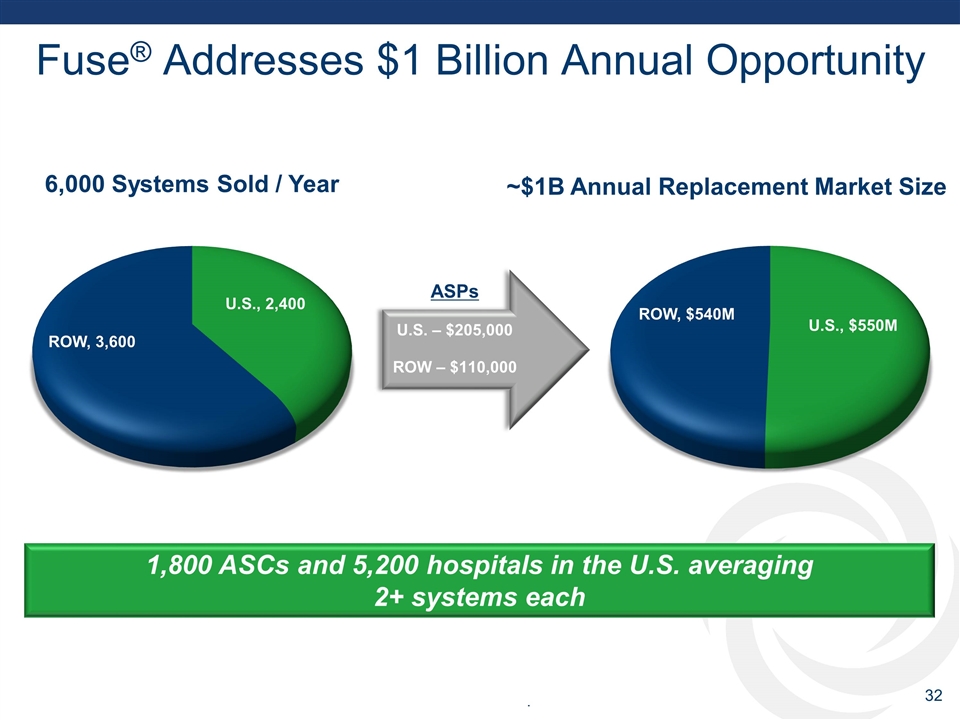
Fuse® Addresses $1 Billion Annual Opportunity ASPs U.S. – $205,000 ROW – $110,000 1,800 ASCs and 5,200 hospitals in the U.S. averaging 2+ systems each
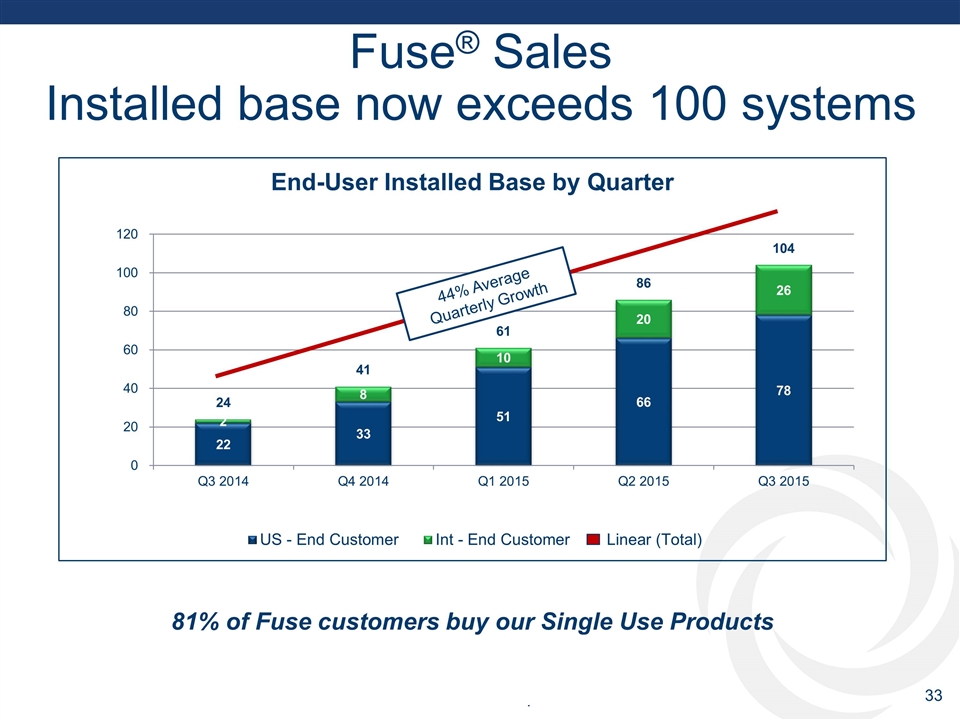
44% Average Quarterly Growth Fuse® Sales Installed base now exceeds 100 systems 81% of Fuse customers buy our Single Use Products
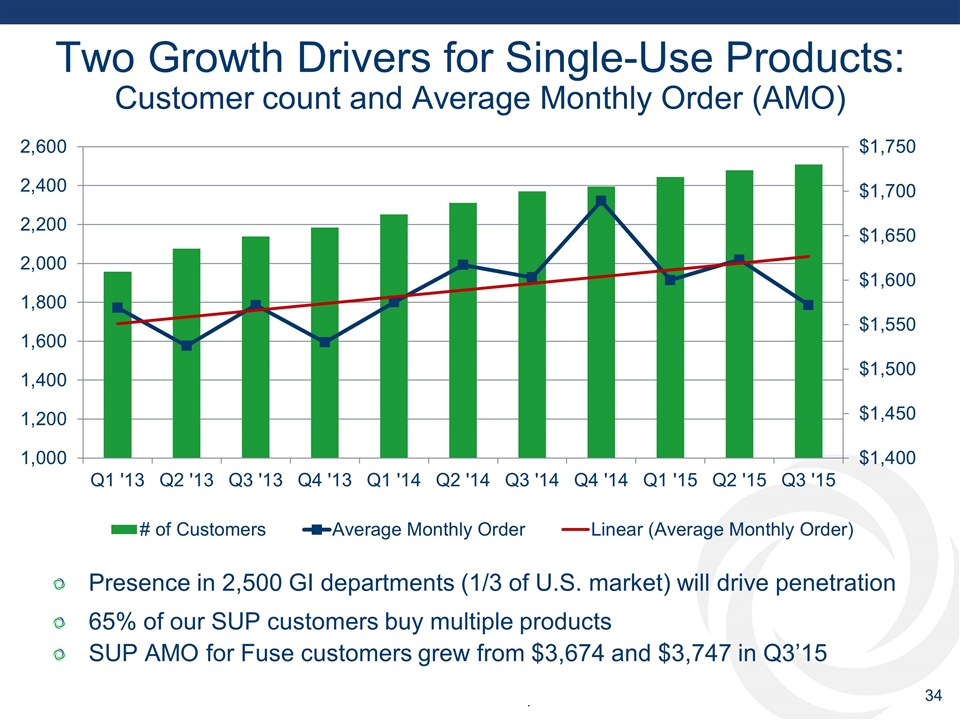
Two Growth Drivers for Single-Use Products: Customer count and Average Monthly Order (AMO) Presence in 2,500 GI departments (1/3 of U.S. market) will drive penetration 65% of our SUP customers buy multiple products SUP AMO for Fuse customers grew from $3,674 and $3,747 in Q3’15
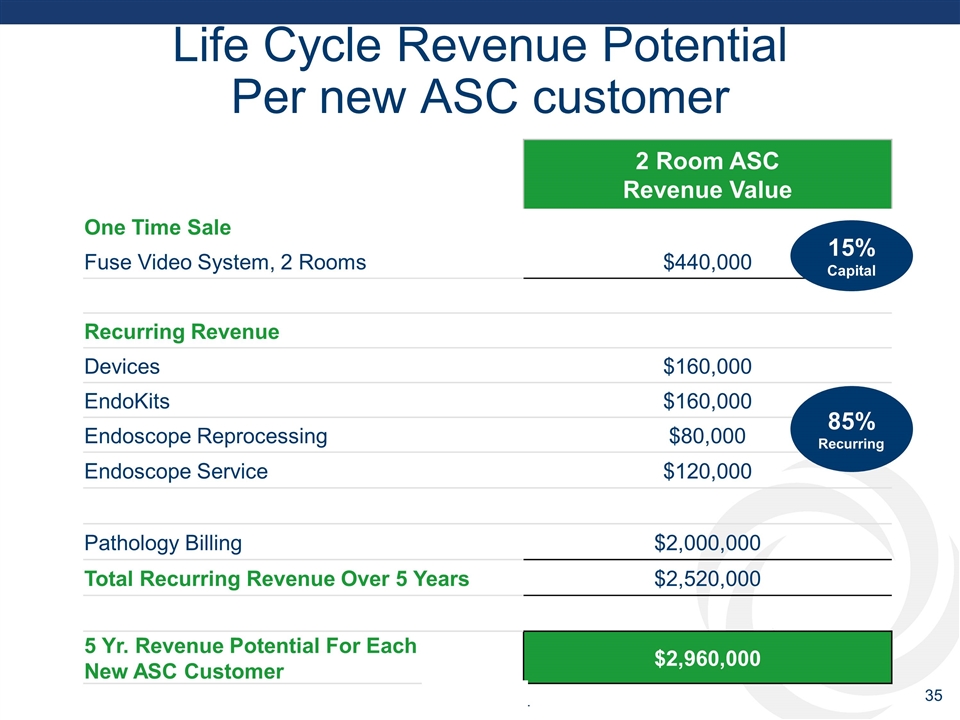
Life Cycle Revenue Potential Per new ASC customer 2 Room ASC Revenue Value One Time Sale Fuse Video System, 2 Rooms $440,000 Recurring Revenue Devices $160,000 EndoKits $160,000 Endoscope Reprocessing $80,000 Endoscope Service $120,000 Pathology Billing $2,000,000 Total Recurring Revenue Over 5 Years $2,520,000 5 Yr. Revenue Potential For Each New ASC Customer $2,960,000 85% Recurring 15% Capital
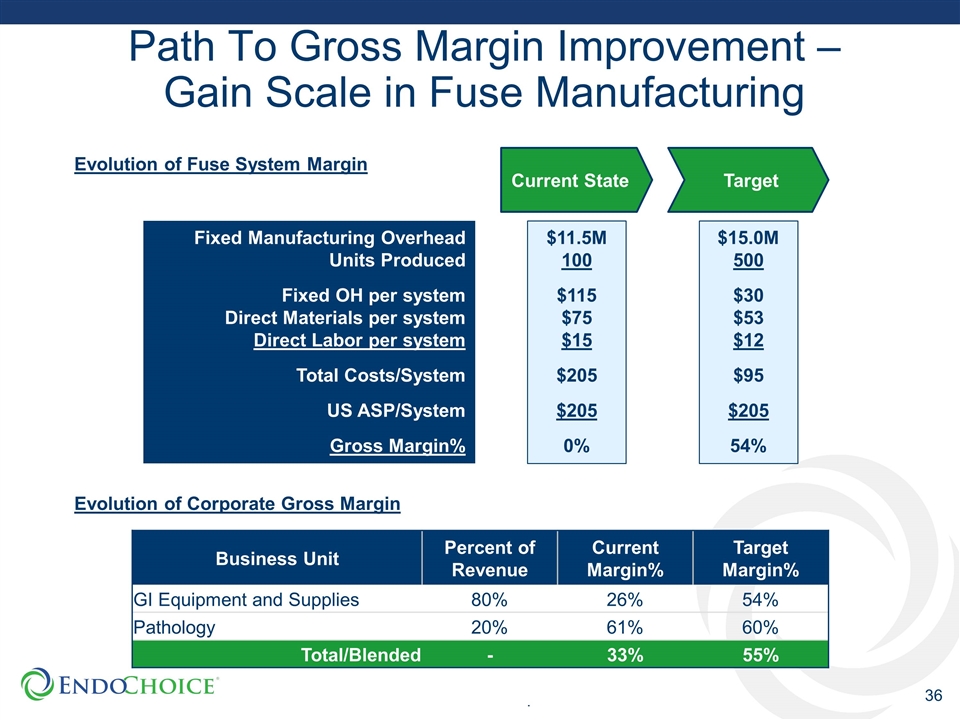
Path To Gross Margin Improvement – Gain Scale in Fuse Manufacturing Target Current State Fixed Manufacturing Overhead Units Produced Fixed OH per system Direct Materials per system Direct Labor per system Total Costs/System US ASP/System Gross Margin% $11.5M 100 $115 $75 $15 $205 $205 0% $15.0M 500 $30 $53 $12 $95 $205 54% Evolution of Fuse System Margin Business Unit Percent of Revenue Current Margin% Target Margin% GI Equipment and Supplies 80% 26% 54% Pathology 20% 61% 60% Total/Blended - 33% 55% Evolution of Corporate Gross Margin
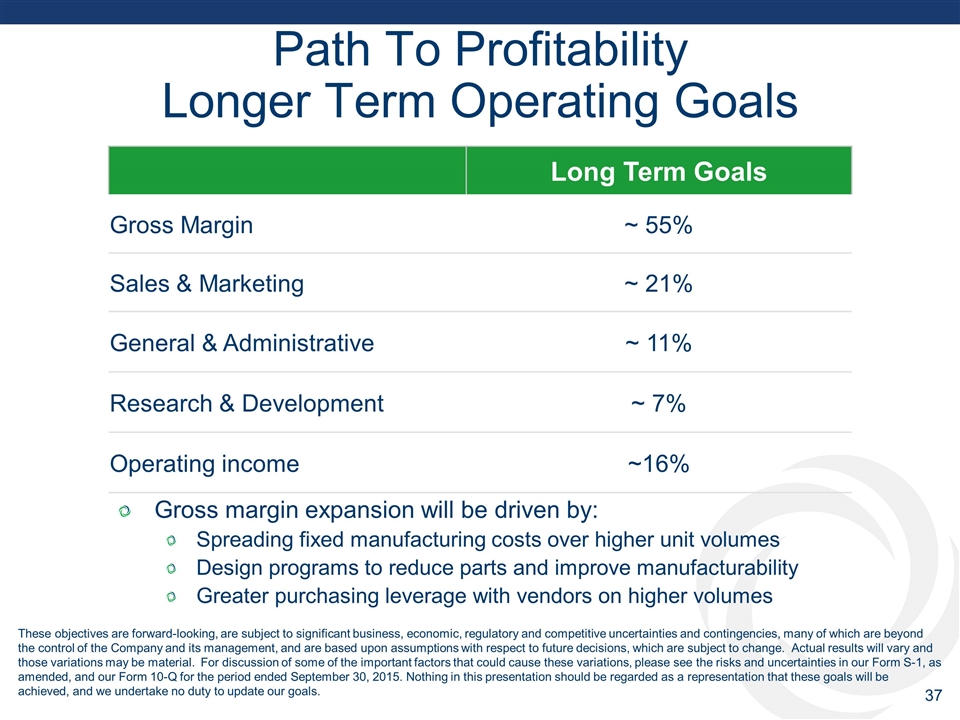
Path To Profitability Longer Term Operating Goals Gross margin expansion will be driven by: Spreading fixed manufacturing costs over higher unit volumes Design programs to reduce parts and improve manufacturability Greater purchasing leverage with vendors on higher volumes Long Term Goals Gross Margin ~ 55% Sales & Marketing ~ 21% General & Administrative ~ 11% Research & Development ~ 7% Operating income ~16% These objectives are forward-looking, are subject to significant business, economic, regulatory and competitive uncertainties and contingencies, many of which are beyond the control of the Company and its management, and are based upon assumptions with respect to future decisions, which are subject to change. Actual results will vary and those variations may be material. For discussion of some of the important factors that could cause these variations, please see the risks and uncertainties in our Form S-1, as amended, and our Form 10-Q for the period ended September 30, 2015. Nothing in this presentation should be regarded as a representation that these goals will be achieved, and we undertake no duty to update our goals.
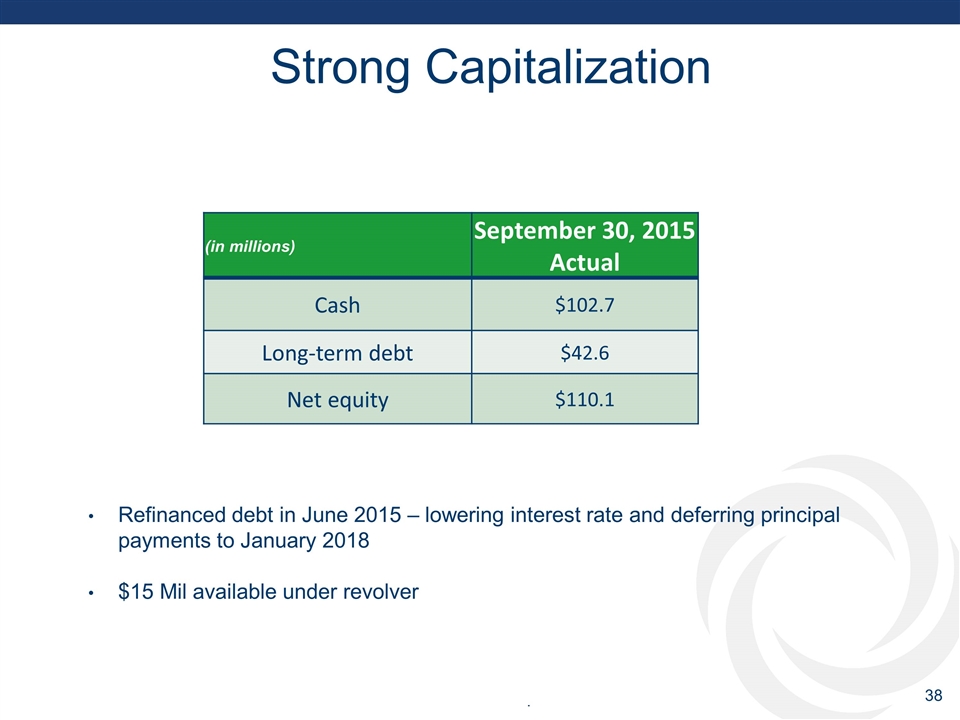
Strong Capitalization (in millions) September 30, 2015 Actual Cash $102.7 Long-term debt $42.6 Net equity $110.1 Refinanced debt in June 2015 – lowering interest rate and deferring principal payments to January 2018 $15 Mil available under revolver


