Exhibit 99.1
E - COMPASS ACQUISITION CORP. Acquisition of NYM Holding, Inc. Investor Presentation August 2016
DISCLAIMER In connection with the proposed acquisition, iFresh Inc . , a wholly owned subsidiary of E - compass Acquisition Corp . (“ECAC”), will prepare a Registration Statement containing a proxy statement/prospectus to be filed with the U . S . Securities and Exchange Commission . When completed, a definitive proxy statement/prospectus and a form of proxy will be mailed to the shareholders of ECAC seeking their approval of the transaction . Before making any voting decision, ECAC's shareholders are urged to read the proxy statements/prospectus regarding the transaction carefully and in its entirety because it will contain important information about the proposed transaction . ECAC’s shareholders will be able to obtain, without charge, a copy of the proxy statement/prospectus (when available) and other relevant documents filed with the U . S . Securities and Exchange Commission from the Commission's website at http : //www . sec . gov . ECAC's shareholders will also be able to obtain, without charge, a copy of the proxy statement/prospectus and other relevant documents (when available) by directing a request by mail to Richard Xu at E - compass Acquisition Corp . , 7 Times Square, New York, New York 10036 , or by telephone at ( 646 ) 912 - 8918 . ECAC and its directors and officers may be deemed to be participants in the solicitation of proxies from ECAC’s shareholders with respect to the proposed transaction . Information about ECAC's directors and executive officers and their ownership of ECAC's common stock is set forth in ECAC's annual report on Form 10 - K for the transition period ended March 31 , 2016 . Shareholders may obtain additional information regarding the interests of ECAC and its directors and executive officers in the transaction, which may be different than those of ECAC's shareholders generally, by reading the proxy statement/prospectus and other relevant documents regarding the proposed merger, when filed with the U . S . Securities and Exchange Commission . This document includes forward - looking statements' within the meaning of the safe harbor provisions of the United States Private Securities Litigation Reform Act of 1995 . Words such as “expect,” “estimate,” “project,” “budget,” “forecast,” “anticipate,” “intend,” “plan,” “may,” “will,” “could,” “should,” “believes,” “predicts,” “potential,” “continue,” and similar expressions are intended to identify such forward - looking statements . Forward - looking statements in this presentation include matters that involve known and unknown risks, uncertainties and other factors that may cause actual results, levels of activity, performance or achievements to differ materially from results expressed or implied by this press release . Such risk factors include, among others : future operating or financial results ; future growth expectations and acquisitions ; uncertainties as to the tinting of the transaction ; approval of the transaction by ECAC shareholders ; the satisfaction of closing conditions to the transaction ; costs related to the transaction ; the performance of NYM Holding Inc .; the cost of importing grocery items from China ; specific economic conditions in the United States ; changes in laws and regulations ; potential liability from future litigation ; the diversion of management time on acquisition and integration related issues ; modifications or adjustments to the financial statements of NYM Holdings Inc . as a result of applicable securities laws ; and general economic conditions . Actual results may differ materially from those contained in the forward - looking statements in this communication and documents filed with the U . S . Securities and Exchange Commission . ECAC undertakes no obligation and does not intend to update these forward - looking statements to reflect events or circumstances occurring after the date of this communication . You are cautioned not to place undue reliance on these forward - looking statements, which speak only as of the date of this communication . All forward - looking statements are qualified in their entirety by this cautionary statement .

NYM Holding, Inc . (NYM) is an established and leading grocery chain on the US East Coast, focused mainly on serving Chinese Americans and the Asian population generally . The market is currently highly fragmented, without any national leader across the country . The growth rate of Chinese - American population is at close to 5 times that of overall Americans . ( 1 ) Therefore, we believe that NYM is well - positioned to consolidate such a fragmented and rapidly growing market . ▪ Unique eating habits, which continue for generations after immigration to the US, include preference for live seafood, various animal parts and organs, and exotic and specialty fruits and vegetables . ▪ Chinese - Americans are now widely geographically dispersed and reside outside of urban Chinatowns ; we believe that they are unsatisfied with the offerings from mainstream supermarkets . ▪ The unique cultural demands of this underserved and growing market segment form a natural barrier to entry . ▪ NYM expects to grow its business mainly through acquisitions in the next 3 years . Potential acquisitions are expected to be along the US I - 95 corridor, from Massachusetts to Florida, and also in Texas and Illinois . ▪ NYM is aggressively developing online ordering and home delivery capability to extend its reach to Chinese residents in dispersed suburban areas . ▪ Mainstream US supermarkets tend to rely on imports from China for their Chinese ethnic offerings, which precludes the option of fresh produce and live seafood, and suffers from periodic supply disruptions . ▪ NYM enjoys long - term, stable relationships with US - based specialty farms and orchards, supplemented by robust storage and logistics capabilities . ▪ NYM has developed, through significant backward integration of its supply chain, a dependable, integrated, and scalable supply and distribution network . Growing, Yet Fragmented Market Unique Market With Entry Barriers Integrated Group With Supply Control Acquisitions and Online Capabilities INVESTMENT HIGHLIGHTS 3 (1) Source: US Census Bureau , 2010 - 2014 American Community Survey, 1 year estimates
NYM Holding, Inc . (NYM) is an established and leading grocery chain on the US East Coast, focused mainly on serving Chinese Americans and the Asian population generally . The market is currently highly fragmented, without any national leader across the country . The growth rate of Chinese - American population is at close to 5 times that of overall Americans . ( 1 ) Therefore, we believe that NYM is well - positioned to consolidate such fragmented and rapidly growing market . ▪ Unique eating habits, which continue for generations after immigration to the US, include preference for live seafood, various animal parts and organs, and exotic and specialty fruits and vegetables . ▪ Chinese - Americans are now widely geographically dispersed and reside outside of urban Chinatowns ; we believe that they are unsatisfied with the offerings from mainstream supermarkets . ▪ The unique cultural demands of this underserved and growing market segment form a natural barrier to entry . ▪ NYM expects to grow its business mainly through acquisitions in the next 3 years . Potential acquisitions are expected to be along the US I - 95 corridor, from Massachusetts to Florida, and also in Texas and Illinois . ▪ NYM is aggressively developing online ordering and home delivery capability to extend its reach to Chinese residents in dispersed suburban areas . ▪ Mainstream US supermarkets tend to rely on imports from China for their Chinese ethnic offerings, which precludes the option of fresh produce and live seafood, and suffers from periodic supply disruptions . ▪ NYM enjoys long - term, stable relationships with US - based specialty farms and orchards, supplemented by robust storage and logistics capabilities . ▪ NYM has developed, through significant backward integration of its supply chain, a dependable, integrated, and scalable supply and distribution network . Growing, Yet Fragmented Market Unique Market With Entry Barriers Integrated Group With Supply Control Acquisitions and Online Capabilities INVESTMENT HIGHLIGHTS 3 (1) Source: US Census Bureau , 2010 - 2014 American Community Survey, 1 year estimates

TRANSACTION SUMMARY 4
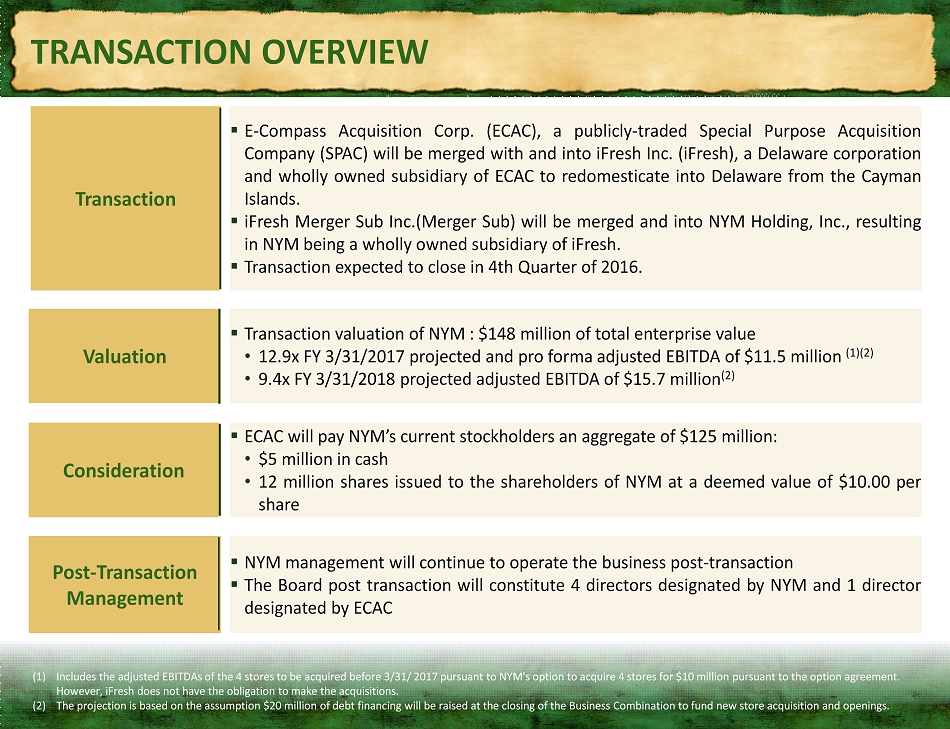
▪ E - Compass Acquisition Corp . (ECAC), a publicly - traded Special Purpose Acquisition Company (SPAC) will be merged with and into iFresh Inc . (iFresh), a Delaware corporation and wholly owned subsidiary of ECAC to redomesticate into Delaware from the Cayman Islands . ▪ iFresh Merger Sub Inc . (Merger Sub) will be merged and into NYM Holding, Inc . , resulting in NYM being a wholly owned subsidiary of iFresh . ▪ Transaction expected to close in 4 th Quarter of 2016 . ▪ Transaction valuation of NYM : $ 148 million of total enterprise value • 12 . 9 x FY 3 / 31 / 2017 projected and pro forma adjusted EBITDA of $ 11 . 5 million ( 1 )( 2 ) • 9 . 4 x FY 3 / 31 / 2018 projected adjusted EBITDA of $ 15 . 7 million ( 2 ) ▪ NYM management will continue to operate the business post - transaction ▪ The Board post transaction will constitute 4 directors designated by NYM and 1 director designated by ECAC ▪ ECAC will pay NYM’s current stockholders an aggregate of $ 125 million : • $ 5 million in cash • 12 million shares issued to the shareholders of NYM at a deemed value of $ 10 . 00 per share Transaction Valuation Consideration Post - Transaction Management TRANSACTION OVERVIEW (1) Includes the adjusted EBITDAs of the 4 stores to be acquired before 3/31/ 2017 pursuant to NYM's option to acquire 4 stores f or $10 million pursuant to the option agreement. However, iFresh does not have the obligation to make the acquisitions. (2) The projection is based on the assumption $20 million of debt financing will be raised at the closing of the Business Combina tio n to fund new store acquisition and openings.
▪ E - Compass Acquisition Corp . (ECAC), a publicly - traded Special Purpose Acquisition Company (SPAC) will be merged with and into iFresh Inc . (iFresh), a Delaware corporation and wholly owned subsidiary of ECAC to redomesticate into Delaware from the Cayman Islands . ▪ iFresh Merger Sub Inc . (Merger Sub) will be merged and into NYM Holding, Inc . , resulting in NYM being a wholly owned subsidiary of iFresh . ▪ Transaction expected to close in 4 th Quarter of 2016 . ▪ Transaction valuation of NYM : $ 148 million of total enterprise value • 12 . 9 x FY 3 / 31 / 2017 projected and pro forma adjusted EBITDA of $ 11 . 5 million ( 1 )( 2 ) • 9 . 1 x FY 3 / 31 / 2018 projected adjusted EBITDA of $ 15 . 7 million ( 2 ) ▪ NYM management will continue to operate the business post - transaction ▪ The Board post transaction will constitute 4 directors designated by NYM and 1 director designated by ECAC ▪ ECAC will pay NYM’s current stockholders an aggregate of $ 125 million : • $ 5 million in cash • 12 million shares issued to the shareholders of NYM at a deemed value of $ 10 . 00 per share Transaction Valuation Consideration Post - Transaction Management TRANSACTION OVERVIEW (1) Includes the adjusted EBITDAs of the 4 stores to be acquired before 3/31/ 2017 pursuant to NYM's option to acquire 4 stores f or $10 million pursuant to the option agreement. However, iFresh does not have the obligation to make the acquisitions. (2) The projection is based on the assumption $20 million of debt financing will be raised at the closing of the Business Combina tio n to fund new store acquisition and openings.

CAPITALIZATION AND OWNERSHIP(Pro Forma) 6 ($ in millions except share and per share data) Purchase Consideration Pro Forma Capitalization (1) Cash $ 5.0 12,000,000 Common Stocks to be Issued (3) 120.0 Cash (2) $ 23.6 Total Consideration $ 125.0 Total Liabilities (2) $ 47.2 Net Assets (2) $ 4.5 Implied Enterprise Value $ 148.0 Total Assets (2) $ 51.6 Valuation Multiples on Adjusted EBITDA Market Cap $ 142.4 FY 3/31/2017 (Projected) (5) 12.9x Pro Forma Enterprise Value $ 189.5 FY 3/31/2018 (Projected) (6) 9.4x Projected Adjusted EBITDA for FY 3/31/2017 (5) $ 11.5 Projected Adjusted EBITDA for FY 3/31/2018 (6) $ 15.7 Source and Uses (1) Pro Forma Enterprise Value/Projected Adjusted EBITDA for FY 3/31/2017 (5) 16.5x Pro Forma Enterprise Value/Projected Adjusted EBITDA for FY 3/31/2018 (6) 12.0x Sources Cash in the Trust Account $ 40.8 Debt Financing 25.0 Pro Forma Ownership (1) Total Sources $ 65.8 Uses Share Redemption $ 30.8 Post Transaction Share Cap (4) : Shares % of Total Cash Consideration 5.0 E - Compass Public Shareholders 900,000 6.3% Transaction Fees 1.7 E - Compass Insider Shares 1,000,000 7.0% Stock buyback (7) 5.0 E - Compass Private Placement Shares 341,000 2.4% Cash for Future Expansion 23.3 Shares Issued to NYM's shareholders 12,000,000 84.3% Total Uses $ 65.8 TOTAL 14,241,000 100% Notes: (1) Assumes 3,000,000 shares to be redeemed (2) As of March 31, 2016 (3) The shares will be valued at a price of $10.00 (4) Includes the underlying shares to be issued for automatic conversion of rights at the closing (5) Includes the numbers of 4 stores to be acquired before 3/31/2017 pursuant to the option agreement (6) 6 new stores will be acquired in FY 3/31/2018 (7) 500,000 shares of the lead investor to be purchased back immediately after closing

Management ▪ Dr . Henry Chang - Yu Lee – Independent Director • One of the world’s foremost forensic scientists • Founder of Henry C . Lee Institute of Forensic Science, University of New Haven • Chief Emeritus for Scientific Services, State of Connecticut • Visiting Professor at East China University of Political Science and Law • A well known member of the Chinese - American community ▪ Jianming You – Independent Director • Chairman of Board and President of CHS Media from 1993 • Vice Chairman of Board and Director of DDMC Culture Co . , Ltd . (SH : 600136 ) from 2015 • Experienced in public company operation, marketing and modern media ▪ Xiangke Fang – Independent Director • Deputy General Manager of China Southern Airlines, New York Office since 2014 • Experienced in strategy planning, staff management, customer service and corporate governance Directors ▪ Long Deng – CEO, COO, Chairman of Board • Founder of NYM since 1995 • Over 20 years of experience in Chinese grocery industry • Experienced in retail management and operation ▪ Peiling He – CFO • CFO of E - Compass from 2014, CFO of Wins Finance Holdings Inc. (formerly Sino Mercury Acquisition Corp.) since 2014 • Previously served in Deyu Agriculture Corp. and Deloitte in China • Experienced in accounting, financing and M&A transactions ▪ Lilly Deng* – VP of Legal and Finance, Director • Co - founder of NYM since 1995 • Extensive experience in internal management, compliance and financial oversight ▪ Mei Deng* – VP of HR • Joined NYM in 1998 • Contributed greatly to the success of Strong America, the first wholesale facility of NYM ▪ Richard Xu – VP of Investor Relations • CEO and Chairman of E - Compass • President and Board Director of Wins Finance (formerly Sino Mercury) from April 2014 to July 2016 • President of CIFCO International Group from 2009 to 2014 • Experienced in capital markets, financing, M&A, restructuring, cross - boarder transaction MANAGEMENT AND BOARD AFTER MERGER • Lilly Deng is wife of Long Deng. Mei Deng is sister of Long Deng.

COMPANY OVERVIEW

▪ Proposition : Established Asian/Chinese grocery supermarket chain in NE USA ▪ Market : Chinese - American population growth of 14 . 3 % between 2010 and 2014 ; Asian - American immigrants bring cultural traditions with them ▪ Founded : 1995 ▪ Current Structure : 8 stores and 2 wholesale facilities in NY, MA and FL - Chinese densely populated areas ▪ Store Size : average 10 , 000 + sq . ft . ▪ Employees : ~ 550 ▪ Vendors : exclusive distributor for 7 famous foreign brands, 7 self - owned brands and reliable supply from organic farms enables significant supply chain control COMPANY OVERVIEW Financials (1) NYM calculates gross profit as net sales less cost of sales and occupancy costs. (2) FY represents fiscal year ended March 31. (3) Grocery includes processed foods, kitchen utensils, seasoning, snacks among other non - perishables. Sales by Category(FY (2) 2016) Company Overview History and Future Plans 1995 : Started as an importer of Chinese groceries 2001: Opened first supermarket in New York 2009 - 2011: Opened and acquired other supermarkets to expand footprint 2016: Currently owns 8 stores and 2 wholesale facilities in NY, MA, FL 2020: Projected 40 stores by March 2019 39.8% 18.3% 18.1% 12.1% 9.0% 2.6% Grocery Vegetables Seafood Meat Fruit Hot Food (3) Perishables contribute ~60% of sales Sales Gross Margin (1) Adjusted EBITDA Adjusted EBITDA Margin $128M 16.7% $3.4M 2.6% $131M 20.3% $8.3M 6.3% FY (2) 2015 FY (2) 2016

ENTRY BARRIER: A QUICK VIEW 10 Bitter Melon Chinese Yam Vine Spinach • Unique fish species not found in mainstream stores • Different recipes require unique seasonings and sauces • Prepared both in parts and in whole for different purposes • Sell both in parts and in whole Highlights • Unique vegetables hard to find elsewhere • Unique cooking styles • Daily consumption items • Freshness, quality and affordability Whole Fish Head Soup Tail Soup Fish Slices

HIGHLIGHTS 11 On - line grocery shopping & delivery initiative to cover Asian/Chinese population living in suburban areas Online - Grocery Pioneer - Proprietary cold chain system developed within the last 20 years - Hibernation technology ensures seafood delivered alive over long distances with survival rate over 95% Proprietary Cold Chain System The growth rate of Chinese – American population is close to 5X that of whole population in the United States (1) Growing Market Potential - Regional leader in niche grocery market - Focus on Asian/Chinese with natural entry barrier Niche Market Leader - 16 years of track record - 8 stores and 2 wholesale locations without external equity investment - Via organic development & successful acquisitions Track Record - Strong control of vegetable and seafood sources and Chinese food vendors - Pricing advantages Strong Vendor Management Fragmented Market Unsophisticated Competitors Natural Barriers to Entry New York Mart is ready to consolidate this business sector COMPANY PROFILE INDUSTRY PROFILE (1) Source: US Census Bureau , 2010 - 2014 American Community Survey, 1 year estimates.

TARGET MARKET ANALYSIS

309.3 4.1 17.2 - 5.0 10.0 15.0 20.0 25.0 millions 318.9 4.7 19.7 Population and Growth Median Household Income and Growth TARGET MARKET ANALYSIS 13 Over the last five years, the population of Chinese and Asian American ethnic groups has outgrown the overall US population, representing a market with significant potential. These groups continue to earn more than their American counterparts, suggesting the higher spending potential of these groups. 50,046 53,657 65,060 70,183 66,201 72,689 - 20,000 40,000 60,000 80,000 2010 2014 $ US (Growth: 7.2%) US Chinese (Growth: 7.9%) US Asians (Growth: 9.8%) 2010 2014 US (Growth: 3.1%) US Chinese (Growth: 14.3%) US Asians (Growth: 14.0%) ` Source: US Census Bureau , 2010 - 2014 American Community Survey, 1 year estimates.

CHINESE POPULATION IN THE US 14 < 1.00% 1.00% - 5.00% 5.00% + WA OR NV CA UT ID MT WY SD ND NE CO AZ NM TX OK KS MN IA MO AR LA MS AL GA FL SC NC TN KY IL WI MI IN OH PA NY VT CT RI NH ME NJ MA WV VA MD DE DC HI AK < 50,000 50,000 to 100,000 100,000 to 200,000 200,000+ GA FL SC NC PA NY VT CT RI NH ME NJ MA WV VA MD DE DC Most of the Chinese - American population is concentrated on the coasts, with New York and California being the most concentrated states CHINESE - AMERICAN POPULATION CONCENTRATION EAST COAST POPULATION: 1.4M % of Total Chinese - Americans Total Chinese - American Population State Population NY 576,136 NJ 173,672 PA 118,102 FL 116,020 MD 94,733 East Coast 1,443,455 Source: US Census Bureau , 2010 - 2014 American Community Survey, 1 year estimates.

Established Brand Premier Quality Culture CULTURE IS A NATURAL ENTRY BARRIER 15 Unique Advantage to Fill the Market Niche Our cultural background gives us an in - depth understanding of unique Chinese and Asian consumption habits, which leads us to go beyond micro - competitive features, such as merchandise display and music environment. “ Fully 79 % of Asian - American adults are immigrants or foreign - born, bringing with them cultural traditions that continue to influence and guide their personal choices and customer habits” Nielsen Asian American Annual Report July 2015 Chinese Preference Mainstream Supermarket Provides Seafood • Live seafood • Variety of species: lake fish, shrimp, clams, crab, shellfish • Whole fish including head, tail and organ meat • Frozen or iced seafood • Limited species • Mainly fish fillet Vegetables • Highly diversified • Many not found in mainstream stores • High - quality and fresh vegetables are the main attraction, making up 50%+ of daily consumption • Inexpensive • Limited vegetable species • Expensive Fruit • Fruit species geared towards Chinese - Americans : Star Fruit, Pitaya, Longan, Lychee • Limited species: mainly Apple, Pear , Banana, Berries Meat • Not just meat; organs, bones etc. • Meats are treated differently for different purposes o E.g. Thinly sliced meat for hot pot o Bones used to stew soup • Typically meat in cubes or steaks. Snacks & Others • A variety of spices: o Snacks and foods reminiscent of childhood o Vinegar: Chinese from different provinces choose different kinds of vinegar o Soy sauce & dark soy sauce are for different purposes o Rice: jasmine rice; glutinous rice; short - grain rice o Noodles: Udon, fine noodles, highly variated like pasta • Unique Chinese supermarkets: o Hot pot sauce: spicy/ tomato/mild o Cooking utensils • Limited exotic choices

▪ From 2010 to 2014, the Chinese - American population has outgrown (at ~14.3%) the overall US population (at ~3.1%) and the Hispanic - American population (at ~8.9%) (1) ▪ Avg. household income for Chinese - American ($70.2K) also grew by ~7% during this period and was significantly higher than the US avg. ($53.7K) ▪ # of Chinese immigrants grew more than 40% over the past decade (2) ▪ Many unique products cannot be sourced from current US vendors ▪ Most vendors in the US are individually owned and small in size WE HAVE ONGOING STEADY PARTNERSHIP WITH FARM VENDORS WHICH PROVIDE CHINESE FRUITS AND VEGETABLES ▪ Giving us low risk and strong negotiation power over price Fast Growing Limited Vendors The Current Market Environment is Imperfect, with Significant Potential for Improvement CURRENT MARKET LANDSCAPE 16 ▪ No absolute nation - wide leader ▪ 99% of participants are small players with a single store ▪ NYM model: Similar to HMart (51 stores with $1.5 billion revenue) WE LEAD ON THE US EAST COAST ▪ Excellent timing to consolidate and cement dominant market position ▪ Younger Chinese reside outside Chinatowns, for better education and environment ▪ But large - scale Chinese supermarkets are generally only in Chinatowns ▪ Thus, weekly shopping usually involves long travel, or shorter trips with limited selections OUR ONLINE - SHOPPING INITIATIVE RESHAPES THE MARKET Highly Fragmented Unsatisfied Customers NYM has all the right ingredients to address current imperfections in the market and is READY TO CATCH THE WAVE (1) Nielsen Asian American Report, 2015, page3. (2) US Census Bureau , 2010 - 2014 American Community Survey, 1 year estimates.

BUSINESS AND OPERATIONS OVERVIEW

Our Presence Along the Value Chain – Both Forward and Backward Integration BUSINESS MODEL 18 Upstream Downstream NYM: A Market Leader that not only expands horizontally, but is also vertically integrated FARM VENDORS - Focus on most popular fruit & vegetables - Long - standing relationship - Good cooperation momentum - Mutually beneficial SUPERMARKET - 8 stores in NY, MA, FL - Avg. 10,000+ SF - Annual Transactions: 6,940,000 purchase times OTHERS ALBE FARM - Diversified base - Quality oriented in sourcing - Closely coordinated with internal inventory management LOGISTICS & STORAGE - Self - Established Cold - Chain - Over 80,000 SF of Storage in NY - Farm - to - Shelf Distribution - Regional Distribution Center Daily Delivery Daily Delivery Export Daily Delivery Suburb China City Metros Physical Store Online Store SELF - OWNED WHOLESALE - 2 wholesale facilities - Overall supply: 23% - Exclusive distributor & own brand Daily Delivery

Leading Brand on East Coast Over 20 years of Experience Established Cold Chain & Logistics ▪ History • Proprietary cold - chain logistics system built 20 years ago ▪ Key Attributes • Frozen Goods - Unique packing and temperature control enables NYM to deliver frozen goods to more than 20 states on the East Coast • Live Seafood - All live seafood is collected daily from wharfs or markets at midnight, and distributed immediately to all retailing stores to best ensure freshness and quality • Fruits & Vegetables - Adopt different storage technologies based on characteristics of different fruits and vegetables, a knowledge only obtained from years of experience - All vegetables and fruits are delivered and sold on a daily basis, to lower worn - out rate, lower human cost and keep high quality standard • Hibernation Technology - Special seafood hibernation method enables NYM to deliver live seafood to China with over 95 % survival rate Vertically Integrated CORE COMPETENCY 19 • Profit generation capacity through synergy and efficient management • Record to replicate success in various locations • Strategic and long - term expansion capacity • Capability to source globally • Benefit from cost efficiency and economies of scale • Strong negotiating power with vendors and competitors • Enhanced negotiation power with new entrants • Self - owned brands as margin boosters • Upstream: exclusive distributor and own brands, long - term farm relationships ensure constant supply throughout high and low seasons • Control over popular & core products and perishables • Downstream : Store network and online pioneer in ethnic grocery industry
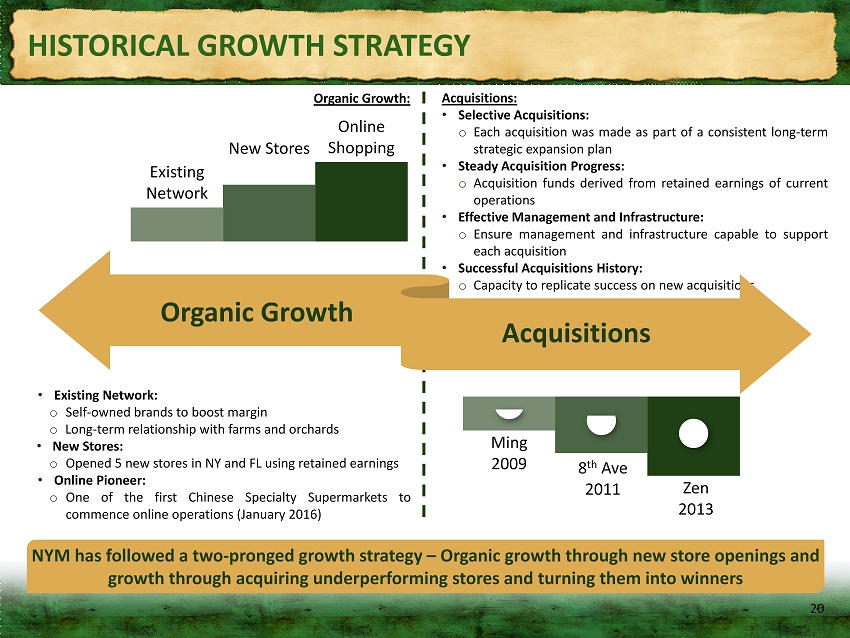
Acquisitions : • Selective Acquisitions : o Each acquisition was made as part of a consistent long - term strategic expansion plan • Steady Acquisition Progress : o Acquisition funds derived from retained earnings of current operations • Effective Management and Infrastructure : o Ensure management and infrastructure capable to support each acquisition • Successful Acquisitions History : o Capacity to replicate success on new acquisitions • Existing Network : o Self - owned brands to boost margin o Long - term relationship with farms and orchards • New Stores : o Opened 5 new stores in NY and FL using retained earnings • Online Pioneer : o One of the first Chinese Specialty Supermarkets to commence online operations (January 2016 ) HISTORICAL GROWTH STRATEGY 20 Existing Network New Stores Online S hopping Zen 2013 Ming 2009 8 th Ave 2011 NYM has followed a two - pronged growth strategy – Organic growth through new store openings and growth through acquiring underperforming stores and turning them into winners Organic Growth Acquisitions Organic Growth:
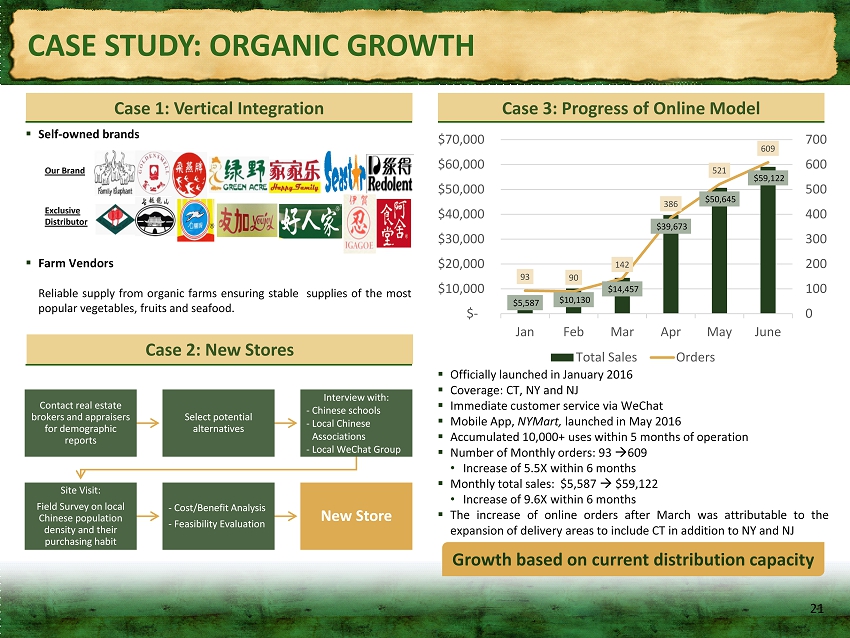
▪ Self - owned brands ▪ Farm Vendors Reliable supply from organic farms ensuring stable supplies of the most popular vegetables, fruits and seafood . Case 1: Vertical Integration Case 3: Progress of Online Model Case 2: New Stores CASE STUDY: ORGANIC GROWTH 21 ▪ Officially launched in January 2016 ▪ Coverage : CT, NY and NJ ▪ Immediate customer service via WeChat ▪ Mobile App, NYMart, launched in May 2016 ▪ Accumulated 10 , 000 + uses within 5 months of operation ▪ Number of Monthly orders : 93 609 • Increase of 5 . 5 X within 6 months ▪ Monthly total sales : $ 5 , 587 $ 59 , 122 • Increase of 9 . 6 X within 6 months ▪ The increase of online orders after March was attributable to the expansion of delivery areas to include CT in addition to NY and NJ Our Brand Exclusive Distributor Growth based on current distribution capacity $5,587 $10,130 $14,457 $39,673 $50,645 $59,122 93 90 142 386 521 609 0 100 200 300 400 500 600 700 $- $10,000 $20,000 $30,000 $40,000 $50,000 $60,000 $70,000 Jan Feb Mar Apr May June Total Sales Orders Contact real estate brokers and appraisers for demographic reports Select potential alternatives Interview with: - Chinese schools - Local Chinese Associations - Local WeChat Group Site Visit: Field Survey on local Chinese population density and their purchasing habit - Cost/Benefit Analysis - Feasibility Evaluation New Store

Case 1: Turn loser to winner – 8th Ave, acquired in 2011 CASE STUDY – SUCCESSFUL ACQUISITIONS Case 2: Proven Operation Expertise – Ming, acquired in 2009 22 Highlights and 1 Year Post Acquisition Performance ▪ Acquisition & Additional Investment $ 1 . 3 M ▪ One year Sales Growth after acquisition 63 . 6 % ▪ Annual Sales/EBITDA @ 3 / 31 / 2016 $ 19 . 5 M/ $ 1 . 6 M Highlights and 1 Year Post Acquisition Performance ▪ Acquisition & Additional Investment $ 2 . 7 M ▪ One Year Sales Growth after acquisition 107 . 3 % ▪ Annual Sales/EBITDA @ 3 / 31 / 2016 $ 21 . 8 M/ $ 2 . 7 M How was it achieved : ▪ Increased live produce from 15 % to 60 % ▪ Enriched selections, provided alternatives resulting in increased margins ▪ Introduced equipment for live products and cold - storage facilities ▪ Prior to acquisition, the store sold only imports from China ; after the acquisition, diversified by introducing products from US, Southeast Asia, Japan, and Korea, to attract more customers How was it achieved : ▪ 3 - month personnel training for live product management and equipment procedures reduced the wear - and - tear rate from 6 % to 1 % ▪ Introduced Performance - Related - Pay system, and promoted internally ▪ Renovated the store for better shopping environment 11.0 18.0 - 2.0 4.0 6.0 8.0 10.0 12.0 14.0 16.0 18.0 20.0 Pre 2012 $ million 8.2 17.0 - 2.0 4.0 6.0 8.0 10.0 12.0 14.0 16.0 18.0 Pre 2010 $ million

FUTURE GROWTH PLAN
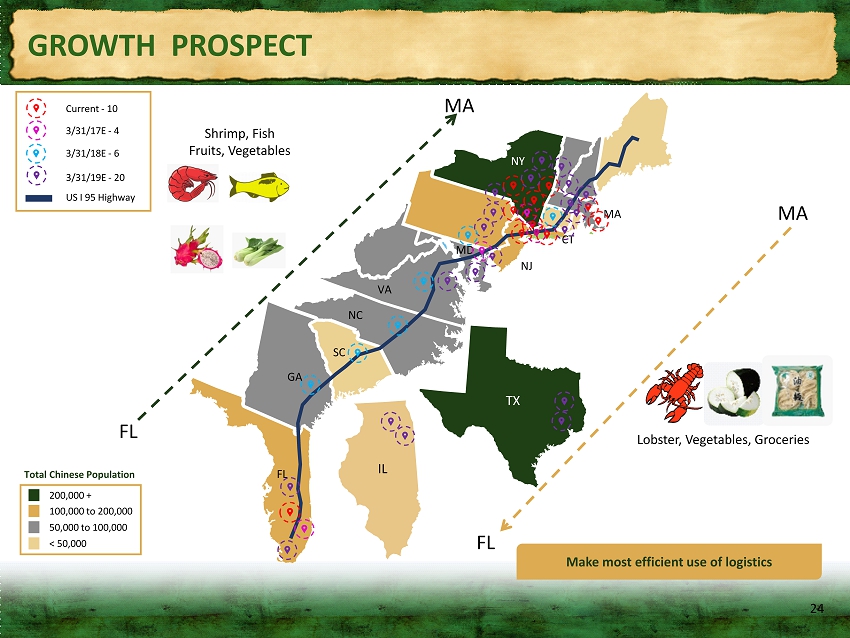
GROWTH PROSPECT 24 < 50,000 50,000 to 100,000 100,000 to 200,000 200,000 + Total Chinese Population Current - 10 3/31/17E - 4 US I 95 Highway 3/31/18E - 6 3/31/19E - 20 FL CT NJ MA MD TX IL VA NC SC GA NY MA FL Shrimp, Fish Fruits, Vegetables FL MA Lobster, Vegetables, Groceries Make most efficient use of logistics

Strategic Growth Trajectory New Store Economics Online Business FUTURE GROWTH STRATEGY 25 Metrics Estimate Store Size AVG 10,000+ sq. ft. Average Investment $2.0 - 2.5 Million Conversion Period 1 - 1.5 Years 1 st Year Sales/Adjusted EBITDA $9 Million/$0.3 Million 2 nd Year Sales/Adjusted EBITDA $16 Million/$1.0 Million 3 rd Year Sales/Adjusted EBITDA $17 Million/$1.2 Million Accelerating the ability to cover unserved population Low cost compared to opening new stores Opportunity to lead the trend in the industry Strategic growth since start Significant Potential for Greater Growth Steady, Sustainable and Strategic By 3/31/2017E $10M By 3/31/2018E $15M By 3/31/2019E $50M For: - 20 stores in NY, NJ, Boston, Chicago, Houston and Orlando areas $25M Before 3/31/2017 $50M In FY 3/31/2018 For: - Transaction fee - Working capital - 4 stores acquisition in NY, MD and FL according to option agreement For: - 6 stores to be acquired from competitors in NJ, VA, NC, SC and GA. - Potential acquisition of farm partners and seafood plant Capital Requirement To Fund Acquisitions

APPENDIX

VALUATION COMPARISON Equity Enterprise EV/Revenue EV/EBITDA P/Diluted EPS Company Name Exchang e Ticker Value Value CY16 CY17 CY 18 CY16 CY17 CY 18 CY16 CY17 CY 18 (USD in millions, except per share data) High - growth Supermarket Yonghui Superstores Co., Ltd. SHSE 601933 5297.1 4,501.2 0.6x 0.5x 0.5x 16.8x 14.2x 11.9x 40.5x 33.6x 27.4x Sprouts Farmers Market, Inc. NasdaqGS SFM 3489.7 3,625.1 0.9x 0.7x 0.7x 10.9x 9.4x 8.3x 23.9x 20.3x 17.4x S.P.Q.R. Companies Dollar Tree, Inc. NasdaqGS SFM 22654.6 29,051.2 1.4x 1.3x 1.2x 12.2x 10.9x 9.4x 25.3x 20.8x 17.6x Dollar General Corporation NYSE DG 27001.5 29,805.0 1.3x 1.2x 1.1x 11.7x 10.8x 9.9x 20.5x 18.4x 16.0x Five Below, Inc. NasdaqGS FIVE 2798.1 2,716.5 2.7x 2.2x 1.9x 19.0x 15.4x 12.8x 39.0x 31.8x 26.2x Other - High - growth Retails Shake Shack Inc. NYSE SHAK 908 896.5 3.6x 2.8x 2.2x 18.7x 15.2x 11.2x 92.2x 73.4x 53.0x Chipotle Mexican Grill, Inc. NYSE CMG 12883.2 12,613.0 3.0x 2.6x 2.2x 36.3x 18.3x 13.9x 99.4x 38.7x 27.7x Retails with SPAC structure Tile Shop Holdings, Inc. NasdaqGS TTS 404.8 566.6 2.7x 2.5x 2.2x 12.8x 11.0x 8.6x 37.8x 30.7x 23.7x Del Taco Restaurants, Inc. NasdaqCM TACO 876.7 893.8 1.3x 1.2x NA 8.2x 7.7x NA 19.4x 17.4x 15.3x Average 1.9x 1.7x 1.5x 16.3x 12.5x 10.7x 44.2x 31.7x 24.9x Median 1.4x 1.3x 1.5x 12.8x 11.0x 10.5x 37.8x 30.7x 23.7x NYM 125.0 148.0 1.0x 0.7x 0.5x 17.5x 12.9x 9.4x 34.3x 27.2x 35..8x Source: Capital IQ. Data as of July 24, 2016. (1) CY16, CY17, CY18 for DLTR and FIVE represent for fiscal year ended 1/31/2017, 1/31/2018, 1/31/2019 (2) CY16, CY17, CY18 for NYM represent for fiscal year ended 3/31/2016, 3/31/2017, 3/31/2018 (3) CY16, CY17, CY18 for other companies represent for the fiscal year ended 12/31/2016, 12/31/2017, 12/31/2018
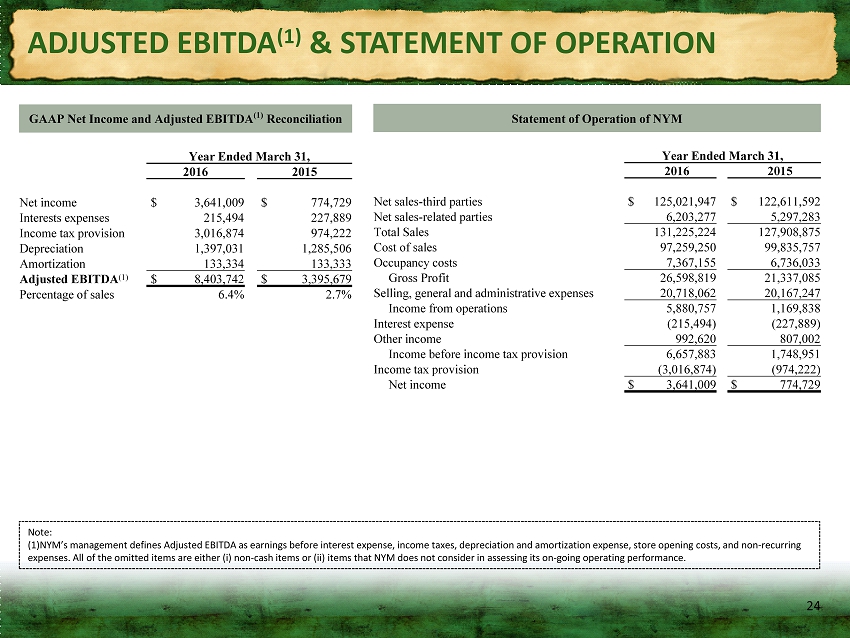
ADJUSTED EBITDA (1) & STATEMENT OF OPERATION 24 GAAP Net Income and Adjusted EBITDA (1) Reconciliation Year Ended March 31, 2016 2015 Net income $ 3,641,009 $ 774,729 Interests expenses 215,494 227,889 Income tax provision 3,016,874 974,222 Depreciation 1,397,031 1,285,506 Amortization 133,334 133,333 Adjusted EBITDA (1) $ 8,403,742 $ 3,395,679 Percentage of sales 6.4% 2.7% Statement of Operation of NYM Year Ended March 31, 2016 2015 Net sales - third parties $ 125,021,947 $ 122,611,592 Net sales - related parties 6,203,277 5,297,283 Total Sales 131,225,224 127,908,875 Cost of sales 97,259,250 99,835,757 Occupancy costs 7,367,155 6,736,033 Gross Profit 26,598,819 21,337,085 Selling, general and administrative expenses 20,718,062 20,167,247 Income from operations 5,880,757 1,169,838 Interest expense (215,494) (227,889) Other income 992,620 807,002 Income before income tax provision 6,657,883 1,748,951 Income tax provision (3,016,874) (974,222) Net income $ 3,641,009 $ 774,729 Note: (1)NYM’s management defines Adjusted EBITDA as earnings before interest expense, income taxes, depreciation and amortization exp ense, store opening costs, and non - recurring expenses. All of the omitted items are either (i) non - cash items or (ii) items that NYM does not consider in assessing its on - go ing operating performance.

BALANCE SHEET 29 Year Ended March 31, 2016 2015 ASSETS Current assets: Cash and cash equivalents $ 551,782 $ 494,738 Accounts receivable, net 1,814,533 2,073,380 Inventories, net 8,200,557 9,716,899 Prepaid expenses and other current assets 473,608 526,505 Total current assets 11,040,480 12,811,522 Property and equipment, net 9,770,382 9,235,649 Intangible assets, net 1,433,333 1,566,667 Security deposits 925,477 742,779 Advances to related parties 5,368,002 - Deferred income tax - 1,023,083 Total Assets $ 28,537,674 $ 25,379,700 LIABILITIES AND SHAREHOLDERS' EQUITY Current liabilities: Accounts payable $ 10,545,342 $ 12,237,166 Deferred revenue 145,497 99,594 Borrowing against lines of credit, current 30,185 2,765,021 Notes payable, current 208,059 306,360 Capital Lease obligations, current 48,303 67,700 Accrued expenses 1,026,871 1,254,332 Due to shareholder - 1,124,407 Tax Payable 1,693,872 233,930 Other payables, current 654,175 778,674 Total current liabilities 14,352,304 18,867,184 Borrowings against lines of credit, non - current 3,561,609 99,099 Notes payable, non - current 424,291 493,471 Capital Lease payables, non - current 40,468 82,056 Deferred rent 4,930,154 4,329,473 Other payables, non - current 37,800 37,800 Deferred income taxes 79,422 - Total liabilities 23,426,048 23,909,083 Commitments and contingencies Shareholders' equity Common stock, $0.001 par value; 10,000 shares authorized, 1,000 shares issued and outstanding 1 1 Additional paid - in capital 9,446,545 9,446,545 Accumulated deficit (4,334,920) (7,975,929) Total shareholders' equity 5,111,626 1,470,617 Total liabilities and stockholder's equity $ 28,537,674 $ 25,379,700

30 E - COMPASS ACQUISITION CORP. August 2016 Acquisition of NYM Holding, Inc.