Exhibit 99.2

TILL CAPITAL LTD.
MANAGEMENT’S DISCUSSION AND ANALYSIS
FOR THE THREE AND NINE MONTHS ENDED SEPTEMBER 30, 2016
Till Capital Ltd.
Management's Discussion and Analysis
For the three and nine months ended September 30, 2016
| BACKGROUND AND CORE BUSINESS | | 2 |
| | | |
| COPORATE DEVELOPMENTS, SIGNIFICANT TRANSACTIONS, AND FACTORS AFFECTING RESULTS OF OPERATIONS | 3 |
| • US listing | | 3 |
| • Change of presentation currency | | 3 |
| • Acquisition of Omega | | 3 |
| • Changes to Till's officers and Board of Directors | | 3 |
| • Investment portfolio | | 4 |
| • Assets held for sale | | 4 |
| • Revision of SPD promissory notes | | 4 |
| • Normal course issuer bid | | 4 |
| | | |
| REVIEW OF INVESTMENTS AND INVESTMENT PERFORMANCE | | 4 |
| • Investment policies and strategy | | 4 |
| • Investments | | 5 |
| • Investment performance | | 5 |
| | | |
| OUTLOOK | | 5 |
| | | |
| SELECTED FINANCIAL INFORMATION | | 6 |
| • Financial position as of September 30, 2016 | | 6 |
| • Results of operations for the three months ended September 30, 2016 compared to the three months ended September 30, 2015 | 6 |
| • Results of operations for the nine months ended September 30, 2016 compared to the nine months ended September 30, 2015 | 7 |
| • Cash flows for the nine months ended September 30, 2016 compared to the nine months ended September 30, 2015 | 7 |
| • Summary of quarterly results | | 8 |
| | | |
| LIQUIDITY AND CAPITAL RESOURCES | | 8 |
| • Regulatory capital | | 9 |
| | | |
| FINANCIAL INSTRUMENTS | | 9 |
| | | |
| OUTSTANDING SHARE DATA | | 10 |
| | | |
| OFF BALANCE SHEET ARRANGEMENTS | | 10 |
| | | |
| RELATED PARTY DISCLOSURES | | 10 |
| | | |
| CRITICAL ACCOUNTING ESTIMATES | | 10 |
| • Valuation of insurance and reinsurance claim liabilities and reinsurance assets | | 10 |
| • Fair value measurement of Level 3 investments | | 11 |
| • Loss of significant influence | | 11 |
| | | |
| CHANGES TO ACCOUNTING STANDARDS | | 11 |
| • New standards not yet adopted | | 11 |
| | | |
| FINANCIAL RISK MANAGEMENT | | 12 |
| • Insurance risk | | 12 |
| • Liquidity risk | | 12 |
| • Credit risk | | 12 |
| | | |
| RISKS | | 12 |
| • Factors related to the legal and regulatory environment in which Till and its subsidiaries operate | 12 |
| • Factors related to insurance claims and related reserves in Till's insurance businesses | 13 |
| • Factors related to Till's ability to compete | 13 |
| • Factors related to the business environment in which Till and its subsidiaries operate | 13 |
| | | |
| INFORMATION REGARDING FORWARD LOOKING STATEMENTS | 13 |
Till Capital Ltd.
Management's Discussion and Analysis
For the three and nine months ended September 30, 2016
The following management's discussion and analysis ("MD&A") of the activities, results of operations, and financial position of Till Capital Ltd. (“Till”) should be read in conjunction with the unaudited interim condensed consolidated financial statements for the three and nine months ended September 30, 2016 and the audited consolidated financial statements for the year ended December 31, 2015 and related notes that have been prepared in accordance with International Financial Reporting Standards (“IFRS”) as issued by the International Accounting Standards Board (“IASB”). All amounts in this MD&A are stated in United States dollars unless otherwise indicated. This report was approved by Till's Audit Committee for issuance on November 11, 2016.
Additional information related to Till, and its subsidiaries, including their Annual Information Forms can be found on SEDAR at www.sedar.com and EDGAR at www.sec.gov/edgar. Till’s website is www.tillcap.com.
BACKGROUND AND CORE BUSINESS
Till was incorporated under the laws of Bermuda on August 20, 2012 under the name Resource Holdings Ltd. On March 19, 2014, Resource Holdings Ltd. changed its name to Till Capital Ltd. in accordance with Till's bye-laws and Section 10 of the Bermuda Companies Act 1981, as amended (the "Companies Act"). Till is an exempted holding company with its principal place of business at Continental Building, 25 Church Street, Hamilton HM12, Bermuda. Till's registered office is Crawford House, 50 Cedar Avenue, Hamilton HM 11, Bermuda, and its registered agent is Compass Administration Services Ltd.
Till was formed to respond to the market need for more capacity for certain types of insurance and reinsurance. Till conducts its reinsurance business through Resource Re Ltd. (“RRL”), a wholly-owned subsidiary of Till that was incorporated in Bermuda on August 20, 2012 and licensed as a Class 3A insurance company in Bermuda by the Bermuda Monetary Authority (“BMA”) on August 28, 2013. RRL operates through the Multi-Strat Re Ltd. ("MSRE") program as a global property and casualty reinsurer to acquire medium to long-term customized reinsurance contracts with capped liabilities and diversification in specialty property and casualty lines. MSRE is a Bermuda based privately-held reinsurance company.
RRL's business strategy is to produce both underwriting profits from reinsurance policies and investment returns by investing reinsurance premiums and corporate capital. RRL generates underwriting income by offering reinsurance coverage to a select group of insurance companies, captive insurers that wish to redeploy capital more productively, profitable privately-held insurers with capital constraints that limit growth or wish to redeploy capital more productively, and insurers and reinsurers that are under regulatory, capital, or ratings stress. RRL's investment team has extensive experience in finance, trading, and operations.
On May 15, 2015, Till acquired all of the issued and outstanding shares of Omega Insurance Holdings, Inc. (“Omega”), a privately-held Toronto, Canada based insurance provider, including its subsidiaries, Omega General Insurance Company (a fully licensed insurance company) and Focus Group, Inc. Omega’s mission is to offer, in a cost effective manner, secure, innovative, and customized solutions for insurers/reinsurers exiting the market and organizations with unique insurance needs. Omega’s expertise in both the Canadian run-off phase and the Canadian start-up phase for a foreign insurance company gives Omega a strategic advantage in its two main target markets:
| • | To provide those insurers wishing to access the Canadian market an ability to do so in an efficient manner through fronting arrangements and other means. |
| • | To provide those insurers wishing to exit the Canadian market, through a dedicated company with experience in handling run-off business, an ability to facilitate such an exit so that their financial, legal, and moral obligations are met on a continuing basis, while being able to repatriate surplus capital in a more timely fashion. |
Till Capital Ltd.
Management's Discussion and Analysis
For the three and nine months ended September 30, 2016
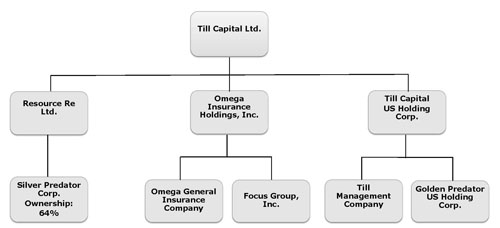
A summary of Till’s legal structure at the date of filing this report is summarized in the following chart:
CORPORATE DEVELOPMENTS, SIGNIFICANT TRANSACTIONS, AND FACTORS AFFECTIING RESULTS OF OPERATONS
US listing
To provide Till with timely access to public capital markets should it require additional capital for insurance and reinsurance programs, capital expenditures, acquisitions, or other general corporate purposes, Till completed a US exchange listing to broaden its access to capital markets. Till's Registration Statement, filed with the United States Securities and Exchange Commission (“SEC”) on Form 20-F as a Foreign Private Issuer, became effective on May 12, 2015 and Till's shares commenced trading on Nasdaq on May 26, 2015.
As of June 30, 2016, Till did not meet the Foreign Private Issuer requirements and, accordingly, has ceased to be a Foreign Private Issuer as of that date. As a result, Till will be required to file its annual 2016 financial statements in accordance with U.S. Generally Accepted Accounting Principals (US GAAP) on Form 10-K.
Change of presentation currency
Till anticipates raising capital primarily in the US market. Accordingly, Till’s Board of Directors made a decision to change Till’s financial statements’ presentation currency from Canadian dollars to US dollars starting with the second quarter of 2015 so that investors in the US can better understand Till’s financial results and financial position and so that the financial statements are more comparable to other companies in the US market.
All comparative financial statements prior to the second quarter of 2015 have been restated to US dollars in accordance with International Accounting Standard (“IAS”) 21,"The Effect of Changes in Foreign Exchange Rates" ("IAS 21"). The functional currency for Till is the US dollar. For purposes of presentation of the comparative financial statements, all assets and liabilities have been converted to US dollars at the rate prevailing at the end of the reporting period and income (loss) items and equity transactions have been converted to US dollars at the average exchange rate for the period.
Acquisition of Omega
On May 15, 2015, Till completed the acquisition of Omega Insurance Holdings, Inc., a privately-held Toronto, Canada based insurance provider, including its subsidiaries, Omega General Insurance Company (a fully licensed insurance company) and Focus Group Inc.
The purchase price of $14,042,084 represents 1.2 times the book value as of the closing date, and includes an additional amount of $730,994 for pending insurance transactions in process at the time of purchase. Till paid $12,262,988 on May 15, 2015 and $402,682 in June 2015. One of the two then pending insurance transactions closed in August 2015, for which Till paid $238,095 on August 31, 2015. The other insurance transaction was closed in October 2015, for which Till paid $456,349 on October 30, 2015. All payments were subject to a 5% hold-back of $681,970, which amount was paid to Omega shareholders on March 25, 2016.
Changes to Till's officers and Board of Directors
On January 7, 2016, Mr. William Lupien resigned as Interim Chief Executive Officer of Till, and Till appointed Dr. Terry Rickard as its interim Chief Executive Officer.
On January 22, 2016, Mr. Timothy Leybold resigned as Chief Financial Officer of Till and each of its subsidiaries. On March 17, 2016, Till appointed Mr. Brian Lupien as its Chief Financial Officer and Ms. Weiying ("Mary") Zhu as its Treasurer.
Till Capital Ltd.
Management's Discussion and Analysis
For the three and nine months ended September 30, 2016
On August 23, 2016, all of the proposed candidates, Alan S. Danson, William A. Lupien, Wayne Kauth, Roger M. Loeb and John T. Rickard were duly elected as directors for the ensuing year; and John T. Rickard was appointed as Chief Executive Officer of Till.
Investment portfolio
Till is exclusively in the insurance business. On April 17, 2014, to obtain a TSX-V listing, Till completed the acquisition of Americas Bullion Royalty Corp. ("AMB"). Till considers the assets acquired to be part of its investment portfolio that includes direct interests in publicly traded mining companies, mainly Silver Predator Corp. ("SPD"), and their underlying assets. Till continually assesses the extent of investment allocation in the mining industry and may sell these assets as part of its investment strategy. As of September 30, 2016, SPD had approximately CDN$6.3 ($4.8 million) million of its CDN$9.2 ($7.0 million) million of assets categorized as assets held for sale as described in the next section. SPD is consolidated into Till’s financial statements as Till owns 64% of SPD.
Assets held for sale
In the second quarter of 2015, Till's controlled subsidiary, SPD, announced its intention to realize value from assets by initiating a process to sell all, or part, of the tangible and intangible assets at some of its properties in Nevada. SPD’s Board of Directors and management committed to a plan to sell two of SPD's assets, namely, the Springer mining and mineral assets and the Taylor mill. During 2015 and 2016, negotiations related to the sale of these assets occurred. SPD currently considers that it is highly probable that the sales of the Springer mining and mineral assets and the Taylor mill assets will be completed within one year. Thus, pursuant to IFRS 5, "Non-current Assets Held for Sale and Discontinued Operations"(“IFRS 5”), those assets are classified as assets held for sale and are measured at the lower of carrying amount and fair value less cost to sell at September 30, 2016. SPD used the market approach to estimate the fair value less costs to sell at September 30, 2016 by using observed market comparable transactions in the United States. There have been no writedowns of those assets to date as the estimated fair value less costs to sell exceeds the carrying amount.
Revision of SPD promissory notes
In April 2016, Till amended the terms of the two promissory notes that RRL had issued to SPD. The terms on the original $4,500,000 promissory note were amended to extend the due date of the second payment of $1,500,000 plus interest to July 18, 2016 and the interest rate was increased from 4% to 10% beginning April 16, 2016. The terms on the $400,000 short term note were amended to extend the payment due date from April 30, 2016 to June 15, 2016. On June 15, 2016, the terms on the original $4,500,000 promissory note were further amended to extend the due date of the second principal payment plus accrued interest to January 17, 2017 and the interest rate was increased from 10% to 14% beginning July 18, 2016. The terms on the $400,000 short-term note were further amended to extend the payment due date to January 17, 2017 and the interest rate was increased from 14% to 15% effective June 16, 2016.
Normal course issuer bid
On September 25, 2015, Till announced that it has initiated a new normal course issuer bid ("NCIB"). Under the new NCIB, Till has approval to bid for up to 265,502 common shares, representing 10% of the 2,655,025 shares forming Till's public float. Purchased shares will be returned to treasury and canceled. Till's Board of Directors believes that the current and recent market prices for Till's common shares do not give full effect to their underlying value and that, accordingly, the purchase of common shares under the NCIB will increase the proportionate share interest of, and be advantageous to, all remaining shareholders. Till also believes the NCIB purchases will provide increased liquidity to current shareholders who would like to sell their shares. Purchases subject to the NCIB will be carried out pursuant to open market transactions through the facilities of the TSX-V/Nasdaq by Canaccord Genuity on behalf of Till. During the nine months ended September 30, 2016, Till purchased 79,000 common shares for $314,678 through the NCIB.
REVIEW OF INVESTMENTS AND INVESTMENT PERFORMANCE
Investment policies andstrategy
Till’s overall portfolio includes the portfolios of both of its wholly-owned subsidiaries, Omega and RRL. Till continually assesses the extent of investment allocation in the mining industry and may sell those assets as part of its investment strategy. Going forward, investments in both portfolios will be principally allocated to one of the following two strategies:
Highly liquid investments
Investments in highly liquid securities with a maturity of less than 30 days or that can be converted to cash within 10 days. The percentage of Till's investments allocated to highly liquid investments is expected to range between 70% and 100%.
Till Capital Ltd.
Management's Discussion and Analysis
For the three and nine months ended September 30, 2016
Long-term opportunities
Longer-term opportunistic investments where Till expects to achieve asymmetrical returns and disposition optionality that may include equity investments, debt financing arrangements, and other structured investments. Holding periods are expected to be one to three years. The percentage of Till's investments allocated to long-term opportunities is expected to range between 0% and 30%.
Investments
Till’s investments at September 30, 2016 (excluding cash of $6,493,470) totaled $17,261,323, and are primarily made up of marketable securities.
Investments in securities as of September 30, 2016:
| | | |
| Government bonds and guaranteed investment certificates | | $ | 12,929,926 | |
| Public companies – natural resource sector | | | 1,971,325 | |
| Public companies – all other sectors | | | 713,431 | |
| Private companies – natural resource sector | | | 1,546,641 | |
| Private company – all other sectors | | | 100,000 | |
| | | $ | 17,261,323 | |
Investment performance
For the nine months ended September 30, 2016, total gain on investments, including the change in unrealized loss on available for sale investments of $1,119,449 and before net ordinary investment income of $49,537, was $2,389,591, as summarized in the following table:
| | | | | | | |
| Security | | Realized Gain | | Net Change
in Unrealized
Gain or Loss | | Total |
| Equities | | $ | 2,654,269 | | | $ | (1,096,961 | ) | | $ | 1,557,308 | |
| Options, warrants, and futures | | | 613,631 | | | | (170,295 | ) | | | 443,336 | |
| Bonds | | | 225,470 | | | | (179,473 | ) | | | 45,997 | |
| Derivative liability | | | — | | | | 337,684 | | | | 337,684 | |
| Foreign currency | | | 3,060 | | | | 2,206 | | | | 5,266 | |
| TOTAL | | $ | 3,496,430 | | | $ | (1,106,839 | ) | | $ | 2,389,591 | |
Gains in equities are primarily due to a gain from the sale of Till's former controlled subsidiary Golden Predator Mining Corp. ("GPY") shares of $894,465 and increases in investments in the resource sectors. Gains in options, warrants, and futures is primarily due to profitable active trading of options and futures contracts. Gains in bonds is primarily from the sale of appreciated bonds in the Omega portfolio. Gain on derivative liability is the result of the exercise of the derivative. Net ordinary investment income is primarily interest income from bonds held at Omega and interest from the promissory note receivable, partially offset by investment related fees.
OUTLOOK
Till's shares began trading on the Nasdaq stock exchange on May 26, 2015. Till expects that the listing of its shares in the US will broaden its access to capital markets and intends to pursue the issuance of additional share capital in the near term to expand its underwriting capacity, fund purchases of additional insurance and reinsurance contracts, consider acquisitions in the insurance/reinsurance industry, and for general corporate purposes.
The insurance markets in which Till operates have historically been cyclical. During periods of excess underwriting capacity, as defined by the availability of capital, competition can result in lower pricing and less favorable policy terms and conditions for insurers and reinsurers. Till has entered the reinsurance business at a time when the reinsurance capital is at its highest, and, as such, the margins that can be earned on some reinsurance programs are now at low levels. Till expects to find its own market niche in acquisitions such as Omega and agreements with MSRE to generate underwriting income. Historically, underwriting capacity has been affected by several factors, including industry losses, the impact of catastrophes, changes in legal and regulatory guidelines, new entrants, investment results (including interest rate levels), and the credit ratings and financial strength of competitors. RRL anticipates writing new reinsurance premiums to modestly outpace claims paid in an effort to grow the business. As such, Till intends to maintain flexibility in the liquidity of investable assets and/or excess capacity in letters of credit to maintain sufficient available assets to cover claim payments.
Till Capital Ltd.
Management's Discussion and Analysis
For the three and nine months ended September 30, 2016
On May 15, 2015, Till acquired Omega Insurance Holdings, Inc for approximately $14.0 million. Omega has a history of profitable operations and Till expects Omega will continue to generate operating income that will be consolidated with Till's financial results.
Till's investment strategies will be a key aspect for generating future profitability. Omega's investment strategy has previously been focused exclusively in Canadian federal and provincial government bonds that historically have provided stable but low returns. Omega has made revisions to its investment policy to enhance future investment returns by allowing a portion of its portfolio to be invested in low-risk equity, futures, and options strategies.
SELECTED FINANCIAL INFORMATION
Financial position as of September 30, 2016
Cash increased $4,973,589 to $6,493,470 (December 31, 2015 - $1,519,881) due primarily to the sale of investments, partly offset by a decrease in accounts payable and accrued liabilities.
Investments decreased $7,841,868 to $17,261,323 (December 31, 2015 - $25,103,191) due primarily to the sale of investments, partially offset by increases in the value of investments.
Unpaid claims ceded increased $441,758 to $8,287,660 (December 31, 2015 - $7,845,902) due primarily to the strengthening of the Canadian dollar compared to the US dollar. All unpaid claims ceded are from Omega.
Unearned premiums ceded increased $849,980 to $2,329,612 (December 31, 2015 - $1,479,632) due to underlying annual policies for one of Omega's significant programs renewing in February and March. The unearned premiums ceded to reinsurers will be earned over subsequent months. The increase is also due to the strengthening of the Canadian dollar compared to the
US dollar. All unearned premiums ceded are from Omega.
Unearned premiums increased $971,764 to $2,757,884 (December 31, 2015 - $1,786,120) due to the annual insurance policies for one of Omega's programs renewing in February and March. The unearned premium will be earned over subsequent months. The increase is also due to the strengthening of the Canadian dollar compared to the US dollar. All unearned premiums are from Omega.
Results of operations for the three months ended September 30, 2016 compared to the three months ended September 30, 2015
Net income for the three months ended September 30, 2016 increased $6,568,538 to $858,524 (three months ended September 30, 2015 - loss of $5,710,014). Individual items contributing to or partially offsetting this increase in net income are as follows:
| • | Net premiums earned in the three months ended September 30, 2016 were $232,070, which amount is the net of premiums written of $9,983,193 and premiums ceded to reinsurers of $9,751,123 (three months ended September 30, 2015 - $901,155). All premiums earned are from Omega. RRL did not enter into new contracts in either of the three month periods ended September 30, 2016 or 2015. The decrease of $669,085 is due to the premium of two assumption reinsurance transactions included in the third quarter of 2015 while no assumption reinsurance transactions were completed in the third quarter of 2016. |
| • | Net investment gain for the three months ended September 30, 2016 increased $1,581,106 to $1,460,767 (three months ended September 30, 2015 - loss of $120,339) due primarily to trading gains in equities and increased interest rate on the promissory note receivable. Investment gains also included active options and futures trading, increases in the value of bonds held in the Omega portfolio, and interest income primarily from the Omega portfolio and the promissory note receivable. These gains were partially offset by investment related fees. The 2015 loss was a result of trading expenses and losses, principally in futures contracts and equities. |
| • | General and administrative expenses for the three months ended September 30, 2016 decreased $81,496 to $457,771 (three months ended September 30, 2015 - $539,267) due to lower professional services fees incurred. |
| • | Staff costs for the three months ended September 30, 2016 decreased $802,274 to $275,888 (three months ended September 30, 2015 - $1,078,162) due primarily to reduced staff. |
Till Capital Ltd.
Management's Discussion and Analysis
For the three and nine months ended September 30, 2016
| • | Mineral property impairment for the three months ended September 30, 2016 was $nil (three months ended September 30, 2015 - $3,380,907). The 2015 write-off was primarily related to the assets owned by Till's controlled subsidiary SPD. |
| • | Foreign exchange loss for the three months ended September 30, 2016 decreased $822,261 to $36,167 (three months ended September 30, 2015 - $858,428) as a result of less weakening of the Canadian dollar compared to the US dollar during the three months ended September 30, 2016 as compared to the three months ended September 30, 2015. |
Results of operations for the nine months ended September 30, 2016 compared to the nine months ended September 30, 2015
Net income for the nine months ended September 30, 2016 increased $13,671,788 to $1,563,002 (nine months ended September 30, 2015 - loss of $12,108,786). Individual items contributing to or partially offsetting this increase in net income are as follows:
| • | Net premiums earned in the nine months ended September 30, 2016 were $594,278, which amount is the net of premiums written of $29,278,101 and premiums ceded to reinsurers of $28,683,823 (nine months ended September 30, 2015 - $941,077). All premiums earned are from Omega, which was acquired on May 15, 2015. RRL did not enter into new contracts in either the nine months ended September 30, 2016 or 2015. |
| • | Net investment gain for the nine months ended September 30, 2016 increased $4,428,552 to $3,558,577 (nine months ended September 30, 2015 - loss of $869,975) due primarily to a gain from the sale of GPY shares and the resulting reclassification of the realized gain from other comprehensive income to profit and loss ($894,465) and the elimination of the GPY share options ($337,684). Investment gains also included trading gains in equities in both the resource and non-resource sectors, active options and futures trading, increases in the value of bonds held in the Omega portfolio, and interest income primarily from the Omega portfolio and the promissory note receivable. These gains were partially offset by investment related fees. The 2015 loss was a result of trading expenses and losses, principally in futures contracts and equities. |
| • | Claims and claim adjustment expenses for the nine months ended September 30, 2016 were $646,964 (nine months ended September 30, 2015 - $253,215) due to nine months of activity from Omega in 2016 compared to only four and a half months of activity from Omega in 2015. No new reinsurance contracts were entered into by RRL in the nine months ended September 30, 2016 and 2015. |
| • | General and administrative expenses for the nine months ended September 30, 2016 increased $259,187 to $1,483,153 (nine months ended September 30, 2015 - $1,223,966) due primarily to higher professional services fees incurred and the inclusion of nine months of Omega's general and administrative expenses compared to only four and a half months in 2015. |
| • | Staff costs for the nine months ended September 30, 2016 decreased $1,695,473 to $1,120,914 (nine months ended September 30, 2015 - $2,816,387) due primarily to reduced staff, partially offset by the inclusion of Omega's staff costs and severance payments to a former Till executive officer. |
| • | Stock-based compensation for the nine months ended September 30, 2016 decreased $426,701 to $26,941 (nine months ended September 30, 2015 - $453,642) due to fewer option grants remaining to be expensed. |
| • | Write-off of property, plant, and equipment for the nine months ended September 30, 2016 was $nil (nine months ended September 30, 2015 - $4,434,158). The 2015 write-off was primarily related to the assets owned by Till's controlled subsidiary SPD. |
| • | Foreign exchange gain for the nine months ended September 30, 2016 was $195,517 (nine months ended September 30, 2015 - loss of $2,514,159) as a result of the strengthening of the Canadian dollar compared to the US dollar during the nine months ended September 30, 2016 compared to the weakening of the Canadian dollar compared to the US dollar during the nine months ended September 30, 2015. |
Cash flows for the nine months ended September 30, 2016 compared to the nine months ended September 30, 2015
Cash outflows from operating activities for the nine months ended September 30, 2016 increased $6,549,343 to $5,813,257 (nine months ended September 30, 2015 - inflows of $736,086) due principally to 2015's receipt of reinsurance receivable of $6,087,262 (2016 - $nil).
Cash flows from investing activities for the nine months ended September 30, 2016 increased $18,439,759 to $10,527,026 (nine months ended September 30, 2015 - cash outflows of $7,912,733) due primarily to the purchase of Omega in May 2015 and net sales of investments for the nine months ended September 30, 2016 of $10,000,783 (nine months ended September 30, 2015 - $4,711,810).
Till Capital Ltd.
Management's Discussion and Analysis
For the three and nine months ended September 30, 2016
Cash flows from financing activities for the nine months ended September 30, 2016 increased $1,151,223 to $259,820 (nine months ended September 30, 2015 - cash outflows of $891,403) due primarily to Till's controlled subsidiary SPD's private placements and less purchase of treasury shares during the nine months ended September 30, 2016.
Summary of quarterly results
| | 2016 | 2015 | 2014 |
| | Jul - Sep | Apr - Jun | Jan - Mar | Oct - Dec | Jul - Sep | Apr - Jun | Jan - Mar* | Oct - Dec* |
| Net revenues (negative revenues) | $ | 1,814,193 | | $ | 2,551,652 | | $ | 202,495 | | $ | (1,123,817 | ) | $ | (4,384,526 | ) | $ | (217,466 | ) | $ | (260,741 | ) | $ | 6,291,024 | |
| Net income (loss) | 858,524 | | 1,462,760 | | (758,280 | ) | (3,524,030 | ) | (5,710,014 | ) | (3,090,770 | ) | (3,308,000 | ) | (3,913,204 | ) |
| Net income (loss) for Till shareholders | 1,029,139 | | 1,603,807 | | (769,434 | ) | (3,478,365 | ) | (4,507,516 | ) | (3,094,872 | ) | (2,907,332 | ) | (3,398,911 | ) |
| | | | | | | | | |
| Basic and diluted income (loss) per share of Till | $ | 0.30 | $ | 0.47 | | $ | (0.22 | ) | $ | (1.03 | ) | $ | (1.31 | ) | $ | (0.90 | ) | $ | (0.81 | ) | $ | (1.09 | ) |
*Restated. See Change in presentation currency on page 3.
In the quarter ended December 31, 2014, net revenue was $6.3 million as a result of Till's entry into the reinsurance business, and a loss of $3.9 million primarily as a result of impairment charges on mineral interests of Till's controlled subsidiaries.
In the first quarter of 2015, Till incurred a net investment loss of $0.3 million and operating expenses of $3.0 million.
In the second quarter of 2015, Till incurred a net investment loss of $0.3 million, premiums earned and other income of $0.1 million, and operating expenses of $2.9 million.
In the third quarter of 2015, Till incurred premiums earned and other income of $1.0 million, a net investment loss of $0.1 million, a reversal of premiums earned of $5.2 million, a reversal of claims and claims adjustment expenses of $5.1 million, mineral property impairment of $3.4 million, and operating expenses of $3.1 million. The reversal of premiums earned and claims and claims adjustment expenses are a result of the novation of RRL's reinsurance contracts.
In the fourth quarter of 2015, Till incurred negative revenue of $1.0 million as a result of insurance premiums ceded to reinsurers being higher than insurance premiums written and operating expenses of $1.4 million.
In the first quarter of 2016, Till earned net insurance premiums of $0.1 million and investment and other income of $0.1 million. Expenses of $1.0 million included $0.2 million in claims and claim adjustment expenses, $1.1 million in general and administrative expenses and staff costs (including $0.26 million in payments to the former CFO under a separation agreement), and $0.2 million in foreign exchange gains.
In the second quarter of 2016, Till earned net insurance premiums of $0.2 million and investment and other income of $2.3 million. Expenses of $1.0 million included $0.2 million in claims and claim adjustment expenses, and $0.8 million in general and administrative expenses and staff costs.
In the third quarter of 2016, Till earned net insurance premiums of $0.2 million and investment and other income of $1.6 million. Expenses of $1.0 million included $0.2 million in claims and claim adjustment expenses, and $0.7 million in general and administrative expenses and staff costs.
LIQUIDITY AND CAPITAL RESOURCES
At September 30, 2016, Till had working capital of $20,457,153 including cash of $6,493,470, as compared to a working capital of $18,956,390, including cash of $1,519,881 at December 31, 2015. Also included in working capital at September 30, 2016 were investments with a market value of $17,261,323 (December 31, 2015 - $25,103,191). Till has no meaningful long-term debt.
Till expects to invest in insurance, reinsurance, and business acquisitions that will require additional capital. Till does not presently have any plans to incur any material indebtedness in the ordinary course of business other than temporary borrowings directly related to the management of the investment portfolio.
Till Capital Ltd.
Management's Discussion and Analysis
For the three and nine months ended September 30, 2016
Till manages capital on an aggregate basis, as well as individually for each regulated entity. Its insurance subsidiaries are subject to the regulatory capital requirements defined by Office of Superintendent of Financial Institutions (Canada) (“OSFI”) for Omega and the Bermuda Monetary Authority (“BMA”) for RRL.
Till’s objectives when managing capital consist of:
| • | | Ensuring policyholders in the insurance and reinsurance subsidiaries are well protected while maintaining strong regulatory capital levels (see Regulatory capital section below). |
| • | | Maximizing long-term shareholder value by optimizing capital used to operate and grow Till. |
Till views capital as a scarce and strategic resource. This resource protects the financial well-being of the organization and is also critical in enabling Till to pursue strategic business opportunities. Adequate capital also acts as a safeguard against possible unexpected losses, and as a basis for confidence in Till by shareholders, policyholders, creditors, and others. For the purpose of capital management, Till has defined capital as shareholders’ equity, excluding accumulated other comprehensive income ("AOCI"). Capital is monitored by Till's Board of Directors. Till's insurance subsidiaries are subject to a minimum amount of capital which, in the case of Omega, is CDN$10 million and, in the case of RRL, is $1 million. Those amounts are not available to satisfy financial liabilities of Till or other subsidiaries. Both Omega and RRL are in compliance with those requirements.
Regulatory capital
Omega
OSFI has established an industry-wide supervisory target capital ratio of 150% to provide an amount above the minimum requirement. Management of Omega has set an internal target of 200%. To ensure that there is minimal risk of breaching the supervisory target, Omega has established a higher internal threshold in excess of which, under normal circumstances, Till will maintain its capital. Total capital available in Omega principally represents total shareholder equity less specific deductions for disallowed assets, including goodwill and intangible assets, net of related deferred tax liabilities. Total capital required is calculated by classifying assets and liabilities into categories and applying prescribed risk factors to each category. That amount is further increased by an operational risk margin, based on the overall riskiness of a property/casualty insurer (its capital required) and its premium volume. Capital required is then reduced by a credit for diversification between investment risk and insurance risk. Reinsurance is utilized to protect Till’s capital from catastrophic loss.
As of September 30, 2016, Omega had total capital available of CDN$8.94 ($6.8) million and a total capital required of CDN$2.16 ($1.64) million. The resulting Minimum Capital Test ratio is at 414% compared to OSFI’s supervisory minimum of 100% and supervisory target of 150% for Canadian property and casualty insurance companies. In addition to that test, there is a minimum capital requirement in Canada of CDN$10 million set by OSFI as the minimum amount of capital for an insurance company. Omega has met that requirement.
Resource Re Ltd.
RRL is registered as a Class 3A insurer under The Bermuda Insurance Act 1978 and related regulations (the “Act”) that requires that RRL file a statutory financial return and maintain certain measures of solvency and liquidity. As of September 30, 2016, RRL met the required Minimum General Business Solvency Margin and the required Minimum Liquidity Ratio.
The required Minimum General Business Solvency Margin at September 30, 2016 and December 31, 2015 was $1,000,000. RRL’s statutory capital and surplus at September 30, 2016 was $4,194,944 (December 31, 2015 - $3,660,932).
The Minimum Liquidity Ratio is the ratio of the insurer’s relevant assets to its relevant liabilities. The minimum allowable ratio is 75%. RRL’s relevant assets at September 30, 2016 were $6,875,227 (December 31, 2015 - $5,655,463) and 75% of its relevant liabilities as of September 30, 2016 were $62,277 (December 31, 2015 - $28,671).
Distributions by RRL to Till are restricted to the extent that any such distribution would result in RRL not meeting the required Minimum General Business Solvency Margin or the required Minimum Liquidity Ratio.
FINANCIAL INSTRUMENTS
Till reviews its investment portfolio together with the reinsurance operations on a periodic basis to ensure that Till has sufficient capital to withstand modeled losses on either or both of its investment and reinsurance portfolios. Till periodically analyzes both its assets and liabilities, including the components of risk in the portfolio, such as concentration risk and liquidity risk.
Till Capital Ltd.
Management's Discussion and Analysis
For the three and nine months ended September 30, 2016
OUTSTANDING SHARE DATA
At September 30, 2016 and through the date of this filing, Till had 3,429,284 issued and outstanding common shares, 110,704 outstanding stock options, and 179,500 outstanding warrants.
OFF BALANCE SHEET ARRANGEMENTS
At September 30, 2016, Till had no material off-balance sheet arrangements.
RELATED PARTY DISCLOSURES
Key management personnel comprise all members of Till's Board of Directors and executive officers. The compensation of key management personnel comprises salaries, fees, share-based awards, and other employee benefits. Total compensation amounted to $0.7 million for the nine months ended September 30, 2016 (nine months ended September 30, 2015 - $0.6 million). The 2016 amount includes $252,875 paid to the former CFO as part of a separation agreement. No additional payments are required under that separation agreement.
Till is party to service agreements with SPD whereby Till provides accounting, corporate communications, technical services, and other management services on a cost-plus recovery basis, and was party to service agreements with GPY whereby Till provided similar services to SPD on a cost-plus recovery basis. The agreements with GPY were terminated on July 31, 2015. The technical service agreement with SPD was terminated on January 1, 2016, leaving only the accounting and corporate communications service agreements in effect. During the nine months ended September 30, 2016, Till charged SPD a total of $27,000 (nine months ended September 30, 2015 - $192,836) and GPY a total of $nil (nine months ended September 30, 2015 - $79,376) for those services.
CRITICAL ACCOUNTING ESTIMATES
The preparation of condensed consolidated financial statements in accordance with IFRS requires the use of certain critical accounting estimates and judgments. It also requires management to exercise judgment in applying the applicable accounting policies. Those judgments and estimates are based on management’s knowledge of the relevant facts and circumstances, input from certain contractors, taking into account previous experience, but actual results may differ from the amounts reported in the financial statements.
Areas of estimation and judgment that have the most significant effect on the amounts recognized in the financial statements include:
Valuation of insurance and reinsurance claim liabilities and reinsurance assets
Estimates must be made for both the expected ultimate cost of claims reported at the reporting date and for the expected ultimate cost of incurred but not yet reported ("IBNR") claims. A significant amount of time may pass before the ultimate claims cost can be established with certainty, and, for some types of policies, IBNR claims form the majority of the liability.
The ultimate cost of outstanding claims is estimated by using a range of actuarial claim projection techniques. The principal assumption underlying those techniques is that a company’s past claims development experience can be used to project future claims development and hence ultimate claims costs. Those techniques extrapolate the development of paid and incurred losses based on the observed development of earlier years and expected loss ratios. Large claims are usually separately addressed either by being reserved at the value of loss adjuster estimates or are separately projected to estimate their future development. Additional qualitative judgment is used to assess the extent that past trends may not apply in the future when estimating the ultimate cost of claims.
Estimates are also made for the portion of the ultimate cost of outstanding claims that will be recoverable from reinsurance ceded policies.
The carrying value of insurance and reinsurance contract liabilities at September 30, 2016 was $19,243,623 (December 31, 2015 - $17,955,767).
Till Capital Ltd.
Management's Discussion and Analysis
For the three and nine months ended September 30, 2016
| | | September 30, 2016 | | December 31, 2015 |
| Provision for outstanding claims | | $ | 15,973,713 | | | $ | 15,768,895 | |
| Unearned premiums | | | 2,757,885 | | | | 1,786,120 | |
| Unearned commissions | | | 512,025 | | | | 400,752 | |
| Total insurance contract liabilities | | $ | 19,243,623 | | | $ | 17,955,767 | |
The carrying value of the reinsurance contract assets at September 30, 2016 was $11,237,450 (December 31, 2015 - $9,791,006).
| | | September 30, 2016 | | December 31, 2015 |
| Unpaid claims ceded | | $ | 8,287,660 | | | $ | 7,845,902 | |
| Unearned premiums ceded | | | 2,329,612 | | | | 1,479,632 | |
| Deferred policy acquisition costs | | | 620,178 | | | | 465,472 | |
| Total insurance contract assets | | $ | 11,237,450 | | | $ | 9,791,006 | |
Fair value measurement of Level 3 investments
Level 3 investments are assets or liabilities that cannot be measured or can only be partially measured using observable market inputs. These include private and unlisted equity securities where observable inputs are not available. The unobservable inputs for Till's Level 3 investments relate principally to an estimate of private company investments in the mining industry that require an assessment of mineral quantities, commodity prices, and costs of production. Where possible, management obtains external evidence of value relating to each investment and considers this information in assessing fair value such as previous trades in the entity and mineral data reports for mining entities. Fair values for the Level 3 investments are derived based on unobserved inputs and management’s assumptions developed from available information using the services of an investment adviser.
Loss of significant influence
Judgment is required as to the extent of influence that Till has over other entities. Till considers the extent of voting power over the entity, the power to participate in financial and operating policy decisions of the entity, representation on the board of directors, material transactions between the entities, interchange of management personnel and provision of essential technical information.
CHANGES TO ACCOUNTING STANDARDS
New standards not yet adopted
Till is currently evaluating the impact of the following pronouncements and has not yet determined the impact on its consolidated financial statements:
Financial Instruments
IFRS 9, "Financial Instruments" ("IFRS 9"), addresses the classification, measurement, and recognition of financial assets and financial liabilities. The IASB has previously issued versions of IFRS 9 that introduced new classification and measurement requirements (in 2009 and 2010) and a new hedge accounting model (in 2013). The July 2014 publication of IFRS 9 is the complete version of the Standard, replacing earlier versions of IFRS 9 and superseding the guidance relating to the classification and measurement of financial instruments in IAS 39, "Financial Instruments:Recognition and Measurement". Additionally, IFRS 9 introduces a new three-stage expected credit loss model for calculating impairment for financial assets, and some modifications related to hedge accounting. This final version of IFRS 9 will become effective for annual periods beginning on or after January 1, 2018, with early adoption permitted.
Revenue from Contracts with Customers
IFRS 15,“Revenue from Contracts with Customers”(“IFRS 15”), replaces IAS 11, “Construction Contracts”, IAS 18, “Revenue”, IFRIC 13, “Customer Loyalty Programmes”, IFRIC 15, “Agreements for the Construction of Real Estate”, IFRIC 18,“Transfer of Assets From Customers”, and Standard Interpretations Committee (“SIC”) 31, “Revenue - Barter Transaction Involving Advertising Services”. IFRS 15 establishes principles for reporting the nature, amount, timing, and uncertainty of revenue and cash flows arising from an entity’s contract(s) with customers. This revenue standard introduces a single, principles-based, five-step model for the recognition of revenue when control of a good or service is transferred to the customer and requires the reporting entity to identify the contract(s) with the customer, identify the performance obligations in the contract(s), determine transaction price, allocate the transaction price, and recognize revenue when a performance obligation is satisfied. IFRS 15 is intended to enhance disclosures about revenue to help investors better understand the nature, amount, timing, and uncertainty of revenue and cash flows from contracts with customers and to improve the comparability of revenue from contracts with customers. This standard will become effective for annual periods beginning on or after January 1, 2018, with early adoption permitted.
Till Capital Ltd.
Management's Discussion and Analysis
For the three and nine months ended September 30, 2016
Leases
In January 2016, the IASB issued IFRS 16, "Leases"("IFRS 16"), under which all leases are to be included on the balance sheets of lessees, except for those that meet the limited exception criteria. This standard is effective for annual periods beginning on or after January 1, 2019.
FINANCIAL RISK MANAGEMENT
Insurance risk
Till's insurance subsidiaries principally write general insurance contracts in personal property, commercial property and liability lines of business. Under these general insurance contracts, Till is exposed to certain risks defined in the general insurance contracts, usually for durations of one to twelve months.
In addition to general insurance contracts, Till's insurance subsidiaries also assume portfolios of existing claims from other insurers through assumption reinsurance transactions. These portfolios of claims could be from any line of business that the transferring insurer wrote in the past. Under these assumption reinsurance transactions, Till is exposed to certain risks defined in the underlying insurance contracts that were originally written by the transferring insurer.
The principal risk Till faces under both general insurance contracts and assumption reinsurance transactions is that the actual claims and benefit payments, or the timing thereof, differs from the expectations used to price the general insurance contacts or assumption reinsurance transactions. That risk is influenced by the frequency of claims, severity of claims, emergence of unknown claims, actual benefits paid and subsequent development of long-term claims. For long-tail claims that take years to settle, Till is also exposed to inflation risk. Till's objective is to ensure that sufficient reserves are available to cover these liabilities.
Risk exposure is mitigated by diversification across a portfolio of insurance contracts and geographical areas. The variability of risks is also improved by careful selection and implementation of underwriting strategies and guidelines. Inflation risk is also mitigated by taking expected inflation into account when estimating insurance contract liabilities.
Risk exposure is also mitigated through the use of various claim review strategies and guidelines to reduce the risk exposure for Till.
Till's insurance subsidiaries purchase reinsurance as part of their risk mitigation strategies. Reinsurance is placed on both a proportional and non-proportional basis. The use of proportional and non-proportional reinsurance varies by line of business.
Amounts recoverable from reinsurers (reinsurance assets) are estimated in a manner consistent with the underlying claim liabilities and in accordance with the reinsurance contracts. Although Till has reinsurance arrangements, it is not relieved of its direct obligations to its policyholders and thus a credit risk exposure exists with respect to such reinsurance agreements.
Liquidity risk
Liquidity risk is the risk that Till is unable to meet its financial obligations as they come due. Till manages this risk by management of its working capital to assess that the estimated expenditures will not exceed share capital and debt financings, or proceeds from property sales or option exercises.
Credit risk
Credit risk is the risk of loss associated with a counterparty’s inability to fulfill its payment obligations. Till's credit risk is primarily attributable to cash and cash equivalents, investments, balances receivable from policyholders and reinsurers, and reclamation bonds. Till has policies in place to limit and monitor its exposure to individual issuers and classes of issuers of investments. Till's credit exposure to any one individual policyholder is not material. Till's insurance and reinsurance policies are distributed by brokers and agents who manage cash collection on its behalf and Till monitors its exposure to brokers and agents. Till has policies in place that limit its exposure to individual reinsurers and conducts regular review processes to assess the creditworthiness of reinsurers with whom it transacts business. Reclamation bonds consist of term deposits and guaranteed investment certificates that have been invested with reputable financial institutions from which management believes the risk of loss to be minimal.
RISKS
Factors related to the legal and regulatory environment in which Till and its subsidiaries operate
Governmental actions, including, but not limited to, implementation of new laws and regulations, and court decisions interpreting existing laws and regulations or policy provisions.
Till Capital Ltd.
Management's Discussion and Analysis
For the three and nine months ended September 30, 2016
Uncertainties related to regulatory approval of insurance rates, policy forms, insurance products, license applications, dividends from insurance subsidiaries, acquisitions of businesses, and other matters within the purview of state insurance regulators.
Factors related to insurance claims and related reserves in Till's insurance businesses
The number and severity of insurance claims.
Changes in facts and circumstances affecting assumptions used in determining loss and loss adjustment expense reserves, including, but not limited to, the number and severity of insurance claims and development patterns.
The impact of inflation on insurance claims.
Developments related to insurance policy claims and coverage issues, including, but not limited to, interpretations or decisions by courts or regulators that may govern or influence losses incurred.
Orders, interpretations, or other actions by regulators that impact the reporting, adjustment, and payment of claims.
Changes in the pricing or availability of reinsurance, or in the financial condition of reinsurers and amounts recoverable therefrom.
Factors related to Till's ability to compete
Changes in the ratings by rating agencies of Till and/or its insurance company subsidiaries with regard to credit, financial strength, claims paying ability, and other areas on which Till is rated.
The level of success and costs incurred in realizing or maintaining economies of scale, implementing significant business consolidations, reorganizations, and technology initiatives, and integrating acquired businesses.
Absolute and relative performance of Till’s products or services, including, but not limited to, the level of success achieved in designing and introducing new insurance products and execution of Till's investment strategies.
The ability of Till to maintain the availability of critical systems and manage technology initiatives cost-effectively to address insurance industry developments and regulatory requirements.
Heightened competition, including, with respect to pricing, entry of new competitors and alternate distribution channels, introduction of new technologies, refinements of existing products, and development of new products by current or future competitors.
Factors related to the business environment in which Till and its subsidiaries operate
Changes in general economic conditions, including, but not limited to, performance of financial markets, interest rates, inflation, unemployment rates, and fluctuating values of particular investments held by Till.
Absolute and relative performance of investments held by Till.
Changes in insurance industry trends and significant industry developments.
Changes in capital requirements, including the calculations thereof, used by regulators and rating agencies.
Regulatory, accounting, or tax changes that may affect the cost of, or demand for, Till’s products or services or after-tax returns from Till’s investments.
Changes in distribution channels, methods, or costs resulting from changes in laws or regulations, lawsuits, or market forces.
Increased costs and risks related to cybersecurity and information technology, including, but not limited to, identity theft, data breaches, and system disruptions affecting services and actions taken to minimize the risks thereof.
INFORMATION REGARDING FORWARD LOOKING STATEMENTS
Certain statements contained in this MD&A, and in certain documents incorporated by reference herein, contain "forward-looking statements" within the meaning of applicable securities legislation. In certain cases, forward-looking statements can be identified by the use of words such as "plans", "expects" or "does not expect", "is expected", "budget", "scheduled", "estimates", "forecasts", "intends", "anticipates" or "does not anticipate", or "believes", or variations of such words and phrases or state that certain actions, events or results "may", "could", "would", "might" or "will be taken", "occur" or "be achieved". Forward-looking statements involve known and unknown risks, uncertainties and other factors that may cause the actual results, performance or achievements of Till to be materially different from any future results, performance or achievements expressed or implied by the forward-looking statements. Till believes the expectations pertaining to those forward-looking statements are reasonable, but there may be other factors that cause actions, events, or results not to be as anticipated, estimated or intended. There can be no assurance that forward-looking statements will prove to be accurate, as actual results and future events could differ materially from those anticipated in such statements. Accordingly, readers should not place undue reliance on forward-looking statements.
Till Capital Ltd.
Management's Discussion and Analysis
For the three and nine months ended September 30, 2016
In particular, this MD&A includes forward-looking statements pertaining, among others, to the following matters:
| • | business strategy, strength, and focus; |
| • | proposed future expenditures; |
| • | the satisfaction of certain conditions in respect of certain properties in which Till may obtain an interest; |
| • | the granting of regulatory approvals; |
| • | the timing and receipt of regulatory approvals; |
| • | the resource potential of Till’s properties; |
| • | the estimated quantity and quality of mineral resources; |
| • | projections of market prices, costs, and the related sensitivity of distributions; |
| • | expectations regarding the ability to raise capital; |
| • | treatment under governmental regulatory regimes and tax laws, and capital expenditure programs; |
| • | expectations with respect to Till’s future working capital position; and |
| • | capital expenditure programs. |
Readers are cautioned that the foregoing list of factors is not exhaustive. The forward-looking statements in this MD&A are made as of the date of filing this report or, in the case of documents incorporated by reference herein, as of the date of such documents. Till does not intend, and does not assume any obligation, to update these forward-looking statements, except as required by applicable securities laws.
14