Exhibit 99.2

© ���� � Kornit Digital. All rights reserved. KORNIT DIGITAL (NASDAQ � KRNT) � Q 3 2020 EARNINGS CALL SUPPORTING SLIDES
© ���� � Kornit Digital. All rights reserved. SAFE HARBOR � This presentation contains forward - looking statements within the meaning of U . S . securities laws . All statements other than statements of historical fact contained in this presentation are forward - looking statements . In some cases, you can identify forward - looking statements by terminology such as “ may, ” “ will, ” “ should, ” “ expects, ” “ plans, ” “ anticipates, ” “ believes, ” “ estimates, ” “ predicts, ” “ potential ” or “ continue ” or the negative of these terms or other comparable terminology . These statements reflect our current views with respect to future events and are subject to known and unknown risks, uncertainties and other factors that may cause our or our industry ’ s actual results, levels of activity, performance or achievements to be materially different from those anticipated by the forward - looking statements . Although we believe that the expectations reflected in the forward - looking statements are reasonable, we cannot guarantee that future results, levels of activity, performance or events or circumstances described in the presentation will occur or be achieved . You should read the Company ’ s most recent annual report on Form 20 - F and its prospectus supplement to the prospectus contained in its registration statement on Form F - 3 , filed with the U . S . Securities and Exchange Commission on March 23 , 2020 and September 17 , 2020 , respectively, including the Risk Factors set forth therein, completely and with the understanding that our actual future results may be materially different from what we expect . Specifically, we face the risk that the duration of the global COVID - 19 pandemic may continue on for a further significant period of time be extensive, which could continue to impact, in a material adverse manner, our operations, financial position and cash flows, and those of our customers and suppliers . Except as required by law, we undertake no obligation to update or revise any of the forward - looking statements, whether as a result of new information, future events or otherwise, after the date of this presentation . In addition to U . S . GAAP financials, this presentation includes certain non - GAAP financial measures . These non - GAAP financial measures are in addition to, and not a substitute for or superior to, measures of financial performance prepared in accordance with U . S . GAAP . This presentation contains statistical data that we obtained from industry publications and reports generated by third parties . Although we believe that the publications and reports are reliable, we have not independently verified this statistical data . Kornit, Kornit Digital, the K logo, and NeoPigment are trademarks of Kornit Digital Ltd . All other trademarks are the property of their respective owners and are used for reference purposes only . Such use should not be construed as an endorsement of our products or services .

© ���� � Kornit Digital. All rights reserved. | © All rights reserved Kornit Digital 2019 3 OUR VISION CREATE A BETTER WORLD WHERE EVERYBODY CAN BOND , DESIGN AND EXPRESS THEIR IDENTITIES , �

© ���� � Kornit Digital. All rights reserved. � Ronen Samuel CEO Guy Avidan CFO Amir Shaked Mandel EVP Corp Dev ON TODAY ’ S CALL

© ���� � Kornit Digital. All rights reserved. BUSINESS HIGHLIGHTS � RONEN SAMUEL CEO
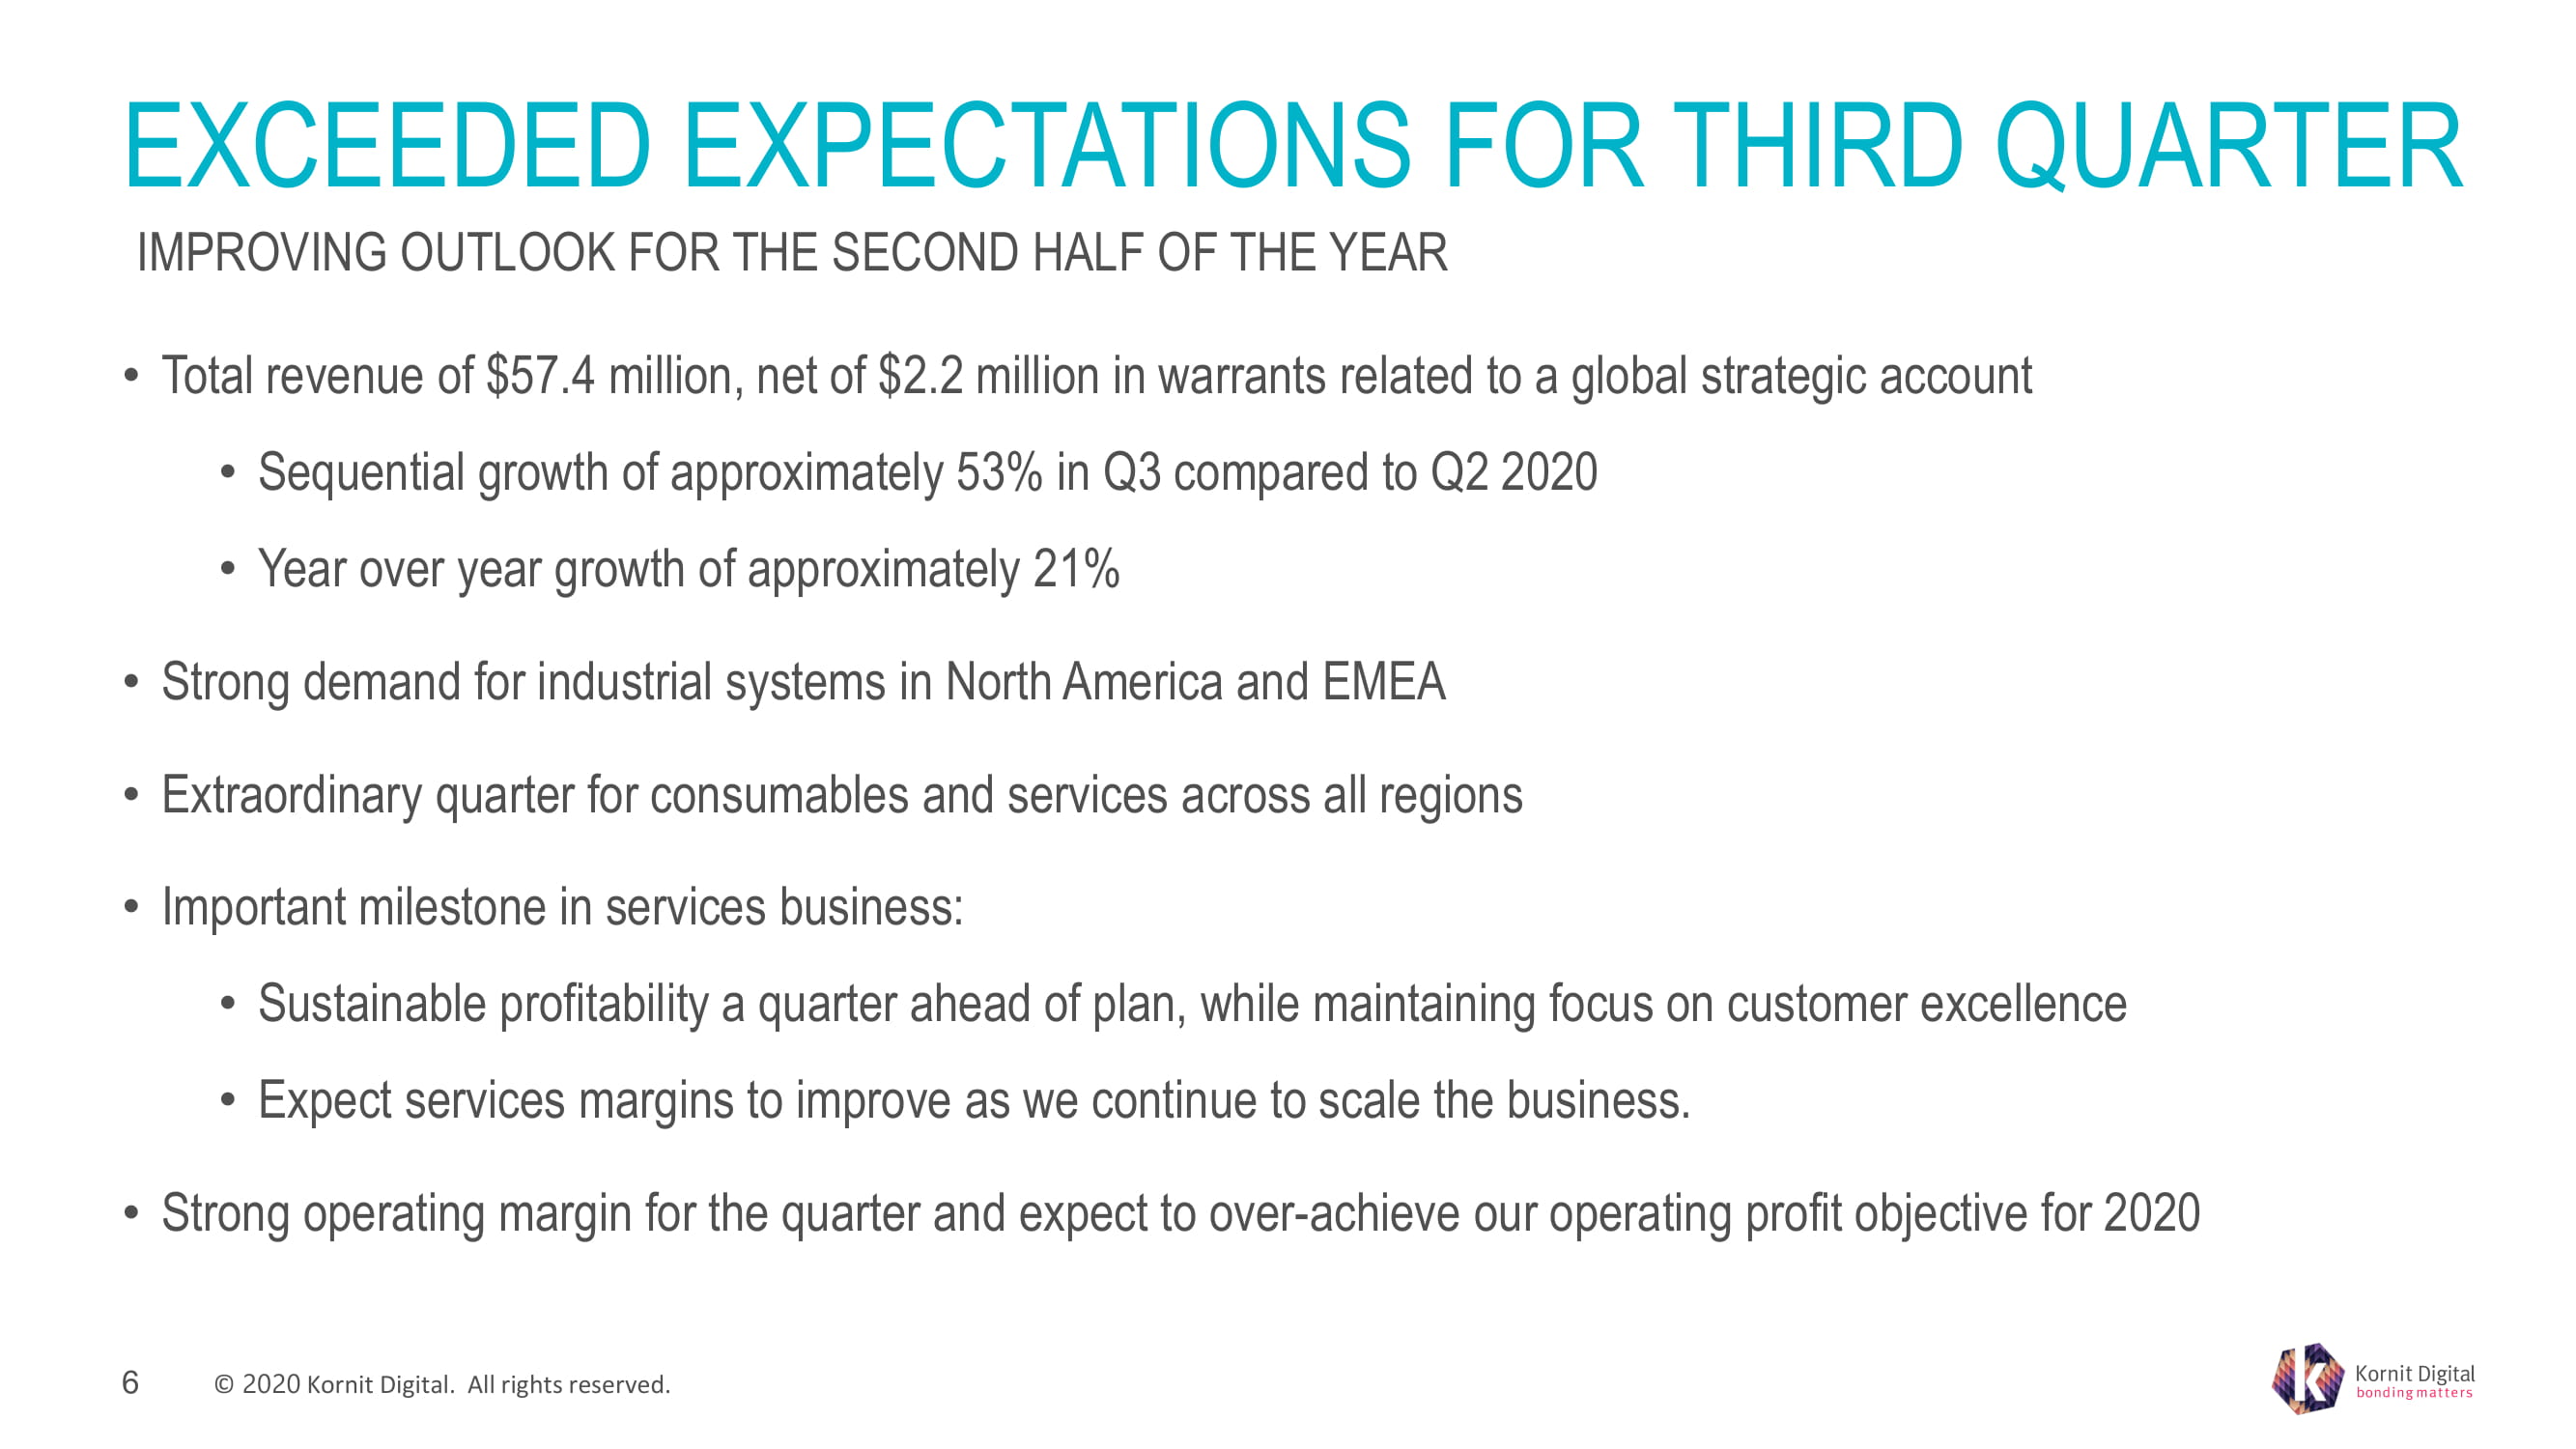
© ���� � Kornit Digital. All rights reserved. • Total revenue of $ 57.4 million, net of $ 2.2 million in warrants related to a global strategic account • Sequential growth of approximately 53 % in Q 3 compared to Q 2 2020 • Year over year growth of approximately 21 % • Strong demand for industrial systems in North America and EMEA • Extraordinary quarter for consumables and services across all regions • Important milestone in services business: • Sustainable profitability a quarter ahead of plan, while maintaining focus on customer excellence • Expect services margins to improve as we continue to scale the business. • Strong operating margin for the quarter and expect to over - achieve our operating profit objective for 2020 EXCEEDED EXPECTATIONS FOR THIRD QUARTER IMPROVING OUTLOOK FOR THE SECOND HALF OF THE YEAR �

© ���� � Kornit Digital. All rights reserved. • Partnering with customers to deliver incremental demand for systems, ink and services as we enter holiday season • Engaged in large scale expansion projects in North America • Unique partnership with Delta Apparel and Hot Topics • EMEA experiencing resurgence • UK investments yield immediate results • Encouraging signs of industry recovery in Asia Pacific • Scaling local sales and support infrastructure required to deliver on global expansion projects • Welcoming Tokyo - based seasoned executive, to lead Asia Pacific and scale operations ACTIVITY AND BUSINESS MOMENTUM INDUSTRY AT AN INFLECTION POINT, WE ARE FOCUSED ON LEADING THE TRANSFORMATION TO ON - DEMAND �
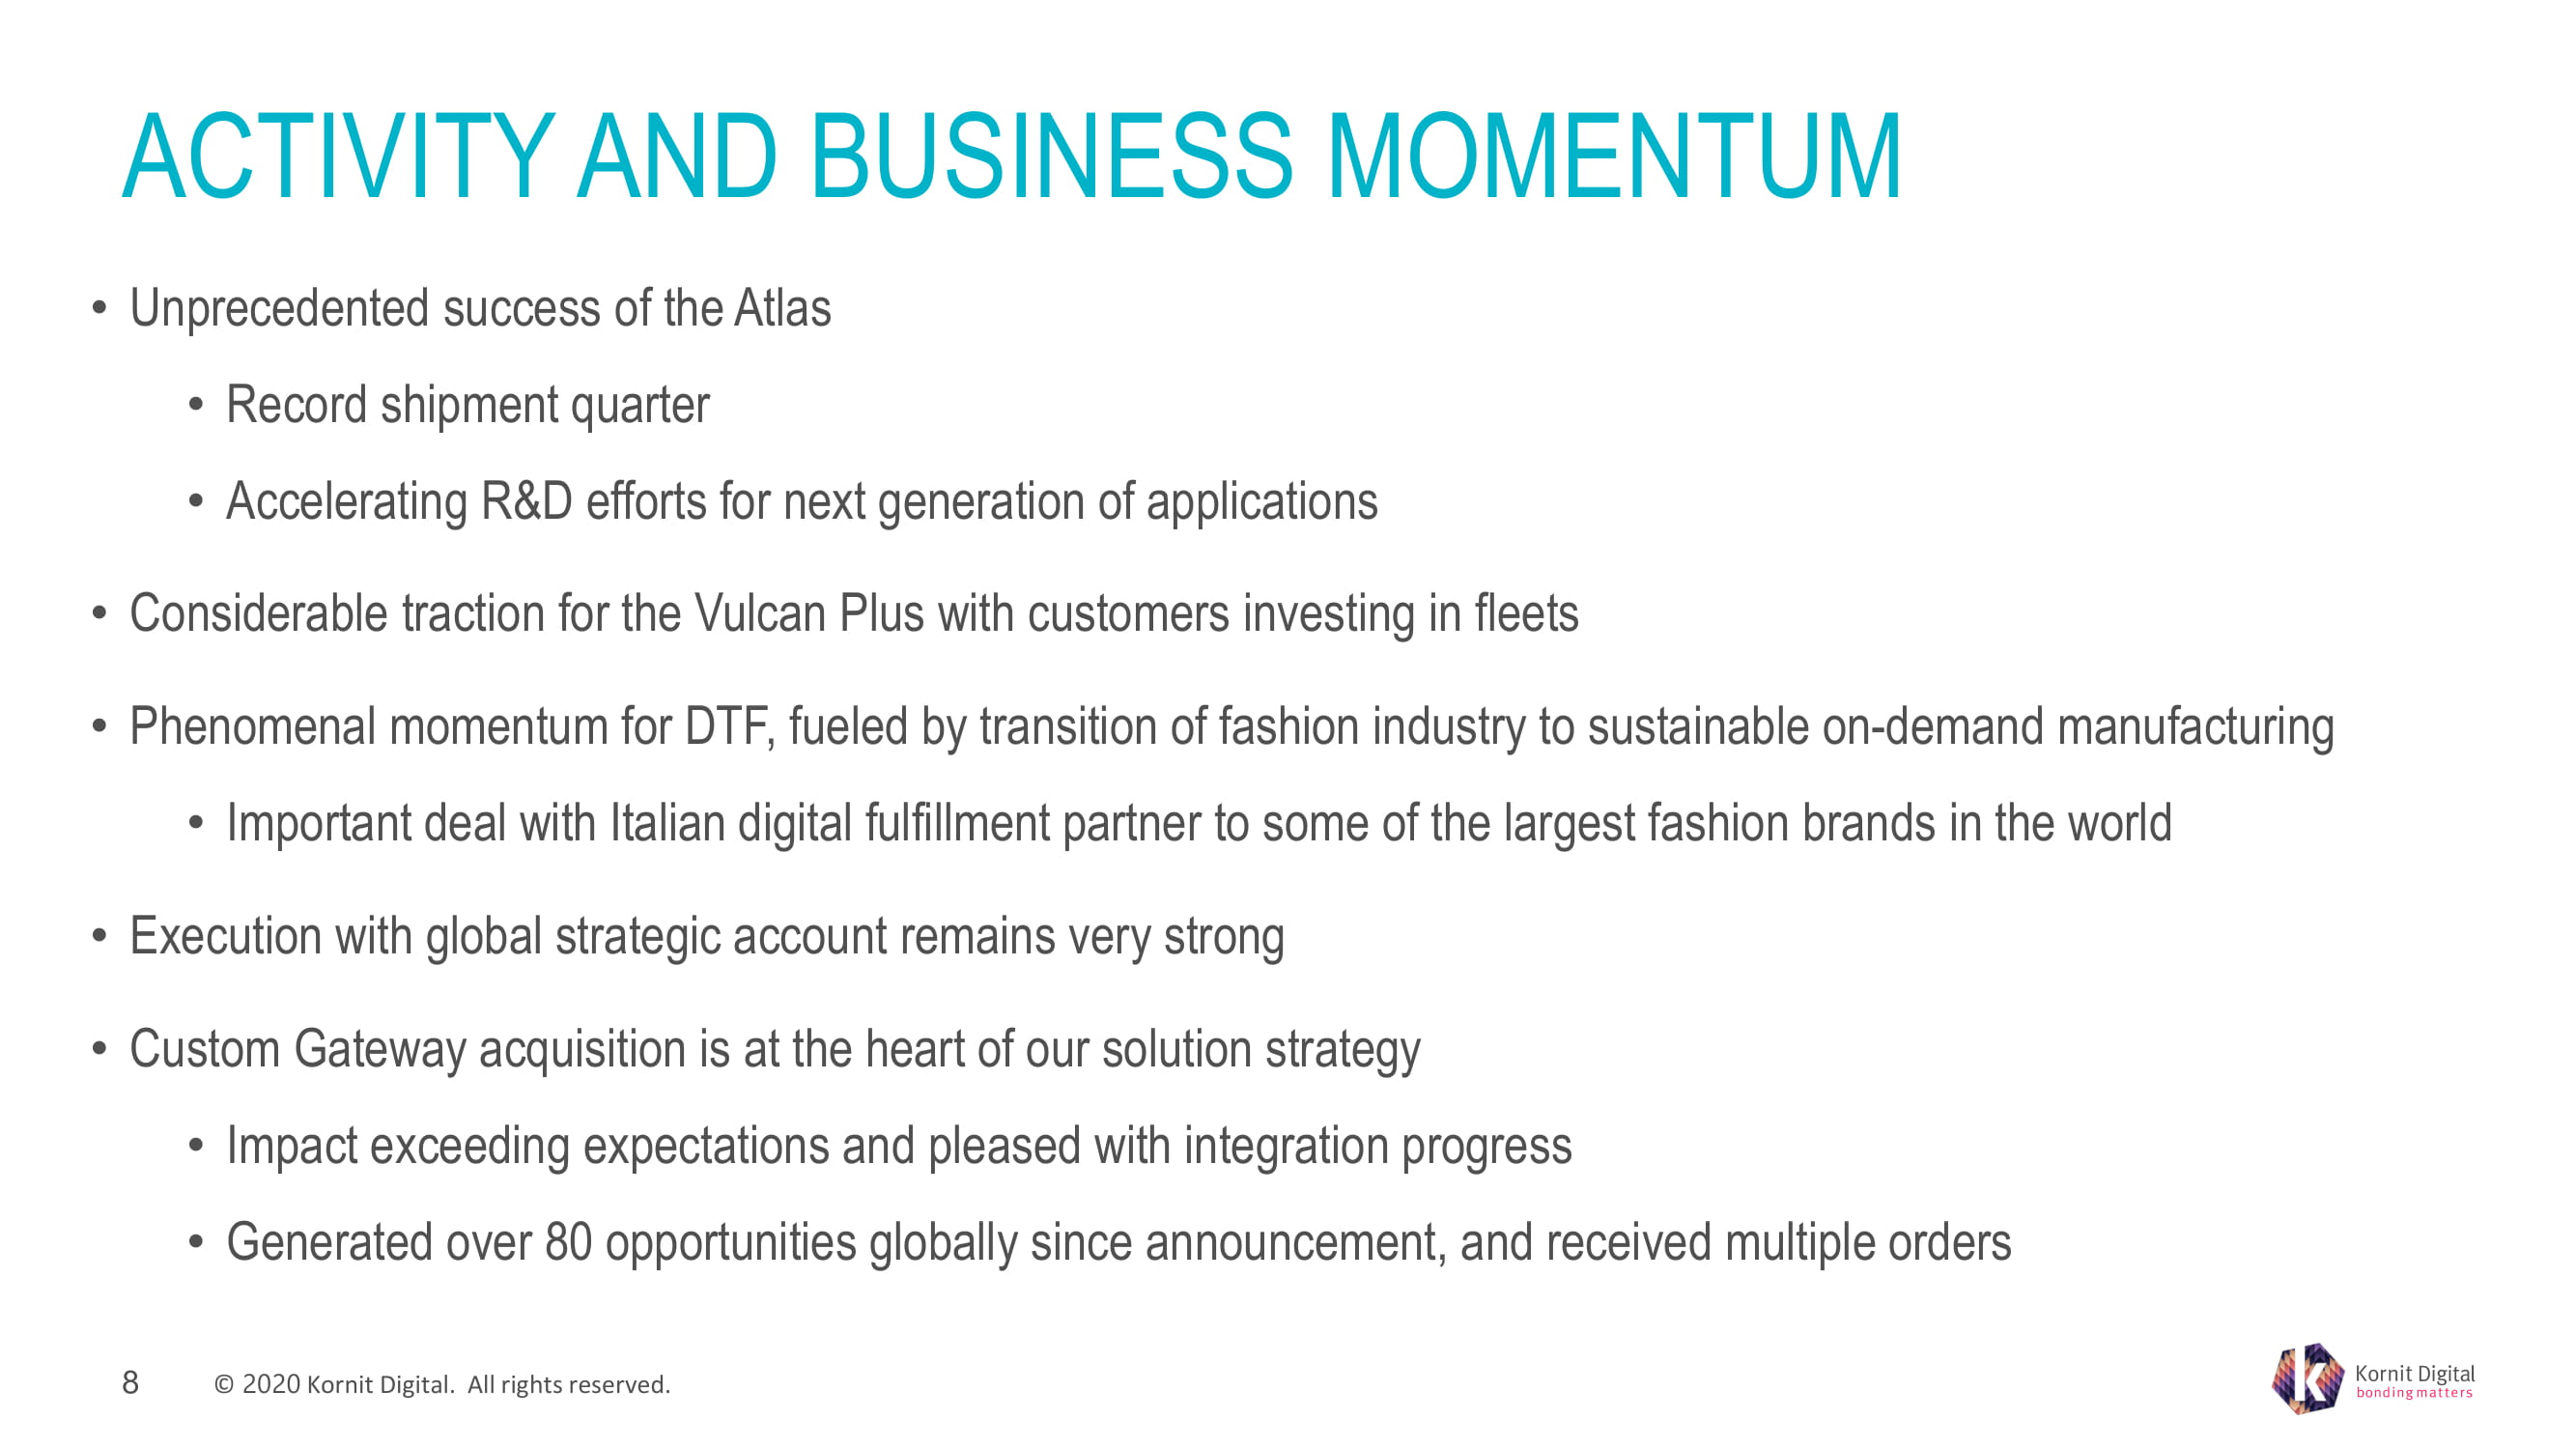
© ���� � Kornit Digital. All rights reserved. • Unprecedented success of the Atlas • Record shipment quarter • Accelerating R&D efforts for next generation of applications • Considerable traction for the Vulcan Plus with customers investing in fleets • Phenomenal momentum for DTF, fueled by transition of fashion industry to sustainable on - demand manufacturing • Important deal with Italian digital fulfillment partner to some of the largest fashion brands in the world • Execution with global strategic account remains very strong • Custom Gateway acquisition is at the heart of our solution strategy • Impact exceeding expectations and pleased with integration progress • Generated over 80 opportunities globally since announcement, and received multiple orders ACTIVITY AND BUSINESS MOMENTUM �
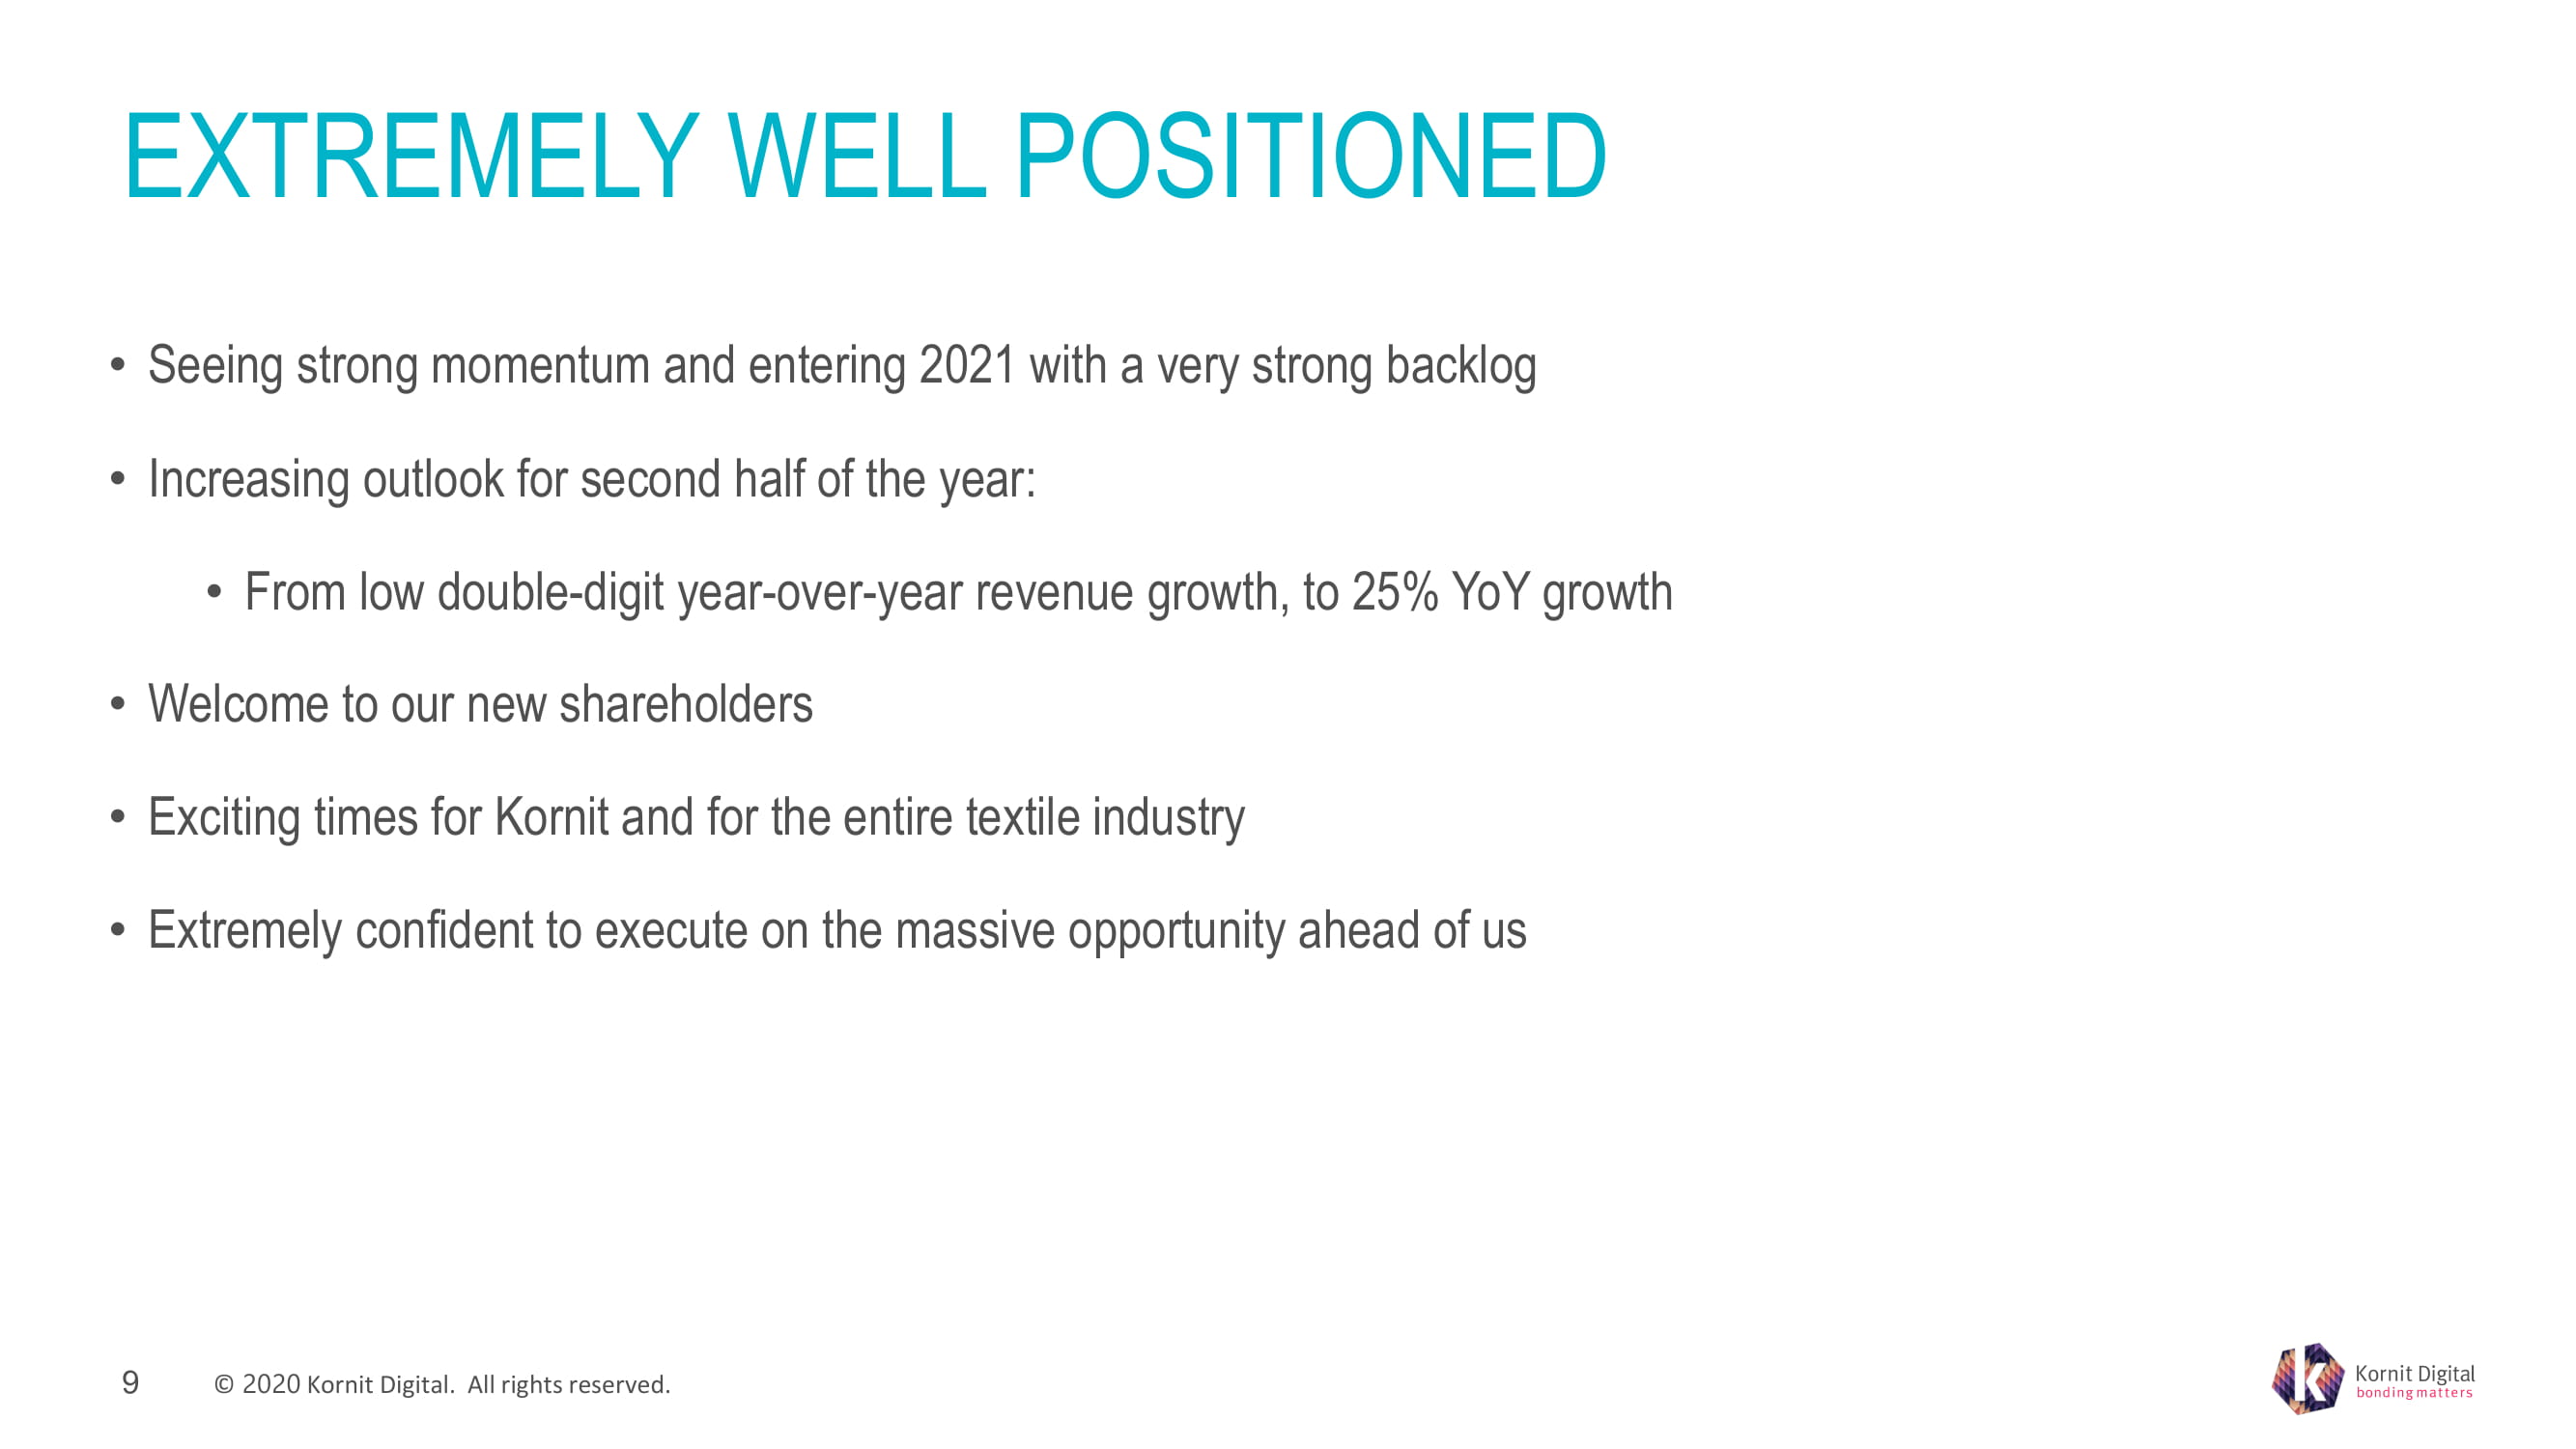
© ���� � Kornit Digital. All rights reserved. • Seeing strong momentum and entering 2021 with a very strong backlog • Increasing outlook for second half of the year: • From low double - digit year - over - year revenue growth, to 25 % YoY growth • Welcome to our new shareholders • Exciting times for Kornit and for the entire textile industry • Extremely confident to execute on the massive opportunity ahead of us EXTREMELY WELL POSITIONED �

© ���� � Kornit Digital. All rights reserved. FINANCIALS HIGHLIGHTS �� GUY AVIDAN CFO
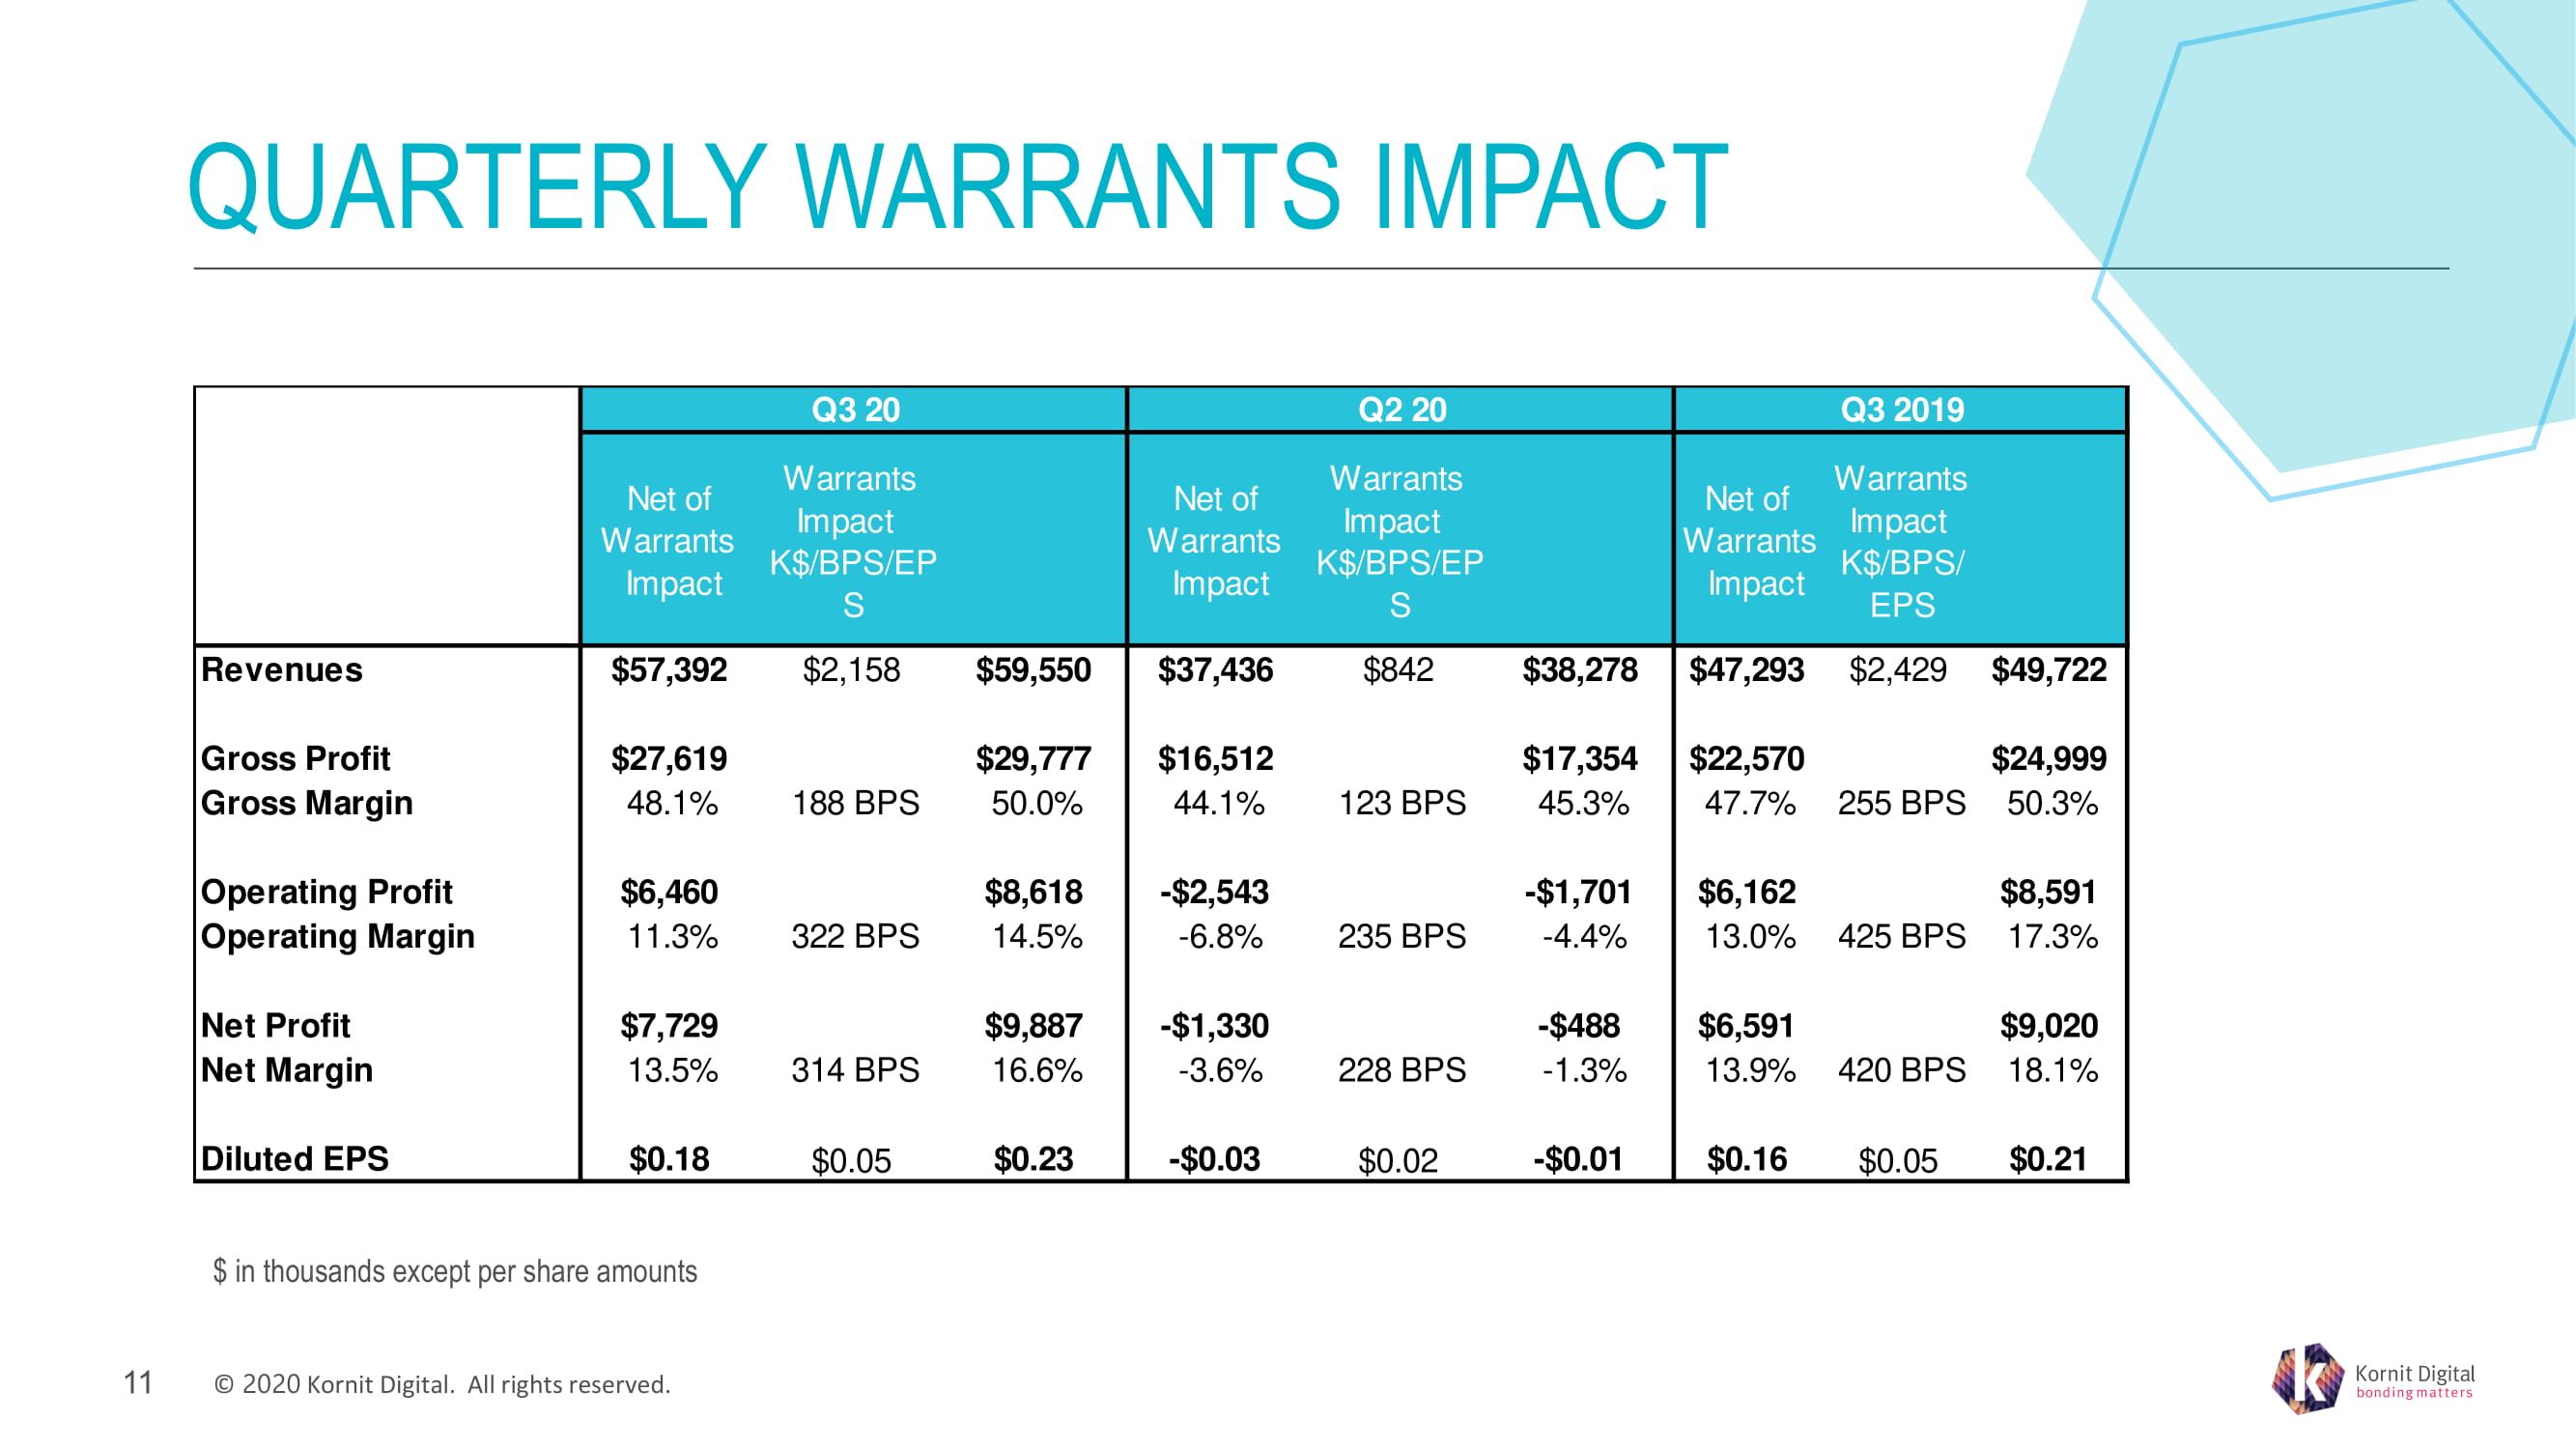
© ���� � Kornit Digital. All rights reserved. QUARTERLY WARRANTS IMPACT $ in thousands except per share amounts �� Net of Warrants Impact Warrants Impact K$/BPS/EP S Net of Warrants Impact Warrants Impact K$/BPS/EP S Net of Warrants Impact Warrants Impact K$/BPS/ EPS Revenues $57,392 $2,158 $59,550 $37,436 $842 $38,278 $47,293 $2,429 $49,722 Gross Profit $27,619 $29,777 $16,512 $17,354 $22,570 $24,999 Gross Margin 48.1% 188 BPS 50.0% 44.1% 123 BPS 45.3% 47.7% 255 BPS 50.3% Operating Profit $6,460 $8,618 -$2,543 -$1,701 $6,162 $8,591 Operating Margin 11.3% 322 BPS 14.5% -6.8% 235 BPS -4.4% 13.0% 425 BPS 17.3% Net Profit $7,729 $9,887 -$1,330 -$488 $6,591 $9,020 Net Margin 13.5% 314 BPS 16.6% -3.6% 228 BPS -1.3% 13.9% 420 BPS 18.1% Diluted EPS $0.18 $0.05 $0.23 -$0.03 $0.02 -$0.01 $0.16 $0.05 $0.21 Q2 20Q3 20 Q3 2019
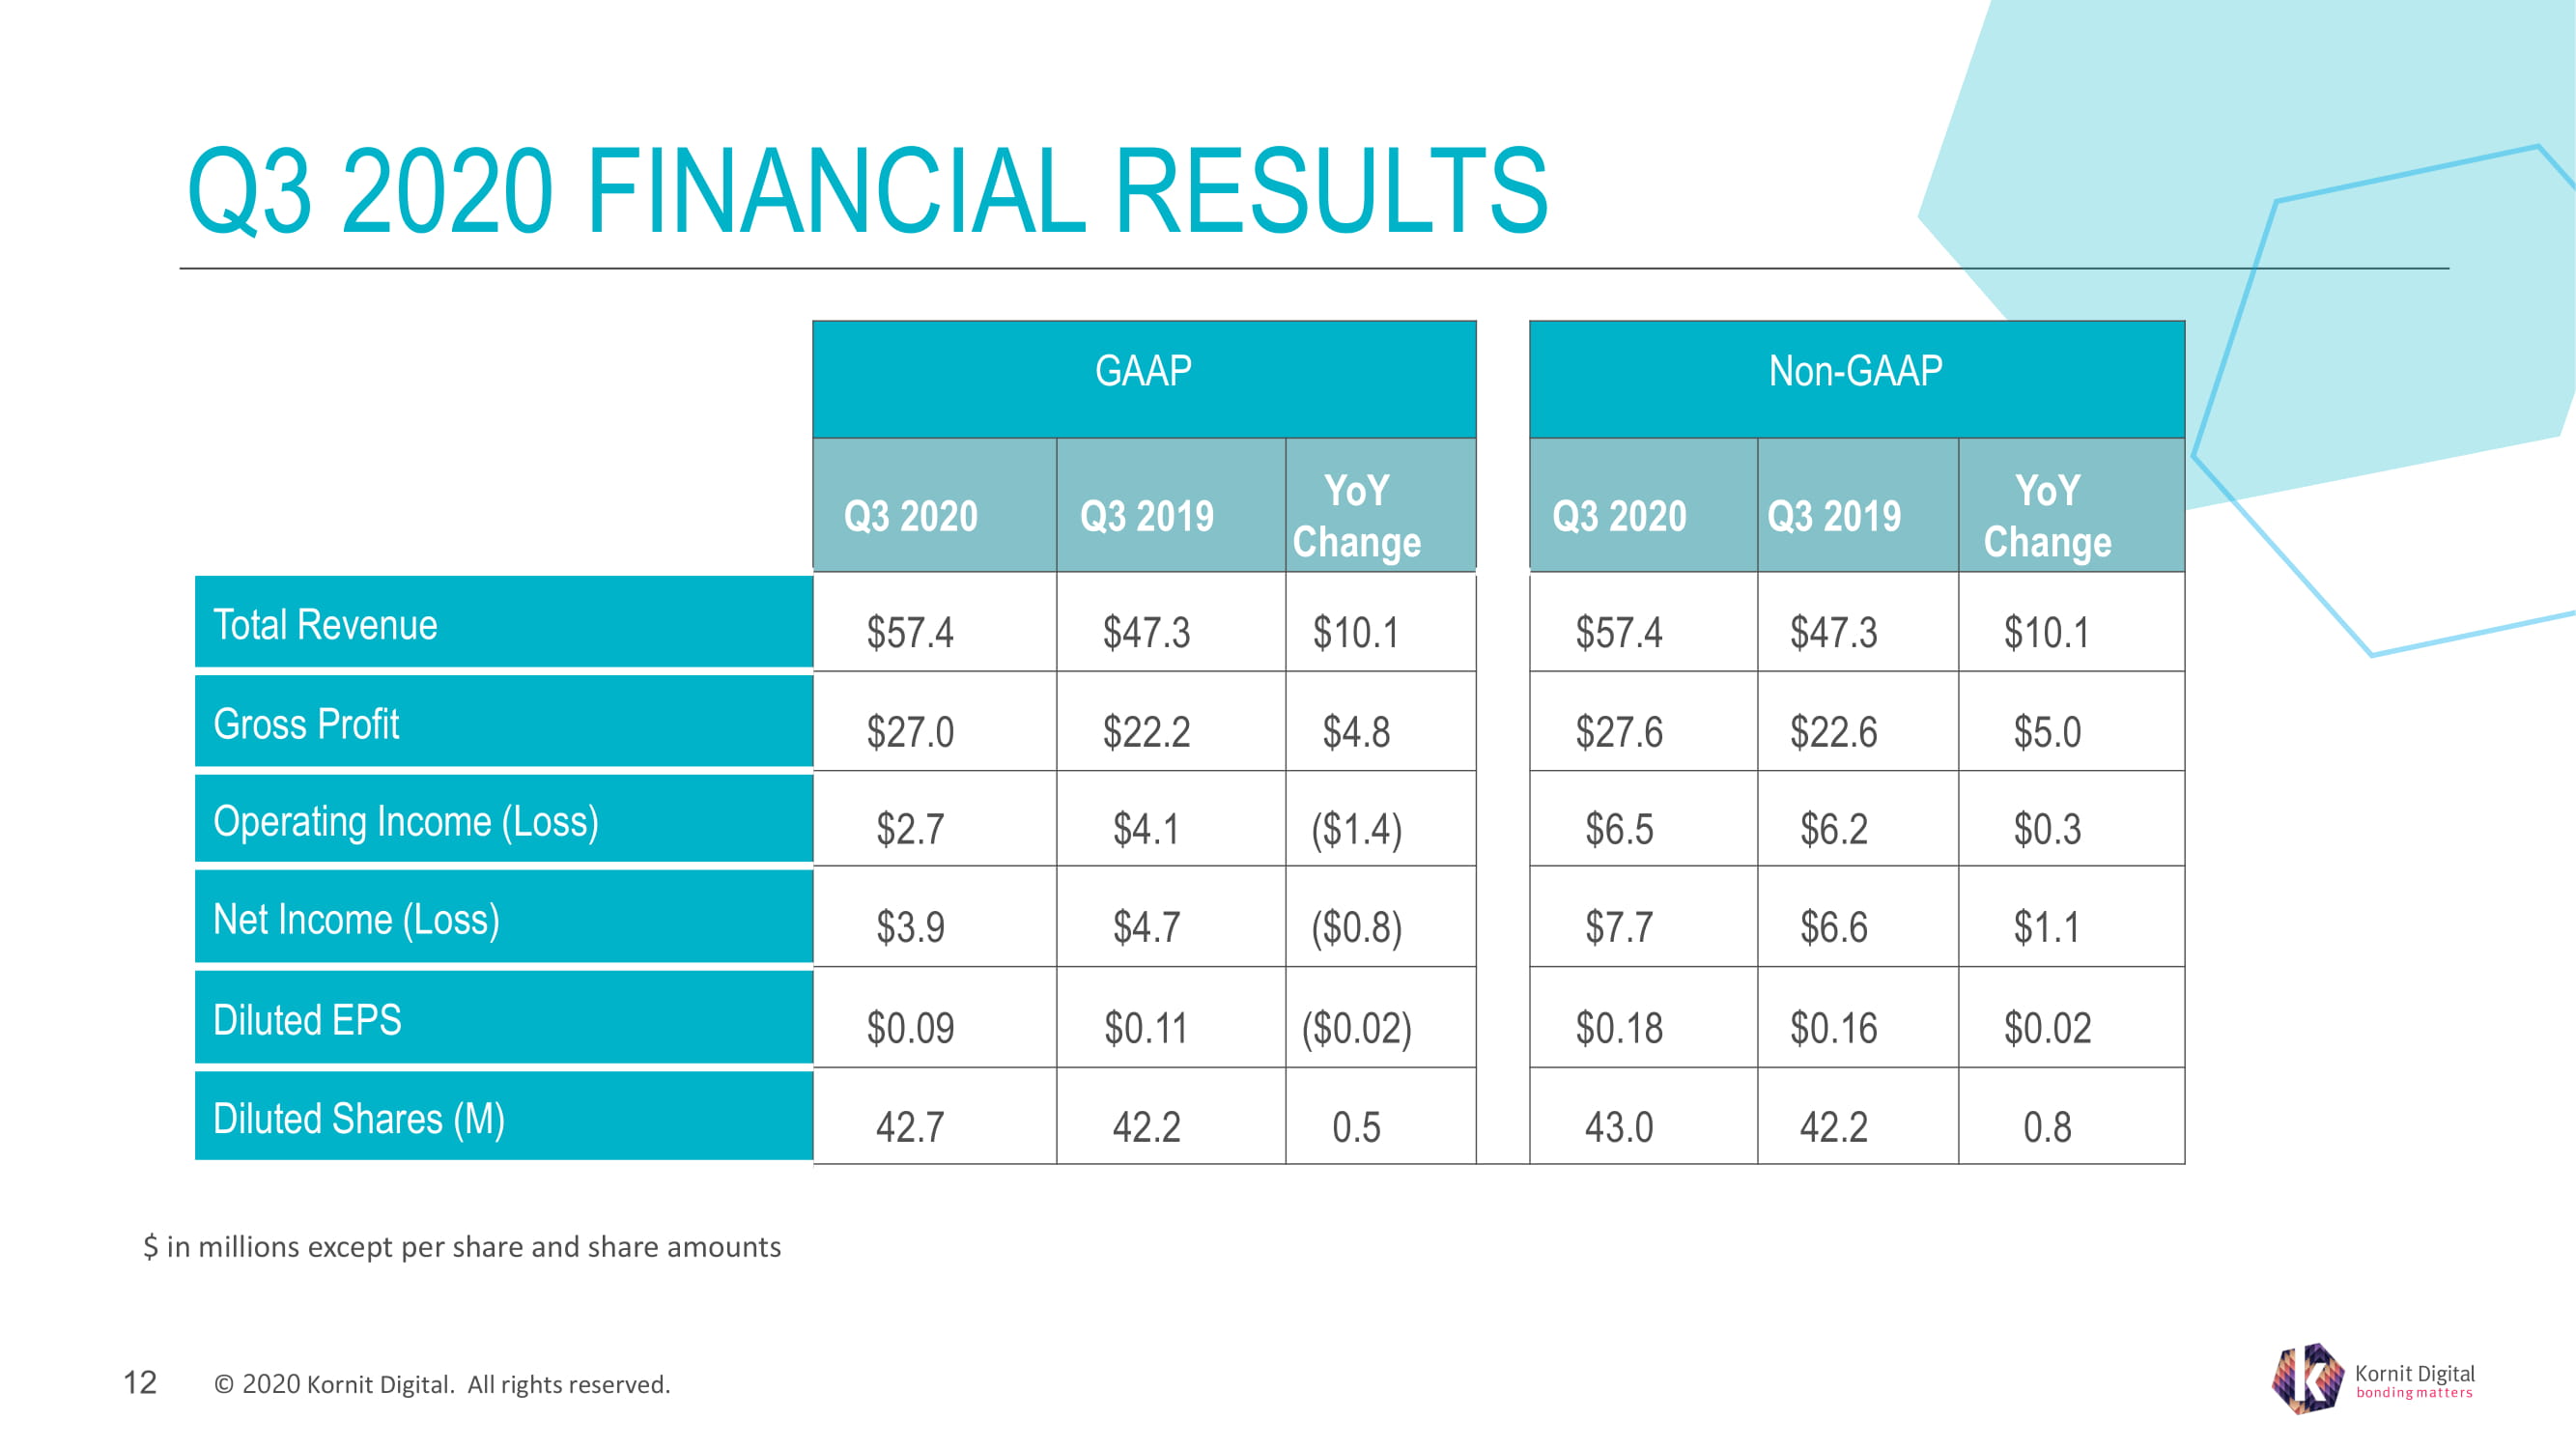
© ���� � Kornit Digital. All rights reserved. Q 3 2020 FINANCIAL RESULTS GAAP Non - GAAP Q3 2020 Q3 2019 YoY Change Q3 2020 Q3 2019 YoY Change Total Revenue $57.4 $47.3 $10.1 $ 57.4 $47.3 $10.1 Gross Profit $27.0 $22.2 $4.8 $ 27.6 $22.6 $5.0 Operating Income (Loss) $2.7 $4.1 ($1.4) $ 6.5 $6.2 $0.3 Net Income (Loss) $3.9 $4.7 ($0.8) $ 7.7 $6.6 $1.1 Diluted EPS $0.09 $0.11 ($0.02) $ 0.18 $0.16 $0.02 Diluted Shares (M) 42.7 42.2 0.5 43.0 42.2 0.8 $ in millions except per share and share amounts ��
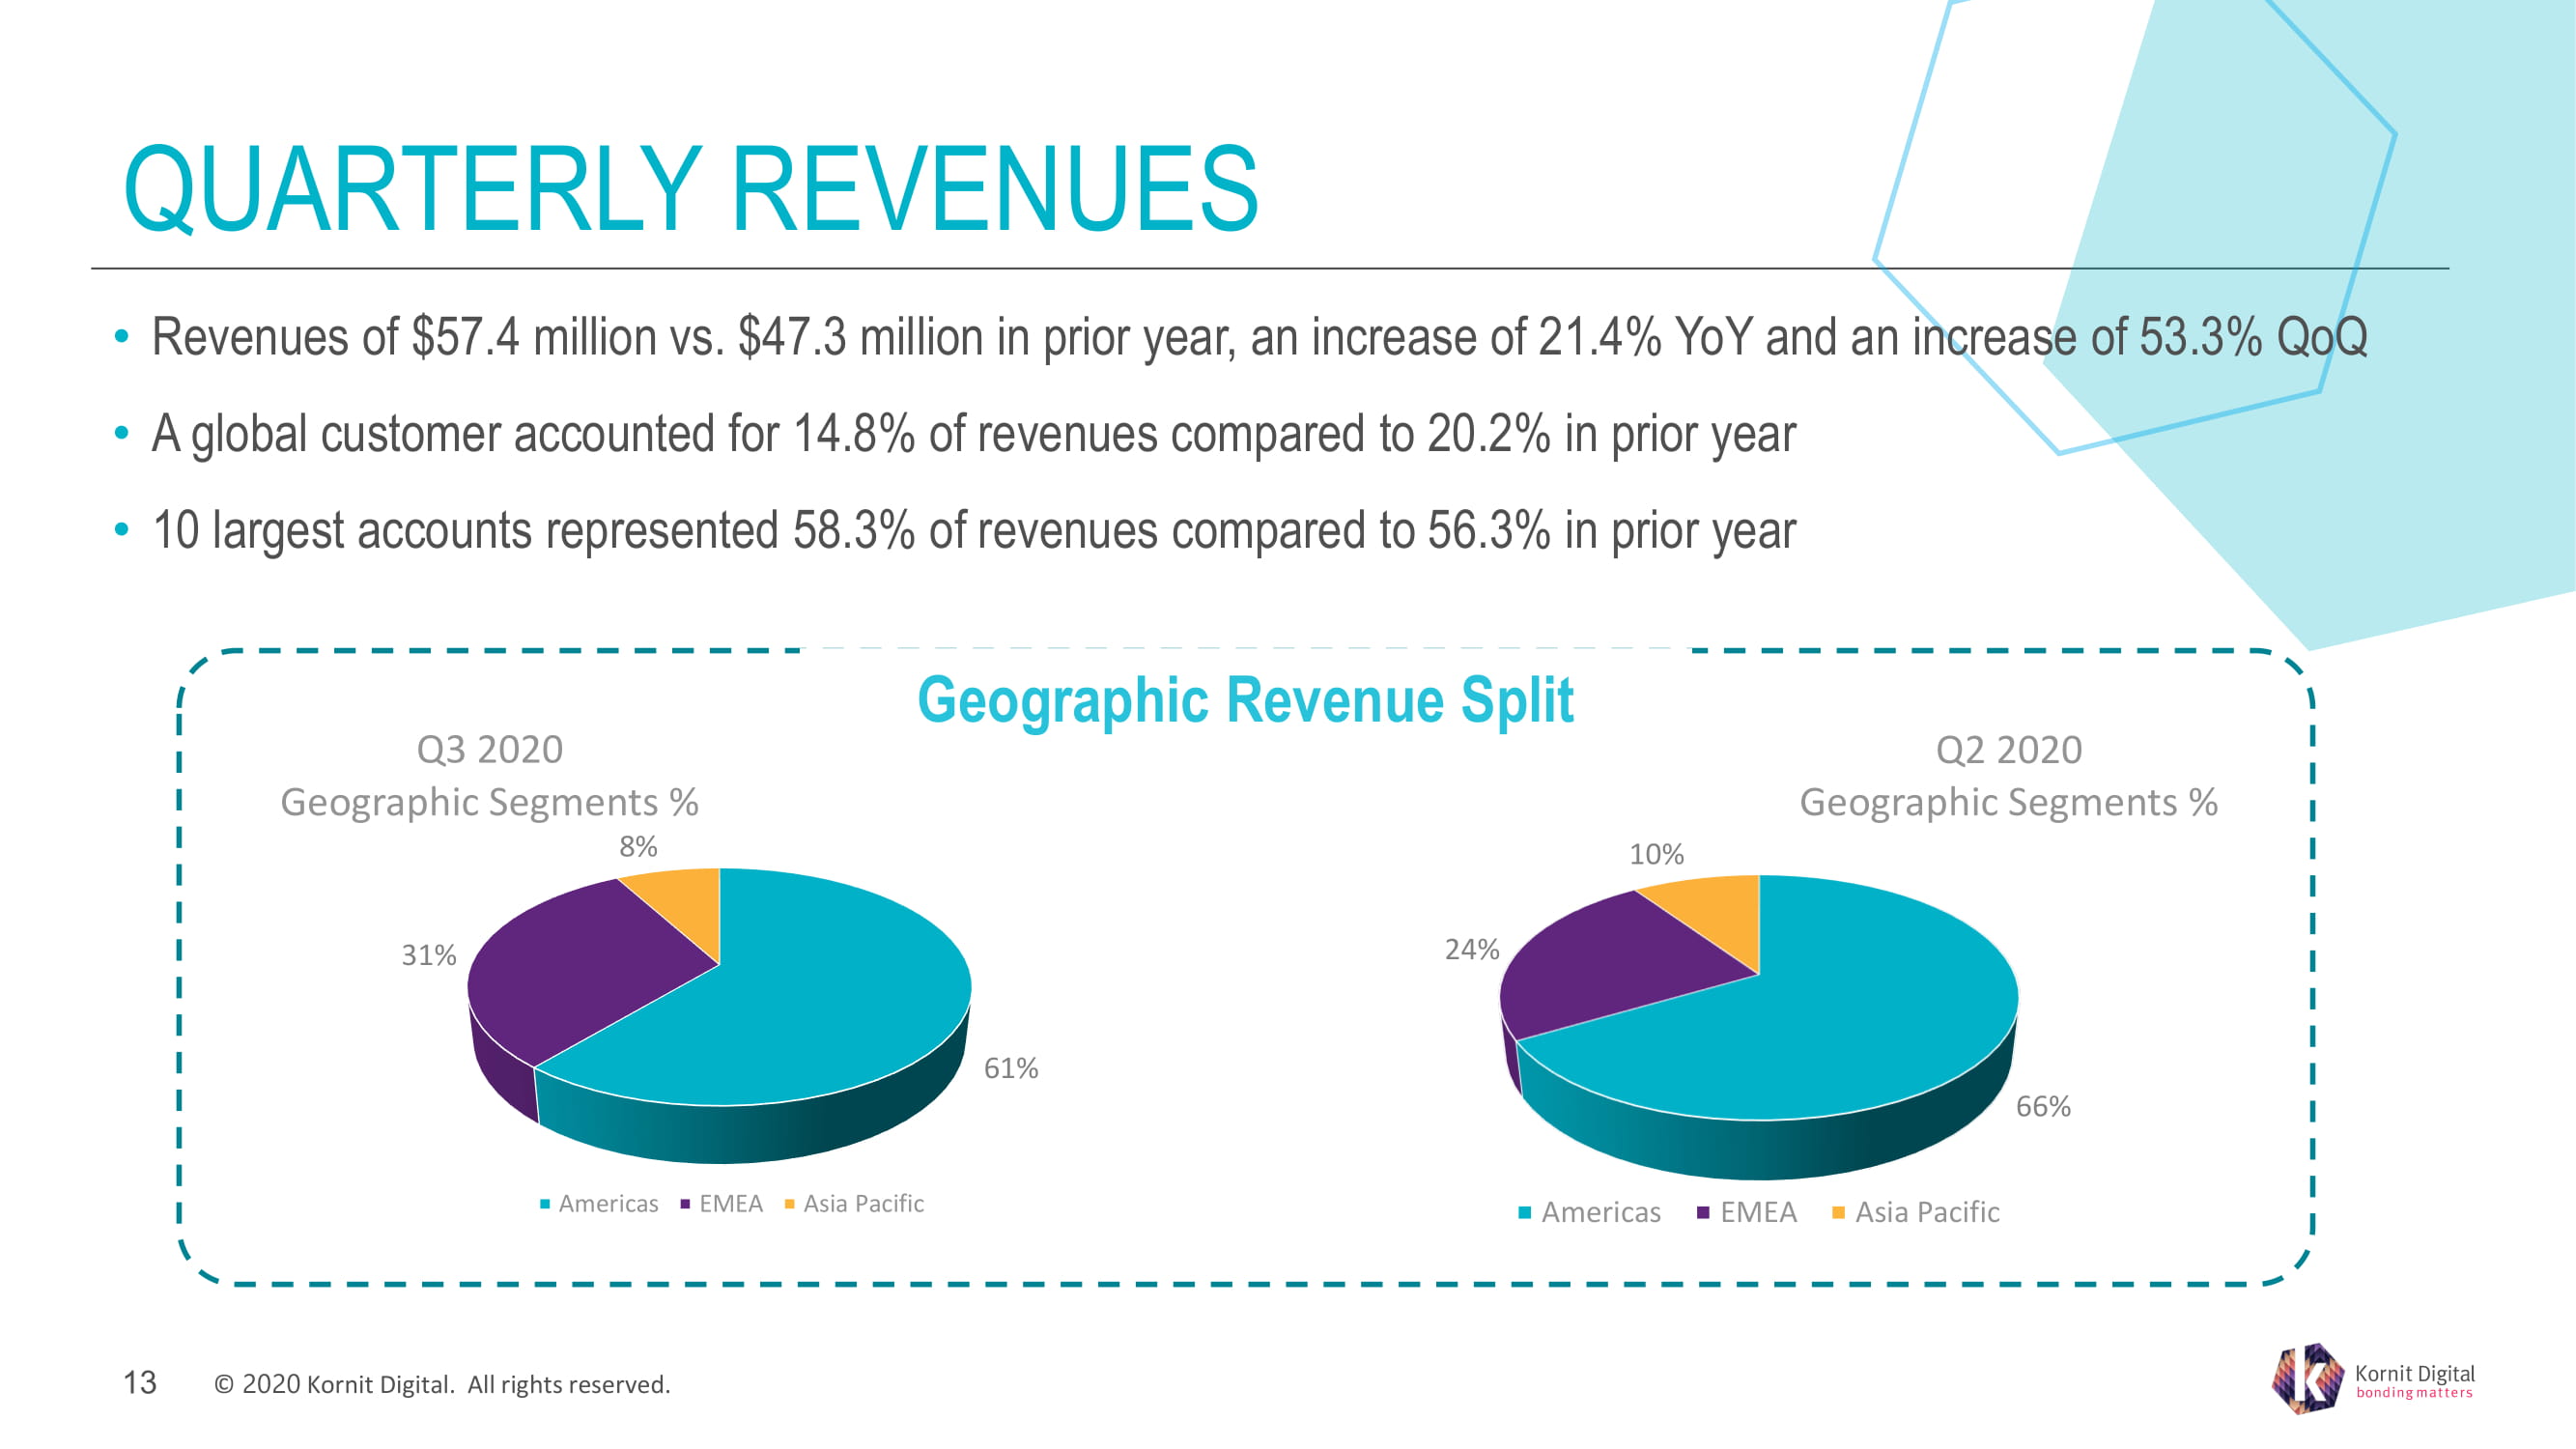
© ���� � Kornit Digital. All rights reserved. QUARTERLY REVENUES Geographic Revenue Split • Revenues of $ 57.4 million vs. $ 47.3 million in prior year, an increase of 21.4 % YoY and an increase of 53.3 % QoQ • A global customer accounted for 14.8 % of revenues compared to 20.2 % in prior year • 10 largest accounts represented 58.3 % of revenues compared to 56.3 % in prior year �� 61% 31% 8% Q 3 2020 Geographic Segments % Americas EMEA Asia Pacific 66% 24% 10 % Q 2 2020 Geographic Segments % Americas EMEA Asia Pacific

© ���� � Kornit Digital. All rights reserved. QUARTERLY GROSS MARGIN AND OPEX Q3 2020 Q3 2019 Research & Development 13.8% 11.2% Sales & Marketing 13.5% 15.1% General & Administrative 9.6% 8.5% Total Operating Expenses 36.9% 34.8% • Non - GAAP gross margin of 48 . � % increased from 47 . 7 % in Q 3 2019 • Non - GAAP operating expenses of $ 21 . 2 million increased 29 . 0 % year over year ��

© ���� � Kornit Digital. All rights reserved. QUARTERLY P&L KPI Q3 2020 Q3 2019 Non - GAAP Operating Income (Loss) $6.5 $6.2 Non - GAAP Net Income (Loss) $7.7 $6.6 Non - GAAP Diluted EPS $0.18 $0.16 GAAP Net Income (Loss) $3.9 $4.7 GAAP Diluted EPS $0.09 $0.11 Adjusted EBITDA $9.4 $13.1 $ in millions except per share amounts ��
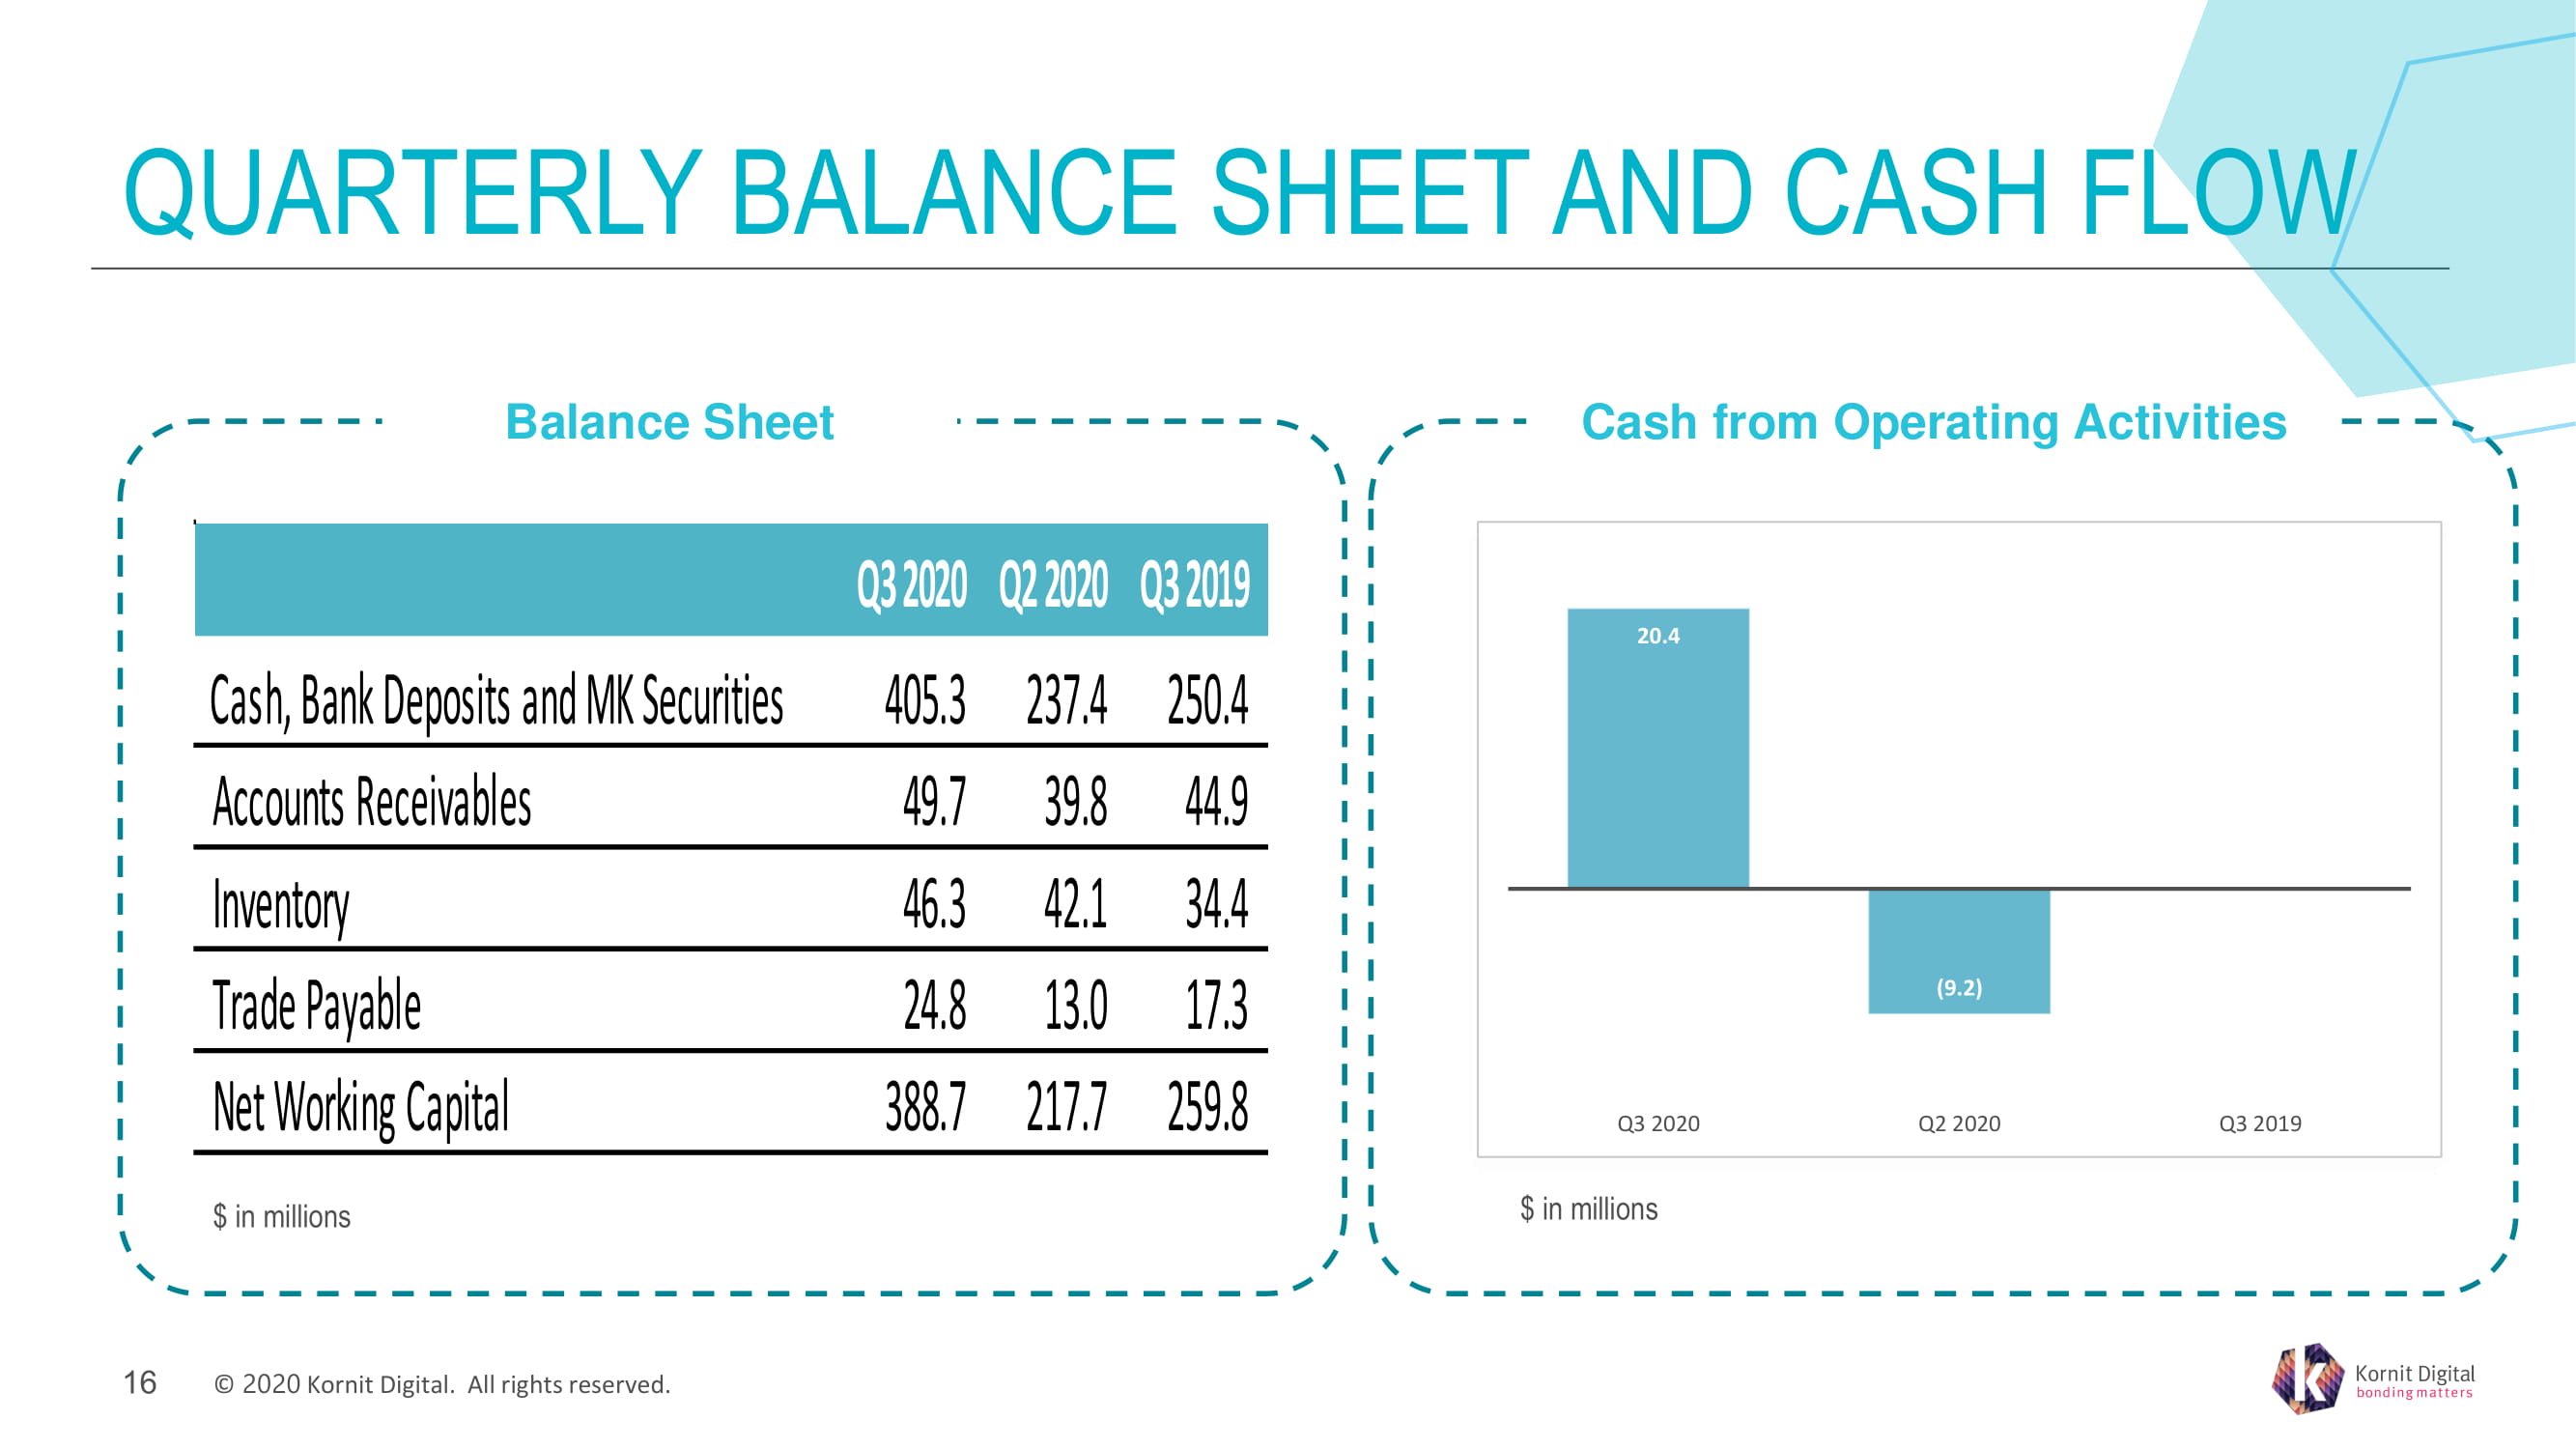
© ���� � Kornit Digital. All rights reserved. QUARTERLY BALANCE SHEET AND CASH FLOW Cash from Operating Activities Balance Sheet $ in millions �� $ in millions 20.4 ( 9.2 ) 0.0 Q 3 2020 Q2 2020 Q 3 2019 Q3 2020 Q2 2020 Q3 2019 Cash, Bank Deposits and MK Securities 405.3 237.4 250.4 Accounts Receivables 49.7 39.8 44.9 Inventory 46.3 42.1 34.4 Trade Payable 24.8 13.0 17.3 Net Working Capital 388.7 217.7 259.8
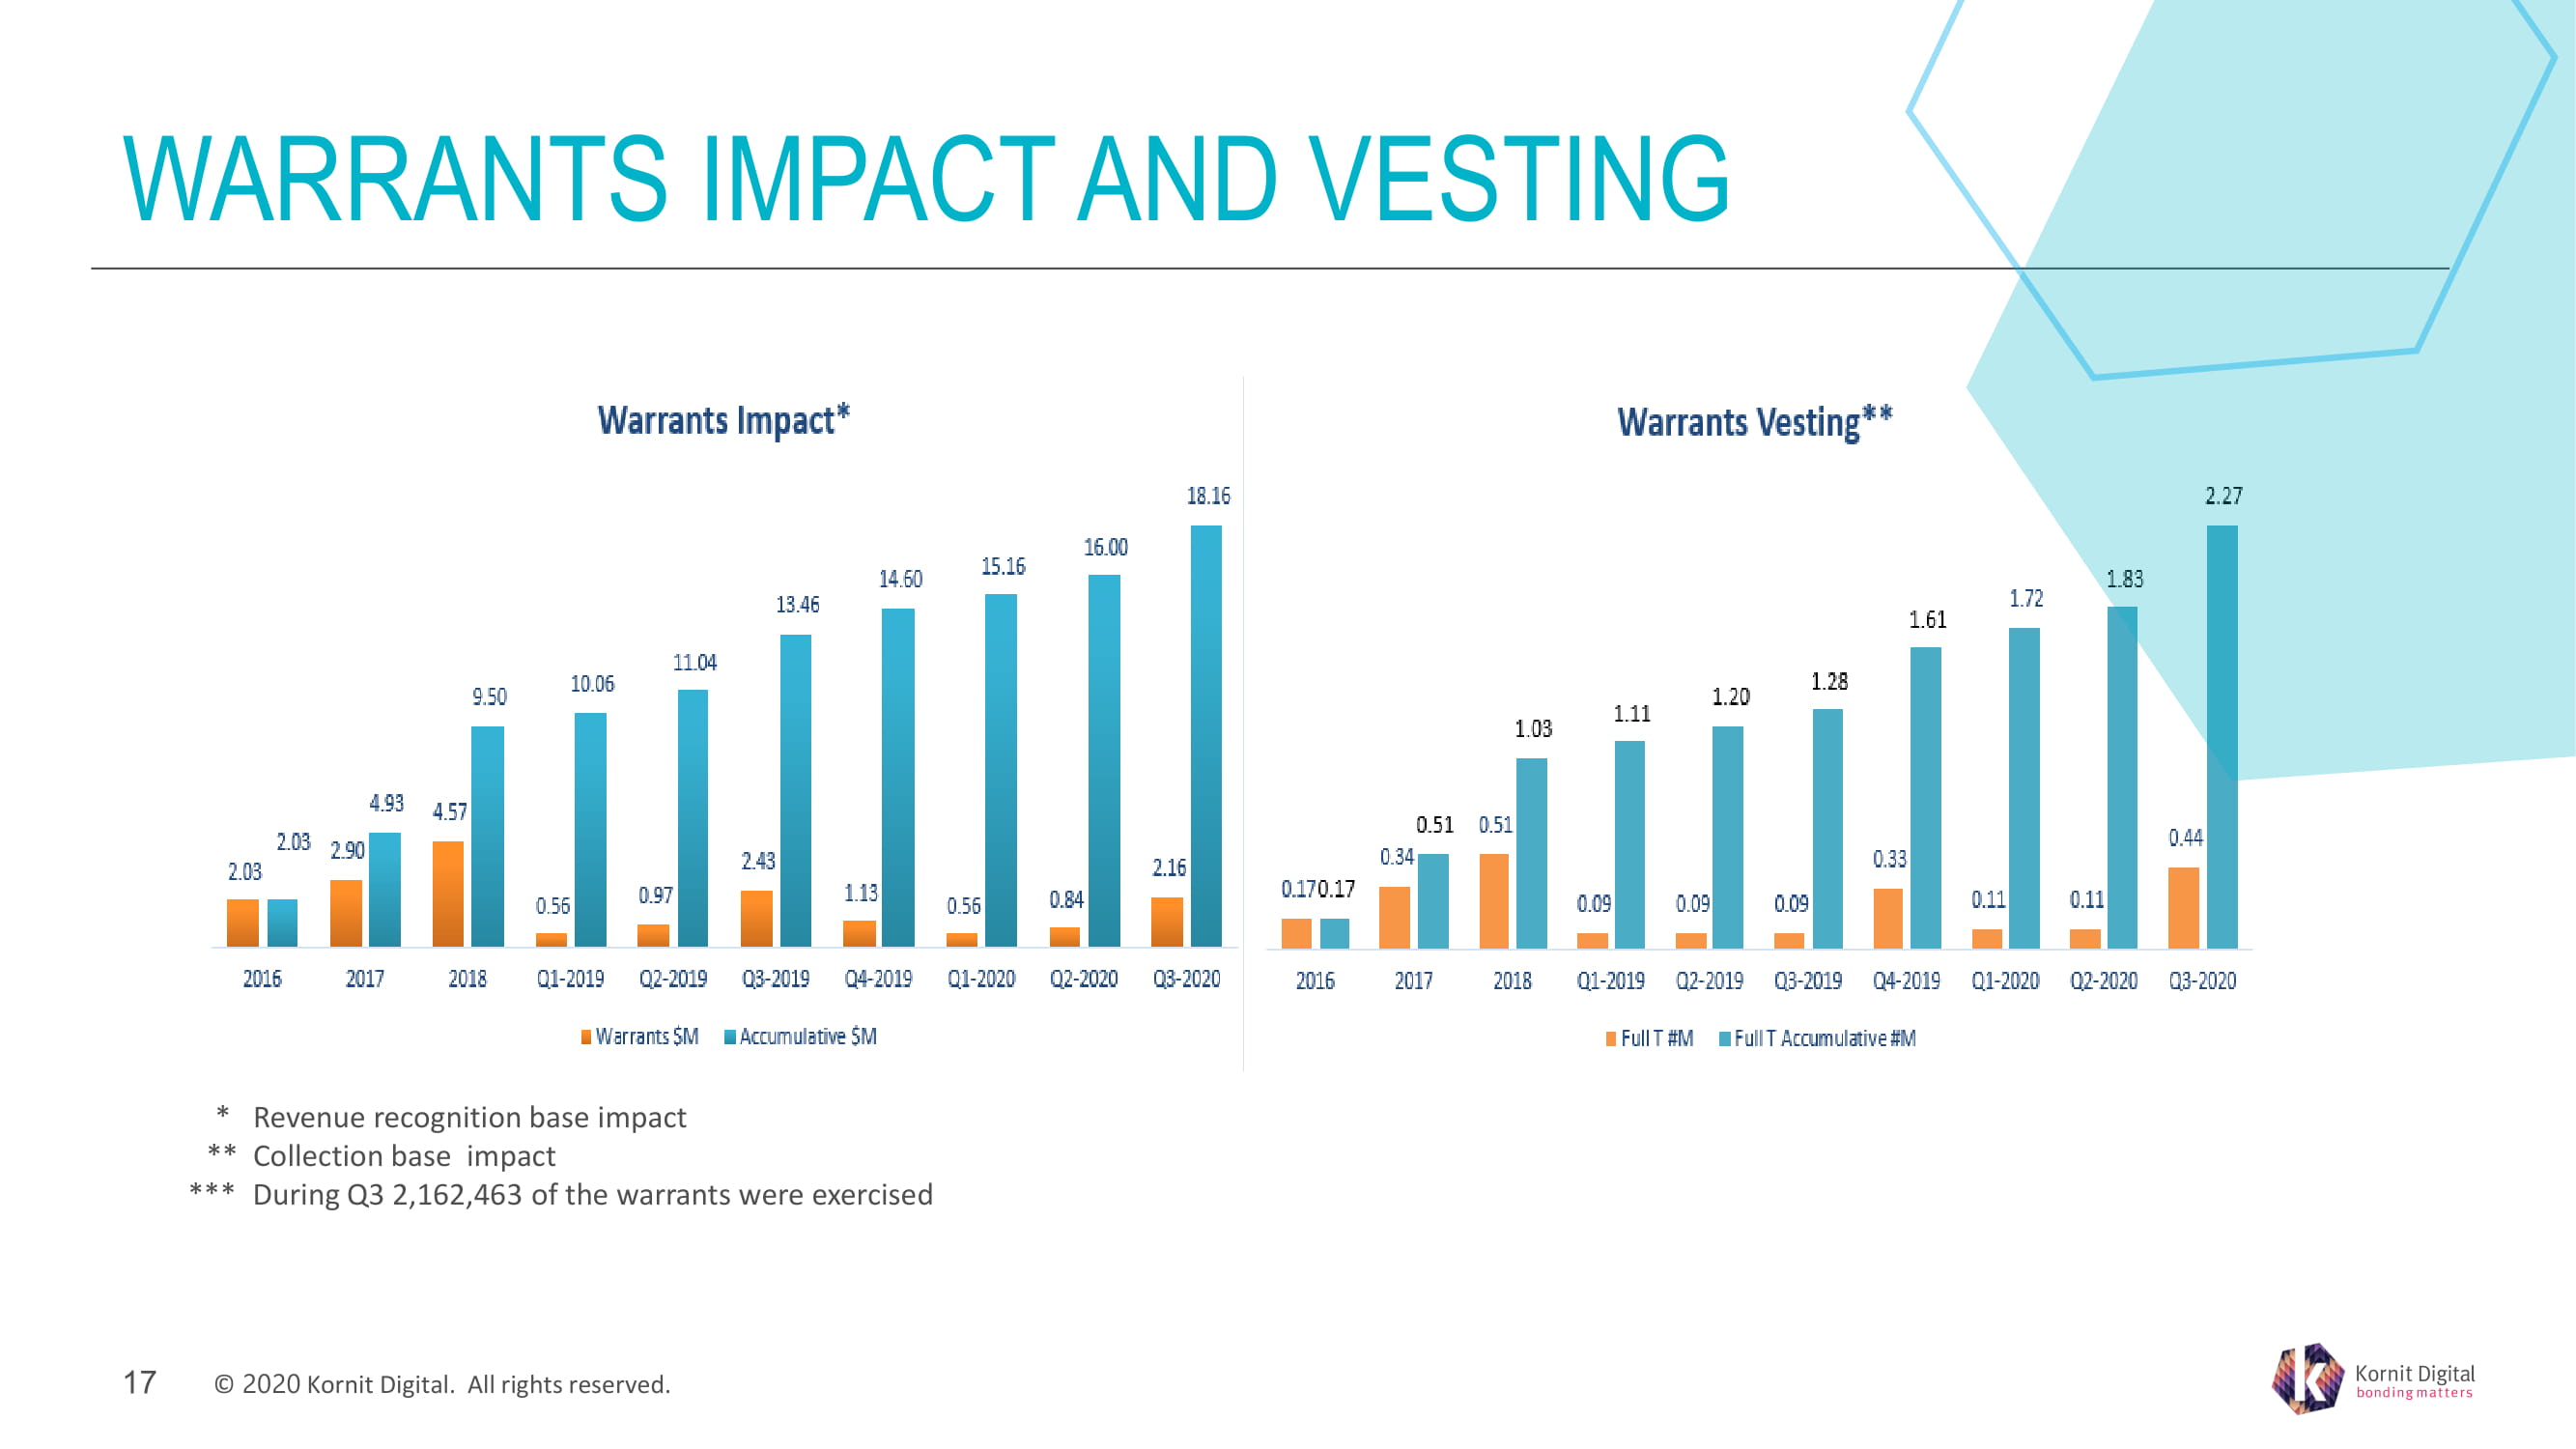
© ���� � Kornit Digital. All rights reserved. WARRANTS IMPACT AND VESTING �� ��� * Revenue recognition base impact �� ** Collection base impact *** � During Q 3 2,162,463 of the warrants were exercised
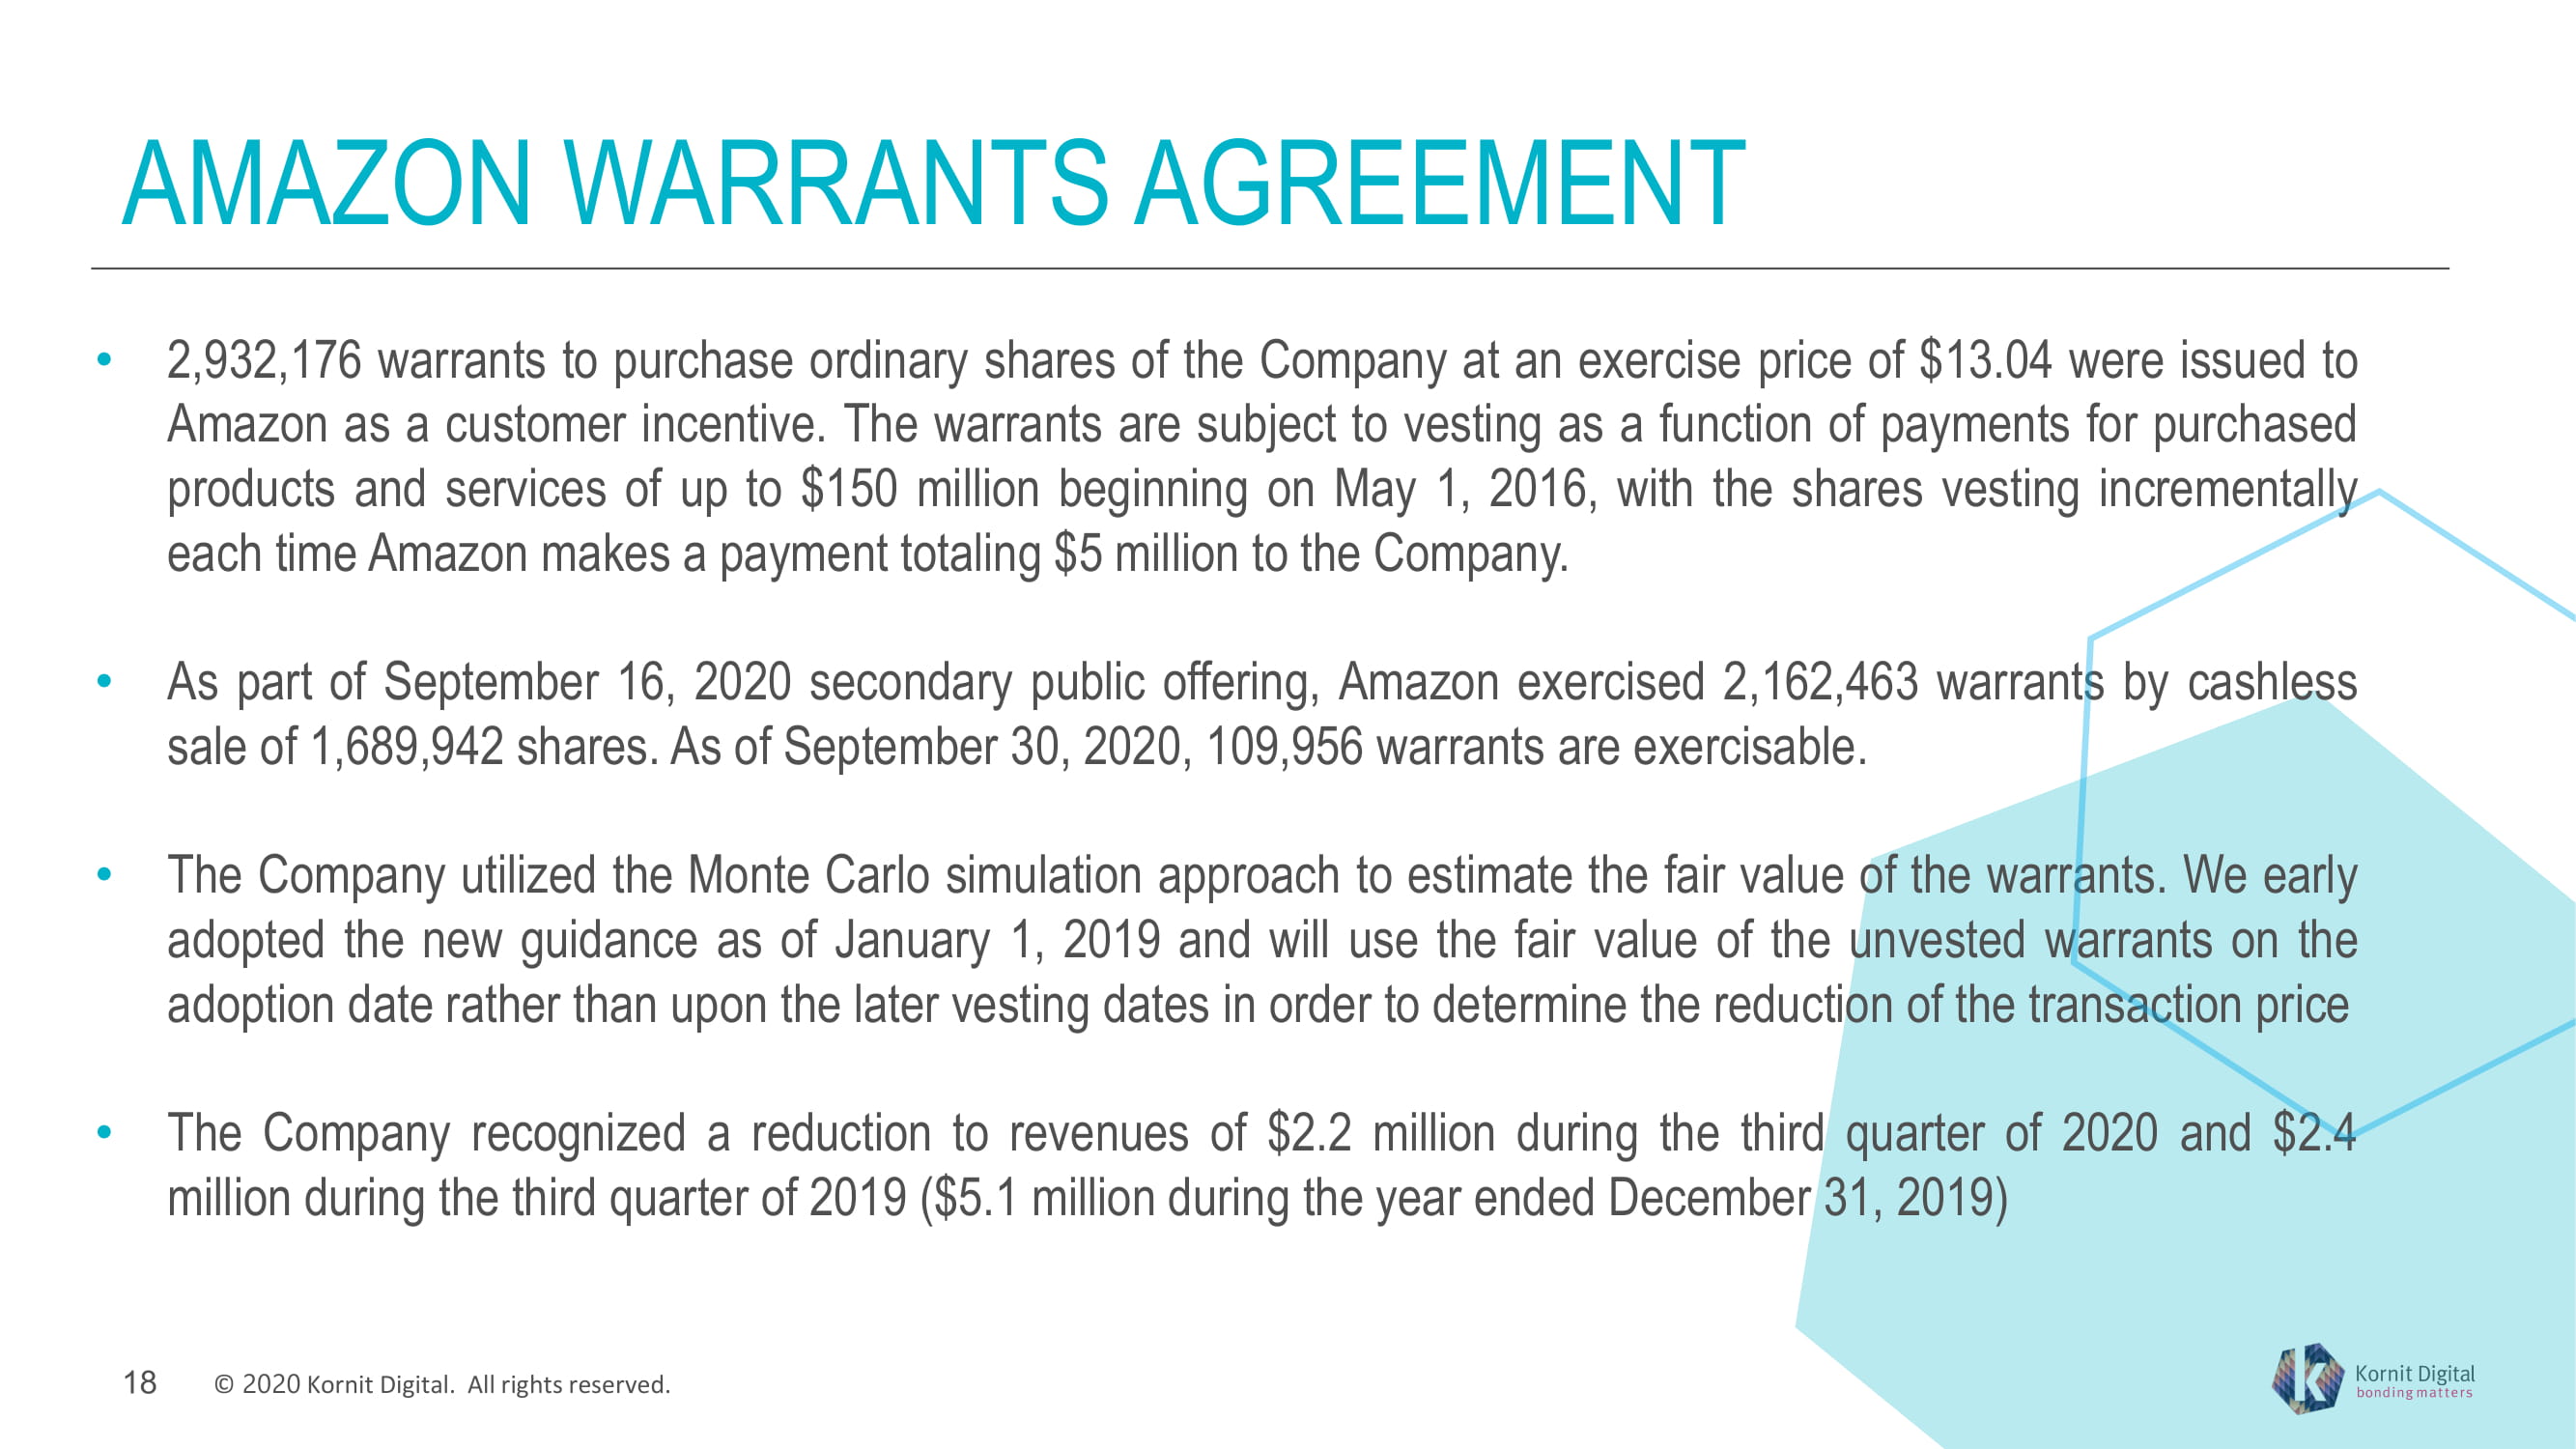
© ���� � Kornit Digital. All rights reserved. AMAZON WARRANTS AGREEMENT • 2 , 932 , 176 warrants to purchase ordinary shares of the Company at an exercise price of $ 13 . 04 were issued to Amazon as a customer incentive . The warrants are subject to vesting as a function of payments for purchased products and services of up to $ 150 million beginning on May 1 , 2016 , with the shares vesting incrementally each time Amazon makes a payment totaling $ 5 million to the Company . • As part of September 16 , 2020 secondary public offering, Amazon exercised 2 , 162 , 463 warrants by cashless sale of 1 , 689 , 942 shares . As of September 30 , 2020 , 109 , 956 warrants are exercisable . • The Company utilized the Monte Carlo simulation approach to estimate the fair value of the warrants . We early adopted the new guidance as of January 1 , 2019 and will use the fair value of the unvested warrants on the adoption date rather than upon the later vesting dates in order to determine the reduction of the transaction price • The Company recognized a reduction to revenues of $ 2 . 2 million during the third quarter of 2020 and $ 2 . 4 million during the third quarter of 2019 ( $ 5 . 1 million during the year ended December 31 , 2019 ) ��
© ���� � Kornit Digital. All rights reserved. Q 4 2020 GUIDANCE* �� *we assume zero impact on revenue and operating margin for the purposes of guidance • Revenue is expected to be between $ � � �� million to $ �� . � million • Non - GAAP operating income is expected to be between �� % to 1 � % of revenue

© ���� � Kornit Digital. All rights reserved. CREATE A BETTER WORLD WHERE EVERYBODY CAN BOND, DESIGN AND EXPRESS THEIR IDENTITIES, ONE IMPRESSION AT A TIME OUR VISION THANK YOU
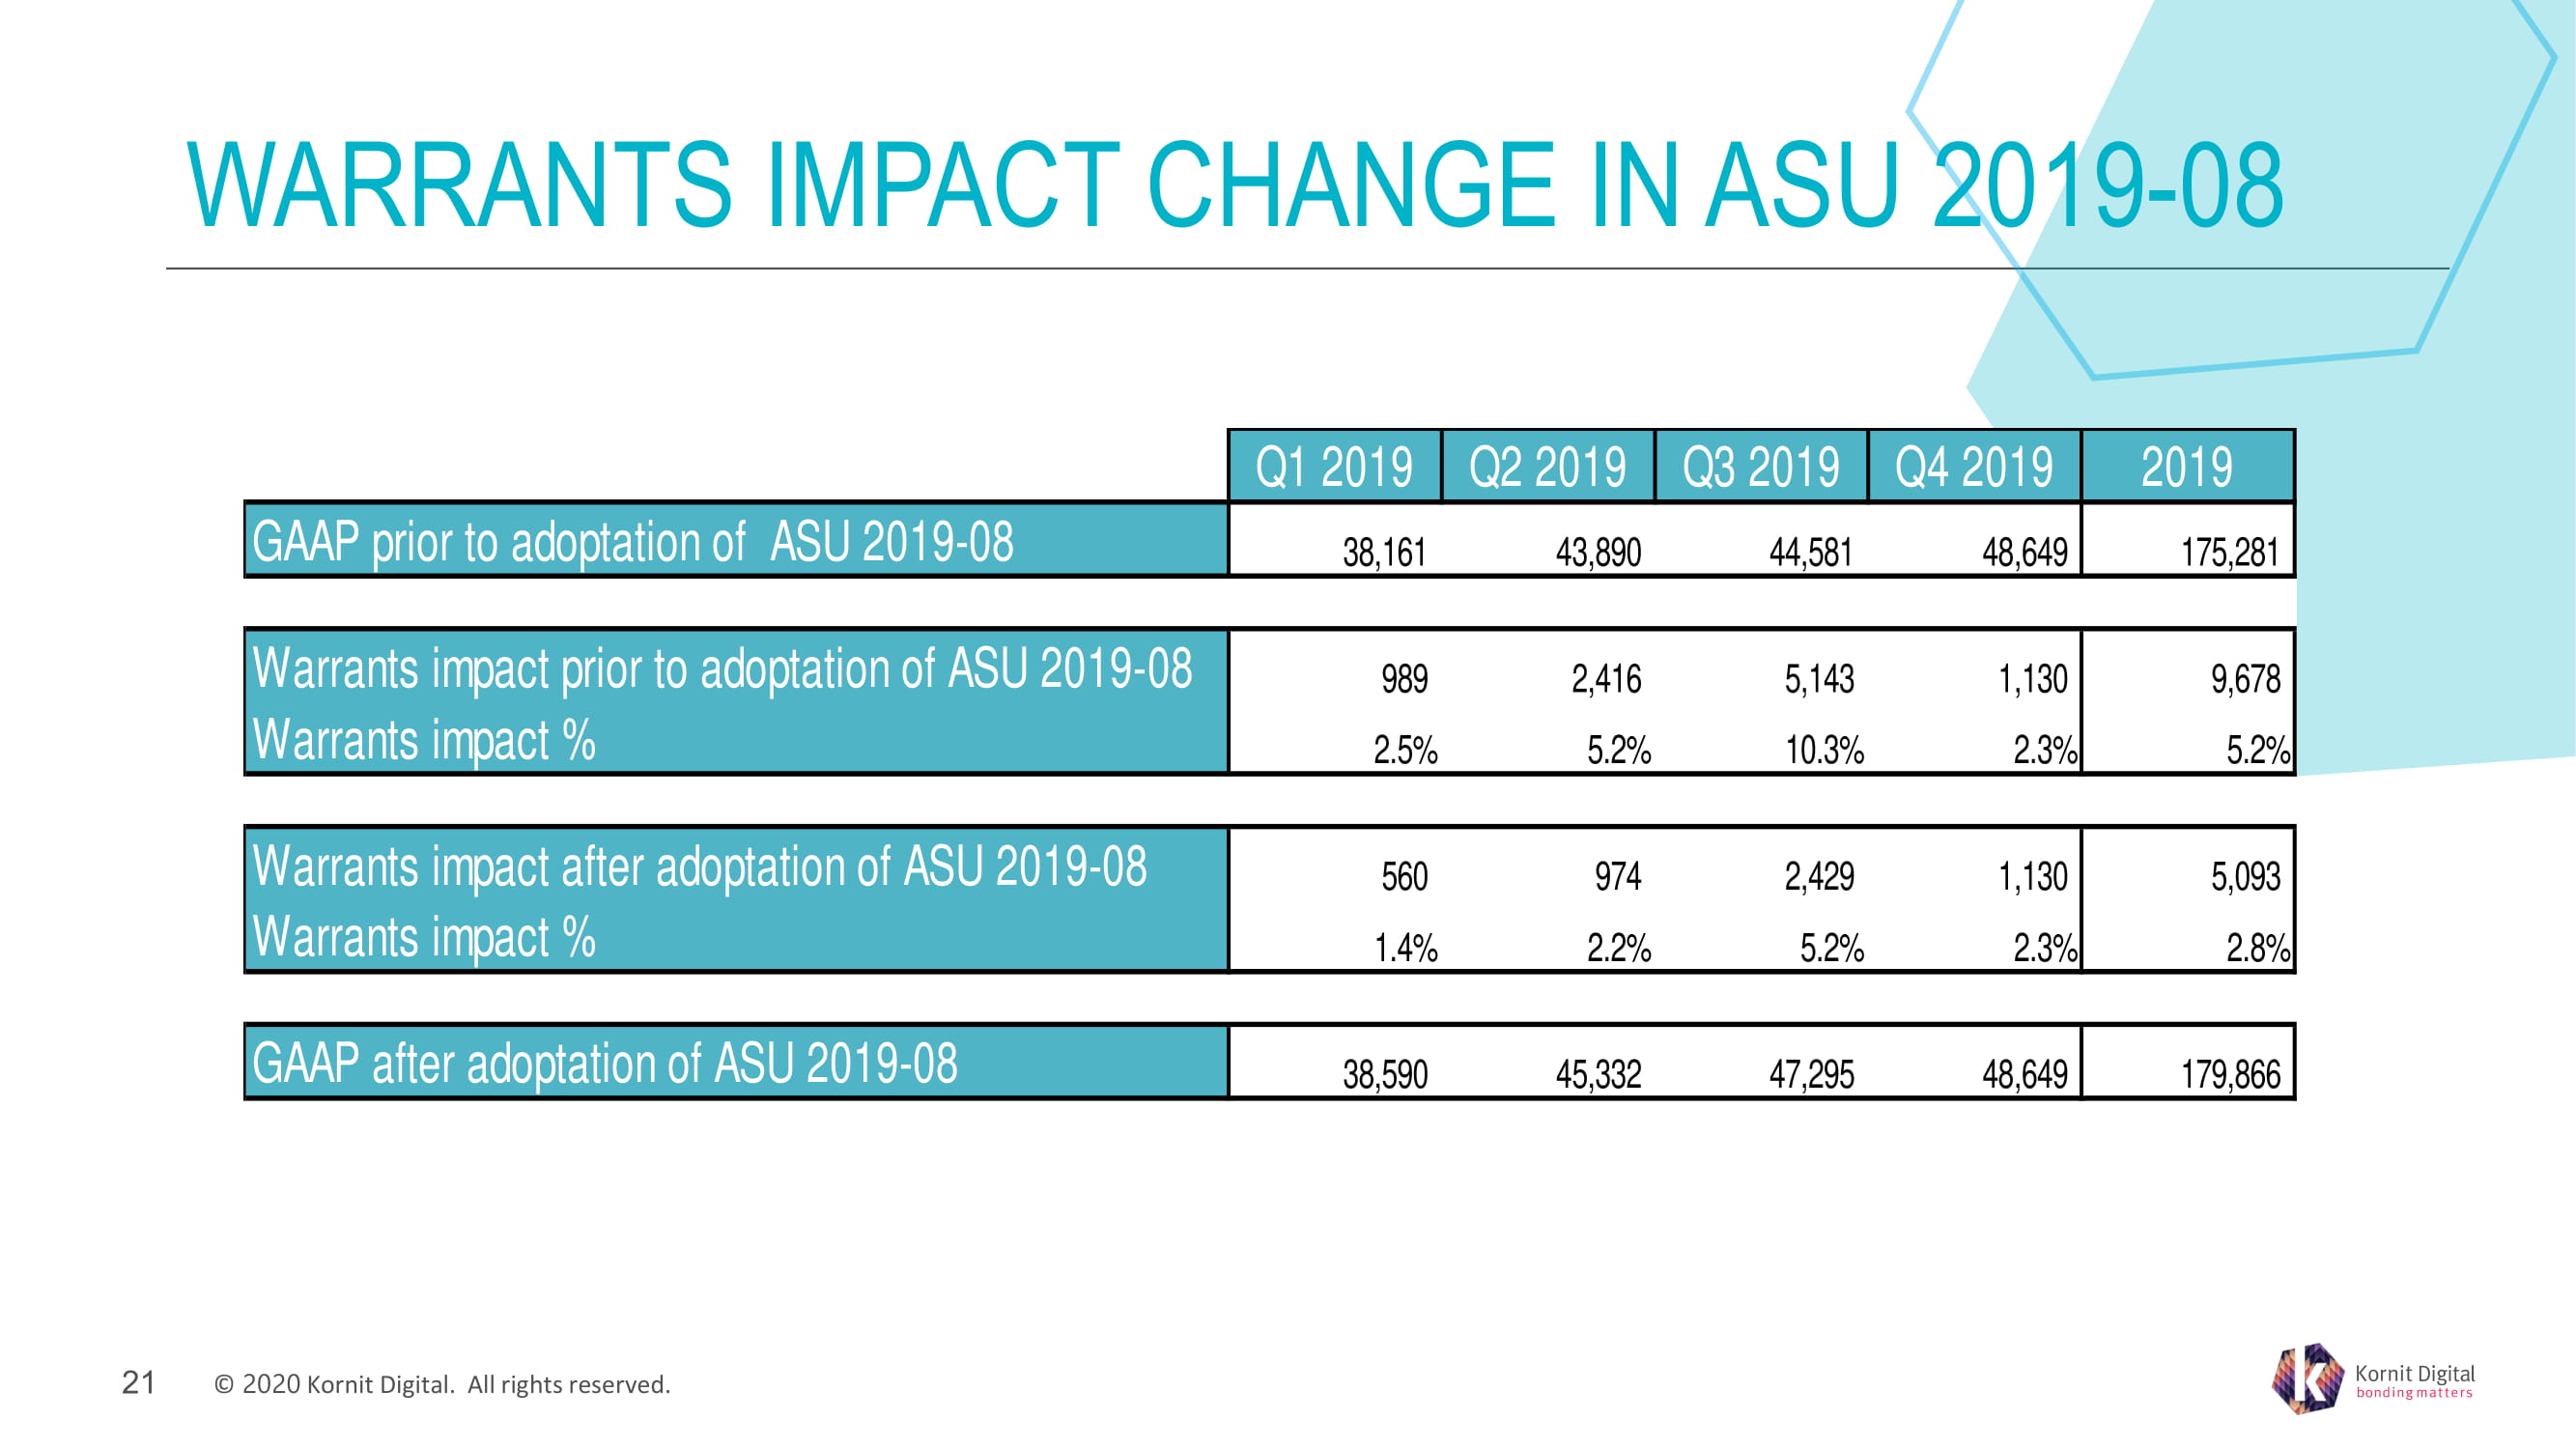
© ���� � Kornit Digital. All rights reserved. WARRANTS IMPACT CHANGE IN ASU 2019 - 08 �� Q1 2019 Q2 2019 Q3 2019 Q4 2019 2019 GAAP prior to adoptation of ASU 2019-08 38,161 43,890 44,581 48,649 175,281 Warrants impact prior to adoptation of ASU 2019-08 989 2,416 5,143 1,130 9,678 Warrants impact % 2.5% 5.2% 10.3% 2.3% 5.2% Warrants impact after adoptation of ASU 2019-08 560 974 2,429 1,130 5,093 Warrants impact % 1.4% 2.2% 5.2% 2.3% 2.8% GAAP after adoptation of ASU 2019-08 38,590 45,332 47,295 48,649 179,866