ARES INDUSTRIAL REAL ESTATE INCOME TRUST (ARIR)
Filed: 13 Nov 20, 2:40pm
Exhibit 99.2
To our Valued Stockholders:
Given continued disruptions of COVID-19 (COVID) throughout the global economy and commercial real estate, we want to provide you with an update regarding Black Creek Industrial REIT IV Inc. (BCI IV).
BCI IV’s total return for October, with respect to Class T shares (without upfront sales charge), was 0.38%, including a net monthly distribution of $0.037 per Class T share, which is equivalent to an annualized yield of 4.40%1 based on NAV. Our NAV per share at October 31, 2020 was $10.092, which is flat relative to the previous months’ NAV per share, and represents, as of that date, with respect to Class T shares (without upfront sales charge), a trailing one year return of 4.85% and a since inception3 annualized return of 4.86%2.
While no property sector is immune to COVID, the industrial real estate sector in which we invest continues to outperform most property sectors4. Our operating portfolio is 94.3% leased, and our total portfolio has collection rates averaging 96.5% for the month of October5. BCI IV’s diversified tenant base includes an abundance of quality tenants with strong operating histories and a weighted average lease term of 4.8 years for the total portfolio – all of which we believe create stability and resiliency.
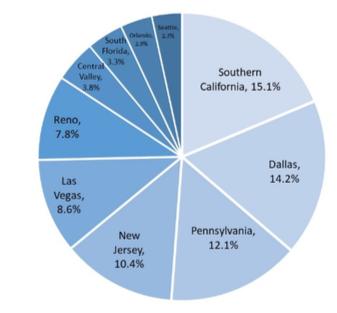
SUMMARY PORTFOLIO STATISTICS AND TOP TEN GEOGRAPHIC ALLOCATIONS (as of October 31, 2020)5
| Operating Portfolio | Total Portfolio | |
Square Feet | 26M | 30M | |
Number of Properties | 109 | 126 | |
Percent Leased | 94.3% | 86.7% | |
Weighted Avg. Lease Term | 4.7 years | 4.8 years | |
Tenant Count | 194 | 197 | |
BCI IV will end October with $2.0B6 in assets under management, including over $300.0 million in cash, and 29.8%7 leverage. Given the uptick in e-commerce demand since COVID began and the strong performance that we continue to see within the industrial sector, we remain committed to acquiring well located, highly functional bulk distribution and light industrial facilities in the largest distribution and logistics markets across the country.
While much remains unknown regarding the broader economy, we believe BCI IV is in a position of strength to weather the effects of COVID while providing our stockholders with access to high quality, income-producing industrial real estate. We are confident in our disciplined investment strategy, asset base, and underlying tenant composition and remain available should you have any questions or want to discuss our portfolio further. As always, we appreciate the continued trust you have placed in BCI IV.
Sincerely,
The Black Creek Team
This communication is for existing stockholders of BCI IV and their financial professional representatives and may not be distributed to others. This communication is not an offer to sell or buy any securities.
Forward-Looking Statements
This letter includes certain statements that are intended to be deemed “forward-looking statements” within the meaning of, and to be covered by the safe harbor provisions contained in, Section 27A of the Securities Act of 1933, as amended, and Section 21E of the Securities Exchange Act of 1934, as amended. Such forward-looking statements are generally identifiable by the use of the words “may,” “will,” “should,” “expect,” “anticipate,” “estimate,” “believe,” “intend,” “project,” “continue,” or other similar words or terms and include, without limitation, statements regarding BCI IV’s ability to successfully navigate through the current economic uncertainty, the resiliency of industrial real estate, BCI IV’s ability to acquire additional high quality industrial assets, BCI IV’s ability to continue to collect rent at current levels and to collect any rent abatements over time and the ability of our advisor’s asset management teams to successfully manage our properties and restructure leases, if necessary. These statements are based on certain assumptions and analyses made in light of our experience and our perception of historical trends, current conditions, expected future developments and other factors we believe are appropriate. Such statements are subject to a number of assumptions, risks and uncertainties that may cause our actual results, performance or achievements to be materially different from future results, performance or achievements expressed or implied by these forward-looking statements. Readers are cautioned not to
place undue reliance on these forward-looking statements. Among the factors that may cause results to vary are the negative impact of COVID-19 on our financial condition and results of operations being more significant than expected, the negative impact of COVID-19 on our tenants being more significant than expected, the slower pace at which capital is expected to be raised compared to the pace of the first three months of 2020, general economic and business (particularly real estate and capital market) conditions being less favorable than expected, the business opportunities that may be presented to and pursued by us, changes in laws or regulations (including changes to laws governing the taxation of real estate investment trusts (“REITs”)), risk of acquisitions, availability and creditworthiness of prospective tenants, availability of capital (debt and equity), interest rate fluctuations, competition, supply and demand for properties in current and any proposed market areas in which we invest, our tenants’ ability and willingness to pay rent at current or increased levels, accounting principles, policies and guidelines applicable to REITs, environmental, regulatory and/or safety requirements, tenant bankruptcies and defaults, the availability and cost of comprehensive insurance, including coverage for terrorist acts, and other factors, many of which are beyond our control. For a further discussion of these factors and other risk factors that could lead to actual results materially different from those described in the forward-looking statements, see “Risk Factors” under Item 1A of Part 1 of our Annual Report on Form 10-K for the year ended December 31, 2019 and subsequent periodic and current reports filed with the Securities and Exchange Commission (“SEC”). We undertake no obligation to publicly update or revise any forward-looking statements, whether as a result of future events, new information or otherwise.
1 For the same trailing one-month period ended October 31, 2020, Class T shares (with sales charge) returned -4.13%, Class I shares returned 0.47% and Class W shares (with ongoing distribution fee) returned 0.42%. For the same trailing one-month period ended October 31, 2020, BCI IV paid $0.045 and $0.041 in net distributions for Class I shares and Class W shares (with ongoing distribution fee), respectively. For the same trailing one-year period ended October 31, 2020, Class T shares (with sales charge) returned 0.13%, Class I shares returned 5.88% and Class W shares (with ongoing distribution fee) returned 5.36%. For the period from their respective inception dates to October 31, 2020, the annualized return for Class T shares (with sales charge) was 3.26%, for Class I shares was 5.89% and for Class W shares (with ongoing distribution fee) was 5.44%. Annualized yield is calculated as the current month’s gross distribution, less the current month’s distribution fees, annualized and divided by NAV. While the annualized yield is based on NAV, most Class T shares are sold at a price equal to NAV plus upfront selling commissions and fees of 4.5% of the purchase price. Performance is measured by total return, which includes income and appreciation (i.e., distributions paid and changes in NAV through the end of the applicable period) and is a compound rate of return that assumes reinvestment of all distributions for the respective time period. Past performance is not a guarantee of future results. Performance would be lower if calculated assuming that distributions are not reinvested. Performance data quoted above is historical and applies to Class T shares only. For the same periods, the return on Class T performance may be higher or lower than the performance data quoted. Actual individual investor returns will vary. The returns have been prepared using unaudited data and valuations of the underlying investments in BCI IV’s portfolio, which are estimates of fair value and form the basis for BCI IV’s NAV. Valuations based upon unaudited or estimated reports from the underlying investments may be subject to later adjustments or revisions, may not correspond to realized value and may not accurately reflect the price at which assets could be liquidated on any given day. See “Management’s Discussion and Analysis of Financial Condition and Results of Operations” in BCI IV’s Quarterly Report on Form 10-Q, filed with the SEC on November 10, 2020, for important additional information concerning the calculation of total return.
2 See BCI IV’s Current Report on Form 8-K, filed with the SEC on November 13, 2020 for important additional information concerning the calculation of our NAV as of October 31, 2020.
3 Inception is the date shares of BCI IV’s common stock were first issued to third-party investors in its initial public offering. The inception date for Class T shares and Class I shares was November 1, 2017. The inception date for Class W shares was July 2, 2018.
4 National Council of Real Estate Investment Fiduciaries Flash Report, 2nd Quarter 2020.
5 The Operating Portfolio reflects information regarding the BCI IV, Build-To-Core Industrial Partnership I LP (BTC I) and Build-To-Core Industrial Partnership II LP (BTC II) stabilized portfolios, which include properties that are more than 90% leased or have been owned for more than one year. The Total Portfolio also includes the BCI IV, BTC I and BTC II value-add portfolios, which include properties that are acquired with the intention to reposition or substantially improve, properties that recently completed development but are not yet 90% leased and properties that are less than 90% leased at acquisition. Top ten geographic allocations (based on gross real estate value) are presented based on BCI IV’s effective ownership through its minority ownership interests in BTC I and BTC II. All of the remaining metrics are shown as if BCI IV owned a 100% interest in BTC I and BTC II and represent all acquired or completed industrial buildings, as of October 31, 2020.
6 Assets under management is calculated as fair value of BCI IV’s real estate investments, fair value of BCI IV’s net investment in unconsolidated joint venture partnerships, plus cash and cash equivalents.
7 As of October 31, 2020. Leverage is calculated as BCI IV’s total borrowings outstanding divided by the fair value of BCI IV’s real properties plus BCI IV’s net investment in unconsolidated joint venture partnerships plus cash and cash equivalents.
8 In July 2020, BCI IV acquired a 20% minority ownership interest in BTC I and an 8% minority ownership interest in BTC II from Industrial Property Trust (IPT), which was an affiliated entity.