
BLACK KNIGHT, INC. INVESTOR DAY November 19, 2018

WELCOME BRYAN HIPSHER, Senior Vice President, Finance 2
Disclaimer Forward-Looking Statements Our discussions today, including this presentation and any comments made by management, contain forward-looking statements within the meaning of the U.S. federal securities laws. Any statements that refer to future events or circumstances, including our future strategies or results, or that are not historical facts, are forward-looking statements. Actual results could differ materially from those projected in forward- looking statements due to a variety of factors, including the risks and uncertainties set forth in our press release dated November 19, 2018, our annual report on Form 10-K for 2017 and our other filings with the SEC. We undertake no obligation to update or revise any forward- looking statements. Non-GAAP Financial Measures This presentation will reference certain non-GAAP financial information. For a description and reconciliation of non-GAAP measures presented in this document, please see the Appendix attached to this presentation, or visit the Black Knight Investor Relations website at https://investor.blackknightinc.com. 3

Presenters ANTHONY JABBOUR SHELLEY LEONARD KIRK LARSEN Chief Executive Officer Chief Product Officer Chief Financial Officer 4

Agenda 5

6

Why Black Knight? BUSINESS 7

Why Black Knight? BUSINESS 8

Black Knight’s Mission BUSINESS To be the PREMIER PROVIDER of software and data and analytics known for CLIENT FOCUS AND PRODUCT EXCELLENCE; and to deliver INNOVATIVE, seamlessly INTEGRATED solutions with URGENCY. 9

Black Knight At A Glance BUSINESS SOFTWARE SOLUTIONS DATA & ANALYTICS VERTICAL SOFTWARE, SOFTWARE-AS-A-SERVICE COMPREHENSIVE DATA ASSETS DATA AND ANALYTICS END-TO-END, MISSION-CRITICAL MODELING AND INSIGHTS PLATFORMS PROVIDER DELIVERY ACROSS BLACK KNIGHT INTEGRATED BUSINESS ECOSYSTEM INTELLIGENCE 10

Best-In-Class Servicing Software BUSINESS 1 Active 1st and 2nd lien mortgages on our mortgage servicing software solution as of October 31, 2018. 11
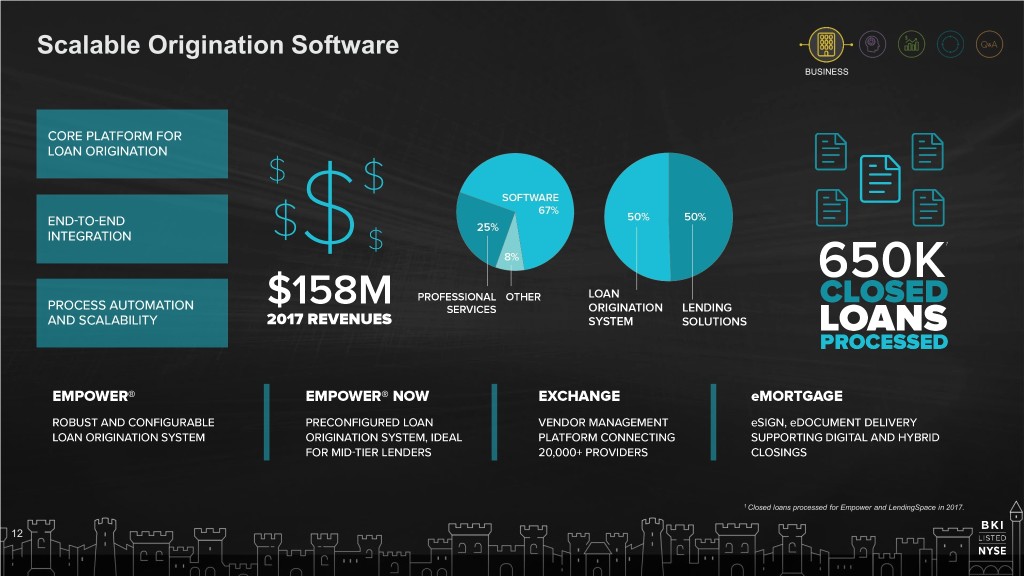
Scalable Origination Software BUSINESS 1 Closed loans processed for Empower and LendingSpace in 2017. 12

Comprehensive Data & Analytics BUSINESS 13
Why Black Knight? BUSINESS 14

Differentiated and Compelling Business and Economic Model BUSINESS 15

Performance At A Glance BUSINESS 1 See appendix for non-GAAP reconciliations. | 2 Midpoint Guidance as of October 30, 2018. 16

Why Black Knight? BUSINESS 17

Our Expansive Client Base BUSINESS 1 According to top 50 MSP clients by loan count as of September 30, 2018. | 2 Q3 2018 compared to Q3 2017. 18

... Affected by Industry Trends BUSINESS Source: Words compiled from recent FNMA Lender Sentiment Surveys 19

Black Knight Executes on a Long-Term Growth Strategy BUSINESS 20

Growth Strategy: LAND BUSINESS 21

Growth Strategy: LAND Servicing Software BUSINESS Market size and top servicers according to Inside Mortgage Finance (“IMF”) and company estimates as of June 30, 2018. 22

Growth Strategy: LAND Origination Software BUSINESS Market size and top originators according to Bureau of Consumer Financial Protection and company estimates as of December 31, 2017. 23
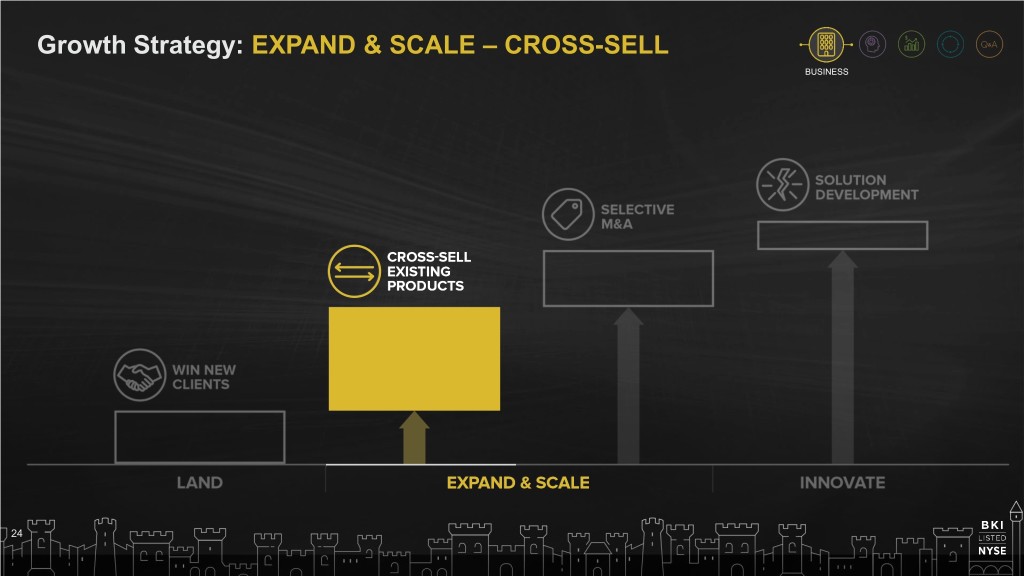
Growth Strategy: EXPAND & SCALE – CROSS-SELL BUSINESS 24

Growth Strategy: EXPAND & SCALE – CROSS-SELL Gain Enterprise Clients BUSINESS End-to-end, software-as-a-service solution with scaling benefits that allow us to double our revenues with the account 25

Growth Strategy: EXPAND & SCALE – CROSS-SELL Proven Value of End-to-End Platform Partner BUSINESS 26

Growth Strategy: EXPAND & SCALE – CROSS-SELL Enterprise Clients Bring Significant Revenues Growth BUSINESS 27
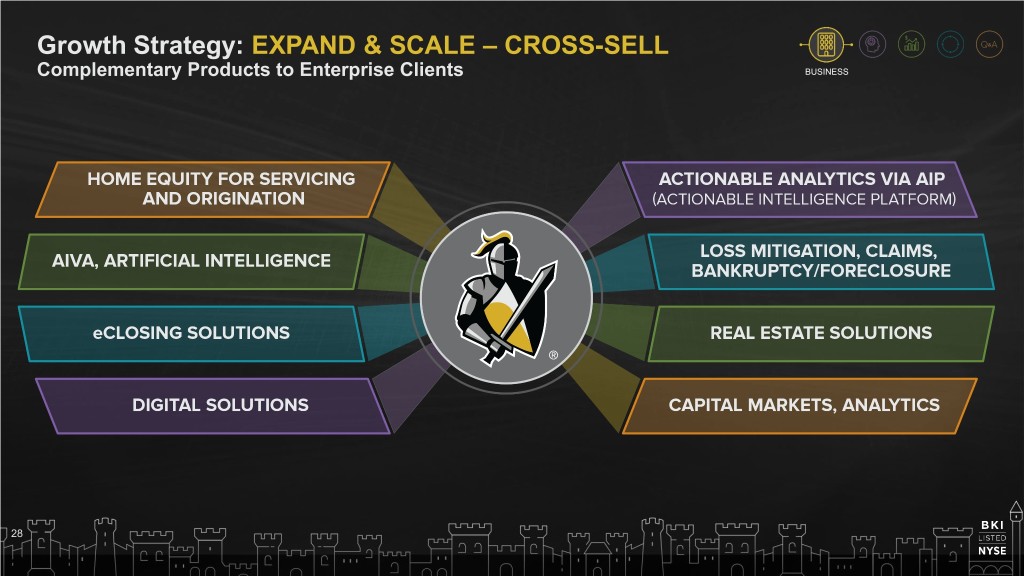
Growth Strategy: EXPAND & SCALE – CROSS-SELL Complementary Products to Enterprise Clients BUSINESS 28

Growth Strategy: EXPAND & SCALE – M&A BUSINESS 29

Growth Strategy: EXPAND & SCALE – SELECTIVE M&A BUSINESS 30

Investment in About Dun & Bradstreet Investment Highlights • • LEADING SOURCE OF COMMERCIAL DATA, JOINING RENOWNED GROUP OF INVESTORS ANALYTICS AND INSIGHTS ON BUSINESSES LED BY CC CAPITAL, CANNAE HOLDINGS, THOMAS H. LEE PARTNERS, L.P. • MISSION-CRITICAL, DEEPLY INTEGRATED AND • DIFFERENTIATED DATA ASSETS INVESTMENT OF UP TO $375 MILLION FOR AN ECONOMIC OWNERSHIP INTEREST OF • MARKET LEADER AND WELL POSITIONED IN LESS THAN 20% LARGE MARKET • OPPORTUNITY TO ACCELERATE D&B • LONG HISTORY WITH GLOBAL BRAND GROWTH AND INCREASE EFFICIENCY RECOGNITION AND REPUTATION FOR HIGH • QUALITY DATA AND SERVICES INVESTMENT NOT TIED TO MORTGAGE MARKET 31
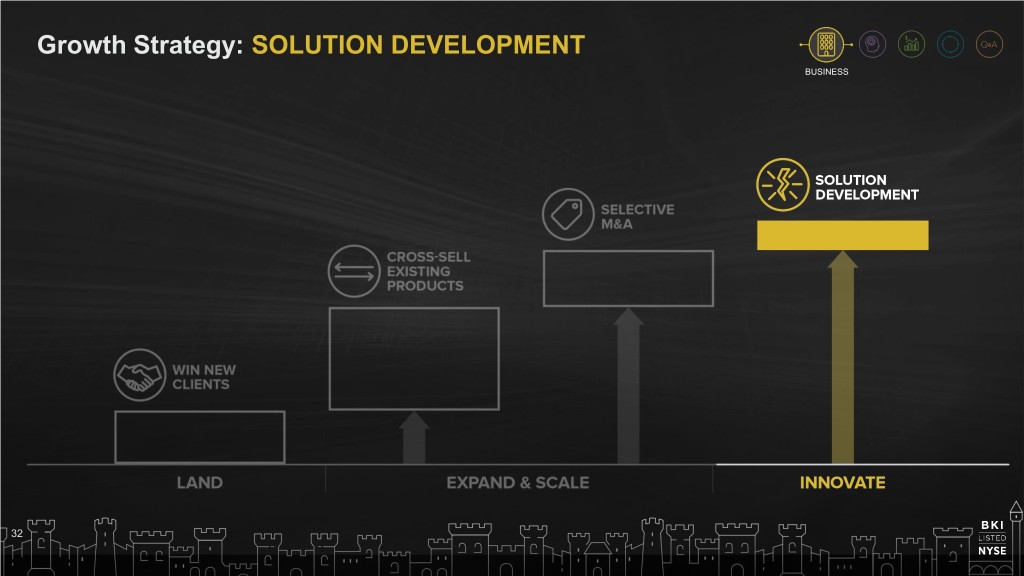
Growth Strategy: SOLUTION DEVELOPMENT BUSINESS 32
33

Growth Strategy: SOLUTION DEVELOPMENT INNOVATION 34

Growth Strategy: SOLUTION DEVELOPMENT INNOVATION 35

Growth Strategy: SOLUTION DEVELOPMENT Elevated Cost of Servicing INNOVATION Annual Per Loan Servicing Cost According to Mortgage Bankers Association (“MBA”) Servicing Operation Study and Forum as of December 31, 2017. 36

Growth Strategy: SOLUTION DEVELOPMENT Elevated Cost of Loan Origination INNOVATION Cost to Originate a Loan According to MBA Quarterly Performance Report as of December 31, 2017. 37

INNOVATION: AIVA SM Artificial Intelligence to Improve Productivity INNOVATION GET DATA CLEAN, PREPARE AND TRAIN MODEL MANIPULATE DATA TEST DATA IMPROVE 38

39

40
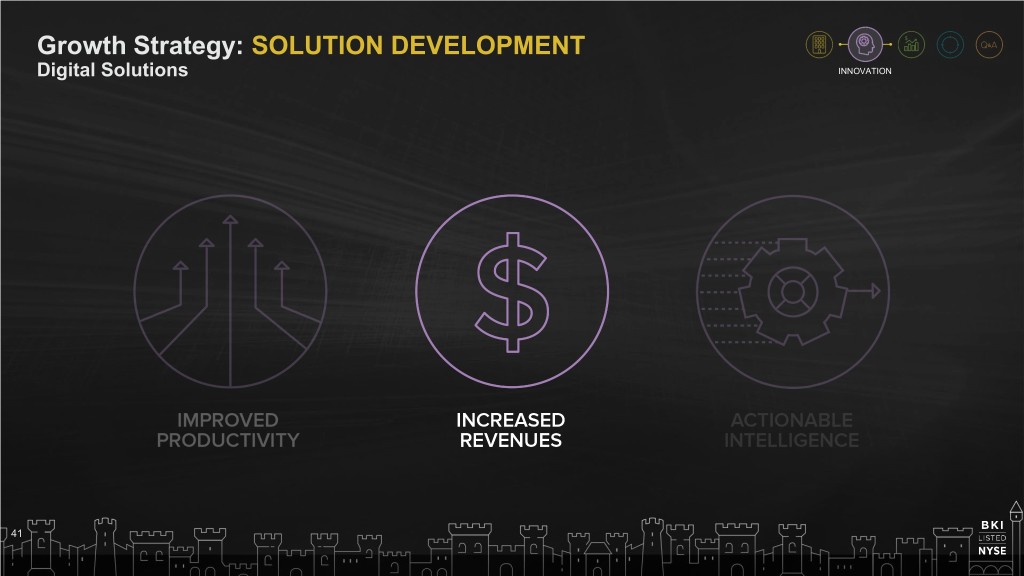
Growth Strategy: SOLUTION DEVELOPMENT Digital Solutions INNOVATION 41

Growth Strategy: SOLUTION DEVELOPMENT Opportunity: Demand for Digital INNOVATION According to Fannie Mae Q1 2018 National Housing Survey 42
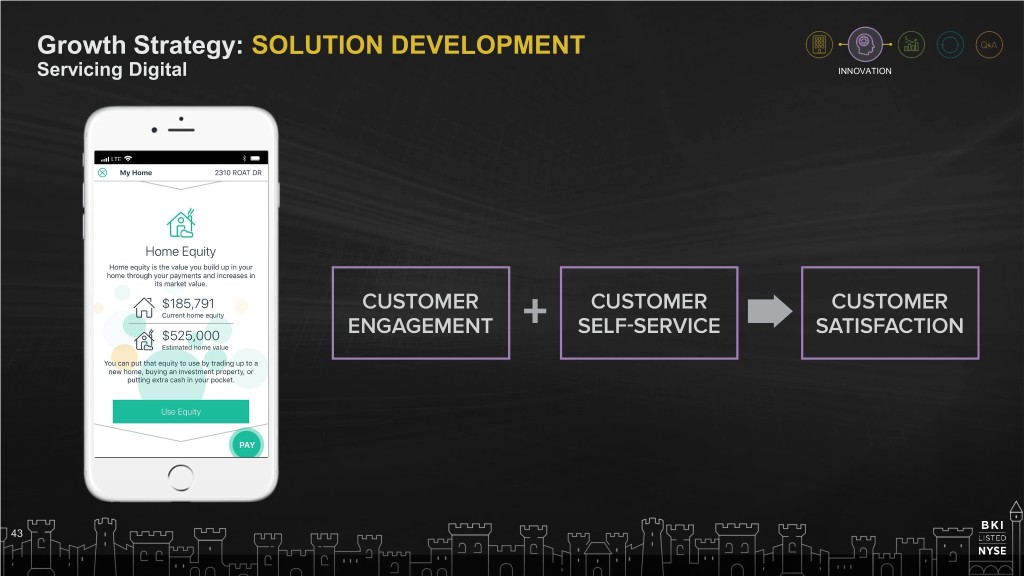
Growth Strategy: SOLUTION DEVELOPMENT Servicing Digital INNOVATION 43

INNOVATION SERVICING DIGITAL DEMO 44

Growth Strategy: SOLUTION DEVELOPMENT Actionable Analytics INNOVATION 45
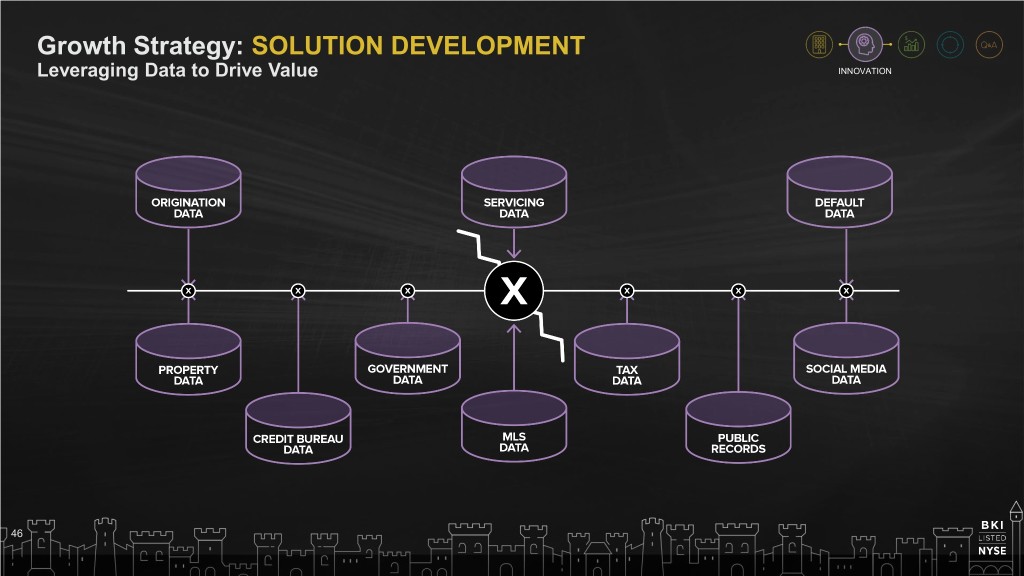
Growth Strategy: SOLUTION DEVELOPMENT Leveraging Data to Drive Value INNOVATION 46

Growth Strategy: SOLUTION DEVELOPMENT Actionable Intelligence Platform INNOVATION 47

Growth Strategy: SOLUTION DEVELOPMENT Actionable Intelligence Platform: Propensity to Transact INNOVATION 48

Growth Strategy: SOLUTION DEVELOPMENT Actionable Intelligence Platform: Propensity to Transact INNOVATION • EstimatedInterest Rate Value • College-age • MarriageChild License • AvailablePrincipal BalanceEquity • BuildingNew Baby Permits • AgePayments of Home • House • LiensRemaining on Remodeling Property 49

Growth Strategy: SOLUTION DEVELOPMENT Actionable Intelligence Platform: Propensity to Transact INNOVATION 50

INNOVATION ACTIONABLE INTELLIGENCE PLATFORM 51

Growth Strategy: SOLUTION DEVELOPMENT INNOVATION AIVA SERVICING DIGITAL ACTIONABLE INTELLIGENCE PLATFORM 52

53

Shareholder Value Creation SHAREHOLDER VALUE CREATION 54
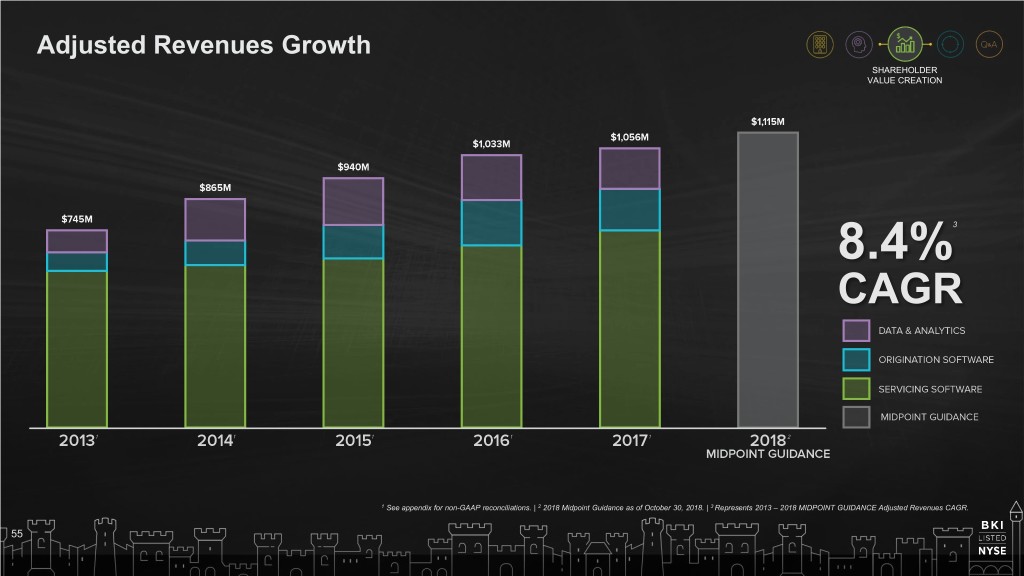
Adjusted Revenues Growth SHAREHOLDER VALUE CREATION 3 8.4% CAGR 1 See appendix for non-GAAP reconciliations. | 2 2018 Midpoint Guidance as of October 30, 2018. | 3 Represents 2013 – 2018 MIDPOINT GUIDANCE Adjusted Revenues CAGR. 55

Highly Visible and Predictable Revenues SHAREHOLDER VALUE CREATION For fiscal year 2017 Adjusted Revenues 56

Servicing Software Growth SHAREHOLDER VALUE CREATION Volumes according to Equifax Data as of June 30, 2018. 57

Origination Software Growth SHAREHOLDER VALUE CREATION Volumes according to Equifax Data as of June 30, 2018. 58

Sold Pipeline SHAREHOLDER VALUE CREATION 1 Incremental annual revenues is in regards to 2017 Adjusted Revenues 59

Operating Leverage SHAREHOLDER VALUE CREATION 60
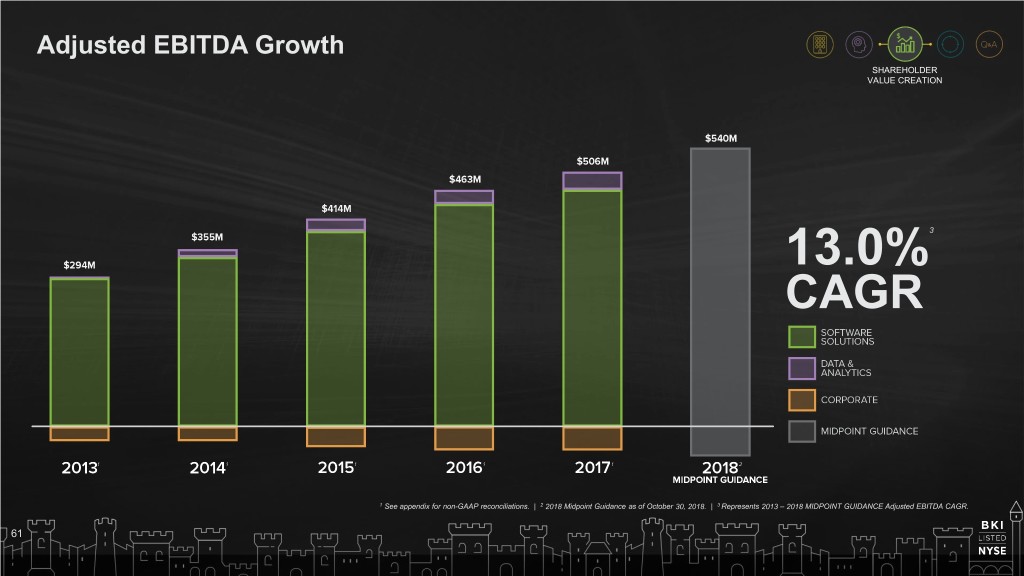
Adjusted EBITDA Growth SHAREHOLDER VALUE CREATION 3 13.0% CAGR 1 See appendix for non-GAAP reconciliations. | 2 2018 Midpoint Guidance as of October 30, 2018. | 3 Represents 2013 – 2018 MIDPOINT GUIDANCE Adjusted EBITDA CAGR. 61

Capital Allocation SHAREHOLDER VALUE CREATION 62

Excellent Return to Shareholders SHAREHOLDER VALUE CREATION BKI +103.2% S&P +38.1% From May 19, 2015 to November 16, 2018 63
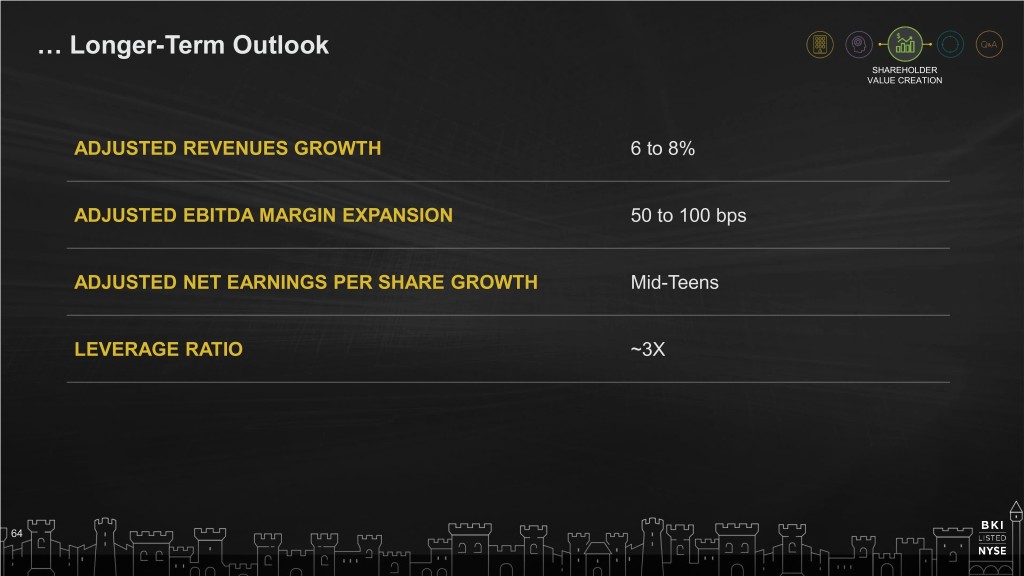
… Longer-Term Outlook SHAREHOLDER VALUE CREATION ADJUSTED REVENUES GROWTH 6 to 8% ADJUSTED EBITDA MARGIN EXPANSION 50 to 100 bps ADJUSTED NET EARNINGS PER SHARE GROWTH Mid-Teens LEVERAGE RATIO ~3X 64

65

Unique Company Profile SUMMARY 66
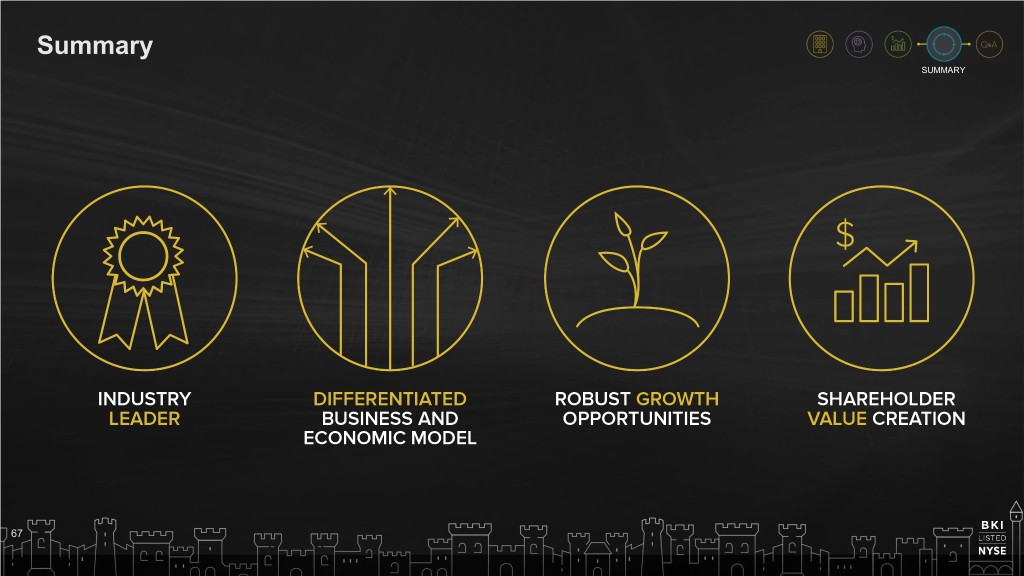
Summary SUMMARY 67

68

APPENDIX 69
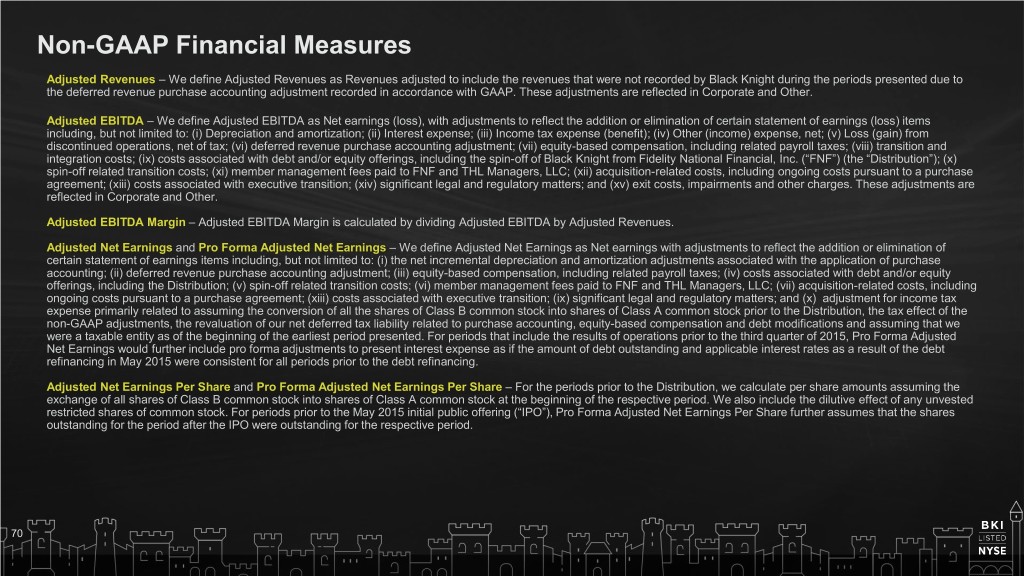
Non-GAAP Financial Measures Adjusted Revenues – We define Adjusted Revenues as Revenues adjusted to include the revenues that were not recorded by Black Knight during the periods presented due to the deferred revenue purchase accounting adjustment recorded in accordance with GAAP. These adjustments are reflected in Corporate and Other. Adjusted EBITDA – We define Adjusted EBITDA as Net earnings (loss), with adjustments to reflect the addition or elimination of certain statement of earnings (loss) items including, but not limited to: (i) Depreciation and amortization; (ii) Interest expense; (iii) Income tax expense (benefit); (iv) Other (income) expense, net; (v) Loss (gain) from discontinued operations, net of tax; (vi) deferred revenue purchase accounting adjustment; (vii) equity-based compensation, including related payroll taxes; (viii) transition and integration costs; (ix) costs associated with debt and/or equity offerings, including the spin-off of Black Knight from Fidelity National Financial, Inc. (“FNF”) (the “Distribution”); (x) spin-off related transition costs; (xi) member management fees paid to FNF and THL Managers, LLC; (xii) acquisition-related costs, including ongoing costs pursuant to a purchase agreement; (xiii) costs associated with executive transition; (xiv) significant legal and regulatory matters; and (xv) exit costs, impairments and other charges. These adjustments are reflected in Corporate and Other. Adjusted EBITDA Margin – Adjusted EBITDA Margin is calculated by dividing Adjusted EBITDA by Adjusted Revenues. Adjusted Net Earnings and Pro Forma Adjusted Net Earnings – We define Adjusted Net Earnings as Net earnings with adjustments to reflect the addition or elimination of certain statement of earnings items including, but not limited to: (i) the net incremental depreciation and amortization adjustments associated with the application of purchase accounting; (ii) deferred revenue purchase accounting adjustment; (iii) equity-based compensation, including related payroll taxes; (iv) costs associated with debt and/or equity offerings, including the Distribution; (v) spin-off related transition costs; (vi) member management fees paid to FNF and THL Managers, LLC; (vii) acquisition-related costs, including ongoing costs pursuant to a purchase agreement; (xiii) costs associated with executive transition; (ix) significant legal and regulatory matters; and (x) adjustment for income tax expense primarily related to assuming the conversion of all the shares of Class B common stock into shares of Class A common stock prior to the Distribution, the tax effect of the non-GAAP adjustments, the revaluation of our net deferred tax liability related to purchase accounting, equity-based compensation and debt modifications and assuming that we were a taxable entity as of the beginning of the earliest period presented. For periods that include the results of operations prior to the third quarter of 2015, Pro Forma Adjusted Net Earnings would further include pro forma adjustments to present interest expense as if the amount of debt outstanding and applicable interest rates as a result of the debt refinancing in May 2015 were consistent for all periods prior to the debt refinancing. Adjusted Net Earnings Per Share and Pro Forma Adjusted Net Earnings Per Share – For the periods prior to the Distribution, we calculate per share amounts assuming the exchange of all shares of Class B common stock into shares of Class A common stock at the beginning of the respective period. We also include the dilutive effect of any unvested restricted shares of common stock. For periods prior to the May 2015 initial public offering (“IPO”), Pro Forma Adjusted Net Earnings Per Share further assumes that the shares outstanding for the period after the IPO were outstanding for the respective period. 70

Non-GAAP Reconciliations ADJUSTED REVENUES PRO FORMA ADJUSTED NET EARNINGS Years Ended Year ended ($ in millions) 2013 2014 2015 2016 2017 ($ in millions, except per share data) 2015 Revenues $744.8 $852.1 $930.7 $1,026.0 $1,051.6 Net earnings $82.4 Deferred revenue purchase accounting adjustment - 12.8 9.6 7.3 4.5 Depreciation and amortization purchase accounting adjustment 90.3 Adjusted Revenues $744.8 $864.9 $940.3 $1,033.3 $1,056.1 Deferred revenue purchase accounting adjustment 9.6 Equity-based compensation 11.4 ADJUSTED EBITDA Debt and/or equity offering expenses 9.2 Years Ended Management fees 3.6 ($ in millions) 2013 2014 2015 2016 2017 Interest expense adjustment 23.3 Net earnings (loss) $84.2 $ (107.1) $82.4 $133.0 $254.2 Income tax expense adjustment (78.4) Depreciation and amortization 83.6 188.8 194.3 208.3 206.5 Pro Forma Adjusted Net Earnings $151.4 Interest expense 53.6 128.7 89.8 67.6 57.5 Pro Forma Adjusted Net Earnings Per Share $0.99 Income tax expense (benefit) 45.7 (5.3) 13.4 25.8 (61.8) Pro Forma Weighted Average Adjusted Shares Outstanding 153.0 Other (income) expense, net (0.2) 12.0 4.6 6.4 12.6 Discontinued operations, net of tax 0.9 0.8 - - - EBITDA 267.8 217.9 384.5 441.1 469.0 Deferred revenue purchase accounting adjustment - 12.8 9.6 7.3 4.5 Equity-based compensation 15.6 6.4 11.4 12.4 19.2 Transition and integration costs - 110.3 - - - Debt and/or equity offering expenses - - 4.4 0.6 7.5 Spin-off related transition costs - - - - 5.6 Management fees - 9.0 3.6 - - Acquisition-related costs - - - 1.7 - Legal and regulatory matters 2.5 (1.5) - - - Exit costs, impairment and other charges 8.1 - - - - Adjusted EBITDA $294.0 $354.9 $413.5 $463.1 $505.8 Adjusted EBITDA Margin (%) 39.5% 41.0% 44.0% 44.8% 47.9% 71

Full Year 2018 Financial Guidance (As of October 30, 2018) 2018 MIDPOINT FINANCIAL METRIC 2018 GUIDANCE GUIDANCE Adjusted Revenues $1,113 million to $1,118 million $1,115.5 million Adjusted EBITDA $538 million to $543 million $540.5 million Adjusted Net Earnings Per Share $1.82 to $1.85 $1.84 72