|
Exhibit 99.1 
|
Piper Jaffray Consumer Conference 2016
June 14-15, 2016
Forward Looking Statements
Forward Looking Statements
Some of the statements contained in this presentation constitute forward looking statements. Forward looking statements relate to expectations, beliefs, projections, future plans and strategies, anticipated events or
trends and similar expressions concerning matters that are not historical facts, such as statements regarding the
Company’s future financial condition or results of operations, its prospects and strategies for future growth, the
development and introduction of new products, and the implementation of its marketing and branding strategies.
In many cases, you can identify forward looking statements by terms such as “may,” “will,” “should,” “expects,” “plans,” “anticipates,” “believes,” “estimates,”
“predicts,” “potential,” “seeks,” “intends,” “targets” or the negative of these terms or other comparable terminology.
The forward looking statements contained in this presentation reflect the Company’s current views about future events and are
subject to risks, uncertainties, assumptions and changes in circumstances that may cause events or its actual activities
or results to differ significantly from those expressed in any forward looking statement. Although the Company believes that its assumptions are reasonable, it cannot guarantee future events,
results, actions, levels of activity, performance or achievements. You are accordingly cautioned not to place undue
reliance on these forward looking statements. A number of important factors could cause actual results to differ materially from those indicated
by the forward looking statements, including, but not limited to, those factors described in “Risk Factors” and “Management’s Discussion and Analysis of Financial Condition and
Results of Operations” in its Annual Report on form 10 K for its year ended January 3,2016. These factors include without limitation: changes in general economic or market
conditions, both in the United States and Brazil; increased competition in the Company’s industry; risk associated with
its Brazilian operations and any other future international operations; its ability to manage operations at its current size
or manage growth effectively; its ability to successfully expand in the United States and other new markets; its ability to locate suitable locations to open new restaurants and to attract guests to its restaurants; its ability to open
new restaurants is subject to factors outside the Company’s control including weather conditions and factors under the
control of the landlords, contractors, and regulatory authorities; the fact that it will rely on its operating subsidiaries to
provide it with distributions to fund its operating activities, which could be limited by law, regulation or otherwise; its
ability to continually innovate and provide its consumers with innovative dining experiences; its ability to maintain
recent levels of comparable revenue or average revenue per square foot; the ability of its suppliers to deliver beef in
a timely or cost effective manner; its lack of long term supplier contracts, its concentration of suppliers and distributors and potential increases in the price of beef; its
ability to raise money and maintain sufficient levels of cash flow; conflicts of interest with the THL Funds; the
Company is considered a “controlled company” and exempt from certain corporate governance rules primarily
relating to board independence, and its use of some or all of these exemptions; its ability to effectively market
and maintain a positive brand image; changes in government regulation; the Company’s ability to attract and maintain the services of its senior management and
key employees; the availability and effective operation of management information systems and other technology;
changes in consumer preferences or changes in demand for upscale dining experiences; the Company’s ability to
accurately anticipate and respond to seasonal or quarterly fluctuations in its operating results; its ability to maintain
effective internal controls or the identification of additional material weaknesses; the Company’s expectations
regarding the time during which it will be an emerging growth company under the JOBS Act; changes in accounting standards; and other risks described in the “Risk Factors” section of its
Annual Report.
Although the Company believes that the assumptions inherent in the forward looking statements contained in this presentation are reasonable, undue reliance should not be placed on these statements, which only apply as of the date hereof. Except as
required by applicable securities law, the Company undertakes no obligation to update any forward looking statement to reflect events or circumstances after the date on which the statement is made or to reflect the
occurrence of unanticipated events.
Non GAAP Financial Measures
This presentation contains certain non GAAP financial measures. A “non GAAP financial measure” is defined as a numerical measure of a company’s financial performance that excludes or includes amounts so as to be different than the most directly
comparable measure calculated and presented in accordance with GAAP in the statements of income, balance sheets
or statements of cash flow of the company. The Company has provided a reconciliation of Restaurant Contribution and
Adjusted EBITDA, non GAAP financial measures, in the Appendix to this presentation. Adjusted EBITDA is presented because management
believes that such financial measure, when viewed with the Company’s results of operations in accordance with GAAP
and the reconciliation of Adjusted EBITDA to net income (loss), provides additional information to investors about
certain material non cash items and about unusual items that the Company does not expect to continue at the same level in the future.
Adjusted EBITDA is used by investors as a supplemental measure to evaluate the overall operating performance of
companies in the Company’s industry, you should not consider it in isolation, or as a substitute for analysis of results
as reported under GAAP. Our calculation of Adjusted EBITDA may not be comparable to that reported by other
companies. For additional information about our non GAAP financial measures, see our filings with the Securities and Exchange Commission.
JOBS Act
The Company is an “emerging growth company” within the meaning of the Jumpstart Our Business Startups Act.
As a result, the Company complies with reduced public company reporting requirements.
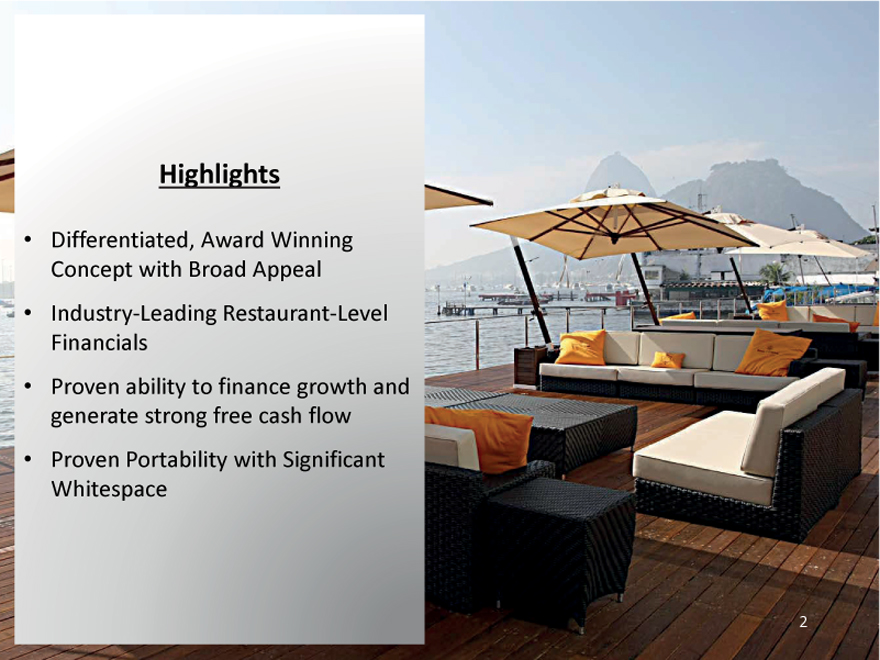
Highlights
Differentiated, Award Winning Concept with Broad Appeal
Industry Leading Restaurant Level Financials
Proven ability to finance growth and generate strong free cash flow
Proven Portability with Significant Whitespace
2
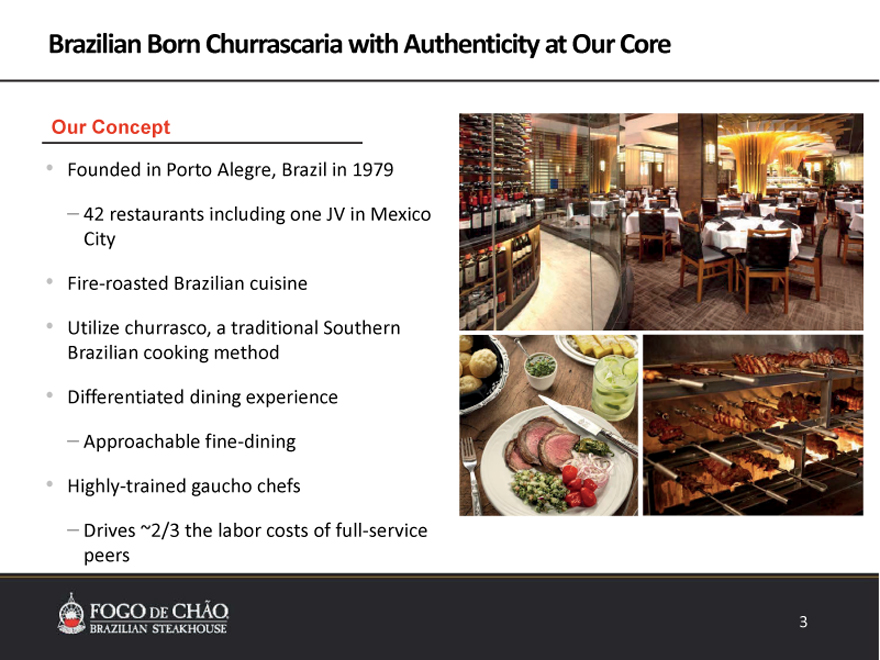
Brazilian Born Churrascaria with Authenticity at Our Core
Our Concept
Founded in Porto Alegre, Brazil in 1979
– 42 restaurants including one JV in Mexico City
Fire roasted Brazilian cuisine
Utilize churrasco, a traditional Southern Brazilian cooking method
Differentiated dining experience
– Approachable fine dining
Highly trained gaucho chefs
– Drives ~2/3 the labor costs of full service peers
3
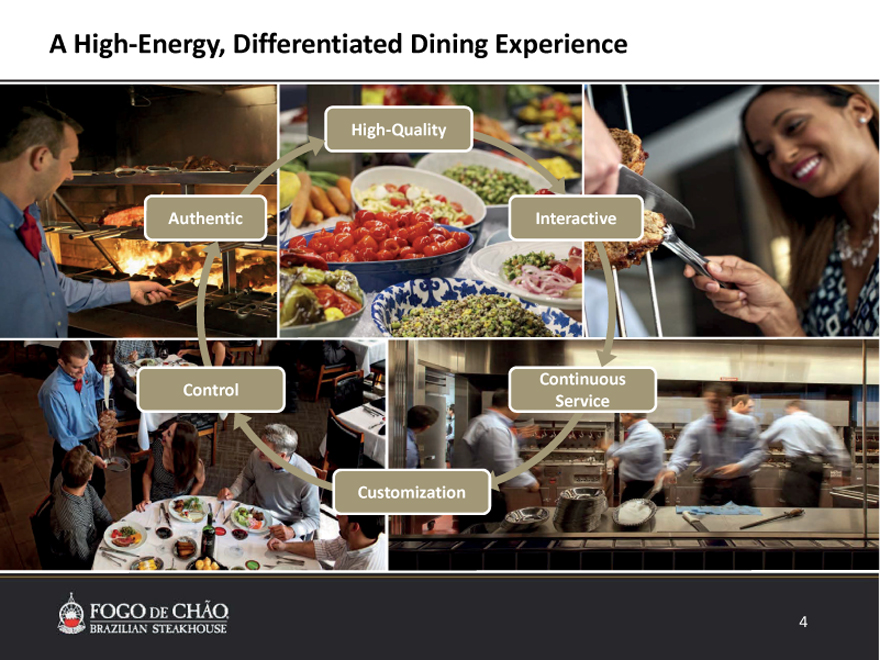
A High Energy, Differentiated Dining Experience
High Quality
Authentic Interactive
Continuous
Control
Service
Customization
4
Industry Leading Financials
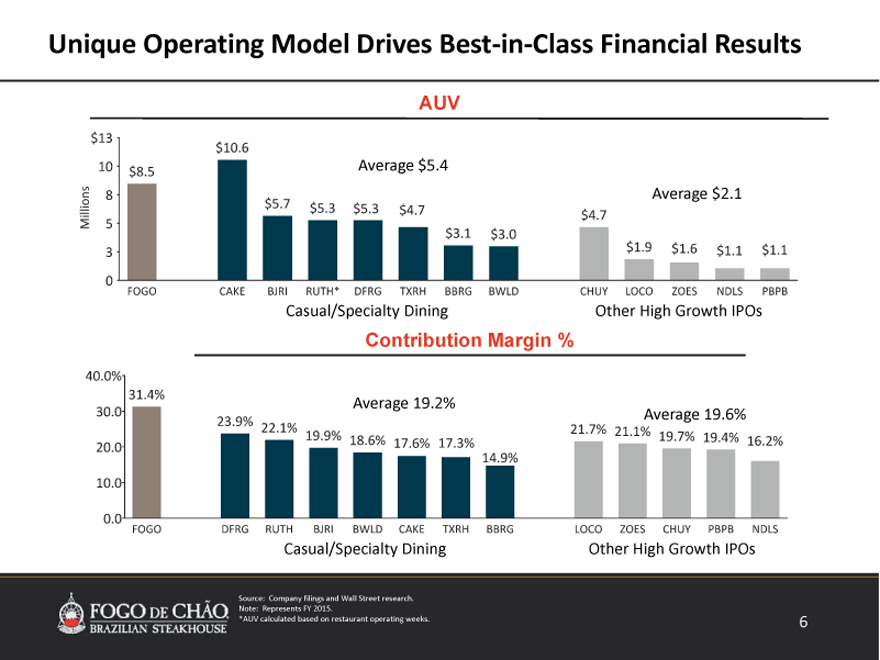
Unique Operating Model Drives Best?in?Class Financial Results
AUV
Average $5.4
Average $2.1
Casual/Specialty Dining Other High Growth IPOs
Contribution Margin %
Average 19.2%
Average 19.6%
Casual/Specialty Dining Other High Growth IPOs
Source: Company filings and Wall Street research. Note: Represents FY 2015.
*AUV calculated based on restaurant operating weeks.
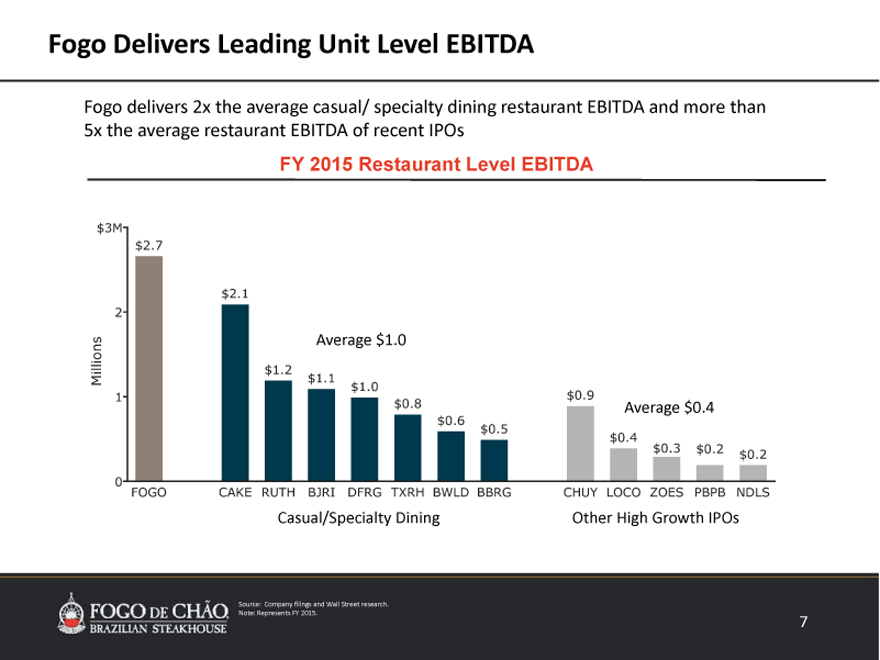
Fogo Delivers Leading Unit Level EBITDA
Fogo delivers 2x the average casual/specialty dining restaurant EBITDA and more than 5x the average restaurant EBITDA of recent IPOs
FY 2015 Restaurant Level EBITDA
Average $1.0
Average $0.4
Casual/Specialty Dining
Other High Growth IPOs
Source: Company filings and Wall Street research. Note: Represents FY 2015.
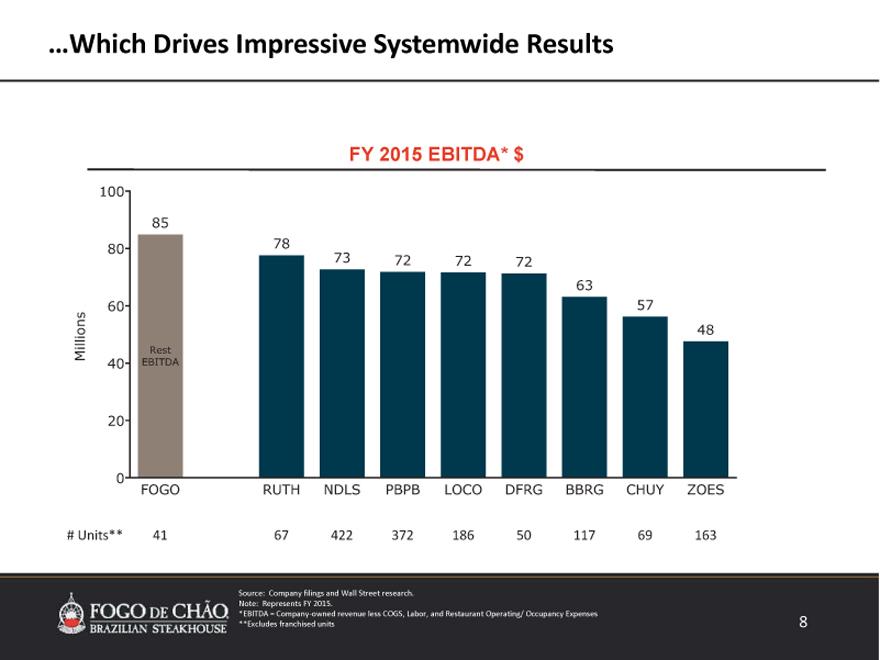
…Which Drives Impressive Systemwide Results
FY 2015 EBITDA* $
Source: Company filings and Wall Street research. Note: Represents FY 2015.
*EBITDA = Company?owned revenue less COGS, Labor, and Restaurant Operating/ Occupancy Expenses **Excludes franchised units
8
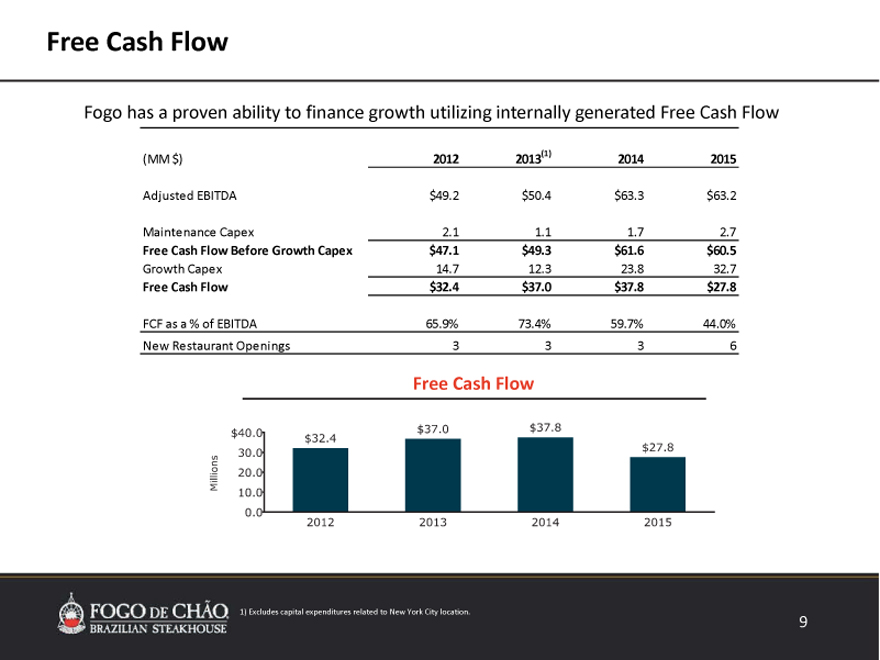
Free Cash Flow
Fogo has a proven ability to finance growth utilizing internally generated Free Cash Flow
(MM $)
2012
2013(1)
2014
2015
Adjusted EBITDA
$49.2
$50.4
$
63.3
$63.2
Maintenance Capex
2.1
1.1
1.7
2.7
Free Cash Flow Before Growth Capex
$47.1
$
49.3
$61.6
$
60.5
Growth Capex
14.7
12.3
23.8
32.7
Free Cash Flow
$32.4
$37.0
$
37.8
$27.8
FCF as a % of EBITDA
65.9%
73.4%
59.7%
44.0%
New Restaurant Openings
Free Cash Flow
1) Excludes capital expenditures related to New York City location.
9
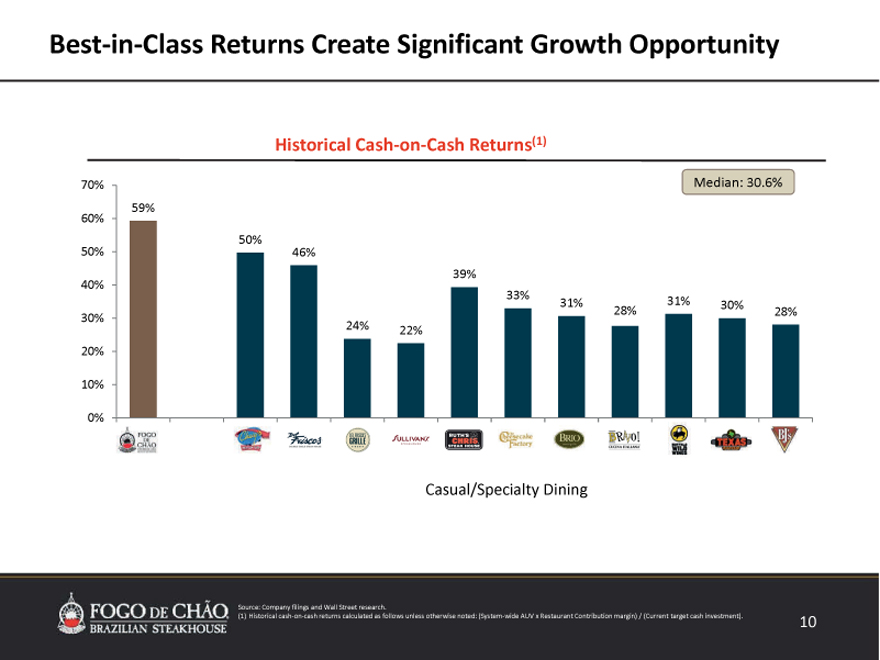
Best in Class Returns Create Significant Growth Opportunity
Historical Cash on Cash Returns(1)
70% Median: 30.6%
59%
60%
50%
50% 46%
39%
40%
33% 31% 31% 30%
30% 28% 28%
24% 22%
20%
10%
0%
Casual/Specialty Dining
Source: Company filings and Wall Street research.
(1) Historical cash on cash returns calculated as follows unless otherwise noted: (System wide AUV x Restaurant Contribution margin) /(Current target cash investment).
10
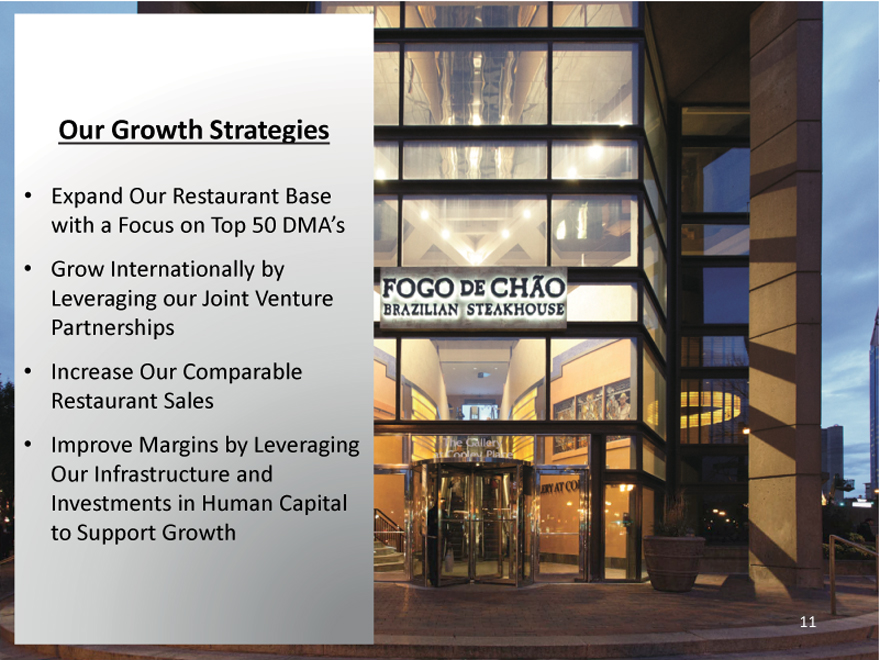
Our Growth Strategies
Expand Our Restaurant Base with a Focus on Top 50 DMA’s
Grow Internationally by Leveraging our Joint Venture Partnerships
Increase Our Comparable Restaurant Sales
Improve Margins by Leveraging Our Infrastructure and Investments in Human Capital to Support Growth
11
Development
12
Our Global Growth Plan
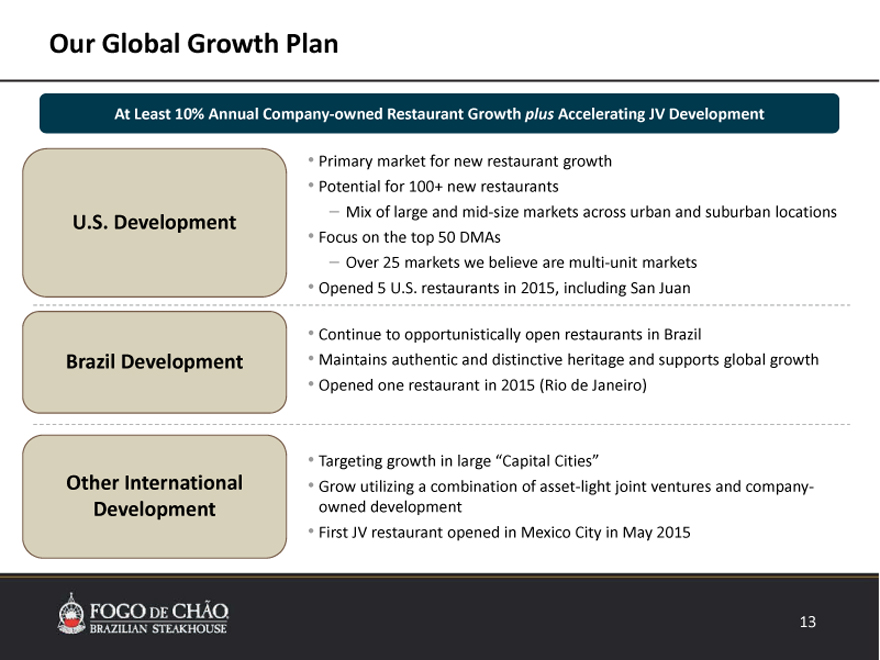
At Least 10% Annual Company owned Restaurant Growth plus Accelerating JV Development
U.S. Development
Brazil Development
Other International Development
Primary market for new restaurant growth
Potential for 100+ new restaurants
– Mix of large and mid size markets across urban and suburban locations
Focus on the top 50 DMAs
– Over 25 markets we believe are multi unit markets
Opened 5 U.S. restaurants in 2015, including San Juan
Continue to opportunistically open restaurants in Brazil
Maintains authentic and distinctive heritage and supports global growth
Opened one restaurant in 2015 (Rio de Janeiro)
Targeting growth in large “Capital Cities”
Grow utilizing a combination of asset light joint ventures and company owned development
First JV restaurant opened in Mexico City in May 2015
13
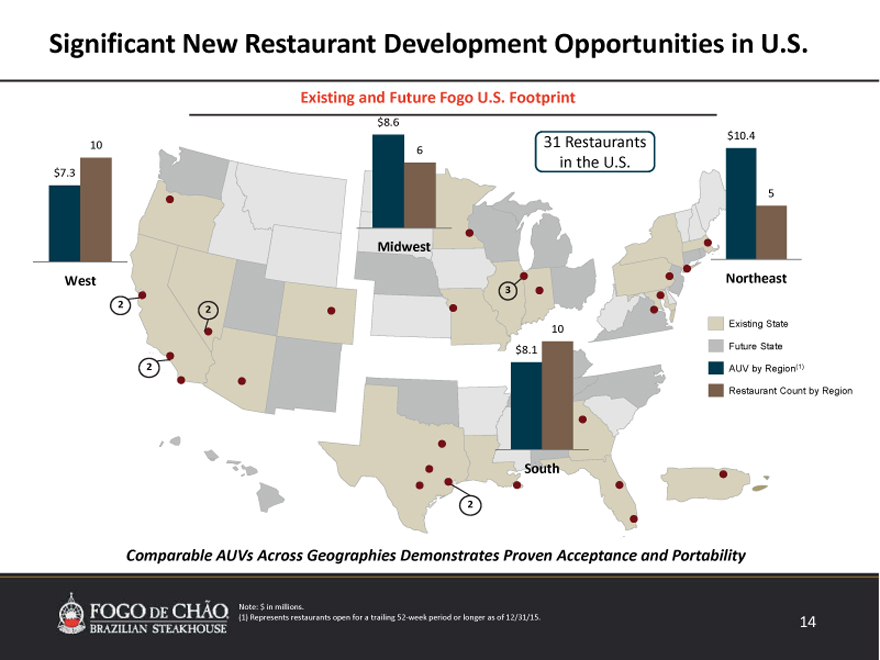
Existing and Future Fogo U.S. Footprint
$8.6
$10.4
10 31 Restaurants
6
in the U.S.
$7.3
5
Midwest
West Northeast
3
2 2
10 Existing State
$8.1 Future State
2 AUV by Region(1)
Restaurant Count by Region
South
2
Comparable AUVs Across Geographies Demonstrates Proven Acceptance and Portability
Note: $ in millions.
(1) Represents restaurants open for a trailing 52?week period or longer as of 12/31/15.
14
Significant International Growth Opportunities in Capital Cities
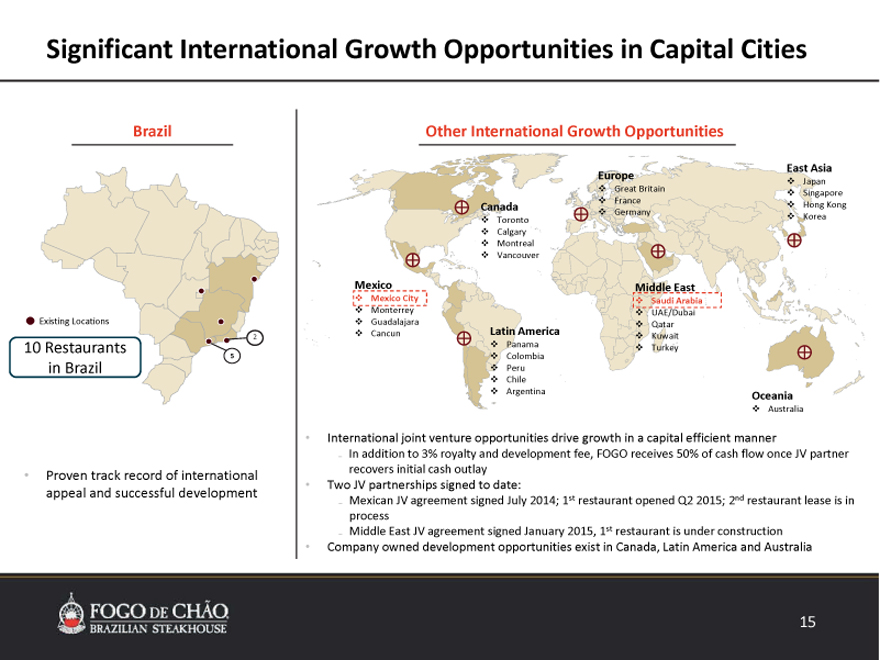
Brazil
Existing Locations
2
10 Restaurants
5
in Brazil
Proven track record of international
appeal and successful development
Other International Growth Opportunities
East Asia
Europe Japan
Great Britain Singapore
Canada France Hong Kong
Germany
Toronto Korea
Calgary
Montreal
Vancouver
Mexico Middle East
Mexico City Saudi Arabia
Monterrey UAE/Dubai
Guadalajara Qatar
Cancun Latin America Kuwait
Panama Turkey
Colombia
Peru
Chile
Argentina Oceania
Australia
International joint venture opportunities drive growth in a capital efficient manner
In addition to 3% royalty and development fee, FOGO receives 50% of cash flow once JV partner recovers initial cash outlay
Two JV partnerships signed to date:
Mexican JV agreement signed July 2014; 1st restaurant opened Q2 2015; 2nd restaurant lease is in process
Middle East JV agreement signed January 2015, 1st restaurant is under construction
Company owned development opportunities exist in Canada, Latin America and Australia
15
Demonstrated Track Record of Successful New Restaurant Growth
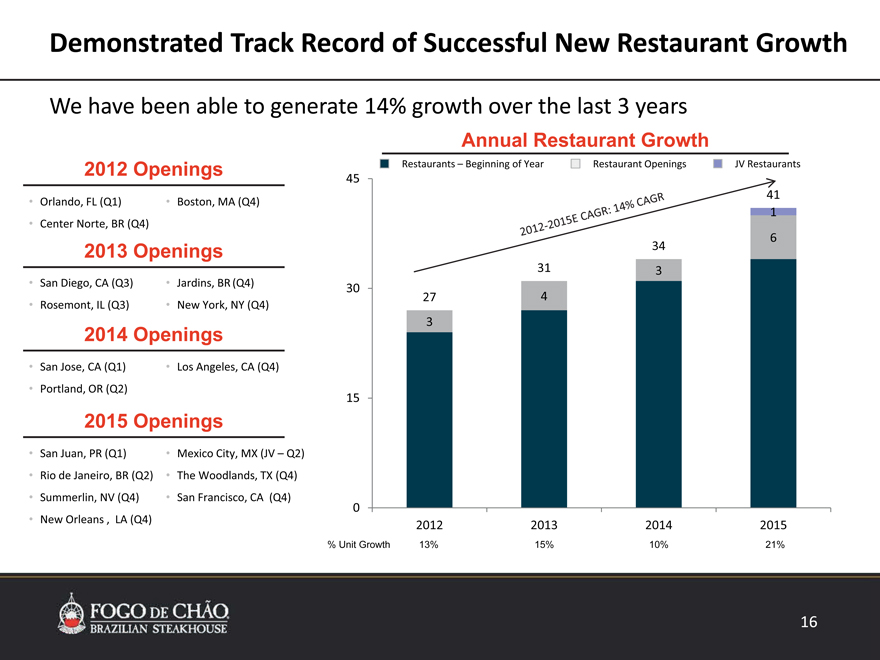
We have been able to generate 14% growth over the last 3 years
2012 Openings
Orlando, FL (Q1) Boston, MA (Q4)
Center Norte, BR (Q4)
2013 Openings
San Diego, CA (Q3) Jardins, BR (Q4)
Rosemont, IL (Q3) New York, NY (Q4)
2014 Openings
San Jose, CA (Q1) Los Angeles, CA (Q4)
Portland, OR (Q2)
2015 Openings
San Juan, PR (Q1) Mexico City, MX (JV – Q2)
Rio de Janeiro, BR (Q2) The Woodlands, TX (Q4)
Summerlin, NV (Q4) San Francisco, CA (Q4)
New Orleans , LA (Q4)
Annual Restaurant Growth
Restaurants – Beginning of Year Restaurant Openings JV Restaurants
45
41
1
6
34
31 3
30
27 4
3
15
0
2012 2013 2014 2015
% Unit Growth 13% 15% 10% 21%
Well Established Pipeline Provides Long?term Visibility
We plan to open 5 to 6 restaurants in FY’16, including at least one additional JV restaurant in the Middle East or Mexico
Near?term Development Pipeline
New vs Existing
Location Site Name Country Ownership Status
Market
Naperville, IL Naperville USA Existing Company Open
Philadelphia, PA King of Prussia USA Existing Company Under construction
Atlanta, GA Dunwoody USA Existing Company Under construction
Dallas, TX Uptown Dallas USA Existing Company Signed lease
Washington, DC Tysons Corner USA Existing Company Signed lease
Rio de Janeiro, BR Rio Leblon Brazil Existing Company Lease in process
Jeddah, SA Jeddah Saudi Arabia New Joint venture Under construction
Mexico City, MX Santa Fe Mexico Existing Joint venture Signed JV agreement
Bellevue, WA Lincoln Square USA New Company Signed lease
Pittsburgh, PA 350 Oliver USA New Company Signed lease
Plano, TX Legacy West USA Existing Company Signed lease
Fort Worth, TX Fort Worth USA New Company LOI in process
Framingham, MA Framingham USA Existing Company LOI in process
17
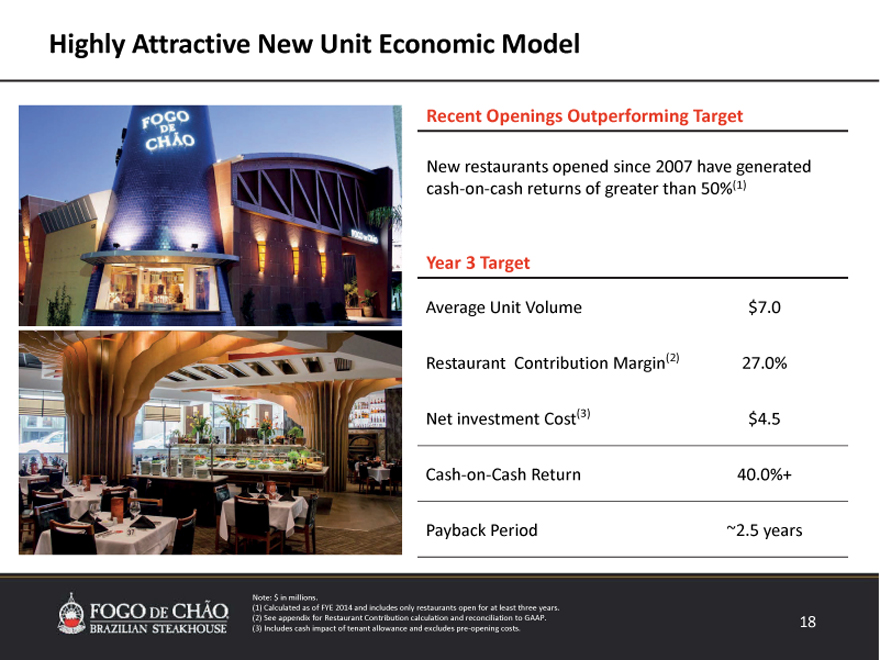
Highly Attractive New Unit Economic Model
Recent Openings Outperforming Target
New restaurants opened since 2007 have generated
cash on cash returns of greater than 50%(1)
Year 3 Target
Average Unit Volume
$7.0
Restaurant Contribution Margin(2)
27.0%
Net investment Cost(3)
$4.5
Cash on Cash Return
40.0%+
Payback Period
~2.5 years
Note: $ in millions.
(1) Calculated as of FYE 2014 and includes only restaurants open for at least three years. (2) See appendix for Restaurant Contribution calculation and reconciliation to GAAP. (3) Includes cash impact of tenant allowance and excludes pre opening costs.
18
Top Line Growth
19
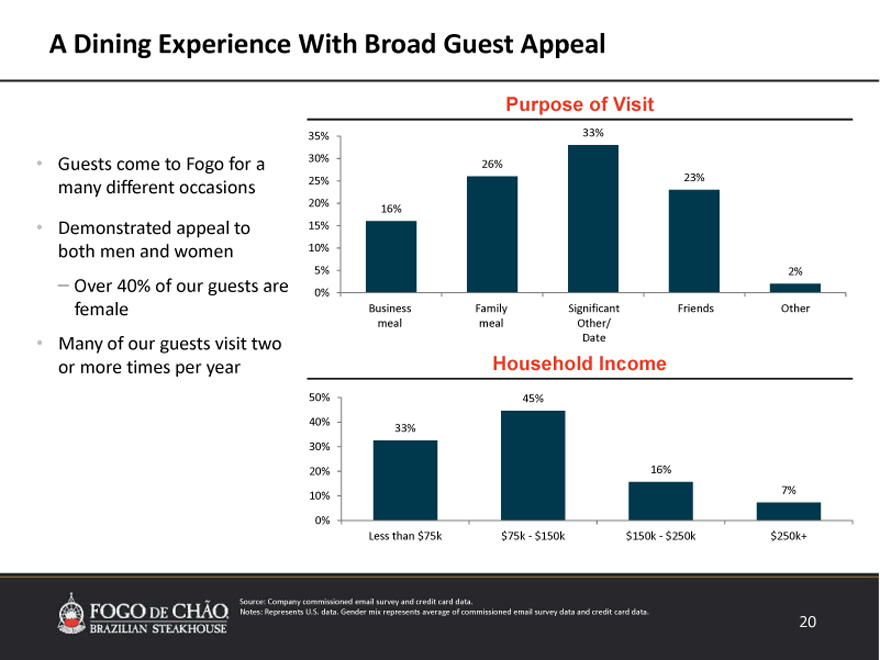
A Dining Experience With Broad Guest Appeal
Guests come to Fogo for a many different occasions
Demonstrated appeal to both men and women
– Over 40% of our guests are female
Many of our guests visit two or more times per year
Purpose of Visit
35% 33%
30% 26%
25% 23%
20% 16%
15%
10%
5% 2%
0%
Business Family Significant Friends Other
meal meal Other/
Date
Household Income
50% 45%
40% 33%
30%
20% 16%
10% 7%
0%
Less than $75k $75k ? $150k $150k ? $250k $250k+
Source: Company commissioned email survey and credit card data.
Notes: Represents U.S. data. Gender mix represents average of commissioned email survey data and credit card data.
20
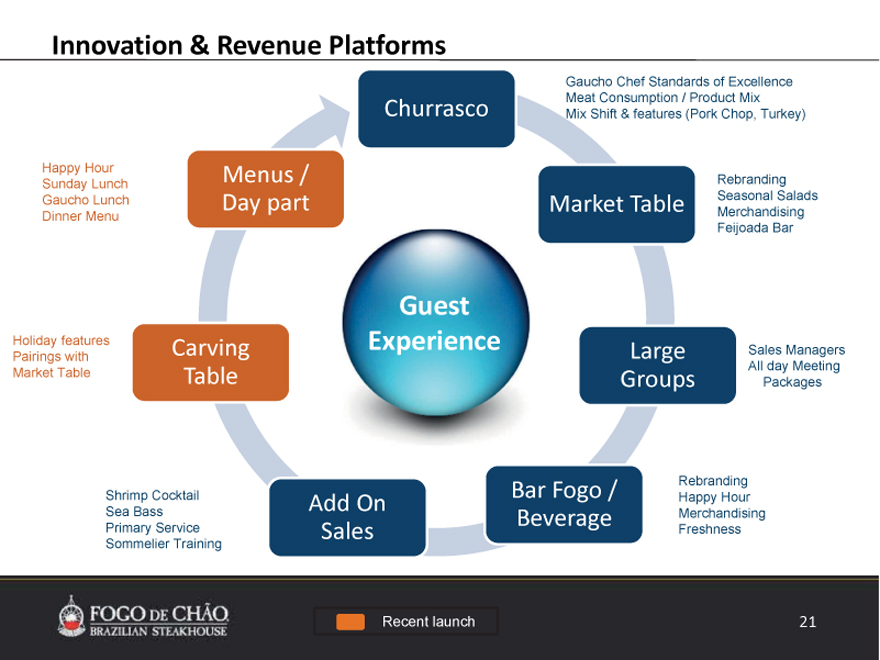
Innovation & Revenue Platforms
Gaucho Chef Standards of Excellence
Meat Consumption / Product Mix
Churrasco Mix Shift & features (Pork Chop, Turkey)
Sunday Happy Hour Lunch Menus / Rebranding
Gaucho Lunch Day part Market Table Merchandising Seasonal Salads
Dinner Menu
Feijoada Bar
Guest
Holiday features Carving Experience Large Sales Managers
Pairings with
All day Meeting
Market Table Table Groups Packages
Shrimp Cocktail Bar Fogo / Happy Rebranding Hour
Add On
Sea Bass Beverage Merchandising
Primary Service Sales Freshness
Sommelier Training
Recent launch
21
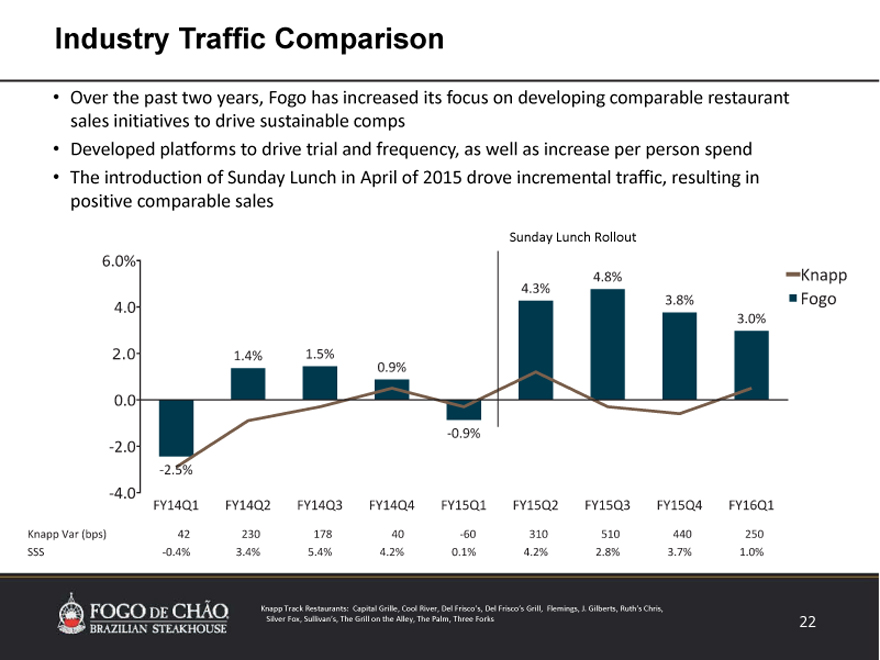
Industry Traffic Comparison
Over the past two years, Fogo has increased its focus on developing comparable restaurant sales initiatives to
drive sustainable comps
Developed platforms to drive trial and frequency, as well as increase per person spend
The introduction of Sunday Lunch in April of 2015 drove incremental traffic, resulting in positive comparable sales
Sunday Lunch Rollout
Knapp Track Restaurants: Capital Grille, Cool River, Del Frisco’s, Del Frisco’s Grill, Flemings, J. Gilberts, Ruth’s Chris, Silver Fox, Sullivan’s, The Grill on the Alley, The Palm, Three Forks
22
Financials
23
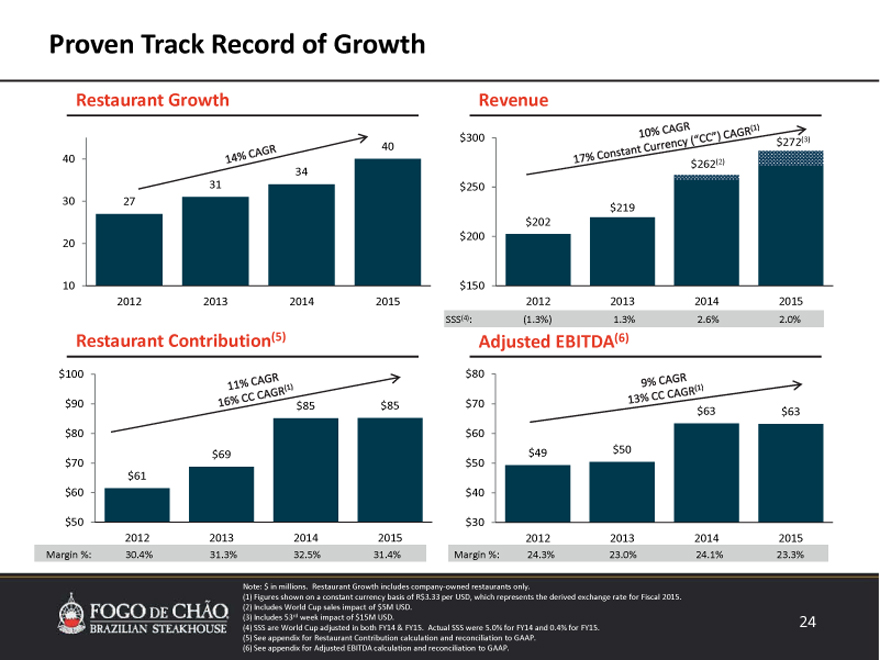
Proven Track Record of Growth
Restaurant Growth Revenue
$ 300 $272(3)
40
40 $262(2)
34
31 $ 250
30 27 $219
$ 202
$ 200
20
10 $ 150
2012 2013 2014 2015 2012 2013 2014 2015
SSS(4):(1.3%) 1.3% 2.6% 2.0%
Restaurant Contribution(5) Adjusted EBITDA(6)
$100 $ 80
$90 $ 85 $ 85 $ 70 $ 63 $ 63
$80 $ 60
$69 $ 49 $ 50
$70 $ 50
$61
$60 $ 40
$50 $ 30
2012 2013 2014 2015 2012 2013 2014 2015
Margin %: 30.4% 31.3% 32.5% 31.4% Margin %: 24.3% 23.0% 24.1% 23.3%
Note: $ in millions. Restaurant Growth includes company?owned restaurants only.
(1) Figures shown on a constant currency basis of R$3.33 per USD, which represents the derived exchange rate for Fiscal 2015. (2) Includes World Cup sales impact of $5M USD.
(3) Includes 53rd week impact of $15M USD.
(4) SSS are World Cup adjusted in both FY14 & FY15. Actual SSS were 5.0% for FY14 and 0.4% for FY15. (5) See appendix for Restaurant Contribution calculation and reconciliation to GAAP.
(6) See appendix for Adjusted EBITDA calculation and reconciliation to GAAP.
24
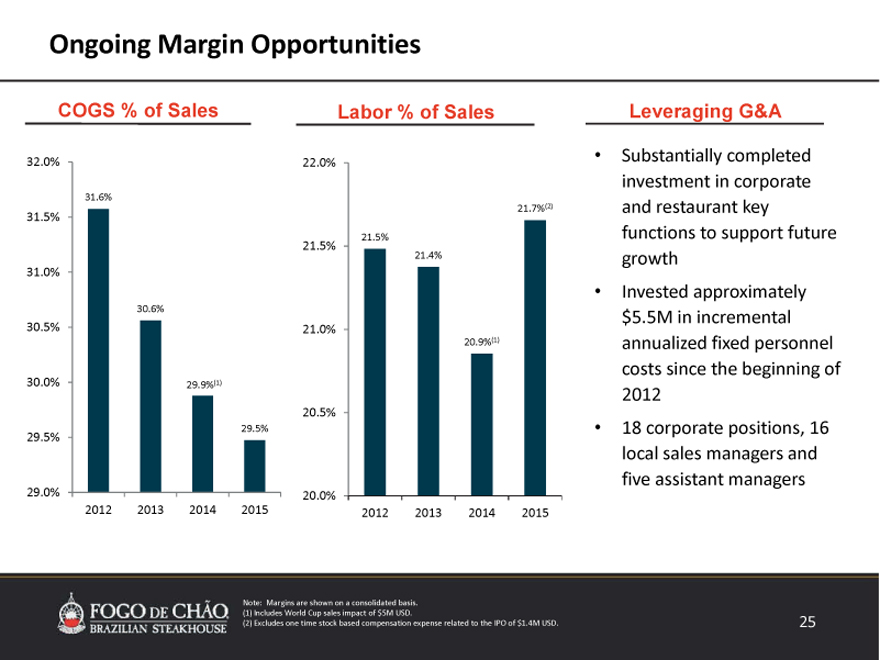
Ongoing Margin Opportunities
COGS % of Sales Labor % of Sales
32.0% 22.0%
31.6%
21.7%(2)
31.5%
21.5%
21.5%
21.4%
31.0%
30.6%
30.5% 21.0%
20.9%(1)
30.0% 29.9%(1)
20.5%
29.5%
29.5%
29.0% 20.0%
2012 2013 2014 2015 2012 2013 2014 2015
Leveraging G&A
Substantially completed investment in corporate and restaurant key functions to support future growth
Invested approximately $5.5M in incremental annualized fixed personnel costs since the beginning of 2012
18 corporate positions, 16 local sales managers and five assistant managers
Note: Margins are shown on a consolidated basis. (1) Includes World Cup sales impact of $5M USD.
(2) Excludes one time stock based compensation expense related to the IPO of $1.4M USD.
25
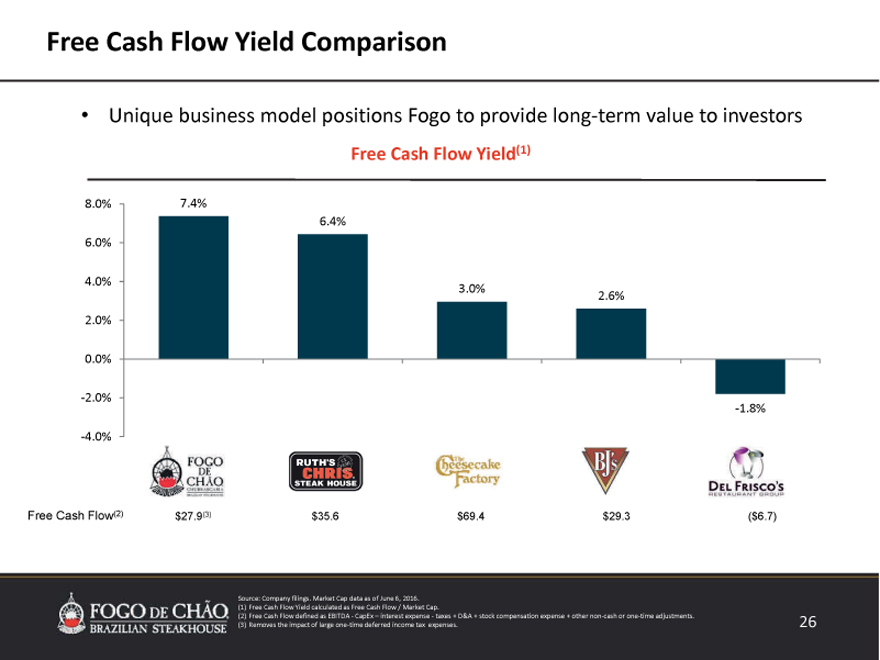
Free Cash Flow Yield Comparison
Unique business model positions Fogo to provide long?term value to investors
Free Cash Flow Yield(1)
8.0% 7.4%
6.4%
6.0%
4.0%
3.0% 2.6%
2.0%
0.0%
?2.0%
?1.8%
?4.0%
Free Cash Flow(2) $27.9(3) $35.6 $69.4 $29.3($6.7)
Source: Company filings. Market Cap data as of June 6, 2016. (1) Free Cash Flow Yield calculated as Free Cash Flow /Market Cap.
(2) Free Cash Flow defined as EBITDA ?CapEx – interest expense ?taxes + D&A + stock compensation expense + other non?cash or one?time adjustments. (3) Removes the impact of large one?time deferred income tax expenses.
26
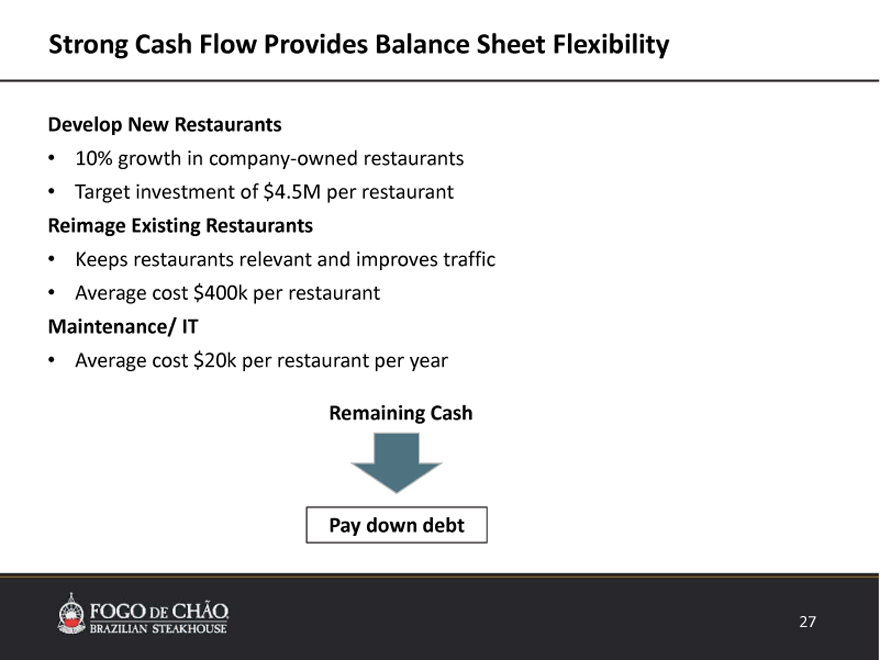
Strong Cash Flow Provides Balance Sheet Flexibility
Develop New Restaurants
10% growth in company owned restaurants
Target investment of $4.5M per restaurant
Reimage Existing Restaurants
Keeps restaurants relevant and improves traffic
Average cost $400k per restaurant
Maintenance/ IT
Average cost $20k per restaurant per year
Remaining Cash
Pay down debt
27
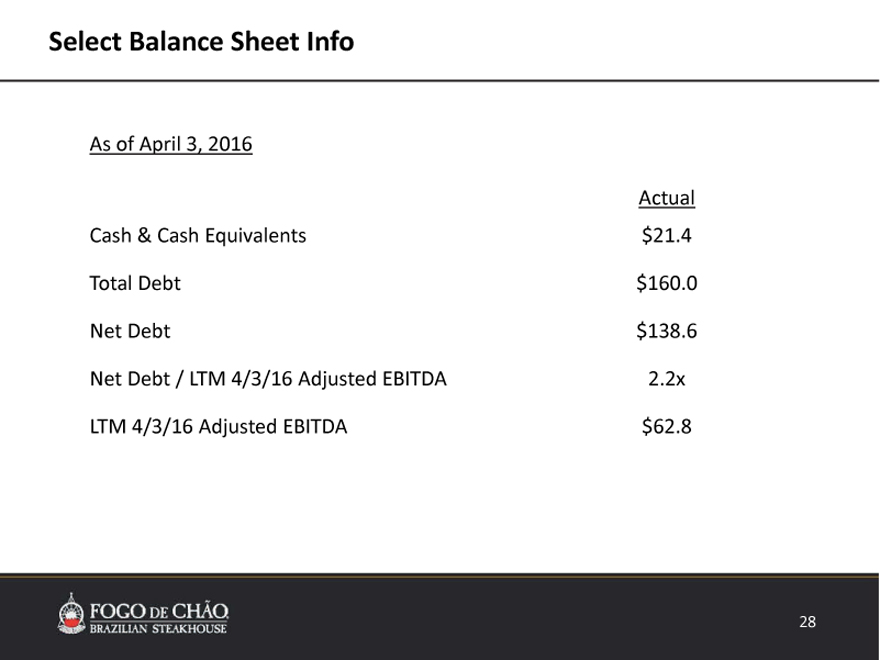
Select Balance Sheet Info
As of April 3, 2016
Actual
Cash & Cash Equivalents $21.4
Total Debt $160.0
Net Debt $138.6
Net Debt / LTM 4/3/16 Adjusted EBITDA 2.2x
LTM 4/3/16 Adjusted EBITDA $62.8
28
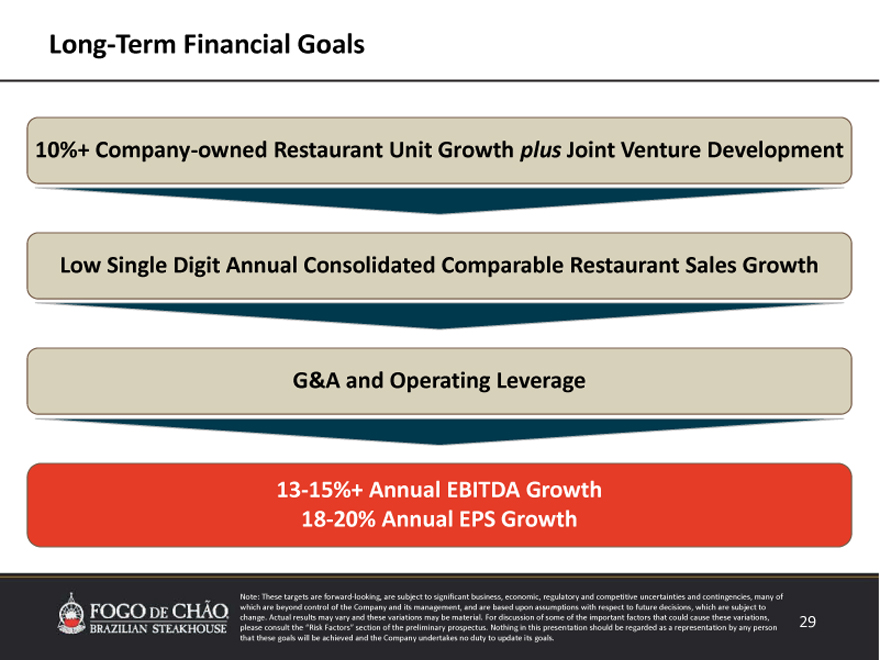
Long Term Financial Goals
10%+ Company owned Restaurant Unit Growth plus Joint Venture Development Low Single Digit Annual Consolidated Comparable Restaurant Sales Growth G&A and Operating Leverage
13 15%+ Annual EBITDA Growth
18 20% Annual EPS Growth
Note: These targets are forward looking, are subject to significant business, economic, regulatory and competitive uncertainties and contingencies, many of which are beyond control of the Company and its management, and are based upon assumptions
with respect to future decisions, which are subject to change. Actual results may vary and these variations may be material.
For discussion of some of the important factors that could cause these variations, please consult the “Risk Factors” section of the preliminary prospectus. Nothing in this presentation
should be regarded as a representation by any person that these goals will be achieved and the Company undertakes no duty to update its goals.
29
Appendix
30
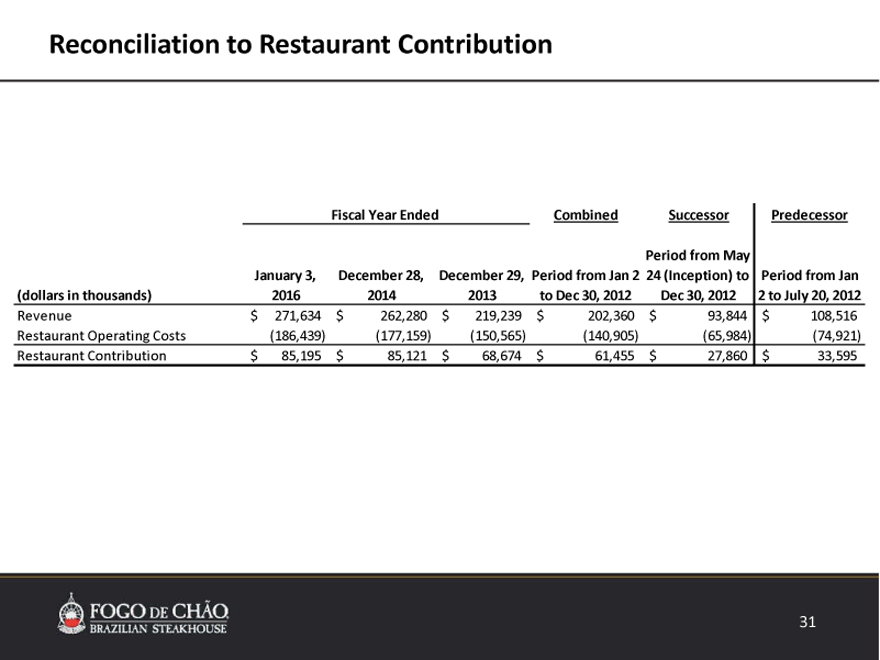
Reconciliation to Restaurant Contribution
Fiscal Year Ended Combined Successor Predecessor
Period from May
January 3, December 28, December 29, Period from Jan 2 24 (Inception) to Period from Jan
(dollars in thousands) 2016 2014 2013 to Dec 30, 2012 Dec 30, 2012 2 to July 20, 2012
Revenue $ 271,634 $ 262,280 $ 219,239 $ 202,360 $ 93,844 $ 108,516
Restaurant Operating Costs (186,439) (177,159) (150,565) (140,905) (65,984) (74,921)
Restaurant Contribution $ 85,195 $ 85,121 $ 68,674 $ 61,455 $ 27,860 $ 33,595
31
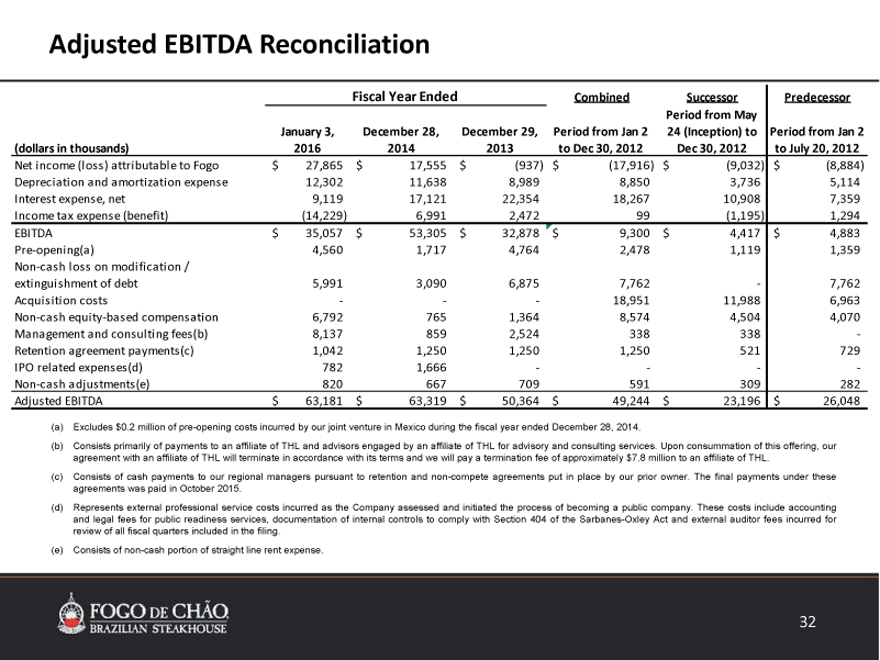
Adjusted EBITDA Reconciliation
Fiscal Year Ended Combined Successor Predecessor
Period from May
January 3, December 28, December 29, Period from Jan 2 24 (Inception) to Period from Jan 2
(dollars in thousands) 2016 2014 2013 to Dec 30, 2012 Dec 30, 2012 to July 20, 2012
Net income (loss) attributable to Fogo $ 27,865 $ 17,555 $ (937) $ (17,916) $ (9,032) $ (8,884)
Depreciation and amortization expense 12,302 11,638 8,989 8,850 3,736 5,114
Interest expense, net 9,119 17,121 22,354 18,267 10,908 7,359
Income tax expense (benefit) (14,229) 6,991 2,472 99 (1,195) 1,294
EBITDA $ 35,057 $ 53,305 $ 32,878 $ 9,300 $ 4,417 $ 4,883
Pre opening(a) 4,560 1,717 4,764 2,478 1,119 1,359
Non cash loss on modification /
extinguishment of debt 5,991 3,090 6,875 7,762 7,762
Acquisition costs 18,951 11,988 6,963
Non cash equity based compensation 6,792 765 1,364 8,574 4,504 4,070
Management and consulting fees(b) 8,137 859 2,524 338 338
Retention agreement payments(c) 1,042 1,250 1,250 1,250 521 729
IPO related expenses(d) 782 1,666
Non cash adjustments(e) 820 667 709 591 309 282
Adjusted EBITDA $ 63,181 $ 63,319 $ 50,364 $ 49,244 $ 23,196 $ 26,048
(a) Excludes $0.2 million of pre-opening costs incurred by our joint venture in Mexico during the fiscal year ended December 28, 2014.
(b) Consists primarily of payments to an affiliate of THL and advisors engaged by an affiliate of THL for advisory and consulting services. Upon consummation of this offering, our agreement with an affiliate of THL will terminate in accordance with its terms and we will pay a termination fee of approximately $7.8 million to an affiliate of THL.
(c) Consists of cash payments to our regional managers pursuant to retention and non-compete agreements put in place by our prior owner. The final payments under these agreements was paid in October 2015.
(d) Represents external professional service costs incurred as the Company assessed and initiated the process of becoming a public company. These costs include accounting and legal fees for public readiness services, documentation of internal controls to comply with Section 404 of the Sarbanes-Oxley Act and external auditor fees incurred for review of all fiscal quarters included in the filing.
(e) | | Consists of non-cash portion of straight line rent expense. |
32