UNITED STATES
SECURITIES AND EXCHANGE COMMISSION
Washington, D.C. 20549
FORMN-CSRS
CERTIFIED SHAREHOLDER REPORT OF REGISTERED
MANAGEMENT INVESTMENT COMPANIES
Investment Company Act File Number811-23015
SEI Catholic Values Trust
(Exact name of registrant as specified in charter)
SEI Investments
One Freedom Valley Drive
Oaks, PA 19456
(Address of principal executive offices) (Zip code)
Timothy D. Barto, Esq.
SEI Investments
One Freedom Valley Drive
Oaks, PA 19456
(Name and address of agent for service)
Registrant’s telephone number, including area code:610-676-1000
Date of fiscal year end: February 29, 2020
Date of reporting period: August 31, 2019
| Item 1. | Reports to Stockholders. |

SEMI-ANNUAL REPORT
SEI Catholic Values Trust
➤ Catholic Values Equity Fund
➤ Catholic Values Fixed Income Fund
Beginning on January 1, 2021, as permitted by regulations adopted by the Securities and Exchange Commission, paper copies of the Funds’ shareholder reports like this one will no longer be sent by mail, unless you specifically request paper copies of the reports from the Funds or from your financial intermediary, such as a broker-dealer or bank. Instead, the reports will be made available on a website, and you will be notified by mail each time a report is posted and provided with a website link to access the report.
If you already elected to receive shareholder reports electronically, you will not be affected by this change and you need not take any action. You may elect to receive shareholder reports and other communications from the Funds electronically by contacting your financial intermediary.
You may elect to receive all future reports in paper free of charge. If you invest through a financial intermediary, you can follow the instructions included with this disclosure, if applicable, or you can contact your financial intermediary to inform it that you wish to continue receiving paper copies of your shareholder reports. If you invest directly with the Funds, you can inform the Funds that you wish to continue receiving paper copies of your shareholder reports by calling 1-800-DIAL-SEI. Your election to receive reports in paper will apply to all funds held with the SEI Funds or your financial intermediary.

TABLE OF CONTENTS
The Trust files its complete schedule of portfolio holdings with the Securities and Exchange Commission for the first and third quarter of each fiscal year on FormN-PORT. The Trust’s FormsN-PORT are available on the Commission’s website at http://www.sec.gov.
A description of the policies and procedures that the Trust uses to determine how to vote proxies relating to portfolio securities, as well as information relating to how a Fund voted proxies relating to portfolio securities during the most recent12-month period ended June 30, is available (i) without charge, upon request, by calling1-800-DIAL-SEI; and (ii) on the Commission’s website at http://www.sec.gov.
SCHEDULE OF INVESTMENTS (Unaudited)
August 31, 2019
Catholic Values Equity Fund
Sector Weightings†:
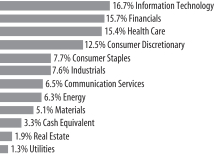
† Percentages based on total investments.
| | | | | | | | | | | | |
| | | | |
| Description | | Shares | | | | | | Market Value
($ Thousands) | |
| | | | | | | | | | | | |
| | | |
COMMON STOCK — 73.9% | | | | | | | | | | | | |
| | | |
Communication Services — 6.0% | | | | | | | | | | | | |
Activision Blizzard Inc | | | 1,536 | | | | | | | $ | 78 | |
Alphabet Inc, Cl A * | | | 2,116 | | | | | | | | 2,519 | |
Alphabet Inc, Cl C * | | | 600 | | | | | | | | 713 | |
AT&T Inc | | | 71,309 | | | | | | | | 2,514 | |
CBS Corp, Cl B | | | 1,031 | | | | | | | | 43 | |
Charter Communications Inc, Cl A * | | | 818 | | | | | | | | 335 | |
Comcast Corp, Cl A | | | 14,311 | | | | | | | | 633 | |
Electronic Arts Inc * | | | 1,255 | | | | | | | | 118 | |
Facebook Inc, Cl A * | | | 20,127 | | | | | | | | 3,737 | |
Fox | | | 2,882 | | | | | | | | 95 | |
Interpublic Group of Cos Inc/The | | | 2,450 | | | | | | | | 49 | |
John Wiley & Sons Inc, Cl A | | | 1,163 | | | | | | | | 52 | |
Live Nation Entertainment Inc * | | | 1,776 | | | | | | | | 123 | |
Madison Square Garden Co/The * | | | 191 | | | | | | | | 48 | |
Netflix Inc * | | | 2,437 | | | | | | | | 716 | |
Omnicom Group Inc | | | 21,567 | | | | | | | | 1,640 | |
Pinterest, Cl A * | | | 8,568 | | | | | | | | 295 | |
Spotify Technology * | | | 360 | | | | | | | | 49 | |
Sprint Corp * | | | 8,319 | | | | | | | | 56 | |
Take-Two Interactive Software Inc * | | | 734 | | | | | | | | 97 | |
T-Mobile US Inc * | | | 4,020 | | | | | | | | 314 | |
Tribune Media, Cl A | | | 1,113 | | | | | | | | 52 | |
Verizon Communications Inc | | | 18,942 | | | | | | | | 1,102 | |
Viacom Inc, Cl B | | | 1,657 | | | | | | | | 41 | |
Walt Disney Co/The | | | 6,703 | | | | | | | | 920 | |
| | | | | | | | | | | | |
| | | |
| | | | | | | | | | | 16,339 | |
| | | | | | | | | | | | |
| | | |
Consumer Discretionary — 10.3% | | | | | | | | | | | | |
Amazon.com Inc * | | | 2,712 | | | | | | | | 4,817 | |
Best Buy Co Inc | | | 1,325 | | | | | | | | 84 | |
Bloomin’ Brands Inc | | | 12,279 | | | | | | | | 222 | |
Booking Holdings Inc * | | | 132 | | | | | | | | 260 | |
Carnival Corp | | | 25,197 | | | | | | | | 1,111 | |
Cheesecake Factory Inc/The | | | 4,938 | | | | | | | | 188 | |
Cooper Tire & Rubber Co | | | 4,116 | | | | | | | | 97 | |
Darden Restaurants Inc | | | 434 | | | | | | | | 53 | |
Dave & Buster’s Entertainment | | | 3,494 | | | | | | | | 150 | |
| | | | | | | | | | | | |
| | | | |
| Description | | Shares | | | | | | Market Value
($ Thousands) | |
| | | | | | | | | | | | |
| | | |
COMMON STOCK (continued) | | | | | | | | | | | | |
Delphi Automotive PLC | | | 7,667 | | | | | | | $ | 638 | |
Dollar General Corp | | | 16,785 | | | | | | | | 2,620 | |
Dollar Tree Inc * | | | 4,305 | | | | | | | | 437 | |
DR Horton Inc | | | 15,427 | | | | | | | | 763 | |
Dunkin’ Brands Group Inc | | | 777 | | | | | | | | 64 | |
eBay Inc | | | 12,262 | | | | | | | | 494 | |
Ford Motor Co | | | 6,427 | | | | | | | | 59 | |
frontdoor Inc * | | | 1,192 | | | | | | | | 61 | |
Gap Inc/The | | | 2,620 | | | | | | | | 41 | |
Garmin Ltd | | | 814 | | | | | | | | 66 | |
General Motors Co | | | 45,086 | | | | | | | | 1,672 | |
Goodyear Tire & Rubber Co/The | | | 3,742 | | | | | | | | 43 | |
Hasbro Inc | | | 526 | | | | | | | | 58 | |
Hilton Worldwide Holdings Inc | | | 1,519 | | | | | | | | 140 | |
Home Depot Inc/The | | | 6,629 | | | | | | | | 1,511 | |
Hyatt Hotels Corp, Cl A | | | 774 | | | | | | | | 56 | |
Kohl’s Corp | | | 839 | | | | | | | | 40 | |
Las Vegas Sands Corp | | | 958 | | | | | | | | 53 | |
Lear Corp | | | 411 | | | | | | | | 46 | |
Lowe’s Cos Inc | | | 21,948 | | | | | | | | 2,463 | |
Macy’s Inc | | | 1,472 | | | | | | | | 22 | |
Magna International Inc | | | 16,863 | | | | | | | | 845 | |
Marriott International Inc/MD, Cl A | | | 679 | | | | | | | | 86 | |
McDonald’s Corp | | | 4,615 | | | | | | | | 1,006 | |
Modine Manufacturing Co * | | | 56,146 | | | | | | | | 573 | |
Mohawk Industries Inc * | | | 4,755 | | | | | | | | 565 | |
NIKE Inc, Cl B | | | 7,680 | | | | | | | | 649 | |
Nordstrom Inc | | | 1,516 | | | | | | | | 44 | |
Norwegian Cruise Line Holdings Ltd * | | | 7,705 | | | | | | | | 391 | |
O’Reilly Automotive Inc * | | | 141 | | | | | | | | 54 | |
PulteGroup Inc | | | 18,091 | | | | | | | | 611 | |
Ross Stores Inc | | | 20,089 | | | | | | | | 2,130 | |
Royal Caribbean Cruises Ltd | | | 2,466 | | | | | | | | 257 | |
Skechers U.S.A. Inc, Cl A * | | | 6,059 | | | | | | | | 192 | |
Starbucks Corp | | | 5,909 | | | | | | | | 571 | |
Target | | | 585 | | | | | | | | 63 | |
Tesla Inc * | | | 364 | | | | | | | | 82 | |
TJX Cos Inc/The | | | 6,986 | | | | | | | | 384 | |
Ulta Beauty Inc * | | | 235 | | | | | | | | 56 | |
Urban Outfitters Inc * | | | 16,371 | | | | | | | | 383 | |
Vail Resorts Inc | | | 574 | | | | | | | | 136 | |
VF Corp | | | 1,652 | | | | | | | | 135 | |
Williams-Sonoma Inc | | | 1,003 | | | | | | | | 66 | |
Wingstop Inc | | | 967 | | | | | | | | 97 | |
Wyndham Destinations Inc | | | 1,185 | | | | | | | | 53 | |
YETI Holdings Inc * | | | 2,157 | | | | | | | | 61 | |
Yum China Holdings Inc | | | 3,981 | | | | | | | | 181 | |
Yum! Brands Inc | | | 560 | | | | | | | | 65 | |
| | | | | | | | | | | | |
| | | |
| | | | | | | | | | | 28,065 | |
| | | | | | | | | | | | |
| | | |
Consumer Staples — 6.2% | | | | | | | | | | | | |
Altria Group Inc | | | 30,349 | | | | | | | | 1,327 | |
Andersons Inc/The | | | 3,336 | | | | | | | | 76 | |
| | |
| SEI Catholic Values Trust / Semi-Annual Report / August 31, 2019 | | 1 |
SCHEDULE OF INVESTMENTS (Unaudited)
August 31, 2019
Catholic Values Equity Fund(Continued)
| | | | | | | | | | | | |
| | | | |
| Description | | Shares | | | | | | Market Value
($ Thousands) | |
| | | | | | | | | | | | |
| | | |
COMMON STOCK (continued) | | | | | | | | | | | | |
Archer-Daniels-Midland Co | | | 1,290 | | | | | | | $ | 49 | |
Brown-Forman Corp, Cl B | | | 1,103 | | | | | | | | 65 | |
Bunge Ltd | | | 963 | | | | | | | | 51 | |
Campbell Soup Co | | | 3,192 | | | | | | | | 144 | |
Clorox Co/The | | | 1,567 | | | | | | | | 248 | |
Coca-Cola Co/The | | | 17,527 | | | | | | | | 965 | |
Colgate-Palmolive Co | | | 7,862 | | | | | | | | 583 | |
Conagra Brands Inc | | | 45,979 | | | | | | | | 1,304 | |
Constellation Brands Inc, Cl A | | | 832 | | | | | | | | 170 | |
Costco Wholesale Corp | | | 1,758 | | | | | | | | 518 | |
Flowers Foods Inc | | | 2,694 | | | | | | | | 61 | |
Hain Celestial Group Inc/The * | | | 9,694 | | | | | | | | 185 | |
Hershey Co/The | | | 1,957 | | | | | | | | 310 | |
Hormel Foods Corp | | | 1,199 | | | | | | | | 51 | |
Ingredion Inc | | | 7,939 | | | | | | | | 613 | |
JM Smucker Co/The | | | 16,042 | | | | | | | | 1,687 | |
Kellogg Co | | | 3,231 | | | | | | | | 203 | |
Keurig Dr Pepper Inc | | | 2,773 | | | | | | | | 76 | |
Kimberly-Clark Corp | | | 3,984 | | | | | | | | 562 | |
Kraft Heinz Co/The | | | 1,549 | | | | | | | | 40 | |
McCormick & Co Inc/MD | | | 941 | | | | | | | | 153 | |
Molson Coors Brewing Co, Cl B | | | 16,232 | | | | | | | | 834 | |
Mondelez International Inc, Cl A | | | 3,900 | | | | | | | | 215 | |
Monster Beverage Corp * | | | 884 | | | | | | | | 52 | |
PepsiCo Inc | | | 7,764 | | | | | | | | 1,062 | |
Philip Morris International Inc | | | 24,389 | | | | | | | | 1,758 | |
Pilgrim’s Pride Corp * | | | 5,978 | | | | | | | | 186 | |
Simply Good Foods Co/The * | | | 2,945 | | | | | | | | 87 | |
Sprouts Farmers Market Inc * | | | 6,447 | | | | | | | | 116 | |
Sysco Corp | | | 3,544 | | | | | | | | 263 | |
TreeHouse Foods Inc * | | | 838 | | | | | | | | 42 | |
Tyson Foods Inc, Cl A | | | 10,827 | | | | | | | | 1,007 | |
Unilever | | | 24,134 | | | | | | | | 1,498 | |
US Foods Holding Corp * | | | 1,326 | | | | | | | | 54 | |
Walgreens Boots Alliance Inc | | | 3,089 | | | | | | | | 158 | |
| | | | | | | | | | | | |
| | | |
| | | | | | | | | | | 16,773 | |
| | | | | | | | | | | | |
| | | |
Energy — 3.1% | | | | | | | | | | | | |
Antero Resources * | | | 14,903 | | | | | | | | 47 | |
Apache Corp | | | 1,840 | | | | | | | | 40 | |
Baker Hughes a GE Co, Cl A | | | 1,514 | | | | | | | | 33 | |
Chevron Corp | | | 22,912 | | | | | | | | 2,697 | |
ConocoPhillips | | | 14,292 | | | | | | | | 746 | |
Core Laboratories NV | | | 10,095 | | | | | | | | 400 | |
Devon Energy Corp | | | 1,691 | | | | | | | | 37 | |
EOG Resources Inc | | | 556 | | | | | | | | 41 | |
Exxon Mobil Corp | | | 12,948 | | | | | | | | 887 | |
Gulfport Energy Corp * | | | 52,115 | | | | | | | | 125 | |
Helmerich & Payne Inc | | | 1,311 | | | | | | | | 49 | |
Hess Corp | | | 1,534 | | | | | | | | 97 | |
Kinder Morgan Inc/DE | | | 20,643 | | | | | | | | 418 | |
Marathon Petroleum Corp | | | 850 | | | | | | | | 42 | |
National Oilwell Varco | | | 2,348 | | | | | | | | 48 | |
| | | | | | | | | | | | |
| | | | |
| Description | | Shares | | | | | | Market Value
($ Thousands) | |
| | | | | | | | | | | | |
| | | |
COMMON STOCK (continued) | | | | | | | | | | | | |
Occidental Petroleum Corp | | | 25,209 | | | | | | | $ | 1,096 | |
ONEOK Inc | | | 921 | | | | | | | | 66 | |
Phillips 66 | | | 555 | | | | | | | | 55 | |
Schlumberger Ltd | | | 43,086 | | | | | | | | 1,397 | |
| | | | | | | | | | | | |
| | | |
| | | | | | | | | | | 8,321 | |
| | | | | | | | | | | | |
| | | |
Financials — 10.3% | | | | | | | | | | | | |
Aflac Inc | | | 43,630 | | | | | | | | 2,189 | |
AGNC Investment Corp ‡ | | | 2,829 | | | | | | | | 42 | |
Allstate Corp/The | | | 1,314 | | | | | | | | 135 | |
American Equity Investment Life Holding Co | | | 21,170 | | | | | | | | 456 | |
American Express Co | | | 2,157 | | | | | | | | 260 | |
American International Group Inc | | | 1,158 | | | | | | | | 60 | |
Annaly Capital Management Inc ‡ | | | 78,453 | | | | | | | | 651 | |
Aon PLC | | | 352 | | | | | | | | 69 | |
AXA Equitable Holdings Inc | | | 12,944 | | | | | | | | 269 | |
Bancorp Inc/The * | | | 5,099 | | | | | | | | 47 | |
Bank of America Corp | | | 67,106 | | | | | | | | 1,846 | |
Bank of New York Mellon Corp/The | | | 7,482 | | | | | | | | 315 | |
BankUnited Inc | | | 11,232 | | | | | | | | 357 | |
BB&T Corp | | | 1,008 | | | | | | | | 48 | |
BlackRock Inc, Cl A | | | 522 | | | | | | | | 221 | |
Capital One Financial Corp | | | 657 | | | | | | | | 57 | |
Cboe Global Markets Inc | | | 535 | | | | | | | | 64 | |
Charles Schwab Corp/The | | | 1,227 | | | | | | | | 47 | |
Chubb Ltd | | | 1,561 | | | | | | | | 244 | |
Citigroup Inc | | | 45,423 | | | | | | | | 2,923 | |
CME Group Inc, Cl A | | | 2,621 | | | | | | | | 570 | |
CNA Financial Corp | | | 4,132 | | | | | | | | 195 | |
CNO Financial Group Inc | | | 23,998 | | | | | | | | 347 | |
Cowen Inc, Cl A * | | | 9,917 | | | | | | | | 155 | |
Cullen/Frost Bankers Inc | | | 907 | | | | | | | | 75 | |
Discover Financial Services | | | 857 | | | | | | | | 69 | |
E*TRADE Financial Corp | | | 6,681 | | | | | | | | 279 | |
Everest Re Group Ltd | | | 4,002 | | | | | | | | 944 | |
First Commonwealth Financial Corp | | | 17,417 | | | | | | | | 215 | |
First Republic Bank/CA | | | 491 | | | | | | | | 44 | |
FNB Corp/PA | | | 24,890 | | | | | | | | 268 | |
Franklin Resources Inc | | | 1,707 | | | | | | | | 45 | |
Great Western Bancorp Inc | | | 12,488 | | | | | | | | 373 | |
Green Dot, Cl A * | | | 5,567 | | | | | | | | 170 | |
Hartford Financial Services Group Inc/The | | | 4,339 | | | | | | | | 253 | |
Intercontinental Exchange Inc | | | 9,530 | | | | | | | | 891 | |
Invesco Ltd | | | 16,527 | | | | | | | | 259 | |
Janus Henderson Group | | | 2,462 | | | | | | | | 47 | |
KeyCorp | | | 3,317 | | | | | | | | 55 | |
Legg Mason Inc | | | 1,747 | | | | | | | | 64 | |
Lincoln National Corp | | | 983 | | | | | | | | 52 | |
Marsh & McLennan Cos Inc | | | 24,009 | | | | | | | | 2,398 | |
MetLife Inc | | | 4,026 | | | | | | | | 178 | |
Moody’s Corp | | | 599 | | | | | | | | 129 | |
Morgan Stanley | | | 12,948 | | | | | | | | 537 | |
Morningstar Inc | | | 695 | | | | | | | | 112 | |
| | |
| 2 | | SEI Catholic Values Trust / Semi-Annual Report / August 31, 2019 |
| | | | | | | | | | | | |
| | | | |
| Description | | Shares | | | | | | Market Value
($ Thousands) | |
| | | | | | | | | | | | |
| | | |
COMMON STOCK (continued) | | | | | | | | | | | | |
MSCI Inc, Cl A | | | 353 | | | | | | | $ | 83 | |
Nasdaq Inc | | | 587 | | | | | | | | 59 | |
National General Holdings Corp | | | 22,522 | | | | | | | | 531 | |
Northern Trust Corp | | | 2,684 | | | | | | | | 236 | |
PNC Financial Services Group Inc/The | | | 1,879 | | | | | | | | 242 | |
Principal Financial Group Inc | | | 1,152 | | | | | | | | 61 | |
Progressive Corp/The | | | 15,046 | | | | | | | | 1,140 | |
Prudential Financial Inc | | | 6,389 | | | | | | | | 512 | |
Regions Financial Corp | | | 6,455 | | | | | | | | 94 | |
S&P Global Inc | | | 5,433 | | | | | | | | 1,414 | |
Santander Consumer USA Holdings Inc | | | 4,402 | | | | | | | | 115 | |
SLM Corp | | | 33,402 | | | | | | | | 282 | |
State Street Corp | | | 33,543 | | | | | | | | 1,721 | |
SunTrust Banks Inc | | | 812 | | | | | | | | 50 | |
Synchrony Financial | | | 2,528 | | | | | | | | 81 | |
T Rowe Price Group Inc | | | 1,349 | | | | | | | | 149 | |
TD Ameritrade Holding Corp | | | 1,020 | | | | | | | | 45 | |
Travelers Cos Inc/The | | | 433 | | | | | | | | 64 | |
Two Harbors Investment Corp ‡ | | | 23,228 | | | | | | | | 293 | |
Umpqua Holdings Corp | | | 19,773 | | | | | | | | 311 | |
US Bancorp | | | 2,210 | | | | | | | | 116 | |
Virtu Financial, Cl A | | | 5,771 | | | | | | | | 109 | |
Voya Financial Inc | | | 1,992 | | | | | | | | 98 | |
Wells Fargo & Co | | | 21,587 | | | | | | | | 1,005 | |
Willis Towers Watson PLC | | | 290 | | | | | | | | 57 | |
Zions Bancorp NA | | | 1,209 | | | | | | | | 50 | |
| | | | | | | | | | | | |
| | | |
| | | | | | | | | | | 27,942 | |
| | | | | | | | | | | | |
| | | |
Health Care — 13.0% | | | | | | | | | | | | |
Abbott Laboratories | | | 45,624 | | | | | | | | 3,893 | |
ABIOMED Inc * | | | 952 | | | | | | | | 184 | |
Acadia Healthcare Co Inc * | | | 1,743 | | | | | | | | 46 | |
Adverum Biotechnologies * | | | 4,891 | | | | | | | | 51 | |
Agios Pharmaceuticals Inc * | | | 1,478 | | | | | | | | 56 | |
Alcon Inc * | | | 12,713 | | | | | | | | 775 | |
Alexion Pharmaceuticals Inc * | | | 2,688 | | | | | | | | 271 | |
Align Technology Inc * | | | 178 | | | | | | | | 33 | |
Alkermes PLC * | | | 5,476 | | | | | | | | 115 | |
Allakos * | | | 1,126 | | | | | | | | 100 | |
Alnylam Pharmaceuticals Inc * | | | 3,782 | | | | | | | | 305 | |
Anthem Inc | | | 1,653 | | | | | | | | 432 | |
ArQule Inc * | | | 15,735 | | | | | | | | 141 | |
Arrowhead Pharmaceuticals * | | | 2,238 | | | | | | | | 76 | |
Axonics Modulation Technologies Inc * | | | 1,700 | | | | | | | | 57 | |
Axsome Therapeutics Inc * | | | 15,884 | | | | | | | | 404 | |
Baxter International Inc | | | 8,300 | | | | | | | | 730 | |
BioMarin Pharmaceutical Inc * | | | 5,008 | | | | | | | | 376 | |
Boston Scientific Corp * | | | 37,666 | | | | | | | | 1,609 | |
Bruker Corp | | | 20,273 | | | | | | | | 875 | |
Cantel Medical Corp | | | 702 | | | | | | | | 65 | |
Cara Therapeutics * | | | 33,665 | | | | | | | | 789 | |
Cardinal Health Inc | | | 3,870 | | | | | | | | 167 | |
Centene Corp * | | | 3,353 | | | | | | | | 156 | |
| | | | | | | | | | | | |
| | | | |
| Description | | Shares | | | | | | Market Value
($ Thousands) | |
| | | | | | | | | | | | |
| | | |
COMMON STOCK (continued) | | | | | | | | | | | | |
Cerner Corp | | | 1,889 | | | | | | | $ | 130 | |
Chemed Corp | | | 160 | | | | | | | | 69 | |
Cigna Corp | | | 3,223 | | | | | | | | 496 | |
Covetrus Inc * | | | 987 | | | | | | | | 13 | |
CryoPort * | | | 2,719 | | | | | | | | 59 | |
CVS Health Corp | | | 50,541 | | | | | | | | 3,079 | |
DaVita Inc * | | | 1,288 | | | | | | | | 73 | |
DENTSPLY SIRONA Inc | | | 1,719 | | | | | | | | 90 | |
DexCom Inc * | | | 722 | | | | | | | | 124 | |
Edwards Lifesciences Corp * | | | 1,263 | | | | | | | | 280 | |
Elanco Animal Health Inc * | | | 30,701 | | | | | | | | 799 | |
Encompass Health Corp | | | 831 | | | | | | | | 51 | |
Exact Sciences Corp * | | | 856 | | | | | | | | 102 | |
Exelixis Inc * | | | 6,508 | | | | | | | | 129 | |
G1 Therapeutics Inc * | | | 2,625 | | | | | | | | 95 | |
Guardant Health Inc * | | | 588 | | | | | | | | 51 | |
Henry Schein Inc * | | | 2,467 | | | | | | | | 152 | |
Hill-Rom Holdings Inc | | | 1,390 | | | | | | | | 150 | |
Hologic Inc * | | | 1,306 | | | | | | | | 64 | |
Horizon Therapeutics Plc * | | | 44,873 | | | | | | | | 1,240 | |
Humana Inc | | | 1,123 | | | | | | | | 318 | |
ICU Medical Inc * | | | 171 | | | | | | | | 28 | |
IDEXX Laboratories Inc * | | | 489 | | | | | | | | 142 | |
Incyte Corp * | | | 3,204 | | | | | | | | 262 | |
Inovalon Holdings, Cl A * | | | 3,117 | | | | | | | | 53 | |
Inspire Medical Systems Inc * | | | 1,002 | | | | | | | | 70 | |
Insulet Corp * | | | 584 | | | | | | | | 90 | |
Integra LifeSciences Holdings Corp * | | | 1,163 | | | | | | | | 70 | |
Intuitive Surgical Inc * | | | 693 | | | | | | | | 354 | |
Ionis Pharmaceuticals Inc * | | | 1,893 | | | | | | | | 120 | |
Iovance Biotherapeutics * | | | 3,113 | | | | | | | | 65 | |
IQVIA Holdings Inc * | | | 5,587 | | | | | | | | 867 | |
Krystal Biotech * | | | 2,120 | | | | | | | | 95 | |
Laboratory Corp of America Holdings * | | | 513 | | | | | | | | 86 | |
LHC Group Inc * | | | 1,055 | | | | | | | | 125 | |
Magellan Health Inc * | | | 9,212 | | | | | | | | 580 | |
Masimo Corp * | | | 874 | | | | | | | | 134 | |
McKesson Corp | | | 1,393 | | | | | | | | 193 | |
Medicines * | | | 2,622 | | | | | | | | 110 | |
Medpace Holdings Inc * | | | 10,440 | | | | | | | | 845 | |
Mettler-Toledo International Inc * | | | 1,249 | | | | | | | | 820 | |
Mirati Therapeutics Inc * | | | 698 | | | | | | | | 57 | |
Moderna Inc * | | | 6,070 | | | | | | | | 95 | |
Molina Healthcare Inc * | | | 616 | | | | | | | | 80 | |
Natera * | | | 3,160 | | | | | | | | 104 | |
Nektar Therapeutics, Cl A * | | | 41,292 | | | | | | | | 726 | |
NeoGenomics Inc * | | | 35,003 | | | | | | | | 874 | |
Neurocrine Biosciences Inc * | | | 2,134 | | | | | | | | 212 | |
Novocure Ltd * | | | 1,011 | | | | | | | | 92 | |
Penumbra Inc * | | | 579 | | | | | | | | 84 | |
PRA Health Sciences Inc * | | | 8,124 | | | | | | | | 803 | |
Premier Inc, Cl A * | | | 1,272 | | | | | | | | 45 | |
| | |
| SEI Catholic Values Trust / Semi-Annual Report / August 31, 2019 | | 3 |
SCHEDULE OF INVESTMENTS (Unaudited)
August 31, 2019
Catholic Values Equity Fund(Continued)
| | | | | | | | | | | | |
| | | | |
| Description | | Shares | | | | | | Market Value
($ Thousands) | |
| | | | | | | | | | | | |
| | | |
COMMON STOCK (continued) | | | | | | | | | | | | |
Quest Diagnostics Inc | | | 2,735 | | | | | | | $ | 280 | |
R1 RCM * | | | 4,138 | | | | | | | | 48 | |
Ra Pharmaceuticals Inc * | | | 4,519 | | | | | | | | 123 | |
Repligen Corp * | | | 1,901 | | | | | | | | 176 | |
ResMed Inc | | | 2,570 | | | | | | | | 358 | |
Sage Therapeutics Inc * | | | 901 | | | | | | | | 155 | |
Sarepta Therapeutics Inc * | | | 2,359 | | | | | | | | 213 | |
Seattle Genetics Inc * | | | 1,982 | | | | | | | | 144 | |
STERIS PLC | | | 1,076 | | | | | | | | 166 | |
Stryker Corp | | | 2,405 | | | | | | | | 531 | |
Teleflex Inc | | | 473 | | | | | | | | 172 | |
Tivity Health Inc * | | | 26,452 | | | | | | | | 483 | |
Turning Point Therapeutics * | | | 1,549 | | | | | | | | 84 | |
United Therapeutics Corp * | | | 4,865 | | | | | | | | 402 | |
Varian Medical Systems Inc * | | | 2,254 | | | | | | | | 239 | |
Veeva Systems Inc, Cl A * | | | 378 | | | | | | | | 61 | |
Veracyte Inc * | | | 6,405 | | | | | | | | 170 | |
Vertex Pharmaceuticals Inc * | | | 6,233 | | | | | | | | 1,122 | |
Waters Corp * | | | 3,791 | | | | | | | | 803 | |
WellCare Health Plans Inc * | | | 480 | | | | | | | | 130 | |
West Pharmaceutical Services Inc | | | 999 | | | | | | | | 145 | |
Zimmer Biomet Holdings Inc | | | 5,327 | | | | | | | | 742 | |
Zoetis Inc, Cl A | | | 7,639 | | | | | | | | 966 | |
| | | | | | | | | | | | |
| | | |
| | | | | | | | | | | 35,264 | |
| | | | | | | | | | | | |
| | | |
Industrials — 6.3% | | | | | | | | | | | | |
3M Co | | | 9,791 | | | | | | | | 1,583 | |
ACCO Brands Corp | | | 15,434 | | | | | | | | 143 | |
AGCO Corp | | | 1,432 | | | | | | | | 99 | |
Alaska Air Group Inc | | | 775 | | | | | | | | 46 | |
Allegion PLC | | | 536 | | | | | | | | 52 | |
AMERCO | | | 140 | | | | | | | | 49 | |
American Airlines Group Inc | | | 28,082 | | | | | | | | 739 | |
AMETEK Inc | | | 605 | | | | | | | | 52 | |
AO Smith Corp | | | 943 | | | | | | | | 44 | |
Apogee Enterprises Inc | | | 10,092 | | | | | | | | 373 | |
ASGN Inc * | | | 1,076 | | | | | | | | 67 | |
Astec Industries Inc | | | 2,843 | | | | | | | | 78 | |
Atlas Air Worldwide Holdings Inc * | | | 11,564 | | | | | | | | 299 | |
Casella Waste Systems Inc, Cl A * | | | 1,827 | | | | | | | | 83 | |
Caterpillar Inc | | | 1,301 | | | | | | | | 155 | |
CH Robinson Worldwide Inc | | | 602 | | | | | | | | 51 | |
Cintas Corp | | | 3,662 | | | | | | | | 966 | |
Clean Harbors Inc * | | | 1,128 | | | | | | | | 83 | |
CoStar Group Inc * | | | 109 | | | | | | | | 67 | |
CSX Corp | | | 1,508 | | | | | | | | 101 | |
Cummins Inc | | | 1,667 | | | | | | | | 249 | |
Deere & Co | | | 1,422 | | | | | | | | 220 | |
Delta Air Lines Inc | | | 6,659 | | | | | | | | 385 | |
Dover Corp | | | 1,366 | | | | | | | | 128 | |
Eaton Corp PLC | | | 8,231 | | | | | | | | 664 | |
Emerson Electric Co | | | 1,607 | | | | | | | | 96 | |
Equifax Inc | | | 476 | | | | | | | | 70 | |
| | | | | | | | | | | | |
| | | | |
| Description | | Shares | | | | | | Market Value
($ Thousands) | |
| | | | | | | | | | | | |
| | | |
COMMON STOCK (continued) | | | | | | | | | | | | |
Fastenal Co | | | 1,480 | | | | | | | $ | 45 | |
FedEx Corp | | | 1,376 | | | | | | | | 218 | |
Flowserve Corp | | | 1,306 | | | | | | | | 56 | |
Fortive Corp | | | 627 | | | | | | | | 44 | |
Great Lakes Dredge & Dock * | | | 4,914 | | | | | | | | 53 | |
HD Supply Holdings Inc * | | | 1,156 | | | | | | | | 45 | |
HEICO | | | 386 | | | | | | | | 56 | |
Hexcel Corp | | | 889 | | | | | | | | 75 | |
IHS Markit Ltd * | | | 1,072 | | | | | | | | 70 | |
Illinois Tool Works Inc | | | 16,109 | | | | | | | | 2,414 | |
Ingersoll-Rand PLC | | | 3,308 | | | | | | | | 401 | |
JB Hunt Transport Services Inc | | | 536 | | | | | | | | 58 | |
JetBlue Airways Corp * | | | 2,913 | | | | | | | | 50 | |
Johnson Controls International plc | | | 8,766 | | | | | | | | 374 | |
Kansas City Southern | | | 423 | | | | | | | | 53 | |
LB Foster Co, Cl A * | | | 3,821 | | | | | | | | 76 | |
Lennox International Inc | | | 194 | | | | | | | | 49 | |
Lydall Inc * | | | 9,664 | | | | | | | | 194 | |
Macquarie Infrastructure Corp | | | 1,159 | | | | | | | | 44 | |
ManpowerGroup Inc | | | 944 | | | | | | | | 77 | |
Masco Corp | | | 1,719 | | | | | | | | 70 | |
MSC Industrial Direct Co Inc, Cl A | | | 598 | | | | | | | | 40 | |
Nielsen Holdings PLC | | | 2,443 | | | | | | | | 51 | |
Oshkosh Corp | | | 837 | | | | | | | | 59 | |
Owens Corning | | | 2,456 | | | | | | | | 141 | |
PACCAR Inc | | | 771 | | | | | | | | 51 | |
Parker-Hannifin Corp | | | 356 | | | | | | | | 59 | |
Pentair PLC | | | 1,364 | | | | | | | | 49 | |
Regal Beloit Corp | | | 733 | | | | | | | | 52 | |
Republic Services Inc, Cl A | | | 700 | | | | | | | | 62 | |
Resideo Technologies Inc * | | | 2,553 | | | | | | | | 35 | |
REV Group Inc | | | 18,346 | | | | | | | | 236 | |
Rockwell Automation Inc | | | 1,053 | | | | | | | | 161 | |
Rollins Inc | | | 1,349 | | | | | | | | 44 | |
Roper Technologies Inc | | | 173 | | | | | | | | 63 | |
Sensata Technologies Holding PLC * | | | 1,149 | | | | | | | | 52 | |
Snap-on Inc | | | 310 | | | | | | | | 46 | |
Southwest Airlines Co | | | 1,122 | | | | | | | | 59 | |
Spirit AeroSystems Holdings Inc, Cl A | | | 1,276 | | | | | | | | 103 | |
Stanley Black & Decker Inc | | | 4,507 | | | | | | | | 599 | |
Toro Co/The | | | 721 | | | | | | | | 52 | |
TransDigm Group Inc * | | | 626 | | | | | | | | 337 | |
TriNet Group Inc * | | | 836 | | | | | | | | 56 | |
Trinity Industries Inc | | | 4,400 | | | | | | | | 77 | |
Uber Technologies * | | | 1,225 | | | | | | | | 40 | |
United Continental Holdings Inc * | | | 1,139 | | | | | | | | 96 | |
United Parcel Service Inc, Cl B | | | 2,273 | | | | | | | | 270 | |
United Rentals Inc * | | | 402 | | | | | | | | 45 | |
Univar Inc * | | | 2,330 | | | | | | | | 45 | |
Verisk Analytics Inc, Cl A | | | 474 | | | | | | | | 77 | |
Wabtec Corp | | | 720 | | | | | | | | 50 | |
Waste Management Inc | | | 3,911 | | | | | | | | 467 | |
| | |
| 4 | | SEI Catholic Values Trust / Semi-Annual Report / August 31, 2019 |
| | | | | | | | | | | | |
| | | | |
| Description | | Shares | | | | | | Market Value
($ Thousands) | |
| | | | | | | | | | | | |
| | | |
COMMON STOCK (continued) | | | | | | | | | | | | |
Watsco Inc | | | 331 | | | | | | | $ | 54 | |
WESCO International Inc * | | | 1,999 | | | | | | | | 90 | |
Woodward Inc | | | 485 | | | | | | | | 52 | |
WW Grainger Inc | | | 5,535 | | | | | | | | 1,515 | |
Xylem Inc/NY | | | 4,067 | | | | | | | | 312 | |
| | | | | | | | | | | | |
| | | |
| | | | | | | | | | | 17,061 | |
| | | | | | | | | | | | |
| | | |
Information Technology — 12.6% | | | | | | | | | | | | |
Accenture PLC, Cl A | | | 4,534 | | | | | | | | 899 | |
Adobe Inc * | | | 7,759 | | | | | | | | 2,208 | |
Advanced Micro Devices * | | | 1,592 | | | | | | | | 50 | |
Amdocs | | | 2,854 | | | | | | | | 185 | |
Analog Devices Inc | | | 1,648 | | | | | | | | 181 | |
Appian, Cl A * | | | 839 | | | | | | | | 50 | |
Apple Inc | | | 17,040 | | | | | | | | 3,557 | |
Applied Materials Inc | | | 2,919 | | | | | | | | 140 | |
Atlassian, Cl A * | | | 391 | | | | | | | | 53 | |
Autodesk Inc * | | | 816 | | | | | | | | 117 | |
Automatic Data Processing Inc | | | 4,812 | | | | | | | | 817 | |
Avalara Inc * | | | 4,211 | | | | | | | | 355 | |
Broadcom Inc | | | 1,407 | | | | | | | | 398 | |
Cisco Systems Inc | | | 16,461 | | | | | | | | 771 | |
Cognizant Technology Solutions Corp, Cl A | | | 621 | | | | | | | | 38 | |
Dell Technologies Inc, Cl C * | | | 1,116 | | | | | | | | 58 | |
Digital Turbine * | | | 10,275 | | | | | | | | 78 | |
DXC Technology Co | | | 691 | | | | | | | | 23 | |
Enphase Energy Inc * | | | 1,565 | | | | | | | | 46 | |
Fidelity National Information Services Inc | | | 8,337 | | | | | | | | 1,136 | |
Fiserv Inc * | | | 1,217 | | | | | | | | 130 | |
Global Payments Inc | | | 6,372 | | | | | | | | 1,058 | |
Hewlett Packard Enterprise Co | | | 12,502 | | | | | | | | 173 | |
HP Inc | | | 15,698 | | | | | | | | 287 | |
Intuit Inc | | | 1,427 | | | | | | | | 411 | |
IPG Photonics Corp * | | | 2,086 | | | | | | | | 258 | |
Keysight Technologies Inc * | | | 598 | | | | | | | | 58 | |
KLA | | | 445 | | | | | | | | 66 | |
Lam Research Corp | | | 2,217 | | | | | | | | 467 | |
Lattice Semiconductor Corp * | | | 3,985 | | | | | | | | 78 | |
Mastercard Inc, Cl A | | | 3,611 | | | | | | | | 1,016 | |
Microchip Technology Inc | | | 15,904 | | | | | | | | 1,373 | |
Micron Technology Inc * | | | 10,569 | | | | | | | | 478 | |
Microsoft Corp | | | 50,474 | | | | | | | | 6,958 | |
NCR Corp * | | | 6,852 | | | | | | | | 216 | |
NetApp Inc | | | 980 | | | | | | | | 47 | |
NVIDIA Corp | | | 6,665 | | | | | | | | 1,116 | |
ON Semiconductor Corp * | | | 2,294 | | | | | | | | 41 | |
PayPal Holdings Inc * | | | 10,264 | | | | | | | | 1,119 | |
QUALCOMM Inc | | | 4,917 | | | | | | | | 382 | |
salesforce.com Inc* | | | 14,573 | | | | | | | | 2,274 | |
ServiceNow Inc * | | | 188 | | | | | | | | 49 | |
Skyworks Solutions Inc | | | 606 | | | | | | | | 46 | |
Super Micro Computer Inc * | | | 29,161 | | | | | | | | 551 | |
Symantec Corp | | | 3,404 | | | | | | | | 79 | |
| | | | | | | | | | | | |
| | | | |
| Description | | Shares | | | | | | Market Value
($ Thousands) | |
| | | | | | | | | | | | |
| | | |
COMMON STOCK (continued) | | | | | | | | | | | | |
Telaria Inc * | | | 8,457 | | | | | | | $ | 84 | |
Teradata Corp * | | | 1,351 | | | | | | | | 42 | |
Texas Instruments Inc | | | 4,800 | | | | | | | | 594 | |
Visa Inc, Cl A | | | 19,314 | | | | | | | | 3,492 | |
VMware Inc, Cl A * | | | 382 | | | | | | | | 54 | |
Workday Inc, Cl A * | | | 251 | | | | | | | | 45 | |
Workiva Inc, Cl A * | | | 1,038 | | | | | | | | 50 | |
Xilinx Inc | | | 598 | | | | | | | | 62 | |
| | | | | | | | | | | | |
| | | |
| | | | | | | | | | | 34,314 | |
| | | | | | | | | | | | |
| | | |
Materials — 3.3% | | | | | | | | | | | | |
Air Products & Chemicals Inc | | | 3,688 | | | | | | | | 833 | |
AptarGroup Inc | | | 1,090 | | | | | | | | 133 | |
Avery Dennison Corp | | | 1,234 | | | | | | | | 143 | |
B2Gold Corp * | | | 49,054 | | | | | | | | 176 | |
Ball Corp | | | 4,736 | | | | | | | | 381 | |
Berry Global Group Inc * | | | 1,067 | | | | | | | | 42 | |
Cabot Corp | | | 883 | | | | | | | | 35 | |
Century Aluminum Co * | | | 9,125 | | | | | | | | 50 | |
Commercial Metals Co | | | 19,369 | | | | | | | | 304 | |
Corteva | | | 9,598 | | | | | | | | 281 | |
Crown Holdings Inc * | | | 12,110 | | | | | | | | 797 | |
Domtar Corp | | | 1,435 | | | | | | | | 47 | |
Dow Inc | | | 5,823 | | | | | | | | 248 | |
DuPont de Nemours | | | 5,823 | | | | | | | | 396 | |
Eastman Chemical Co | | | 6,389 | | | | | | | | 418 | |
Ecolab Inc | | | 466 | | | | | | | | 96 | |
FMC Corp | | | 1,027 | | | | | | | | 89 | |
Freeport-McMoRan Inc | | | 21,003 | | | | | | | | 193 | |
Huntsman Corp | | | 13,246 | | | | | | | | 264 | |
International Flavors & Fragrances Inc | | | 1,080 | | | | | | | | 119 | |
International Paper Co | | | 1,238 | | | | | | | | 48 | |
Linde PLC | | | 2,849 | | | | | | | | 538 | |
Livent Corp * | | | 9,157 | | | | | | | | 56 | |
LyondellBasell Industries NV, Cl A | | | 607 | | | | | | | | 47 | |
Newmont Goldcorp Corp | | | 28,149 | | | | | | | | 1,123 | |
Nucor Corp | | | 870 | | | | | | | | 43 | |
Owens-Illinois Inc | | | 27,394 | | | | | | | | 279 | |
PPG Industries Inc | | | 510 | | | | | | | | 57 | |
Sherwin-Williams Co/The | | | 1,456 | | | | | | | | 767 | |
Sonoco Products Co | | | 3,500 | | | | | | | | 200 | |
United States Steel Corp | | | 19,964 | | | | | | | | 221 | |
Vulcan Materials Co | | | 3,153 | | | | | | | | 445 | |
Westrock Co | | | 1,448 | | | | | | | | 49 | |
| | | | | | | | | | | | |
| | | |
| | | | | | | | | | | 8,918 | |
| | | | | | | | | | | | |
| | | |
Real Estate — 1.5% | | | | | | | | | | | | |
American Campus Communities Inc ‡ | | | 1,095 | | | | | | | | 51 | |
American Tower Corp ‡ | | | 1,117 | | | | | | | | 257 | |
AvalonBay Communities Inc ‡ | | | 909 | | | | | | | | 193 | |
Brandywine Realty Trust ‡ | | | 3,873 | | | | | | | | 56 | |
CBRE Group Inc, Cl A *‡ | | | 1,320 | | | | | | | | 69 | |
Corporate Office Properties Trust ‡ | | | 2,505 | | | | | | | | 72 | |
| | |
| SEI Catholic Values Trust / Semi-Annual Report / August 31, 2019 | | 5 |
SCHEDULE OF INVESTMENTS (Unaudited)
August 31, 2019
Catholic Values Equity Fund(Continued)
| | | | | | | | | | | | |
| | | | |
| Description | | Shares | | | | | | Market Value ($ Thousands) | |
| | | | | | | | | | | | |
| | | |
COMMON STOCK (continued) | | | | | | | | | | | | |
Crown Castle International Corp ‡ | | | 8,384 | | | | | | | $ | 1,217 | |
CubeSmart‡ | | | 1,472 | | | | | | | | 53 | |
Digital Realty Trust ‡ | | | 437 | | | | | | | | 54 | |
Equinix Inc ‡ | | | 145 | | | | | | | | 81 | |
Equity Residential ‡ | | | 780 | | | | | | | | 66 | |
Essex Property Trust Inc ‡ | | | 187 | | | | | | | | 60 | |
Extra Space Storage ‡ | | | 438 | | | | | | | | 53 | |
Gaming and Leisure Properties ‡ | | | 1,375 | | | | | | | | 54 | |
HCP Inc ‡ | | | 1,868 | | | | | | | | 65 | |
Host Hotels & Resorts Inc ‡ | | | 7,990 | | | | | | | | 128 | |
Iron Mountain Inc ‡ | | | 1,533 | | | | | | | | 49 | |
Jones Lang LaSalle Inc ‡ | | | 410 | | | | | | | | 55 | |
Kilroy Realty Corp ‡ | | | 811 | | | | | | | | 63 | |
Prologis Inc ‡ | | | 7,761 | | | | | | | | 649 | |
Public Storage ‡ | | | 457 | | | | | | | | 121 | |
Realty Income Corp ‡ | | | 747 | | | | | | | | 55 | |
Simon Property Group Inc ‡ | | | 566 | | | | | | | | 84 | |
SL Green Realty ‡ | | | 586 | | | | | | | | 47 | |
Ventas Inc ‡ | | | 1,890 | | | | | | | | 139 | |
VEREIT Inc ‡ | | | 6,295 | | | | | | | | 61 | |
Vornado Realty Trust ‡ | | | 765 | | | | | | | | 46 | |
Welltower Inc ‡ | | | 1,829 | | | | | | | | 164 | |
Weyerhaeuser Co ‡ | | | 5,915 | | | | | | | | 156 | |
| | | | | | | | | | | | |
| | | |
| | | | | | | | | | | 4,218 | |
| | | | | | | | | | | | |
| | | |
Utilities — 1.3% | | | | | | | | | | | | |
Alliant Energy Corp | | | 1,056 | | | | | | | | 55 | |
Ameren Corp | | | 786 | | | | | | | | 61 | |
American Electric Power Co Inc | | | 675 | | | | | | | | 62 | |
American Water Works Co Inc | | | 950 | | | | | | | | 121 | |
Avangrid Inc | | | 1,034 | | | | | | | | 52 | |
CMS Energy Corp | | | 6,772 | | | | | | | | 427 | |
Consolidated Edison Inc | | | 664 | | | | | | | | 59 | |
Dominion Energy Inc | | | 694 | | | | | | | | 54 | |
DTE Energy Co | | | 4,574 | | | | | | | | 593 | |
Duke Energy Corp | | | 1,264 | | | | | | | | 117 | |
Edison International | | | 839 | | | | | | | | 61 | |
Entergy Corp | | | 595 | | | | | | | | 67 | |
Evergy Inc | | | 923 | | | | | | | | 60 | |
Eversource Energy | | | 3,118 | | | | | | | | 250 | |
Exelon Corp | | | 6,186 | | | | | | | | 292 | |
FirstEnergy Corp | | | 1,272 | | | | | | | | 59 | |
NextEra Energy Inc | | | 1,489 | | | | | | | | 326 | |
NiSource Inc | | | 2,008 | | | | | | | | 59 | |
Pinnacle West Capital Corp | | | 590 | | | | | | | | 56 | |
PPL Corp | | | 1,714 | | | | | | | | 51 | |
Public Service Enterprise Group Inc | | | 1,789 | | | | | | | | 108 | |
Sempra Energy | | | 466 | | | | | | | | 66 | |
Southern Co/The | | | 1,127 | | | | | | | | 66 | |
WEC Energy Group Inc | | | 737 | | | | | | | | 71 | |
Xcel Energy Inc | | | 6,735 | | | | | | | | 433 | |
| | | | | | | | | | | | |
| | | | | | | | | | | 3,626 | |
| | | | | | | | | | | | |
| | | | | | | | | | | | |
| | | | |
| Description | | Shares | | | | | | Market Value
($ Thousands) | |
| | | | | | | | | | | | |
| | | |
COMMON STOCK (continued) | | | | | | | | | | | | |
Total Common Stock (Cost $167,010) ($ Thousands) | | | | | | | | | | $ | 200,841 | |
| | | | | | | | | | | | |
| | | |
FOREIGN COMMON STOCK — 22.4% | | | | | | | | | | | | |
| | | |
Australia — 0.4% | | | | | | | | | | | | |
BHP Group Ltd ADR | | | 22,006 | | | | | | | | 1,082 | |
South32 Ltd ADR | | | 7,863 | | | | | | | | 69 | |
| | | | | | | | | | | | |
| | | |
| | | | | | | | | | | 1,151 | |
| | | | | | | | | | | | |
| | | |
Austria — 0.7% | | | | | | | | | | | | |
Erste Group Bank AG * | | | 28,543 | | | | | | | | 920 | |
Schoeller-Bleckmann Oilfield Equipment AG | | | 7,939 | | | | | | | | 505 | |
voestalpine AG | | | 21,904 | | | | | | | | 505 | |
| | | | | | | | | | | | |
| | | |
| | | | | | | | | | | 1,930 | |
| | | | | | | | | | | | |
| | | |
Bermuda — 0.2% | | | | | | | | | | | | |
Marvell Technology Group Ltd | | | 20,966 | | | | | | | | 503 | |
| | | | | | | | | | | | |
| | | |
Brazil — 0.8% | | | | | | | | | | | | |
Banco Bradesco SA ADR * | | | 119,023 | | | | | | | | 951 | |
JBS SA | | | 149,600 | | | | | | | | 1,081 | |
| | | | | | | | | | | | |
| | | |
| | | | | | | | | | | 2,032 | |
| | | | | | | | | | | | |
| | | |
Canada — 1.0% | | | | | | | | | | | | |
Canadian Natural Resources Ltd | | | 57,388 | | | | | | | | 1,371 | |
Magna International Inc | | | 17,257 | | | | | | | | 866 | |
Rogers Communications Inc, Cl B | | | 9,788 | | | | | | | | 485 | |
| | | | | | | | | | | | |
| | | |
| | | | | | | | | | | 2,722 | |
| | | | | | | | | | | | |
| | | |
Chile — 0.0% | | | | | | | | | | | | |
Sociedad Quimica y Minera de Chile SA ADR | | | 5,090 | | | | | | | | 125 | |
| | | | | | | | | | | | |
| | | |
China — 1.2% | | | | | | | | | | | | |
Alibaba Group Holding Ltd ADR * | | | 8,215 | | | | | | | | 1,438 | |
Anhui Conch Cement Co Ltd, Cl H | | | 176,500 | | | | | | | | 995 | |
Baidu Inc ADR * | | | 2,280 | | | | | | | | 238 | |
BYD Co Ltd, Cl H | | | 102,000 | | | | | | | | 528 | |
| | | | | | | | | | | | |
| | | |
| | | | | | | | | | | 3,199 | |
| | | | | | | | | | | | |
| | | |
Colombia — 0.4% | | | | | | | | | | | | |
Bancolombia SA ADR | | | 21,447 | | | | | | | | 1,068 | |
| | | | | | | | | | | | |
| | | |
Czech Republic — 0.2% | | | | | | | | | | | | |
Komercni banka as | | | 17,516 | | | | | | | | 623 | |
| | | | | | | | | | | | |
| | | |
France — 1.1% | | | | | | | | | | | | |
Capgemini SE | | | 8,963 | | | | | | | | 1,078 | |
Societe Generale SA | | | 32,468 | | | | | | | | 824 | |
Sodexo SA | | | 9,978 | | | | | | | | 1,133 | |
| | | | | | | | | | | | |
| | | |
| | | | | | | | | | | 3,035 | |
| | | | | | | | | | | | |
| | | |
Germany — 1.0% | | | | | | | | | | | | |
BASF SE | | | 14,266 | | | | | | | | 946 | |
Continental AG | | | 6,157 | | | | | | | | 744 | |
Vonovia SE‡ | | | 19,808 | | | | | | | | 988 | |
| | | | | | | | | | | | |
| | | |
| | | | | | | | | |
| 2,678
|
|
| | | | | | | | | | | | |
| | |
| 6 | | SEI Catholic Values Trust / Semi-Annual Report / August 31, 2019 |
| | | | | | | | | | | | |
| | | | |
| Description | | Shares | | | | | | Market Value
($ Thousands) | |
| | | | | | | | | | | | |
| | | |
FOREIGN COMMON STOCK (continued) | | | | | | | | | | | | |
| | | |
Hong Kong — 0.7% | | | | | | | | | | | | |
ANTA Sports Products Ltd | | | 60,000 | | | | | | | $ | 498 | |
China Life Insurance Co Ltd, Cl H | | | 362,000 | | | | | | | | 847 | |
Sinopharm Group Co Ltd, Cl H | | | 135,200 | | | | | | | | 489 | |
| | | | | | | | | | | | |
| | | | | | | | | | | 1,834 | |
| | | | | | | | | | | | |
| | | |
India — 0.8% | | | | | | | | | | | | |
HDFC Bank Ltd ADR | | | 10,650 | | | | | | | | 1,148 | |
ICICI Bank Ltd ADR | | | 90,404 | | | | | | | | 1,015 | |
| | | | | | | | | | | | |
| | | |
| | | | | | | | | | | 2,163 | |
| | | | | | | | | | | | |
| | | |
Ireland — 2.4% | | | | | | | | | | | | |
AerCap Holdings NV * | | | 10,948 | | | | | | | | 587 | |
ICON PLC * | | | 20,455 | | | | | | | | 3,154 | |
Jazz Pharmaceuticals PLC * | | | 8,966 | | | | | | | | 1,149 | |
Medtronic PLC | | | 15,468 | | | | | | | | 1,669 | |
| | | | | | | | | | | | |
| | | |
| | | | | | | | | | | 6,559 | |
| | | | | | | | | | | | |
| | | |
Israel — 0.4% | | | | | | | | | | | | |
Check Point Software Technologies Ltd * | | | 10,180 | | | | | | | | 1,096 | |
| | | | | | | | | | | | |
| | | |
Italy — 0.3% | | | | | | | | | | | | |
Prysmian SpA | | | 36,774 | | | | | | | | 806 | |
| | | | | | | | | | | | |
| | | |
Japan — 1.3% | | | | | | | | | | | | |
Denso Corp | | | 35,200 | | | | | | | | 1,478 | |
Hitachi Ltd | | | 29,500 | | | | | | | | 1,009 | |
Toray Industries Inc | | | 146,500 | | | | | | | | 1,046 | |
| | | | | | | | | | | | |
| | | |
| | | | | | | | | | | 3,533 | |
| | | | | | | | | | | | |
| | | |
Mexico — 0.3% | | | | | | | | | | | | |
Grupo Financiero Banorte SAB de CV, Cl O | | | 132,600 | | | | | | | | 715 | |
| | | | | | | | | | | | |
| | | |
Netherlands — 2.4% | | | | | | | | | | | | |
Heineken NV | | | 13,435 | | | | | | | | 1,432 | |
NXP Semiconductors NV | | | 10,411 | | | | | | | | 1,063 | |
RELX PLC | | | 51,732 | | | | | | | | 1,240 | |
Royal Dutch Shell PLC, Cl A | | | 28,974 | | | | | | | | 805 | |
Royal Dutch Shell PLC ADR, Cl A | | | 35,237 | | | | | | | | 1,959 | |
| | | | | | | | | | | | |
| | | |
| | | | | | | | | | | 6,499 | |
| | | | | | | | | | | | |
| | | |
Norway — 1.1% | | | | | | | | | | | | |
DNB ASA | | | 99,951 | | | | | | | | 1,612 | |
| | | | | | | | | | | | |
| | | | |
| Description | | Shares | | | | | | Market Value
($ Thousands) | |
| | | | | | | | | | | | |
| | | |
FOREIGN COMMON STOCK (continued) | | | | | | | | | | | | |
Equinor ASA ADR | | | 83,157 | | | | | | | $ | 1,415 | |
| | | | | | | | | | | | |
| | | | | | | | | | | 3,027 | |
| | | | | | | | | | | | |
| | | |
Puerto Rico — 0.0% | | | | | | | | | | | | |
OFG Bancorp | | | 2,668 | | | | | | | | 55 | |
| | | | | | | | | | | | |
| | | |
Singapore — 0.6% | | | | | | | | | | | | |
DBS Group Holdings Ltd | | | 84,600 | | | | | | | | 1,496 | |
| | | | | | | | | | | | |
| | | |
South Korea — 0.4% | | | | | | | | | | | | |
Samsung Electronics Co Ltd | | | 28,171 | | | | | | | | 1,023 | |
| | | | | | | | | | | | |
| | | |
Spain — 0.6% | | | | | | | | | | | | |
Amadeus IT Group SA, Cl A | | | 23,403 | | | | | | | | 1,746 | |
| | | | | | | | | | | | |
| | | |
Switzerland — 0.5% | | | | | | | | | | | | |
Credit Suisse Group AG ADR | | | 118,020 | | | | | | | | 1,378 | |
| | | | | | | | | | | | |
| | | |
Taiwan — 1.2% | | | | | | | | | | | | |
ASE Technology Holding Co Ltd | | | 356,700 | | | | | | | | 811 | |
Hon Hai Precision Industry Co Ltd | | | 376,960 | | | | | | | | 890 | |
Taiwan Semiconductor Manufacturing Co Ltd | | | 194,000 | | | | | | | | 1,600 | |
| | | | | | | | | | | | |
| | | | | | | | | | | 3,301 | |
| | | | | | | | | | | | |
| | | |
United Kingdom — 2.4% | | | | | | | | | | | | |
Barclays PLC | | | 371,460 | | | | | | | | 618 | |
BP PLC ADR | | | 42,703 | | | | | | | | 1,578 | |
Diageo PLC | | | 36,945 | | | | | | | | 1,576 | |
HSBC Holdings PLC | | | 193,316 | | | | | | | | 1,392 | |
ITV PLC | | | 297,246 | | | | | | | | 420 | |
Rio Tinto PLC ADR | | | 19,393 | | | | | | | | 981 | |
| | | | | | | | | | | | |
| | | | | | | | | | | 6,565 | |
| | | | | | | | | | | | |
| | | |
Total Foreign Common Stock
(Cost $58,151) ($ Thousands) | | | | | | | | | | | 60,862 | |
| | | | | | | | | | | | |
| | | |
CASH EQUIVALENT — 3.3% | | | | | | | | | | | | |
SEI Daily Income Trust, Government Fund, Cl F | | | | | | | | | | | | |
1.970% **† | | | 9,010,128 | | | | | | | | 9,010 | |
| | | | | | | | | | | | |
| | | |
Total Cash Equivalent
(Cost $9,010) ($ Thousands) | | | | | | | | | | | 9,010 | |
| | | | | | | | | | | | |
| | | |
Total Investments in Securities — 99.6% (Cost $234,171) ($ Thousands) | | | | | | | | | | $ | 270,713 | |
| | | | | | | | | | | | |
A list of the open futures contracts held by the Fund at August 31, 2019, is as follows:
| | | | | | | | | | | | | | | | | | | | |
| | | | | | |
| Type of Contract | | Number of
Contracts
Long | | | Expiration
Date | | | Notional Amount
(Thousands) | | | Value
(Thousands) | | | Unrealized
Depreciation
(Thousands) | |
Russell 2000 IndexE-MINI | | | 14 | | | | Sep-2019 | | | | $ 1,079 | | | | $ 1,046 | | | | $ (33 | ) |
S&P 500 IndexE-MINI | | | 52 | | | | Sep-2019 | | | | 7,634 | | | | 7,604 | | | | (30 | ) |
| | | | | | | | | | | | | | | | | | | | |
| | | | | | | | | | | $ 8,713 | | | | $ 8,650 | | | | $ (63 | ) |
| | | | | | | | | | | | | | | | | | | | |
| | |
| Percentages are based on Net Assets of $271,934 ($ Thousands). | | ** Rate shown is the7-day effective yield as of August 31, 2019. |
* Non-income producing security. | | † Investment in Affiliated Security (see Note 5). |
| | ‡ Real Estate Investment Trust. |
| | |
| SEI Catholic Values Trust / Semi-Annual Report / August 31, 2019 | | 7 |
SCHEDULE OF INVESTMENTS (Unaudited)
August 31, 2019
Catholic Values Equity Fund(Concluded)
ADR — American Depositary Receipt
Cl — Class
PLC — Public Limited Company
S&P— Standard & Poor’s
As of August 31, 2019, all of the Fund’s investments and other financial instruments were considered Level 1, in accordance with the authoritative guidance on fair value measurements and disclosure under U.S. GAAP.
For the period ended August 31, 2019, there were no transfers between Level 1 and Level 2 assets and liabilities. For the period ended August 31, 2019, there were no transfers between Level 2 and Level 3 assets and liabilities. For the period ended August 31, 2019, there were no Level 3 securities.
The following is a summary of the Fund’s transactions with affiliates for the period ended August 31, 2019 ($ Thousands):
| | | | | | | | | | | | | | | | | | | | | | | | | | | | | | | | | | | | |
| Security Description | | Value 2/28/19 | | | Purchases at
Cost | | | Proceeds from Sales | | | Realized Gain
(Loss) | | | Change in
Unrealized
Appreciation
(Depreciation) | | | Value 8/31/19 | | | Shares | | | Income | | | Capital Gains | |
SEI Daily Income Trust, Government Fund, Cl F | | $ | 5,352 | | | $ | 17,829 | | | $ | (14,171) | | | $ | — | | | $ | — | | | $ | 9,010 | | | | 9,010,128 | | | $ | 86 | | | $ | — | |
| | | | | | | | | | | | | | | | | | | | | | | | | | | | | | | | | | | | |
The accompanying notes are an integral part of the financial statements.
| | |
| 8 | | SEI Catholic Values Trust / Semi-Annual Report / August 31, 2019 |
SCHEDULE OF INVESTMENTS (Unaudited)
August 31, 2019
Catholic Values Fixed Income Fund
Sector Weightings†:

† Percentages based on total investments.
| | | | | | | | | | | | |
| | | | |
| Description | | Face Amount
(Thousands) | | | | | | Market Value ($ Thousands) | |
| | | | | | | | | | | | |
|
MORTGAGE-BACKED SECURITIES — 38.3% | |
|
Agency Mortgage-Backed Obligations — 30.8% | |
FHLMC | | | | | | | | | | | | |
6.000%, 03/01/2035 to 07/01/2040 | | $ | 611 | | | | | | | $ | 700 | |
5.500%, 04/01/2030 | | | 228 | | | | | | | | 246 | |
5.000%, 06/01/2041 to 01/01/2049 | | | 384 | | | | | | | | 420 | |
4.500%, 06/01/2038 to 07/01/2047 | | | 821 | | | | | | | | 883 | |
4.000%, 07/01/2037 to 05/01/2049 | | | 2,623 | | | | | | | | 2,756 | |
3.500%, 03/01/2043 to 12/01/2048 | | | 908 | | | | | | | | 945 | |
3.000%, 09/01/2036 to 09/01/2049 | | | 5,026 | | | | | | | | 5,177 | |
FHLMC CMO, Ser 2012-4057, Cl CS, IO | | | | | | | | | | | | |
3.855%, VAR LIBOR USD 1 Month+6.050%, 04/15/2039 | | | 21 | | | | | | | | 1 | |
FHLMC CMO,Ser 2014-328, Cl S4, IO | | | | | | | | | | | | |
2.003%, 02/15/2038 (A) | | | 56 | | | | | | | | 4 | |
FHLMC CMO, Ser 2014-4415, Cl IO, IO | | | | | | | | | | | | |
1.867%, 04/15/2041 (A) | | | 271 | | | | | | | | 15 | |
FHLMC CMO, Ser 2015-4494, Cl AI, IO | | | | | | | | | | | | |
1.994%, 11/15/2038 (A) | | | 289 | | | | | | | | 15 | |
FHLMC CMO, Ser 2018-4813, Cl CJ | | | | | | | | | | | | |
3.000%, 08/15/2048 | | | 148 | | | | | | | | 148 | |
FHLMC Multifamily Structured Pass Through Certificates, Ser K091, Cl A2 | | | | | | | | | | | | |
3.505%, 03/25/2029 | | | 80 | | | | | | | | 90 | |
FHLMC Structured Agency Credit Risk Debt Notes, Ser 2016-DNA2, Cl M3 | | | | | | | | | | | | |
6.795%, VAR ICE LIBOR USD 1 Month+4.650%, 10/25/2028 | | | 340 | | | | | | | | 362 | |
FHLMC Structured Agency Credit Risk Debt Notes, Ser 2016-DNA4, Cl M2 | | | | | | | | | | | | |
3.445%, VAR ICE LIBOR USD 1 Month+1.300%, 03/25/2029 | | | 170 | | | | | | | | 170 | |
FHLMC TBA | | | | | | | | | | | | |
3.000%, 09/25/2049 | | | 300 | | | | | | | | 307 | |
FNMA | | | | | | | | | | | | |
5.000%, 10/01/2033 to 02/01/2049 | | | 2,996 | | | | | | | | 3,301 | |
| | | | | | | | | | | | |
| | | | |
| Description | | Face Amount
(Thousands) | | | | | | Market Value ($ Thousands) | |
| | | | | | | | | | | | |
|
MORTGAGE-BACKED SECURITIES (continued) | |
4.500%, 07/01/2033 to 09/01/2057 | | $ | 2,740 | | | | | | | $ | 2,947 | |
4.000%, 04/01/2036 to 06/01/2057 | | | 4,364 | | | | | | | | 4,616 | |
3.525%, 02/01/2029 | | | 300 | | | | | | | | 336 | |
3.500%, 10/01/2037 to 03/01/2057 | | | 6,424 | | | | | | | | 6,700 | |
3.350%, 05/01/2029 | | | 10 | | | | | | | | 11 | |
3.260%, 05/01/2029 | | | 30 | | | | | | | | 33 | |
3.240%, 05/01/2029 | | | 40 | | | | | | | | 44 | |
3.160%, 05/01/2029 | | | 20 | | | | | | | | 22 | |
3.000%, 12/01/2037 to 09/01/2049 | | | 3,000 | | | | | | | | 3,097 | |
2.810%, 04/01/2025 | | | 40 | | | | | | | | 42 | |
2.790%, 08/01/2029 | | | 100 | | | | | | | | 106 | |
2.765%, 08/01/2031 | | | 100 | | | | | | | | 105 | |
2.450%, 08/01/2031 | | | 100 | | | | | | | | 100 | |
FNMA CMO,Ser 2015-55, Cl IO, IO | | | | | | | | | | | | |
1.681%, 08/25/2055 (A) | | | 228 | | | | | | | | 13 | |
FNMA CMO,Ser 2015-56, Cl AS, IO | | | | | | | | | | | | |
4.005%, VAR LIBOR USD 1 Month+6.150%, 08/25/2045 | | | 256 | | | | | | | | 58 | |
FNMA Connecticut Avenue Securities,Ser 2016-C04, Cl 1M2 | | | | | | | | | | | | |
6.395%, VAR ICE LIBOR USD 1 Month+4.250%, 01/25/2029 | | | 50 | | | | | | | | 53 | |
FNMA Connecticut Avenue Securities,Ser 2018-C05, Cl 1M2 | | | | | | | | | | | | |
4.495%, VAR ICE LIBOR USD 1 Month+2.350%, 01/25/2031 | | | 250 | | | | | | | | 253 | |
FNMA TBA | | | | | | | | | | | | |
5.000%, 09/01/2037 | | | 200 | | | | | | | | 214 | |
4.500%, 10/15/2033 | | | 800 | | | | | | | | 842 | |
3.500%, 09/01/2040 | | | 2,100 | | | | | | | | 2,176 | |
3.000%, 09/13/2042 to 09/25/2049 | | | 400 | | | | | | | | 409 | |
FNMA,Ser 2019-M1, Cl A2 | | | | | | | | | | | | |
3.673%, 09/25/2028 (A) | | | 190 | | | | | | | | 212 | |
FNMA,Ser 2019-M4, Cl A2 | | | | | | | | | | | | |
3.610%, 02/25/2031 | | | 40 | | | | | | | | 46 | |
FNMA,Ser 2019-M5, Cl A2 | | | | | | | | | | | | |
3.273%, 01/25/2029 | | | 70 | | | | | | | | 76 | |
FNMA,Ser 2019-M6, Cl A2 | | | | | | | | | | | | |
3.450%, 01/01/2029 | | | 70 | | | | | | | | 78 | |
GNMA | | | | | | | | | | | | |
5.000%, 04/15/2048 to 01/20/2049 | | | 655 | | | | | | | | 695 | |
4.500%, 01/15/2042 to 01/20/2049 | | | 2,372 | | | | | | | | 2,521 | |
4.000%, 08/15/2045 to 08/20/2048 | | | 1,088 | | | | | | | | 1,151 | |
3.500%, 01/20/2047 to 02/20/2048 | | | 516 | | | | | | | | 542 | |
3.000%, 09/15/2042 to 04/20/2048 | | | 804 | | | | | | | | 830 | |
GNMA CMO,Ser 2007-51, Cl SG, IO | | | | | | | | | | | | |
4.408%, VAR LIBOR USD 1 Month+6.580%, 08/20/2037 | | | 13 | | | | | | | | 2 | |
GNMA CMO,Ser 2012-34, Cl SA, IO | | | | | | | | | | | | |
3.878%, VAR LIBOR USD 1 Month+6.050%, 03/20/2042 | | | 147 | | | | | | | | 29 | |
| | |
| SEI Catholic Values Trust / Semi-Annual Report / August 31, 2019 | | 9 |
SCHEDULE OF INVESTMENTS (Unaudited)
August 31, 2019
Catholic Values Fixed Income Fund(Continued)
| | | | | | | | | | | | |
| | | | |
| Description | | Face Amount
(Thousands) | | | | | | Market Value
($ Thousands) | |
| | | | | | | | | | | | |
|
MORTGAGE-BACKED SECURITIES (continued) | |
GNMA CMO,Ser 2012-43, Cl SN, IO | | | | | | | | | | | | |
4.403%, VAR LIBOR USD 1 Month+6.600%, 04/16/2042 | | $ | 126 | | | | | | | $ | 26 | |
GNMA CMO,Ser 2012-H27, Cl AI, IO | | | | | | | | | | | | |
1.740%, VAR ICE LIBOR USD 1 Month0.000%, 10/20/2062 | | | 97 | | | | | | | | 5 | |
GNMA CMO,Ser 2014-118, Cl HS, IO | | | | | | | | | | | | |
4.028%, VAR LIBOR USD 1 Month+6.200%, 08/20/2044 | | | 267 | | | | | | | | 54 | |
GNMA TBA | | | | | | | | | | | | |
4.500%, 09/15/2039 | | | 500 | | | | | | | | 523 | |
3.500%, 09/15/2041 | | | 1,600 | | | | | | | | 1,663 | |
3.000%, 09/01/2042 | | | 300 | | | | | | | | 309 | |
GNMA,Ser 2018-130, Cl A | | | | | | | | | | | | |
3.250%, 05/16/2059 | | | 99 | | | | | | | | 102 | |
| | | | | | | | | | | | |
| | | |
| | | | | | | | | | | 46,581 | |
| | | | | | | | | | | | |
|
Non-Agency Mortgage-Backed Obligations — 7.5% | |
BANK, Ser 2017-BNK8, Cl XA, IO | | | | | | | | | | | | |
0.881%, 11/15/2050 (A) | | | 1,649 | | | | | | | | 85 | |
BBCCRE Trust,Ser 2015-GTP, Cl D | | | | | | | | | | | | |
4.715%, 08/10/2033 (A)(B) | | | 140 | | | | | | | | 143 | |
Chevy Chase Funding Mortgage-Backed Certificates,Ser 2004-2A, Cl B1 | | | | | | | | | | | | |
2.901%, 05/25/2035 (A)(B) | | | 220 | | | | | | | | 174 | |
Chevy Chase Funding Mortgage-Backed Certificates,Ser 2004-2A, Cl A1 | | | | | | | | | | | | |
2.415%, VAR ICE LIBOR USD 1 Month+0.270%, 05/25/2035 (B) | | | 128 | | | | | | | | 126 | |
CIT Mortgage Loan Trust,Ser 2007-1, Cl 1M1 | | | | | | | | | | | | |
3.645%, VAR ICE LIBOR USD 1 Month+1.500%, 10/25/2037 (B) | | | 120 | | | | | | | | 122 | |
COMM Mortgage Trust,Ser 2013-CR6, Cl B | | | | | | | | | | | | |
3.397%, 03/10/2046 (B) | | | 100 | | | | | | | | 103 | |
COMM Mortgage Trust,Ser 2013-CR8, Cl A4 | | | | | | | | | | | | |
3.334%, 06/10/2046 | | | 385 | | | | | | | | 400 | |
COMM Mortgage Trust, Ser 2015-CR24, Cl AM | | | | | | | | | | | | |
4.028%, 08/10/2048 (A) | | | 90 | | | | | | | | 98 | |
Credit Suisse Mortgage Capital Certificates, Ser 2019-ICE4, Cl F | | | | | | | | | | | | |
4.845%, VAR ICE LIBOR USD 1 Month+2.650%, 05/15/2036 (B) | | | 190 | | | | | | | | 191 | |
CSAIL Commercial Mortgage Trust, Ser 2015-C2, Cl AS | | | | | | | | | | | | |
3.849%, 06/15/2057 (A) | | | 210 | | | | | | | | 224 | |
CSMC Trust,Ser 2017-HL1, Cl A3 | | | | | | | | | | | | |
3.500%, 06/25/2047 (A)(B) | | | 226 | | | | | | | | 229 | |
CSMC Trust, Ser 2017-TIME, Cl A | | | | | | | | | | | | |
3.646%, 11/13/2039 (B) | | | 100 | | | | | | | | 107 | |
CSMC Trust,Ser 2018-J1, Cl A2 | | | | | | | | | | | | |
3.500%, 02/25/2048 (A)(B) | | | 626 | | | | | | | | 630 | |
| | | | | | | | | | | | |
| | | | |
| Description | | Face Amount
(Thousands) | | | | | | Market Value
($ Thousands) | |
| | | | | | | | | | | | |
|
MORTGAGE-BACKED SECURITIES (continued) | |
EverBank Mortgage Loan Trust, Ser 2018-1, Cl A22 | | | | | | | | | | | | |
3.500%, 02/25/2048 (A)(B) | | $ | 224 | | | | | | | $ | 227 | |
First Franklin Mortgage Loan Trust, Ser 2006-FF15, Cl A5 | | | | | | | | | | | | |
2.305%, VAR ICE LIBOR USD 1 Month+0.160%, 11/25/2036 | | | 224 | | | | | | | | 219 | |
GS Mortgage Securities Trust, Ser 2006-GG8, Cl AJ | | | | | | | | | | | | |
5.622%, 11/10/2039 | | | 106 | | | | | | | | 93 | |
GS Mortgage Securities Trust, Ser 2010-C1, Cl A2 | | | | | | | | | | | | |
4.592%, 08/10/2043 (B) | | | 735 | | | | | | | | 744 | |
GS Mortgage Securities Trust, Ser 2012-GC6, Cl AS | | | | | | | | | | | | |
4.948%, 01/10/2045 (B) | | | 200 | | | | | | | | 212 | |
GS Mortgage Securities Trust, Ser 2012-GCJ7, Cl A4 | | | | | | | | | | | | |
3.377%, 05/10/2045 | | | 373 | | | | | | | | 380 | |
GS Mortgage Securities Trust, Ser 2018- SRP5, Cl A | | | | | | | | | | | | |
3.281%, 06/09/2021 | | | 190 | | | | | | | | 187 | |
GS Mortgage Securities Trust, Ser 2018- SRP5, Cl B | | | | | | | | | | | | |
4.481%, 06/09/2021 | | | 190 | | | | | | | | 187 | |
Impac CMB Trust, Ser 2005-4, Cl 1M1 | | | | | | | | | | | | |
2.790%, VAR ICE LIBOR USD 1 Month+0.645%, 05/25/2035 | | | 55 | | | | | | | | 53 | |
Impac Secured Assets Trust, Ser 2006-2, Cl 2M3 | | | | | | | | | | | | |
3.245%, VAR ICE LIBOR USD 1 Month+1.100%, 08/25/2036 | | | 173 | | | | | | | | 175 | |
JPMDB Commercial Mortgage Securities Trust, Ser 2017-C7, Cl XA, IO | | | | | | | | | | | | |
1.046%, 10/15/2050 (A) | | | 1,465 | | | | | | | | 82 | |
JPMorgan Chase Commercial Mortgage Securities Trust, Ser 2012-C6, Cl A3 | | | | | | | | | | | | |
3.507%, 05/15/2045 | | | 176 | | | | | | | | 183 | |
JPMorgan Chase Commercial Mortgage Securities Trust, Ser 2012-CIBX, Cl A4 | | | | | | | | | | | | |
3.483%, 06/15/2045 | | | 440 | | | | | | | | 452 | |
JPMorgan Mortgage Trust, Ser 2005-S2, Cl 2A15 | | | | | | | | | | | | |
6.000%, 09/25/2035 | | | 162 | | | | | | | | 159 | |
JPMorgan Mortgage Trust, Ser 2016-1, Cl A5 | | | | | | | | | | | | |
3.500%, 05/25/2046 (A)(B) | | | 209 | | | | | | | | 211 | |
JPMorgan Mortgage Trust, Ser 2016-4, Cl A5 | | | | | | | | | | | | |
3.500%, 10/25/2046 (A)(B) | | | 83 | | | | | | | | 84 | |
JPMorgan Mortgage Trust, Ser 2018-3, Cl A1 | | | | | | | | | | | | |
3.500%, 09/25/2048 (A)(B) | | | 260 | | | | | | | | 265 | |
JPMorgan Mortgage Trust, Ser 2018-4, Cl A1 | | | | | | | | | | | | |
3.500%, 10/25/2048 (A)(B) | | | 130 | | | | | | | | 132 | |
| | |
| 10 | | SEI Catholic Values Trust / Semi-Annual Report / August 31, 2019 |
| | | | | | | | | | | | |
| | | | |
| Description | | Face Amount
(Thousands) | | | | | | Market Value
($ Thousands) | |
| | | | | | | | | | | | |
|
MORTGAGE-BACKED SECURITIES (continued) | |
JPMorgan Mortgage Trust, Ser 2018-5, Cl A1 | | | | | | | | | | | | |
3.500%, 10/25/2048 (A)(B) | | $ | 440 | | | | | | | $ | 448 | |
JPMorgan Mortgage Trust, Ser 2018-6, Cl 1A4 | | | | | | | | | | | | |
3.500%, 12/25/2048 (A)(B) | | | 345 | | | | | | | | 349 | |
Morgan Stanley Bank of America Merrill Lynch Trust, Ser 2015-C23, Cl B | | | | | | | | | | | | |
4.268%, 07/15/2050 (A) | | | 100 | | | | | | | | 108 | |
Morgan Stanley Bank of America Merrill Lynch Trust, Ser 2016-C32, Cl ASB | | | | | | | | | | | | |
3.514%, 12/15/2049 | | | 283 | | | | | | | | 301 | |
Morgan Stanley Capital I Trust, Ser 2007-IQ16, Cl AJ | | | | | | | | | | | | |
6.458%, 12/12/2049 (A) | | | 28 | | | | | | | | 17 | |
Morgan Stanley Capital I Trust, Ser 2019-BPR, Cl A | | | | | | | | | | | | |
3.595%, VAR ICE LIBOR USD 1 Month+1.400%, 05/15/2036 (B) | | | 140 | | | | | | | | 140 | |
MSCG Trust, Ser 2015-ALDR, Cl A2 | | | | | | | | | | | | |
3.577%, 06/07/2035 (A)(B) | | | 110 | | | | | | | | 116 | |
Natixis Commercial Mortgage Securities Trust, Ser 2019-FAME, Cl A | | | | | | | | | | | | |
3.047%, 08/05/2024 (B) | | | 110 | | | | | | | | 113 | |
Option One Mortgage Loan Trust, Ser 2007-FXD1, Cl 3A4 | | | | | | | | | | | | |
5.860%, 01/25/2037 | | | 124 | | | | | | | | 125 | |
Reperforming Loan REMIC Trust, Ser 2005-R2, Cl 2A3 | | | | | | | | | | | | |
8.000%, 06/25/2035 (B) | | | 75 | | | | | | | | 78 | |
Rosslyn Portfolio Trust, Ser 2017-R17, Cl A | | | | | | | | | | | | |
3.145%, VAR ICE LIBOR USD 1 Month+0.950%, 06/15/2033 (B) | | | 100 | | | | | | | | 100 | |
Seasoned Credit Risk Transfer Trust, Ser 2019-2, Cl MA | | | | | | | | | | | | |
3.500%, 08/25/2058 | | | 224 | | | | | | | | 237 | |
Sequoia Mortgage Trust, Ser 2017-1, Cl A4 | | | | | | | | | | | | |
3.500%, 02/25/2047 (A)(B) | | | 279 | | | | | | | | 283 | |
Sequoia Mortgage Trust, Ser 2017-4, Cl A4 | | | | | | | | | | | | |
3.500%, 07/25/2047 (A)(B) | | | 150 | | | | | | | | 153 | |
Sequoia Mortgage Trust, Ser 2017-6, Cl A4 | | | | | | | | | | | | |
3.500%, 09/25/2047 (A)(B) | | | 161 | | | | | | | | 163 | |
UBS Commercial Mortgage Trust, Ser 2012-C1, Cl A3 | | | | | | | | | | | | |
3.400%, 05/10/2045 | | | 630 | | | | | | | | 648 | |
UBS Commercial Mortgage Trust, Ser 2018-C13, Cl ASB | | | | | | | | | | | | |
4.241%, 10/15/2051 | | | 532 | | | | | | | | 603 | |
Wells Fargo Commercial Mortgage Trust, Ser 2015-C28, Cl AS | | | | | | | | | | | | |
3.872%, 05/15/2048 (A) | | | 270 | | | | | | | | 290 | |
WFRBS Commercial Mortgage Trust, Ser 2011-C4, Cl A4 | | | | | | | | | | | | |
4.902%, 06/15/2044 (A)(B) | | | 359 | | | | | | | | 373 | |
| | | | | | | | | | | | |
| | | | |
| Description | | Face Amount
(Thousands) | | | | | | Market Value
($ Thousands) | |
| | | | | | | | | | | | |
|
MORTGAGE-BACKED SECURITIES (continued) | |
WFRBS Commercial Mortgage Trust, Ser 2013-UBSS1, Cl A2 | | | | | | | | | | | | |
2.927%, 03/15/2046 | | $ | 10 | | | | | | | $ | 10 | |
| | | | | | | | | | | | |
| | | |
| | | | | | | | | | | 11,332 | |
| | | | | | | | | | | | |
| | | |
Total Mortgage-Backed Securities (Cost $56,739) ($ Thousands) | | | | | | | | | | | 57,913 | |
| | | | | | | | | | | | |
|
CORPORATE OBLIGATIONS — 32.9% | |
|
Communication Services — 3.2% | |
AT&T | | | | | | | | | | | | |
5.350%, 09/01/2040 | | | 1 | | | | | | | | 1 | |
4.500%, 03/09/2048 | | | 130 | | | | | | | | 143 | |
4.350%, 06/15/2045 | | | 20 | | | | | | | | 21 | |
3.616%, VAR ICE LIBOR USD 3 Month+1.180%, 06/12/2024 | | | 462 | | | | | | | | 469 | |
3.600%, 07/15/2025 | | | 135 | | | | | | | | 142 | |
3.400%, 05/15/2025 | | | 438 | | | | | | | | 459 | |
CCO Holdings | | | | | | | | | | | | |
5.125%, 05/01/2027 (B) | | | 50 | | | | | | | | 53 | |
5.000%, 02/01/2028 (B) | | | 10 | | | | | | | | 10 | |
Charter Communications Operating | | | | | | | | | | | | |
6.484%, 10/23/2045 | | | 102 | | | | | | | | 126 | |
6.384%, 10/23/2035 | | | 390 | | | | | | | | 476 | |
5.750%, 04/01/2048 | | | 70 | | | | | | | | 81 | |
5.375%, 04/01/2038 | | | 20 | | | | | | | | 23 | |
5.050%, 03/30/2029 | | | 20 | | | | | | | | 23 | |
4.200%, 03/15/2028 | | | 110 | | | | | | | | 117 | |
3.579%, 07/23/2020 | | | 50 | | | | | | | | 50 | |
Comcast | | | | | | | | | | | | |
6.400%, 05/15/2038 | | | 170 | | | | | | | | 245 | |
4.700%, 10/15/2048 | | | 40 | | | | | | | | 50 | |
4.250%, 10/15/2030 | | | 60 | | | | | | | | 70 | |
4.150%, 10/15/2028 | | | 160 | | | | | | | | 181 | |
3.950%, 10/15/2025 | | | 70 | | | | | | | | 77 | |
3.900%, 03/01/2038 | | | 40 | | | | | | | | 45 | |
3.375%, 08/15/2025 | | | 140 | | | | | | | | 149 | |
3.150%, 03/01/2026 | | | 20 | | | | | | | | 21 | |
Comcast Cable Communications Holdings | | | | | | | | | | | | |
9.455%, 11/15/2022 | | | 270 | | | | | | | | 332 | |
Netflix | | | | | | | | | | | | |
5.375%, 02/01/2021 | | | 10 | | | | | | | | 10 | |
Sprint | | | | | | | | | | | | |
7.250%, 09/15/2021 | | | 10 | | | | | | | | 11 | |
Sprint Spectrum | | | | | | | | | | | | |
4.738%, 03/20/2025 (B) | | | 230 | | | | | | | | 244 | |
Telefonica Emisiones | | | | | | | | | | | | |
4.103%, 03/08/2027 | | | 150 | | | | | | | | 164 | |
Telefonica Emisiones SAU | | | | | | | | | | | | |
5.213%, 03/08/2047 | | | 150 | | | | | | | | 175 | |
| | |
| SEI Catholic Values Trust / Semi-Annual Report / August 31, 2019 | | 11 |
SCHEDULE OF INVESTMENTS (Unaudited)
August 31, 2019
Catholic Values Fixed Income Fund(Continued)
| | | | | | | | | | | | |
| | | | |
| Description | | Face Amount
(Thousands) | | | | | | Market Value
($ Thousands) | |
| | | | | | | | | | | | |
|
CORPORATE OBLIGATIONS (continued) | |
Verizon Communications | | | | | | | | | | | | |
5.500%, 03/16/2047 | | $ | 6 | | | | | | | $ | 8 | |
5.250%, 03/16/2037 | | | 20 | | | | | | | | 25 | |
4.862%, 08/21/2046 | | | 20 | | | | | | | | 25 | |
4.522%, 09/15/2048 | | | 261 | | | | | | | | 314 | |
4.500%, 08/10/2033 | | | 170 | | | | | | | | 201 | |
4.329%, 09/21/2028 | | | 50 | | | | | | | | 58 | |
3.500%, 11/01/2024 | | | 20 | | | | | | | | 21 | |
3.376%, 02/15/2025 | | | 19 | | | | | | | | 20 | |
2.625%, 08/15/2026 | | | 10 | | | | | | | | 10 | |
Vodafone Group | | | | | | | | | | | | |
4.375%, 05/30/2028 | | | 110 | | | | | | | | 123 | |
| | | | | | | | | | | | |
| | | |
| | | | | | | | | | | 4,773 | |
| | | | | | | | | | | | |
|
Consumer Discretionary — 2.1% | |
1011778 BC ULC | | | | | | | | | | | | |
4.250%, 05/15/2024 (B) | | | 30 | | | | | | | | 31 | |
Amazon.com | | | | | | | | | | | | |
4.950%, 12/05/2044 | | | 30 | | | | | | | | 40 | |
4.050%, 08/22/2047 | | | 30 | | | | | | | | 37 | |
3.875%, 08/22/2037 | | | 20 | | | | | | | | 23 | |
3.150%, 08/22/2027 | | | 50 | | | | | | | | 54 | |
American Axle & Manufacturing | | | | | | | | | | | | |
6.625%, 10/15/2022 | | | 8 | | | | | | | | 8 | |
BMW US Capital | | | | | | | | | | | | |
1.850%, 09/15/2021 (B) | | | 10 | | | | | | | | 10 | |
Cox Communications | | | | | | | | | | | | |
3.350%, 09/15/2026 (B) | | | 231 | | | | | | | | 240 | |
3.250%, 12/15/2022 (B) | | | 385 | | | | | | | | 396 | |
Daimler Finance North America | | | | | | | | | | | | |
2.700%, 08/03/2020 (B) | | | 180 | | | | | | | | 181 | |
2.550%, 08/15/2022 (B) | | | 297 | | | | | | | | 298 | |
Ford Motor | | | | | | | | | | | | |
4.750%, 01/15/2043 | | | 30 | | | | | | | | 27 | |
General Motors | | | | | | | | | | | | |
6.250%, 10/02/2043 | | | 50 | | | | | | | | 56 | |
5.150%, 04/01/2038 | | | 20 | | | | | | | | 21 | |
General Motors Financial | | | | | | | | | | | | |
4.150%, 06/19/2023 | | | 545 | | | | | | | | 569 | |
3.450%, 04/10/2022 | | | 10 | | | | | | | | 10 | |
2.450%, 11/06/2020 | | | 20 | | | | | | | | 20 | |
Hanesbrands | | | | | | | | | | | | |
4.875%, 05/15/2026 (B) | | | 20 | | | | | | | | 21 | |
Hilton Domestic Operating | | | | | | | | | | | | |
5.125%, 05/01/2026 | | | 10 | | | | | | | | 11 | |
Hilton Worldwide Finance | | | | | | | | | | | | |
4.875%, 04/01/2027 | | | 20 | | | | | | | | 21 | |
Las Vegas Sands | | | | | | | | | | | | |
3.200%, 08/08/2024 | | | 110 | | | | | | | | 112 | |
Lennar | | | | | | | | | | | | |
5.000%, 06/15/2027 | | | 10 | | | | | | | | 11 | |
4.750%, 11/29/2027 | | | 20 | | | | | | | | 22 | |
| | | | | | | | | | | | |
| | | | |
| Description | | Face Amount
(Thousands) | | | | | | Market Value
($ Thousands) | |
| | | | | | | | | | | | |
|
CORPORATE OBLIGATIONS (continued) | |
4.500%, 04/30/2024 | | $ | 20 | | | | | | | $ | 21 | |
McDonald’s MTN | | | | | | | | | | | | |
3.800%, 04/01/2028 | | | 10 | | | | | | | | 11 | |
3.500%, 03/01/2027 | | | 90 | | | | | | | | 97 | |
Myriad International Holdings BV | | | | | | | | | | | | |
4.850%, 07/06/2027 (B) | | | 200 | | | | | | | | 226 | |
Sands China | | | | | | | | | | | | |
5.125%, 08/08/2025 | | | 200 | | | | | | | | 221 | |
Time Warner Cable | | | | | | | | | | | | |
7.300%, 07/01/2038 | | | 90 | | | | | | | | 116 | |
5.875%, 11/15/2040 | | | 30 | | | | | | | | 34 | |
Time Warner Entertainment | | | | | | | | | | | | |
8.375%, 07/15/2033 | | | 120 | | | | | | | | 168 | |
Toll Brothers Finance | | | | | | | | | | | | |
4.375%, 04/15/2023 | | | 20 | | | | | | | | 21 | |
VOC Escrow | | | | | | | | | | | | |
5.000%, 02/15/2028 (B) | | | 30 | | | | | | | | 31 | |
| | | | | | | | | | | | |
| | | |
| | | | | | | | | | | 3,165 | |
| | | | | | | | | | | | |
|
Consumer Staples — 2.8% | |
Altria Group | | | | | | | | | | | | |
6.200%, 02/14/2059 | | | 10 | | | | | | | | 13 | |
5.950%, 02/14/2049 | | | 20 | | | | | | | | 26 | |
5.800%, 02/14/2039 | | | 130 | | | | | | | | 160 | |
4.800%, 02/14/2029 | | | 60 | | | | | | | | 68 | |
4.750%, 05/05/2021 | | | 50 | | | | | | | | 52 | |
4.400%, 02/14/2026 | | | 70 | | | | | | | | 77 | |
3.800%, 02/14/2024 | | | 10 | | | | | | | | 10 | |
3.490%, 02/14/2022 | | | 20 | | | | | | | | 21 | |
2.850%, 08/09/2022 | | | 20 | | | | | | | | 20 | |
Anheuser-Busch | | | | | | | | | | | | |
4.900%, 02/01/2046 | | | 638 | | | | | | | | 761 | |
3.650%, 02/01/2026 | | | 60 | | | | | | | | 64 | |
Anheuser-Busch InBev Finance | | | | | | | | | | | | |
3.300%, 02/01/2023 | | | 120 | | | | | | | | 125 | |
2.650%, 02/01/2021 | | | 15 | | | | | | | | 15 | |
Anheuser-Busch InBev Worldwide | | | | | | | | | | | | |
5.550%, 01/23/2049 | | | 50 | | | | | | | | 65 | |
4.750%, 01/23/2029 | | | 70 | | | | | | | | 82 | |
4.150%, 01/23/2025 | | | 40 | | | | | | | | 44 | |
4.000%, 04/13/2028 | | | 20 | | | | | | | | 22 | |
3.500%, 01/12/2024 | | | 100 | | | | | | | | 106 | |
2.500%, 07/15/2022 | | | 60 | | | | | | | | 61 | |
BAT Capital | | | | | | | | | | | | |
4.540%, 08/15/2047 | | | 110 | | | | | | | | 110 | |
3.557%, 08/15/2027 | | | 140 | | | | | | | | 144 | |
Constellation Brands | | | | | | | | | | | | |
4.750%, 11/15/2024 | | | 80 | | | | | | | | 89 | |
Cott Holdings | | | | | | | | | | | | |
5.500%, 04/01/2025 (B) | | | 20 | | | | | | | | 21 | |
CVS Health | | | | | | | | | | | | |
5.125%, 07/20/2045 | | | 60 | | | | | | | | 70 | |
| | |
| 12 | | SEI Catholic Values Trust / Semi-Annual Report / August 31, 2019 |
| | | | | | | | | | | | |
| | | | |
| Description | | Face Amount
(Thousands) | | | | | | Market Value
($ Thousands) | |
| | | | | | | | | | | | |
|
CORPORATE OBLIGATIONS (continued) | |
3.875%, 07/20/2025 | | $ | 18 | | | | | | | $ | 19 | |
CVS Pass-Through Trust | | | | | | | | | | | | |
7.507%, 01/10/2032 (B) | | | 404 | | | | | | | | 505 | |
6.036%, 12/10/2028 | | | 223 | | | | | | | | 253 | |
Danone | | | | | | | | | | | | |
2.077%, 11/02/2021 (B) | | | 200 | | | | | | | | 199 | |
Diageo Capital | | | | | | | | | | | | |
4.828%, 07/15/2020 | | | 110 | | | | | | | | 113 | |
Kraft Heinz Foods | | | | | | | | | | | | |
5.375%, 02/10/2020 | | | 30 | | | | | | | | 30 | |
3.950%, 07/15/2025 | | | 70 | | | | | | | | 73 | |
Kroger | | | | | | | | | | | | |
4.000%, 02/01/2024 | | | 407 | | | | | | | | 437 | |
Lamb Weston Holdings | | | | | | | | | | | | |
4.875%, 11/01/2026 (B) | | | 20 | | | | | | | | 21 | |
Mars | | | | | | | | | | | | |
3.200%, 04/01/2030 (B) | | | 10 | | | | | | | | 11 | |
2.700%, 04/01/2025 (B) | | | 30 | | | | | | | | 31 | |
PepsiCo | | | | | | | | | | | | |
4.600%, 07/17/2045 | | | 40 | | | | | | | | 52 | |
Philip Morris International | | | | | | | | | | | | |
2.900%, 11/15/2021 | | | 10 | | | | | | | | 10 | |
2.500%, 08/22/2022 | | | 50 | | | | | | | | 51 | |
2.500%, 11/02/2022 | | | 50 | | | | | | | | 50 | |
1.875%, 11/01/2019 | | | 70 | | | | | | | | 70 | |
Reynolds American | | | | | | | | | | | | |
5.850%, 08/15/2045 | | | 20 | | | | | | | | 23 | |
3.250%, 06/12/2020 | | | 11 | | | | | | | | 11 | |
Spectrum Brands | | | | | | | | | | | | |
6.625%, 11/15/2022 | | | 10 | | | | | | | | 10 | |
Walgreens Boots Alliance | | | | | | | | | | | | |
3.450%, 06/01/2026 | | | 40 | | | | | | | | 41 | |
Wm Wrigley Jr | | | | | | | | | | | | |
3.375%, 10/21/2020 (B) | | | 30 | | | | | | | | 30 | |
| | | | | | | | | | | | |
| | | |
| | | | | | | | | | | 4,266 | |
| | | | | | | | | | | | |
|
Energy — 4.7% | |
Anadarko Finance | | | | | | | | | | | | |
7.500%, 05/01/2031 | | | 60 | | | | | | | | 80 | |
Anadarko Petroleum | | | | | | | | | | | | |
6.200%, 03/15/2040 | | | 75 | | | | | | | | 92 | |
5.550%, 03/15/2026 | | | 60 | | | | | | | | 68 | |
5.021%, 10/10/2036 (C) | | | 1,000 | | | | | | | | 497 | |
4.850%, 03/15/2021 | | | 16 | | | | | | | | 16 | |
Antero Resources | | | | | | | | | | | | |
5.375%, 11/01/2021 | | | 10 | | | | | | | | 10 | |
Apache | | | | | | | | | | | | |
4.375%, 10/15/2028 | | | 90 | | | | | | | | 93 | |
4.250%, 01/15/2044 | | | 150 | | | | | | | | 136 | |
Blue Racer Midstream | | | | | | | | | | | | |
6.125%, 11/15/2022 (B) | | | 20 | | | | | | | | 20 | |
| | | | | | | | | | | | |
| | | | |
| Description | | Face Amount
(Thousands) | | | | | | Market Value
($ Thousands) | |
| | | | | | | | | | | | |
|
CORPORATE OBLIGATIONS (continued) | |
BP Capital Markets | | | | | | | | | | | | |
3.535%, 11/04/2024 | | $ | 10 | | | | | | | $ | 11 | |
3.506%, 03/17/2025 | | | 100 | | | | | | | | 106 | |
BP Capital Markets America | | | | | | | | | | | | |
3.588%, 04/14/2027 | | | 10 | | | | | | | | 11 | |
3.216%, 11/28/2023 | | | 200 | | | | | | | | 208 | |
Cheniere Corpus Christi Holdings | | | | | | | | | | | | |
5.125%, 06/30/2027 | | | 10 | | | | | | | | 11 | |
Chesapeake Energy | | | | | | | | | | | | |
8.000%, 06/15/2027 | | | 10 | | | | | | | | 7 | |
6.125%, 02/15/2021 | | | 10 | | | | | | | | 10 | |
Chevron | | | | | | | | | | | | |
2.954%, 05/16/2026 | | | 30 | | | | | | | | 32 | |
Cimarex Energy | | | | | | | | | | | | |
3.900%, 05/15/2027 | | | 50 | | | | | | | | 51 | |
Concho Resources | | | | | | | | | | | | |
4.300%, 08/15/2028 | | | 325 | | | | | | | | 354 | |
3.750%, 10/01/2027 | | | 10 | | | | | | | | 10 | |
Continental Resources | | | | | | | | | | | | |
4.500%, 04/15/2023 | | | 70 | | | | | | | | 72 | |
4.375%, 01/15/2028 | | | 20 | | | | | | | | 21 | |
3.800%, 06/01/2024 | | | 10 | | | | | | | | 10 | |
Devon Energy | | | | | | | | | | | | |
5.850%, 12/15/2025 | | | 30 | | | | | | | | 36 | |
5.600%, 07/15/2041 | | | 50 | | | | | | | | 61 | |
5.000%, 06/15/2045 | | | 50 | | | | | | | | 59 | |
Diamondback Energy | | | | | | | | | | | | |
5.375%, 05/31/2025 | | | 10 | | | | | | | | 11 | |
Ecopetrol | | | | | | | | | | | | |
5.875%, 05/28/2045 | | | 100 | | | | | | | | 118 | |
Energy Transfer Operating | | | | | | | | | | | | |
6.250%, 04/15/2049 | | | 10 | | | | | | | | 12 | |
5.500%, 06/01/2027 | | | 121 | | | | | | | | 139 | |
5.250%, 04/15/2029 | | | 20 | | | | | | | | 23 | |
4.950%, 06/15/2028 | | | 10 | | | | | | | | 11 | |
4.500%, 04/15/2024 | | | 50 | | | | | | | | 54 | |
Enterprise Products Operating | | | | | | | | | | | | |
4.150%, 10/16/2028 | | | 290 | | | | | | | | 322 | |
4.050%, 02/15/2022 | | | 123 | | | | | | | | 129 | |
EOG Resources | | | | | | | | | | | | |
4.150%, 01/15/2026 | | | 20 | | | | | | | | 22 | |
ExxonMobil | | | | | | | | | | | | |
4.114%, 03/01/2046 | | | 70 | | | | | | | | 85 | |
3.043%, 03/01/2026 | | | 40 | | | | | | | | 42 | |
Halliburton | | | | | | | | | | | | |
5.000%, 11/15/2045 | | | 40 | | | | | | | | 45 | |
3.800%, 11/15/2025 | | | 50 | | | | | | | | 53 | |
Kerr-McGee | | | | | | | | | | | | |
7.875%, 09/15/2031 | | | 10 | | | | | | | | 14 | |
6.950%, 07/01/2024 | | | 10 | | | | | | | | 12 | |
Kinder Morgan | | | | | | | | | | | | |
5.300%, 12/01/2034 | | | 20 | | | | | | | | 23 | |
| | |
| SEI Catholic Values Trust / Semi-Annual Report / August 31, 2019 | | 13 |
SCHEDULE OF INVESTMENTS (Unaudited)
August 31, 2019
Catholic Values Fixed Income Fund(Continued)
| | | | | | | | | | | | |
| | | | |
| Description | | Face Amount
(Thousands) | | | | | | Market Value
($ Thousands) | |
| | | | | | | | | | | | |
|
CORPORATE OBLIGATIONS (continued) | |
4.300%, 03/01/2028 | | $ | 20 | | | | | | | $ | 22 | |
Kinder Morgan Energy Partners | | | | | | | | | | | | |
4.250%, 09/01/2024 | | | 40 | | | | | | | | 43 | |
3.500%, 03/01/2021 | | | 20 | | | | | | | | 21 | |
3.500%, 09/01/2023 | | | 30 | | | | | | | | 31 | |
MPLX | | | | | | | | | | | | |
5.500%, 02/15/2049 | | | 30 | | | | | | | | 34 | |
4.875%, 06/01/2025 | | | 110 | | | | | | | | 122 | |
4.800%, 02/15/2029 | | | 60 | | | | | | | | 67 | |
4.700%, 04/15/2048 | | | 60 | | | | | | | | 62 | |
4.500%, 04/15/2038 | | | 10 | | | | | | | | 10 | |
Noble Energy | | | | | | | | | | | | |
5.250%, 11/15/2043 | | | 10 | | | | | | | | 11 | |
4.950%, 08/15/2047 | | | 10 | | | | | | | | 11 | |
4.150%, 12/15/2021 | | | 50 | | | | | | | | 52 | |
3.850%, 01/15/2028 | | | 30 | | | | | | | | 31 | |
Oasis Petroleum | | | | | | | | | | | | |
6.875%, 03/15/2022 | | | 10 | | | | | | | | 10 | |
6.875%, 01/15/2023 | | | 9 | | | | | | | | 8 | |
Occidental Petroleum | | | | | | | | | | | | |
4.625%, 06/15/2045 | | | 20 | | | | | | | | 21 | |
4.400%, 04/15/2046 | | | 10 | | | | | | | | 10 | |
4.100%, 02/15/2047 | | | 70 | | | | | | | | 70 | |
3.400%, 04/15/2026 | | | 20 | | | | | | | | 21 | |
3.125%, 02/15/2022 | | | 19 | | | | | | | | 19 | |
3.000%, 02/15/2027 | | | 20 | | | | | | | | 20 | |
2.900%, 08/15/2024 | | | 30 | | | | | | | | 30 | |
2.700%, 08/15/2022 | | | 30 | | | | | | | | 30 | |
2.600%, 08/13/2021 | | | 20 | | | | | | | | 20 | |
Pertamina Persero | | | | | | | | | | | | |
6.000%, 05/03/2042 (B) | | | 200 | | | | | | | | 250 | |
Petrobras Global Finance BV | | | | | | | | | | | | |
7.375%, 01/17/2027 | | | 210 | | | | | | | | 249 | |
6.850%, 06/05/2115 | | | 50 | | | | | | | | 56 | |
5.750%, 02/01/2029 | | | 50 | | | | | | | | 54 | |
5.299%, 01/27/2025 | | | 155 | | | | | | | | 168 | |
Petroleos Mexicanos | | | | | | | | | | | | |
6.625%, 06/15/2035 | | | 100 | | | | | | | | 97 | |
Petroleos Mexicanos MTN | | | | | | | | | | | | |
6.875%, 08/04/2026 | | | 20 | | | | | | | | 21 | |
Phillips 66 Partners | | | | | | | | | | | | |
3.605%, 02/15/2025 | | | 300 | | | | | | | | 313 | |
3.550%, 10/01/2026 | | | 232 | | | | | | | | 242 | |
Range Resources | | | | | | | | | | | | |
5.875%, 07/01/2022 | | | 10 | | | | | | | | 9 | |
4.875%, 05/15/2025 | | | 30 | | | | | | | | 25 | |
Schlumberger Holdings | | | | | | | | | | | | |
4.000%, 12/21/2025 (B) | | | 30 | | | | | | | | 32 | |
3.900%, 05/17/2028 (B) | | | 471 | | | | | | | | 501 | |
Shell International Finance BV | | | | | | | | | | | | |
4.375%, 05/11/2045 | | | 50 | | | | | | | | 61 | |
4.000%, 05/10/2046 | | | 50 | | | | | | | | 59 | |
| | | | | | | | | | | | |
| | | | |
| Description | | Face Amount
(Thousands) | | | | | | Market Value
($ Thousands) | |
| | | | | | | | | | | | |
|
CORPORATE OBLIGATIONS (continued) | |
2.875%, 05/10/2026 | | $ | 80 | | | | | | | $ | 84 | |
Sinopec Group Overseas Development | | | | | | | | | | | | |
4.375%, 04/10/2024 (B) | | | 200 | | | | | | | | 217 | |
Sunoco Logistics Partners Operations | | | | | | | | | | | | |
3.450%, 01/15/2023 | | | 381 | | | | | | | | 391 | |
Targa Resources Partners | | | | | | | | | | | | |
6.875%, 01/15/2029 (B) | | | 10 | | | | | | | | 11 | |
6.500%, 07/15/2027 (B) | | | 10 | | | | | | | | 11 | |
5.875%, 04/15/2026 | | | 10 | | | | | | | | 10 | |
4.250%, 11/15/2023 | | | 10 | | | | | | | | 10 | |
Whiting Petroleum | | | | | | | | | | | | |
5.750%, 03/15/2021 | | | 10 | | | | | | | | 9 | |
Williams | | | | | | | | | | | | |
7.875%, 09/01/2021 | | | 30 | | | | | | | | 33 | |
7.750%, 06/15/2031 | | | 140 | | | | | | | | 190 | |
7.500%, 01/15/2031 | | | 10 | | | | | | | | 13 | |
3.700%, 01/15/2023 | | | 20 | | | | | | | | 21 | |
Williams Partners | | | | | | | | | | | | |
5.250%, 03/15/2020 | | | 20 | | | | | | | | 20 | |
WPX Energy | | | | | | | | | | | | |
8.250%, 08/01/2023 | | | 30 | | | | | | | | 33 | |
| | | | | | | | | | | | |
| | | |
| | | | | | | | | | | 7,163 | |
| | | | | | | | | | | | |
|
Financials — 10.3% | |
Ally Financial | | | | | | | | | | | | |
8.000%, 11/01/2031 | | | 50 | | | | | | | | 70 | |
Ambac Assurance | | | | | | | | | | | | |
5.100%, 06/07/2020 (B) | | | — | | | | | | | | 1 | |
Ambac LSNI | | | | | | | | | | | | |
7.319%, VAR ICE LIBOR USD 3 Month+5.000%, 02/12/2023 (B) | | | 1 | | | | | | | | 1 | |
American Express | | | | | | | | | | | | |
3.400%, 02/27/2023 | | | 412 | | | | | | | | 430 | |
2.650%, 12/02/2022 | | | 140 | | | | | | | | 143 | |
American Express Credit MTN | | | | | | | | | | | | |
2.375%, 05/26/2020 | | | 40 | | | | | | | | 40 | |
American International Group | | | | | | | | | | | | |
3.750%, 07/10/2025 | | | 40 | | | | | | | | 43 | |
Banco Santander | | | | | | | | | | | | |
4.379%, 04/12/2028 | | | 200 | | | | | | | | 220 | |
Bank of America | | | | | | | | | | | | |
3.946%, VAR ICE LIBOR USD 3 Month+1.190%, 01/23/2049 | | | 10 | | | | | | | | 12 | |
3.419%, VAR ICE LIBOR USD 3 Month+1.040%, 12/20/2028 | | | 42 | | | | | | | | 44 | |
3.004%, VAR ICE LIBOR USD 3 Month+0.790%, 12/20/2023 | | | 419 | | | | | | | | 430 | |
Bank of America MTN | | | | | | | | | | | | |
5.000%, 01/21/2044 | | | 70 | | | | | | | | 91 | |
4.450%, 03/03/2026 | | | 10 | | | | | | | | 11 | |
4.330%, VAR ICE LIBOR USD 3 Month+1.520%, 03/15/2050 | | | 258 | | | | | | | | 315 | |
| | |
| 14 | | SEI Catholic Values Trust / Semi-Annual Report / August 31, 2019 |
| | | | | | | | | | | | |
| | | | |
| Description | | Face Amount
(Thousands) | | | | | | Market Value
($ Thousands) | |
| | | | | | | | | | | | |
|
CORPORATE OBLIGATIONS (continued) | |
4.000%, 01/22/2025 | | $ | 300 | | | | | | | $ | 320 | |
3.970%, VAR ICE LIBOR USD 3 Month+1.070%, 03/05/2029 | | | 50 | | | | | | | | 55 | |
3.593%, VAR ICE LIBOR USD 3 Month+1.370%, 07/21/2028 | | | 160 | | | | | | | | 171 | |
3.550%, VAR ICE LIBOR USD 3 Month+0.780%, 03/05/2024 | | | 70 | | | | | | | | 73 | |
3.500%, 04/19/2026 | | | 224 | | | | | | | | 240 | |
Barclays | | | | | | | | | | | | |
5.088%, VAR ICE LIBOR USD 3 Month+3.054%, 06/20/2030 | | | 200 | | | | | | | | 208 | |
Barclays MTN | | | | | | | | | | | | |
4.972%, VAR ICE LIBOR USD 3 Month+1.902%, 05/16/2029 | | | 200 | | | | | | | | 219 | |
Blackstone Holdings Finance | | | | | | | | | | | | |
6.250%, 08/15/2042 (B) | | | 118 | | | | | | | | 163 | |
BNP Paribas | | | | | | | | | | | | |
4.705%, VAR ICE LIBOR USD 3 Month+2.235%, 01/10/2025 (B) | | | 200 | | | | | | | | 217 | |
4.400%, 08/14/2028 (B) | | | 200 | | | | | | | | 223 | |
Brighthouse Financial | | | | | | | | | | | | |
4.700%, 06/22/2047 | | | 50 | | | | | | | | 45 | |
Chubb INA Holdings | | | | | | | | | | | | |
2.300%, 11/03/2020 | | | 10 | | | | | | | | 10 | |
CIT Group | | | | | | | | | | | | |
5.250%, 03/07/2025 | | | 20 | | | | | | | | 22 | |
4.750%, 02/16/2024 | | | 20 | | | | | | | | 22 | |
Citigroup | | | | | | | | | | | | |
8.125%, 07/15/2039 | | | 110 | | | | | | | | 184 | |
4.650%, 07/23/2048 | | | 10 | | | | | | | | 13 | |
4.450%, 09/29/2027 | | | 270 | | | | | | | | 297 | |
4.125%, 07/25/2028 | | | 90 | | | | | | | | 98 | |
3.980%, VAR ICE LIBOR USD 3 Month+1.338%, 03/20/2030 | | | 60 | | | | | | | | 66 | |
3.700%, 01/12/2026 | | | 170 | | | | | | | | 183 | |
3.400%, 05/01/2026 | | | 510 | | | | | | | | 539 | |
Commonwealth Bank of Australia MTN | | | | | | | | | | | | |
3.900%, 07/12/2047 (B) | | | 20 | | | | | | | | 23 | |
Cooperatieve Rabobank UA | | | | | | | | | | | | |
4.375%, 08/04/2025 | | | 250 | | | | | | | | 269 | |
3.875%, 09/26/2023 (B) | | | 392 | | | | | | | | 418 | |
3.125%, 04/26/2021 | | | 250 | | | | | | | | 255 | |
Credit Agricole | | | | | | | | | | | | |
8.125%, VAR USD Swap Semi 30/360 5 Yr Curr+6.185%, 03/23/2168 (B) | | | 260 | | | | | | | | 303 | |
Credit Agricole MTN | | | | | | | | | | | | |
4.000%, VAR USD Swap Semi 30/360 5 Yr Curr+1.644%, 01/10/2033 (B) | | | 250 | | | | | | | | 261 | |
Credit Suisse Group Funding Guernsey | | | | | | | | | | | | |
4.550%, 04/17/2026 | | | 250 | | | | | | | | 277 | |
Danske Bank | | | | | | | | | | | | |
5.000%, 01/12/2022 (B) | | | 200 | | | | | | | | 211 | |
| | | | | | | | | | | | |
| | | | |
| Description | | Face Amount
(Thousands) | | | | | | Market Value
($ Thousands) | |
| | | | | | | | | | | | |
|
CORPORATE OBLIGATIONS (continued) | |
Five Corners Funding Trust | | | | | | | | | | | | |
4.419%, 11/15/2023 (B) | | $ | 200 | | | | | | | $ | 217 | |
HSBC Holdings | | | | | | | | | | | | |
4.583%, VAR ICE LIBOR USD 3 Month+1.535%, 06/19/2029 | | | 600 | | | | | | | | 671 | |
4.250%, 03/14/2024 | | | 200 | | | | | | | | 211 | |
4.041%, VAR ICE LIBOR USD 3 Month+1.546%, 03/13/2028 | | | 200 | | | | | | | | 213 | |
Intesa Sanpaolo | | | | | | | | | | | | |
3.125%, 07/14/2022 (B) | | | 200 | | | | | | | | 201 | |
Intesa Sanpaolo MTN | | | | | | | | | | | | |
5.017%, 06/26/2024 (B) | | | 200 | | | | | | | | 205 | |
KKR Group Finance II | | | | | | | | | | | | |
5.500%, 02/01/2043 (B) | | | 208 | | | | | | | | 258 | |
KKR Group Finance III | | | | | | | | | | | | |
5.125%, 06/01/2044 (B) | | | 215 | | | | | | | | 256 | |
Liberty Mutual Group | | | | | | | | | | | | |
4.569%, 02/01/2029 (B) | | | 49 | | | | | | | | 56 | |
4.250%, 06/15/2023 (B) | | | 15 | | | | | | | | 16 | |
Lloyds Banking Group | | | | | | | | | | | | |
4.375%, 03/22/2028 | | | 200 | | | | | | | | 218 | |
Macquarie Group MTN | | | | | | | | | | | | |
4.150%, VAR ICE LIBOR USD 3 Month+1.330%, 03/27/2024 (B) | | | 374 | | | | | | | | 396 | |
Metropolitan Life Insurance | | | | | | | | | | | | |
7.800%, 11/01/2025 (B) | | | 267 | | | | | | | | 344 | |
Mitsubishi UFJ Financial Group | | | | | | | | | | | | |
2.998%, 02/22/2022 | | | 20 | | | | | | | | 20 | |
Morgan Stanley | | | | | | | | | | | | |
3.737%, VAR ICE LIBOR USD 3 Month+0.847%, 04/24/2024 | | | 120 | | | | | | | | 126 | |
Morgan Stanley MTN | | | | | | | | | | | | |
3.875%, 04/29/2024 | | | 346 | | | | | | | | 371 | |
3.772%, VAR ICE LIBOR USD 3 Month+1.140%, 01/24/2029 | | | 170 | | | | | | | | 184 | |
Navient MTN | | | | | | | | | | | | |
8.000%, 03/25/2020 | | | 40 | | | | | | | | 41 | |
Park Aerospace Holdings | | | | | | | | | | | | |
5.250%, 08/15/2022 (B) | | | 50 | | | | | | | | 53 | |
Peachtree Corners Funding Trust | | | | | | | | | | | | |
3.976%, 02/15/2025 (B) | | | 225 | | | | | | | | 238 | |
Reliance Standard Life Global Funding II MTN | | | | | | | | | | | | |
2.500%, 01/15/2020 (B) | | | 10 | | | | | | | | 10 | |
Royal Bank of Canada MTN | | | | | | | | | | | | |
3.200%, 04/30/2021 | | | 40 | | | | | | | | 41 | |
2.150%, 10/26/2020 | | | 30 | | | | | | | | 30 | |
Royal Bank of Scotland Group | | | | | | | | | | | | |
5.125%, 05/28/2024 | | | 200 | | | | | | | | 212 | |
4.519%, VAR ICE LIBOR USD 3 Month+1.550%, 06/25/2024 | | | 200 | | | | | | | | 210 | |
Santander Holdings USA | | | | | | | | | | | | |
4.500%, 07/17/2025 | | | 10 | | | | | | | | 11 | |
| | |
| SEI Catholic Values Trust / Semi-Annual Report / August 31, 2019 | | 15 |
SCHEDULE OF INVESTMENTS (Unaudited)
August 31, 2019
Catholic Values Fixed Income Fund(Continued)
| | | | | | | | | | | | |
| | | | |
| Description | | Face Amount
(Thousands) | | | | | | Market Value
($ Thousands) | |
| | | | | | | | | | | | |
|
CORPORATE OBLIGATIONS (continued) | |
Santander UK | | | | | | | | | | | | |
2.375%, 03/16/2020 | | $ | 20 | | | | | | | $ | 20 | |
Sumitomo Mitsui Financial Group | | | | | | | | | | | | |
2.058%, 07/14/2021 | | | 30 | | | | | | | | 30 | |
Teachers Insurance & Annuity Association of America | | | | | | | | | | | | |
4.900%, 09/15/2044 (B) | | | 150 | | | | | | | | 189 | |
Toronto-Dominion Bank MTN | | | | | | | | | | | | |
3.250%, 06/11/2021 | | | 50 | | | | | | | | 51 | |
UBS MTN | | | | | | | | | | | | |
4.500%, 06/26/2048 (B) | | | 200 | | | | | | | | 258 | |
UBS Group Funding Jersey | | | | | | | | | | | | |
4.125%, 04/15/2026 (B) | | | 449 | | | | | | | | 491 | |
UBS Group Funding Switzerland | | | | | | | | | | | | |
4.253%, 03/23/2028 (B) | | | 200 | | | | | | | | 221 | |
US Bank | | | | | | | | | | | | |
3.150%, 04/26/2021 | | | 250 | | | | | | | | 254 | |
Voya Financial | | | | | | | | | | | | |
3.125%, 07/15/2024 | | | 258 | | | | | | | | 267 | |
WEA Finance | | | | | | | | | | | | |
3.750%, 09/17/2024 (B) | | | 200 | | | | | | | | 214 | |
2.700%, 09/17/2019 (B) | | | 430 | | | | | | | | 430 | |
Wells Fargo | | | | | | | | | | | | |
4.480%, 01/16/2024 | | | 200 | | | | | | | | 217 | |
3.000%, 10/23/2026 | | | 50 | | | | | | | | 52 | |
Wells Fargo MTN | | | | | | | | | | | | |
4.900%, 11/17/2045 | | | 50 | | | | | | | | 62 | |
4.750%, 12/07/2046 | | | 30 | | | | | | | | 37 | |
4.650%, 11/04/2044 | | | 100 | | | | | | | | 120 | |
4.400%, 06/14/2046 | | | 10 | | | | | | | | 12 | |
4.300%, 07/22/2027 | | | 300 | | | | | | | | 332 | |
3.450%, 02/13/2023 | | | 160 | | | | | | | | 166 | |
Westpac Banking | | | | | | | | | | | | |
2.600%, 11/23/2020 | | | 40 | | | | | | | | 40 | |
2.300%, 05/26/2020 | | | 10 | | | | | | | | 10 | |
| | | | | | | | | | | | |
| | | |
| | | | | | | | | | | 15,518 | |
| | | | | | | | | | | | |
|
Health Care — 1.4% | |
Abbott Laboratories | | | | | | | | | | | | |
4.900%, 11/30/2046 | | | 40 | | | | | | | | 53 | |
4.750%, 11/30/2036 | | | 10 | | | | | | | | 13 | |
3.750%, 11/30/2026 | | | 23 | | | | | | | | 25 | |
Aetna | | | | | | | | | | | | |
2.800%, 06/15/2023 | | | 10 | | | | | | | | 10 | |
Anthem | | | | | | | | | | | | |
3.650%, 12/01/2027 | | | 70 | | | | | | | | 74 | |
3.350%, 12/01/2024 | | | 20 | | | | | | | | 21 | |
2.950%, 12/01/2022 | | | 50 | | | | | | | | 51 | |
Cardinal Health | | | | | | | | | | | | |
3.079%, 06/15/2024 | | | 20 | | | | | | | | 20 | |
2.616%, 06/15/2022 | | | 20 | | | | | | | | 20 | |
| | | | | | | | | | | | |
| | | | |
| Description | | Face Amount
(Thousands) | | | | | | Market Value
($ Thousands) | |
| | | | | | | | | | | | |
|
CORPORATE OBLIGATIONS (continued) | |
Centene | | | | | | | | | | | | |
6.125%, 02/15/2024 | | $ | 20 | | | | | | | $ | 21 | |
5.625%, 02/15/2021 | | | 10 | | | | | | | | 10 | |
5.375%, 06/01/2026 (B) | | | 10 | | | | | | | | 11 | |
4.750%, 05/15/2022 | | | 20 | | | | | | | | 20 | |
Cigna | | | | | | | | | | | | |
4.375%, 10/15/2028 | | | 120 | | | | | | | | 134 | |
4.125%, 11/15/2025 | | | 347 | | | | | | | | 378 | |
3.750%, 07/15/2023 | | | 80 | | | | | | | | 84 | |
3.400%, 09/17/2021 | | | 30 | | | | | | | | 31 | |
CVS Health | | | | | | | | | | | | |
5.050%, 03/25/2048 | | | 20 | | | | | | | | 23 | |
4.300%, 03/25/2028 | | | 310 | | | | | | | | 338 | |
4.100%, 03/25/2025 | | | 40 | | | | | | | | 43 | |
3.700%, 03/09/2023 | | | 180 | | | | | | | | 188 | |
3.350%, 03/09/2021 | | | 16 | | | | | | | | 17 | |
Express Scripts Holding | | | | | | | | | | | | |
3.400%, 03/01/2027 | | | 441 | | | | | | | | 459 | |
Fresenius Medical Care US Finance II | | | | | | | | | | | | |
4.750%, 10/15/2024 (B) | | | 50 | | | | | | | | 54 | |
Medtronic | | | | | | | | | | | | |
3.500%, 03/15/2025 | | | 32 | | | | | | | | 35 | |
| | | | | | | | | | | | |
| | | |
| | | | | | | | | | | 2,133 | |
| | | | | | | | | | | | |
|
Industrials — 3.2% | |
3M | | | | | | | | | | | | |
2.375%, 08/26/2029 | | | 30 | | | | | | | | 30 | |
AerCap Ireland Capital DAC | | | | | | | | | | | | |
4.625%, 10/30/2020 | | | 278 | | | | | | | | 285 | |
Air Canada Pass-Through Trust,Ser 2015-1, Cl A | | | | | | | | | | | | |
3.600%, 03/15/2027 (B) | | | 259 | | | | | | | | 272 | |
American Airlines Pass-Through Trust,Ser 2013-1, Cl B | | | | | | | | | | | | |
5.625%, 01/15/2021 (B) | | | 106 | | | | | | | | 109 | |
American Airlines Pass-Through Trust,Ser 2013-2, Cl A | | | | | | | | | | | | |
4.950%, 01/15/2023 | | | 556 | | | | | | | | 586 | |
Canadian Pacific Railway | | | | | | | | | | | | |
6.125%, 09/15/2115 | | | 127 | | | | | | | | 192 | |
Cintas No. 2 | | | | | | | | | | | | |
3.700%, 04/01/2027 | | | 30 | | | | | | | | 33 | |
2.900%, 04/01/2022 | | | 20 | | | | | | | | 20 | |
Continental Airlines Pass-Through Trust,Ser 2012-2, Cl A | | | | | | | | | | | | |
4.000%, 10/29/2024 | | | 172 | | | | | | | | 182 | |
DAE Funding | | | | | | | | | | | | |
5.750%, 11/15/2023 (B) | | | 10 | | | | | | | | 11 | |
Eaton | | | | | | | | | | | | |
4.150%, 11/02/2042 | | | 70 | | | | | | | | 79 | |
FedEx | | | | | | | | | | | | |
4.050%, 02/15/2048 | | | 237 | | | | | | | | 242 | |
| | |
| 16 | | SEI Catholic Values Trust / Semi-Annual Report / August 31, 2019 |
| | | | | | | | | | | | |
| | | | |
| Description | | Face Amount
(Thousands) | | | | | | Market Value
($ Thousands) | |
| | | | | | | | | | | | |
|
CORPORATE OBLIGATIONS (continued) | |
Ferguson Finance | | | | | | | | | | | | |
4.500%, 10/24/2028 (B) | | $ | 394 | | | | | | | $ | 425 | |
International Lease Finance | | | | | | | | | | | | |
8.625%, 01/15/2022 | | | 20 | | | | | | | | 23 | |
5.875%, 08/15/2022 | | | 50 | | | | | | | | 55 | |
Norfolk Southern | | | | | | | | | | | | |
4.837%, 10/01/2041 | | | 200 | | | | | | | | 247 | |
Penske Truck Leasing LP | | | | | | | | | | | | |
3.900%, 02/01/2024 (B) | | | 457 | | | | | | | | 483 | |
Republic Services | | | | | | | | | | | | |
2.500%, 08/15/2024 | | | 20 | | | | | | | | 20 | |
Ryder System MTN | | | | | | | | | | | | |
3.875%, 12/01/2023 | | | 432 | | | | | | | | 459 | |
Spirit Airlines Pass-Through Trust,Ser 2017-1AA | | | | | | | | | | | | |
3.375%, 02/15/2030 | | | 190 | | | | | | | | 202 | |
United Airlines Pass-Through Trust, Ser 2014-1, Cl A | | | | | | | | | | | | |
4.000%, 04/11/2026 | | | 651 | | | | | | | | 696 | |
United Rentals North America | | | | | | | | | | | | |
6.500%, 12/15/2026 | | | 10 | | | | | | | | 11 | |
5.875%, 09/15/2026 | | | 30 | | | | | | | | 32 | |
4.875%, 01/15/2028 | | | 20 | | | | | | | | 21 | |
Waste Management | | | | | | | | | | | | |
4.150%, 07/15/2049 | | | 20 | | | | | | | | 24 | |
3.500%, 05/15/2024 | | | 60 | | | | | | | | 64 | |
3.450%, 06/15/2029 | | | 10 | | | | | | | | 11 | |
3.200%, 06/15/2026 | | | 20 | | | | | | | | 21 | |
| | | | | | | | | | | | |
| | | |
| | | | | | | | | | | 4,835 | |
| | | | | | | | | | | | |
|
Information Technology — 1.3% | |
Apple | | | | | | | | | | | | |
3.200%, 05/13/2025 | | | 80 | | | | | | | | 86 | |
2.000%, 11/13/2020 | | | 30 | | | | | | | | 30 | |
1.550%, 08/04/2021 | | | 150 | | | | | | | | 149 | |
Broadcom | | | | | | | | | | | | |
3.625%, 10/15/2024 (B) | | | 224 | | | | | | | | 227 | |
3.125%, 01/15/2025 | | | 30 | | | | | | | | 30 | |
Diamond 1 Finance | | | | | | | | | | | | |
4.420%, 06/15/2021 (B) | | | 140 | | | | | | | | 144 | |
Hewlett Packard Enterprise | | | | | | | | | | | | |
4.400%, 10/15/2022 | | | 69 | | | | | | | | 73 | |
Microsoft | | | | | | | | | | | | |
4.450%, 11/03/2045 | | | 40 | | | | | | | | 52 | |
4.100%, 02/06/2037 | | | 10 | | | | | | | | 12 | |
3.300%, 02/06/2027 | | | 130 | | | | | | | | 142 | |
2.875%, 02/06/2024 | | | 60 | | | | | | | | 63 | |
2.700%, 02/12/2025 | | | 20 | | | | | | | | 21 | |
2.400%, 02/06/2022 | | | 70 | | | | | | | | 71 | |
2.400%, 08/08/2026 | | | 160 | | | | | | | | 165 | |
1.550%, 08/08/2021 | | | 50 | | | | | | | | 50 | |
| | | | | | | | | | | | |
| | | | |
| Description | | Face Amount
(Thousands) | | | | | | Market Value
($ Thousands) | |
| | | | | | | | | | | | |
|
CORPORATE OBLIGATIONS (continued) | |
NXP BV | | | | | | | | | | | | |
4.625%, 06/01/2023 (B) | | $ | 215 | | | | | | | $ | 230 | |
salesforce.com | | | | | | | | | | | | |
3.700%, 04/11/2028 | | | 10 | | | | | | | | 11 | |
3.250%, 04/11/2023 | | | 40 | | | | | | | | 42 | |
Telefonaktiebolaget LM Ericsson | | | | | | | | | | | | |
4.125%, 05/15/2022 | | | 211 | | | | | | | | 219 | |
Visa | | | | | | | | | | | | |
4.300%, 12/14/2045 | | | 50 | | | | | | | | 63 | |
3.150%, 12/14/2025 | | | 70 | | | | | | | | 75 | |
| | | | | | | | | | | | |
| | | |
| | | | | | | | | | | 1,955 | |
| | | | | | | | | | | | |
|
Materials — 0.8% | |
Anglo American Capital | | | | | | | | | | | | |
3.625%, 09/11/2024 (B) | | | 200 | | | | | | | | 206 | |
ArcelorMittal | | | | | | | | | | | | |
4.550%, 03/11/2026 | | | 50 | | | | | | | | 52 | |
Barrick North America Finance | | | | | | | | | | | | |
5.700%, 05/30/2041 | | | 60 | | | | | | | | 78 | |
BHP Billiton Finance USA | | | | | | | | | | | | |
6.750%, VAR USD Swap Semi 30/360 5 Yr Curr+5.093%, 10/19/2075 (B) | | | 200 | | | | | | | | 234 | |
Equate Petrochemical BV MTN | | | | | | | | | | | | |
4.250%, 11/03/2026 (B) | | | 200 | | | | | | | | 217 | |
Freeport-McMoRan | | | | | | | | | | | | |
5.450%, 03/15/2043 | | | 50 | | | | | | | | 46 | |
4.550%, 11/14/2024 | | | 10 | | | | | | | | 10 | |
3.550%, 03/01/2022 | | | 30 | | | | | | | | 30 | |
Glencore Funding | | | | | | | | | | | | |
4.125%, 05/30/2023 (B) | | | 70 | | | | | | | | 74 | |
4.125%, 03/12/2024 (B) | | | 10 | | | | | | | | 10 | |
4.000%, 03/27/2027 (B) | | | 150 | | | | | | | | 155 | |
2.875%, 04/16/2020 (B) | | | 10 | | | | | | | | 10 | |
Resolute Forest Products | | | | | | | | | | | | |
5.875%, 05/15/2023 | | | 30 | | | | | | | | 30 | |
Reynolds Group Issuer | | | | | | | | | | | | |
5.125%, 07/15/2023 (B) | | | 20 | | | | | | | | 21 | |
Southern Copper | | | | | | | | | | | | |
5.250%, 11/08/2042 | | | 80 | | | | | | | | 92 | |
Vale Overseas | | | | | | | | | | | | |
6.875%, 11/21/2036 | | | 10 | | | | | | | | 13 | |
4.375%, 01/11/2022 | | | 3 | | | | | | | | 3 | |
WestRock RKT | | | | | | | | | | | | |
4.000%, 03/01/2023 | | | 10 | | | | | | | | 10 | |
| | | | | | | | | | | | |
| | | |
| | | | | | | | | | | 1,291 | |
| | | | | | | | | | | | |
|
Real Estate — 1.0% | |
Boston Properties | | | | | | | | | | | | |
3.850%, 02/01/2023 | | | 200 | | | | | | | | 211 | |
Digital Realty Trust | | | | | | | | | | | | |
3.700%, 08/15/2027 | | | 317 | | | | | | | | 338 | |
| | |
| SEI Catholic Values Trust / Semi-Annual Report / August 31, 2019 | | 17 |
SCHEDULE OF INVESTMENTS (Unaudited)
August 31, 2019
Catholic Values Fixed Income Fund(Continued)
| | | | | | | | | | | | |
| | | | |
| Description | | Face Amount
(Thousands) | | | | | | Market Value
($ Thousands) | |
| | | | | | | | | | | | |
|
CORPORATE OBLIGATIONS (continued) | |
HCP | | | | | | | | | | | | |
4.000%, 06/01/2025 | | $ | 150 | | | | | | | $ | 161 | |
Realty Income | | | | | | | | | | | | |
4.125%, 10/15/2026 | | | 207 | | | | | | | | 230 | |
Ventas Realty | | | | | | | | | | | | |
4.125%, 01/15/2026 | | | 136 | | | | | | | | 147 | |
Welltower | | | | | | | | | | | | |
4.500%, 01/15/2024 | | | 144 | | | | | | | | 156 | |
4.000%, 06/01/2025 | | | 231 | | | | | | | | 248 | |
| | | | | | | | | | | | |
| | | |
| | | | | | | | | | | 1,491 | |
| | | | | | | | | | | | |
| | | |
Utilities — 2.1% | | | | | | | | | | | | |
Aquarion | | | | | | | | | | | | |
4.000%, 08/15/2024 (B) | | | 103 | | | | | | | | 109 | |
Duke Energy | | | | | | | | | | | | |
3.950%, 08/15/2047 | | | 10 | | | | | | | | 11 | |
Duke Energy Ohio | | | | | | | | | | | | |
3.650%, 02/01/2029 | | | 50 | | | | | | | | 55 | |
Eversource Energy | | | | | | | | | | | | |
3.150%, 01/15/2025 | | | 111 | | | | | | | | 116 | |
2.500%, 03/15/2021 | | | 305 | | | | | | | | 306 | |
Exelon | | | | | | | | | | | | |
5.625%, 06/15/2035 | | | 60 | | | | | | | | 76 | |
5.100%, 06/15/2045 | | | 328 | | | | | | | | 411 | |
FirstEnergy | | | | | | | | | | | | |
7.375%, 11/15/2031 | | | 220 | | | | | | | | 315 | |
4.850%, 07/15/2047 | | | 100 | | | | | | | | 122 | |
3.900%, 07/15/2027 | | | 50 | | | | | | | | 54 | |
NextEra Energy Capital Holdings | | | | | | | | | | | | |
3.550%, 05/01/2027 | | | 292 | | | | | | | | 312 | |
2.403%, 09/01/2021 | | | 227 | | | | | | | | 228 | |
Public Service Enterprise Group | | | | | | | | | | | | |
2.875%, 06/15/2024 | | | 259 | | | | | | | | 267 | |
Sempra Energy | | | | | | | | | | | | |
1.625%, 10/07/2019 | | | 239 | | | | | | | | 239 | |
Southern | | | | | | | | | | | | |
3.250%, 07/01/2026 | | | 415 | | | | | | | | 430 | |
Virginia Electric & Power | | | | | | | | | | | | |
3.150%, 01/15/2026 | | | 124 | | | | | | | | 131 | |
| | | | | | | | | | | | |
| | | |
| | | | | | | | | | | 3,182 | |
| | | | | | | | | | | | |
| | | |
Total Corporate Obligations (Cost $46,265) ($ Thousands) | | | | | | | | | | | 49,772 | |
| | | | | | | | | | | | |
| | |
U.S. TREASURY OBLIGATIONS — 15.0% | | | | | | | | | |
U.S. Treasury Bills | | | | | | | | | | | | |
2.101%, 09/19/2019 (C) | | | 315 | | | | | | | | 314 | |
1.952%, 11/07/2019 (C) | | | 990 | | | | | | | | 987 | |
U.S. Treasury Bonds | | | | | | | | | | | | |
4.500%, 05/15/2038 | | | 2,293 | | | | | | | | 3,302 | |
3.750%, 11/15/2043 | | | 1,830 | | | | | | | | 2,474 | |
| | | | | | | | | | | | |
| | | | |
| Description | | Face Amount
(Thousands) | | | | | | Market Value
($ Thousands) | |
| | | | | | | | | | | | |
|
U.S. TREASURY OBLIGATIONS (continued) | |
3.000%, 02/15/2048 | | $ | 341 | | | | | | | $ | 418 | |
3.000%, 08/15/2048 | | | 1,763 | | | | | | | | 2,164 | |
3.000%, 02/15/2049 | | | 10 | | | | | | | | 12 | |
2.875%, 08/15/2045 | | | 550 | | | | | | | | 653 | |
2.750%, 08/15/2047 | | | 970 | | | | | | | | 1,133 | |
2.750%, 11/15/2047 | | | 1,977 | | | | | | | | 2,312 | |
2.500%, 02/15/2045 | | | 230 | | | | | | | | 255 | |
2.500%, 05/15/2046 | | | 826 | | | | | | | | 918 | |
U.S. Treasury Inflation Protected Securities | | | | | | | | | | | | |
1.750%, 01/15/2028 | | | 147 | | | | | | | | 168 | |
1.375%, 02/15/2044 | | | 396 | | | | | | | | 492 | |
1.000%, 02/15/2046 | | | 173 | | | | | | | | 201 | |
1.000%, 02/15/2049 | | | 683 | | | | | | | | 794 | |
0.750%, 02/15/2042 | | | 45 | | | | | | | | 50 | |
U.S. Treasury Notes | | | | | | | | | | | | |
3.625%, 02/15/2020 | | | 750 | | | | | | | | 755 | |
3.125%, 11/15/2028 | | | 110 | | | | | | | | 125 | |
2.875%, 08/15/2028 | | | 202 | | | | | | | | 225 | |
2.750%, 02/15/2028 | | | 8 | | | | | | | | 9 | |
2.625%, 05/15/2021 | | | 84 | | | | | | | | 85 | |
2.625%, 02/15/2029 | | | 660 | | | | | | | | 725 | |
2.375%, 02/29/2024 | | | 3,026 | | | | | | | | 3,153 | |
2.375%, 05/15/2029 | | | 290 | | | | | | | | 313 | |
1.750%, 06/30/2024 | | | 549 | | | | | | | | 558 | |
| | | | | | | | | | | | |
| | | |
Total U.S. Treasury Obligations (Cost $19,826) ($ Thousands) | | | | | | | | | | | 22,595 | |
| | | | | | | | | | | | |
|
ASSET-BACKED SECURITIES — 8.7% | |
| | | |
Automotive — 1.1% | | | | | | | | | | | | |
Avis Budget Rental Car Funding AESOP,Ser 2019-2A, Cl A | | | | | | | | | | | | |
3.350%, 09/22/2025 (B) | | | 100 | | | | | | | | 105 | |
Ford Credit Floorplan Master Owner Trust,Ser 2015-2, Cl A1 | | | | | | | | | | | | |
1.980%, 01/15/2022 | | | 825 | | | | | | | | 824 | |
Ford Credit Floorplan Master Owner Trust,Ser 2018-3, Cl A1 | | | | | | | | | | | | |
3.520%, 10/15/2023 | | | 585 | | | | | | | | 605 | |
Ford Credit Floorplan Master Owner Trust,Ser 2018-4, Cl A | | | | | | | | | | | | |
4.060%, 11/15/2030 | | | 150 | | | | | | | | 169 | |
| | | | | | | | | | | | |
| | | |
| | | | | | | | | | | 1,703 | |
| | | | | | | | | | | | |
|
Other Asset-Backed Securities — 7.6% | |
Applebee's Funding, Ser 2019-1A, Cl A2I | | | | | | | | | | | | |
4.194%, 06/07/2049 (B) | | | 140 | | | | | | | | 144 | |
Ascentium Equipment Receivables Trust,Ser 2018-2A, Cl A2 | | | | | | | | | | | | |
3.270%, 10/12/2021 (B) | | | 368 | | | | | | | | 370 | |
| | |
| 18 | | SEI Catholic Values Trust / Semi-Annual Report / August 31, 2019 |
| | | | | | | | | | | | |
| | | | |
| Description | | Face Amount
(Thousands) | | | | | | Market Value
($ Thousands) | |
| | | | | | | | | | | | |
|
ASSET-BACKED SECURITIES (continued) | |
Asset Backed Securities Home Equity Loan Trust, Ser 2007-HE1, Cl A4 | | | | | | | | | | | | |
2.285%, VAR ICE LIBOR USD 1 Month+0.140%, 12/25/2036 | | $ | 251 | | | | | | | $ | 243 | |
BankAmerica Manufactured Housing | | | | | | | | | | | | |
Contract Trust, Ser 1996-1, Cl B1 | | | | | | | | | | | | |
7.875%, 10/10/2026 | | | 508 | | | | | | | | 121 | |
Bear Stearns Asset Backed Securities I Trust,Ser 2004-AC6, Cl A1 | | | | | | | | | | | | |
5.750%, 11/25/2034 | | | 84 | | | | | | | | 85 | |
Bear Stearns Asset Backed Securities I Trust,Ser 2004-HE6, Cl M1 | | | | | | | | | | | | |
3.000%, VAR ICE LIBOR USD 1 Month+0.855%, 08/25/2034 | | | 253 | | | | | | | | 251 | |
Bear Stearns Asset Backed Securities I Trust,Ser 2004-HE7, Cl M1 | | | | | | | | | | | | |
3.045%, VAR ICE LIBOR USD 1 Month+0.900%, 08/25/2034 | | | 229 | | | | | | | | 229 | |
BXP Trust, Ser 2017-CQHP, Cl A | | | | | | | | | | | | |
3.045%, VAR ICE LIBOR USD 1 Month+0.850%, 11/15/2034 (B) | | | 190 | | | | | | | | 189 | |
CCG Receivables Trust, Ser 2017-1, Cl A2 | | | | | | | | | | | | |
1.840%, 11/14/2023 (B) | | | 74 | | | | | | | | 74 | |
CCG Receivables Trust, Ser 2018-1, Cl A2 | | | | | | | | | | | | |
2.500%, 06/16/2025 (B) | | | 396 | | | | | | | | 397 | |
CCG Receivables Trust, Ser 2019-1, Cl A2 | | | | | | | | | | | | |
2.800%, 09/14/2026 (B) | | | 240 | | | | | | | | 242 | |
DB Master Finance, Ser 2017-1A, Cl A2I | | | | | | | | | | | | |
3.629%, 11/20/2047 (B) | | | 249 | | | | | | | | 254 | |
Domino’s Pizza Master Issuer, Ser 2017-1A, Cl A2I | | | | | | | | | | | | |
3.526%, VAR ICE LIBOR USD 3 Month+1.250%, 07/25/2047 (B) | | | 221 | | | | | | | | 220 | |
Domino’s Pizza Master Issuer, Ser 2018-1A, Cl A2I | | | | | | | | | | | | |
4.116%, 07/25/2048 (B) | | | 148 | | | | | | | | 156 | |
GMF Floorplan Owner Revolving Trust,Ser 2018-4, Cl A1 | | | | | | | | | | | | |
3.500%, 09/15/2023 (B) | | | 255 | | | | | | | | 263 | |
Lone Star Portfolio Trust, Ser 2015-LSP, Cl E | | | | | | | | | | | | |
8.045%, VAR ICE LIBOR USD 1 Month+5.850%, 09/15/2028 (B) | | | 137 | | | | | | | | 137 | |
Navient Private Education Refi Loan Trust,Ser 2019-CA, Cl A2 | | | | | | | | | | | | |
3.130%, 02/15/2068 (B) | | | 180 | | | | | | | | 187 | |
Nelnet Student Loan Trust, Ser 2008-3, Cl A4 | | | | | | | | | | | | |
3.782%, VAR ICE LIBOR USD 3 Month+1.650%, 11/25/2024 | | | 72 | | | | | | | | 72 | |
NextGear Floorplan Master Owner Trust,Ser 2018-1A, Cl A2 | | | | | | | | | | | | |
3.220%, 02/15/2023 (B) | | | 354 | | | | | | | | 359 | |
| | | | | | | | | | | | |
| | | | |
| Description | | Face Amount
(Thousands) | | | | | | Market Value
($ Thousands) | |
| | | | | | | | | | | | |
|
ASSET-BACKED SECURITIES (continued) | |
NextGear Floorplan Master Owner Trust, Ser 2018-2A, Cl A2 | | | | | | | | | | | | |
3.690%, 10/15/2023 (B) | | $ | 377 | | | | | | | $ | 389 | |
NextGear Floorplan Master Owner Trust, Ser 2019-1A, Cl A2 | | | | | | | | | | | | |
3.210%, 02/15/2024 (B) | | | 347 | | | | | | | | 356 | |
Nomura Asset Acceptance Alternative Loan Trust, Ser 2007-1, Cl 1A4 | | | | | | | | | | | | |
6.138%, 03/25/2047 | | | 179 | | | | | | | | 190 | |
Progress Residential Trust, Ser 2018-SFR3, Cl A | | | | | | | | | | | | |
3.880%, 10/17/2035 (B) | | | 408 | | | | | | | | 423 | |
RAMP Trust, Ser 2006-RZ3, Cl M1 | | | | | | | | | | | | |
2.495%, VAR ICE LIBOR USD 1 Month+0.350%, 08/25/2036 | | | 470 | | | | | | | | 468 | |
Seasoned Credit Risk Transfer Trust, Ser 2018-4, Cl MA | | | | | | | | | | | | |
3.500%, 03/25/2058 | | | 452 | | | | | | | | 475 | |
Sofi Professional Loan Program Trust,Ser 2018-B, Cl A2FX | | | | | | | | | | | | |
3.340%, 08/25/2047 (B) | | | 100 | | | | | | | | 104 | |
Sofi Professional Loan Program Trust,Ser 2018-D, Cl A2FX | | | | | | | | | | | | |
3.600%, 02/25/2048 (B) | | | 180 | | | | | | | | 190 | |
Store Master Funding I, Ser 2015-1A, Cl A1 | | | | | | | | | | | | |
3.750%, 04/20/2045 (B) | | | 329 | | | | | | | | 337 | |
Structured Asset Investment Loan Trust,Ser 2003-BC12, Cl 2A | | | | | | | | | | | | |
2.865%, VAR ICE LIBOR USD 1 Month+0.720%, 11/25/2033 | | | 238 | | | | | | | | 239 | |
U.S. Small Business Administration, Ser 2010-20B, Cl 1 | | | | | | | | | | | | |
4.140%, 02/01/2030 | | | 96 | | | | | | | | 104 | |
U.S. Small Business Administration, Ser 2011-20H, Cl 1 | | | | | | | | | | | | |
3.290%, 08/01/2031 | | | 168 | | | | | | | | 176 | |
U.S. Small Business Administration,Ser 2013-20G, Cl 1 | | | | | | | | | | | | |
3.150%, 07/01/2033 | | | 752 | | | | | | | | 791 | |
U.S. Small Business Administration,Ser 2014-20C, Cl 1 | | | | | | | | | | | | |
3.210%, 03/01/2034 | | | 629 | | | | | | | | 671 | |
U.S. Small Business Administration,Ser 2015-20F, Cl 1 | | | | | | | | | | | | |
2.980%, 06/01/2035 | | | 177 | | | | | | | | 187 | |
U.S. Small Business Administration,Ser 2018-20A, Cl 1 | | | | | | | | | | | | |
2.920%, 01/01/2038 | | | 277 | | | | | | | | 293 | |
U.S. Small Business Administration,Ser 2018-20B, Cl 1 | | | | | | | | | | | | |
3.220%, 02/01/2038 | | | 435 | | | | | | | | 466 | |
| | |
| SEI Catholic Values Trust / Semi-Annual Report / August 31, 2019 | | 19 |
SCHEDULE OF INVESTMENTS (Unaudited)
August 31, 2019
Catholic Values Fixed Income Fund(Continued)
| | | | | | | | | | | | |
| | | | |
| Description | | Face Amount
(Thousands) | | | | | | Market Value
($ Thousands) | |
| | | | | | | | | | | | |
|
ASSET-BACKED SECURITIES (continued) | |
U.S. Small Business Administration, Ser 2018-20E, Cl 1 | | | | | | | | | | | | |
3.500%, 05/01/2038 | | $ | 283 | | | | | | | $ | 308 | |
U.S. Small Business Administration, Ser 2019-20D, Cl 1 | | | | | | | | | | | | |
2.980%, 04/01/2039 | | | 30 | | | | | | | | 32 | |
U.S. Small Business Administration, Ser 2019-25G, Cl 1 | | | | | | | | | | | | |
2.690%, 07/01/2044 | | | 30 | | | | | | | | 32 | |
Vantage Data Centers Issuer, Ser 2019-1A, Cl A2 | | | | | | | | | | | | |
3.188%, 07/15/2044 (B) | | | 120 | | | | | | | | 122 | |
Verizon Owner Trust, Ser 2017-2A, Cl A | | | | | | | | | | | | |
1.920%, 12/20/2021 (B) | | | 244 | | | | | | | | 244 | |
Verizon Owner Trust, Ser 2017-3A, Cl A1A | | | | | | | | | | | | |
2.060%, 04/20/2022 (B) | | | 325 | | | | | | | | 325 | |
Verizon Owner Trust, Ser 2019-B, Cl A1A | | | | | | | | | | | | |
2.330%, 12/20/2023 | | | 285 | | | | | | | | 288 | |
Volvo Financial Equipment LLC, Ser 2017-1A, Cl A3 | | | | | | | | | | | | |
1.920%, 03/15/2021 (B) | | | 123 | | | | | | | | 122 | |
Wendy’s Funding, Ser 2019-1A, Cl A2I | | | | | | | | | | | | |
3.783%, 06/15/2049 (B) | | | 153 | | | | | | | | 158 | |
| | | | | | | | | | | | |
| | | |
| | | | | | | | | | | 11,483 | |
| | | | | | | | | | | | |
| | | |
Total Asset-Backed Securities (Cost $12,874) ($ Thousands) | | | | | | | | | | | 13,186 | |
| | | | | | | | | | | | |
|
U.S. GOVERNMENT AGENCY OBLIGATIONS — 2.3% | |
FHLB | | | | | | | | | | | | |
2.125%, 02/11/2020 | | | 30 | | | | | | | | 30 | |
FHLB DN | | | | | | | | | | | | |
2.461%, 09/27/2019 (C) | | | 850 | | | | | | | | 849 | |
2.152%, 09/20/2019 (C) | | | 220 | | | | | | | | 220 | |
2.145%, 09/03/2019 (C) | | | 650 | | | | | | | | 650 | |
2.021%, 10/23/2019 (C) | | | 940 | | | | | | | | 937 | |
2.002%, 09/09/2019 (C) | | | 380 | | | | | | | | 380 | |
1.957%, 10/28/2019 (C) | | | 380 | | | | | | | | 379 | |
| | | | | | | | | | | | |
| | | |
Total U.S. Government Agency Obligations (Cost $3,444) ($ Thousands) | | | | | | | | | | | 3,445 | |
| | | | | | | | | | | | |
| | | |
SOVEREIGN DEBT — 2.2% | | | | | | | | | | | | |
Abu Dhabi Government International Bond | | | | | | | | | | | | |
2.500%, 10/11/2022 (B) | | | 200 | | | | | | | | 203 | |
Argentine Republic Government International Bond | | | | | | | | | | | | |
6.875%, 01/11/2048 | | | 140 | | | | | | | | 53 | |
5.625%, 01/26/2022 | | | 210 | | | | | | | | 83 | |
| | | | | | | | | | | | |
| | | | |
| Description | | Face Amount
(Thousands) | | | | | | Market Value
($ Thousands) | |
| | | | | | | | | | | | |
|
SOVEREIGN DEBT (continued) | |
3.750%, 5.250%, 03/31/2029, 12/31/2038 (D) | | $ | 20 | | | | | | | $ | 7 | |
Brazilian Government International Bond | | | | | | | | | | | | |
5.625%, 01/07/2041 | | | 120 | | | | | | | | 137 | |
4.625%, 01/13/2028 | | | 290 | | | | | | | | 312 | |
Colombia Government International Bond | | | | | | | | | | | | |
5.625%, 02/26/2044 | | | 200 | | | | | | | | 257 | |
Ecuador Government International Bond | | | | | | | | | | | | |
7.875%, 01/23/2028 (B) | | | 200 | | | | | | | | 187 | |
Egypt Government International Bond | | | | | | | | | | | | |
5.577%, 02/21/2023 (B) | | | 200 | | | | | | | | 206 | |
Indonesia Government International Bond | | | | | | | | | | | | |
4.350%, 01/11/2048 | | | 400 | | | | | | | | 455 | |
Mexico Government International Bond | | | | | | | | | | | | |
4.600%, 02/10/2048 | | | 230 | | | | | | | | 251 | |
Nigeria Government International Bond MTN | | | | | | | | | | | | |
6.500%, 11/28/2027 (B) | | | 200 | | | | | | | | 199 | |
Peruvian Government International Bond | | | | | | | | | | | | |
6.550%, 03/14/2037 | | | 10 | | | | | | | | 15 | |
5.625%, 11/18/2050 | | | 240 | | | | | | | | 366 | |
Poland Government International Bond | | | | | | | | | | | | |
4.000%, 01/22/2024 | | | 110 | | | | | | | | 120 | |
Provincia de Buenos Aires | | | | | | | | | | | | |
6.500%, 02/15/2023 (B) | | | 200 | | | | | | | | 62 | |
Republic of South Africa Government International Bond | | | | | | | | | | | | |
4.300%, 10/12/2028 | | | 200 | | | | | | | | 199 | |
Uruguay Government International Bond | | | | | | | | | | | | |
4.375%, 01/23/2031 | | | 200 | | | | | | | | 227 | |
| | | | | | | | | | | | |
| | | |
Total Sovereign Debt (Cost $3,342) ($ Thousands) | | | | | | | | | | | 3,339 | |
| | | | | | | | | | | | |
|
LOAN PARTICIPATIONS — 1.6% | |
1011778 B.C. Unlimited Liability Company (New Red Finance, Inc.) (aka Burger King/Tim Hortons), Term B-3 Loan | | | | | | | | | | | | |
4.362%, VAR LIBOR+0.023%, 02/16/2024 | | | 10 | | | | | | | | 10 | |
1011778 B.C. Unlimited Liability Company (New Red Finance, Inc.) (aka Burger King/Tim Hortons), Term B-3 Loan, 1st Lien | | | | | | | | | | | | |
4.362%, VAR LIBOR+0.023%, 02/16/2024 | | | 13 | | | | | | | | 13 | |
Air Medical Group Holdings, 2018 Term Loan | | | | | | | | | | | | |
5.432%, 04/28/2022 | | | 69 | | | | | | | | 65 | |
Albertson’s, Term Loan, 1st Lien | | | | | | | | | | | | |
4.862%, 08/07/2026 | | | 46 | | | | | | | | 46 | |
Allied Universal Hold LLC, Term Loan B, 1st Lien | | | | | | | | | | | | |
6.507%, 06/26/2026 | | | 18 | | | | | | | | 18 | |
| | |
| 20 | | SEI Catholic Values Trust / Semi-Annual Report / August 31, 2019 |
| | | | | | | | | | | | |
| | | | |
| Description | | Face Amount
(Thousands) | | | | | | Market Value
($ Thousands) | |
| | | | | | | | | | | | |
|
LOAN PARTICIPATIONS (continued) | |
American Axle & Manufacturing, Inc., Tranche B Term Loan, 1st Lien | | | | | | | | | | | | |
4.530%, VAR LIBOR+0.045%, 04/06/2024 | | $ | 1 | | | | | | | $ | 1 | |
4.400%, VAR LIBOR+0.045%, 04/06/2024 | | | 6 | | | | | | | | 6 | |
Asurion, LLC (fka Asurion Corporation), Amendment No. 14 ReplacementB-4 Term Loan, 1st Lien | | | | | | | | | | | | |
5.112%, 08/04/2022 | | | 50 | | | | | | | | 50 | |
Asurion, LLC, Term Loan | | | | | | | | | | | | |
5.112%, 11/03/2024 | | | 40 | | | | | | | | 40 | |
Athenahealth, Inc., Term Loan | | | | | | | | | | | | |
6.701%, 02/11/2026 | | | — | | | | | | | | — | |
Athenahealth, Inc., Term Loan B, 1st Lien | | | | | | | | | | | | |
6.681%, 02/11/2026 | | | 80 | | | | | | | | 79 | |
Atlantic Aviation, Term Loan B, 1st Lien | | | | | | | | | | | | |
5.870%, 12/06/2025 | | | 10 | | | | | | | | 10 | |
Avalon, Term Loan B, 1st Lien | | | | | | | | | | | | |
3.922%, 01/15/2025 | | | 39 | | | | | | | | 39 | |
Berry Global, Inc. (fka Berry Plastics Corporation), Term Q Loan, 1st Lien | | | | | | | | | | | | |
4.451%, VAR LIBOR+0.050%, 10/01/2022 | | | 13 | | | | | | | | 13 | |
Blackstone CQP Holdco LP, Initial Term Loan, 1st Lien | | | | | | | | | | | | |
5.887%, 06/07/2024 | | | 10 | | | | | | | | 10 | |
Brickman Group/Brightview Landscapes, 1st Lien | | | | | | | | | | | | |
4.688%, 08/15/2025 | | | 11 | | | | | | | | 11 | |
Brightview Landscapes, LLC, Initial Term Loan, 1st Lien | | | | | | | | | | | | |
4.625%, 08/15/2025 | | | 9 | | | | | | | | 9 | |
Caesars Resort Collection, LLC (fka Caesars Growth Properties Holdings, LLC), Term B Loan, 1st Lien | | | | | | | | | | | | |
4.862%, VAR LIBOR+0.043%, 12/23/2024 | | | 48 | | | | | | | | 47 | |
CBS Radio Inc. Term Loan B (2017) | | | | | | | | | | | | |
4.890%, VAR LIBOR+0.038%, 11/18/2024 | | | 32 | | | | | | | | 32 | |
Change Healthcare Holdings, Inc. (fka Emdeon Inc.), Closing Date Term Loan, 1st Lien | | | | | | | | | | | | |
4.612%, VAR LIBOR+0.053%, 03/01/2024 | | | 22 | | | | | | | | 22 | |
Charter Communications Operating LLC, Term Loan B | | | | | | | | | | | | |
4.330%, VAR LIBOR+0.090%, 04/30/2025 | | | 98 | | | | | | | | 98 | |
| | | | | | | | | | | | |
| | | | |
| Description | | Face Amount
(Thousands) | | | | | | Market Value
($ Thousands) | |
| | | | | | | | | | | | |
|
LOAN PARTICIPATIONS (continued) | |
CityCenter Holdings, LLC, Term B Loan, 1st Lien | | | | | | | | | | | | |
4.362%, VAR LIBOR+0.030%, 04/18/2024 | | $ | 18 | | | | | | | $ | 18 | |
Dell International L.L.C. (EMC Corporation), Refinancing Term B Loan | | | | | | | | | | | | |
4.120%, 09/07/2023 | | | 39 | | | | | | | | 39 | |
Diamond Sports, Term Loan B, 1st Lien | | | | | | | | | | | | |
5.420%, 07/17/2026 | | | 10 | | | | | | | | 10 | |
DigiCert Holdings, Inc., Term Loan, 1st Lien | | | | | | | | | | | | |
0.000%, 08/07/2026 (E) | | | 60 | | | | | | | | 60 | |
Digicert, Term LoanB-2 | | | | | | | | | | | | |
6.112%, 10/31/2024 | | | 90 | | | | | | | | 90 | |
Edelman Financial Center, Term Loan B | | | | | | | | | | | | |
5.432%, 07/21/2025 | | | 30 | | | | | | | | 30 | |
First Eagle Holdings, Inc. (fka Arnhold and S. Bleichroeder Holdings, Inc.), Refinancing Term Loan | | | | | | | | | | | | |
5.080%, 12/02/2024 | | | 20 | | | | | | | | 20 | |
Focus Financial Partners, Term Loan, 1st Lien | | | | | | | | | | | | |
4.612%, 07/03/2024 | | | 10 | | | | | | | | 10 | |
Four Seasons, 1st Lien | | | | | | | | | | | | |
4.112%, 11/30/2023 | | | 20 | | | | | | | | 20 | |
Golden Nugget, Inc., Initial Term Loan B | | | | | | | | | | | | |
4.932%, VAR LIBOR+0.070%, 10/04/2023 | | | 11 | | | | | | | | 11 | |
Golden Nugget, Inc., Initial Term Loan B, 1st Lien | | | | | | | | | | | | |
4.862%, VAR LIBOR+0.070%, 10/04/2023 | | | 13 | | | | | | | | 13 | |
HC Group Holdings II, Inc., 1st Lien | | | | | | | | | | | | |
6.612%, 05/22/2026 | | | 40 | | | | | | | | 40 | |
Hilton Worldwide Finance LLC, Term Loan | | | | | | | | | | | | |
3.895%, 06/22/2026 | | | 42 | | | | | | | | 43 | |
iHeartCommunications, Term Loan, 1st Lien | | | | | | | | | | | | |
6.230%, 05/01/2026 | | | 16 | | | | | | | | 16 | |
Intelsat Jackson Holdings S.A., TrancheB-3 Term Loan | | | | | | | | | | | | |
5.895%, 11/27/2023 | | | 20 | | | | | | | | 20 | |
Intrawest, Term LoanB-1 | | | | | | | | | | | | |
5.112%, 07/31/2024 | | | 40 | | | | | | | | 40 | |
Jaguar Holding, Inital Term Loan | | | | | | | | | | | | |
4.612%, 08/18/2022 | | | 12 | | | | | | | | 12 | |
Level 3 Financing, Inc., Tranche B, Term Loan | | | | | | | | | | | | |
4.423%, VAR LIBOR+0.030%, 02/22/2024 | | | 96 | | | | | | | | 96 | |
LifePoint Health, Term Loan, 1st Lien | | | | | | | | | | | | |
6.645%, 11/16/2025 | | | 80 | | | | | | | | 79 | |
LPL Holdings, Term Loan B (2017) | | | | | | | | | | | | |
4.395%, 09/23/2024 | | | 10 | | | | | | | | 10 | |
MA Financeco., LLC, TrancheB-3 Term Loan | | | | | | | | | | | | |
4.612%, 06/21/2024 | | | 1 | | | | | | | | 1 | |
| | |
| SEI Catholic Values Trust / Semi-Annual Report / August 31, 2019 | | 21 |
SCHEDULE OF INVESTMENTS (Unaudited)
August 31, 2019
Catholic Values Fixed Income Fund(Continued)
| | | | | | | | | | | | |
| | | | |
| Description | | Face Amount
(Thousands) | | | | | | Market Value
($ Thousands) | |
| | | | | | | | | | | | |
| | |
LOAN PARTICIPATIONS (continued) | | | | | | | | | |
McAfee, LLC, Term B USD Loan | | | | | | | | | | | | |
5.866%, 09/30/2024 | | $ | 50 | | | | | | | $ | 50 | |
MGM Growth Properties Operating Partnership, Term B Loan, 1st Lien | | | | | | | | | | | | |
4.112%, VAR US LIBOR+0.038%, 04/25/2023 | | | 32 | | | | | | | | 32 | |
Michaels Stores, Inc., 2018 New Replacement Term B Loan | | | | | | | | | | | | |
4.667%, 01/30/2023 | | | 8 | | | | | | | | 8 | |
4.612%, 01/30/2023 | | | 21 | | | | | | | | 19 | |
Michaels Stores, Replacement Term Loan B | | | | | | | | | | | | |
4.612%, 01/30/2023 | | | 1 | | | | | | | | 1 | |
MPH Acquisition Holdings LLC, Initial Term Loan, 1st Lien | | | | | | | | | | | | |
5.080%, VAR LIBOR+0.088%, 06/07/2023 | | | 87 | | | | | | | | 80 | |
Nexstar Broadcasting, Term Loan, 1st Lien | | | | | | | | | | | | |
0.000%, 06/19/2026 (E) | | | 50 | | | | | | | | 50 | |
Numericable U.S. LLC, Term Loan B | | | | | | | | | | | | |
5.883%, VAR LIBOR+0.038%, 01/31/2026 | | | 50 | | | | | | | | 49 | |
ON Semiconductor, 2018 New Replacement Term Loan B-3 | | | | | | | | | | | | |
3.862%, 03/31/2023 | | | 25 | | | | | | | | 25 | |
Panther BF Aggregator 2 L.P., Initial Term Loan, 1st Lien | | | | | | | | | | | | |
5.612%, 04/30/2026 | | | 50 | | | | | | | | 49 | |
Party City Holdings Inc., 2018 Replacement Term Loan | | | | | | | | | | | | |
4.620%, 08/19/2022 | | | 12 | | | | | | | | 12 | |
PCO Gaming, 1st Lien | | | | | | | | | | | | |
5.112%, 05/15/2026 | | | 40 | | | | | | | | 40 | |
Phoenix Guarantor Inc., Initial Term Loan, 1st Lien | | | | | | | | | | | | |
6.744%, 03/05/2026 | | | 60 | | | | | | | | 60 | |
Post Holdings, Inc., Series A Incremental Term Loan | | | | | | | | | | | | |
4.150%, VAR LIBOR+0.058%, 05/24/2024 | | | 24 | | | | | | | | 24 | |
Prime Security Services Borrower, LLC, Refinancing Term Loan B-1, Ser 2016-2 | | | | | | | | | | | | |
4.862%, 05/02/2022 | | | 74 | | | | | | | | 74 | |
Reynolds Group Holdings Inc., Incremental U.S. Term Loan | | | | | | | | | | | | |
4.862%, VAR LIBOR+0.040%, 02/05/2023 | | | 72 | | | | | | | | 72 | |
RPI Finance Trust, Initial Term Loan B-6 | | | | | | | | | | | | |
4.112%, VAR Prime Rate by Country+0.025%, 03/27/2023 | | | 47 | | | | | | | | 47 | |
Scientific Games International, Inc., Initial Term Loan B-5 | | | | | | | | | | | | |
4.896%, VAR LIBOR+0.055%, 08/14/2024 | | | 59 | | | | | | | | 58 | |
| | | | | | | | | | | | |
| | | | |
| Description | | Face Amount
(Thousands) | | | | | | Market Value
($ Thousands) | |
| | | | | | | | | | | | |
| | |
LOAN PARTICIPATIONS (continued) | | | | | | | | | |
4.862%, VAR LIBOR+0.055%, 08/14/2024 | | $ | 14 | | | | | | | $ | 14 | |
Seattle SpinCo, Inc., Initial Term Loan, 1st Lien | | | | | | | | | | | | |
4.612%, VAR LIBOR+0.080%, 06/21/2024 | | | 9 | | | | | | | | 9 | |
Sprint Communications, Inc., Initial Term Loan, 1st Lien | | | | | | | | | | | | |
4.625%, VAR LIBOR+0.065%, 02/02/2024 | | | 19 | | | | | | | | 18 | |
Station Casinos LLC, Term B Facility Loan, 1st Lien | | | | | | | | | | | | |
4.620%, VAR LIBOR+0.075%, 06/08/2023 | | | 13 | | | | | | | | 13 | |
The Servicemaster Company, 1st Lien | | | | | | | | | | | | |
4.612%, 11/08/2023 | | | 4 | | | | | | | | 4 | |
TKC Holdings, Inc. Term Loan B | | | | | | | | | | | | |
5.870%, 02/01/2023 | | | 20 | | | | | | | | 19 | |
Trans Union LLC, 2017 Replacement Term Loan B-3 | | | | | | | | | | | | |
4.112%, 04/10/2023 | | | 29 | | | | | | | | 29 | |
UFC Holdings II, Inc. 1st Lien | | | | | | | | | | | | |
5.370%, 04/29/2026 | | | 50 | | | | | | | | 50 | |
Univision Communications Inc., 2017 Replacement Repriced First-Lien Term Loan | | | | | | | | | | | | |
4.862%, 03/15/2024 | | | 52 | | | | | | | | 50 | |
VICI Properties 1 LLC, Term B Loan, 1st Lien | | | | | | | | | | | | |
4.170%, 12/20/2024 | | | 8 | | | | | | | | 8 | |
Virgin Media, Term Loan, 1st Lien | | | | | | | | | | | | |
4.695%, VAR LIBOR+0.085%, 01/15/2026 | | | 55 | | | | | | | | 55 | |
Western Digital | | | | | | | | | | | | |
3.862%, 04/29/2023 | | | 32 | | | | | | | | 32 | |
Ziggo Secured Finance Partnership, Term Loan E Facility, 1st Lien | | | | | | | | | | | | |
4.695%, VAR LIBOR+0.038%, 04/15/2025 | | | 90 | | | | | | | | 90 | |
| | | | | | | | | | | | |
| | | |
Total Loan Participations
(Cost $2,459) ($ Thousands) | | | | | | | | | | | 2,438 | |
| | | | | | | | | | | | |
| | | |
MUNICIPAL BONDS — 0.9% | | | | | | | | | | | | |
| | | |
California — 0.3% | | | | | | | | | | | | |
California State, GO | | | | | | | | | | | | |
7.500%, 04/01/2034 | | | 280 | | | | | | | | 441 | |
| | | | | | | | | | | | |
| | | |
Florida — 0.1% | | | | | | | | | | | | |
Florida State, Board of Administration Finance, Ser A, RB | | | | | | | | | | | | |
2.638%, 07/01/2021 | | | 100 | | | | | | | | 101 | |
| | | | | | | | | | | | |
| | |
| 22 | | SEI Catholic Values Trust / Semi-Annual Report / August 31, 2019 |
| | | | | | | | | | | | |
| | | | |
| Description | | Face Amount
(Thousands) | | | | | | Market Value
($ Thousands) | |
| | | | | | | | | | | | |
| | | |
MUNICIPAL BONDS (continued) | | | | | | | | | | | | |
| | | |
Illinois — 0.3% | | | | | | | | | | | | |
Chicago, Metropolitan Water Reclamation District, GO | | | | | | | | | | | | |
5.720%, 12/01/2038 | | $ | 345 | | | | | | | $ | 479 | |
| | | | | | | | | | | | |
| | | |
New York — 0.2% | | | | | | | | | | | | |
New York State, Urban Development, RB | | | | | | | | | | | | |
5.770%, 03/15/2039 | | | 275 | | | | | | | | 347 | |
| | | | | | | | | | | | |
| | | |
Total Municipal Bonds
(Cost $1,232) ($ Thousands) | | | | | | | | | | | 1,368 | |
| | | | | | | | | | | | |
| | | | | | | | | | | | |
| | | | |
| Description | | Shares | | | | | | Market Value
($ Thousands) | |
| | | | | | | | | | | | |
| | | |
CASH EQUIVALENT — 3.5% | | | | | | | | | | | | |
SEI Daily Income Trust, Government Fund, Cl F | | | | | | | | | | | | |
1.970%**† | | | 5,314,163 | | | | | | | $ | 5,314 | |
| | | | | | | | | | | | |
| | | |
Total Cash Equivalent
(Cost $5,314) ($ Thousands) | | | | | | | | | | | 5,314 | |
| | | | | | | | | | | | |
| | | |
Total Investments in Securities — 105.4% (Cost $151,495) ($ Thousands) | | | | | | | | | | $ | 159,370 | |
| | | | | | | | | | | | |
| | | |
| | | Contracts | | | | | | | |
| | | |
PURCHASED OPTIONS* — 0.0% | | | | | | | | | | | | |
| | | |
Total Purchased Options (F)
(Cost $29) ($ Thousands) | | | 1,782,611 | | | | | | | $ | 63 | |
| | | | | | | | | | | | |
A list of the open options held by the Fund at August 31, 2019, is as follows:
| | | | | | | | | | | | | | | | | | | | | | | | |
| | | | | | | |
| Description | | Counterparty | | | Number of Contracts | | | Notional Amount
(Thousands)^ | | | Exercise Price | | | Expiration Date | | | Value
(Thousands) | |
| | | | | | |
PURCHASED OPTIONS — 0.0% | | | | | | | | | | | | | | | | | | | | | | | | |
| | | | | | |
Call Options | | | | | | | | | | | | | | | | | | | | | | | | |
November 2019, USD Call EUR Put * | | | Citigroup | | | | 1,182,611 | | | $ | 22 | | | $ | 1.14 | | | | 11/16/19 | | | $ | 45 | |
October 2019, USD Call EUR Put * | | | Citigroup | | | | 600,000 | | | | 7 | | | | 1.13 | | | | 10/19/19 | | | | 18 | |
| | | | | | | | | | | | | | | | | | | | | | | | |
Total Purchased Option | | | | | | | | | | $ | 29 | | | | | | | | | | | $ | 63 | |
| | | | | | | | | | | | | | | | | | | | | | | | |
A list of the open futures contracts held by the Fund at August 31, 2019, is as follows:
| | | | | | | | | | | | | | | | | | | | |
| | | | | | |
| Type of Contract | | Number of
Contracts Long/(Short) | | | Expiration Date | | | Notional Amount
(Thousands) | | | Value
(Thousands) | | | Unrealized
Appreciation
(Depreciation)
(Thousands) | |
90-Day Euro$ | | | 25 | | | | Dec-2019 | | | $ | 6,063 | | | $ | 6,134 | | | $ | 70 | |
90-Day Euro$ | | | 5 | | | | Mar-2021 | | | | 1,218 | | | | 1,235 | | | | 17 | |
U.S.10-Year Treasury Note | | | 24 | | | | Dec-2019 | | | | 3,155 | | | | 3,161 | | | | 6 | |
U.S.2-Year Treasury Note | | | (3 | ) | | | Jan-2020 | | | | (648 | ) | | | (648 | ) | | | — | |
U.S.5-Year Treasury Note | | | (134 | ) | | | Jan-2020 | | | | (16,037 | ) | | | (16,077 | ) | | | (40 | ) |
U.S. Long Treasury Bond | | | 18 | | | | Dec-2019 | | | | 2,950 | | | | 2,975 | | | | 25 | |
U.S. Ultra Long Treasury Bond | | | 16 | | | | Dec-2019 | | | | 3,114 | | | | 3,159 | | | | 45 | |
Ultra10-Year U.S. Treasury Note | | | (9 | ) | | | Dec-2019 | | | | (1,295 | ) | | | (1,300 | ) | | | (5 | ) |
| | | | | | | | | | | | | | | | | | | | |
| | | | | | | | | | $ | (1,480 | ) | | $ | (1,361 | ) | | $ | 118 | |
| | | | | | | | | | | | | | | | | | | | |
| | |
| SEI Catholic Values Trust / Semi-Annual Report / August 31, 2019 | | 23 |
SCHEDULE OF INVESTMENTS (Unaudited)
August 31, 2019
Catholic Values Fixed Income Fund(Concluded)
A list of the open forward foreign currency contracts held by the Fund at August 31, 2019, is as follows:
| | | | | | | | | | | | | | | | | | | | | | | | |
| | | | | | | |
| Counterparty | | Settlement Date | | | | | | Currency to Deliver
(Thousands) | | | | | | Currency to Receive
(Thousands) | | | Unrealized
Appreciation (Depreciation)
(Thousands) | |
Citigroup | | | 10/17/19 | | | | GBP | | | | 50 | | | | USD | | | | 61 | | | $ | — | |
Citigroup | | | 10/17/19 | | | | USD | | | | 165 | | | | ZAR | | | | 2,370 | | | | (10 | ) |
Citigroup | | | 10/17/19 | | | | USD | | | | 173 | | | | GBP | | | | 138 | | | | (5 | ) |
Citigroup | | | 10/17/19 | | | | USD | | | | 176 | | | | AUD | | | | 254 | | | | (5 | ) |
Citigroup | | | 10/17/19 - 10/23/19 | | | | USD | | | | 688 | | | | EUR | | | | 608 | | | | (16 | ) |
Citigroup | | | 10/17/19 | | | | USD | | | | 750 | | | | INR | | | | 51,986 | | | | (29 | ) |
Citigroup | | | 10/17/19 | | | | USD | | | | 909 | | | | RUB | | �� | | 58,693 | | | | (33 | ) |
Citigroup | | | 10/17/19 | | | | USD | | | | 1,100 | | | | IDR | | | | 15,760,196 | | | | 4 | |
Citigroup | | | 10/17/19 | | | | CAD | | | | 1,254 | | | | USD | | | | 955 | | | | 11 | |
Citigroup | | | 10/17/19 | | | | BRL | | | | 1,734 | | | | USD | | | | 460 | | | | 41 | |
Citigroup | | | 10/17/19 | | | | USD | | | | 1,751 | | | | BRL | | | | 6,654 | | | | (146 | ) |
Citigroup | | | 10/17/19 | | | | CNY | | | | 2,862 | | | | USD | | | | 416 | | | | 16 | |
Citigroup | | | 10/17/19 | | | | USD | | | | 3,209 | | | | CAD | | | | 4,207 | | | | (40 | ) |
Citigroup | | | 10/17/19 | | | | PHP | | | | 32,016 | | | | USD | | | | 620 | | | | 6 | |
| | | | | | | | | | | | | | | | | | | | | | | | |
| | | | | | | | | | | | | | | | | | | | | | $ | (206) | |
| | | | | | | | | | | | | | | | | | | | | | | | |
A list of open centrally cleared swap agreements held by the Fund at August 31, 2019, is as follows:
| | | | | | | | | | | | | | | | | | | | | | | | | | | | | | | | |
| Credit Default Swaps | |
| | | | | | | | | |
| Reference Entity/Obligation | | Buy/Sell Protection | | | (Pays)/ Receives Rate | | | Payment
Frequency | | | Termination
Date | | | Notional Amount
(Thousands) | | | Value
(Thousands) | | | Upfront Payments/
Receipts
(Thousands) | | | Net Unrealized
Appreciation
(Thousands) | |
CDX.NA.HY.24 | | | Sell | | | | 5.00% | | | | Quarterly | | | | 06/20/2024 | | | $ | (916 | ) | | $ | 60 | | | $ | 48 | | | $ | 12 | |
CDX.NA.IG.32 | | | Sell | | | | 1.00% | | | | Quarterly | | | | 06/20/2024 | | | | (2,830 | ) | | | 59 | | | | 40 | | | | 19 | |
| | | | | | | | | | | | | | | | | | | | | | | | | | | | | | | | |
| | | | | | | | | | | | | | | | | | | | | | $ | 119 | | | $ | 88 | | | $ | 31 | |
| | | | | | | | | | | | | | | | | | | | | | | | | | | | | | | | |
| | | | | | | | | | | | | | | | | | | | | | | | |
| Interest Rate Swaps | |
| | | | | | | | | |
| Fund Pays | | Fund Receives | | Payment
Frequency | | | Termination Date | | Currency | | Notional
Amount
(Thousands) | | Value (Thousands) | | | Upfront
Payments/
Receipts
(Thousands) | | | Net Unrealized
Depreciation
(Thousands) | |
2.5% | | 3-MONTH USD - LIBOR | | | Quarterly | | | 01/31/2026 | | USD | | 1,089 | | $ | (79 | ) | | $ | (15 | ) | | $ | (64 | ) |
1.55% | | USD FEDL01 | | | Annually | | | 04/30/2026 | | USD | | 2,630 | | | (86 | ) | | | 3 | | | | (89 | ) |
2.875% | | 3-MONTH USD - LIBOR | | | Quarterly | | | 05/15/2044 | | USD | | 945 | | | (268 | ) | | | 11 | | | | (279 | ) |
2.75% | | 3-MONTH USD - LIBOR | | | Quarterly | | | 08/15/2044 | | USD | | 918 | | | (238 | ) | | | (2 | ) | | | (236 | ) |
1.85% | | SD LIBOR BBA | | | Quarterly | | | 11/15/2044 | | USD | | 324 | | | (22 | ) | | | 1 | | | | (23 | ) |
1.81% | | 3-MONTH USD - LIBOR | | | Quarterly | | | 11/15/2044 | | USD | | 164 | | | (9 | ) | | | — | | | | (9 | ) |
1.65% | | 3-MONTH USD - LIBOR | | | Quarterly | | | 08/23/2049 | | USD | | 580 | | | (16 | ) | | | (2 | ) | | | (14 | ) |
| | | | | | | | | | | | | | | | | | | | | | | | |
| | | | | | | | | | | | | | $ | (718 | ) | | $ | (4 | ) | | $ | (714 | ) |
| | | | | | | | | | | | | | | | | | | | | | | | |
Percentages are based on Net Assets of $151,141 ($ Thousands).
| * | Non-income producing security. |
| ** | Rate shown is the7-day effective yield as of August 31, 2019. |
| † | Investment in Affiliated Security (see Note 5). |
| (A) | Variable or floating rate security, the interest rate of which adjusts periodically based on changes in current interest rates and prepayments on the underlying pool of assets. |
| (B) | Security exempt from registration under Rule 144A of the Securities Act of 1933. These securities may be resold in transactions exempt from registration normally to qualified institutions. On August 31, 2019, the value of these securities amounted to $25,217 ($ Thousands), representing 16.7% of the Net Assets of the Fund. |
| (C) | Zero coupon security. The rate shown on the Schedule of Investments is the security’s effective yield at the time of purchase. |
| (D) | Step Bonds — Represents the current rate, the step rate, the step date and the final maturity date. |
| (E) | Unsettled bank loan. Interest rate may not be available. |
| (F) | Refer to table below for details on Options Contracts. |
| | |
| 24 | | SEI Catholic Values Trust / Semi-Annual Report / August 31, 2019 |
AUD — Australian Dollar
BBA — British Bankers’ Association
BRL — Brazilian Real
CAD — Canadian Dollar
Cl — Class
CMO — Collateralized Mortgage Obligation
CNY — Chinese Yuan Onshore
DN — Discount Note
EUR — Euro
FHLB — Federal Home Loan Bank
FHLMC — Federal Home Loan Mortgage Corporation
FNMA — Federal National Mortgage Association
GBP — British Pound Sterling
GNMA — Government National Mortgage Association
GO — General Obligation
ICE — Intercontinental Exchange
IDR — Indonesian Rupiah
INR — Indian Rupee
IO — Interest Only — face amount represents notional amount.
LIBOR — London Interbank Offered Rate
LLC — Limited Liability Company
LP — Limited Partnership
MTN — Medium Term Note
PHP — Philippine Peso
RB — Revenue Bond
REMIC — Real Estate Mortgage Investment Conduit
RUB — Russian Ruble
Ser — Series
TBA — To Be Announced
ULC — Unlimited Liability Company
USD — U.S. Dollar
VAR — Variable Rate
ZAR — South African Rand
The following is a list of the inputs used as of August 31, 2019, in valuing the Fund’s investments and other financial instruments carried at value ($ Thousands):
| | | | | | | | | | | | | | | | |
| Investments in Securities | | Level 1 | | | Level 2 | | | Level 3 | | | Total | |
Mortgage-Backed Securities | | $ | — | | | $ | 57,913 | | | $ | — | | | $ | 57,913 | |
Corporate Obligations | | | — | | | | 49,772 | | | | — | | | | 49,772 | |
U.S. Treasury Obligations | | | — | | | | 22,595 | | | | — | | | | 22,595 | |
Asset-Backed Securities | | | — | | | | 13,186 | | | | — | | | | 13,186 | |
U.S. Government Agency Obligations | | | — | | | | 3,445 | | | | — | | | | 3,445 | |
Sovereign Debt | | | — | | | | 3,339 | | | | — | | | | 3,339 | |
Loan Participations | | | — | | | | 2,438 | | | | — | | | | 2,438 | |
Municipal Bonds | | | — | | | | 1,368 | | | | — | | | | 1,368 | |
Cash Equivalent | | | 5,314 | | | | — | | | | — | | | | 5,314 | |
| | | | | | | | | | | | | | | | |
Total Investments in Securities | | $ | 5,314 | | | $ | 154,056 | | | $ | — | | | $ | 159,370 | |
| | | | | | | | | | | | | | | | |
| | | | | | | | | | | | | | | | |
| Other Financial Instruments | | Level 1 | | | Level 2 | | | Level 3 | | | Total | |
Purchased Options | | $ | 63 | | | $ | — | | | $ | — | | | $ | 63 | |
Futures Contracts * | | | | | | | | | | | | | | | | |
Unrealized Appreciation | | | 163 | | | | — | | | | — | | | | 163 | |
Unrealized Depreciation | | | (45 | ) | | | — | | | | — | | | | (45 | ) |
Forwards Contracts * | | | | | | | | | | | | | | | | |
Unrealized Appreciation | | | — | | | | 78 | | | | — | | | | 78 | |
Unrealized Depreciation | | | — | | | | (284 | ) | | | — | | | | (284 | ) |
Centrally Cleared Swaps | | | | | | | | | | | | | | | | |
Credit Default Swaps * | | | | | | | | | | | | | | | | |
Unrealized Appreciation | | | — | | | | 31 | | | | — | | | | 31 | |
Interest Rate Swaps * | | | | | | | | | | | | | | | | |
Unrealized Depreciation | | | — | | | | (714 | ) | | | — | | | | (714 | ) |
| | | | | | | | | | | | | | | | |
Total Other Financial Instruments | | $ | 181 | | | $ | (889 | ) | | $ | — | | | $ | (708 | ) |
| | | | | | | | | | | | | | | | |
| * | Futures contracts, forward contracts and swap contracts are valued at the unrealized appreciation (depreciation) on the instrument. |
For the period ended August 31, 2019, there were no transfers between Level 1 and Level 2 assets and liabilities. For the period ended August 31, 2019, there were no transfers from Level 2 into Level 3 assets and liabilities. For the period ended August 31, 2019, there were no Level 3 investments.
The following is a summary of the transactions with affiliates for the period ended August 31, 2019 ($ Thousands):
| | | | | | | | | | | | | | | | | | | | | | | | | | | | | | | | | | | | |
| Security Description | | Value 2/28/19 | | | Purchases at
Cost | | | Proceeds from Sales | | | Realized Gain
(Loss) | | | Change in
Unrealized
Appreciation
(Depreciation) | | | Value
8/31/19 | | | Shares | | | Income | | | Capital Gains | |
SEI Daily Income Trust, Government Fund, Cl F | | $ | 6,772 | | | $ | 32,830 | | | $ | (34,288 | ) | | $ | — | | | $ | — | | | $ | 5,314 | | | | 5,314,163 | | | $ | 53 | | | $ | — | |
| | | | | | | | | | | | | | | | | | | | | | | | | | | | | | | | | | | | |
Amounts designated as “—” are $0.
The accompanying notes are an integral part of the financial statements.
| | |
| SEI Catholic Values Trust / Semi-Annual Report / August 31, 2019 | | 25 |
STATEMENTS OF ASSETS AND LIABILITIES(Unaudited) ($ Thousands)
August 31, 2019
| | | | | | | | |
| | | Catholic Values
Equity Fund | | | Catholic Values
Fixed Income Fund | |
| | | | | | | | |
Assets: | | | | | | | | |
Investments, at Value† | | $ | 261,703 | | | $ | 154,056 | |
Affiliated Investments, at Value†† | | | 9,010 | | | | 5,314 | |
Cash | | | 236 | | | | — | |
Cash Collateral on Futures | | | 395 | | | | 90 | |
Cash Collateral on Swap Contracts | | | — | | | | 509 | |
Foreign Currency, at Value††† | | | 1,043 | | | | 67 | |
Receivable for Fund Shares Sold | | | 42 | | | | 58 | |
Receivable for Investment Securities Sold | | | 2,859 | | | | 2,461 | |
Dividends and Interest Receivable | | | 461 | | | | 830 | |
Unrealized Appreciation on Forward Foreign Currency Contracts | | | — | | | | 78 | |
Options Purchased, at Value†††† | | | — | | | | 63 | |
Foreign Tax Reclaim Receivable | | | 3 | | | | — | |
Prepaid Expenses | | | 34 | | | | 20 | |
Total Assets | | | 275,786 | | | | 163,546 | |
Liabilities: | | | | | | | | |
Payable for Investment Securities Purchased | | | 2,834 | | | | 11,438 | |
Payable for Fund Shares Redeemed | | | 785 | | | | 342 | |
Income Distribution Payable | | | — | | | | 1 | |
Payable to Custodian | | | — | | | | 187 | |
Payable for Variation Margin on Futures Contracts | | | 8 | | | | 14 | |
Payable for Variation Margin on Swap Contracts | | | — | | | | 29 | |
Administration Fees Payable | | | 61 | | | | 20 | |
Shareholder Servicing Fees Payable, Class F | | | 19 | | | | 9 | |
Unrealized Depreciation on Forward Foreign Currency Contracts | | | — | | | | 284 | |
Trustees Fees Payable | | | 1 | | | | 1 | |
Chief Compliance Officer Fees Payable | | | 1 | | | | 1 | |
Investment Advisory Fees Payable | | | 96 | | | | 38 | |
Accrued Expense Payable | | | 47 | | | | 41 | |
Total Liabilities | | | 3,852 | | | | 12,405 | |
Net Assets | | $ | 271,934 | | | $ | 151,141 | |
† Cost of Investments | | $ | 225,161 | | | $ | 146,181 | |
†† Cost of Affiliated Investments | | | 9,010 | | | | 5,314 | |
††† Cost of Foreign Currency | | | 1,046 | | | | 66 | |
†††† Cost of Purchased Options | | | — | | | | 29 | |
Net Assets: | | | | | | | | |
Paid-in Capital — (Unlimited Authorization — No Par Value) | | $ | 227,697 | | | $ | 144,492 | |
Total Distributable Earnings | | | 44,237 | | | | 6,649 | |
Net Assets | | $ | 271,934 | | | $ | 151,141 | |
Net Asset Value, Offering and Redemption Price Per Share — Class F | | $ | 12.17 | | | $ | 10.46 | |
| | | ($234,494,858 ÷ | | | | ($112,663,414 ÷ | |
| | | | 19,268,092 shares | ) | | | 10,773,523 shares | ) |
Net Asset Value, Offering and Redemption Price Per Share — Class Y | | $ | 12.14 | | | $ | 10.47 | |
| | | ($37,439,116 ÷ | | | | ($38,477,497 ÷ | |
| | | | 3,082,832 shares | ) | | | 3,676,766 shares | ) |
Amounts designated as “—” are $0 or have been rounded to $0.
The accompanying notes are an integral part of the financial statements.
| | |
| 26 | | SEI Catholic Values Trust / Semi-Annual Report / August 31, 2019 |
STATEMENTS OF OPERATIONS (Unaudited) ($ Thousands)
For thesix-month period ended August 31, 2019
| | | | | | | | |
| | | Catholic Values
Equity Fund | | | Catholic Values
Fixed Income Fund | |
| | | | | | | | |
Investment Income: | | | | | | | | |
Dividends | | $ | 3,184 | | | $ | — | |
Income from Affiliated Registered Investment Company(1) | | | 86 | | | | 53 | |
Interest Income | | | 28 | | | | 2,458 | |
Less: Foreign Taxes Withheld | | | (185 | ) | | | — | |
Total Investment Income | | | 3,113 | | | | 2,511 | |
Expenses: | | | | | | | | |
Investment Advisory Fees | | | 820 | | | | 261 | |
Administration Fees | | | 410 | | | | 149 | |
Shareholder Servicing Fees, Class F Shares | | | 294 | | | | 140 | |
Professional Fees | | | 32 | | | | 18 | |
Registration Fees | | | 26 | | | | 16 | |
Printing Fees | | | 15 | | | | 9 | |
Custodian/Wire Agent Fees | | | 11 | | | | 20 | |
Pricing Fees | | | 10 | | | | 44 | |
Trustees’ Fees | | | 3 | | | | 1 | |
Other Expenses | | | 17 | | | | 10 | |
Total Expenses | | | 1,638 | | | | 668 | |
Less: | | | | | | | | |
Waiver of Investment Advisory Fees | | | (250 | ) | | | (37 | ) |
Waiver of Shareholder Servicing Fees, Class F Shares | | | (176 | ) | | | (84 | ) |
Waiver of Administration Fees | | | (54 | ) | | | (35 | ) |
Net Expenses | | | 1,158 | | | | 512 | |
Net Investment Income | | | 1,955 | | | | 1,999 | |
Net Realized and Unrealized Gain (Loss) on Investments: | | | | | | | | |
Net Realized Gain (Loss) on: | | | | | | | | |
Investments | | | 4,643 | | | | 840 | |
Futures Contracts | | | 753 | | | | 467 | |
Forward Foreign Currency Contracts | | | 2 | | | | 88 | |
Foreign Currency Transactions | | | (9 | ) | | | (2 | ) |
Purchased and Written Options | | | — | | | | 95 | |
Swap Contracts | | | — | | | | (96 | ) |
Net Change in Unrealized Appreciation (Depreciation) on: | | | | | | | | |
Investments | | | (1,352 | ) | | | 8,760 | |
Futures Contracts | | | (633 | ) | | | 89 | |
Forward Foreign Currency Contracts | | | — | | | | (220 | ) |
Foreign Currency and Translation of Other Assets and Liabilities Denominated in Foreign Currencies | | | (3 | ) | | | (1 | ) |
Purchased and Written Options | | | — | | | | 34 | |
Swap Contracts | | | — | | | | (778 | ) |
Net Increase in Net Assets Resulting from Operations | | $ | 5,356 | | | $ | 11,275 | |
| (1) | See Note 5 in the Notes to the Financial Statements. |
Amounts designated as “—” are $0 or have been rounded to $0.
The accompanying notes are an integral part of the financial statements.
| | |
| SEI Catholic Values Trust / Semi-Annual Report / August 31, 2019 | | 27 |
STATEMENTS OF CHANGES IN NET ASSETS ($ Thousands)
For thesix-month period ended August 31, 2019 (Unaudited) and the year ended February 28, 2019
| | | | | | | | | | | | | | | | |
| | | Catholic Values Equity Fund | | | Catholic Values Fixed Income Fund | |
| | | 8/31/2019 | | | 2/28/2019 | | | 8/31/2019 | | | 2/28/2019 | |
| | | | | | | | | | | | | | | | |
Operations: | | | | | | | | | | | | | | | | |
Net Investment Income | | $ | 1,955 | | | $ | 3,257 | | | $ | 1,999 | | | $ | 4,077 | |
Net Realized Gain (Loss) on Investments, Futures Contracts, Options and Swap Contracts | | | 5,396 | | | | 6,056 | | | | 1,306 | | | | (262 | ) |
Net Realized Gain (Loss) on Foreign Currency Transactions and Forward Foreign Currency Contracts | | | (7 | ) | | | (5 | ) | | | 86 | | | | 1 | |
Net Change in Unrealized Appreciation (Depreciation) on Investments, Futures Contracts, Options and Swap Contracts | | | (1,985 | ) | | | (6,360 | ) | | | 8,105 | | | | 929 | |
Net Change in Unrealized Appreciation (Depreciation) on Forward Foreign Currency Contracts, Foreign Currencies and Translation of Other Assets and Liabilities Denominated in Foreign Currencies | | | (3 | ) | | | 1 | | | | (221 | ) | | | — | |
Net Increase in Net Assets Resulting from Operations | | | 5,356 | | | | 2,949 | | | | 11,275 | | | | 4,745 | |
Distributions: | | | | | | | | | | | | | | | | |
Class F | | | — | | | | (10,898 | ) | | | (1,606 | ) | | | (3,328 | ) |
Class Y | | | — | | | | (1,790 | ) | | | (555 | ) | | | (1,039 | ) |
Total Distributions | | | — | | | | (12,688 | ) | | | (2,161 | ) | | | (4,367 | ) |
Capital Share Transactions: | | | | | | | | | | | | | | | | |
Class F: | | | | | | | | | | | | | | | | |
Proceeds from Shares Issued | | | 8,578 | | | | 23,862 | | | | 6,116 | | | | 14,015 | |
Reinvestment of Dividends & Distributions | | | — | | | | 10,878 | | | | 1,598 | | | | 3,317 | |
Cost of Shares Redeemed | | | (8,316 | ) | | | (22,076 | ) | | | (9,586 | ) | | | (25,977 | ) |
Net Increase (Decrease) in Net Assets from Class F Transactions | | | 262 | | | | 12,664 | | | | (1,872 | ) | | | (8,645 | ) |
Class Y: | | | | | | | | | | | | | | | | |
Proceeds from Shares Issued | | | 3,105 | | | | 10,927 | | | | 1,244 | | | | 10,078 | |
Reinvestment of Dividends & Distributions | | | — | | | | 1,790 | | | | 555 | | | | 1,037 | |
Cost of Shares Redeemed | | | (1,545 | ) | | | (10,573 | ) | | | (1,301 | ) | | | (10,762 | ) |
Net Increase in Net Assets from Class Y Transactions | | | 1,560 | | | | 2,144 | | | | 498 | | | | 353 | |
Net Increase (Decrease) in Net Assets Derived from Capital Share Transactions | | | 1,822 | | | | 14,808 | | | | (1,374 | ) | | | (8,292 | ) |
Net Increase (Decrease) in Net Assets | | | 7,178 | | | | 5,069 | | | | 7,740 | | | | (7,914 | ) |
Net Assets: | | | | | | | | | | | | | | | | |
Beginning of Period | | | 264,756 | | | | 259,687 | | | | 143,401 | | | | 151,315 | |
End of Period | | $ | 271,934 | | | $ | 264,756 | | | $ | 151,141 | | | $ | 143,401 | |
Capital Share Transactions: | | | | | | | | | | | | | | | | |
Class F: | | | | | | | | | | | | | | | | |
Shares Issued | | | 707 | | | | 2,057 | | | | 605 | | | | 1,445 | |
Shares Issued in Lieu of Dividends & Distributions | | | — | | | | 994 | | | | 157 | | | | 341 | |
Shares Redeemed | | | (685 | ) | | | (1,779 | ) | | | (945 | ) | | | (2,687 | ) |
Net Increase (Decrease) in Shares Outstanding from Share Transactions | | | 22 | | | | 1,272 | | | | (183 | ) | | | (901 | ) |
Capital Share Transactions: | | | | | | | | | | | | | | | | |
Class Y: | | | | | | | | | | | | | | | | |
Shares Issued | | | 252 | | | | 879 | | | | 124 | | | | 1,036 | |
Shares Issued in Lieu of Dividends & Distributions | | | — | | | | 164 | | | | 55 | | | | 106 | |
Shares Redeemed | | | (129 | ) | | | (845 | ) | | | (129 | ) | | | (1,104 | ) |
Net Increase in Shares Outstanding from Share Transactions | | | 123 | | | | 198 | | | | 50 | | | | 38 | |
Amounts designated as “—” are $0 or have been rounded to $0.
The accompanying notes are an integral part of the financial statements.
| | |
| 28 | | SEI Catholic Values Trust / Semi-Annual Report / August 31, 2019 |
FINANCIAL HIGHLIGHTS
For thesix-month period ended August 31, 2019 (Unaudited) and the year or period ended February 28,
For a share outstanding throughout the year or period
| | | | | | | | | | | | | | | | | | | | | | | | | | | | | | | | | | | | | | | | | | | | | | | | | | | | | | | | |
| | | Net Asset
Value,
Beginning
of Period | | | Net
Investment
Income(1) | | | Net Realized
and
Unrealized
Gains (Losses)
on
Investments(1) | | | Total
from
Operations | | | Dividends
from Net
Investment
Income | | | Distributions
from Net
Realized
Gains | | | Total
Dividends
and
Distributions | | | Net Asset
Value, End
of Period | | | Total
Return† | | | Net Assets End of Period
($ Thousands) | | | Ratio of Net
Expenses
to Average
Net Assets | | | Ratio of Expenses
to Average
Net Assets
(Excluding Fees
Paid Indirectly
and Waivers) | | | Ratio of Net
Investment
Income
to Average
Net Assets | | | Portfolio
Turnover
Rate† | |
Catholic Values Equity Fund | | | | | | | | | | | | | | | | | | | | | | | | | | | | | | | | | | | | | | | | | |
Class F | | | | | | | | | | | | | | | | | | | | | | | | | | | | | | | | | | | | | | | | | | | | | | | | | | | | | | | | |
2019@ | | | $11.93 | | | | $0.09 | | | | $0.15 | | | | $0.24 | | | | $— | | | | $— | | | | $— | | | | $12.17 | | | | 2.01% | | | | $234,495 | | | | 0.86% | | | | 1.23% | | | | 1.42% | | | | 18% | |
2019 | | | 12.53 | | | | 0.15 | | | | (0.13) | | | | 0.02 | | | | (0.15) | | | | (0.47) | | | | (0.62) | | | | 11.93 | | | | 0.62 | | | | 229,548 | | | | 0.82 | | | | 1.24 | | | | 1.26 | | | | 49 | |
2018 | | | 10.61 | | | | 0.11 | | | | 1.90 | | | | 2.01 | | | | (0.09) | | | | — | | | | (0.09) | | | | 12.53 | | | | 18.93 | | | | 225,146 | | | | 0.86 | | | | 1.24 | | | | 0.94 | | | | 56 | |
2017 | | | 8.57 | | | | 0.09 | | | | 2.05 | | | | 2.14 | | | | (0.10) | | | | — | | | | (0.10) | | | | 10.61 | | | | 25.03 | | | | 185,908 | | | | 0.86 | | | | 1.25 | | | | 0.88 | | | | 63 | |
2016(2) | | | 10.00 | | | | 0.08 | | | | (1.44) | | | | (1.36) | | | | (0.07) | | | | — | | | | (0.07) | | | | 8.57 | | | | (13.66) | | | | 142,564 | | | | 0.86 | | | | 1.32 | | | | 0.96 | | | | 84 | |
Class Y | | | | | | | | | | | | | | | | | | | | | | | | | | | | | | | | | | | | | | | | | | | | | | | | | | | | | | | | |
2019@ | | | $11.90 | | | | $0.09 | | | | $0.15 | | | | $0.24 | | | | $— | | | | $— | | | | $— | | | | $12.14 | | | | 2.02% | | | | $37,439 | | | | 0.76% | | | | 0.98% | | | | 1.53% | | | | 18% | |
2019 | | | 12.51 | | | | 0.16 | | | | (0.13) | | | | 0.03 | | | | (0.17) | | | | (0.47) | | | | (0.64) | | | | 11.90 | | | | 0.71 | | | | 35,207 | | | | 0.76 | | | | 0.99 | | | | 1.31 | | | | 49 | |
2018 | | | 10.60 | | | | 0.12 | | | | 1.90 | | | | 2.02 | | | | (0.11) | | | | — | | | | (0.11) | | | | 12.51 | | | | 19.05 | | | | 34,541 | | | | 0.76 | | | | 0.99 | | | | 1.06 | | | | 56 | |
2017 | | | 8.56 | | | | 0.10 | | | | 2.06 | | | | 2.16 | | | | (0.12) | | | | — | | | | (0.12) | | | | 10.60 | | | | 25.28 | | | | 11,516 | | | | 0.76 | | | | 1.00 | | | | 0.98 | | | | 63 | |
2016(3) | | | 10.04 | | | | 0.07 | | | | (1.47) | | | | (1.40) | | | | (0.08) | | | | — | | | | (0.08) | | | | 8.56 | | | | (14.05) | | | | 9,308 | | | | 0.76 | | | | 1.07 | | | | 1.01 | | | | 84 | |
Catholic Values Fixed Income Fund | | | | | | | | | | | | | | | | | | | | | | | | | | | | | | | | | | | | | | | | | |
Class F | | | | | | | | | | | | | | | | | | | | | | | | | | | | | | | | | | | | | | | | | | | | | | | | | | | | | | | | |
2019@ | | | $9.83 | | | | $0.13 | | | | $0.65 | | | | $0.78 | | | | $(0.15) | | | | $— | | | | $(0.15) | | | | $10.46 | | | | 7.95% | | | | $112,663 | | | | 0.71% | | | | 0.96% | | | | 2.66% | | | | 67% | |
2019 | | | 9.79 | | | | 0.25 | | | | 0.07 | | | | 0.32 | | | | (0.28) | | | | — | | | | (0.28) | | | | 9.83 | | | | 3.29 | | | | 107,715 | | | | 0.67 | | | | 0.96 | | | | 2.66 | | | | 159 | |
2018 | | | 9.93 | | | | 0.20 | | | | (0.11) | | | | 0.09 | | | | (0.23) | | | | — | | | | (0.23) | | | | 9.79 | | | | 0.87 | | | | 116,124 | | | | 0.71 | | | | 0.96 | | | | 2.06 | | | | 194 | |
2017 | | | 9.89 | | | | 0.19 | | | | 0.11 | | | | 0.30 | | | | (0.23) | | | | (0.03) | | | | (0.26) | | | | 9.93 | | | | 3.11 | | | | 111,465 | | | | 0.71 | | | | 1.04 | | | | 1.87 | | | | 124 | |
2016(2) | | | 10.00 | | | | 0.14 | | | | (0.09) | | | | 0.05 | | | | (0.16) | | | | — | | | | (0.16) | | | | 9.89 | | | | 0.54 | | | | 86,406 | | | | 0.71 | | | | 1.09 | | | | 1.77 | | | | 216 | |
Class Y | | | | | | | | | | | | | | | | | | | | | | | | | | | | | | | | | | | | | | | | | | | | | | | | | | | | | | | | |
2019@ | | | $9.84 | | | | $0.14 | | | | $0.64 | | | | $0.78 | | | | $(0.15) | | | | $— | | | | $(0.15) | | | | $10.47 | | | | 8.00% | | | | $38,478 | | | | 0.61% | | | | 0.71% | | | | 2.75% | | | | 67% | |
2019 | | | 9.81 | | | | 0.26 | | | | 0.06 | | | | 0.32 | | | | (0.29) | | | | — | | | | (0.29) | | | | 9.84 | | | | 3.29 | | | | 35,686 | | | | 0.61 | | | | 0.71 | | | | 2.72 | | | | 159 | |
2018 | | | 9.94 | | | | 0.23 | | | | (0.12) | | | | 0.11 | | | | (0.24) | | | | — | | | | (0.24) | | | | 9.81 | | | | 1.07 | | | | 35,191 | | | | 0.61 | | | | 0.74 | | | | 2.35 | | | | 194 | |
2017 | | | 9.89 | | | | 0.20 | | | | 0.15 | | | | 0.35 | | | | (0.24) | | | | (0.03) | | | | (0.27) | | | | 9.94 | | | | 3.32 | | | | 1,170 | | | | 0.61 | | | | 0.79 | | | | 1.97 | | | | 124 | |
2016(3) | | | 9.95 | | | | 0.14 | | | | (0.04) | | | | 0.10 | | | | (0.16) | | | | — | | | | (0.16) | | | | 9.89 | | | | 1.00 | | | | 1,185 | | | | 0.61 | | | | 0.84 | | | | 1.97 | | | | 216 | |
| | @ | For thesix-month period ended August 31, 2019. All ratios for the period have been annualized. |
| | † | Returns and portfolio turnover rates are for the period indicated and have not been annualized. Returns do not reflect the deduction of taxes the shareholder would pay on fund distributions or redemption of fund shares. |
| | (1) | Per share net investment income and net realized and unrealized gains (losses) calculated using average shares. |
| | (2) | Commenced operations on April 30, 2015. All ratios for the period have been annualized. |
| | (3) | Commenced operations on May 31, 2015. All ratios for the period have been annualized. |
Amounts designated as “—” are either $0 or have been rounded to $0.
The accompanying notes are an integral part of the financial statements.
| | |
| SEI Catholic Values Trust / Semi-Annual Report / August 31, 2019 | | 29 |
NOTES TO FINANCIAL STATEMENTS (Unaudited)
August 31, 2019
1. ORGANIZATION
SEI Catholic Values Trust (the “Trust”) is organized as a Delaware statutory trust under a Declaration of Trust dated December 8, 2014.
The Trust is registered under the Investment Company Act of 1940, as amended, as a diversified,open-end investment company with two operational Funds: Catholic Values Equity Fund (“Equity Fund”) and Catholic Values Fixed Income Fund (“Fixed Income Fund”) (each a “Fund”, collectively, the “Funds”), both of which are diversified Funds. The Trust is registered to offer: Class F and Class Y shares of the Funds. The assets of each Fund are segregated, and a shareholder’s interest is limited to the Fund in which shares are held. The Funds’ prospectuses provide a description of each Fund’s investment objective and strategies.
In addition to its objective and strategies, each of the Funds makes investment decisions consistent with Catholic values on a range of social and moral concerns that may include: protecting human life; promoting human dignity; reducing arms production; pursuing economic justice; protecting the environment, and encouraging corporate responsibility. Potential investments for the Funds are first selected for financial soundness and then evaluated according to the Funds’ social criteria. The Adviser has engaged an independent compliance support organization that has identified a list of issuers that do not align with Catholic values. The Funds will not invest in issuers identified through this process. The Adviser reserves the right to modify the criteria from time to time to maintain alignment with evolving Catholic social and moral positions.
2. SIGNIFICANT POLICIES
The following are significant accounting policies, which are consistently followed in the preparation of its financial statements by the Funds. The Funds are investment companies that apply the accounting and reporting guidance issued in Topic 946 by the U.S. Financial Accounting Standards Board (“FASB”).
Use of Estimates— The preparation of financial statements, in conformity with accounting principles generally accepted in the United States of America (“U.S. GAAP”) requires management to make estimates and assumptions that affect the reported amount of assets and liabilities and disclosure of contingent assets and liabilities at the date of the financial statements and the reported amounts of increases and decreases in net assets from operations during the reporting period. Actual results could differ from those estimates.
Security Valuation— Securities listed on a securities exchange, market or automated quotation system
for which quotations are readily available (other than securities traded on National Association of Securities Dealers Automated Quotations (“NASDAQ”) or as otherwise noted below) at the last quoted sale price on an exchange or market (foreign or domestic) on which the securities are traded, or, if there is no such reported sale, at the most recent quoted bid price. The Funds value securities traded on NASDAQ at the NASDAQ Official Closing Price. If available, debt securities, swaps (which are not centrally cleared), bank loans or collateralized debt obligations (including collateralized loan obligations), such as those held by the Funds, are priced based upon valuations provided by independent, third-party pricing agents. Such values generally reflect the last reported sales price if the security is actively traded. The third-party pricing agents may also value debt securities at an evaluated bid price by employing methodologies that utilize actual market transactions, broker-supplied valuations or other methodologies designed to identify the market value for such securities. Redeemable securities issued byopen-end investment companies are valued at the investment company’s applicable net asset value, with the exception of ETFs, which are priced as equity securities. The prices of foreign securities are reported in local currency and converted to U.S. dollars using currency exchange rates. If a security’s price cannot be obtained, as noted above, the Funds will value the securities using a bid price from at least one independent broker. If such prices are not readily available or cannot be valued using the methodologies described above, the Funds will value the security using the Funds’ Fair Value Pricing Policies and Procedures (“Fair Value Procedures”), as described below.
On the first day a new debt security purchase is recorded, if a price is not available from a third-party pricing agent or an independent broker, the security may be valued at its purchase price. Each day thereafter, the debt security will be valued according to the Funds’ Fair Value Procedures until a price from an independent source can be secured. Securities held by a Fund with remaining maturities of 60 days or less may be valued by the amortized cost method, which involves valuing a security at its cost on the date of purchase and thereafter (absent unusual circumstances) assuming a constant amortization to maturity of any discount or premium, regardless of the impact of fluctuations in general market rates of interest on the value of the instrument. While this method provides certainty in valuation, it may result in periods during which value, as determined by this method, is higher or lower than the price a Fund would receive if it sold the instrument. Further, the value of securities in the Fund can be expected to vary inversely with changes in prevailing
| | |
| 30 | | SEI Catholic Values Trust / Semi-Annual Report / August 31, 2019 |
interest rates. Should existing credit, liquidity or interest rate conditions in the relevant markets and issuer-specific circumstances suggest that amortized cost does not approximate fair value, then the amortized cost method may not be used.
Options and warrants are valued at the last quoted sales price. If there is no such reported sale on the valuation date, long positions are valued at the most recent bid price, and short positions are valued at the most recent ask price.
Futures and swaps cleared through a central clearing house (“Centrally Cleared swaps”) are valued at the settlement price established each day by the board of exchange on which they are traded. The daily settlement prices for financial futures and centrally cleared swaps are provided by an independent source. On days when there is excessive volume, market volatility or the future or centrally cleared swap does not end trading by the time a Fund calculates its NAV, the settlement price may not be available at the time at which the Fund calculates its NAV. On such days, the best available price (which is typically the last sales price) may be used to value a Fund’s futures or centrally cleared swaps position.
Foreign currency forward contracts are valued at the current day’s interpolated foreign exchange rate, as calculated using the current day’s spot rate, and the thirty, sixty, ninety andone-hundred eighty day forward rates provided by an independent source.
Prices for most securities held by a Fund are provided daily by third-party independent pricing agents. SEI Investments Management Corporation (“SIMC”) or aSub-Adviser(“Sub-Adviser”), as applicable, reasonably believes that prices provided by independent pricing agents are reliable. However, there can be no assurance that such pricing service’s prices will be reliable. SIMC or aSub-Adviser, as applicable, monitors the reliability of prices obtained from any pricing service and shall promptly notify the Funds’ administrator if it believes that a particular pricing service is no longer a reliable source of prices. The Funds’ administrator, in turn, notifies the Fair Value Pricing Committee (the “Committee”) if it receives such notification from SIMC or aSub-Adviser, as applicable, or if the Funds’ administrator reasonably believes that a particular pricing service is no longer a reliable source for prices.
The Funds’ Fair Value Procedures provide that any change in a primary pricing agent or a pricing methodology requires prior approval by the Board of Trustees (“Board”) or its designatedsub-committee. However, when the change would not materially affect valuation of a Fund’s net assets or involve a material departure in pricing methodology from that of the Fund’s
existing pricing agent or pricing methodology, approval may be obtained at the next regularly scheduled meeting of the Board.
Securities for which market prices are not readily available, for which market prices are determined to be unreliable, or which cannot be valued using the methodologies described above are valued in accordance with the Fair Value Procedures established by the Board. The Funds’ Fair Value Procedures are implemented through the Committee designated by the Board. The Committee is currently composed of two members of the Board, as well as representatives from SIMC and its affiliates. Some of the more common reasons that may necessitate that a security be valued using Fair Value Procedures include: (i) the security’s trading has been halted or suspended, (ii) the security has been delisted from a national exchange, (iii) the security’s primary trading market is temporarily closed at a time when under normal conditions it would be open, or (iv) the security’s primary pricing source is not able or willing to provide a price. When a security is valued in accordance with the Fair Value Procedures, the Committee will determine the value after taking into consideration relevant information reasonably available to the Committee. Examples of factors the Committee may consider include: (i) the facts giving rise to the need to fair value, (ii) the last trade price, (iii) the performance of the market or the issuer’s industry, (iv) the liquidity of the security, (v) the size of the holding in a Fund, or (vi) any other appropriate information.
The determination of a security’s fair value price often involves the consideration of a number of subjective factors, and is therefore subject to the unavoidable risk that the value assigned to a security may be higher or lower than the security’s value would be if a reliable market quotation for the security was readily available.
For securities that principally trade on a foreign market or exchange, a significant gap in time can exist between the time of a particular security’s last trade and the time at which a Fund calculates its Net Asset Value (“NAV”). The closing prices of such securities may no longer reflect their market value at the time a Fund calculates NAV if an event that could materially affect the value of those securities (a “Significant Event”), including substantial fluctuations in domestic or foreign markets or occurrences not tied directly to the securities markets, such as natural disasters, armed conflicts or significant governmental actions, has occurred between the time of the security’s last close and the time that the Fund calculates NAV. A Fund may invest in securities that are primarily listed on foreign exchanges that trade on weekends or other days when the Fund does not price its shares. As a result, the NAV of the Fund’s shares may
| | |
| SEI Catholic Values Trust / Semi-Annual Report / August 31, 2019 | | 31 |
NOTES TO FINANCIAL STATEMENTS (Unaudited) (Continued)
August 31, 2019
change on days when shareholders will not be able to purchase or redeem Fund shares.
A Significant Event may relate to a single issuer or to an entire market sector. If SIMC or aSub-Adviser becomes aware of a Significant Event that has occurred with respect to a security or group of securities after the closing of the exchange or market on which the security or securities principally trade, but before the time at which the Funds calculate NAV, it may request that a Committee meeting be called. In addition, the Funds use several processes, with respect to certain securities to monitor the pricing data supplied by various sources, including price comparisons and price movements. Any identified discrepancies are researched and subject to the procedures described above.
The Equity Fund and Fixed Income Fund, which may hold international securities, use a third-party fair valuation vendor. The vendor provides a fair value for foreign securities held by the Funds based on certain factors and methodologies (involving, generally, tracking valuation correlations between the U.S. market and eachnon-U.S. security). Values from the fair value vendor are applied in the event that there is a movement in the U.S. market that exceeds a specific threshold that has been established by the Committee. The Committee has also established a “confidence interval” which is used to determine the level of historical correlation between the value of a specific foreign security and movements in the U.S. market before a particular security will be fair valued when the threshold is exceeded. In the event that the threshold established by the Committee is exceeded on a specific day, these Funds will value thenon-U.S. securities in their portfolios that exceed the applicable “confidence interval” based upon the adjusted prices provided by the fair valuation vendor.
In accordance with U.S. GAAP, fair value is defined as the price that a Fund would receive upon selling an investment in an orderly transaction to an independent buyer in the principal or most advantageous market of the investment. A three tier hierarchy has been established to maximize the use of observable and minimize the use of unobservable inputs and to establish classification of fair value measurements for disclosure purposes. Inputs refer broadly to the assumptions that market participants would use in pricing an asset. Inputs may be observable or unobservable. Observable inputs are inputs that reflect the assumptions market participants would use in pricing the asset or liability based on market data obtained from sources independent of the reporting entity. Unobservable inputs are inputs that reflect the reporting entity’s own assumptions about the assumptions market participants
would use in pricing the asset or liability based on the best information available in the circumstances.
The three-tier hierarchy of inputs is summarized in the three broad Levels listed below:
Level 1 — Unadjusted quoted prices in active markets for identical, unrestricted assets or liabilities that the Fund has the ability to access at the measurement date;
Level 2 — Quoted prices which are not active, or inputs that are observable (either directly or indirectly) for substantially the full term of the asset or liability; and
Level 3 — Prices, inputs or exotic modeling techniques which are both significant to the fair value measurement and unobservable (supported by little or no market activity).
Investments are classified within the level of the lowest significant input considered in determining fair value. Investments classified within Level 3 whose fair value measurement considers several inputs may include Level 1 or Level 2 inputs as components of the overall fair value measurement.
Debt securities are valued in accordance with the evaluated bid price supplied by the pricing service and generally categorized as Level 2 in the hierarchy. Other securities that are categorized as Level 2 in the hierarchy include, but are not limited to, preferred stocks, bank loans, warrants, swaps and forward contracts.
The valuation techniques used by the Funds to measure fair value during the period ended August 31, 2019 maximized the use of observable inputs and minimized the use of unobservable inputs.
For the period ended August 31, 2019, there have been no significant changes to the Trust’s fair valuation methodologies. For details of the investment classifications reference the Schedules of Investments.
Security Transactions and Investment Income— Security transactions are recorded on the trade date. Costs used in determining net realized capital gains and losses on the sale of securities are on the basis of specific identification. Dividend income is recognized on theex-dividend date, and interest income is recognized using the accrual basis of accounting. Income frompayment-in-kind securities is recorded daily based on the effective interest method of accrual.
Distributions received on securities that represent a return of capital or capital gains are recorded as a reduction of cost of investments and/or as a realized gain. The Trust estimates the components of distributions received that may be considered nontaxable distributions or capital gain distributions.
| | |
| 32 | | SEI Catholic Values Trust / Semi-Annual Report / August 31, 2019 |
Amortization and accretion is calculated using the scientific interest method, which approximates the effective interest method over the holding period of the security, which is not materially different from the effective interest method. Amortization of premiums and discounts is included in interest income.
Foreign Currency Translation— The books and records of the Funds investing in international securities are maintained in U.S. dollars on the following basis:
(i) market value of investment securities, assets and liabilities at the current rate of exchange; and
(ii) purchases and sales of investment securities, income and expenses at the relevant rates of exchange prevailing on the respective dates of such transactions.
The Funds do not isolate that portion of gains and losses on investments in equity securities that is due to changes in the foreign exchange rates from that which is due to changes in market prices of equity securities.
The Funds report certain foreign-currency-related transactions as components of realized gains for financial reporting purposes, whereas such components are treated as ordinary income for Federal income tax purposes.
Futures Contracts— To the extent consistent with its Investment Objective and Strategies, a Fund may use futures contracts for tactical hedging purposes as well as to enhance the Fund’s returns. In addition, fixed income funds will utilize futures contracts to help manage duration and yield curve exposure. These Funds’ investments in futures contracts are designed to enable the Funds to more closely approximate the performance of their benchmark indices. Initial margin deposits of cash or securities are made upon entering into futures contracts. The contracts aremarket-to-market daily and the resulting changes in value are accounted for as unrealized gains and losses. Variation margin payments are paid or received, depending upon whether unrealized gains or losses are incurred. When contracts are closed, the Funds record a realized gain or loss equal to the difference between the proceeds from (or cost of) the closing transaction and the amount invested in the contract.
Risks of entering into futures contracts include the possibility that there will be an imperfect price correlation between the futures and the underlying securities. Second, it is possible that a lack of liquidity for futures contracts could exist in the secondary market, resulting in an inability to close a position prior to its maturity date. Third, futures contracts involve the risk that a Fund could lose more than the original margin deposit required to initiate a futures transaction.
Finally, the risk exists that losses could exceed amounts disclosed on the Statements of Assets and Liabilities.
It is the Funds’ policy to present the gross variation margin payable and the gross variation margin receivable of the future contracts separately on the Statement of Assets and Liabilities as the Funds do not have a master netting agreement with the counter party to the future contracts.
Refer to each Fund’s Schedule of Investments for details regarding open futures contracts as of August 31, 2019, if applicable.
Master Limited Partnerships— Investments in units of master limited partnerships (“MLPs”) involve risks that differ from an investment in common stock. Holders of the units of master limited partnerships have more limited control and limited rights to vote on matters affecting the partnership. There are also certain tax risks associated with an investment in units of master limited partnerships. In addition, conflicts of interest may exist between common unit holders, subordinated unit holders and the general partner of a master limited partnership, including a conflict arising as a result of incentive distribution payments. The benefit a Fund derives from investment in MLP units is largely dependent on the MLPs being treated as partnerships and not as corporations for federal income tax purposes. If an MLP were classified as a corporation for federal income tax purposes, there would be reduction in theafter-tax return to a Fund of distributions from the MLP, likely causing a reduction in the value of a Fund’s shares. MLP entities are typically focused in the energy, natural resources and real estate sectors of the economy. A downturn in the energy, natural resources or real estate sectors of the economy could have an adverse impact on a Fund. At times, the performance of securities of companies in the energy, natural resources and real estate sectors of the economy may lag the performance of other sectors or the broader market as a whole.
Inflation-Indexed Bonds— Inflation-indexed bonds are fixed income securities whose principal value is periodically adjusted according to the rate of inflation. If the index measuring inflation rises or falls, the principal value of inflation-indexed bonds will be adjusted upward or downward, and consequently the interest payable on these securities (calculated with respect to a larger or smaller principal amount) will be increased or reduced, respectively. Any upward or downward adjustment in the principal amount of an inflation-indexed bond will be included in interest income in the Statement of Operations, even though investors do not receive their principal until maturity. Repayment of the original bond principal upon maturity (as adjusted for inflation) is guaranteed in the case of U.S. Treasury inflation-
| | |
| SEI Catholic Values Trust / Semi-Annual Report / August 31, 2019 | | 33 |
NOTES TO FINANCIAL STATEMENTS (Unaudited) (Continued)
August 31, 2019
indexed bonds. For bonds that do not provide a similar guarantee, the adjusted principal value of the bond repaid at maturity may be less than the original principal.
Options Written/Purchased— To the extent consistent with its investment objective and strategies, a Fund may invest in financial options contracts to add return or to hedge their existing portfolio securities. When the Fund writes or purchases an option, an amount equal to the premium received or paid by the Fund is recorded as a liability or an asset and is subsequently adjusted to the current market value of the option written or purchased. Premiums received or paid from purchasing or writing options which expire unexercised are treated by the Fund on the expiration date as realized gains or losses. The difference between the premium and the amount paid or received on effecting a closing purchase or sale transaction, including brokerage commissions, is also treated as a realized gain or loss. If an option is exercised, the premium paid or received is added to the cost of the purchase or proceeds from the sale in determining whether the Fund has realized a gain or a loss. The risk in writing a call option is that the Fund gives up the opportunity for profit if the market price of the security increases. The risk in writing a put option is that the Fund may incur a loss if the market price of the security decreases and the option is exercised. The risk in purchasing an option is that the Fund pays a premium whether or not the option is exercised. The Fund also has the additional risk of being unable to enter into a closing transaction at an acceptable price if a liquid secondary market does not exist. Option contracts also involve the risk that they may not work as intended due to unanticipated developments in market conditions or other causes. In connection with option agreement securities may be set aside as collateral by a Fund’s custodian.
The cost of purchased options and the premiums received for written options that are presented in the Schedule of Investments are representative of the volume of activity during the period ended August 31, 2019.
Finally, the risk exists that losses on written options could exceed amounts disclosed on the Statements of Assets and Liabilities. Refer to each Fund’s Schedule of Investments for details regarding open options contracts as of August 31, 2019, if applicable.
Swap Agreements— To the extent consistent with its Investment Objective and Strategies, a Fund may invest in swap contracts as an efficient means to synthetically obtain exposure to securities or baskets of securities and to manage a Fund’s interest rate duration and yield curve exposure. Swap contracts may also be used to mitigate a Fund’s overall level of risk and/or a Fund’s
risk to particular types of securities, currencies or market segments. Interest rate swaps may further be used to manage a Fund’s yield spread sensitivity. A Fund may buy credit default swaps in an attempt to manage credit risk where a Fund has credit exposure to an issuer, and a Fund may sell credit default swaps to more efficiently gain credit exposure to a security or basket of securities. A swap agreement is atwo-party contract under which an agreement is made to exchange returns from predetermined investments or instruments, including a particular interest rate, foreign currency, or “Basket” of securities representing a particular index. Swap agreements are privately negotiated in theover-the-counter market (“OTC swaps”) or may be executed in a multilateral or other trade facility platform, such as a registered commodities exchange (“Centrally Cleared swaps”). Interest rate swaps involve the exchange by a Fund with another party of their respective commitments to pay or receive interest (e.g., an exchange of floating rate payments for fixed rate payments) with respect to a notional amount of principal. Credit default swaps involve periodic payments by a Fund or counterparty based on a specified rate multiplied by a notional amount assigned to an underlying debt instrument or group of debt instruments in exchange for the assumption of credit risk on the same instruments. In the event of a credit event, usually in the form of a credit rating downgrade, the party receiving periodic payments (i.e. floating rate payer) must pay the other party (i.e. fixed rate payer) an amount equal to the recovery rate used to settle the contracts. The recovery rate is a function of how many credit default swap investors wish to deliver the security or receive the security. The recovery rate is determined through an auction process. Total return swaps allow an investor to benefit from the cash flow without ever actually owning the underlying security. The receiver must pay any decline in value to the payer at the end of the total return swap. However, the investor does not need to make a payment if there is no decline in price. Payments can be made on various indices, bonds (i.e. mortgage backed securities, bank debt and corporate), loans or commodities. The value of a total return swap is equal to the change in value of the underlying asset versus the accrued income payment based on LIBOR or some other form of indices on the notional amount. Payments received or made are recorded as realized gains or loss. A Fund could be exposed to credit or market risk due to unfavorable changes in the fluctuation of interest rates or if the counterparty defaults on its obligation to perform. Risk of loss may exceed amounts recognized on the statement of assets and liabilities. Interest rate swap contracts outstanding at period end, if any, are listed after a Fund’s
| | |
| 34 | | SEI Catholic Values Trust / Semi-Annual Report / August 31, 2019 |
portfolio. In connection with swap agreements securities may be set aside as collateral by a Fund’s custodian.
Swaps are“marked-to-market” daily based upon quotations from market makers and the resulting changes in market values, if any, are recorded as an unrealized gain or loss in the Statement of Operations. Centrally Cleared swaps are valued at the settlement price established each day by the board on exchange on which they are traded. The daily settlement prices for centrally cleared swaps are provided by an independent source. Net payments of interest are recorded as realized gains or losses. Daily changes in valuation of Centrally Cleared swaps, if any, are recorded as a receivable or payable for the change in value as appropriate (“Variation Margin”) on the Statements of Assets and Liabilities.
Entering into swap agreements involves, to varying degrees, elements of credit and market risk in excess of the amounts recognized on the Statement of Assets and Liabilities. Such risks involve the possibility that there will be no liquid market for these agreements, that the counterparty to the agreement may default on its obligation to perform and that there may be unfavorable changes in the fluctuation of interest rates. Risks also arise from potential losses from adverse market movements.
It is the Funds’ policy to present the gross variation margin payable and the gross variation margin receivable of the swap contracts separately on the Statement of Assets and Liabilities as the Funds do not have a master netting agreement with the counter party to the swap contracts. See Note 3 for further details. Refer to each Fund’s Schedule of Investments, for details regarding open swap agreements as of August 31, 2019, if applicable.
Delayed Delivery Transactions— To the extent consistent with its Investment Objective and Strategies, a Fund may purchase or sell securities on a when-issued or delayed delivery basis. These transactions involve a commitment by the Fund to purchase or sell securities for a predetermined price or yield, with payment and delivery taking place beyond the customary settlement period. When delayed delivery purchases are outstanding, the Fund will set aside liquid assets in an amount sufficient to meet the purchase price. When purchasing a security on a delayed delivery basis, the Fund assumes the rights and risks of ownership of the security, including the risk of price and yield fluctuations, and takes such fluctuations into account when determining its net asset value. The Fund may dispose of or renegotiate a delayed delivery transaction after it is entered into, and may sell when-issued securities before they are delivered, which may result in a capital gain or
loss. When the Fund has sold a security on a delayed delivery basis, the Fund does not participate in future gains and losses with respect to the security.
Collateralized Debt Obligations— To the extent consistent with its Investment Objective and Strategies, a Fund may invest in collateralized debt obligations (“CDOs”), which include collateralized loan obligations (“CLOs”) and other similarly structured securities. CLOs are a type of asset-backed securities. A CLO is a trust typically collateralized by a pool of loans, which may include, among others, domestic and foreign senior secured loans, senior unsecured loans, and subordinate corporate loans, including loans that may be rated below investment grade or equivalent unrated loans. CDOs may charge management fees and administrative expenses.
For CDOs, the cash flows from the trust are split into two or more portions, called tranches, varying in risk and yield. The riskiest portion is the “Equity” tranche which bears the bulk of defaults from the bonds or loans in the trust and serves to protect the other, more senior tranches from default in all but the most severe circumstances. Since it is partially protected from defaults, a senior tranche from a CDO trust typically has a higher rating and lower yield than its underlying securities, and can be rated investment grade. Despite the protection from the equity tranche, CDO tranches can experience substantial losses due to actual defaults, increased sensitivity to defaults due to collateral default and disappearance of protecting tranches, market anticipation of defaults, as well as aversion to CDO securities as a class.
The risks of an investment in a CDO depend largely on its Class and its collateral securities. Normally, CLOs and other CDOs are privately offered and sold, and thus, are not registered under the securities laws. As a result, investments in CDOs may be characterized by the Funds as illiquid securities; however, an active dealer market may exist for CDOs, allowing a CDO to qualify for Rule 144A transactions. In addition to the normal risks associated with fixed income securities (e.g., interest rate risk and default risk), CDOs carry additional risks including, but not limited to: (i) the possibility that distributions from collateral securities will not be adequate to make interest or other payments; (ii) the quality of the collateral may decline in value or default; (iii) the Funds may invest in CDOs that are subordinate to other classes; and (iv) the complex structure of the security may not be fully understood at the time of investment and may produce disputes with the issuer or unexpected investment results.
Illiquid Securities— A security is considered illiquid if it cannot be sold or disposed of in the ordinary course of
| | |
| SEI Catholic Values Trust / Semi-Annual Report / August 31, 2019 | | 35 |
NOTES TO FINANCIAL STATEMENTS (Unaudited) (Continued)
August 31, 2019
business within seven days or less for its approximate carrying value on the books of a Fund. Valuations of illiquid securities may differ significantly from the values that would have been used had an active market value for these securities existed.
Restricted Securities— Throughout the period, the Funds may own private placement investments that were purchased through private offerings or acquired through initial public offerings that could not be sold without prior registration under the Securities Act of 1933 or pursuant to an exemption there from. In addition, the Funds had generally agreed to further restrictions on the disposition of certain holdings as set forth in various agreements entered into in connection with the purchase of those investments. These investments were valued at amortized cost, which approximates fair value, as determined in accordance with the procedures approved by the Board of Trustees. At August 31, 2019, the Funds did not own any restricted securities.
Classes— Class-specific expenses are borne by that class of shares. Income, expenses, and realized and unrealized gains/losses andnon- class-specific expenses are allocated to the respective class on the basis of relative daily net assets.
Expenses— Expenses that are directly related to one of the Funds are charged directly to that Fund. Other operating expenses of the Funds are prorated to the Funds on the basis of relative net assets.
Cash and Cash Equivalents— Idle cash and currency balances may be swept into various overnight sweep accounts and are classified as cash equivalents on the Statement of Assets and Liabilities. These amounts, at times, may exceed United States federally insured limits. Amounts swept are available on the next business day.
Dividends and Distributions to Shareholders— The Equity Fund will distribute its net investment income annually. The Fixed Income Fund declares its net investment income daily and distributes monthly. The Funds make distributions of capital gains, if any, at least annually.
Investments in Real Estate Investment Trusts (“REITs”)— Dividend income is recorded based on the income included in distributions received from the REIT investments using published REIT reclassifications including management estimates when actual amounts are not available. Distributions received in excess of this estimated amount are recorded as a reduction of the cost of investments or reclassified to capital gains. The actual amounts of income, return of capital, and capital
gains are only determined by each REIT after its fiscalyear-end, and may differ from the estimated amounts.
3. CREDIT DERIVATIVES
A Fund may use credit default swaps to reduce risk where a Fund has exposure to the issuer, or to take an active long or short position with respect to the likelihood of an event of default. The reference obligation of the swap can be a single issuer, a “basket” of issuers, or an index. The underlying referenced assets are corporate debt, sovereign debt and asset backed securities.
The buyer of a credit default swap is generally obligated to pay the seller a periodic stream of payments over the term of the contract in return for a contingent payment upon the occurrence of a credit event with respect to an underlying reference obligation. Generally, a credit event for corporate or sovereign reference obligations means bankruptcy, failure to pay, obligation acceleration, repudiation/moratorium or restructuring. For credit default swaps on asset-backed securities, credit event may be triggered by events such as failure to pay principal, maturity extension, rating downgrade or write-down.
If a Fund is a seller of protection, and a credit event occurs, as defined under the terms of that particular swap agreement, a Fund will generally either (i) pay to the buyer an amount equal to the notional amount of the swap and take delivery of the referenced obligation, other deliverable obligations, or underlying securities comprising a referenced index or (ii) pay a net settlement amount in the form of cash or securities equal to the notional amount of the swap less the recovery value of the referenced obligation or underlying securities comprising a referenced index.
If a Fund is a buyer of protection and a credit event occurs, as defined under the terms of that particular swap agreement, a Fund will either (i) receive from the seller of protection an amount equal to the notional amount of the swap and deliver the referenced obligation, other deliverable obligations or underlying securities comprising the referenced index or (ii) receive a net settlement amount in the form of cash or securities equal to the notional amount of the swap less the recovery value of the referenced obligation or underlying securities comprising the referenced index. Recovery values are assumed by market makers considering either industry standard recovery rates or entity specific factors and considerations until a credit event occurs. If a credit event has occurred, the recovery value is determined by a facilitated auction whereby a minimum number of allowable broker bids, together with
| | |
| 36 | | SEI Catholic Values Trust / Semi-Annual Report / August 31, 2019 |
a specified valuation method, are used to calculate the settlement value.
As of August 31, 2019, the Fixed Income Fund is the seller (“Providing Protection”) on a total notional amount of
$3.7 million. The notional amounts of the swaps are not recorded in the financial statements. The notional amounts approximate the maximum potential amount of future payments that the Fund could be required to make if the Fund were the seller of protection and a credit event were to occur. Those credit default swaps (“CDS”) for which the Fund is providing protection at balance sheet date are summarized as follows:
| | | | | | | | | | | | | | | | | | | | |
| FIXED INCOME FUND | | | | | | | | | | | | | | | |
| WRITTEN CREDIT DERIVATIVE CONTRACTS | | SINGLE NAME CREDIT DEFAULT SWAPS | | | CREDIT DEFAULT SWAP INDEX | | | | |
| REFERENCE ASSET | | CORPORATE
DEBT | | | SOVERIGN
DEBT | | | ASSET
BACKED
SECURITIES | | | CORPORATE
DEBT | | | Total | |
Fair value of written credit derivatives | | $ | — | | | $ | — | | | $ | — | | | $ | 119,004 | | | $ | 119,004 | |
Maximum potential amount of future payments | | | — | | | | — | | | | — | | | | 3,745,750 | | | | 3,745,750 | |
Recourse provisions with third parties to recover any amounts paid under the credit derivative (including any purchased credit protection)(1) | | | — | | | | — | | | | — | | | | — | | | | — | |
Collateral held by the Fund can obtain upon occurrence of triggering event | | | — | | | | — | | | | — | | | | — | | | | — | |
| (1) | Potential recoveries would include purchased credit derivatives to the extent they offset written credit derivatives which have an identical underlying, or a netting arrangement or credit support annex with the counterparty. There may be other potential recoveries from recourse provisions where agreements cover multiple derivative arrangements but those amounts have not been included. |
| | | | | | | | | | | | | | | | | | | | | | | | |
| FIXED INCOME FUND | | | | | | | | | | | | | | | | | | |
| MAXIMUM POTENTIAL AMOUNT OF FUTURE PAYMENTS BY CONTRACT TERM | | 0-6 MONTHS | | | 6-12 MONTHS | | | 1-5 YEARS | | | 5-10 YEARS | | | > 10 YEARS | | | Total | |
Current credit spread* on underlying (in basis points) | | | | | | | | | | | | | | | | | | | | | | | | |
0-100 | | $ | — | | | $ | — | | | $ | 2,830,000 | | | $ | — | | | $ | — | | | $ | 2,830,000 | |
> than 100 | | | — | | | | — | | | | 915,750 | | | | — | | | | — | | | | 915,750 | |
Total | | $ | — | | | $ | — | | | $ | 3,745,750 | | | $ | — | | | $ | — | | | $ | 3,745,750 | |
| * | The credit spread on the underlying asset is generally indicative of the current status of the underlying risk of the Fund having to perform. The spread also reflects the cost of buying/selling protection and may include upfront payments required to be made to enter into a contract. Higher credit spreads with a shorter contract term is indicative of a higher likelihood of performance by the Fund. |
The credit spread disclosed above for each reference obligation where the Fund is the seller of protection is a representation of the current payment/performance risk of the swap.
4. DERIVATIVE TRANSACTIONS
The following tables include only Funds that had exposure to more than one type of risk on derivatives held throughout the period. For Funds that held derivatives throughout the period with only one type of risk exposure, additional information can be found on the Schedule of Investments and the Statement of Operations.
| | |
| SEI Catholic Values Trust / Semi-Annual Report / August 31, 2019 | | 37 |
NOTES TO FINANCIAL STATEMENTS (Unaudited) (Continued)
August 31, 2019
The fair value of derivative instruments as of August 31, 2019 was as follows ($ Thousands):
| | | | | | | | | | | | |
| | | | | |
| | | Asset Derivatives | | | | | Liability Derivatives | | | |
| | | Statement of Assets and Liabilities Location | | Fair Value | | | Statement of Assets and Liabilities Location | | Fair Value | |
| | |
Derivatives Not Accounted for as Hedging Instruments: | | | | | | | |
| | | | |
Fixed Income Fund | | | | | | | | | | | | |
Interest rate contracts | | Net Assets — Unrealized appreciation on futures contracts | | $ | 163 | * | | Net Assets — Unrealized depreciation on futures contracts | | $ | 45 | * |
| | Net Assets — Unrealized appreciation on swap contracts | | | — | † | | Net Assets — Unrealized depreciation on swap contracts | | | 714 | † |
Foreign exchange contracts | | Unrealized gain on forward foreign currency contracts | | | 78 | | | Unrealized loss on forward foreign currency contracts | | | 284 | |
| | Over the counter options purchased, at value | | | 63 | | | Over the counter options written, at value | | | — | |
Credit Contracts | | Net Assets — Unrealized appreciation on swap contracts | | | 31 | † | | Net Assets — Unrealized depreciation on swap contracts | | | — | † |
| | | | | | | | | | | | |
Total Derivatives Not Accounted for as Hedging Instruments | | $ | 335 | | | | | $ | 1,043 | |
| | | | | | | | | | | | |
| * | Includes cumulative appreciation/depreciation of futures contracts as reported in the Schedules of Investments. Only current day’s variation margin is reported within the Statements of Assets & Liabilities. |
| † | Includes cumulative appreciation/depreciation of swap contracts as reported in the Schedules of Investments. Market Value is reported within the Statements of Assets & Liabilities for swap contracts that have paid premiums. |
The effect of derivative instruments on the Statements of Operations for the period ended August 31, 2019.
Amount of realized gain or (loss) on derivatives recognized in income ($ Thousands):
| | | | | | | | | | | | | | | | | | | | |
| Derivatives Not Accounted for as Hedging Instruments: | | Options | | | Futures | | | Forward Currency Contracts | | | Swaps | | | Total | |
Equity Fund | | | | | | | | | | | | | | | | | | | | |
Equity Contracts | | | $— | | | | $753 | | | | $— | | | | $— | | | | $753 | |
Foreign Exchange Contracts | | | — | | | | — | | | | 2 | | | | — | | | | 2 | |
Total | | | $— | | | | $753 | | | | $2 | | | | $— | | | | $755 | |
Fixed Income Fund | | | | | | | | | | | | | | | | | | | | |
Interest Rates | | | $100 | | | | $467 | | | | $— | | | | $(206) | | | | $361 | |
Foreign exchange contracts | | | (5) | | | | — | | | | 88 | | | | — | | | | 83 | |
Credit contracts | | | — | | | | — | | | | — | | | | 110 | | | | 110 | |
Total | | | $95 | | | | $467 | | | | $88 | | | | $(96) | | | | $554 | |
Change in unrealized appreciation or (depreciation) on derivatives recognized in income ($ Thousands):
| | | | | | | | | | | | | | | | | | | | |
| Derivatives Not Accounted for as Hedging Instruments | | Options | | | Futures | | | Forward
Currency
Contracts | | | Swaps | | | Total | |
Equity Fund | | | | | | | | | | | | | | | | | | | | |
Equity Contracts | | | $— | | | | $(633) | | | | $— | | | | $— | | | | $(633 | ) |
Total | | | $— | | | | $(633) | | | | $— | | | | $— | | | | $(633 | ) |
Fixed Income Fund | | | | | | | | | | | | | | | | | | | | |
Interest Rates | | | $(3) | | | | $89 | | | | $— | | | | $(749) | | | | $(663 | ) |
Foreign exchange contracts | | | 37 | | | | — | | | | (220) | | | | — | | | | (220 | ) |
Credit contracts | | | — | | | | — | | | | — | | | | (29) | | | | (29 | ) |
Total | | | $34 | | | | $89 | | | | $(220 | ) | | | $(778) | | | | $(912 | ) |
| | |
| 38 | | SEI Catholic Values Trust / Semi-Annual Report / August 31, 2019 |
The following table discloses the volume of the Fund’s futures contracts, forward foreign currency contracts and swap activity during the period ended August 31, 2019 ($ Thousands):
| | | | |
| | | Fixed Income Fund | |
| |
Futures Contracts: | | | | |
| |
Interest Contracts | | | | |
| |
Average Notional Balance Long | | $ | 22,359 | |
| |
Average Notional Balance Short | | | 21,145 | |
| |
Ending Notional Balance Long | | | 16,501 | |
| |
Ending Notional Balance Short | | | 17,980 | |
| |
Forward Foreign Currency Contracts: | | | | |
| |
Average Notional Balance Long | | | 10,306 | |
| |
Average Notional Balance Short | | | 10,441 | |
| |
Ending Notional Balance Long | | | 11,154 | |
| |
Ending Notional Balance Short | | | 11,359 | |
| |
Swaps: | | | | |
| |
Credit Contracts | | | | |
| |
Average Notional Balance Short | | | 5,490 | |
| |
Ending Notional Balance Short | | | 3,746 | |
| |
Interest Contracts | | | | |
| |
Average Notional Balance Long | | | 8,654 | |
| |
Average Notional Balance Short | | | 8,654 | |
| |
Ending Notional Balance Long | | | 6,650 | |
| |
Ending Notional Balance Short | | | 6,650 | |
| |
Options: | | | | |
| |
Currency | | | | |
| |
Average Notional Balance Long† | | | 28 | |
| |
Ending Notional Balance Long† | | | 29 | |
5. INVESTMENT ADVISORY, ADMINISTRATION AND DISTRIBUTION AGREEMENTS, INVESTMENTSUB-ADVISORY AGREEMENTS AND OTHER TRANSACTIONS WITH AFFILIATES
Investment Advisory, Administration, Distribution and Custodian Agreements— SIMC serves as each Fund’s investment adviser (the “Adviser”) and “Manager of Managers” under an investment advisory agreement approved by the shareholders of each Fund. In connection with serving as Adviser, SIMC is entitled to a fee, which is calculated daily and paid monthly, based on the average daily net assets of each Fund.
SEI Investments Global Funds Services (the “Administrator”) provides the Trust with administrative
and transfer agency services. For its services, the Administrator is entitled to a fee, which is calculated daily and paid monthly, based on the average daily net assets of each Fund.
The Fund has adopted a shareholder servicing plan (the “Shareholder Servicing Plan”) under which a shareholder servicing fee of up to 0.25% of the average daily net assets of Class F shares of the Funds will be paid to other service providers. Under the Shareholder Servicing Plan, other service providers may perform, or may compensate other service providers for performing, certain shareholder and administrative services.
The Adviser, Administrator and/or Distributor have voluntarily agreed to waive a portion of their fees in order to keep total direct operating expenses (exclusive of interest from borrowings, brokerage commissions, taxes, Trustee fees, prime broker fees, interest and dividend expenses related to short sales and extraordinary expenses not incurred in the ordinary course of the Funds’ business) at a specified level.
The waivers by the Funds’ Adviser, Administrator and/or Distributor are limited to the Funds’ direct operating expenses and, therefore, do not apply to indirect expenses incurred by the Funds, such as acquired fund fees and expenses. The waivers are voluntary and the Funds’ Adviser, Administrator and/or Distributor may discontinue all or part of any of these waivers at any time. In addition, some Funds may participate in a commission recapture program where the Funds’ trades may be executed through the Funds’ distributor, and a portion of the commissions paid on those trades are then used to pay the Funds’ expenses.
The following is a summary of annual fees payable to the Adviser and Distributor and the voluntary expense limitations for each Fund:
| | | | | | | | | | | | |
| | | Advisory
Fee | | | Shareholder
Servicing
Fee | | | Voluntary
Expense
Limitation | |
Equity Fund | | | | | | | | | | | | |
Class F | | | 0.60% | | | | 0.25% | | | | 0.86% | |
Class Y | | | 0.60% | | | | 0.00% | | | | 0.76% | |
Fixed Income Fund | | | | | | | | | | | | |
Class F | | | 0.35% | | | | 0.25% | | | | 0.71% | |
Class Y | | | 0.35% | | | | 0.00% | | | | 0.61% | |
| | |
| SEI Catholic Values Trust / Semi-Annual Report / August 31, 2019 | | 39 |
NOTES TO FINANCIAL STATEMENTS (Unaudited) (Continued)
August 31, 2019
The following is a summary of annual fees payable to the Administrator:
| | | | | | | | | | | | | | | | | | | | |
| | First $ | 1.5 Billion | | | Next $ | 500 Million | | | Next $ | 500 Million | | | Next $ | 500 Million | | | Over $ | 3 Billion | |
Equity Fund | | | 0.300 | % | | | 0.260 | % | | | 0.210 | % | | | 0.1700 | % | | | 0.120 | % |
Fixed Income Fund | | | 0.200 | % | | | 0.1775 | % | | | 0.1550 | % | | | 0.1325 | % | | | 0.110 | % |
InvestmentSub-Advisory Agreements— As of August 31, 2019, SIMC has entered into InvestmentSub-Advisory Agreements with the following parties:
Equity Fund
Brandywine Global Investment Management, LLC
Coho Partners, Ltd.
Copeland Capital Management, LLC
EARNEST Partners, LLC
Fred Alger Management, Inc
Parametric Portfolio Associates LLC
Snow Capital Management, L.P.
Fixed Income Fund
Income Research & Management
Western Asset Management Company
Western Asset Management Company Limited
Under the investmentsub-advisory agreements, eachsub-adviser receives an annual fee, paid by SIMC.
The Administrator and Distributor have voluntarily agreed to waive a portion of their fee for each fund. The following table lists the waivers for the period ended August 31, 2019 ($ Thousands):
| | | | | | | | |
| | |
| Administration
Fee
Waiver |
| |
| Shareholder
Servicing Fee
Waiver (Class F) |
|
Equity Fund | | $ | 54 | | | $ | 176 | |
Fixed Income Fund | | | 35 | | | | 84 | |
U.S. Bank, N.A. serves as the custodian of the Fixed Income Fund. Brown Brothers Harriman & Co. serves as the custodian of the Equity Fund. The custodian plays no role in determining the investment policies of the Funds or which securities are to be purchased or sold in the Funds.
Investment in Affiliated Securities— The Funds may invest in the SEI Daily Income Trust Government Fund, an affiliated money market fund to manage excess cash or to serve as margin or collateral for derivative positions. Refer to the Fund’s Schedule of Investments for details regarding transactions with affiliates for the period ended August 31, 2019, if applicable.
Payment to Affiliates— Certain officers and Trustees of the Trust are also officers and/or Trustees of the Administrator, Adviser, or the Distributor. The Trust pays each unaffiliated Trustee an annual fee for attendance at quarterly, interim, and committee meetings. The
Administrator, Adviser and/or the Distributor pays compensation of Officers and affiliated Trustees.
A portion of the services provided by the Chief Compliance Officer (“CCO”) and his staff, whom are employees of the administrator, are paid for by the Trust as incurred.
Interfund Lending— The SEC has granted an exemption that permits the Trust to participate in an interfund lending program (the “Program”) with existing or future investment companies registered under the 1940 Act that are advised by SIMC (the “SEI Funds”). The Program allows the SEI Funds to lend money to and borrow money from each other for temporary or emergency purposes.
Participation in the Program is voluntary for both borrowing and lending funds.
Interfund loans may be made only when the rate of interest to be charged is more favorable to the lending fund than an investment in overnight repurchase agreements (“Repo Rate”), and more favorable to the borrowing fund than the rate of interest that would be charged by a bank for short-term borrowings (“Bank Loan Rate”). The Bank Loan Rate will be determined using a formula reviewed annually by the Trust’s Board of Trustees. The interest rate imposed on interfund loans is the average of the Repo Rate and the Bank Loan Rate. As of August 31, 2019 and for the period then ended, the Trust has not participated in the Program.
6. INVESTMENT TRANSACTIONS
The cost of security purchases and the proceeds from the sale and maturities of securities other than temporary cash investments, during the period ended August 31, 2019, were as follows:
| | | | | | | | | | | | | | |
| | | | | U.S. Gov’t
($ Thousands) | | | Other ($ Thousands) | | | Total ($ Thousands) | |
Equity Fund | | | | | | | | | | | | | | |
Purchases | | | | $ | — | | | | $ 49,353 | | | | $ 49,353 | |
Sales | | | | | — | | | | 46,621 | | | | 46,621 | |
| | | | |
Fixed Income Fund | | | | | | | | | | | | | | |
Purchases | | | | | 87,503 | | | | 8,790 | | | | 96,293 | |
Sales | | | | | 89,589 | | | | 12,620 | | | | 102,209 | |
| | |
| 40 | | SEI Catholic Values Trust / Semi-Annual Report / August 31, 2019 |
7. FEDERAL TAX INFORMATION
It is each Fund’s intention to continue to qualify as a regulated investment company for Federal income tax purposes and distribute all of its taxable income (including net capital gains). Accordingly, no provision for Federal income taxes is required.
Reclassification of Components of Net Assets— The timing and characterization of certain income and capital gain distributions are determined annually in accordance
with Federal tax regulations which may differ from accounting principles generally accepted in the United States. As a result, net investment income (loss) and net realized gain (loss) on investment transactions for the reporting period may differ from distributions during such period. These book/tax differences may be temporary or permanent in nature. To the extent these differences are permanent, they are charged or credited toPaid-in Capital and Distributable Earnings, as appropriate, in the periods that the differences arise.
The tax character of dividends and distributions during the last two fiscal years was as follows:
| | | | | | | | | | | | | | | | | | | | | | | | | | |
| | | | | | | | |
| Ordinary
Income
($ Thousands) |
| | | | | |
| Long-term
Capital Gain
($ Thousands) |
| | | | | |
| Total
($ Thousands) |
|
Equity Fund | | | | | | | | | | | | | | | | | | | | | | | | | | |
| | 2019 | | | $ | | | | 4,437 | | | | $ | | | | 8,251 | | | | $ | | | | 12,688 | |
| | 2018 | | | | | | | 1,776 | | | | | | | | — | | | | | | | | 1,776 | |
Fixed Income Fund | | | | | | | | | | | | | | | | | | | | | | | | | | |
| | 2019 | | | | | | | 4,367 | | | | | | | | — | | | | | | | | 4,367 | |
| | 2018 | | | | | | | 2,847 | | | | | | | | — | | | | | | | | 2,847 | |
As of February 28, 2019, the components of Distributable Earnings/(Accumulated Losses) on a tax basis were as follows:
| | | | | | | | | | | | | | | | | | | | | | | | | | | | | | | | | | | | | | | | | | | | | | | | | | | | | | | | | | | | | | | | |
| | | | | | |
| Undistributed
Ordinary Income ($ Thousands |
) | | | | | |
| Undistributed
Long-Term
Capital Gain
($ Thousands) |
| | | | | |
| Capital
Loss
Carryforwards
($ Thousands) |
| | | | | |
| Post-
October
Losses
($ Thousands) |
| | | | | |
| Late Year
Ordinary
Losses
($ Thousands) |
| | | | | |
| Unrealized
Appreciation
(Depreciation)
($ Thousands) |
| | | | | |
| Other
Temporary
Differences
($ Thousands) |
| | | | | |
| Total
Distributable
Earnings/
(Accumulated
Losses)
($ Thousands) |
|
Equity Fund | | | $ | | | | 405 | | | | $ | | | | 3,039 | | | | $ | | | | — | | | | $ | | | | (1,287 | ) | | | $ | | | | — | | | | $ | | | | 36,752 | | | | $ | | | | (28 | ) | | | $ | | | | 38,881 | |
Fixed Income Fund | | | | | | | 389 | | | | | | | | — | | | | | | | | (1,406 | ) | | | | | | | — | | | | | | | | — | | | | | | | | (889 | ) | | | | | | | (559 | ) | | | | | | | (2,465 | ) |
Post October losses represent losses realized on investment transactions from November 1, 2018 through February 28, 2019 that, in accordance with Federal income tax regulations, the Funds may defer and treat as having arisen in the following fiscal year. Deferred Late-Year Losses represent ordinary losses realized on investment transactions from January 1, 2019 through February 28, 2019 and specified losses realized on investment transactions from November 1, 2018 through February 28, 2019, that, in accordance with Federal income tax regulations, the Fund defers and treats as having arisen in the following fiscal year.
Under the Regulated Investment Company Modernization Act of 2010, the Funds are permitted to carry forward capital losses incurred in taxable years beginning after December 22, 2010 for an unlimited period. However, any losses incurred during those future taxable years will be required to be utilized prior to the losses incurred inpre-enactment taxable years. As a result of this ordering rule,pre-enactment
capital loss carryforwards may be more likely to expire unused. Additionally, post-enactment capital losses that are carried forward will retain their character as either short-term or long-term capital losses rather than being considered all short-term as under previous law. Losses carried forward under these new provisions are as follows:
| | | | | | | | | | | | | | | | |
| | | | | | |
| Short-Term
Loss
($ Thousands) |
| |
| Long-Term
Loss
($ Thousands) |
| |
| Total *
($ Thousands) |
|
Fixed Income Fund | | | $ | | | | 76 | | | | 1,330 | | | | 1,406 | |
* This table should be used in conjunction with the capital loss carryforwards table.
For Federal income tax purposes, the cost of securities owned at February 28, 2019, and net realized gains or losses on securities sold for the period, were different from amounts reported for financial reporting purposes, primarily due to wash sales, PFIC MTM, and MLP basis adjustments, which cannot be used for Federal income tax purposes in the current year and have been deferred for use in future years.
| | |
| SEI Catholic Values Trust / Semi-Annual Report / August 31, 2019 | | 41 |
NOTES TO FINANCIAL STATEMENTS (Unaudited) (Continued)
August 31, 2019
The Federal tax cost and aggregate gross unrealized appreciation and depreciation on investments held by the Funds at August 31, 2019, were as follows:
| | | | | | | | | | | | | | | | | | | | | | | | | | | | | | | | |
| | | | | | |
| Federal Tax Cost
($ Thousands) |
| | | | | |
| Aggregate Gross
Unrealized
Appreciation
($ Thousands) |
| | | | | |
| Aggregate Gross
Unrealized
Depreciation
($ Thousands) |
| | | | | | Net Unrealized Appreciation/ (Depreciation) ($ Thousands) | | |
Equity Fund | | | $ | | | | 234,171 | | | | $ | | | | 53,602 | | | | $ | | | | (17,060) | | | | $ | | | 36,542 | | |
Fixed Income Fund | | | | | | | 151,495 | | | | | | | | 8,476 | | | | | | | | (601) | | | | | | | 7,875 | | |
Management has analyzed the Funds’ tax positions taken on Federal income tax returns for all open tax years and has concluded that as of August 31, 2019, no provision for income tax would be required in the Funds’ financial statements. The Funds’ Federal and state income and Federal excise tax returns for tax years for which the applicable statutes of limitations have not expired are subject to examination by the Internal Revenue Service and state departments of revenue.
8. CONCENTRATION/RISKS
In the normal course of business, a Fund may enter into contracts that provide general indemnifications by a Fund to the counterparty to the contract. A Fund’s maximum exposure under these arrangements is dependent on future claims that may be made against a Fund and, therefore, cannot be established; however, based on experience, management believes the risk of loss from such claim is considered remote.
The market values of the Fixed Income Fund’s investments will change in response to interest rate changes and other factors. During periods of falling interest rates, the values of fixed income securities generally rise. Conversely, during periods of rising interest rates, the values of such securities generally decline. Changes by recognized rating agencies in the ratings of any fixed income security and in the ability of an issuer to make payments of interest and principal may also affect the value of these investments.
The following descriptions provide additional information about some of the risks of investing in the Funds:
Asset-Backed Securities Risk— Payment of principal and interest on asset-backed securities is dependent largely on the cash flows generated by the assets backing the securities. Securitization trusts generally do not have any assets or sources of funds other than the receivables and related property they own, and asset-backed securities are generally not insured or guaranteed by the related sponsor or any other entity. Asset-backed securities may be more illiquid than more conventional types of fixed income securities that the Fund may acquire.
Bank Loans Risk— With respect to bank loans, the Fund will assume the credit risk of both the borrower and the lender that is selling the participation in the loan.
The Fund may also have difficulty disposing of bank loans because, in certain cases, the market for such instruments is not highly liquid.
Below Investment Grade Securities (Junk Bonds) Risk — Fixed income securities rated below investment grade ( junk bonds) involve greater risks of default or downgrade and are generally more volatile than investment grade securities because the prospect for repayment of principal and interest of many of these securities is speculative. Because these securities typically offer a higher rate of return to compensate investors for these risks, they are sometimes referred to as “high yield bonds”, but there is no guarantee that an investment in these securities will result in a high rate of return. These risks may be increased in foreign and emerging markets.
Commercial Paper Risk— Commercial paper is a short-term obligation with a maturity generally ranging from one to 270 days and is issued by U.S. or foreign companies or other entities in order to finance their current operations. Such investments are unsecured and usually discounted from their value at maturity. The value of commercial paper may be affected by changes in the credit rating or financial condition of the issuing entities and will tend to fall when interest rates rise and rise when interest rates fall. Asset-backed commercial paper may be issued by structured investment vehicles or other conduits that are organized to issue the commercial paper and to purchase trade receivables or other financial assets. The repayment of asset-backed commercial paper depends primarily on the cash collections received from such issuer’s underlying asset portfolio and the issuer’s ability to issue new asset-backed commercial paper.
Corporate Fixed Income Securities Risk— Corporate fixed income securities respond to economic developments, especially changes in interest rates, as well as perceptions of the creditworthiness and business prospects of individual issuers.
Catholic Values Investing Risk— The Funds consider the United States Conference of Catholic Bishops’ Socially Responsible Investing Guidelines (“Guidelines”) in its investment process and may choose not to purchase, or may sell, otherwise profitable investments in companies which have been identified as being in
| | |
| 42 | | SEI Catholic Values Trust / Semi-Annual Report / August 31, 2019 |
conflict with the Guidelines. This means that the Funds may underperform other similar mutual funds that do not consider the Guidelines when making investment decisions.
Currency Risk— Currency risk is the risk that foreign currencies will decline in value relative to the U.S. dollar or, in the case of hedging positions, that the U.S. dollar will decline in value relative to the currency hedged. In either event, the dollar value of an investment in the Fund would be adversely affected. Currency exchange rates may fluctuate in response to, among other things, changes in interest rates, intervention (or failure to intervene) by U.S. or foreign governments, central banks or supranational entities, or by the imposition of currency controls or other political developments in the United States or abroad.
Credit Risk— The risk that the issuer of a security or the counterparty to a contract will default or otherwise become unable to honor a financial obligation.
Depositary Receipts Risk— Depositary receipts, such as American Depositary Receipts (ADRs), are certificates evidencing ownership of shares of a foreign issuer that are issued by depositary banks and generally trade on an established market. Depositary receipts are subject to many of the risks associated with investing directly in foreign securities, including, among other things, political, social and economic developments abroad, currency movements and different legal, regulatory and tax environments.
Derivatives Risk— The Equity Fund’s use of swaps and the Fixed Income Fund’s use of futures contracts, forwards contracts, and options is subject to market risk, leverage risk, correlation risk, credit risk, valuation risk and liquidity risk. Credit risk is described above. Leverage risk and liquidity risk are described below. Manyover-the-counter (OTC) derivative instruments will not have liquidity beyond the counterparty to the investment. Market risk is the risk that the market value of an investment may move up and down, sometimes rapidly and unpredictably. Correlation risk is the risk that changes in the value of the derivative may not correlate perfectly with the underlying asset, rate or index. Valuation risk is the risk that the derivative may be difficult to value and/or valued incorrectly. Each of these risks could cause the Fund to lose more than the principal amount invested in a swap. Some derivatives have the potential for unlimited loss, regardless of the size of the Fund’s initial investment. The other parties to certain derivative contracts present the same types of credit risk as issuers of fixed income securities. The Fund’s use of derivatives may also increase the amount of taxes payable by some shareholders. Both U.S. andnon-U.S. regulators are in the process of adopting and
implementing regulations governing derivatives markets, the ultimate impact of which remains unclear.
Duration Risk— The longer-term securities in which the Fund may invest are more volatile. A portfolio with a longer average portfolio duration is more sensitive to changes in interest rates than a portfolio with a shorter average portfolio duration.
Exchange-Traded Funds Risk— The risks of owning shares of an ETF generally reflect the risks of owning the underlying securities the ETF is designed to track, although lack of liquidity in an ETF could result in its value being more volatile than the underlying portfolio securities. When the Fund invests in an ETF, in addition to directly bearing the expenses associated with its own operations, it will bear a pro rata portion of the ETF’s expenses.
Extension Risk— The risk that rising interest rates may extend the duration of a fixed income security, typically reducing the security’s value.
Foreign Investment/Emerging Markets Risk— The risk thatnon-U.S. securities may be subject to additional risks due to, among other things, political, social and economic developments abroad, currency movements, and different legal, regulatory and tax environments. These additional risks may be heightened with respect to emerging market countries since political turmoil and rapid changes in economic conditions are more likely to occur in these countries.
Foreign Sovereign Debt Securities Risk— The risk that (i) the governmental entity that controls the repayment of sovereign debt may not be willing or able to repay the principal and/or interest when it becomes due, because of factors such as debt service burden, political constraints, cash flow problems and other national economic factors; (ii) governments may default on their debt securities, which may require holders of such securities to participate in debt rescheduling or additional lending to defaulting governments; and (iii) there is no bankruptcy proceeding by which defaulted sovereign debt may be collected in whole or in part.
Interest Rate Risk— The risk that a rise in interest rates will cause a fall in the value of fixed income securities, including U.S. Government Securities, in which the Fund invests. A low interest rate environment may present greater interest rate risk, because there may be a greater likelihood of rates increasing and rates may increase more rapidly.
Investment Style Risk— The risk that the equity securities in which the Fund invests may underperform
| | |
| SEI Catholic Values Trust / Semi-Annual Report / August 31, 2019 | | 43 |
NOTES TO FINANCIAL STATEMENTS (Unaudited) (Concluded)
August 31, 2019
other segments of the equity markets or the equity markets as a whole.
Leverage Risk— The Fund’s use of derivatives may result in the Fund’s total investment exposure substantially exceeding the value of its portfolio securities and the Fund’s investment returns depending substantially on the performance of securities that the Fund may not directly own. The use of leverage can amplify the effects of market volatility on the Fund’s share price and may also cause the Fund to liquidate portfolio positions when it would not be advantageous to do so in order to satisfy its obligations. The Fund’s use of leverage may result in a heightened risk of investment loss.
Liquidity Risk— The risk that certain securities may be difficult or impossible to sell at the time and the price that the Fund would like. The Fund may have to lower the price of the security, sell other securities instead or forego an investment opportunity, any of which could have a negative effect on Fund management or performance.
Manager Risk— The success of the Fund’s investment strategy depends both on SIMC’s selection of theSub-Advisers and allocating assets to suchSub-Advisers, as well as theSub-Advisers’ success or failure in implementing the Fund’s investment strategies. SIMC or aSub-Adviser may be incorrect in assessing market trends, the value or growth capability of particular securities or asset classes.
Market Risk— The risk that the market value of a security may move up and down, sometimes rapidly and unpredictably. Market risk may affect a single issuer, an industry, a sector or the equity or bond market as a whole. The prices of the Fixed income Fund’s fixed income securities respond to economic developments, particularly interest rate changes, as well as to perceptions about the creditworthiness of individual issuers, including governments and their agencies. Generally, the Fund’s fixed income securities will decrease in value if interest rates rise and vice versa. In a low interest rate environment, risks associated with rising rates are heightened. Declines in dealer market-making capacity as a result of structural or regulatory changes could decrease liquidity and/or increase volatility in the fixed income markets. In the case of foreign securities, price fluctuations will reflect international economic and political events, as well as changes in currency valuations relative to the U.S. dollar. In response to these events, the Fund’s value may fluctuate and/or the Fund may experience increased redemptions from shareholders, which may impact the
Fund’s liquidity or force the Fund to sell securities into a declining or illiquid market.
Mortgage-Backed Securities Risk— Mortgage-backed securities are affected by, among other things, interest rate changes and the possibility of prepayment of the underlying mortgage loans. Mortgage-backed securities are also subject to the risk that underlying borrowers will be unable to meet their obligations.
Participation Notes(P-Notes) Risk— Participation notes(P-Notes) are participation interest notes that are issued by banks or broker-dealers and are designed to offer a return linked to a particular underlying equity, debt, currency or market. Investments inP-Notes involve the same risks associated with a direct investment in the underlying foreign companies or foreign securities markets that they seek to replicate. However, there can be no assurance that the trading price ofP-Notes will equal the underlying value of the foreign companies or foreign securities markets that they seek to replicate.
Portfolio Turnover Risk— Due to its investment strategy, the Fund may buy and sell securities frequently. This may result in higher transaction costs and additional capital gains tax liabilities, which may affect the Fund’s performance.
Prepayment Risk— The risk that, in a declining interest rate environment, fixed income securities with stated interest rates may have the principal paid earlier than expected, requiring the Fund to invest the proceeds at generally lower interest rates.
Small and Medium Capitalization Risk— The risk that small and medium capitalization companies in which the Fund may invest may be more vulnerable to adverse business or economic events than larger, more established companies. In particular, small and medium capitalization companies may have limited product lines, markets and financial resources and may depend upon a relatively small management group. Therefore, small capitalization and medium capitalization stocks may be more volatile than those of larger companies. Small capitalization and medium capitalization stocks may be tradedover-the-counter or listed on an exchange.
U.S. Government Securities Risk— Although U.S. Government securities are considered to be among the safest investments, they are not guaranteed against price movements due to changing interest rates. Obligations issued by some U.S. Government agencies are backed by the U.S. Treasury, while others are backed solely by the ability of the agency to borrow from the U.S. Treasury or by the agency’s own resources.
Warrants Risk— Warrants are instruments that entitle the holder to buy an equity security at a specific price for a specific period of time. Warrants may be more
| | |
| 44 | | SEI Catholic Values Trust / Semi-Annual Report / August 31, 2019 |
speculative than other types of investments. The price of a warrant may be more volatile than the price of its underlying security, and a warrant may offer greater potential for capital appreciation as well as capital loss. A warrant ceases to have value if it is not exercised prior to its expiration date.
Please refer to each Fund’s current prospectus for additional disclosure regarding the risks associated with investing in the Funds. The foregoing is not intended to be a complete discussion of the risks associated with the investment strategies of the Funds.
9. CONCENTRATION OF SHAREHOLDERS
SEI Private Trust Company (“SPTC”) and SIMC are subsidiaries of SEI Investments Company. As of August 31, 2019, SPTC held of record the following:
| | | | |
Equity Fund | | | | |
Class F | | | 99.23% | |
Class Y | | | 71.12% | |
Fixed Income Fund | | | | |
Class F | | | 99.44% | |
Class Y | | | 65.34% | |
SPTC is not a direct service provider to the Funds. However, SPTC performs a key role in the comprehensive investment solution that SEI provides to investors. SPTC holds the vast majority of shares in the Funds as custodian for shareholders that are clients of the advisors and financial planners. SPTC maintains accounts at SEI Institutional Transfer Agency (“SITA”), and operates in an omnibus fund account environment.
10. REGULATORY MATTERS
On August 17, 2018, the SEC adopted amendments to RegulationS-X. These changes are effective for periods after November 5, 2018. The updates to Registered Investment Companies were mainly focused on simplifying the presentation of distributable earnings by eliminating the need to present the components of distributable earnings on a book basis in the Statements of Assets and Liabilities. The update also impacted the presentation of undistributed net investment income and distribution to shareholders on the Statements of Changes in Net Assets. The amounts presented in the current Statements of Changes in Net Assets represent the aggregated total distributions of net investment income and realized capital gains, except for distributions classified as return of capital which are still presented separately.
11. NEW ACCOUNTING PRONOUNCEMENT
In August 2018, The FASB issued Accounting Standards Update2018-13, Fair Value Measurement (Topic 820). The new guidance includes additions and modifications
to disclosures requirements for fair value measurements. For public entities, the amendments are effective for financial statements issued for fiscal years beginning after December 15, 2019, and interim periods within those fiscal years. At this time, management is currently evaluating the impact of this new guidance on the financial statements and disclosures.
12. SUBSEQUENT EVENTS
Management has evaluated the need for disclosures and/or adjustments resulting from subsequent events through the date the financial statements were issued. Based on this evaluation, no disclosures and/or adjustments were required to the financial statements as of August 31, 2019.
| | |
| SEI Catholic Values Trust / Semi-Annual Report / August 31, 2019 | | 45 |
DISCLOSURE OF FUND EXPENSES (Unaudited)
August 31, 2019
All mutual funds have operating expenses. As a shareholder of a fund, your investment is affected by these ongoing costs, which include (among others) costs for portfolio management, administrative services, and shareholder reports like this one. It is important for you to understand the impact of these costs on your investment returns.
Operating expenses such as these are deducted from the fund’s gross income and directly reduce your final investment return. These expenses are expressed as a percentage of the fund’s average net assets; this percentage is known as the fund’s expense ratio.
The following examples use the expense ratio and are intended to help you understand the ongoing costs (in dollars) of investing in your fund and to compare these costs with those of other mutual funds. The examples are based on an investment of $1,000 made at the beginning of the period shown and held for the entire period (March 1, 2019 through August 31, 2019).
The table on this page illustrates your fund’s costs in two ways:
Actual fund return: This section helps you to estimate the actual expenses after fee waivers that your Fund incurred over the period. The “Expenses Paid During Period” column shows the actual dollar expense cost incurred by a $1,000 investment in the Fund, and the “Ending Account Value” number is derived from deducting that expense cost from the Fund’s gross investment return.
You can use this information, together with the actual amount you invested in the Fund, to estimate the expenses you paid over that period. Simply divide your actual account value by $1,000 to arrive at a ratio (for example, an $8,600 account value divided by $1,000 = 8.6), then multiply that ratio by the number shown for your Fund under “Expenses Paid During Period”.
Hypothetical 5% return: This section helps you compare your Fund’s costs with those of other mutual funds. It assumes that the fund had an annual 5% return before expenses during the year, but that the expense ratio (Column 3) for the period is unchanged. This example is useful in making comparisons because the Securities and Exchange Commission requires all mutual funds to make this 5% calculation. You can assess your Fund’s comparative cost by comparing the hypothetical result for your Fund in the “Expense Paid During Period” column with those that appear in the same charts in the shareholder reports for other funds.
NOTE: Because the return is set at 5% for comparison purposes — NOT your Fund’s actual return — the account values shown may not apply to your specific investment.
| | | | | | | | | | | | | | | | | | |
| | | | | Beginning
Account
Value
3/1/19 | | | Ending
Account
Value
8/31/19 | | | Annualized
Expense
Ratios | | | Expenses
Paid
During
Period * | |
Catholic Values Equity Fund | | | | | | | | | |
Actual Fund Return | | | | | | | | | |
Class F | | | | $ | 1,000.00 | | | $ | 1,020.10 | | | | 0.86 | % | | $ | 4.38 | |
Class Y | | | | | 1,000.00 | | | | 1,020.20 | | | | 0.76 | | | | 3.87 | |
Hypothetical 5% Return | | | | | | | | | |
Class F | | | | $ | 1,000.00 | | | $ | 1,020.87 | | | | 0.86 | % | | $ | 4.38 | |
Class Y | | | | | 1,000.00 | | | | 1,021.37 | | | | 0.76 | | | | 3.87 | |
| | | | | | | | | | | | | | | | | | |
| | | | | Beginning
Account
Value
3/1/19 | | | Ending
Account
Value
8/31/19 | | | Annualized
Expense
Ratios | | | Expenses
Paid
During
Period * | |
Catholic Values Fixed Income Fund | | | | | | | | | |
Actual Fund Return | | | | | | | | | |
Class F | | | | $ | 1,000.00 | | | $ | 1,079.50 | | | | 0.71 | % | | $ | 3.72 | |
Class Y | | | | | 1,000.00 | | | | 1,080.00 | | | | 0.61 | | | | 3.20 | |
Hypothetical 5% Return | | | | | | | | | |
Class F | | | | $ | 1,000.00 | | | $ | 1,021.63 | | | | 0.71 | % | | $ | 3.62 | |
Class Y | | | | | 1,000.00 | | | | 1,022.13 | | | | 0.61 | | | | 3.11 | |
* Expenses are equal to the Fund’s annualized expense ratio multiplied by the average account value over the period, multiplied by 184/365 (to reflect theone-half year period shown).
| | |
| 46 | | SEI Catholic Values Trust / Semi-Annual Report / August 31, 2019 |
BOARD OF TRUSTEES CONSIDERATIONS IN APPROVING THE ADVISORY ANDSUB-ADVISORY AGREEMENTS (Unaudited)
SEI Catholic Values Trust (the “Trust”) and SEI Investments Management Corporation (“SIMC”) have entered into an investment advisory agreement (the “Advisory Agreement”). Pursuant to the Advisory Agreement, SIMC is responsible for the investment advisory services provided to the series of the Trust (the “Funds”). Pursuant to separatesub-advisory agreements with SIMC (the“Sub-Advisory Agreements” and, together with the Advisory Agreement, the “Investment Advisory Agreements”), and under the supervision of SIMC and the Trust’s Board of Trustees (the “Board”), thesub-advisers (each, a“Sub-Adviser” and collectively, the“Sub-Advisers”) provide security selection and certain other advisory services with respect to all or a discrete portion of the assets of the Funds. TheSub-Advisers are also responsible for managing their employees who provide services to the Funds. TheSub-Advisers are selected based primarily upon the research and recommendations of SIMC, which evaluates quantitatively and qualitatively theSub-Advisers’ skills and investment results in managing assets for specific asset classes, investment styles and strategies.
The Investment Company Act of 1940, as amended (the “1940 Act”), requires that the initial approval of, as well as the continuation of, the Funds’ Investment Advisory Agreements be specifically approved: (i) by the vote of the Board or by a vote of the shareholders of the Funds; and (ii) by the vote of a majority of the Trustees who are not parties to the Investment Advisory Agreements or “interested persons” of any party (the “Independent Trustees”), cast in person at a meeting called for the purpose of voting on such approval(s). In connection with their consideration of such approval(s), the Funds’ Trustees must request and evaluate, and SIMC and theSub-Advisers are required to furnish, such information as may be reasonably necessary to evaluate the terms of the Investment Advisory Agreements. In addition, the Securities and Exchange Commission takes the position that, as part of their fiduciary duties with respect to a mutual fund’s fees, mutual fund boards are required to evaluate the material factors applicable to a decision to approve an investment advisory agreement.
Consistent with these responsibilities, the Board calls and holds meetings each year to consider whether to approve new and/or renew existing Investment Advisory Agreements between the Trust and SIMC and SIMC and theSub-Advisers with respect to the Funds of the Trust. In preparation for these meetings, the Board requests and reviews a wide variety of materials provided by SIMC and theSub-Advisers, including information about SIMC’s and theSub-Advisers’ affiliates, personnel and operations and the services provided pursuant to the Investment Advisory Agreements. The Board also receives data from third parties. This information is provided in addition to the detailed information about the Funds that the Board reviews during the course of each year, including information that relates to Fund operations and Fund performance. The Trustees also receive a memorandum from counsel regarding the responsibilities of Trustees in connection with their consideration of whether to approve the Trust’s Investment Advisory Agreements. Finally, the Independent Trustees receive advice from independent counsel to the Independent Trustees, meet in executive sessions outside the presence of Fund management and participate in question and answer sessions with representatives of SIMC and theSub-Advisers.
Specifically, during the first half of the Trust’s fiscal year, the Board requested and received written materials from SIMC and theSub-Advisers regarding: (i) the quality of SIMC’s and theSub-Advisers’ investment management and other services; (ii) SIMC’s and theSub-Advisers’ investment management personnel; (iii) SIMC’s and theSub-Advisers’ operations and financial condition; (iv) SIMC’s and theSub-Advisers’ brokerage practices (including any soft dollar arrangements) and investment strategies; (v) the level of the advisory fees that SIMC charges the Funds and the level of thesub-advisory fees that SIMC pays theSub-Advisers, compared with fees each charge to comparable accounts; (vi) the advisory fees charged by SIMC and the Funds’ overall fees and operating expenses compared with peer groups of mutual funds prepared by Broadridge, an independent provider of investment company data; (vii) the level of SIMC’s and theSub-Advisers’ profitability from their Fund-related operations; (viii) SIMC’s and theSub-Advisers’ compliance program, including a description of material compliance matters and material compliance violations; (ix) SIMC’s potential economies of scale; (x) SIMC’s and theSub-Advisers’ policies on and compliance procedures for personal securities transactions; (xi) SIMC’s and theSub-Advisers’ expertise and resources in domestic and/or international financial markets; and (xii) the Funds’ performance over various periods of time compared with peer groups of mutual funds prepared by Broadridge and the Funds’ benchmark indexes.
At the December4-5, 2018 meeting of the Board, the Trustees approved a brief extension of the Advisory Agreement already in effect to accommodate a revised meeting schedule. Accordingly, at the April2-3. 2019 meeting of the Board, the Trustees, including a majority of the Independent Trustees, approved the renewal of the Advisory Agreement. Also, onepre-existingSub-Advisory Agreement was renewed at a meeting of the Board held on June25-26, 2019. In each case, the Board’s renewal was based on its consideration and evaluation of the
| | |
| SEI Catholic Values Trust / Semi-Annual Report / August 31, 2019 | | 47 |
BOARD OF TRUSTEES CONSIDERATIONS IN APPROVING THE ADVISORY AND SUB-ADVISORY AGREEMENTS (Unaudited) (Concluded)
factors described above, as discussed at the meetings and at prior meetings. The following discusses some, but not all, of the factors that were considered by the Board in connection with its assessment of the Investment Advisory Agreements.
Nature, Extent and Quality of Services. The Board considered the nature, extent and quality of the services provided by SIMC and theSub-Advisers to the Funds and the resources of SIMC and theSub-Advisers and their affiliates dedicated to the Funds. In this regard, the Trustees evaluated, among other things, SIMC’s and eachSub-Adviser’s personnel, experience, track record and compliance program. Following evaluation, the Board concluded that, within the context of its full deliberations, the nature, extent and quality of services provided by SIMC and theSub-Advisers to the Funds and the resources of SIMC and theSub-Advisers and their affiliates dedicated to the Funds were sufficient to support the renewal of the Investment Advisory Agreements. In addition to advisory services, the Board considered the nature and quality of certain administrative, transfer agency and othernon-investment advisory services provided to the Funds by SIMC and/or its affiliates.
Performance. In determining whether to renew SIMC’s Advisory Agreement, the Trustees considered the Funds’ performance relative to their peer groups and appropriate indexes/benchmarks. The Trustees reviewed performance information for each Fund, noting that they receive performance reports that permit them to monitor each Fund’s performance at board meetings throughout the year. As part of this review, the Trustees considered the composition of each peer group and selection criteria. In assessing Fund performance, the Trustees considered a report compiled by Broadridge, an independent third-party that was engaged to prepare an assessment of the Funds in connection with the renewal of the Advisory Agreement (the “Broadridge Report”). The Broadridge Report included metrics on risk analysis, volatility versus total return, net total return and performance consistency for the Funds and a universe of comparable funds. Based on the materials considered and discussed at the meetings, the Trustees found Fund performance satisfactory, or, where performance was materially below the benchmark and/or peer group, the Trustees were satisfied with the reasons provided to explain such performance. In connection with the approval or renewal ofSub-Advisory Agreements, the Board considered the performance of theSub-Adviser relative to appropriate indexes/benchmarks. Following evaluation, the Board concluded that, within the context of its full deliberations, the performance of the Funds was sufficient to support renewal of SIMC’s Advisory Agreement, and the performance of eachSub-Adviser was sufficient to support approval or renewal of theSub-Advisory Agreement.
Fees. With respect to the Funds’ expenses under the Investment Advisory Agreements, the Trustees considered the rate of compensation called for by the Investment Advisory Agreements and the Funds’ net operating expense ratio in comparison to those of the Funds’ respective peer groups. In assessing Fund expenses, the Trustees considered the information in the Broadridge Report, which included various metrics related to fund expenses, including, but not limited to, contractual management fees at various asset levels, actual management fees (including transfer agent expenses), and actual total expenses for the Funds and a universe of comparable funds. Based on the materials considered and discussion at the meetings, the Trustees further determined that fees were either shown to be below the peer average in the comparative fee analysis, or that there was a reasonable basis for the fee level. The Trustees also considered the effects of SIMC’s and its affiliates’ voluntary waiver of management and other fees to prevent total Fund operating expenses from exceeding a specified cap and concluded that SIMC, through waivers, has maintained the Funds’ net operating expenses at competitive levels for its distribution channels. In determining the appropriateness of fees, the Board also took into consideration the impact of fees incurred indirectly by the Funds as a result of investments into underlying funds, including funds from which SIMC or its affiliates earn fees. The Board also took into consideration compensation earned from the Funds by SIMC or its affiliates fornon-advisory services, such as administration, transfer agency, shareholder services or brokerage, and considered whether SIMC and its affiliates may have realized other benefits from their relationship with the Funds, such as any research and brokerage services received under soft dollar arrangements. When considering fees paid toSub-Advisers, the Board took into account the fact that theSub-Advisers are compensated by SIMC and not by the Funds directly, and that such compensation with respect to any unaffiliatedSub-Adviser reflects an arms-length negotiation between theSub-Adviser and SIMC. Following evaluation, the Board concluded that, within the context of its full deliberations, the expenses of the Funds are reasonable and supported renewal of the Investment Advisory Agreements. The Board also considered whether theSub-Advisers and their affiliates may have realized other benefits from their relationship with the Funds, such as any research and brokerage services received under soft dollar arrangements.
Profitability. With regard to profitability, the Trustees considered compensation flowing to SIMC and theSub-Advisers and their affiliates, directly or indirectly. The Trustees considered whether the levels of compensation and
| | |
| 48 | | SEI Catholic Values Trust / Semi-Annual Report / August 31, 2019 |
profitability were reasonable. As with the fee levels, when considering the profitability of theSub-Advisers, the Board took into account the fact that compensation with respect to any unaffiliatedSub-Adviser reflects an arms-length negotiation between theSub-Adviser and SIMC. In connection with the approval or renewal of eachSub-Advisory Agreement, the Board also took into consideration the impact that the fees paid to theSub-Adviser have on SIMC’s advisory fee margin and profitability. Based on this evaluation, the Board concluded that, within the context of its full deliberations, the profitability of each of SIMC and theSub-Advisers is reasonable and supported renewal of the Investment Advisory Agreements.
Economies of Scale. With respect to the Advisory Agreement, the Trustees considered whether any economies of scale were being realized by SIMC and its affiliates and, if so, whether the benefits of such economies of scale were passed along to the Funds’ shareholders through a graduated investment advisory fee schedule or other means, including any fee waivers by SIMC and its affiliates. The Trustees recognized that economies of scale are difficult to identify and quantify and are rarely identifiable on afund-by-fund basis. Based on this evaluation, the Board determined that the fees were reasonable in light of the information that was provided by SIMC with respect to economies of scale.
Based on the Trustees’ deliberation and their evaluation of the information described above, the Board, including all of the Independent Trustees, with the assistance of Fund counsel and Independent Trustees’ counsel, unanimously approved the approval or renewal, as applicable, of the Investment Advisory Agreements and concluded that the compensation under the Investment Advisory Agreements is fair and reasonable in light of such services and expenses and such other matters as the Trustees considered to be relevant in the exercise of their reasonable judgment. In the course of its deliberations, the Board did not identify any particular factor (or conclusion with respect thereto) or single piece of information that wasall-important, controlling or determinative of its decision, but considered all of the factors together, and each Trustee may have attributed different weights to the various factors (and conclusions with respect thereto) and information.
| | |
| SEI Catholic Values Trust / Semi-Annual Report / August 31, 2019 | | 49 |
(This page intentionally left blank)
(This page intentionally left blank)
(This page intentionally left blank)
SEI CATHOLIC VALUES TRUST / SEMI-ANNUAL REPORT / AUGUST 31, 2019
Robert A. Nesher,Chairman
Trustees
William M. Doran
George J. Sullivan, Jr.
Nina Lesavoy
James M. Williams
Mitchell A. Johnson
Hubert L. Harris, Jr.
Susan C. Cote
James B. Taylor
Officers
Robert A. Nesher
President and Chief Executive Officer
James J. Hoffmayer
Controller and Chief Financial Officer
Glenn R. Kurdziel
Assistant Controller
Russell Emery
Chief Compliance Officer
Timothy D. Barto
Vice President and Secretary
Aaron Buser
Vice President and Assistant Secretary
David F. McCann
Vice President and Assistant Secretary
Stephen G. MacRae
Vice President
Bridget E. Sudall
Anti-Money Laundering Compliance Officer
and Privacy Officer
Investment Adviser
SEI Investments Management Corporation
Administrator
SEI Investments Global Funds Services
Distributor
SEI Investments Distribution Co.
Legal Counsel
Morgan, Lewis & Bockius LLP
Independent Registered Public Accounting Firm
KPMG LLP
This report and the financial statements contained herein are submitted for the general information of the shareholders of the Trust and must be preceded or accompanied by a current prospectus. Shares of the Funds are not deposits or obligations of, or guaranteed or endorsed by, any bank. The shares are not federally insured by the Federal Deposit Insurance Corporation (FDIC), the Federal Reserve Board, or any other government agency. Investment in the shares involves risk, including the possible loss of principal.
For more information call
1 800 DIAL SEI
(1 800 342 5734)

1 Freedom valley Drive, P.O. Box 1100, Oaks, PA 19456
SEI-F-199 (8/19)
Not applicable for semi-annual report.
| Item 3. | Audit Committee Financial Expert. |
Not applicable for semi-annual report.
| Item 4. | Principal Accountant Fees and Services. |
Not applicable for semi-annual report.
| Item 5. | Audit Committee of Listed Registrants. |
Not applicable.
| Item 6. | Schedule of Investments |
The Schedules of Investments in securities of unaffiliated issuers as of the close of the reporting period for the Catholic Values Equity Fund and the Catholic Values Fixed Income Fund are included as part of the report to shareholders filed under Item 1 of this form.
| Item 7. | Disclosure of Proxy Voting Policies and Procedures forClosed-End Management Investment Companies. |
Not applicable.
| Item 8. | Portfolio Managers ofClosed-End Management Investment Companies. |
Not applicable.
| Item 9. | Purchases of Equity Securities byClosed-End Management Company and Affiliated Purchasers. |
Not applicable.
| Item 10. | Submission of Matters to a Vote of Security Holders. |
There have been no material changes to the procedures by which shareholders may recommend nominees to the Registrant’s Board of Trustee (the “Board”). The Registrant has a standing Governance Committee (the “Committee”) currently consisting of the independent trustees. The Committee is responsible for evaluating and recommending nominees for election to the Board. Pursuant to the Committee’s Charter, adopted on June 18, 2004, the Committee will review all shareholder recommendations for nominations to fill vacancies on the Board if such recommendations are submitted in writing and addressed to the Committee at the Registrant’s office.
| Item 11. | Controls and Procedures. |
(a) The Registrant’s principal executive and principal financial officers, or persons performing similar functions, have concluded that the Registrant’s disclosure controls and procedures (as defined in Rule30a-3(c) under the Investment Company Act of 1940 (the “1940 Act”)) are effective, based on the evaluation of these controls and procedures required by Rule30a-3(b) under the 1940 Act (17 CFR270.30a-3(b)) and Rules13a-15(b) or15d-15(b) under the Securities
Exchange Act of 1934 (17 CFR240.13a-15(b) or240.15d-15(b)) as of a date within 90 days of the filing date of this report.
(b) There were no changes in the Registrant’s internal control over financial reporting (as defined in Rule30a-3(d) under the 1940 Act (17 CFR270.30a-3(d)) that occurred during the period covered by this report that have materially affected, or are reasonably likely to materially affect, the Registrant’s internal control over financial reporting.
| Items 12. | Disclosure of Securities Lending Activities forclosed-end Management Investment Companies. |
Not applicable.
(a)(1) Not applicable for semi-annual report.
(a)(2) A separate certification for the principal executive officer and the principal financial officer of the Registrant as required by Rule30a-2(a) under the Investment Company of 1940 are filed herewith.
(b) Officer certifications as required by Rule30a-2(b) under the Investment Company Act of 1940, as amended, also accompany this filing as an exhibit.
SIGNATURES
Pursuant to the requirements of the Securities Exchange Act of 1934 and the Investment Company Act of 1940, the Registrant has duly caused this report to be signed on its behalf by the undersigned, thereunto duly authorized.
| | | | | | |
| | | | | | SEI Catholic Values Trust |
| | | |
| By | | | | | | /s/ Robert A. Nesher |
| | | | | | Robert A. Nesher, President & CEO |
| | | |
| Date: November 7, 2019 | | | | | | |
Pursuant to the requirements of the Securities Exchange Act of 1934 and the Investment Company Act of 1940, this report has been signed below by the following persons on behalf of the Registrant and in the capacities and on the dates indicated.
| | | | | | |
| By | | | | | | /s/ Robert A. Nesher |
| | | | | | Robert A. Nesher, President & CEO |
| | | |
| Date: November 7, 2019 | | | | | | |
| | | |
| By | | | | | | /s/ James J. Hoffmayer |
| | | | | | James J. Hoffmayer, Controller & CFO |
| | | |
| Date: November 7, 2019 | | | | | | |