UNITED STATES
SECURITIES AND EXCHANGE COMMISSION
WASHINGTON, D.C. 20549
FORM 20-F
| x | REGISTRATION STATEMENT PURSUANT TO SECTION 12(b) OR 12(g) OF THE SECURITIES EXCHANGE ACT OF 1934 |
OR
| ¨ | ANNUAL REPORT PURSUANT TO SECTION 13 OR 15(d) OF THE SECURITIES EXCHANGE ACT OF 1934 |
For the fiscal year ended _______________
OR
| ¨ | TRANSITION REPORT PURSUANT TO SECTION 13 OR 15(d) OF THE SECURITIES EXCHANGE ACT OF 1934 |
For the transition period from to
OR
| ¨ | SHELL COMPANY REPORT PURSUANT TO SECTION 13 OR 15(d) OF THE SECURITIES EXCHANGE ACT OF 1934 |
Date of event requiring this shell company report
Commission file number: ___________
Profound Medical Corp.
(Exact name of Registrant as specified in its charter)
Not Applicable
(Translation of Registrant’s name into English)
Ontario, Canada
(Jurisdiction of incorporation or organization)
2400 Skymark Avenue, Unit 6, Mississauga, Ontario L4W 5K5
(Address of principal executive offices)
Aaron Davidson, Chief Financial Officer and Senior Vice-President of Corporate Development; Tel (647) 476-1350; Fax (647) 847-3739
2400 Skymark Avenue, Unit 6, Mississauga, Ontario L4W 5K5
(Name, Telephone, E-mail, and/or Facsimile number and Address of Company Contact Person)
Securities registered or to be registered pursuant to Section 12(b) of the Act:
Title of Each Class | | Trading Symbol(s) | | Name of each exchange on which registered |
| Common Shares | | PROF (reserved) | | Nasdaq Capital Market (proposed) |
Securities registered or to be registered pursuant to Section 12(g) of the Act: None
Securities for which there is a reporting obligation pursuant to Section 15(d) of the Act: None
Indicate the number of outstanding shares of each of the issuer’s classes of capital or common stock as of the close of the period covered by the annual report: N/A.
Indicate by check mark whether Registrant is a well-known seasoned issuer, as defined in Rule 405 of the Securities Act. Yes ¨ No x
If this report is an annual or transition report, indicate by check mark if Registrant is not required to file reports pursuant to Section 13 or 15(d) of the Securities Exchange Act of 1934. Yes ¨ No ¨
Indicate by check mark whether the Registrant (1) has filed all reports required to be filed by Sections 13 or 15(d) of the Securities Exchange Act of 1934 during the preceding 12 months (or for such shorter period that the registrant was required to file such reports), and (2) has been subject to such filing requirements for the past 90 days. Yes ¨ No x
Indicate by check mark whether the registrant has submitted electronically every Interactive Data File required to be submitted pursuant to Rule 405 of Regulation S-T (§ 232.405 of this chapter) during the preceding 12 months (or for such shorter period that the registrant was required to submit such files). Yes ¨ No ¨
Indicate by check mark whether Registrant is a large accelerated filer, an accelerated filer, a non-accelerated filer, or an emerging growth company. See definition of “accelerated filer”, “large accelerated filer”, and “emerging growth company” in Rule 12b-2 of the Exchange Act.
| Large accelerated Filer ¨ | Accelerated Filer ¨ | Non-accelerated Filer x | Emerging growth company x |
If an emerging growth company that prepares its financial statements in accordance with U.S. GAAP, indicate by check mark if the registrant has elected not to use the extended transition period for complying with any new or revised financial accounting standards provided pursuant to Section 13(a) of the Exchange Act. ¨
Indicate by check mark which basis of accounting the Registrant has used to prepare the financial statements included in this filing:
| U.S. GAAP ¨ | International Financial Reporting Standards as issued by the International Accounting Standards Board x | Other ¨ |
If “Other” has been check in response to the previous question, by check mark which financial statement item Registrant has elected to follow. Item 17 ¨ Item 18 ¨
If this is an annual report, indicate by check mark whether Registrant is a shell company (as defined in Rule 12b-2 of the Exchange Act). Yes ¨ No ¨
TABLE OF CONTENTS
TABLE OF CONTENTS
(continued)
GENERAL MATTERS
In this Registration Statement on Form 20-F (this “Registration Statement”), all references to “Profound” are to Profound Medical Corp., and all references to the “Company”, “our”, “us” or “we” refer to Profound Medical Corp. and its consolidated subsidiaries, unless the context clearly requires otherwise. Certain terms used herein are defined in the text and others are included in the glossary of terms. See “Glossary of Terms” below.
We report under International Financial Reporting Standards, as issued by the International Accounting Standards Board (“IFRS”). None of our financial statements were prepared in accordance with generally accepted accounting principles in the United States (“U.S. GAAP”).
We use the Canadian dollar as our reporting currency. All references to “C$” are to Canadian dollars and references to “US$” are to United States dollars. On August 28, 2019 the daily average exchange rate for the conversion of Canadian dollars into U.S. dollars as reported by the Bank of Canada was C$1.00 = US$0.7518. See also Item 3, “Key Information” for more detailed currency and conversion information.
CAUTIONARY NOTE REGARDING FORWARD-LOOKING STATEMENTS
This Registration Statement includes certain statements that are “forward-looking statements” within the meaning of applicable securities laws. All statements in this Registration Statement, other than statements of historical facts, are forward-looking statements. These statements appear in a number of different places in this Registration Statement and can be identified by words such as “anticipates”, “estimates”, “projects”, “expects”, “intends”, “believes”, “plans”, “will”, “could”, “may”, or their negatives or other comparable words. Such forward-looking statements involve known and unknown risks, uncertainties and other factors that may cause our actual results, performance or achievements to be materially different from any future results, performance or achievements that may be expressed or implied by such forward-looking statements. Examples of such forward-looking statements include, but are not limited to:
| · | our expectations regarding commercializing our approved products (particularly the TULSA-PRO system following FDA clearance) and our ability to generate revenues and achieve profitability; |
| · | our expectations regarding the safety, efficacy and advantages of our products over our competitors and alternative treatment options; |
| · | our expectations regarding our products fulfilling unmet clinical needs and achieving market acceptance among patients, physicians and clinicians; |
| · | our expectations regarding reimbursement for our approved products from third-party payers; |
| · | our expectations regarding our relationships with Philips and Siemens, and our ability to achieve compatibility of our systems with MRI scanners produced by other manufacturers; |
| · | our ability to attract, develop and maintain relationships with other suppliers, manufacturers, distributors and strategic partners; |
| · | our expectations regarding our pipeline of product development, including expanding the clinical application of our products to cover additional indications; |
| · | our expectations regarding current and future clinical trials, including the timing and results thereof; |
| · | our expectations regarding receipt of additional regulatory approvals for our products and future product candidates; |
| · | our mission and future growth plans; |
| · | our ability to attract and retain personnel; |
| · | our expectations regarding our competitive position for each of our products in the jurisdictions where they are approved; |
| · | our ability to raise debt and equity capital to fund future product development, pursue regulatory approvals and commercialize our approved products; and |
| · | anticipated trends and challenges in our business and the markets in which we operate. |
In evaluating forward-looking statements, current and prospective shareholders should specifically consider various factors, including the risks outlined herein under the heading “Risk Factors” in Item 3.D. of this Registration Statement. Some of these risks and assumptions include, among others:
| · | risks related to our limited operating history and history of net losses; |
| · | risks related to our ability to commercialize our approved products, including expanding our sales and marketing capabilities, increasing our manufacturing and distribution capacity, increasing reimbursement coverage for our approved products and achieving and maintaining market acceptance for our products; |
| · | risks related to the regulation of our products, including in connection with obtaining regulatory approvals as well as post-marketing regulation; |
| · | risks related to our successful completion of clinical trials with respect to our products and future product candidates; |
| · | risks related to managing growth, including in respect of obtaining additional funding and establishing and maintaining collaborative partnerships, to achieve our goals; |
| · | risks related to competition that may impact market acceptance of our products and limit our growth; |
| · | risks relating to fluctuating input prices and currency exchange rates; |
| · | risks related to the reimbursement models in relevant jurisdictions that may not be advantageous; |
| · | risks related to reliance on third parties, including our collaborative partners, manufacturers, distributors and suppliers, and increasing the compatibility of our systems with MRI scanners; |
| · | risks related to intellectual property, including license rights that are key to our business; and |
| · | risks related to the loss of key personnel. |
Should one or more of these risks or uncertainties, or a risk that is not currently known to us, materialize, or should assumptions underlying those forward-looking statements prove incorrect, actual results may vary materially from those described herein. These forward-looking statements are made as of the date of this Registration Statement and we do not intend, and do not assume any obligation, to update these forward-looking statements, except as required by applicable securities laws. Investors are cautioned that forward-looking statements are not guarantees of future performance and are inherently uncertain. Accordingly, investors are cautioned not to put undue reliance on forward-looking statements.
We caution you that these cautionary remarks expressly qualify in their entirety all forward-looking statements attributable to us or persons acting on our behalf.
TRADEMARKS
The “Profound Medical” name and design logo are our registered trademarks. Solely for convenience, the trademarks, service marks, and trade names referred to in this Registration Statement are without the ® and TM symbols, but such references are not intended to indicate, in any way, that we will not assert, to the fullest extent under applicable law, our rights or the rights of the applicable licensors to these trademarks, service marks and trade names. This Registration Statement contains additional trademarks, service marks and trade names of others, which are the property of their respective owners. All trademarks, service marks and trade names appearing in this Registration Statement are, to our knowledge, the property of their respective owners. We do not intend our use or display other companies’ trademarks, service marks or trade names to imply a relationship with, or endorsement or sponsorship of us by, any other companies.
MARKET AND INDUSTRY DATA
This Registration Statement includes statistics and other data relating to markets, market sizes and other industry data pertaining to our business that we have obtained from industry publications and surveys and other information available to us. Industry publications and surveys generally state that the information contained therein has been obtained from sources believed to be reliable. Market data and statistics are inherently predictive and speculative and are not necessarily reflective of actual market conditions. Such statistics are based on market research, which itself is based on sampling and subjective judgments by both the researchers and the respondents, including judgments about what types of products and transactions should be included in the relevant market. In addition, the value of comparisons of statistics for different markets is limited by many factors, including that (i) the markets are defined differently, (ii) the underlying information was gathered by different methods and (iii) different assumptions were applied in compiling the data. Accordingly, the market statistics included in this prospectus should be viewed with caution. We believe that information from these industry publications included in this Registration Statement is reliable.
GLOSSARY OF TERMS
As used in this Registration Statement, the following terms have the respective meaning as specified below:
| 2016 Bought Deal | has the meaning given under the heading Item 5.B, “Liquidity and Capital Resources—Recent Sources and Uses of Financing—Bought Deals”. |
| | |
| 2017 Bought Deal | has the meaning given under the heading Item 5.B, “Liquidity and Capital Resources—Recent Sources and Uses of Financing—Bought Deals”. |
| | |
| 2018 Bought Deal | has the meaning given under the heading Item 5.B, “Liquidity and Capital Resources—Recent Sources and Uses of Financing—Bought Deals”. |
| 3D | means three-dimensional. |
| | |
| ablation | means to remove or destroy tissue. |
| | |
| ACA | means the 2010 Affordable Care Act and the Health Care and Education Affordability Reconciliation Act of 2010. |
| | |
| ADT | means androgen deprivation therapy. |
| | |
| Articles | means our Articles of Incorporation, as amended. |
| | |
| Audit Committee | has the meaning given under the heading Item 6.C, “Directors, Senior Management and Employees—Board Practices—Audit Committee”. |
| | |
| BDC Capital | means BDC Capital Inc. |
| | |
| Board | means the Board of Directors of Profound Medical Corp. |
| | |
| Bought Deals | means the 2016 Bought Deal, the 2017 Bought Deal and/or the 2018 Bought Deal, as the context may require. |
| | |
| BPH | means benign prostatic hyperplasia, a condition where the prostate gland is enlarged and not cancerous. |
| | |
| brachytherapy | means the precise placement of short-range radiation-sources (radioisotopes) directly at the site of the cancerous tumor. |
| | |
| Canada MDR | means the Medical Devices Regulations issued by Health Canada’s Therapeutic Products Directorate. |
| | |
| CE Mark | means “Conformité Européenne” and is affixed to a medical device in the European Union by its manufacturer or his authorized representative to declare that the medical device complies with the essential requirements of the Medical Device Directive (Council Directive 93/42/EEC, “MDD”) and that the appropriate related conformity assessment procedure as provided in the MDD and its annexes has been conducted. |
| | |
| CIBC | means Canadian Imperial Bank of Commerce. |
| | |
| CIBC Loan | means the initial gross proceeds of C$12,500,000, maturing on July 29, 2022, with an interest rate based on prime plus 2.5%, pursuant to the CIBC Loan Agreement. |
| | |
| CIBC Loan Agreement | means the loan agreement entered into on July 30, 2018 between PMI, as borrower; Profound, Profound Medical (U.S.) Inc and Profound Medical GmbH, as guarantors; and CIBC, as lender. |
| | |
| Common Shares | means the common shares in the capital of Profound Medical Corp. |
| | |
| cryoablation | means a therapy that uses extreme cold temperature to destroy benign and malignant tissue by crystallizing it. |
| | |
| de novo classification | means the submission of a petition to the FDA to reclassify a novel non-predicated Class III device as a Class I or II device pursuant to Section 513(f)(2) of the United States Federal Food, Drug and Cosmetic Act. |
| | |
| EBRT | means external beam radiation therapy. |
| | |
| EPIC | means the Expanded Prostate Cancer Index Composite. |
| | |
| Essential Requirements | has the meaning given under the heading Item 4.B, “Information on the Company—Business Overview—Regulation—European Union”. |
| European Union or EU | means an organization created in 1993 with the aim of achieving closer economic and political union between the member states of Europe and currently comprising Austria, Belgium, Bulgaria, Croatia, Cyprus, the Czech Republic, Denmark, Estonia, Finland, France, Germany, Greece, Hungary, Ireland, Italy, Latvia, Lithuania, Luxembourg, Malta, the Netherlands, Poland, Portugal, Romania, Slovakia, Slovenia, Spain, Sweden, and the United Kingdom. |
| | |
| Executive Employment Agreements | has the meaning given under the heading Item 6.B., “Compensation—Executive Compensation—Executive Employment Agreements – Termination and Change of Control Benefits.” |
| | |
| False Claims Act | means the U.S. False Claims Act, 31 U.S.C. §§ 3729-3733. |
| | |
| FCPA | means the U.S. Foreign Corrupt Practices Act of 1977, as amended. |
| | |
| FDA | means the United States Food and Drug Administration. |
| Federal Economic Development Agency Loan | has the meaning given under the heading Item 5.B, “Liquidity and Capital Resources—Recent Sources and Uses of Financing—Federal Economic Development Agency Loan”. |
| | |
| FFDCA | means the Federal Food, Drug and Cosmetic Act, 21 U.S.C. § 301 et seq., as amended. |
| | |
| FSCAs | means Field Safety Corrective Actions. |
| | |
| Genesys | means Genesys Ventures II LP. |
| | |
| Gleason Score | means the histological assessment of prostate tissue using a tumor grading system which describes how aggressive a prostate cancer is on a scale from 1 (least aggressive) to 5 (most aggressive). The Gleason score is a combination of the two most common growth patterns observed in a biopsy specimen. |
| | |
| Gn-RH | means gonadotrophin-releasing hormone. |
| | |
| HDR | means high dose radiation. |
| | |
| Health Technology Exchange Loan | has the meaning given under the heading Item 5.B, “Liquidity and Capital Resources—Recent Sources and Uses of Financing—Health Technology Exchange Loan”. |
| | |
| HIFU | means high intensity focus ultrasound. |
| | |
| HIPAA | means Health Insurance Portability and Accountability Act of 1996. |
| | |
| IDE | means an investigational device exemption under the FFDCA and FDA regulations. |
| | |
| IFRS | means the International Financial Reporting Standards as issued by the International Accounting Standards Board. |
| | |
| IIEF | means the International Index of Erectile Function. |
| | |
| income test | has the meaning given under the heading Item 10.E, “Additional Information—Taxation—Certain U.S. Federal Income Tax Considerations”. |
| Insider Participation Limits | has the meaning given under the heading Item 6.B., “Compensation—Executive Compensation—Share Option Plan.” |
| | |
| IRB | means an institutional review board. |
| | |
| JOBS Act | means the Jumpstart Our Business Startups Act of 2012, as amended. |
| | |
| Knight | means Knight Therapeutics Inc. |
| | |
| Knight Loan | means the secured loan of C$4,000,000 bearing interest at 15% per annum provided by Knight pursuant to the Knight Loan Agreement. |
| | |
| Knight Loan Agreement | means the loan agreement entered into on April 30, 2015 between PMI and Knight. |
| | |
| MDB | means Medical Devices Bureau of Health Canada. |
| | |
| Medical Devices Directive | means the Council Directive 93/42/EEC concerning medical devices. |
| | |
| Medical Device License | means the license for marketing approval of a medical device in Canada. |
| | |
| MHLW | means Japan’s Pharmaceutical and Medical Device Agency. |
| | |
| Mira | has the meaning given under the heading Item 4.A.1, “History and Development of the Company—Name, Address and Incorporation; Trading Market”. |
| | |
| Mira Subco | has the meaning given under the heading Item 4.A.1, “History and Development of the Company—Name, Address and Incorporation; Trading Market”. |
| | |
| MR | means magnetic resonance. |
| | |
| MR-HIFU | means magnetic resonance guided high intensity focused ultrasound. |
| | |
| MRI | means magnetic resonance imaging. |
| | |
| Nasdaq | means the Nasdaq Stock Market LLC (a U.S. national securities exchange). |
| | |
| New Siemens Agreement | has the meaning given under the heading Item 10.C, “Additional Information—Material Contracts. |
| | |
| New EU MDR | has the meaning given under the heading Item 4.B, “Business Overview—Regulatory—European Union Regulation”. |
| | |
| NMPA | National Medical Products Administration of China. |
| | |
| non-resident holder | has the meaning given under the heading Item 10.E, “Additional Information—Taxation—Canadian Federal Income Taxation”. |
| | |
| OBCA | means the Business Corporations Act (Ontario), as amended, together with all regulations promulgated pursuant thereto. |
| | |
| Old PMI | has the meaning given under the heading Item 4.A.1, “History and Development of the Company—Name, Address and Incorporation; Trading Market”. |
| | |
| Original Siemens Agreement | has the meaning given under the heading Item 4.B, “Information on the Company—Business Overview—Alliances and Partnerships—Siemens”. |
| Philips | means Koninklijke Philips N.V. |
| | |
| Philips Confidentiality Agreement | has the meaning given under the heading Item 10.C, “Additional Information—Material Contracts”. |
| | |
| Philips Medical | has the meaning given under the heading Item 10.C, “Additional Information—Material Contracts”. |
| | |
| Philips Resale Purchasing Agreement | has the meaning given under the heading Item 10.C, “Additional Information—Material Contracts”. |
| | |
| Philips Share Purchase Agreement | has the meaning given under the heading Item 10.C, “Additional Information—Material Contracts”. |
| | |
| Philips Supply Agreement | has the meaning given under the heading Item 10.C, “Additional Information—Material Contracts”. |
| | |
| PIRADS | means Prostate Imaging Reporting and Data System. |
| | |
| PMA | means the Pre-Market Approval application process for marketing approval of medical devices in the United States. |
| | |
| PMD Act | means Japan’s Pharmaceutical and Medical Device Act. |
| | |
| PMDA | means Japan’s Pharmaceutical and Medical Device Agency. |
| | |
| PMI | means Profound Medical Inc., an OBCA corporation and Profound’s 100%-owned direct subsidiary, which serves as the holding subsidiary of our operating subsidiaries. |
| | |
| Profound | means Profound Medical Corp., an OBCA corporation and our TSX-traded holding company and registrant for purposes of this Registration Statement. |
| | |
| PSA | means prostate specific antigen. |
| | |
| QMS | means quality management system. |
| | |
| QSR | means the FDA’s Quality System Regulation. |
| | |
| radical prostatectomy | means a surgical procedure that involves the removal of the whole prostate gland. |
| | |
| Registration Statement | means this registration statement on Form 20-F. |
| | |
| Sarbanes-Oxley | means the Sarbanes-Oxley Act of 2002, as amended. |
| | |
| SEC | means the U.S. Securities and Exchange Commission. |
| | |
| SEDAR | means the Canadian System for Electronic Document Analysis and Retrieval. |
| | |
| Share Consolidation | has the meaning given under the heading Item 4.A.1, “History and Development of the Company—Name, Address and Incorporation; Trading Market”. |
| | |
| Share Option Plan | means our amended and restated share option plan dated July 13, 2018. |
| | |
| Siemens | means Siemens Healthcare GmbH. |
| | |
| Sonalleve | means the technology acquired from Philips in 2017 underlying our Sonalleve system, which combines real-time MRI and thermometry with focused ultrasound delivered from the outside to the patient to enable precise and incision-free ablation of diseased tissue. |
| Sonalleve system | means our system utilizing Sonalleve technology. |
| | |
| Sonalleve Transaction | means the transaction with Philips on July 31, 2017, where we entered into the Philips Share Purchase Agreement with Philips in order to expand the existing collaboration and acquire the Sonalleve technology, which we use in our Sonalleve system. |
| | |
| Sunnybrook | means the Sunnybrook Health Sciences Centre. |
| | |
| Sunnybrook License | has the meaning given under the heading Item 10.C, “Additional Information—Material Contracts”. |
| | |
| TACT or TACT Pivotal Clinical Trial | means our TULSA-PRO Ablation Clinical Trial, a prospective, open-label, single-arm pivotal clinical study of our TULSA-PRO system. |
| | |
| TPD | means Health Canada’s Therapeutic Products Directorate. |
| | |
| TSX | means the Toronto Stock Exchange. |
| | |
| TSX-V | means the TSX Venture Exchange. |
| | |
| TULSA | means transurethral ultrasound ablation. |
| | |
| TULSA-PRO | means our TULSA technology, which is used in our TULSA-PRO systems. |
| | |
| TULSA-PRO system | means our leading product, which combines real-time MRI, robotically-driven transurethral sweeping action/thermal ultrasound and closed-loop temperature feedback control, and is comprised of two categories of components: disposables and the capital equipment used in conjunction with a customer’s MRI scanner. |
| | |
| TURP | means a transurethral resection of the prostate, a surgical procedure that removes portions of the prostate gland via the urethra. |
| | |
| UA | means ultrasound applicator. |
| | |
| urinary rectal fistula | means an abnormal channel between the bladder and rectum resulting in the potential for leakage of urine from the urinary tract into surrounding tissues. |
| | |
| USPTO | means the United States Patent and Trademark Office. |
PART I
ITEM 1. IDENTITY OF DIRECTORS, SENIOR MANAGEMENT AND ADVISERS
A. Directors and Senior Management
For the names, business addresses and functions of our directors and senior management, see Item 6.A, “Directors and Senior Management” and Item 6.C, “Board Practices”.
B. Advisors
Our principal legal advisers are Torys LLP, 79 Wellington St. W., 33rd Floor, TD South Tower, Toronto, Ontario, Canada M5K 1N2.
C. Auditors
PricewaterhouseCoopers LLP audited our consolidated financial statements for the fiscal years ended December 31, 2018, 2017 and 2016. The address of PricewaterhouseCoopers LLP is PwC Centre, 354 Davis Road, Suite 600, Oakville, Ontario, Canada L6J 0C5.
ITEM 2. OFFER STATISTICS AND EXPECTED TIMETABLE
Not applicable.
ITEM 3. KEY INFORMATION
A. Selected Financial Data
The following table sets forth selected consolidated financial information for the periods indicated, prepared in accordance with IFRS. The selected consolidated statements of operations data and balance sheet data as of and for the years ended December 31, 2018, 2017 and 2016 are derived from our audited consolidated financial statements set forth elsewhere in this Registration Statement. The selected consolidated statements of operations data for the three and six months ended June 30, 2019 and 2018 and selected consolidated balance sheet data as of June 30, 2019 are derived from our unaudited consolidated financial statements included elsewhere in this Registration Statement.
The selected consolidated financial information should be read in conjunction with the financial statements and accompanying notes thereto contained elsewhere in this Registration Statement and discussions in Item 5, “Operating and Financial Review and Prospects”. The selected consolidated financial information set out below may not be indicative of our future performance.
| | | Three Months
Ended June 30, | | | Six Months
Ended June 30, | | | Year Ended
December 31, | |
| | | 2019 | | | 2018 | | | 2019 | | | 2018 | | | 2018 | | | 2017 | | | 2016 | |
| | | | (Unaudited) | | | | (Unaudited) | | | | | | | | | | | | | |
| Figures in C$ unless otherwise stated Consolidated Statements of Operations Data: | | | | | | | | | | | | | | | | | | | | | | | | | | | | |
| Revenues | | | 574,109 | | | | 213,343 | | | | 2,049,897 | | | | 589,678 | | | | 2,602,278 | | | | 4,904,550 | | | | - | |
| Cost of sales | | | 244,066 | | | | 126,259 | | | | 777,422 | | | | 357,334 | | | | 1,778,501 | | | | 3,032,208 | | | | - | |
| Gross profit | | | 330,043 | | | | 87,084 | | | | 1,272,475 | | | | 232,344 | | | | 823,777 | | | | 1,872,342 | | | | - | |
| Expenses: | | | | | | | | | | | | | | | | | | | | | | | | | | | | |
| Research and development expenses | | | 3,186,355 | | | | 2,347,909 | | | | 5,864,101 | | | | 4,864,690 | | | | 10,265,388 | | | | 9,638,190 | | | | 9,988,693 | |
| General and administrative expenses | | | 1,586,323 | | | | 2,236,529 | | | | 3,100,436 | | | | 3,539,733 | | | | 6,656,723 | | | | 5,935,215 | | | | 4,369,288 | |
| Selling and distribution expenses | | | 1,154,869 | | | | 1,113,225 | | | | 625,524 | | | | 2,060,127 | | | | 4,091,347 | | | | 3,925,804 | | | | 1,282,433 | |
| Total expenses | | | 5,927,547 | | | | 5,697,663 | | | | 9,590,061 | | | | 10,464,550 | | | | 21,013,458 | | | | 19,499,209 | | | | 15,640,414 | |
| Finance costs | | | 337,220 | | | | 313,606 | | | | 651,905 | | | | 633,569 | | | | 826,312 | | | | 1,249,084 | | | | 829,899 | |
| Financial income | | | (110,790 | ) | | | (117,357 | ) | | | (252,671 | ) | | | (157,161 | ) | | | (483,788 | ) | | | (127,732 | ) | | | (157,598 | ) |
| Net finance costs | | | 226,430 | | | | 196,249 | | | | 399,234 | | | | 476,408 | | | | 342,524 | | | | 1,121,352 | | | | 672,301 | |
| Loss before income taxes | | | 5,823,934 | | | | 5,806,828 | | | | 8,716,820 | | | | 10,708,614 | | | | 20,532,205 | | | | 18,748,219 | | | | 16,312,715 | |
| Income tax expense | | | 20,200 | | | | 24,200 | | | | 54,000 | | | | 60,600 | | | | 230,784 | | | | 74,123 | | | | 14,054 | |
| Net loss attributable to shareholders for the period | | | 5,844,134 | | | | 5,831,028 | | | | 8,770,820 | | | | 10,769,214 | | | | 20,762,989 | | | | 18,822,342 | | | | 16,326,769 | |
| Other comprehensive income | | | (11,843 | ) | | | 57,943 | | | | (58,232 | ) | | | 14,695 | | | | 29,226 | | | | (69,245 | ) | | | 11,316 | |
| Net loss and comprehensive loss for the period | | | 5,832,291 | | | | 5,888,971 | | | | 8,712,588 | | | | 10,783,909 | | | | 20,792,215 | | | | 18,753,097 | | | | 16,338,085 | |
| | | | | | | | | | | | | | | | | | | | | | | | | | | | | |
| Loss per share: | | | | | | | | | | | | | | | | | | | | | | | | | | | | |
| Basic and diluted weighted average shares outstanding | | | 108,061,539 | | | | 107,727,319 | | | | 108,058,221 | | | | 92,614,640 | | | | 100,395,649 | | | | 61,404,141 | | | | 41,510,145 | |
| Basic and diluted | | | 0.05 | | | | 0.05 | | | | 0.08 | | | | 0.12 | | | | 0.21 | | | | 0.31 | | | | 0.39 | |
| | | As of
June 30, | | | As of
December 31, | |
| | | 2019 | | | 2018 | | | 2017 | |
| | | (Unaudited) | | | | | | | |
| Consolidated Balance Sheet Data: | | | | | | | | | | | | |
| Cash(1) | | C$ | 20,493,470 | | | C$ | 30,687,183 | | | C$ | 11,103,223 | |
| Total assets | | | 37,862,711 | | | | 46,549,872 | | | | 27,879,379 | |
| Total liabilities | | | 19,443,184 | | | | 19,923,538 | | | | 13,738,240 | |
| Deficit | | | (119,644,062 | ) | | | (111,033,661 | ) | | | (90,270,672 | ) |
| Total shareholders’ equity | | | 18,419,527 | | | | 26,626,334 | | | | 14,141,139 | |
| (1) | Following FDA clearance of our TULSA-PRO system in August 2019, we paid a C$250,000 milestone payment to Sunnybrook under the Sunnybrook License. See Item 4.B, “Business Overview—Intellectual Property—Licenses”. |
B. Capitalization and Indebtedness
The following table sets forth our capitalization as of June 30, 2019. You should read this information together with our historical financial information and other information provided in this Registration Statement, including Item 5, “Operating and Financial Review and Prospects” and our unaudited consolidated financial statements as of and for the three months ended June 30, 2019 and 2018, including the notes thereto, set forth elsewhere in this Registration Statement.
| | | As of June 30,
2019 | |
| | | (Unaudited) | |
| Figures in C$ unless otherwise stated | | | | |
| Long-Term Debt | | | | |
| Long-term bank loan (secured) (non-current portion)(1) | | $ | 8,562,737 | |
| Total long-term debt | | | 8,562,737 | |
| | | | | |
| Equity | | | | |
| Share capital | | | 120,942,408 | |
| Contributed surplus | | | 17,208,040 | |
| Accumulated other comprehensive loss | | | (86,935 | ) |
| Deficit | | | (119,644,062 | ) |
| Total equity | | | 18,419,527 | |
| | | | | |
| Total Capitalization (long-term debt and equity) | | $ | 26,982,264 | |
| (1) | Excludes current portion of C$3,475,358. |
C. Reasons for the Offer and Use of Proceeds
Not applicable.
D. Risk Factors
An investment in the Common Shares involves a high degree of risk and should be considered highly speculative due to the nature and present early stage of our business. The following risks are the material risks that we face; however, the risks below are not the only ones we face. Additional risks and uncertainties not presently known to us or that we believe to be immaterial may also adversely affect our business. If any of the following risks occur, our business, financial condition and results of operations could be seriously harmed and you could lose all or part of your investment. Before deciding to invest in any Common Shares, investors should carefully consider the risk factors described below.
Risk Factors Relating to Our Operating History and Financial Condition
We have a limited operating history and history of operating losses.
We commenced operations in June 2008 and have only begun generating revenues in 2017. As of June 30, 2019, we had an accumulated deficit of C$119,644,062 and had cash and cash equivalents of approximately C$20.5 million. Since inception, we have incurred significant losses each year. For the six months ended June 30, 2019, we recorded a net loss of C$8,770,820, and for the year ended December 31, 2018, we recorded a net loss of C$20,762,989. We expect to incur significant operating losses even as we begin to commercialize the TULSA-PRO system in the United States following our recent FDA clearance, which will require significant expenditures to increase our sales and marketing capabilities and expand our manufacturing and distribution capacity, as well as other expenses related to increasing reimbursement coverage and gaining market acceptance among patients, physicians/clinicians and others in the medical community. In addition, we plan to continue product research and development and clinical trials and may pursue additional regulatory approvals. There is no assurance that we will ever successfully commercialize our systems, generate significant revenues from our approved products or achieve profitability. Even if profitability is achieved, we may not be able to sustain or increase profitability. Our failure to achieve or maintain profitability could negatively impact the value of the Common Shares.
Our business is capital intensive and requires significant investment to increase our commercial capacity for our approved products, and the resources to do so may not be available in amounts or on terms acceptable to us, if at all.
Our business requires substantial capital investment in order to commercialize our approved products, in particular to expand our sales and marketing capabilities and increase our manufacturing capacity, as well as to conduct research and development and to obtain regulatory approvals for existing products and future product candidates. We will likely need additional capital to fund our current and planned business activities and to fund any significant expansion of operations. In order to secure financing, if available, it is likely that we would need to sell additional Common Shares and/or securities that are exchangeable for or convertible into Common Shares, incur additional indebtedness and/or enter into development, manufacturing, distribution and/or licensing relationships. Any future equity financing may be dilutive to existing shareholders. Any future debt financing arrangements we enter into (like our CIBC Loan Agreement as described below) would likely contain restrictive covenants that would impose significant operating and, if any, financial restrictions on us. The availability of equity or debt financing will be affected by, among other things, our commercial progress and market acceptance in respect of the TULSA-PRO system and other approved products, as well as the results of our research and development, our ability to obtain regulatory approvals, the state of the capital markets generally, strategic alliance agreements, and other relevant considerations.
Any additional financing may not be obtained on favorable terms, if at all. If we cannot obtain adequate funding on reasonable terms, we may not be able advance our business strategy and/or the commercialization of our approved products, and we may need to terminate or delay clinical trials, curtail significant regulatory initiatives, and/or sell, license or assign rights to our technologies, products or product candidates.
Our cash outflows are expected to consist primarily of expenditures to increase our commercial capacity, particularly in sales and marketing, as well as in manufacturing and distribution. In addition, we intend to continue internal and external research and development efforts to develop and expand our product pipeline, as well as incur general and administrative expenditures to support our corporate infrastructure. If we do not obtain sufficient additional capital, there may be substantial doubt about our ability to continue as a going concern and realize assets and pay liabilities as they become due. Depending upon the results of our research and development programs and the availability of financial resources, we could decide to accelerate, terminate or reduce certain projects, or commence new ones. Any failure on our part to raise additional funds on terms favorable to us, or at all, may require us to significantly change or curtail current or planned operations in order to conserve cash until such time, if ever, that sufficient proceeds from operations are generated, and could result in us not taking advantage of business opportunities, in the termination or delay of clinical trials for one or more of our product candidates, in curtailment of our product development programs designed to identify new product candidates, and/or in the sale or assignment of rights to our technologies, products or product candidates. Any of the foregoing could have a material adverse effect on our business, financial condition and results of operations.
Our CIBC Loan Agreement contains financial and non-financial covenants that may impact how we operate our business. In addition, failure to comply with any of these covenants could have a material adverse effect on our business.
Our CIBC Loan Agreement contains financial and non-financial covenants, including a requirement that our unrestricted cash is at all times greater than our operating cash expenditures during any trailing three month period. Complying with such covenants may at times necessitate that we must forego other favorable business opportunities. Moreover, our failure to comply with any of these covenants would likely constitute a default under any other similar facilities and agreements that we may enter into in the future, and could give rise to an acceleration of some, if not all, of our other then outstanding indebtedness, if any, which would have a material adverse effect on our business. Our indebtedness may grow as our business grows and/or we make acquisitions. If our income from operations underperforms, we may have to utilize cash flow or capital resources to fund our debt service payments. If our cash flow and capital resources are insufficient to service amounts owed under our current or any future indebtedness, we may be forced to reduce or delay capital expenditures, dispose of assets, license or assign the rights to our technology, issue equity or incur additional debt to obtain necessary funds, or restructure our debt, any or all of which could have a material adverse effect on our business, financial condition and results of operations. In addition, we cannot guarantee that we would be able to take any of these actions on terms acceptable to us, or at all; that these actions would enable us to continue to satisfy our capital requirements; or that these actions would be permitted under the terms of our debt agreements. In particular, the CIBC Loan Agreement contains covenants with respect to capital expenditures and other indebtedness, maintaining minimum cash balances at all times and certain financial covenants. We have granted a security interest over all of our assets (including the shares of our subsidiaries owned by us). Events of default under the CIBC Loan Agreement include among other things, any covenant breach (subject, in certain instances, to a cure period), insolvency of Profound or its subsidiaries, the occurrence of certain events which would have a material adverse effect, cross defaults to other agreements, a failure to comply with certain financial tests, and a change of control of Profound or its subsidiaries. The enforcement by CIBC of its rights and remedies pursuant to the terms of the CIBC Loan Agreement and associated documentation could result in CIBC, its agent or any third party purchaser thereof owning all of our assets, including the shares of our subsidiaries.
We are exposed to foreign currency risk, which exposure will increase as we commercialize our approved products in the United States; to date, we have not hedged against risk associated with foreign exchange rate exposure.
As we commercialize our approved products, in particular our TULSA-PRO system in the United States, we expect that a significant portion of our revenues, expenses, current assets and current liabilities will be denominated in United States dollars, Euros and other foreign currencies. Currently, our financial statements are expressed in Canadian dollars. A decrease in the value of such foreign currencies relative to the Canadian dollar could result in decreases in revenues from currency exchange rate fluctuations. To date, we have not hedged against risk associated with foreign exchange rate exposure. Consequently, our results of operations may be negatively affected by foreign currency exchange rate fluctuations, which could have a negative impact on the market price of our Common Shares.
Risks Related to Our Business and Growth Strategy
We may not achieve our commercialization and future product development goals in the time frames expected, or at all.
We may set goals for and makes public statements regarding the timing of the accomplishment of objectives material to our success, such as the timing and extent of product launches in the jurisdictions where they are approved for marketing and sale, in particular our expected commercialization of the TULSA-PRO system following our recently obtained FDA clearance in the United States; third-party reimbursement for our approved products; the timing and terms of any collaborations, partnerships, licenses, acquisitions or other agreements; the commencement and completion of clinical trials, including follow-up data on our TACT Pivotal Clinical Trial; and anticipated regulatory submission and approval dates for our products in additional jurisdictions, and for future product candidates. The actual timing of these events can vary dramatically due to factors such as the uncertainties inherent in the arrangements sufficient to commercialize our products, including in respect of manufacturing, distribution and marketing, as well as market competition and adverse results from our clinical trials, and other factors and described herein, many of which are beyond our control. There can be no assurance that we will achieve our commercialization goals in respect of the TULSA-PRO system in the United States, or that future efficacy and safety results from our TACT Pivotal Clinical Trial will be favorable. If we fail to commercialize the TULSA-PRO system in the United States or any other approved products in the time frame and to the extent that we anticipate, our business, results of operations and financial condition may be materially adversely affected, and the price of the Common Shares could decline.
Our products, including the TULSA-PRO system, may not achieve or maintain expected levels of market acceptance.
The commercial success of our approved products, including the TULSA-PRO system which was recently FDA-cleared in the United States, is dependent upon achieving and maintaining market acceptance. New medical devices that appear promising in development may fail to reach the market or may have only limited or no commercial success. Levels of market acceptance for our products could be impacted by several factors, many of which are not within our control, including but not limited to:
| · | safety, efficacy, convenience and cost-effectiveness of our systems as a method of ablation of prostate tissue, uterine fibroids, bone metastases compared to products of our competitors or other forms of treatment; |
| · | scope of approved uses and marketing approval or clearance; |
| · | timing of market entry of our products versus those of our competitors; |
| · | difficulties in, or excessive costs required in the process of, manufacturing our products; |
| · | expanding compatibility of our systems to work with MRI scanners other than those made by Philips and Siemens, and maintaining our existing relationships with Philips and Siemens; |
| · | infringement or alleged infringement of the patents or intellectual property rights of others; |
| · | acceptance of the price of our products relative to those of our competitors; |
| · | acceptance and adoption of our products by patients, physicians/clinicians and the medical community; |
| · | the availability of training necessary for proficient use of our products, as well as willingness of physicians and technicians to participate in such training; |
| · | the perceived risks generally associated with the use of new products and procedures; |
| · | the placement of our products in treatment guidelines published by leading medical organizations; |
| · | the size and growth rate of the market for our products in the major geographies in which we operate or intend to operate, in particular in the United States; and |
| · | acceptance of our products by government and third-party payers for adequate reimbursement coverage. |
In addition, the success of any new product will depend on our ability to either successfully build our in-house sales and marketing capabilities or to maintain or secure new, or to realize the benefits of existing or future arrangements with, third-party marketing or distribution partners. See “—We intend to rely primarily on our in-house sales and marketing capabilities for our commercialization strategy, which will require substantial build-up and commitment of resources” and “—We currently rely on our collaborative partners, and we may rely on additional collaborative partnerships, to assist in the sales and marketing and/or distribution of our approved products” below. If we are unable to commercialize new products successfully, whether through a failure to achieve market acceptance, a failure to build our own in-house sales and marketing capabilities, a failure to maintain or secure new or existing marketing partners or to realize the benefits of our arrangements with our marketing and distribution partners, there may be a material adverse effect on our business, financial condition and results of operations and it could cause the market value of our Common Shares to decline.
Market acceptance of our approved products also depends on our ability to identify and address the relevant market. For example, our TULSA-PRO system is FDA-cleared in the United States for transurethral ultrasound ablation (“TULSA”) of prostate tissue, and is not specific to any particular condition or disease. For more information, see “We may be subject to fines, penalties or injunctions if we are determined to be promoting the use of our products for unapproved or “off-label” uses or engaged in false or misleading promotion.” below. Furthermore, our estimates of the number of patients who have received or might have been candidates to use a specific product may not accurately reflect the true market or market prices for such products or the extent to which such products will actually be used by patients. Our failure to successfully introduce and market our approved products could have a material adverse effect on our business, financial condition, and results of operations.
Successful commercialization of our approved products, including the TULSA-PRO system, and future product development depends upon our maintaining strong working relationships with physicians/clinicians.
If we fail to maintain positive working relationships with physicians/clinicians, our approved products, including our TULSA-PRO system, may not achieve the level of market acceptance sufficient for successful commercialization of the products. It is important for us to market our approved systems successfully to physicians/clinicians who we expect will use our approved products, and we depend on our sales and marketing personnel (and those of our collaborative partners, e.g., Philips and Siemens) to do so in an effective manner. We can provide no assurance that physicians/clinicians will prescribe or otherwise utilize our TULSA-PRO systems based on our existing clinical data (such as our TACT data) or the results of any future clinical trials, or at all. See “—Data from our clinical trials may not support regulatory approvals or clearances and/or reimbursement coverage for our products” below. We also rely on our relationships with physicians/clinicians to further develop our existing products and develop future product candidates in line with the clinical needs and expectations of the professionals who we expect will use and support the devices. These development efforts are similarly dependent upon us and our collaborative partners maintaining working relationships with physicians/clinicians.
In addition, we rely on physicians/clinicians to provide considerable knowledge and experience that assists us in the marketing and sale of our approved products and development of our products and product candidates. Physicians/clinicians assist us as researchers, marketing and product consultants, inventors and public speakers. If we are unable to maintain strong relationships with these professionals and continue to receive their advice and input, the development and marketing of our products could suffer, which could have a material adverse effect on our business, financial condition and operating results.
Physicians/clinicians misuse could result in negative publications, negative sentiment or adverse events, thereby limiting market acceptance and future sales of our products.
There is a risk that physicians/clinicians may misuse our products, such as not following the instructions for use, not using our products on the intended patient population, using our products with unapproved or modified hardware or software, or misuse by inadequately trained staff. Physicians/clinicians may also initiate their own clinical studies which may be poorly designed or controlled, and may result in adverse safety or efficacy results. Any of the foregoing could result in negative publications, negative sentiment or adverse events or regulatory actions in respect of our products, thereby limiting market acceptance and sales of our products, which could have a material adverse effect on our business, financial condition and results of operations.
We rely on the compatibility of our products with MRI scanners in the successful commercialization of our products.
We have designed our TULSA-PRO system to be capable of integration with some of the MRI scanners from two of the major MRI manufacturers (Philips and Siemens), and the Sonalleve system with one MRI manufacturer (Philips). Although we believe that our approved products can be used by the vast majority of hospitals and treatment facilities, not all such facilities utilize MRI scanners that are compatible with the TULSA-PRO and Sonalleve systems, and such facilities would be required to acquire (or outsource to other facilities that already have) compatible MRI equipment, which may increase their costs and which could restrict or delay utilization of our systems by such facilities. Accordingly, we intend to expand compatibility of the systems with other MRI scanners in the future, which would require design changes to our systems, collaboration with the manufacturer of the MRI scanner and may require additional regulatory approvals. We may be unsuccessful in making the necessary design changes and, if required, receiving the necessary regulatory approvals for such changes, and the terms of any such arrangements that we may enter into in the future with the MRI scanner manufacturers may not be on as favorable terms. Accordingly, we can provide no assurance that we will be successful in any such expansion of the compatibility of our products to other MRI scanners.
Successful commercialization of our approved products will also depend on the cost of the system and the availability of coverage and adequate reimbursement coverage from third-party payers.
Successful commercialization of our approved products, including our TULSA-PRO system, depends largely upon the cost of the system and the availability of coverage and adequate reimbursement for the system, and the medical procedure associated with its use, from third-party payers, such as government healthcare programs, private health insurers and other organizations, such as health maintenance organizations and managed care organizations. We expect that our systems will be purchased by health-care providers, including clinics and hospitals that use MRI scanners that are compatible with our systems, and that these providers will subsequently bill various third-party payers or will be responsible for covering the costs of the system through the provider’s operating budget. Although we expect there to be an out-of-pocket market for our approved products, an out-of-pocket market alone is unlikely to be sufficient to support successful commercialization of our products. To date we have not secured significant coverage or reimbursement for any of our products from government or third-party payors in the jurisdictions where we have regulatory approvals, including our TULSA-PRO system in the United States. We can provide no assurance that third-party payers will provide coverage and adequate reimbursement for our TULSA-PRO system to treat our targeted indications based on our existing clinical data (such as our TACT data) or the results of any future clinical trials, or at all. See “—Data from our clinical trials may not support regulatory approvals or clearances and/or coverage and reimbursement for our products” below. Accordingly, we likely will need to conduct additional research and successfully complete additional clinical trials in order to obtain such coverage (e.g., follow-up data from our TACT Pivotal Clinical Trial). Such additional research and clinical trials may require significant time and resources, and may not be successful, which could result in the postponement of or inability to obtain coverage and reimbursement for our approved products, which could significantly delay or otherwise negatively affect our commercialization strategy. Any of the foregoing could, in turn, have a material adverse effect on our business, results of operations and financial condition.
Third-party payers carefully review and increasingly challenge the prices charged for medical devices, procedures and services. Government healthcare programs in the United States and the European Union may reimburse certain providers at a pre-determined all-inclusive amount for all the costs associated with a particular procedure performed or course of treatment, based on such factors as the patient’s principal diagnosis, age and severity or complexity. Similarly, the surgeon or physician may be reimbursed at a pre-determined amount based on the procedure performed, and without taking into consideration the actual costs incurred, including the actual cost of the specific devices used.
New products are being increasingly scrutinized with respect to whether or not they will be covered at all by the various health plans and at what level of reimbursement. In some instances, economic research studies are and will be required to demonstrate whether our products and approach are superior from a long-term cost containment standpoint. Third-party payers may determine that our products are not medically necessary, not cost-effective, experimental, or primarily intended for non-approved indications. Such determinations could have a material adverse effect on our business, results of operations and financial condition.
Further, healthcare reform measures may be adopted in the future that may impose more rigorous coverage and reimbursement standards. We are unable to predict what, if any, additional legislation or regulation impacting the healthcare industry or third-party coverage and reimbursement may be enacted in the future, or what effect such legislation or regulation would have on our business.
We intend to rely primarily on our in-house sales and marketing capabilities for our commercialization strategy, which will require substantial build-up and commitment of resources.
We intend to rely primarily on our in-house sales and marketing capabilities in order to advance our commercialization strategy, particularly in the United States in respect of our recently FDA-cleared TULSA-PRO system. This will require a substantial commitment of time and resources in the near-term, and we may be unsuccessful in executing on this strategy, which could negatively impact our anticipated commercialization. We are in the early stages of expanding our U.S. sales and marketing capabilities and can provide no assurance that we will be successful in establishing a marketing presence and sales force sufficient to commercialize the TULSA-PRO system successfully in the United States.
In addition, by relying on an in-house sales and marketing function, we may have less visibility in the U.S. market (particularly among hospitals) than we would have if we had significant third-party distribution relationships. Any shortcomings in our in-house sales force may have a material adverse effect on our business, results of operations and financial condition.
We currently rely on our collaborative partners, and we may rely on additional collaborative partnerships, to assist in the sales and marketing and/or distribution of our approved products.
We currently rely on our collaborative partnerships for the sales and marketing and/or distribution of our approved products, in particular Philips and Siemens, who promote our systems that are compatible with the MRI scanners produced and sold by them to end users, including hospitals and clinics. In the future, we intend to enter into similar arrangements with other producers of MRI scanners to increase the compatibility of our products and to promote and increase market acceptance among hospitals, clinics and other end-users. However, we can provide no assurance that we will be successful in establishing such additional arrangements, which could negatively impact our commercialization strategy and may have a material adverse effect on our business, results of operations and financial condition. See “—We rely on the compatibility of our products with MRI scanners in the successful commercialization of our products” above.
We may also seek out, evaluate and negotiate other third-party marketing and/or distribution arrangements for our products in the jurisdictions where they are approved, which may involve the commitment of substantial time and effort and may not ultimately result in an arrangement that is favorable to our commercialization goals (e.g. if such third-party marketing or distribution partners are not as successful in promoting our products as anticipated). If any of these third party collaborators are unable or unwilling to promote and/or deliver our products to our customers in an effective manner, then our business, financial condition and operating results could be materially impacted.
Additionally, if any of our relationships with third-party collaborators is terminated, whether by us or the third party for any reason, there can be no assurance that we will be able to obtain alternative sales and marketing and/or distribution channels rapidly or effectively enough to prevent disruptions in sales generated in those markets or otherwise to ensure the success of our products in those markets. Any such termination may have material adverse impact on our business, results of operations and financial condition.
We may experience manufacturing scaling issues in connection with our commercialization strategy, as we have limited experience assembling and testing our approved products, including the TULSA-PRO system, at a significant scale.
As we implement our commercialization strategy, in particular in respect of the TULSA-PRO system in the United States, we may not be able to produce sufficient quantities of systems or maintain consistent quality control in the production of our systems. We have limited experience in assembling and testing our approved products, including our TULSA-PRO system, on a commercial scale. To commercialize our approved products successfully and become profitable, we must be able to assemble and test such in commercial quantities in compliance with applicable regulatory requirements, and at an acceptable cost. Increasing our capacity to assemble and test our products on a commercial scale will require us to improve internal efficiencies, including hiring additional experienced personnel, which may result in significant capital expenditures. We may encounter a number of difficulties in increasing our assembly and testing capacity, including:
| · | managing production yields; |
| · | maintaining quality control and assurance; |
| · | providing component and service availability; |
| · | maintaining adequate control policies and procedures; |
| · | hiring and retaining qualified personnel; and |
| · | complying with U.S. and Canadian regulations (including at the state, provincial and/or federal levels) and applicable foreign regulations. |
In particular, our ability to increase our assembly and testing capacity successfully will greatly depend on our ability to hire, train and retain an adequate number of employees, in particular employees with the appropriate level of knowledge, background and skills to assemble and test our products. We compete with several other medical device companies to hire and retain these skilled employees, and we may be unable to hire and retain such employees in numbers sufficient to increase our in-house capabilities.
We currently intend to partner with one or more additional QSR-compliant and FDA-registered contract manufacturers for our TULSA-PRO systems in the United States. However, we may not be successful in establishing or maintaining such partnerships on acceptable terms or in the timeframe necessary to commercialize our products successfully, or at all.
In addition, we may encounter difficulties in scaling our manufacturing operations, whether in-house or through third-party contract manufacturers, as a result of, among other things, quality control and quality assurance issues and availability of components and raw material supplies. Any such quality control issues may negatively affect production and sales of our products, and may require increased repair or re-engineering costs due to product returns, defects and increased expenses due to switching to alternate suppliers, and reputational damage, any of which could negatively affect our business and reputation.
If we are unable to satisfy commercial demand for our products, in particular our TULSA-PRO system in the United States, due to our inability (or the inability of any of our contract manufacturers) to assemble and test such products in sufficient quantities with consistent quality control, and in compliance with applicable regulatory requirements (and in a cost-efficient manner), our ability to commercialize such products successfully, and market acceptance of our products could be adversely affected as our target customers may instead purchase or use our competitors’ products. This, in turn, could have a material adverse effect on our business, results of operations and financial condition.
We rely on third parties to manufacture and supply components of our systems.
The TULSA-PRO and Sonalleve systems consists of common electronic components, proprietary capital equipment and proprietary disposables. We purchase standard electronic components for our systems from a number of third-party vendors. The capital equipment consists of custom system electronics, a treatment delivery console, fluid circuits and an MRI compatible robotic positioning system. Printed circuit boards and assemblies and custom mechanical parts are outsourced from approved suppliers.
We cannot be certain that manufacturing sources for all components will continue to be available or that we can continue to outsource the manufacturing of our components on reasonable or acceptable terms. If we encounter delays or difficulties with contract manufacturers, delivery of our products could be delayed. In addition, we could be forced to secure new or alternative contract manufacturers or suppliers. Securing a replacement contract manufacturer or supplier could be difficult, and we may not be able to do so in a timely manner or without significant expense. Any loss of a manufacturer or any difficulties that could arise in the manufacturing process could significantly affect our ability to supply sufficient amounts of our products to our customers on a timely basis, which may negatively affect our market share and, correspondingly, could have a material adverse effect on our business, results of operations and financial condition.
In addition, not all of our suppliers provide us with guaranteed minimum production levels, and we rely on single-source suppliers for some of our components. See “—We depend on single-source suppliers for some of the components in our systems” below. Furthermore, we do not currently have long-term supply contracts, and accordingly, our suppliers could terminate their services at any time without penalty within agreed notice periods. As a result, there can be no assurance that we will be able to obtain sufficient quantities of components in the future necessary to commercialize our approved products.
Our reliance on third-party manufacturers and suppliers involves a number of additional risks, including, among other things:
| · | contract manufacturers or suppliers may fail to comply with regulatory requirements or make errors in manufacturing that could negatively affect the efficacy or safety of our products or cause delays in shipments of products; |
| · | we or our contract manufacturers and suppliers may not be able to respond to unanticipated changes in customer orders, and if orders do not match forecasts, our suppliers may have excess or inadequate inventory of materials and components; |
| · | we or our contract manufacturers and suppliers may be subject to price fluctuations of raw materials and key components due to a lack of long-term supply arrangements for key components; |
| · | we or our contract manufacturers and suppliers may lose access to critical services and components, resulting in an interruption in the manufacture, assembly and shipment of our products; |
| · | we may experience delays in delivery by our contract manufacturers and suppliers due to changes in demand from us or our other customers; |
| · | fluctuations in demand for products that our contract manufacturers and suppliers manufacture for others may affect their ability or willingness to deliver components in a timely manner; |
| · | suppliers or contract manufacturers may wish to discontinue supplying components or services for risk management reasons; |
| · | we may not be able to find new or alternative components or reconfigure our system and manufacturing processes in a timely manner if the necessary components become unavailable; and |
| · | contract manufacturers and suppliers may encounter financial hardships unrelated to our demand, which could inhibit their ability to fulfill orders and meet our requirements. |
If any of these risks materialize, it could significantly increase costs and impact our ability to meet demand for our products, in particular in respect of our planned commercialization of TULSA-PRO in the United States. If we are unable to satisfy commercial demand for the TULSA-PRO system or other approved products in a timely manner, our ability to generate revenue could be impaired, market acceptance of our products could be adversely affected, and customers may instead purchase or use competitors’ products. As a result, our business, results of operations and financial condition may be materially adversely affected.
We depend on single-source suppliers for some of the components in our systems.
We currently rely on a single source for the manufacture of some of the components of our TULSA-PRO and Sonalleve systems. Although we intend to procure alternative supply sources for our components as our commercialization efforts increase, we can provide no assurance that we will be successful. Establishing additional or replacement suppliers for these components will take a substantial amount of time and could result in increased costs and impair our ability to produce our products. In addition, our products are highly technical and are required to meet exacting specifications, and any quality control problems that we experience from such alternative supply sources could negatively affect our reputation and market acceptance of our products.
We may also have difficulty obtaining similar components from other suppliers that are acceptable to the FDA or foreign regulatory authorities. The failure of our suppliers to comply with strictly enforced regulatory requirements could expose us to regulatory action, including warning letters, product recalls, termination of distribution, product seizures, or civil penalties. See “—Risks Relating to the Regulation of the Company and Our Products” below for more information.
If we fail to procure alternative supply sources on acceptable terms or at all, our planned commercialization of TULSA-PRO in the United States could be negatively affected, which could have a material adverse effect on our business, operating results and financial condition.
We face significant competition in the markets for our products, and in particular, there are numerous devices and procedures that compete with our TULSA-PRO system.
Our products face significant competition from currently available and future medical devices or surgical methodologies that are used in the same patient populations as our products. See Item 4.B, “Information on the Company—Business Overview—Competition”. Some of these available options are well-established, and our competitors have greater financial resources, development, selling and marketing capabilities than we do. We may face further competition from medical equipment/supply companies that focus their efforts on developing and marketing products that are similar in nature to our products, but that in some instances offer improvements over our products. Our competitors may succeed in developing technologies and products that are more effective or less expensive to use than our products. These developments could render our products uncompetitive, which would have a material adverse effect on our business, financial condition and operating results. In addition, academic institutions, government agencies and other public and private organizations conducting research may seek patent protection with respect to potentially competitive products. They may also establish exclusive collaborative or licensing relationships with our competitors.
Further, our industry is also subject to changing industry standards, market trends and customer preferences and to competitive pressures which can, among other things, necessitate revisions in pricing strategies, price reductions and reduced profit margins. Our success will depend, in part, on our ability to achieve technological superiority in our products and operations and maintain such superiority in the face of new technologies. No assurance can be given that further modification of our product offerings will not be required in order to meet demands or to make changes necessitated by developments made by competitors that might render our products less competitive. Our future success will be influenced by our ability to continue to develop, test and market our products and future product candidates, including increasing and/or maintaining their compatibility with MRI scanners. Although we have committed resources to these efforts, there can be no assurance that we will be successful.
Data from our clinical trials may not support regulatory approvals or clearances and/or reimbursement coverage for our products.
Regulatory clearances and approvals for the commercial sale of any of our product candidates require that we demonstrate through clinical trials that the product candidate is safe and effective for its intended use or, to receive 510(k) clearance in the United States, that the product candidate is substantially equivalent to an existing predicate device for its intended use. While we have obtained 510(k) clearance for TULSA-PRO, additional follow-up data from our TACT Pivotal Clinical Trial may not be consistent with our 12-month data in terms of efficacy and/or side effect profile, which in certain circumstances may result in the FDA taking regulatory actions that are adverse to us. In addition, our TACT Pivotal Clinical Trial involves a relatively small patient population. Because of the small sample size, the results may not be indicative of future results.
We believe that third-party payers, in determining reimbursement coverage for our products, including the TULSA-PRO system, generally would rely upon our clinical trial results, such as TACT, that were obtained in support of our regulatory approvals; however, we may be required to provide additional data from our existing trials and/or conduct additional clinical trials prior to obtaining reimbursement coverage for the TULSA-PRO system and other approved products, which would likely involve significant time and expense, and may have a material adverse effect on our business, results of operations and financial condition.
In the future, we may also seek regulatory approvals, which may include 510(k) clearance, for other product candidates, which likewise could be adversely affected by insufficient clinical trial results. Obtaining product clearance or approval and conducting the requisite clinical trials is a long, expensive and uncertain process and is subject to delays and failures at any stage. There can be no assurance that clinical trials will be completed successfully within any specified period of time, if at all. In addition, a regulatory authority may disagree with our interpretation of the data from our clinical trials, or may find the clinical trial data inadequate to support clearance or approval, and may require us to extend existing clinical trials and/or pursue additional clinical trials, which would increase costs and could further delay regulatory approval or clearance of our products, or cause such regulatory approvals or clearances to be denied altogether.
The data from a clinical trial may be inadequate to support clearance or approval of an application to the regulatory authorities for numerous reasons including, but not limited to:
| · | prevalence and severity of adverse events and other unforeseen safety issues; |
| · | changes in regulatory requirements, policies or guidelines; |
| · | the interim or final results are insufficient (including in respect of the time period for which results were obtained), inconclusive or unfavorable as to the safety or efficacy of the device; |
| · | the FDA or other regulatory authorities concluding that a clinical trial design is inadequate to demonstrate safety and efficacy for a particular use, or to demonstrate substantial equivalence to a predicate device; and |
| · | the FDA or other regulatory authorities concluding that the trial was not conducted in compliance with regulatory requirements or lacked controls necessary to ensure the integrity of the trial data. |
We, the FDA or other regulatory authorities may suspend or terminate clinical trials at any time if it is determined that patients may be or are being exposed to unacceptable health risks, including the risk of death, that our devices are not manufactured under acceptable conditions or with acceptable quality, or that the trial is not being conducted according the protocol and in compliance with Good Clinical Practice and regulatory requirements. Further, success in preclinical studies and early clinical trials does not mean that future clinical trials will be successful because medical devices and/or treatment options in later stage clinical trials may fail to demonstrate sufficient safety and efficacy to the satisfaction of the FDA and other regulatory authorities despite having progressed through initial clinical trials. We cannot be sure that the later trials will replicate the results of prior trials.
Even if our clinical trials are completed as planned, there can be no certainty that trial results will support our product candidate claims or that the FDA or foreign authorities will agree with our conclusions regarding them or agree that they are adequate to support approval or clearance. The clinical trial process may fail to demonstrate that our product candidates are safe and effective for the proposed indicated uses, which could cause us to abandon a product candidate and may delay development of others. Any delay or termination of our clinical trials will delay the filing of our regulatory submissions and, ultimately, negatively affect our ability to commercialize our systems and generate revenues.
If our products do not prove to be, or continue to prove to be, safe and effective, or substantially equivalent to a predicate device, in clinical trials to the satisfaction of the relevant regulatory authorities or third party payers, if the clinical studies do not support our product candidate claims or if they result in the discovery of adverse side effects, then our regulatory approvals and reimbursement coverage (as applicable) may be delayed or denied altogether, and our business, financial condition and results of operation could be materially adversely affected.
We may rely on third parties to perform clinical trial planning and to facilitate obtaining regulatory approvals or clearances for our product candidates.
We may rely on third parties to provide clinical trial planning and regulatory services for our product candidates. We may be unable to find suitable partners, external consultants or service providers to provide such services or such arrangements may not be available on commercially reasonable terms. Further, we may engage third parties that may cease to be able to provide these services or may not provide these services in a timely or professional manner. Accordingly, we may not be able to successfully manage such services, execute clinical trials or obtain regulatory approvals or clearances for our product candidates, which may negatively affect our business. If we fail to establish such arrangements when, and as necessary, we could be required to undertake these activities at our own expense, which would significantly increase capital requirements and may delay the development, approval and future commercialization of our product candidates, which could have a material adverse effect on our business, financial condition and operating results.
We depend on key managerial personnel for our continued success.
We are highly dependent upon our small team of managerial personnel, particularly that of our Chief Executive Officer, Arun Menawat. We do not maintain any “key man” insurance policies on Mr. Menawat or any other members of senior management. Our anticipated growth will require additional expertise and the addition of new qualified personnel. There is intense competition for qualified personnel in the medical device field. Therefore, we may not be able to attract and retain the qualified personnel necessary for the development of our business. We must continue to retain, motivate and recruit executives and other key employees. The failure to motivate, or the loss of the services of, existing personnel, as well as the failure to recruit additional key managerial personnel in a timely manner, would harm our business development programs, and our ability to manage day-to-day operations, attract collaboration partners, attract and retain other employees, generate revenues, and could have a material adverse impact on our business, financial condition and results of operations.
Research and development carries substantial risk and we may not be able to expand our product portfolio.
Future growth may also depend on, among other factors, our ability to successfully develop new product candidates and make product improvements to meet evolving market needs. We may not be able to successfully expand our product portfolio to generate new revenue opportunities in the future. Although we believe we have the scientific and technical resources available to improve our products and develop new products, future products will nevertheless be subject to the risks of failure inherent in the development of products based on innovative technologies. In addition, any such research and development activities may involve significant capital expenditures. There can be no assurance that we will be able to successfully develop future products and tests, which would prevent us from introducing new products in the marketplace and negatively impact our ability to grow revenues and become profitable.
In addition, the identification of new product candidates for development may require that we enter into licensing or other collaborative agreements with others, including medical device and pharmaceutical companies and research institutions. These collaborative agreements may require that we pay license fees, make milestone payments or pay royalties or grant rights, including marketing rights, to one or more parties, and such amounts may be material to our results of operations and financial condition. Moreover, these arrangements may contain covenants restricting our product development or business efforts in the future. Any such arrangements would also increase our reliance on third parties.
We may be subject to product liability claims, which can be expensive, difficult to defend and may result in large judgments or settlements, and/or warranty claims on our products.
The use of medical devices for treatment of humans, whether in clinical trials or after marketing clearance or approval is obtained, can result in product liability claims. Product liability claims can be expensive, difficult to defend and may result in large judgments or settlements against us. In addition, third party collaborators and licensees may not protect us from product liability claims.
We currently maintain product liability insurance in connection with the use of our products in clinical trials and in commercial use; however, we may not have adequate protection against all potential liabilities under these insurance policies. If we are unable to obtain sufficient levels of insurance at acceptable cost or otherwise protect against potential product liability claims, we will be exposed to product liability claims. A successful product liability claim in excess of our insurance coverage could harm our financial condition, results of operations and prevent or interfere with our commercialization efforts and future product development. In addition, any successful claim may prevent us from obtaining adequate product liability insurance in the future on commercially desirable terms. Even if a claim is not successful, defending such a claim may be time-consuming and expensive.
We also bear the risk of warranty claims on our products, generally for one year after sale. We may not be successful in claiming recovery of the relevant components from our suppliers in the event of a successful warranty claim against us by a customer, or that any recovery from such suppliers would be adequate. In addition, warranty claims brought by our customers related to third-party components may arise after the expiration of our corresponding warranty with our third-party suppliers, which would require us to bear the burden of any such warranty claims.
Rising insurance costs could negatively impact our profitability.
The cost of insurance, including director and officer, worker’s compensation, property, product liability and general liability insurance, has risen significantly in recent years and is expected to continue to increase. In particular, our product liability insurance is subject to price increases if we experience product liability claims. In response, we may increase deductibles and/or decrease certain coverages to mitigate these costs. These increases, and our increased risk due to increased deductibles and reduced coverages, could have a negative impact on our business, financial condition and results of operations.
We are increasingly dependent on sophisticated information technology systems to operate our business and if we fail to properly maintain the integrity of our data or we experience a cyber-attack or other breach of these systems, our business could be adversely affected.
We are increasingly dependent on sophisticated information technology for our development activities, products and infrastructure. We rely on information technology systems to process, transmit and store electronic information in our day-to-day operations. The complexity of our information technology systems makes them vulnerable to increasingly sophisticated cyber-attacks, malicious intrusion, breakdown, destruction, loss of data privacy, or other significant disruption. Any such event could be prolonged and/or could go undetected for a significant period of time. Our products and their information systems require an ongoing commitment of resources to maintain, protect, and enhance existing systems and develop new systems to keep pace with continuing changes in information processing technology, evolving systems and regulatory standards, the increasing need to protect patient and customer information, and changing customer patterns.
In addition, third parties may attempt to hack into our products or systems and may obtain data relating to patients, our products or our proprietary information. If we fail to maintain or protect our information systems and data integrity effectively, we could lose existing customers, have difficulty attracting new customers, have problems in determining product cost estimates and establishing appropriate pricing, have difficulty preventing, detecting, and controlling fraud, have disputes with customers, physicians, and other health care professionals, become subject to litigation, have regulatory sanctions or penalties imposed, experience increases in operating expenses, incur expenses or lose revenues as a result of a data privacy breach, or suffer other adverse consequences. Any of the foregoing could have a material adverse effect on our business, financial condition and results of operations.
A portion of our employees are unionized, and our good labor relations may not continue.
As of June 30, 2019, 14 of our employees in Vantaa, Finland are unionized. Currently, labor relations are good; however, the maintenance of a productive and efficient labor environment cannot be assured. If any of our employees at our other manufacturing facilities unionize in the future, or if protracted and extensive work stoppages occur, labor disruptions such as strikes or lockouts could have a material adverse effect on our business, financial condition and results of operations.
If our facilities are damaged or destroyed, we may experience delays that could negatively impact our revenues.
Our facilities may be affected by natural or man-made disasters. If our facilities were affected by a disaster, we would be forced to rely on third party manufacturers or to set up production at another manufacturing facility. In such an event, we might not be able to find a suitable alternate manufacturer or might face significant delays in manufacturing which would prevent us from being able to sell our products. In addition, our insurance may not be sufficient to cover all of the potential losses and may not continue to be available to us on acceptable terms, or at all.
We face risks associated with acquisition of businesses and technologies.
As part of our growth strategy, we intend to evaluate and may pursue additional acquisitions of, or significant investments in, complementary companies or technologies to increase our technological capabilities and expand our product offerings. For example, in July 2017, we acquired from Philips the technologies and asset underlying our Sonalleve system. Acquisitions and the successful integration of new technologies, products, assets or businesses may require significant attention from our management and could result in a diversion of resources from our existing business, which in turn could have an adverse effect on our business operations. Other risks typically encountered with acquisitions include disruption of our ongoing business; difficulties in integration of the acquired operations and personnel; inability of our management to maximize our financial and strategic position by the successful implementation or integration of the acquired technology into our product offerings; being subject to known or unknown contingent liabilities, including taxes, expenses and litigation costs; and inability to realize expected synergies or other anticipated benefits which may, among other things, also lead to goodwill impairments or other write-offs. For example, our ability to achieve the anticipated benefits of the Sonalleve Transaction depends in part on our ability to realize the anticipated growth opportunities and synergies from the acquired assets and technologies, including our further development of the Sonalleve system.
We cannot assure you that we will be successful in overcoming these risks or any other problems we may encounter in connection with the Sonalleve Transaction or potential future acquisitions. Our inability to successfully integrate the operations of an acquired business, including a successful implementation of the technologies and assets we acquire, and realize anticipated benefits associated with an acquisition, could have a material adverse effect on our business, financial condition, results of operations and cash flows. Acquisitions or other strategic transactions may also result in dilution to our existing shareholders if we issue additional equity securities as consideration or partial consideration as well as in the incurrence of indebtedness if we borrow funds to finance such transactions.
Risks Relating to Regulation of the Company and Our Products
Our business is subject to limitations imposed by government regulations.
The preclinical testing and clinical trials of any products developed by us and the manufacturing, labeling, sale, distribution, export or import, marketing, advertising and promotion of any of those products are subject to rigorous regulation by U.S., Canadian, EU and other foreign regulatory authorities at the federal, provincial, state and local governmental levels, as applicable. Our medical devices are principally regulated in the United States by the FDA, in the European Union Notified Bodies (carrying out conformity assessment procedures) and the competent authorities of the EU member states (supervising Notified Bodies and manufacturers of medical devices), in Canada by Health Canada (particularly, the TPD), and by other similar regulatory authorities in other jurisdictions. Government regulation substantially increases the cost and risk of researching, developing, manufacturing and selling products.
We may be unable to obtain, or experience significant delays in obtaining, FDA clearances or other regulatory approvals for our product candidates and/or enhancements to our approved or cleared products.
Our products are subject to rigorous regulation by the FDA and numerous other federal, state and foreign governmental authorities and notified bodies. The process of obtaining FDA clearances or approvals, or equivalent third country approvals to market a medical device can be costly and time consuming, and we may not be able to obtain these clearances or approvals on a timely basis, if at all. We expect to generate a significant portion of our revenues from sales of our marketed systems, in particular our recently FDA-cleared TULSA-PRO system, but may be unable to do so if the systems do not continue to prove to be safe and effective for our intended use in clinical trials to the satisfaction of the relevant regulatory authorities in the United States, the EU, China or other countries. In addition, no assurance can be given that our other product candidates will prove to be safe and effective in clinical trials or that we will receive regulatory approvals in the jurisdictions where we seek to market the systems. For example, we are in discussion with the FDA regarding Sonalleve and have submitted an application requesting designation of a regulatory pathway; however, we can provide no assurance that an acceptable regulatory pathway will be available or that we will ever apply for or obtain FDA approval for Sonalleve in the future. In addition, no assurance can be given that current regulations relating to regulatory approval will not change or become more stringent.
Any delay in, or failure to receive or maintain, regulatory clearance, approval or other products under development would adversely affect our ability to commercialize our approved products, thereby adversely affecting operations and could prevent us from generating revenue from these products or achieving profitability. Any failure to obtain regulatory approval would materially adversely affect our business, financial condition and results of operations.
If clinical trials are conducted in a manner that fails to meet all FDA requirements, the FDA may delay our clearances or approvals, or the deficiencies may be so great that the FDA could refuse to accept all or part of our data or trigger enforcement action.
Clinical trials are generally required to support PMA approval and de novo classification and are sometimes required to support 510(k) clearance. Such trials, if conducted in the United States and involve a significant risk device require an IDE application to be approved in advance by the FDA for a specified number of patients and study sites. Clinical trials involving a non-significant risk device do not require FDA approval of an IDE application and are subject to abbreviated requirements under the IDE regulation. Further, some clinical trials are exempted from the IDE regulation. Although we do not expect to need to obtain an additional IDE application for any further clinical trials involving TULSA-PRO system, we may need to obtain one for any expansion to the label.
In addition, IDE applications may be required in support of clinical trials involving other product candidates. Clinical trials are subject to extensive monitoring, recordkeeping and reporting requirements. Clinical trials must be conducted under the oversight of an IRB for the relevant clinical trial sites and must comply with FDA regulations, including but not limited to those relating to good clinical practices. To conduct a clinical trial, we must also obtain the patients’ informed consent that complies with FDA requirements, state and federal privacy regulations and human subject protection regulations. We, the FDA or the IRB could suspend a clinical trial at any time for various reasons, including a belief that the risks to study subjects outweigh the anticipated benefits. Additionally, we may decide at any time, for business or other reasons, to terminate a clinical trial. Even if a clinical trial is completed, the results of clinical testing may not adequately demonstrate the safety and efficacy of the device for its intended use or may otherwise not be sufficient to obtain FDA clearance or approval to market the product in the United States. Following completion of a clinical trial, we would need to collect, analyze and present the data in an appropriate submission to the FDA. Even if a study is completed and submitted to the FDA, the results of clinical testing may not demonstrate the safety and efficacy of the device for its intended use, or may be equivocal or otherwise not be sufficient to obtain clearance or approval of our product. In addition, the FDA may perform a bioresearch monitoring inspection of a study and if it finds deficiencies, we will need to expend resources to correct those deficiencies, which may delay clearance or approval or the deficiencies may be so great that the FDA could refuse to accept all or part of the data or could trigger enforcement action.
Even if our products are approved by regulatory authorities, if we or our suppliers fail to comply with ongoing FDA or other foreign regulatory authority requirements or if we experience unanticipated problems with our products, we could be subject to restrictions or withdrawal from the market.
Any product for which we obtain regulatory clearance or approval, and the manufacturing processes, reporting requirements, post-approval clinical data and promotional activities for such product, will be subject to continued regulatory review, oversight and periodic inspections by the FDA and other regulatory bodies. In particular, we and our suppliers are required to comply with the QSR and international standards for the manufacture of products and other regulations which cover the methods and documentation of the design, testing, production, control, quality assurance, labeling, packaging, storage and shipping of any product for which we obtain regulatory clearance or approval. Regulatory bodies, such as the FDA, enforce the QSR and other regulations through periodic inspections. We and our contract manufacturers have been, and anticipate in the future being, subject to such inspections.
The failure by us or one of our suppliers to comply with applicable statutes and regulations administered by the FDA and other regulatory bodies, or the failure to timely and adequately respond to any adverse inspectional observations or product safety issues, could result in, among other things, any of the following enforcement actions:
| · | untitled letters, warning letters, fines, injunctions, consent decrees and civil penalties; |
| · | customer notifications for repair, replacement or refunds; |
| · | recall, withdrawal, detention or seizure of our products; |
| · | operating restrictions or partial suspension or total shutdown of production; |
| · | refusing or delaying our requests for 510(k) clearance or premarket approval of new products or modified products; |
| · | withdrawing PMA approvals that have already been granted; |
| · | suspension, variation, or withdrawal of our CE Certificates of Conformity; |
| · | refusals to allow imports and/or to issue documentation necessary to facilitate exports; |
| · | refusal to grant export approval for our products; or |
| · | imposition of civil, administrative or criminal penalties. |
If any of these actions were to occur, we may be required to expend significant time and resources to address or defend such actions, and our reputation may be harmed and our product sales and/or profitability may be negatively affected. Furthermore, key component suppliers may not currently be, or may not continue to be, in compliance with all applicable regulatory requirements, which could result in our failure to produce our products on a timely basis and in the required quantities, if at all.
In addition, we may be required to conduct costly post-market testing and surveillance to monitor the safety or effectiveness of our products, and we must comply with medical device reporting requirements, including the reporting of certain adverse events and malfunctions related to our products. Later discovery of previously unknown problems with our products, including unanticipated adverse events or adverse events of unanticipated severity or frequency, manufacturing problems, or failure to comply with regulatory requirements such as QSR, may result in changes to labeling, restrictions on such products or manufacturing processes, withdrawal of the products from the market, voluntary or mandatory recalls, a requirement to repair, replace or refund the cost of any product we manufacture or distribute, fines, suspension of regulatory approvals, product seizures, injunctions or the imposition of civil or criminal penalties which would have a material adverse effect on our business, financial condition, and results of operations.
Our products that have received regulatory clearance or approval are subject to extensive post-market regulation that could affect sales, marketing and profitability
With respect to the products for which we have obtained regulatory clearance or approval, we are subject to post-marketing regulatory obligations, including requirements by the FDA, EU competent authorities, Health Canada and similar agencies in other jurisdictions to maintain records regarding product safety and to report to regulatory authorities serious or unexpected adverse events. The occurrence of unanticipated serious adverse events or other safety problems could cause the governing agencies to impose significant restrictions on the indicated uses for which the product may be marketed, impose other restrictions on the distribution or sale of the product or require potentially costly post-approval studies. In addition, post-market discovery of previously unknown safety problems or increased severity or significance of a pre-existing safety signal could result in withdrawal of the product from the market and product recalls. Compliance with extensive post-marketing record keeping and reporting requirements requires a significant commitment of time and funds, which may limit our ability to successfully commercialize approved products.
We may be subject to fines, penalties or injunctions if we are determined to be promoting the use of our products for unapproved or “off-label” uses or engaged in false or misleading promotion.
Regulatory clearances and approvals may be subject to limitations on the intended uses for which our products may be marketed and reduce our potential to successfully commercialize our products. While physicians/clinicians, in most jurisdictions, can use our products in ways or circumstances other than those strictly within the scope of the regulatory clearance or approval, we are required, in many jurisdictions, to limit our training and promotion of our products to the cleared or approved intended uses. For example, if the FDA determines that our promotional materials, labeling, training or other marketing constitutes promotion of an uncleared or unapproved, or “off-label” use, it could request that we modify or cease use of those training or promotional materials until we obtain FDA clearance or approval for those uses or subject us to regulatory or enforcement actions, including the issuance of an untitled letter, a warning letter, injunction, seizure, civil fine and/or criminal penalties. Discussions that may be viewed as off-label promotion by FDA include discussions regarding treatment of a specific disease or condition when FDA has cleared or approved a device with a general tool-type indication that does not mention any particular disease or condition. It is also possible that other federal, state or foreign enforcement authorities might take action if they consider our promotional or training materials to constitute promotion of an uncleared or unapproved use, which could result in significant fines or penalties under other statutory authorities, such as laws prohibiting false claims for reimbursement. In that event, our reputation could be damaged and adoption of our products would be impaired.
In addition to promoting our products in a manner consistent with our clearances and approvals, we must have adequate substantiation for the claims we make for our products. If any of our claims are determined to be false, misleading or deceptive, we could be subject to enforcement action. In addition, unsubstantiated claims also present a risk of consumer class action or consumer protection litigation and competitor challenges.
Modifications to our approved products may require new regulatory clearances or approvals or may require us to recall or cease marketing our products until such additional clearances or approvals are obtained.
Certain modifications to our products may require the submission of new 510(k) notifications, PMA supplements, or other regulatory agency approval applications or documents. If a modification is implemented to address a safety concern, we may also need to initiate a recall or cease distribution of the affected device. The FDA can review a manufacturer’s decision not to submit a new 510(k) notification or PMA for a modification and may disagree. The FDA may also on its own initiative determine that clearance of a new 510(k) or approval of a new PMA submission is required. We may make additional modifications to our products in the future that we believe do not or will not require clearance of a new 510(k) or approval of a new PMA. If we begin manufacture and distribution of the modified devices and the FDA later disagrees with our determination and requires the submission of a new 510(k) or PMA for the modifications, we may also be required to recall the distributed modified devices and to stop distribution of the modified devices until we have received approval or clearance for the modified device, which could have an adverse effect on our business. If the FDA does not clear or approve the modified devices, we may need to redesign the devices, which could also harm our business. When a device is marketed without a required clearance or approval, the FDA has the authority to bring an enforcement action, including injunction, seizure and criminal prosecution. The FDA considers such additional actions generally when there is a serious risk to public health or safety and the company’s corrective and preventive actions are inadequate to address the FDA’s concerns
Where we determine that modifications to our products require clearance of a new 510(k) or approval of a new PMA or PMA supplement, we may not be able to obtain those additional clearances or approvals for the modifications or additional indications in a timely manner, or at all. For those products sold in the European Economic Area, we must notify an EU Notified Body, if significant changes are made to the products or if there are substantial changes to our quality assurance systems affecting those products. Delays in obtaining required future clearances or approvals would adversely affect our ability to introduce new or enhanced products in a timely manner, which in turn would harm its future growth.
Our contract manufacturers are subject to regulatory compliance by the FDA, Health Canada and regulatory authorities in the EU and other jurisdictions.
Our contract manufacturers must comply with applicable FDA, EU, Health Canada and other applicable foreign regulations, which include quality control and quality assurance requirements, as well as the corresponding maintenance of records and documentation and manufacture of devices according to the specifications contained in the applicable regulatory file. If our contract manufacturers do not or cannot comply with these requirements, our ability to commercialize our approved products may be adversely affected.
The introduction of new or alternative manufacturers or suppliers also may require manufacturing or design changes to our products that are subject to FDA and other regulatory clearances or approvals. Similarly, in the European Union, the introduction of new or alternative manufacturers or suppliers could be considered to constitute a substantial change to our quality system or result in design changes to our products which could affect compliance with the Essential Requirements. These changes must be disclosed to our notified body in the EU before implementation. The Notified Body will then assess the changes and verify whether they affect the products’ conformity with the Essential Requirements. If the assessment is favorable the Notified Body will issue a new CE Certificate of Conformity or an addendum to the existing certificates attesting compliance with the Essential Requirements. We may also be required to assess the new manufacturer’s compliance with all applicable regulations and guidelines, which could further impede our ability to manufacture our products in a timely manner. As a result, we could incur increased production costs, experience delays in deliveries of our products, suffer damage to our reputation, and experience a material adverse effect on our business, financial condition, and results of operations.
Our products may in the future be subject to product recalls that could harm our reputation, business and financial results.
The FDA and similar foreign governmental authorities have the authority to require the recall of commercialized products in the event of material deficiencies or defects in design or manufacture. In the case of the FDA, the authority to require a recall must be based on an FDA finding that there is a reasonable probability that the device would cause serious adverse health consequences or death. In addition, we may initiate voluntary recalls of our products in the future to the extent we experience safety or other concerns with such products. For voluntary corrections or removals, the FDA requires that manufacturers report to the FDA within 10 working days after the correction or removal is initiated if the action was initiated to reduce a risk to health posed by the device or to remedy a violation of the FFDCA caused by the device which may present a risk to health. Companies are required to maintain certain records of corrections and removals, even if they are not reportable to the FDA. We may determine that any particular voluntary recall that we initiate does not require notification of the FDA. If the FDA disagrees with our determinations, they could require us to report those actions. A future recall announcement could harm our reputation with customers and negatively affect our sales. In addition, the FDA could take enforcement action for failing to report the recalls when they were conducted.
In the European Union, incidents must be reported to the relevant authorities of the European Union Member States, and manufacturers are required to take FSCAs, to reduce a risk of death or serious deterioration in the state of health associated with the use of a medical device that is already placed on the market. For purposes of these regulations, an “incident” is defined as any malfunction or deterioration in the characteristics and/or performance of a device, as well as any inadequacy in the labeling or the instructions for use which, directly or indirectly, might lead to or might have led to the death of a patient or user or of other persons or to a serious deterioration in their state of health. An FSCA may include the recall, modification, exchange, destruction or retrofitting of the device. In addition, governmental or other competent bodies or authorities have the authority to require the recall of products in the event of material deficiencies or defects in design or manufacture. Manufacturers may, under their own initiative, recall a product if any material deficiency in a device is found. A government-mandated or voluntary recall by us or one of our distributors could occur as a result of component failures, manufacturing errors, design or labeling defects or other deficiencies and issues. Recalls of the TULSA-PRO system, Sonalleve system or any future products would divert managerial and financial resources and could have an adverse effect on our financial condition and results of operations.
If our products cause or contribute to a death or a serious injury, or malfunction in certain ways, we will be subject to medical device reporting regulations, and such events can result in voluntary corrective actions or agency enforcement actions.
Under FDA medical device reporting regulations, manufacturers are required to report to the FDA information that reasonably suggests that one of their marketed devices may have caused or contributed to a death or serious injury or has malfunctioned and that the device or a similar device marketed by the manufacturer would likely cause or contribute to death or serious injury if the malfunction were to recur. If we fail to report these events to the FDA within the required timeframes, or at all, the FDA could take enforcement action against us. Similar enforcement action could be taken by the competent authorities in the European Union if we do not comply with our medical devices vigilance obligations. In addition, our EU notified body could decide to suspend or withdraw our CE Certificates of Conformity. Any such adverse event involving the TULSA-PRO or Sonalleve systems also could result in future voluntary corrective actions, such as recalls or customer notifications, or agency action, such as inspection, audit or enforcement action. Any corrective action, whether voluntary or involuntary, as well as defending ourselves in a lawsuit, will require the dedication of personnel time and capital, distract management from operating the business and may harm our reputation and could have a material adverse effect on our business, financial condition and operating results.
Legislative or regulatory reform of the healthcare systems in which we intend to operate may affect our ability to sell our products profitably and could adversely affect our business.
The government and regulatory authorities in the United States, the European Union, Canada and other markets in which we expect to sell our devices may propose and adopt new legislation and regulatory requirements relating to medical product approval criteria, manufacturing and marketing requirements. In addition, regulations and guidance promulgated by the FDA, the EU and other regulatory bodies are often revised or reinterpreted by the agency in ways that may significantly affect our business and products. It is impossible to predict whether legislative changes will be enacted or regulations, guidance or interpretations changed and what the impact of such changes, if any, may be. Such legislation or changes in regulatory requirements, or the failure to comply with such, could adversely impact our operations and could have a material adverse effect on our business, financial condition and results of operations.
For example, in the United States, as part of the Food and Drug Administration Safety and Innovation Act of 2012, Congress enacted several reforms entitled the Medical Device Regulatory Improvements and additional miscellaneous provisions which impacted FDA medical device regulation both pre- and post-approval. In 2016, Congress enacted the 21st Century Cures Act, which included a number of modifications to the medical device provisions of the FFDCA, including a new priority review program for “breakthrough devices”. Further, the FDA Reauthorization Act of 2017, amended certain pre- and post-market requirements for medical devices. For example, the legislation imposed a new user fee for de novo classification requests. The FDA has implemented, and continues to implement, these reforms, which could impose additional regulatory requirements upon us and delay our ability to obtain new 510(k) clearances or PMA approvals or increase the costs of compliance. Any change in the laws or regulations that govern the clearance and approval processes relating to our products could make it more difficult and costly to obtain clearance or approval for new products, or to produce, market and distribute products. Significant delays in receiving clearance or approval, or the failure to receive clearance or approval for our products would have a material adverse effect on our business, financial condition and operating results.
On April 5, 2017, the EU adopted a new Regulation on medical devices (Regulation (EU) 2017/745 of the European Parliament and of the Council on Medical Devices (“MDR”)) and a new Regulation on in vitro diagnostic medical devices (Regulation (EU) 2017/746 of the European Parliament and of the Council on in vitro diagnostic medical devices (“IVDR”)), which will become fully applicable on May 26, 2020 and May 26, 2022, respectively. The Regulations do not set out a substantially different regulatory system, but contemplate, among other things, stricter controls of medical devices, including strengthening of the conformity assessment procedures, increased expectations as regards clinical data for devices and pre-market regulatory review of high-risk devices and an extension of transparency requirements through the establishment of a comprehensive EU database on medical devices and of a device traceability system allowing to trace the device from its manufacturer through the supply chain to the final user. The MDR and the IVDR also introduce new classification rules according to which manufacturers must test their products and adapt their documentation. For example, stricter clinical requirements now apply to Class III medical devices and implants. After the expiry of the transitional periods as provided by the MDR and the IVDR, respectively, only devices that have been CE marked under the MDR/IVDR may be placed on the market in the EU. Any notification of Notified Bodies which are responsible for conformity assessments regarding medical devices (except for low risk medical devices classified as Class I with no measuring function and which are not sterile) will cease to be valid from May 26, 2020. Only a few Notified Bodies currently have a notification under the MDR. The new legislation may therefore delay the CE marking of our product candidates under development or impact our ability to renew the CE marking our currently CE marked products on a timely basis.
The growth of overall healthcare costs as a percentage of gross domestic product in many countries means that governments and payers are under intense pressure to control healthcare spending even more tightly. As a result, our businesses and the healthcare industry in general are operating in an ever more challenging environment with very significant pricing pressures. In recent years, national, federal, provincial, state and local officials and legislators have proposed, or are reportedly considering proposing, a variety of price-based reforms to the healthcare systems in the United States, the European Union and other countries. Some proposals include measures that would limit or eliminate payments for certain medical procedures and treatments or subject pricing to government control. Furthermore, in certain foreign markets, the pricing or profitability of healthcare products is subject to government controls and other measures that have been prepared by legislators and government officials. While we cannot predict whether any such legislative or regulatory proposals or reforms will be adopted, the adoption of any such proposals or reforms could adversely affect the commercial viability of our existing and potential products.
The ACA was intended to expand healthcare coverage within the United States, primarily through the imposition of health insurance mandates on employers and individuals and expansion of the Medicaid program. The legislation imposes a number of changes to the U.S. healthcare market that are designed to reduce the number of uninsured individuals through, among other things, expansion of certain federal and state healthcare programs such as Medicaid, and establishment of health insurance exchanges. In addition, the legislation imposes changes directly affecting the device industry, specifically taxes on medical device makers in the form of a 2.3% excise tax on all medical device sales in the United States. The tax has been delayed multiple times, most recently on January 22, 2018, when President Trump signed legislation delaying implementation through the end of 2019. The tax will go into effect on January 1, 2020, if the delay is not further extended or the medical tax is not permanently repealed. It is uncertain whether future legislation will suspend, modify or repeal this tax. The tax could materially and adversely affect our business, cash flows and results of operations.
The ACA also focuses on a number of Medicare provisions aimed at improving quality and decreasing costs. The Medicare provisions include value-based payment programs, increased funding of comparative effectiveness research, reduced hospital payments for avoidable readmissions and hospital acquired conditions, and pilot programs to evaluate alternative payment methodologies that promote care coordination (such as bundled physician and hospital payments). Additionally, the law includes a productivity adjustment, or reduction in the annual rate of inflation for Medicare payments to a number of providers, including hospitals, that began in 2011. The United States President and certain members of the U.S. Congress have indicated their desire to repeal and replace all or portions of the ACA and to decrease fiscal burdens. Recently enacted legislation addresses certain ACA measures and effectively repeals the individual mandate insurance requirement. In addition, in December 2018, a federal district court judge in Texas found the ACA to be unconstitutional, although the ruling was stayed while the case is appealed. It is unclear whether, when and how a repeal of, or a court order enjoining, the ACA would be effectuated and what the effect on the healthcare sector would be.
Other measures by the current administration that address ACA provisions include regulatory changes to healthcare insurance exchange parameters. According to the Trump administration’s statements describing the changes, they are intended to increase flexibility, improve affordability, promote stability, and reduce unnecessary burdens. We cannot predict the full effect of these new measures, what other health care laws, and regulations and programs will be ultimately implemented at the federal or state level, or the effect of any future legislation, regulation or court order. However, any changes that deny or restrict coverage or lower reimbursement for our products or reduce medical procedure volumes could adversely affect our business and results of operations. Changes in the law or regulatory framework that reduce our revenues or increase our costs would have a material adverse effect on our business, financial condition and results of operations and cash flows.
Other legislation or regulatory proposals may adversely affect our revenues and profitability.
Existing and proposed changes in the laws and regulations affecting public companies may cause us to incur increased costs as we evaluate the implications of new rules and responds to new requirements. Failure to comply with the new rules and regulations could result in enforcement actions or the assessment of other penalties. The new laws and regulations could make it more difficult to obtain certain types of insurance, including directors’ and officers’ liability insurance, and we may be forced to accept reduced policy limits and coverage or incur substantially higher costs to obtain the same or similar coverage. The impact of these events could also make it more difficult for us to attract and retain qualified persons to serve on our board of directors, or as executive officers. We may be required to hire additional personnel and utilize additional outside legal, accounting and advisory services, all of which could cause our general and administrative costs to increase beyond what we currently have planned. Although we intend to evaluate and monitor developments with respect to these rules, we cannot predict or estimate the amount of the additional costs we may incur or the timing of such costs.
We are subject to “fraud and abuse” laws, anti-bribery laws, environmental laws and privacy and security regulations. Any violation by our employees or other agents could expose us to severe penalties and other consequences that may have a material adverse effect on our business, financial condition and results of operations.
Our business is subject to the FCPA in the United States, which generally prohibits companies and company employees from engaging in bribery or other prohibited payments to foreign officials for the purpose of obtaining or retaining business. The FCPA also requires companies to maintain accurate books and records and internal controls. In addition, we are subject to other anti-bribery laws of the nations in which we conduct business that apply similar prohibitions as the FCPA (e.g., The Bribery Act 2010 in the United Kingdom, Articles 299a and 299b of the German Criminal Code specifically addressing bribery in the healthcare sector, the Corruption of Foreign Public Officials Act in Canada and the Convention on Combating Bribery of Foreign Public Officials in International Business Transactions of the Organisation for Economic Co-operation and Development). Our employees or other agents may, without our knowledge and despite our efforts, engage in prohibited conduct under our policies and procedures and the FCPA or other anti-bribery laws to which we may be subject. If our employees or other agents are found to have engaged in such practices, we could suffer severe penalties and other consequences that may have a material adverse effect on our business, financial condition and results of operations.
Our operations may be directly or indirectly affected by various broad United States or foreign healthcare fraud and abuse laws. In particular, the United States federal healthcare program Anti-Kickback Statute prohibits any person from knowingly and willfully offering, paying, soliciting or receiving remuneration, directly or indirectly, in return for or to induce the referring, ordering, leasing, purchasing or arranging for or recommending the ordering, purchasing or leasing of an item or service, for which payment may be made under United States federal healthcare programs, such as the Medicare and Medicaid programs. This statute has been interpreted to apply to arrangements between device manufacturers on one hand and prescribers and purchasers on the other. For example, the United States government has sought to apply the Anti-Kickback Statute to device manufacturers’ financial relationships with physician consultants. Among other theories, the United States government has alleged that such relationships are payments to induce the consultants to arrange for or recommend the ordering, purchasing or leasing of the manufacturers’ products by the hospitals, medical institutions and other entities with whom they are affiliated. Although there are a number of statutory exemptions and regulatory safe harbors protecting certain common activities from prosecution or other regulatory sanctions, the exemptions and safe harbors are drawn narrowly, and arrangements that involve remuneration that could induce prescribing, purchases, or recommendations may be subject to government scrutiny if they do not qualify for an exemption or a safe harbor.
Also, the False Claims Act prohibits persons from knowingly submitting, or causing to be submitted, a false claim to, or the knowing use of false statements to obtain payment from the federal government. Suits filed under the False Claims Act can be brought by the United States government or they can be brought by an individual on behalf of the United States government, as “qui tam” actions, and such individuals, commonly known as “whistleblowers,” may share in any damages paid by the entity to the United States government in fines or settlement. When an entity is determined to have violated the False Claims Act, it may be required to pay up to three times the actual damages sustained by the United States government, plus civil penalties of up to $22,363 for each separate false claim. Various states have also enacted laws modeled after the False Claims Act.
Profound is also subject to various privacy and security regulations, including but not limited to HIPAA in the United States. HIPAA mandates, among other things, the adoption of uniform standards for the electronic exchange of information in common health care transactions (e.g., health care claims information and plan eligibility, referral certification and authorization, claims status, plan enrolment, coordination of benefits and related information), as well as standards relating to the privacy and security of individually identifiable health information, which govern the use and disclosure of such information and require the adoption of administrative, physical and technical safeguards to protect such information. In addition, many U.S. states, Canadian provinces and other countries have enacted comparable laws addressing the privacy and security of health information, some of which are more stringent than HIPAA. Failure to comply with these laws could result in the imposition of significant civil and criminal penalties. The costs of compliance with these laws and the potential liability associated with the failure to comply with these laws could have a material adverse effect on our business, financial condition and operating results.
Compliance with environmental laws and regulations could be expensive, and failure to comply with these laws and regulations could subject us to significant liability.
We may use hazardous materials in our research and development and manufacturing processes. We are subject to various regulations governing use, storage, handling and disposal of these materials and associated waste products. We will need one or more licenses to handle such materials, but there can be no assurance that it will be able to retain these licenses in the future or obtain licenses under new regulations if and when they are required by governing authorities. We cannot completely eliminate the risk of contamination or injury resulting from hazardous materials, and we may incur liability as a result of any such contamination or injury. In the event of an accident, we could be held liable for damages or penalized with fines, and the liability could exceed our resources and any applicable insurance. We would also likely incur expenses related to any such incidents. Such future expenses or liability could have a significant negative impact on its business, financial condition and results of operations. Further, we cannot assure that the cost of compliance with these laws and regulations will not materially increase in the future. We may also be subject to liability in respect of the operations of prior owners or operators of any properties we may own, at manufacturing sites where operations have previously resulted in spills, discharges or other releases of hazardous substances into the environment. We could be held strictly liable under environmental laws for contamination of property that we occupy without regard to fault or whether our actions were in compliance with law at the time. Our liability could also increase if other responsible parties, including prior owners or operators of our facilities, fail to complete their clean-up obligations or satisfy indemnification obligations to us. Similarly, if we fail to ensure compliance with applicable environmental laws in foreign jurisdictions in which we operate, we may not be able to offer our products and may be subject to civil or criminal liabilities.
Risk Factors Relating to Intellectual Property
If we breach any of the agreements under which we license rights to our technology from third parties, we could lose license rights that are important to our business. Certain of our license agreements may not provide an adequate remedy for their breach by the licensor.
We license certain development and commercialization rights for certain technologies used in our systems, and expect to enter into similar licenses in the future. For instance, we license exclusive intellectual property rights from Sunnybrook that enable us to use, manufacture, distribute and sell the TULSA-PRO system. Under this royalty-free license, we are subject to various obligations, including the milestone payment of C$250,000 we paid upon obtaining FDA clearance of our TULSA-PRO system, and legal costs associated with patent application preparation, filing and maintenance. If we breach or otherwise terminate any of the agreements under which we license rights to our technology from third parties, we could lose intellectual property rights that are important to our business, and incur other liabilities. Certain of our license agreements may not provide an adequate remedy for their breach by the licensor. The loss or breach of any of these license agreements could have a material adverse effect on our business, results of operations and financial condition.
Our proprietary rights may not adequately protect our technologies.
Our commercial success will depend on our ability to obtain patents (or exclusive rights thereto) and to maintain adequate protection for our technologies in the United States, Europe, Canada and other countries. We own or have exclusive rights to multiple issued United States patents and several pending United States patent applications in respect of our products. For the TULSA-PRO system, our patent rights include rights licensed to us from Sunnybrook and other intellectual property that we have developed. We acquired the patent rights for the Sonalleve system from Philips. We or our licensors will be able to protect such proprietary rights from unauthorized use by third parties only to the extent that our proprietary technologies and future products are covered by valid and enforceable patents or are effectively maintained as trade secrets.
We apply for patents covering our technologies as we deem appropriate. However, we may fail to apply for patents on important technologies in a timely fashion, or at all. Our existing patent applications and any future patents we may obtain may not be sufficiently broad to prevent others from utilizing our technologies or from developing competing products and technologies. In addition, we cannot guarantee that:
| · | we or our licensors were the first to make the inventions covered by each of our licensed or issued patents and pending patent applications; |
| · | we or our licensors were the first to file patent applications for these inventions; |
| · | others will not independently develop similar or alternative technologies or duplicate any of our or our licensors’ technologies; |
| · | any of our or our licensors’ pending patent applications will result in issued patents; |
| · | any of our or our licensors’ patents will be valid or enforceable; |
| · | any patents issued to us or our licensors and collaboration partners will provide us with any competitive advantages, or will not be challenged by third parties; |
| · | we will develop or in-license additional proprietary technologies that are patentable; or |
| · | the patents of others will not have an adverse effect on our business. |
The actual protection afforded by a patent varies on an offering-by-offering basis, from country to country and depends upon many factors, including the type of patent, the scope of our or our licensors’ coverage, the availability of regulatory related extensions, the availability of legal remedies in a particular country and the validity and enforceability of the patents. Our or our licensors’ ability to maintain and solidify our or our licensors’ proprietary position for our products will depend on our or our licensors’ success in obtaining effective patent claims and enforcing those claims once granted. Our or our licensors’ issued patents and those that may be issued in the future may be challenged, invalidated or circumvented, and the rights granted under any such issued patents may not provide us with proprietary protection or competitive advantages against competitors with similar products or offerings. Due to the extensive amount of time required for the development, testing and regulatory review of a medical device, it is possible that, before our devices can be commercialized, any relevant patent may expire or remain in force for only a short period following commercialization, thereby reducing any advantage of the patent.
Protection afforded by patents may be adversely affected by recent or future changes to patent related statutes and administrative procedures, for example, such as in the laws of the United States or to USPTO rules. Patent reform legislation could increase the uncertainties and costs surrounding the prosecution of our patent applications and the enforcement or defense of our issued patents. For example, on September 16, 2011, the Leahy-Smith Act was signed into law in the United States. The Leahy-Smith Act includes a number of significant changes to United States patent law. These include provisions that affect the way patent applications are prosecuted and may also affect patent litigation. However, it is not fully clear what, if any, impact the Leahy-Smith Act will have on the operation of our business. As such, the Leahy-Smith Act and its implementation, as well as any future changes to patent law in the United States or elsewhere, could increase the uncertainties and costs surrounding the prosecution of our or our licensors’ patent applications and the enforcement or defense of our or our licensors’ issued patents, all of which could have a material adverse effect on our business, financial condition and operating results.
Moreover, we or our licensors may be subject to a third party preissuance submission of prior art to the USPTO and other patent offices, or become involved in opposition, derivation, re-examination, inter partes review or interference proceedings, or other preissuance or post-grant proceedings in the United States or other jurisdictions, challenging our or our licensors’ patent rights or the patent rights of others. An adverse determination in any such submission, proceeding or litigation could reduce the scope of, or invalidate, our or our licensors’ patent rights, allow third parties to commercialize our technology or product and compete directly with us, without payment to us, or result in our inability to manufacture or commercialize products without infringing third party patent rights. In addition, if the breadth or strength of protection provided by our or our licensors’ patents and patent applications is threatened, it could dissuade companies from collaborating with us to license, develop or commercialize current or future products. Changes to the current patent statutes may adversely affect the protection afforded by our patents and/or open our patents up to third party attack in non-litigation settings. The costs of patent enforcement or invalidity proceedings could be substantial, result in adverse determinations, and divert management attention from our business.
We also rely on trade secrets to protect some of our technology, especially where we do not believe patent protection is appropriate or obtainable. However, trade secrets are difficult to maintain. While we use reasonable efforts to protect our trade secrets, our or our collaboration partners’ employees, consultants, contractors or scientific and other advisors may unintentionally or wilfully disclose our proprietary information to competitors. Enforcement of claims that a third party has illegally obtained and is using trade secrets is expensive, time consuming and uncertain, and may divert our efforts and attention from other aspects of our business. In addition, non-U.S. courts are sometimes less willing than courts in the United States to protect trade secrets. If our competitors independently develop equivalent knowledge, methods and know-how, we would not be able to assert our trade secrets against them and our business could be harmed.
We may not be able to protect our intellectual property rights throughout the world.
Filing, prosecuting and defending patents on all of our product candidates, and products and services, when and if we have any, in every jurisdiction would be prohibitively expensive. Competitors may use our technologies in jurisdictions where we or our licensors have not obtained patent protection to develop competing products. These products may compete with our products, when and if we have any, and may not be covered by any of our or our licensors’ patent claims or other intellectual property rights.
The laws of some countries do not protect intellectual property rights to the same extent as the laws of the United States and many companies have encountered significant problems in protecting and defending such rights in foreign jurisdictions. The legal systems of certain countries, particularly certain developing countries, may not favor the enforcement of patents and other intellectual property protection, particularly those relating to biotechnology and/or pharmaceuticals, which could make it difficult for us to stop the infringement of our patents. Proceedings to enforce our or our licensors’ patent rights in foreign jurisdictions could result in substantial cost and divert our efforts and attention from other aspects of our business.
The patent protection for our technologies may expire before we are able to maximize our commercial value which may subject us to increased competition and reduce or eliminate our opportunity to generate product revenue.
The patents for our technologies have varying expiration dates; although the patents for the technologies we used are not expected to expire in the near term, when these patents expire, we may be subject to increased competition and may not be able to recover our development costs or license fees. In some of the larger economic territories, such as the United States and the European Union, patent term extension/restoration may be available to compensate for time taken during aspects of a product candidate’s regulatory review. However, we cannot be certain that any extension will be granted or, if granted, what the applicable time period or the scope of patent protection afforded during any extended period will be. If we or our licensors are unable to obtain patent term extension/restoration or some other exclusivity, we could be subject to increased competition and our opportunity to establish or maintain product revenue could be substantially reduced or eliminated. Furthermore, we may not have sufficient time to recover our development costs prior to the expiration of our or our licensors’ patents in the United States or elsewhere.
We may incur substantial costs as a result of litigation or other proceedings relating to enforcement of our or our licensors’ patent and other intellectual property rights and we may be unable to protect our rights to, or use of, our technology.
If we choose to go to court to try to stop or prevent a third party from using the inventions claimed in our or our licensors’ patents, that third party has the right to ask the court to rule that these patents are invalid and/or should not be enforced against that third party. Even if we were successful in stopping the infringement of these patents, these lawsuits are expensive and would consume time and other resources, and divert attention from other aspects of our business. In addition, there is a risk that the court will decide that these patents are invalid or unenforceable and that we do not have the right to prevent the other party from using the inventions. There is also the risk that, even if the validity of these patents is upheld, the court will refuse to prevent the other party’s activities on the ground that such other party’s activities do not infringe our rights.
We may be subject to lawsuits from, liable for damages to, or be required to enter into license agreements with, a third party that claims we infringed its patents or otherwise misused its proprietary information.
If we wish to use the technology in issued and unexpired patents owned by others, we will need to obtain a license from the owner, enter into litigation to challenge the validity or enforceability of these patents or incur the risk of litigation in the event that the owner asserts that we infringed these patents. The failure to obtain a license for technology or the failure to challenge an issued patent owned by others that we may require to develop or commercialize our product candidates may have a material adverse impact on us.
In addition, if a third party asserts that we infringed its patents or other proprietary rights, we could face a number of risks that could seriously harm our results of operations, financial condition and competitive position, including:
| · | patent infringement and other intellectual property claims, which would be costly and time consuming to defend, whether or not the claims have merit, and which could delay the regulatory approval process and divert management’s attention from our business; |
| · | substantial damages for past infringement, including possible treble damages in some jurisdictions, which we may have to pay if a court determines that our product candidates, offerings or technologies infringe a competitor’s patent or other proprietary rights; |
| · | a court prohibiting us from selling or licensing our technologies unless the third party licenses patents or other proprietary rights to us on commercially reasonable terms, which it is not required to do; and |
| · | if a license is available from a third party, we may have to pay substantial royalties or lump sum payments or grant cross licenses to our patents or other proprietary rights to obtain that license. |
The coverage of patents is subject to interpretation by the courts and the interpretation is not always uniform. If we are sued for patent infringement, we would need to demonstrate that our products or methods of use either do not infringe the patent claims of the relevant patent and/or that the patent claims are invalid, and we may not be able to do this. Proving invalidity, in particular, is difficult since it requires a showing of clear and convincing evidence to overcome the presumption of validity enjoyed by issued patents.
Patent laws in the United States as well as the laws of certain other jurisdictions provide for provisional rights in published patent applications beginning on the date of publication, including the right to obtain reasonable royalties, if a patent is subsequently issued and certain other conditions are met. While we believe that there may be multiple grounds on which to challenge the validity of United States patents and the counterparts filed in other jurisdictions possibly relevant to our business, we cannot predict the outcome of any invalidity challenge. Alternatively, it is possible that we may determine it is prudent to seek a license from a patent holder to avoid potential litigation and other potential disputes. We cannot be sure that a license would be available to us on acceptable terms, or at all.
Because some patent applications in certain jurisdictions may be maintained in secrecy until the patents are issued, because patent applications in the United States and many other jurisdictions are typically not published until 18 months after filing and because publications in the scientific literature often lag behind actual discoveries, we cannot be certain that others have not filed patent applications for technology covered by our or our licensors’ issued patents or our pending applications or our licensors’ pending applications, or that we or our licensors were the first to invent the technology.
Patent applications filed by third parties that cover technology similar to ours may have priority over our or our licensors’ patent applications and could further require us to obtain rights to issued patents covering such technologies. If another party files a United States patent application on an invention similar to ours, we may elect to participate in or be drawn into an interference or other proceeding declared by the USPTO to determine priority of invention in the United States. The costs of these proceedings could be substantial and it is possible that such efforts would be unsuccessful, resulting in a loss of our United States patent position with respect to such inventions.
We may also be subject to damages resulting from claims that we or our employees or consultants have wrongfully used or disclosed alleged trade secrets of third parties. Many of our employees were previously employed, and certain of our consultants are currently employed, at universities or medical device companies, including our competitors or potential competitors. Although we have not received any claim to date, we may be subject to claims that we, or these employees or consultants, have inadvertently or otherwise used or disclosed trade secrets or other proprietary information of these current or former employers. Litigation may be necessary to defend against these claims. If we fail in defending such claims, in addition to paying monetary damages, we may lose valuable intellectual property rights or personnel. We may be subject to claims that employees of our partners or licensors of technology licensed by us have inadvertently or otherwise used or disclosed trade secrets or other proprietary information of their former employers. We may become involved in litigation to defend against these claims. If we fail in defending such claims, in addition to paying monetary damages, we may lose valuable intellectual property rights or personnel; and even if we are successful in defending such claims, they can be expensive and would consume time and other resources, and divert attention from other aspects of our business.
Some of our competitors may be able to sustain the costs of complex patent and other intellectual property litigation more effectively than we can because they have substantially greater resources. In addition, any uncertainties resulting from the initiation and continuation of any litigation could have a material adverse effect on our ability to raise the funds necessary to continue our operations. We cannot predict whether third parties will assert these claims against us or against our licensors, or whether those claims will harm our business. If we or our licensors are forced to defend against these claims, whether they are with or without any merit, whether they are resolved in favor of or against us or our licensors, we may face costly litigation and diversion of management’s attention and resources. As a result of these disputes, we may have to develop costly non-infringing technology, or enter into licensing agreements. These agreements, if necessary, may be unavailable on terms acceptable to us, if at all, which could have a material adverse effect on our business, financial conditions and results of operations.
Risk Factors Relating to Our Common Shares
Future sales or the issuances of our securities may cause the market price of our Common Shares to decline.
The market price of our Common Shares could decline as a result of issuances of securities (including our Common Shares) by us, exercises of outstanding options or warrants for additional Common Shares or sales by our existing shareholders of Common Shares in the market, or the perception that these issuances or sales could occur. Sales of Common Shares by shareholders may make it more difficult for us to sell equity securities at a time and price that we deem appropriate. As at August 26, 2019, there were a total of 10,373,929 outstanding share options issued under our Share Option Plan and 22,571,714 outstanding warrants issued pursuant to the Bought Deals and the CIBC Loan Agreement. In addition, as at August 26, 2019, 3,675,553 options remain available for future grant under the Share Option Plan. Sales or issuances of substantial numbers of Common Shares, or the perception that such sales or issuances could occur, may adversely affect prevailing market prices of the Common Shares. With any such sale or issuance of Common Shares, investors may suffer dilution and we may experience dilution in our earnings per share.
We expect that the price of our Common Shares may fluctuate significantly.
The market price of securities of many companies, particularly development and early commercial stage medical device companies, experience wide fluctuations in price that are not necessarily related to the operating performance, underlying asset values or prospects of such companies.
The market price of our Common Shares could be subject to wide fluctuations in response to many risk factors listed in this section, and others beyond our control, including:
| · | delays in respect of our commercialization of the TULSA-PRO system in the United States; |
| · | adverse results or delays in our future planned data collection for the TACT Pivotal Clinical Trial and any future clinical trials that we may conduct; |
| · | regulatory actions with respect to our products and/or product candidates; |
| · | changes in laws or regulations applicable to our products or any future product candidates, including but not limited to clinical trial requirements for approvals; |
| · | actual or anticipated fluctuations in our financial condition and operating results; |
| · | actual or anticipated changes in our growth rate relative to our competitors; |
| · | competition from existing products or new products that may emerge; |
| · | announcements by us, our collaborators or our competitors of significant acquisitions, strategic partnerships, joint ventures, collaborations or capital commitments; |
| · | failure to meet or exceed financial estimates and projections of the investment community or that we provide to the public; |
| · | issuance of new or updated research or reports by securities analysts; |
| · | fluctuations in the valuation of companies perceived by investors to be comparable to us; |
| · | share price and volume fluctuations attributable to inconsistent trading volume levels of our shares; |
| · | additions or departures of key management or scientific personnel; |
| · | disputes or other developments related to proprietary rights, including patents, litigation matters and our ability to obtain patent protection for its products; |
| · | announcement or expectation of additional debt or equity financing efforts; |
| · | sales or issuances of our Common Shares by us, our insiders or our other shareholders, including by exercise of outstanding options or warrants; and |
| · | general economic and market conditions. |
These and other market and industry factors may cause the market price and demand for our Common Shares to fluctuate substantially, regardless of our actual operating performance, which may limit or prevent investors from readily selling their Common Shares and may otherwise negatively affect the liquidity of our Common Shares. In addition, stock markets in general, and the TSX, the Nasdaq and the share prices of biotechnology companies in particular, have experienced price and volume fluctuations that have often been unrelated or disproportionate to the operating performance of these companies. In addition, following our planned listing on Nasdaq, there may be price variations between the TSX and Nasdaq because of our dual listing.
If equity research analysts do not publish research or reports about our business or if they issue unfavorable commentary or downgrade our Common Shares, the price of our Common Shares could decline.
The trading market for our Common Shares will rely in part on the research and reports that equity research analysts publish about us and our business, over which we have no control. The price of our Common Shares could decline if one or more equity analysts downgrade our Common Shares or if analysts issue other unfavorable commentary or cease publishing reports about us or our business.
We may be subject to securities litigation, which is expensive and could divert management attention.
The market price of our Common Shares may be volatile, and in the past companies that have experienced volatility in the market price of their shares have been subject to securities class action litigation. We may be the target of this type of litigation in the future. Litigation of this type could result in substantial costs and diversion of management’s attention and resources, which could adversely impact our business. Any adverse determination in litigation could also subject us to significant liabilities.
We have never paid dividends on our Common Shares and we do not anticipate paying any dividends in the foreseeable future. Consequently, any gains from an investment in our Common Shares will likely depend on whether the price of our Common Shares increases.
We have not paid dividends on our Common Shares to date and we currently intend to retain our future earnings, if any, to fund the development and growth of our business. As a result, capital appreciation, if any, of our Common Shares will be your sole source of gain for the foreseeable future. Consequently, in the foreseeable future, you will likely only experience a gain from your investment in our Common Shares if the price of our Common Shares increases.
If we are unable to satisfy the requirements of Sarbanes-Oxley, or our internal controls over financial reporting are not effective, the reliability of our financial statements may be questioned.
We will become subject to the requirements of Sarbanes-Oxley if our Common Shares are listed on Nasdaq. Section 404 of Sarbanes-Oxley (“Section 404”) requires companies subject to the reporting requirements of the U.S. securities laws to complete a comprehensive evaluation of our internal controls over financial reporting. To comply with this statute, we will be required to document and test our internal control procedures and our management will be required to assess and issue a report concerning our internal controls over financial reporting. Pursuant to the JOBS Act, we will be classified as an “emerging growth company.” Under the JOBS Act, emerging growth companies are exempt from certain reporting requirements, including the independent auditor attestation requirements of Section 404(b) of Sarbanes-Oxley. Under this exemption, our independent auditor will not be required to attest to and report on management’s assessment of our internal controls over financial reporting during a five year transition period. We will need to prepare for compliance with Section 404 by strengthening, assessing and testing our system of internal controls to provide the basis for our report. However, the continuous process of strengthening our internal controls and complying with Section 404 is complicated and time-consuming. Furthermore, we believe that our business will grow both domestically and internationally, in which case our internal controls will become more complex and will require significantly more resources and attention to ensure our internal controls remain effective overall. During the course of our testing, our management may identify material weaknesses or significant deficiencies, which may not be remedied in a timely manner to meet the deadline imposed by Sarbanes-Oxley. If our management cannot favorably assess the effectiveness of our internal controls over financial reporting, or our independent registered public accounting firm identifies material weaknesses in our internal controls, investor confidence in our financial results may weaken, and the market price of our securities may suffer.
As a foreign private issuer whose shares are listed on Nasdaq, we intend to follow certain home country corporate governance practices instead of certain Nasdaq requirements.
As a foreign private issuer whose shares will be listed on Nasdaq, we are permitted to follow certain home country corporate governance practices instead of certain requirements of the Nasdaq rules. We intend to adopt and approve material changes to equity incentive plans in accordance with TSX listing rules, which do not impose a requirement of shareholder approval for such actions. In addition, we intend to follow the TSX listing rules in respect of private placements instead of Nasdaq requirements to obtain shareholder approval for certain dilutive events (such as issuances that will result in a change of control, certain transactions other than a public offering involving issuances of a 20% or greater interest in us and certain acquisitions of the stock or assets of another company) and the minimum quorum requirement for a shareholders meeting. Under Nasdaq listing rules, the required minimum quorum for a shareholders meeting is 33 1/3% of the outstanding common shares, and our minimum quorum requirement is only 10% of the total number of voting rights attaching to all outstanding Common Shares. See Item 10.B, “Additional Information—Memorandum and Articles of Association—Meetings”. Accordingly, our shareholders may not be afforded the same protection as provided under Nasdaq corporate governance rules for domestic issuers.
We will incur significantly increased costs and devote substantial management time as a result of operating as a U.S. public company.
As a U.S. public company, we will incur significant legal, accounting and other expenses that we did not incur as a private company or as a Canadian public company. For example, we will be subject to the reporting requirements of the U.S. Exchange Act, and will be required to comply with the applicable requirements of Sarbanes-Oxley and the Dodd-Frank Wall Street Reform and Consumer Protection Act, as well as rules and regulations subsequently implemented by the SEC and the including the establishment and maintenance of effective disclosure and financial controls and changes in corporate governance practices. We expect that compliance with these requirements will increase our legal and financial compliance costs and will make some activities more time consuming and costly. In addition, we expect that management and other personnel will need to divert attention from operational and other business matters to devote substantial time to these public company requirements. In particular, we expect to incur significant expenses and devote substantial management effort toward ensuring compliance with the requirements of Section 404, which involve annual assessments of a company’s internal controls over financial reporting. We may need to hire additional accounting and financial staff with appropriate public company experience and technical accounting knowledge and may need to establish an internal audit function. We cannot predict or estimate the amount of additional costs we may incur as a result of becoming a U.S. public company or the timing of such costs.
We may lose foreign private issuer status in the future, which could result in significant additional costs and expenses.
We may in the future lose foreign private issuer status if a majority of our common shares are held in the United States and we fail to meet the additional requirements necessary to avoid loss of foreign private issuer status, such as if: (i) a majority of our directors or executive officers are U.S. citizens or residents; (ii) a majority of our assets are located in the United States; or (iii) our business is administered principally in the United States. The regulatory and compliance costs to us under U.S. securities laws as a U.S. domestic issuer will be significantly more than the costs incurred as an SEC foreign private issuer. If we are not a foreign private issuer, we would be required to file periodic and current reports and registration statements on U.S. domestic issuer forms with the SEC, which are generally more detailed and extensive than the forms available to a foreign private issuer. In addition, we may lose the ability to rely upon exemptions from corporate governance requirements that are available to foreign private issuers.
It may be difficult for United States investors to effect services of process or enforcement of actions against us or certain of our directors and officers under U.S. federal securities laws.
Profound is incorporated under the laws of the Province of Ontario, Canada. A majority of our directors and officers reside in Canada. Because all or a substantial portion of our assets and these persons are located outside the United States, it will be difficult for United States investors to effect service of process in the United States upon us or our directors or officers, or to realize in the United States upon judgments of United States courts predicated upon civil liabilities under the U.S. Exchange Act or other United States laws. It may also be difficult to have a judgment rendered in a U.S. court recognized or enforced against us in Canada.
We may be a passive foreign investment company (“PFIC”) for U.S. federal income tax purposes, which generally would result in certain adverse U.S. federal income tax consequences to our U.S. shareholders.
In general, a non-U.S. corporation is a PFIC for any taxable year in which (i) 75% or more of its gross income consists of passive income (the “income test”) or (ii) 50% or more of the average quarterly value of its assets consists of assets that produce, or are held for the production of, passive income (the “asset test”). Generally, “passive income” includes interest, dividends, rents, royalties and certain gains, and cash is a passive asset for PFIC purposes. We have made no determination as to whether we are classified as a PFIC for U.S. federal income tax purposes. The determination of whether we are a PFIC depends on the particular facts and circumstances (such as the valuation of our assets, including goodwill and other intangible assets) and is also affected by the application of the PFIC rules, which are subject to differing interpretations. The fair market value of our assets is expected to depend, in part, upon (i) the market price of the Common Shares, which is likely to fluctuate, and (ii) the composition of our income and assets, which will be affected by how, and how quickly, we spend any cash that is raised in any financing transaction. If we were a PFIC for any taxable year during which a U.S. shareholder owned the Common Shares, such U.S. shareholder generally will be subject to certain adverse U.S. federal income tax consequences, including increased tax liability on gains from dispositions of the Common Shares and certain distributions and a requirement to file annual reports with the Internal Revenue Service. In light of the foregoing, no assurance can be provided that we are not currently a PFIC or that we will not become a PFIC in any future taxable year. Prospective investors should consult their own tax advisers regarding our PFIC status. See Item 10.E, “Additional Information—Taxation—Certain U.S. Federal Income Tax Considerations—Passive Foreign Investment Company Considerations.”
ITEM 4. INFORMATION ON THE COMPANY
A. History and Development of the Company
| 1. | Name, Address and Incorporation; Trading Market |
Profound is the company resulting from a “three-cornered” amalgamation involving Mira, Mira Subco (a subsidiary formed to complete the amalgamation) and Profound Medical Inc. (“Old PMI”). Old PMI was formed by articles of incorporation under the OBCA on June 13, 2008. Mira was formed by articles of incorporation under the OBCA on July 16, 2014, and following its initial public offering in Canada, was a “capital pool company” listed on the TSX-V. As a capital pool company, Mira had no assets other than cash and did not carry on any operations. On June 3, 2015, in anticipation of the amalgamation, Mira changed its name to “Profound Medical Corp.” (becoming “Profound”) and completed a consolidation of its share capital on the basis of one post-consolidation common share for every 13.6363 pre-consolidation common shares. On June 4, 2015, Mira (now “Profound”), Mira Subco and Old PMI completed the amalgamation, with Profound as our surviving holding company, and Mira Subco and Old PMI amalgamating to form a new OBCA subsidiary, Profound Medical Inc. (“PMI”), to serve as the holding subsidiary of our operating subsidiaries. Upon completion of the amalgamation, we commenced trading on the TSX-V. On July 13, 2018, we graduated from the TSX-V and commenced trading on the TSX under the symbol “PRN”.
We intend to apply to list our Common Shares on the Nasdaq in connection with this Registration Statement. Such a listing is dependent upon satisfaction of all necessary listing requirements as well as this Registration Statement becoming effective with the SEC. On June 13, 2019, we received shareholder approval for a special resolution authorizing the Board to amend our articles of incorporation to effect a consolidation of all of the issued and outstanding Common Shares (the “Share Consolidation”), such that the trading price of the Common Shares following the Share Consolidation would permit us to qualify for a potential listing on the Nasdaq. Although shareholder approval for the Share Consolidation has been obtained, the exact ratio of the Share Consolidation has not yet been determined, and will not become effective until a date in the future to be determined by the Board in order to satisfy the applicable listing eligibility requirements of the Nasdaq.
Our head and registered office is located at 2400 Skymark Avenue, Unit 6, Mississauga, Ontario, Canada L4W 5K5, and its telephone number is (647) 476-1350. Our agent for service of process in the United States is Corporation Service Company, located at 251 Little Falls Drive, Wilmington, DE 19808.
| 2. | Summary Corporate History and Intercorporate Relationships |
Intercorporate Relationships
Profound operates its business through its direct subsidiary, PMI, and its indirect subsidiaries, Profound Medical Oy, Profound Medical GmbH and Profound Medical (U.S.) Inc.
The following diagram illustrates the organizational structure of Profound and its subsidiaries, their respective jurisdictions of incorporation and the percentage of voting and non-voting securities owned by Profound as of the date of this Registration Statement.
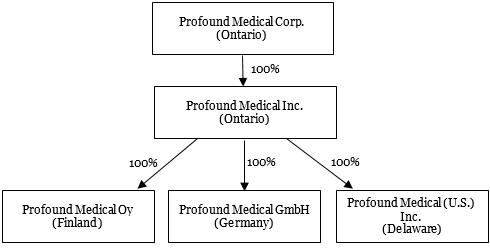
Corporate History
2019 Highlights (Year-to-Date)
On August 15, 2019, we received 510(k) clearance from the FDA to market TULSA-PRO for transurethral ultrasound ablation of prostate tissue.
On July 9, 2019, we announced that we sold our first TULSA-PRO system in Japan. The system was purchased by Hokuyu Hospital in Sapporo via Japan’s PMD Act expanded access program. The PMD Act, regulated by Japan’s PMDA and Ministry of Health, Labor and Welfare (“MHLW”), allows physicians to import, with permission from the MHLW, an unapproved medical device directly from the distributor in cases where there is a clinical urgency and there are no alternatives in Japan.
On June 13, 2019, our shareholders approved a special resolution authorizing the Board to amend our articles of incorporation to effect a consolidation of all of the issued and outstanding Common Shares at a consolidation ratio that would permit us to qualify for a potential listing on the Nasdaq.
In May 2019, based on the TACT 12-month follow-up data, we submitted an application to the FDA for clearance to market TULSA-PRO in the United States.
On May 5, 2019, Dr. Scott Eggener presented 12-month results of the TACT Pivotal Clinical Trial for TULSA-PRO, including the primary efficacy and safety endpoints, as well as key secondary endpoints.
On April 16, 2019, we announced that the first prostate cancer treatment using a first-of-its-kind TULSA-PRO installation had been performed in Trier, Germany.
On April 4, 2019, we announced positive topline results from the TACT Pivotal Clinical Trial of TULSA-PRO in patients with prostate cancer.
Effective as of January 21, 2019, we entered into and replaced our original co-marketing and co-selling agreement with Siemens.
2018 Highlights
On September 18, 2018, we press released 3-year clinical outcomes in prostate patients and a BPH subgroup analysis of our Phase I Clinical Trial for TULSA-PRO which was included in a presentation at the Deutschen Gesellschaft für Urologie (DGU) 2018 conference.
On July 30, 2018, we entered into the CIBC Loan Agreement, which provided up to C$18.75 million of borrowing capacity. The first tranche of C$12.5 million was funded upon execution of the agreement, with the option of a second tranche of up to an additional C$6.25 million available through December 31, 2019, subject to the satisfaction of certain financing and product development milestones.
On July 11, 2018, we received final approval for listing of the Common Shares on the TSX to trade under the symbol “PRN”.
On May 9, 2018, we obtained Chinese Food and Drug Administration approval for Sonalleve for the non-invasive treatment of uterine fibroids.
On March 20, 2018, we completed the 2018 Bought Deal in which we issued 34,500,000 Common Shares at a price of C$1.00 per Common Share, for total gross proceeds of C$34.5 million.
In February 2018, we completed patient enrollment in the TACT Pivotal Clinical Trial.
2017 Highlights
On November 6, 2017, we announced the expanded clinical use in Germany of TULSA-PRO in prostate care to include BPH.
On September 20, 2017, we closed the 2017 Bought Deal in which we issued 10,000,000 Common Shares at a price of C$1.00 per Common Share, for total gross proceeds of C$10 million.
On July 31, 2017, we completed the acquisition of the Sonalleve technology from Philips, and expanded our non-exclusive strategic sales relationship to include distribution of Sonalleve.
On March 27, 2017, we announced that the first TULSA-PRO patient paid procedure was conducted at the ALTA Klinik in Bielefeld, Germany under the supervision of Dr. Agron Lumiani.
2016 Highlights
On November 14, 2016, we completed the 2016 Bought Deal in which we issued 15,820,000 Common Shares at a price of C$1.10 per Common Share for aggregate gross proceeds of C$17,402,000.
On May 19, 2016, the FDA granted approval of an IDE application for our TACT Pivotal Clinical Trial.
On May 11, 2016, we announced the signing of a sales and marketing agreement with Philips to collaborate in the commercialization of our TULSA-PRO system in Europe, Canada, the United States and other markets, subject to regulatory clearance in those jurisdictions.
On April 28, 2016, we announced our first commercial sale of our TULSA-PRO system in Europe.
On April 11, 2016, we affixed the CE Mark to the TULSA-PRO system following receipt of a CE Certificate of Conformity from our notified body in the European Union. The CE Mark affixed to the medical device enables us to market the TULSA-PRO system in the European Union and in other jurisdictions accepting CE marked medical devices such as Norway, Iceland, Liechtenstein and Switzerland.
On February 26, 2016, we entered into a strategic collaboration agreement with Siemens, aimed at advancing the commercial launch of our TULSA-PRO system.
Principal Capital Expenditures and Divestitures
See Item 5.B, “Liquidity and Capital Resources”.
Internet Availability of Company Information
The SEC maintains an Internet site (http://www.sec.gov) that makes available reports and other information that the Company files or furnishes electronically with it. The Company’s Internet site can be found at http://www.profoundmedical.com. The information on our website is not incorporated by reference into this Registration Statement and should not be considered a part of this Registration Statement, and the reference to our website in this Registration Statement is an inactive textual reference only.
B. Business Overview
Overview
We are an early commercial-stage medical device company focused on the development and marketing of customizable, incision-free therapeutic systems for the ablation of diseased tissue using our platform technology. Our leading approved product is our TULSA-PRO system, which in August 2019 received FDA clearance as a Class II device in the United States for thermal ablation of prescribed prostate tissue, benign and malignant, using transurethral ultrasound ablation (“TULSA”) based on our TULSA-PRO whole gland ablation clinical trial (the “TACT Pivotal Clinical Trial” or “TACT”), and is also CE marked in the European Union for ablation of targeted prostate tissue (benign or malignant). In addition, our Sonalleve system is CE marked in the EU for the treatment of uterine fibroids and palliative pain relief associated with metastases in bone, and is also approved in China for the treatment of non-invasive treatment of uterine fibroids. Our systems are designed to be used with MRI scanners and are currently compatible with MRI scanners manufactured by Philips and Siemens. To date, we have primarily generated revenues from our limited commercialization of our systems in the EU (principally in Germany) and Asia. We intend to commence commercialization of the TULSA-PRO system in the United States in the near term following our recent FDA clearance. We also continue to pursue additional regulatory approvals, research and development, clinical studies and acquisitions in order to expand the applications of our platform technology and expand our commercial footprint.
Our Technology Platform
We anticipate that, based on our TACT clinical data and additional studies conducted in the European Union, physicians may elect to use TULSA-PRO to ablate benign or malignant prostate tissue in patients with a variety of prostate diseases. Prostate diseases include prostate cancer and benign prostatic hyperplasia (“BPH”). Prostate cancer is one of the most common types of cancer affecting men, with an annual incidence of newly diagnosed cases reaching 450,000 in Europe, according to the International Agency for Research on Cancer, and 175,000 in the United States according to the American Cancer Society. The American Cancer Society further estimates that there are currently 5.8 million men living with prostate cancer in these two geographies. Although ten-year survival outcomes for prostate cancer remain favorable, it is still one of most common causes of cancer deaths among men. BPH is a histologic diagnosis that refers to the proliferation of smooth muscle and epithelial cells within the prostatic transition zone. According to the American Urological Association, BPH is nearly ubiquitous in the aging male with worldwide autopsy proven histological prevalence increases starting at ages 40 to 45 years, reaching 60% at age 60 and 80% at age 80.
We believe that we are the only company to provide customizable, incision-free therapies which combine real-time MRI, thermal ultrasound and closed-loop temperature feedback control for the radiation-free and incision-free ablation of diseased tissue. We believe that our platform technology has the potential to offer clinicians and qualified patients a better alternative to current standards of care for removing or otherwise ablating benign or malignant prostate tissue, such as traditional surgery or radiation therapy, with respect to clinical outcomes, side effects and recovery time.
TULSA-PRO and Sonalleve share the common technological concept of using MRI to enable visualization of the surgeon desired tissue in real time. Both products also use thermal ultrasound technology to heat and ablate tissue. The TULSA-PRO ablation is a catheter-based design, which is to be inserted transurethrally into the prostate to provide a robotically driven sweeping ultrasound for continuous ablation of the surgeon defined prostate volume. The Sonalleve ultrasound is provided through a disc located outside the patient and designed to focus the ultrasound to a specific location inside the patient. The focal point provides the energy for ablation. We believe that Sonalleve has the potential to provide us with a platform to expand into additional applications that may offer similar advantageous incision-free ablation related benefits for various disease conditions.
TULSA-PRO
Our TULSA-PRO System
Our TULSA-PRO system combines real-time MRI, robotically-driven transurethral sweeping action/thermal ultrasound and closed-loop temperature feedback control. The combination enables the TULSA-PRO system to provide customizable and predictable radiation-free and incision-free ablation of a surgeon-defined prostate volume while actively protecting the urethra and rectum through water cooling to minimize the impact of ablation on the patient’s natural functional abilities.
Our TULSA-PRO system is comprised of two categories of components: disposables and the capital equipment used in conjunction with a customer’s MRI scanner. We have designed the TULSA-PRO system to be capable of integration with many major MRI scanners currently deployed in hospitals and treatment facilities. That integration allows the TULSA-PRO system to display high resolution images of the prostate and surrounding anatomy. The integrated MRI is used for treatment planning but, more importantly, to provide real-time measurement of temperature in the prostate as the treatment is occurring to enable the physician/clinician to control and monitor tissue ablation. We have designed our TULSA-PRO technology to work optimally with particular MRI scanners sold by Siemens and Philips and we intend to increase compatibility of the TULSA-PRO system with models from other MRI vendors over time.
The ultrasound applicator (the “UA”) is a sterile, single use, disposable component of the TULSA-PRO system. The UA produces directional ultrasound beams, through a linear array of 10 independent ultrasound transducers, each of which is independently computer controlled using real-time MRI feedback to deliver heat out to the prescribed treatment boundary. The UA is introduced into the patient via the urethra and is precisely located within the prostate using the system’s robotic positioning, which is controlled by the system’s software together with MRI feedback for guidance. The real time measurement of the temperature from the MR and the precision of transurethral ultrasound is intended to enable the TULSA-PRO system to sculpt the ablated tissue volume to the shape of the patient’s prostate, which may assist in avoiding damage to sensitive structures, including the bladder neck and urethral sphincter.
We believe there are a number of expected clinical advantages of TULSA-PRO procedure over the existing standard of care. As described below, TULSA-PRO technology has demonstrated accurate and precise ablation of targeted prostate tissue, while providing a well-tolerated favorable safety profile with relatively minor impact on urinary, erectile and bowel function at 12 months.
TACT – Our Pivotal Clinical Trial
We received FDA clearance for our TULSA-PRO system in August 2019 based on our TACT Pivotal Clinical Trial. The TACT Pivotal Clinical Trial is a prospective, open-label, single-arm pivotal clinical study, of 115 prostate cancer patients across 13 research sites in the United States, Canada and Europe. We commenced our TACT Pivotal Clinical Trial in August 2016, and completed patient enrollment in February 2018.
On May 5, 2019, Dr. Scott Eggener, Chief Investigator of the TACT Pivotal Clinical Trial, presented 12-month follow-up outcomes during the American Urological Association’s 2019 Annual Meeting Plenary Program in Chicago, IL, including the primary efficacy and safety endpoints, as well as key secondary endpoints. The TACT Pivotal Clinical Trial met its primary Prostate-Specific Antigen (“PSA”) reduction endpoint in 110 of 115 (approximately 96%) patients, with median interquartile range PSA reduction of approximately 95% (91-98%) and nadir of 0.34 (0.12-0.56) ng/ml, and with low rates of severe toxicity and residual clinically significant prostate cancer.
The median age of enrolled patients was 65 years and the median PSA level was 6.3 ng/ml. The study focused on a clinically significant prostate cancer population, where 67.0% (77 out of 115) had NCCN (National Comprehensive Cancer Network) intermediate-risk disease, and 62.6% (72 out of 115) had Grade Group 2 (GG2) or Gleason Score 7 (GS7) disease. Of the 43 patients with GG1 or GS6 disease, 60.5% (26 out of 43) had high-volume disease (≥ 3 cores positive, or ≥ 50% cancer core length). Treatment intent was whole-gland ablation with sparing of the urethra and urinary sphincter. Median targeted prostate volume was 40 cc with treatment delivery time of 51 minutes. A median of 97.6% of the prescribed target volume was heated to ablative temperatures with spatial ablation precision of ±1.4 mm measured on MRI thermometry during treatment.
The primary efficacy endpoint of TACT is the proportion of patients achieving a post-treatment PSA reduction ≥ 75% of their pre-treatment baseline value. The FDA-approved protocol’s pre-established performance goal for the success proportion was 50% of patients.
Secondary efficacy endpoints include prostate volume reduction on 12-month MRI and histological response on 12-month 10-core prostate biopsy. The median perfused prostate volume of patients in TACT decreased from 41 cc to 4 cc, based on assessment from the local research sites, pending review by a central radiology core lab. Of the 115 patients enrolled in the study, only 4 (3.5%) did not undergo follow-up biopsy, in all cases due to patient refusal. Among 68 men with pre-treatment intermediate-risk GG2 disease, 54 (79.4%) were free of GG2 disease on one-year biopsy. Among 94 men with pre-treatment GG2 or high-volume GG1 disease, 72 (76.6%) were free of GG2 or high-volume GG1 disease on follow-up biopsy. Of the 111 men with one-year biopsy data, 72 (64.9%) had a complete histological response with no evidence of any cancer, and 16 (14.4%) had low-volume GG1 disease which has virtually no potential for metastases or cancer-related mortality. The 20.6% rate of residual clinically significant prostate cancer in an intermediate-risk patient population is similar or better than that reported in prospective studies of modern external beam radiation therapy and other ablation technologies. In addition, the TACT patients remain amenable to re-treatment with TULSA-PRO or standard of care therapies.
The primary safety endpoint of TACT is the frequency and severity of adverse events graded according to the Common Terminology Criteria for Adverse Events, or CTCAE. The rate and nature of attributable adverse events were similar to the favorable safety profile reported in the Phase I Safety & Feasibility Study of TULSA-PRO (as described below). In the TACT study, attributable serious adverse events occurred in 7.0% of patients, including 4.3% genitourinary infection, 0.9% urinary retention, 0.9% urinoma, 0.9% ileus (related to urinary catheter), 0.9% deep vein thrombosis, and 0.9% urethral stricture, and in all cases the adverse events were resolved. Similarly, 7.8% of patients experienced an attributable severe (Grade 3) adverse event, all resolved. There were no rectal injuries or fistulas, and no attributable Grade ≥ 4 adverse events.
Additional secondary endpoints of TACT focus on functional side effects commonly associated with current prostate cancer therapies, such as erectile dysfunction and urinary incontinence. At 12 months, 23.5% of patients had moderate erectile dysfunction (surgeon assessed Grade 2 adverse event, intervention such as medication indicated) and no patient experienced severe erectile dysfunction (Grade 3, intervention such as medication not helpful). Erectile function was also evaluated using the IIEF Patient-Reported Questionnaire. The median change in IIEF-5 was a decrease in 3 points, less than the minimal clinically important difference in erectile function. At 12 months, 75.0% (69 out of 92) of previously potent patients were able to maintain erections sufficient for penetration (IIEF question 2 ≥ 2). With respect to urinary function, 2.6% of patients had moderate urinary incontinence (surgeon assessed Grade 2 adverse event, pads indicated) at 12 months. Urinary function was also evaluated using the EPIC Patient-Reported Questionnaire. At 12 months, there was 99.1% (111 out of 112) preservation of urinary continence (≤1 pad/day), and a 96.2% rate of leak-free continence (leak <1 time/day).
Multivariate predictors of GG2 disease at one-year biopsy included presence of intraprostatic calcifications at screening, MRI thermal coverage of target volume, and PIRADS ≥ 3 lesion at one-year post-treatment MRI (p < 0.05).
Based on the 12-month outcomes of the TACT Pivotal Clinical Trial, we submitted our application to the FDA in May 2019 for clearance to market the TULSA-PRO system in the United States, and on August 15, 2019, we received 510(k) clearance for commercial sales of TULSA-PRO as a Class II device in the United States for thermal ablation of prescribed prostate tissue, benign and malignant, using transurethral ultrasound ablation.
Phase I Safety and Feasibility Study
In March 2014, we completed enrollment and treatment of 30 patients in the Phase I TULSA multi-jurisdictional safety and feasibility study. The procedure was delivered using our TULSA-PRO system, with the objective of determining its clinical safety and feasibility for prostate ablation in the primary treatment setting of patients with localized prostate cancer.
In October 2015, the results of our safety and feasibility study were accepted for publication in European Urology, the official journal of the European Association of Urology. We presented the successful 12-month Phase I clinical trial outcomes at the European Symposium on Focused Ultrasound Therapy. Upon completion of the study, the clinical data was also submitted to European regulatory authorities for regulatory clearance in Europe. Based on our Phase I clinical trial results, in April 2016, we received a CE Certificate of Conformity for the TULSA-PRO system from our notified body in the EU, and in the fourth quarter of 2016, we initiated a pilot commercial launch of TULSA-PRO in key European markets where the CE Mark is accepted.
Sonalleve
Our Sonalleve system combines real-time MRI and thermometry with focused ultrasound delivered from the outside of the patient to enable precise and incision-free ablation of diseased tissue. We acquired the Sonalleve technology from Philips in 2017. The Sonalleve system is CE marked in the EU for the treatment of uterine fibroids and palliative pain treatment of bone metastases. In 2018, the Sonalleve system was also approved in China by the National Medical Products Administration (“NMPA”) for the non-invasive treatment of uterine fibroids. We are in the early stages of exploring additional potential indications for which the Sonalleve technology has been shown in pre-clinical studies to have the potential for clinical application, such as non-invasive ablation of abdominal cancers and hyperthermia for cancer therapy.
Overview of Uterine Fibroids
Uterine fibroids are the most common non-cancerous tumors in women of childbearing age. Based on data from the Agency for Healthcare Research and Quality, we estimate that uterine fibroids occur in 70-80% of the female population, but only approximately one third of these cases will require treatment. In addition, based on data from the Agency for Healthcare Research and Quality, we estimate that in the United States, 26 million women between the ages of 15 and 50 have uterine fibroids, and more than 15 million of them will experience associated symptoms or health concerns during their lifetimes. Uterine fibroids cause a variety of symptoms that can significantly reduce the quality of life for a woman, which can include bleeding, pain, pressure and reproductive challenges including infertility, multiple miscarriages, and premature labor. Treatment options differ in fundamental aspects such as cost, invasiveness, recovery time, risks, likelihood of long-term resolution of symptoms, need for future care for fibroids, and influence on future childbearing potential.
Our Sonalleve System
The procedure using the Sonalleve system consists of imaging the uterus in an MRI scanner and heating the fibroid or adenomyosis with high-intensity focused ultrasound energy until the tissue reaches the temperature that causes necrosis. The MRI scanner monitors the progress of the treatment. For the patient, the technique can be much more convenient and comfortable than traditional surgical procedures, such as hysterectomy or myomectomy. These require hospital admission on an in-patient basis and sometimes weeks of recovery. In contrast, with Sonalleve fibroid therapy, patients can be treated on an outpatient basis without the need for anesthesia, discharged the same day and almost fully recovered within a few days.
The Sonalleve bone pain relief application is indicated for palliative treatments to relieve pain associated with bone metastasis. In the later stages of their disease, many cancer patients develop bone metastases. Bone changes and malformations irritate nerve endings, which can cause severe and debilitating pain and become unbearable for many patients. Conventional treatment with strong medication or radiation therapy can result in unpleasant side effects. Sonalleve provides an alternative option to alleviate this pain. Pain relief can be expected in as quickly as 2-3 days as compared to radiation therapy which could take up to three weeks.
The ultrasound energy utilized in the Sonalleve system is MR High Intensity Focused Ultrasound (“HIFU”) or MR-HIFU. MR-HIFU therapy uses a focused transducer to bundle ultrasound energy into a small volume at the target locations inside the body under MRI and visualization. During treatment, the ultrasound energy beam passes through the intact skin and soft tissue, causing localized high temperatures in the focus area. The skin and intermediate tissue are left unharmed. Within a few seconds this produces a well-defined region of coagulative necrosis.
The Sonalleve system is designed to be integrated with Philips MRI scanners and we intend to expand this compatibility to additional MRI scanner brands in the future. MRI can measure temperature changes within the human body non-invasively. 3D MR images provide the anatomical reference data for treatment planning, while real-time temperature sensitive images are acquired during ablation to provide real-time information about treatment progress and monitor critical anatomical structures.
There are over 200 publications from leading institutions globally on Sonalleve technology. There are also over approximately 60 medical and scientific institutions globally that make up the installed base of Sonalleve system.
Sales and Marketing
To date, we have primarily generated revenues from our limited commercialization of our systems, including disposables and related services, in the EU (principally in Germany) and Asia. For the year ended December 31, 2018, approximately 52% and 48% of our revenues were generated in the EU and Asia, respectively, compared to 77%, 12% and 11% in the EU, South America and Asia, respectively, for the year ended December 31, 2017. For the year ended December 31, 2016, we had no revenue as we only started our pilot commercial launch in 2017. We intend to commence commercialization of the TULSA-PRO system in the United States in the near term following our recent FDA clearance.
Historically treatment of conditions such as localized prostate disease and uterine fibroids have included surgical intervention. Over time, surgery has evolved from an ‘open’ technique, to laparoscopic, to robotic surgery. The surgeon’s motivation behind this evolution has been to perform procedures that reduce invasiveness, improve clinical outcomes, and reduce recovery times. We are now taking this concept to the next level by enabling customizable, incision-free therapies for the MRI-guided ablation of diseased tissue with the TULSA-PRO and Sonalleve systems. These incision-free and radiation-free procedures offer surgeons the option of providing predictable and customizable procedures that eliminate invasiveness, offer the potential to improve clinical outcomes and further reduce hospital stays and patient recovery times.
For the TULSA-PRO system, we generate revenue from the sale of the capital equipment, procedure-related sales of disposable single use components of the system (which are sold on a per patient basis), and service revenue for ongoing maintenance of the systems. The key customer segments for TULSA-PRO we are targeting include academic/university/clinical leadership hospitals as well as private clinics with access to MRI scanners. We are establishing our own direct sales and marketing teams for sales of TULSA-PRO systems and the disposable components related thereto, as well as for Sonalleve systems in the jurisdictions where it is approved. The primary focus of our direct sales team is to cultivate adoption of the TULSA-PRO technology, support clinical customers with the TULSA-PRO procedures and increase the utilization of the systems and disposable components. We expect to generate recurring revenues from the sale of disposables and service maintenance.
We also collaborate with our strategic partners Philips and Siemens for lead generation and distribution of the capital equipment, which are currently available through the Philips and Siemens sales catalogs. The catalogs provide access and enable the sales teams of each collaborator to provide quotations for potential sales, in those jurisdictions where the product is approved for sale by the relevant regulatory bodies.
Sales of Sonalleve currently are primarily a one-time capital sale with limited recurring service revenue. Given that it is currently only compatible with Philips MRI scanners, we rely primarily on our strategic partnership with Philips for lead generation and sale of the capital units, which are available through the Philips sales catalog. With regulatory approval for the sale of Sonalleve only in the EU and China, our current commercial focus is limited to those jurisdictions.
Competition
TULSA-PRO
Our TULSA-PRO system is intended to ablate benign and malignant prostate tissue. There are currently no marketed devices indicated for the treatment of prostate diseases or prostate cancer and our FDA indication and CE mark in the European Union also do not include treatment of any particular disease or condition. However, there are a number of devices indicated for the destruction or removal of prostate tissue and devices indicated for use in performing surgical procedures that physicians and surgeons currently utilize when treating patients with prostate disease, including prostate cancer. Approaches that physicians and surgeons currently use to address prostate disease include: (1) watchful waiting/active surveillance; (2) simple prostectomy; (3) radical prostatectomy (includes open, laparoscopic and robotic procedures); (4) radiation therapies including, external beam radiation therapy (“EBRT”), brachytherapy and high dose radiation (“HDR”); (5) cryoablation and (6) trans-rectal high intensity focused ultrasound (“HIFU”). In addition, certain adjunct or less common procedures are used or are under development to address prostate disease, such as androgen deprivation therapy (“ADT”) and proton beam therapy. We anticipate that physicians may likewise elect to use our TULSA-PRO system to ablate benign or malignant prostate tissue in patients with prostate disease such that our system faces competition from these other options.
These competing options each have their own limitations and benefits and may be appropriate for only limited patient populations. For example, active surveillance is generally recommended for patients who have been diagnosed with earlier stage, lower risk, disease where the possibility of side effects from intervention may outweigh the expected benefit of the chosen procedure. For clinicians and patients, the gap between active surveillance and the most commonly utilized options of surgery or radiation therapy impose the possibility of substantial side effects, creating a need for a less invasive methodology to remove diseased prostate tissue that is both radiation- and incision-free and provides a more favorable side-effect profile.
Watchful Waiting; Active Surveillance
Watchful waiting means no treatment until there is an indication that the cancer has spread. Active surveillance is monitoring of the prostate cancer closely with PSA tests and digital rectal exams. Prostate biopsies may also be done to see if the cancer is becoming more aggressive. Test results will indicate whether a more aggressive treatment option should be considered.
Simple Prostatectomy
Simple prostatectomy is recommended for men with severe urinary symptoms caused by an obstructive prostate gland and whose symptoms are not responsive to other medical or minimally-invasive therapies. Simple prostatectomy involves removing only the obstructive portion of the prostate gland rather than the entire gland and surrounding tissue. A simple prostatectomy can be open or robotic. Open simple prostatectomy can be conducted through retropubic, suprapubic, or perineal routes. Simple prostatectomy has higher morbidity and longer hospitalization in comparison to less invasive therapies such as transurethral resection of the prostate. Simple prostatectomy is contraindicated in the presence of cancer.
Radical Prostatectomy
Radical prostatectomy, an open surgical removal of the entire prostate gland and some surrounding tissues, represents a current standard of care, practiced by urologists in North America and Europe, which procedure involves the removal of the localized cancerous tissue. However, the conventional open surgical technique has high post-surgery incidences of impotence and incontinence and long recovery time. Relatively recently, robotic surgery systems have become more common in the market. Cited benefits of the robotic technique include improved precision and range of motion. Risks specific to the robotic technique include longer operation time, the possible need to convert the procedure to a non-robotic approach, and the need for additional or larger incision sites. Converting the procedure could mean a longer operation time, resulting in a longer time under anesthesia.
External Beam Radiation Therapy
EBRT requires multiple weekly clinic visits over a period of six to eight weeks. The procedure directs a beam of radiation from outside the body to cancerous tissue inside the body. Although such procedures are relatively costly with studies showing significant risk of collateral damage and lengthy recovery times, it is non-invasive. It can also be used to irradiate cancer that has spread to other areas.
Brachytherapy and High Dose Radiation
With brachytherapy, radioactive seeds are implanted in the prostate to irradiate the cancerous tissue. The seeds irradiate the prostate over time and decay in place to background levels; they remain implanted and inert afterwards. Side effects of brachytherapy are similar to those of EBRT in terms of urinary, bowel and erectile function. An alternative is high dose radiation, or HDR, in which highly radioactive seeds are temporarily inserted, then removed during the same procedure, leaving nothing implanted afterward. HDR has the ability to target tissue, but requires hospital stays and usually is accompanied by adjunct EBRT over several weeks.
Cryoablation
Cryoablation freezes cells to death by introducing cooled liquids and gases to an area of cancerous tissue. Studies show cryoablation offers poor precision and has delivered impotence rates that are almost as high as those for conventional radical prostatectomy. The procedure also carries a risk of potential damage to the tissue between the urethra and rectum, potentially resulting in a urinary rectal fistulas.
Trans-rectal High Intensity Focused Ultrasound (“HIFU”)
Trans-rectal HIFU is used increasingly in the European Union, United States and Canada. This technique utilizes focused ultrasound that is delivered through the rectal wall to treat the prostate. Image guidance is generally provided by ultrasound. At an FDA urology panel meeting in 2014, the panel indicated that HIFU can lead to complications such as rectal fistulae and rectal incontinence. Due to the focused treatment zone, this treatment requires approximately three hours to complete. One limitation of HIFU is prostate size; the procedure is limited to patients with prostate volume smaller than 40 cubic centimeters. Patients with larger prostates need a separate surgical procedure, such as transurethral resection of the prostate (“TURP”) or ADT, both described below, to de-bulk or reduce the size of the prostate prior to HIFU. This additional procedure increases costs and the risk of complications. Recent studies have indicated positive survival outcomes and thermal ultrasound appears to be gaining traction in certain settings.
Adjunct and Emerging Therapies
Androgen deprivation therapy, or ADT, uses hormones to suppress testosterone production and alleviate symptoms, but with the primary side-effect of reduced sexual interest and activity. Although historically used as a last line of defense for the disease (and typically in a palliative setting), it is increasingly used as a first line treatment or in combination with other treatments.
TURP is a surgical procedure that removes portions of the prostate gland through the penis. This procedure is used to relieve moderate to severe urinary symptoms caused by an enlarged prostate, a condition known as BPH. This procedure is also used in adjunct to a HIFU procedure when a prostate gland is larger than 40 cubic centimeters.
Proton beam therapy is a way to deliver radiation to tumors using tiny, sub-atomic particles (protons) instead of the photons used in conventional radiation treatment. Proton beam therapy uses new technology to accelerate atoms to approximately 93,000 miles per second, separating the protons from the atom. While moving at this high speed, the particles are “fired” at the patient’s tumor. These charged particles deliver a very high dose of radiation to the cancer but release very little radiation to the normal tissue in their path. In theory, this approach minimizes damage to healthy organs and structures surrounding the cancer. The radiation beams must pass through the skin, the bladder and the rectum on the way to the prostate gland, and once they reach the gland, they encounter normal prostate cells and the nerves that control penile erections. Damage to these tissues can lead to complications, including bladder problems, rectal leakage or bleeding, and erectile dysfunction.
We believe that use of the TULSA-PRO system as a tool to ablate prostate tissue can provide a clinician and his or her patients with the following clinical advantages:
| · | Clinically shown to have millimeter accuracy designed to ablate prostate tissue while sparing nearby critical structures, and that real time MR thermometry also ensures precision in ablation temperature, minimizing side effects that can occur from overheating; |
| · | Enables clinician to define the boundaries of the tissue to be ablated, whether the whole prostate or any of its subsections, to ensure customization of the needs of each patient; |
| · | Transurethral approach allows for ablation of even the largest prostates that may be 120 cubic centimeters or larger in size; |
| · | Potential to be a single outpatient procedure with a rapid recovery time; and |
| · | Designed to be compatible with leading MRI platforms and could become part of a continuum of care from MR imaging diagnosis, MR guided biopsy to MR guided treatment. |
We believe that the flexibility of the TULSA-PRO system may allow us to demonstrate its use as a tool for ablating benign and malignant diseased prostate tissue with greater speed and precisions than current options while minimizing potential side effects. We believe that the TULSA-PRO system may overcome certain limitations of other devices and methodologies for removing or addressing disease prostate tissue including HIFU, such as complications associated with trans-rectal delivery and limitations relating to prostate size. We believe that a transurethral (inside out) ablation approach with millimeter accuracy has advantages over HIFU in ablating the whole gland safely.
Sonalleve
The treatment choices for uterine fibroids usually depend on the symptoms of the patient, size of the fibroid, desire for future pregnancy, and preference of the treating gynecologist. Most common treatment options for uterine fibroids include: (1) hormonal medications including gonadotrophin releasing hormone agonists (“Gn-RH”); (2) progesterone releasing intra-uterine devices; (3) surgical procedures such as hysterectomy and myomectomy; and (4) uterine artery embolization.
We believe that the Sonalleve system may provide a treatment option that is more convenient and comfortable with less side effects than surgical procedures, such as hysterectomy or myomectomy.
Hormonal Medications
Fibroids can be treated with hormonal drugs, such as Gn-RH agonists. Gn-RH agonists can treat fibroids by blocking the production of estrogen and progesterone, putting women into a temporary postmenopausal state. As a result, menstruation stops, fibroids shrink and anemia is often alleviated. Other hormonal medications can also be utilized in patients with uterine fibroids. In many cases, however, medication may provide only temporary relief from the symptoms caused by fibroids. The symptoms often return when the patient stops taking the medication. Moreover, the side effects of some drugs may cause them to be unsuitable for some patients. Gn-RH agonists typically are used for no more than three to six months because long-term use can cause loss of bone.
Progesterone Releasing Intra-Uterine Devices
Progesterone releasing intra-uterine devices can relieve heavy bleeding caused by fibroids. However, these devices can only provide symptom relief and do not impact the fibroid itself.
Uterine Artery Embolization
Uterine artery embolization involves injection of embolic agents into the arteries that supply the uterus, thereby cutting off the blood supply to the fibroids. Many women require at least one day of hospitalization and heavy pain medication. The prolonged pain may slow down the recovery period. Complications may occur if the blood supply to the ovaries or other organs is compromised.
Surgery
Surgical options for the treatment of uterine fibroids include hysterectomy and myomectomy. Hysterectomy is a surgical procedure which involves the complete removal of uterus with or without removal of the cervix, ovaries and fallopian tubes. Hysterectomy can be performed abdominally in an open, laparoscopic, robotic-assisted or vaginal method. Surgical options are associated with blood loss, hospital stays, long recovery times, pain and scarring. Post-operative complications can include infections, urinary incontinence, vaginal prolapse, fistula formation and chronic pain. After a hysterectomy, a woman will enter menopause and is infertile. Myomectomy is a surgical procedure to remove uterine fibroids from the wall of the uterus. The procedure can be performed with an abdominal incision, laparoscopic, or hysteroscopic.
We believe that use of the Sonalleve system as a tool to ablate uterine fibroids can provide a clinician and his or her patients with the following clinical advantages:
| · | Millimeter accuracy designed to ablate uterine fibroid while sparing nearby critical structures; |
| · | Outpatient procedure with rapid recovery time, not requiring general anesthesia; and |
| · | Non-invasive approach using thermal ablation designed to heat the uterine fibroid; and guided by real-time MRI with temperature (thermometry) feedback. |
Alliances and Partnerships
Philips
On July 31, 2017, we entered into the Philips Share Purchase Agreement with Philips in order to expand the existing collaboration and acquire the Sonalleve technology, which we use in our Sonalleve system (the “Sonalleve Transaction”).
Under the terms of the Philips Share Purchase Agreement, we acquired from Philips its Sonalleve assets for upfront consideration of 7,400,000 Common Shares. The Philips Share Purchase Agreement includes earn-out provisions that require us to pay additional consideration of: (i) 5% of Net Sales (as defined below) occurring after July 31, 2017 for the calendar year 2017; (ii) 6% of Net Sales occurring in the calendar year 2018; and (iii) 7% of Net Sales occurring in the calendar years 2019 and 2020. To the extent that the cumulative Net Sales for the full calendar years 2017 through 2020 exceeds €45,300,000, we will be required to pay an additional earn-out equal to 7% of Net Sales for the period beginning after July 31, 2017 through December 31, 2019. To date, we have paid €99,059 (C$147,469) as part of the earn-out provision, including €80,771 (C$121,157) for the year ended December 31, 2018.
“Net Sales” include the revenues (less any royalties) received by us or third parties on our behalf in respect of the sale or transfer of the Sonalleve technology, any subsequent, successor or next-generation treatment technology of which is primarily based on Sonalleve and which utilizes intellectual property rights acquired under the Philips Share Purchase Agreement or any future product that combines the technologies of Sonalleve and TULSA-PRO and any amounts received by us with respect to service agreements, but does not include any revenues with respect to consumables.
As part of the Sonalleve Transaction, we expanded our non-exclusive strategic sales relationship with Philips for our TULSA-PRO system to include distribution of Sonalleve.
We have also entered into several other agreements with Philips, including (1) the Philips Supply Agreement pursuant to which Philips is required to manufacture our Sonalleve systems for a certain period, (2) the Philips Confidentiality Agreement in which Philips agreed to certain non-competition terms, and (3) a Philips Resale Purchasing Agreement, in which Philips is permitted to purchase and resell certain of our products to its customers. For more details on these agreements, see Item 10.C, “Additional Information—Material Contracts”.
Siemens
On February 26, 2016, we entered into a strategic collaboration agreement with Siemens (the “Original Siemens Agreement”), aimed at advancing the commercial launch of our TULSA-PRO system in approved jurisdictions. As of April 1, 2018, our TULSA-PRO systems are marketed by Siemens through its electronic catalog.
On February 11, 2019, we entered into the New Siemens Agreement, effective as of January 21, 2019, which replaced the Original Siemens Agreement. Under the New Siemens Agreement, all prior financial commitments and obligations owed to Siemens were released and replaced with a one-time fixed license fee and per annum payments calculated based on annual volume of our systems interfaced to a Siemens MRI scanner. The initial term of the New Siemens Agreement is five years, but will be automatically extended for successive terms of one year thereafter unless terminated earlier. We also obtained a non-exclusive license to Siemens Access I interface software and reasonable support for the term of the New Siemens Agreement.
Knight
Knight acts as our exclusive distributor for TULSA-PRO in Canada pursuant to a 10-year distribution, license and supply agreement initially entered into in April 2015 (which may be extended for successive 10-year periods at the option of either party). Currently, we are not planning any significant commercialization efforts in Canada.
Manufacturing and Supply
We rely principally on third parties for the manufacturing of the components of our system; however, we are responsible for assembly and testing.
We have designed the TULSA-PRO system to be capable of integration with some of the MRI scanners from two of the major MRI manufacturers (Philips and Siemens) and the Sonalleve system with one MRI manufacturer (Philips). As not all hospital and treatment facilities utilize MRI scanners that are compatible with the TULSA-PRO and Sonalleve systems, such facilities would be required to acquire compatible MRI technology, which may involve additional capital expenditure and which could restrict or delay utilization of the systems by such facilities. Accordingly, we intend to expand compatibility of the systems with other MRI scanners in the future.
Our systems are assembled from off-the-shelf and custom-made components. We have entered into and expect to enter into additional manufacturing, licensing and distribution arrangements with one or more QSR compliant and FDA registered contract manufacturers for the materials and components used in our products. The TULSA-PRO and Sonalleve systems consist of common electronic components, proprietary capital equipment and proprietary disposables. We purchase standard electronic components from a number of third party vendors. The capital equipment consists of custom system electronics, treatment delivery console, fluid circuits and an MRI compatible robotic positioning system. Printed circuit boards and assemblies and custom mechanical parts are outsourced to approved suppliers. TULSA-PRO disposables consist of the UA, an endo-rectal cooling device and associated accessories. Due to sterility requirements used in connection with the TULSA-PRO system, the UA must be manufactured under clean conditions. We have developed proprietary automated manufacturing test equipment to improve quality and provide scalability as demand grows and this equipment is assembled and tested in-house. We assemble and test the UA and endo-rectal cooling device in-house.
We have no long-term contracts with our suppliers, and we are not bound by any minimum purchase volume undertakings with such suppliers.
We currently rely on single source suppliers for certain components used in our systems. In connection with our anticipated commercialization of our approved products, we intend to procure alternative supply arrangements for these components. See Item 3.D, “Risk Factors—Risk Factors Relating to Our Business and Growth Strategy—We depend on single-source suppliers for some of the components in our systems.”
Regulation
On August 15, 2019, we obtained 510(k) clearance for commercial sale of the TULSA-PRO as a Class II device in the United States, and have previously received a CE Certificate of Conformity for our products in European Union, and have recently obtained regulatory approval for Sonalleve in China. Additionally, the TULSA-PRO system has received regulatory clearances or approvals for commercial sale in Saudi Arabia, Singapore and China, while the Sonalleve system has received regulatory clearance or approval for commercial sale in Canada, Saudi Arabia, South Korea and Malaysia. Our long-term goal is to expand our regulatory indications in Asia and other parts of the world where potential profitable business development opportunities warrant such investments.
United States
The FDA strictly regulates medical devices under the authority of the FFDCA and the regulations promulgated under the FFDCA. The FFDCA and the implementing regulations govern, among other things, the following related to our products: preclinical and clinical testing, design, manufacture, safety, efficacy, labeling, storage, record keeping, sales and distribution, importation, post-market adverse event reporting, recalls, and advertising and promotion.
The TULSA-PRO system, and any future medical devices that we may develop, will be classified by the FDA under the statutory framework described in the FFDCA. Medical devices are classified into three classes from lowest risk (Class I) to highest risk (Class III). Unless an exemption applies, medical devices require FDA clearance or approval prior to commercial sale in the United States depending on the assigned risk class. Most Class I devices and some Class II devices are exempt from premarket review requirements. Class I devices are subject to the “general controls” of the FFDCA, which include facility registration and device listing, quality system requirements, labeling requirements, medical device reporting, and reporting of corrections and removals. Most Class II devices and some Class I devices require FDA clearance of a 510(k) premarket notification prior to marketing. A 510(k) premarket notification must demonstrate that the device is substantially equivalent to a previously marketed predicate device. In addition to the general controls, Class II devices are subject to “special controls,” such as performance standards and guidance documents, as identified in the classification regulation for the device type. Class III devices require FDA approval of a premarket approval application, or PMA, demonstrating the safety and effectiveness of the device, prior to commercial distribution. Class III devices are those deemed by the FDA to pose the greatest risk, such as life-sustaining, life-supporting or implantable devices. Class III devices are subject to the general controls and any conditions of approval in the PMA approval order, which can include postmarket study requirements. Novel devices that have not been classified and devices deemed not substantially equivalent to a predicate device are automatically classified into Class III. For such low- to moderate-risk devices, the manufacturer can submit a de novo classification request to classify the device into Class I or Class II. 510(k) premarket notifications, de novo classification requests, and PMA applications are subject to the payment of user fees paid at the time of submission for FDA review.
Clinical trials are generally required to support a PMA application and are sometimes required for 510(k) clearance or de novo classification requests. Such trials, if conducted in the United States, generally require an IDE application, approved in advance by the FDA for a specified number of patients and study sites, unless the product is deemed a non-significant risk device eligible for more abbreviated IDE requirements or an exemption applies. Clinical trials are subject to extensive monitoring, recordkeeping and reporting requirements as well as a requirement to submit information regarding certain clinical trials to a public database maintained by the National Institutes of Health. Clinical trials must be conducted under the oversight of an IRB, for the relevant clinical trial sites and must comply with FDA regulations, including but not limited to those relating to good clinical practices and informed consent.
After a device is placed on the market, numerous regulatory requirements apply. Device manufacturers and importers must register their establishments annually, list the devices they manufacturer and pay an annual registration fee. Device manufacturers are also subject to the QSR, which includes both design control requirements and good manufacturing practice requirements (such as requirements for purchasing controls, document controls, production and process controls, labeling and packaging controls, control of nonconforming product, complaint handling, corrective and preventative actions, storage, handling, distribution, and servicing). Devices must be labeled in accordance with the FDA’s device labeling regulations, including Unique Device Identification requirements. The FDA also regulates the promotion of medical devices, including a requirement that all device promotion be truthful and non-misleading and a prohibition against the promotion of devices for uncleared, unapproved or off-label use or indications. Under the medical device reporting regulations, manufacturers and initial importers must submit a report to the FDA if they become aware of information that reasonably suggests that one of their marketed devices may have caused or contributed to a death or serious injury or malfunctioned and the malfunction would be likely to cause or contribute to a death or serious injury if it were to recur. Manufacturers must also report any corrections or removals that include repairs, adjustments, relabeling, or destruction of distributed devices, if the correction or removal was initiated to reduce a risk to health or to remedy a violation of the FFDCA caused by the device which may present a risk to health.
The FDA has broad enforcement authority to take action against a failure to comply with the clinical trial, premarket review, or postmarket regulatory requirements discussed above and the agency conducts routine inspections of device manufacturers to determine compliance with these requirements. FDA enforcement typically takes the form of inspectional observations at the close of inspection, an Untitled Letter (a private letter raising compliance questions), or a Warning Letter (a public letter alleging noncompliance). However, the FDA has authority to take additional enforcement actions including: civil monetary penalties, criminal fines and prosecution, injunctions, mandatory recall, and import detentions.
European Union
In the European Union, legal manufacturers of medical devices, such as the TULSA-PRO and Sonalleve systems, are required to comply with the Essential Requirements laid down in Annex I to the Council Directive 93/42/EEC concerning medical devices, known as the Medical Devices Directive (“MDD”). Active implantable medical devices and in-vitro diagnostic medical devices are regulated in separate EC directives. Compliance with these requirements entitles us to affix the CE Mark to our medical devices, without which they cannot be commercialized in the European Union. To demonstrate compliance with the Essential Requirements and obtain the right to affix the CE Mark to our medical devices, we must undergo a conformity assessment procedure, which varies according to the type of medical device and its classification. The MDD provides for four different classifications of medical devices based on their risk: Class I, Class IIa, Class IIb and Class III. Except for low risk medical devices (Class I with no measuring function and which are not sterile), in relation to which the manufacturer may prepare an EC Declaration of Conformity based on a self-assessment of the conformity of its products with the Essential Requirements, a conformity assessment procedure requires the intervention of a Notified Body. A Notified Body is a private body or company designated by the competent authorities of a European Union Member State to conduct conformity assessments and to execute the provisions of the MDD (as implemented in the respective national legal system) in the interest of public health. Depending on the device’s risk category/class, the conformity assessment of the Notified Body extends to the quality assurance system established by the manufacturer and/or the product design, as well as to the Technical Documentation to be compiled by the manufacturer for each device.
As part of the conformity assessment process, medical device manufacturers must carry out a clinical evaluation of their medical devices to verify that they comply with the relevant Essential Requirements covering safety and performance. A clinical evaluation is defined as a “methodologically sound ongoing procedure to collect, appraise and analyze clinical data pertaining to a medical device and to evaluate whether there is sufficient clinical evidence to confirm compliance with relevant essential requirements for safety and performance when using the device according to the manufacturer’s Instructions for Use”. A clinical evaluation must address the intended purpose of the device, clinical performance, benefits that outweigh associated risks and the usability of the device.
This assessment must be based on clinical data (Annex X of the MDD), which can be obtained from (i) clinical studies conducted on the devices being assessed; (ii) scientific literature from similar devices whose equivalence with the assessed device can be demonstrated; or (iii) both clinical studies and scientific literature. As part of the conformity assessment procedure, depending on the type of devices, the Notified Body will review the manufacturer’s clinical evaluation for the medical device.
If the Notified Body finds, as a result of its conformity assessment, that the quality assurance system and/or the product design is compliant with the applicable legal provisions, it issues a CE Certificate of Conformity, which is valid for a maximum of five (5) years. On the basis of these Notified Body CE Certificates of Conformity, the manufacturer is able to draw up an EC Declaration of Conformity and affix the CE Mark to the relevant device, followed by the ID number of the Notified Body. The CE mark allows the device to be placed on the market throughout the EU and the European Economic Area (“EEA”), as well as in Switzerland and Turkey based on bi-lateral treaties.
The Notified Body is obliged to perform regular audits and, before the expiry date of a certificate of conformity, renewal audits at the manufacturer’s site upon prior notification. In addition to these notified audits, on the basis of a Commission Recommendation of 2012, the EU member states were advised by the European Commission to conduct unannounced audits (including testing of product samples) on a regular basis.
If the requirements for application of the CE mark are not (or no longer) fulfilled, or in other cases of non-compliance with applicable medical devices law:
| · | the Notified Body has the power to withdraw, suspend or limit the scope of the applicable certificate of conformity, in accordance with the principle of proportionality; |
| · | the competent supervisory authority of the EU member state may enforce the provisions of the MDD, e.g. by preventing the product from being put on the market, ordering a recall or shutting down a manufacturing site; |
| · | criminal or administrative sanctions (e.g. fines) may apply. |
In the European Union, we must establish a medical device vigilance system, including post-marketing surveillance and adverse event reporting procedures. Under this system, incidents occurring in the EU that might lead to or might have led to the death of a patient or user or of other persons or to a serious deterioration in their state of health must be reported to the relevant authorities of the European Union Member States. Manufacturers are required to take FSCAs, including product recalls and withdrawals, to reduce a risk of death or serious deterioration in the state of health associated with the use of a medical device that is already placed on the market. Manufacturers have to appoint a safety officer having the necessary professional qualifications to fulfil the reporting requirements and to coordinate the necessary actions. For class I devices and certain other devices, the manufacturer of the device or its authorized representative in the EU, must also register with the competent authority before placing the product on the market in the EU.
The advertising and promotion of our products in the European Union is subject to the provisions of the Medical Devices Directive, Directive 2006/114/EC concerning misleading and comparative advertising, and Directive 2005/29/EC on unfair commercial practices, as well as other national legislation in the individual European Union Member States governing the advertising and promotion of medical devices. These laws may limit or restrict the advertising and promotion of our products to the public and may impose limitations on our promotional activities with healthcare professionals. In Germany, a company which advises healthcare professionals on the handling and use of medical devices – as may be the case for the TULSA-PRO and Sonalleve devices – has to appoint a “medical devices advisor” (Medizinprodukteberater) with appropriate qualification and professional experience as set out in the German Medical Devices Act (Medizinproduktegesetz).
On April 5, 2017, the EU adopted a new Medical Devices Regulation (EU) 2017/745 (the “New EU MDR”), which will repeal and replace the Medical Device Directive effective May 26, 2020. The New EU MDR does not set out a substantially different regulatory system, but clearly envisages, among other things, stricter controls of medical devices, including strengthening of the conformity assessment procedures, increased expectations as regards clinical data for devices and pre-market regulatory review of high-risk devices. The New EU MDR also envisages greater control over Notified Bodies and their standards, increased transparency through the establishment of a comprehensive EU database on medical devices, more robust device vigilance requirements and clarification of the rules for clinical investigations. Further, new classification rules apply. Under transitional provisions, medical devices with notified body certificates issued under the Medical Devices Directive prior to May 25, 2017 may continue to be placed on the market for the remaining validity of the certificate. Certificates of conformity issued by Notified Bodies in accordance with the MDD after May 25, 2017 and prior to May 26, 2020 will remain valid until the end of the period indicated on the certificate, but will expire on May 26, 2024 at the latest, except for certificates issued in accordance with Annex IV to Directive 90/385/EEC or Annex IV to the MDD which shall become void at the latest on May 27, 2022. After the expiry of any applicable transitional period, only devices that have been CE marked under the New EU MDR may be placed on the market in the EU.
Canada
Health Canada’s Therapeutic Products Directorate (“TPD”) is the Canadian authority that regulates medical devices. In general, prior to being given market authorization to sell a Class II, III or IV medical device in Canada, a manufacturer must present and/or attest to substantive scientific evidence of a product’s safety, efficacy and quality as required by the Food and Drugs Act and the Medical Devices Regulations (“Canada MDR”).
The Medical Devices Bureau (“MDB”) of the TPD applies the Canada MDR through a combination of pre-market review, post-approval surveillance and quality systems in the manufacturing process. Medical devices are classified into one of four classes, where Class I represents the lowest risk and Class IV represents the highest risk. In order to perform investigational testing in Canada for a Class II, III or IV medical device, authorization for the testing must be granted by the MDB. A Medical Device License is a pre-market requirement for a Class II, III and IV medical device, including for Class II, III or IV medical devices previously authorized for sale for investigational testing now to be offered for general/commercial sale. A Medical Device License is issued to the device manufacturer, provided the requirements of the Canada MDR are met.
The Canada MDR requires that medical devices be manufactured under a certified QMS that meets the criteria of the international standard, ISO 13485 Medical devices – Quality management systems – Requirements for regulatory purposes. The MDB currently recognizes the Medical Device Single Audit Program, a program designed to include compliance with the QMS requirements of the Canada MDR. We are manufacturing the TULSA-PRO system under a certified ISO 13485 Quality Management System.
Our Current Regulatory Status
TULSA-PRO
On August 15, 2019, we received 510(k) clearance for commercial sales of the TULSA-PRO as a Class II device in the United States for transurethral ultrasound ablation (“TULSA”) of prostate tissue, and in April 2016 the TULSA-PRO system was CE marked in the European Union for ablation of targeted prostate tissue (benign or malignant). Outside of these jurisdictions, the TULSA-PRO system will require country-specific pre-market clearance or approval prior to launch.
Upon completion of our Phase I safety and feasibility study for TULSA-PRO in April 2016, we were granted CE Mark approval for the commercial sale of the TULSA-PRO system in Europe and in other CE Mark jurisdictions.
In August 2016, we initiated TACT Pivotal Clinical Trial, which the FDA approved under an IDE application. The TACT Pivotal Clinical Trial was designed to support a 510(k) premarket notification submission in the United States. This submission was made in May 2019 in support of clearance of the TULSA-PRO system by the FDA for use in the ablation of prostate tissue in the United States.
In Canada, we are currently manufacturing the TULSA-PRO system under a certified ISO 13485 Quality Management System. However, on October 26, 2017, Health Canada refused Medical Device License approval of TULSA-PRO requiring further clinical evidence beyond the Phase I data. We are in the process of evaluating the additional requirements with Health Canada, however, the Canadian market is not considered a lower priority from a commercialization strategy perspective in light of its relatively small size.
Sonalleve
The Sonalleve applications to treat uterine fibroids and bone metastasis are CE marked and available in the European Union and its member states. The uterine fibroids application is also available for sale in Canada. Philips Oy had registered Sonalleve in several Middle East, North African, and South Asian countries. We are in the process of transferring existing regulatory registrations of Sonalleve from Philips Oy to us. We are also in the process of assessing current clinical research network activities and the investigator lead studies in the United States to form regulatory strategies for several potential indications.
In 2018, Sonalleve was also approved in China by the NMPA for the non-invasive treatment of uterine fibroids.
Reimbursement
Our ability to successfully commercialize our products depends in large part on the extent to which coverage and reimbursement for such products and related treatments or procedures will be available from government health administration authorities, government and private health insurers, and other organizations or third-party payers. Pricing and reimbursement procedures and decisions vary from country to country. Many government health authorities and private payers condition payment on the cost-effectiveness of the product. Even if a device is CE marked or has received regulatory clearance or approval, there is no guarantee that third party payers will reimburse providers or patients for the cost of the device and related procedures or that the amount of such reimbursement will be adequate to cover the cost of the device. The availability of adequate coverage and reimbursement to hospitals and clinicians using our products therefore is critical to our ability to generate revenue.
Although we expect there to be an out-of-pocket market for our approved products, an out-of-pocket market alone is unlikely to be sufficient to support successful commercialization of our products. To date, our products do not have significant coverage or reimbursement from government or third-party payers in the jurisdictions where they are approved. For more information, see Item 3.D, “Risk Factors—Risks Related to Our Business and Growth Strategy—Successful commercialization of our approved products will also depend on the cost of the system and the availability of coverage and adequate reimbursement from third-party payers.”
We plan to pursue reimbursement for our products in these and other key markets where we have regulatory approvals.
Intellectual Property
Our intellectual property is comprised of a broad and world-wide portfolio of patents, patent applications, trademarks, copyrights, trade secrets and other proprietary assets. Our intellectual property portfolio is both growing and dynamic and includes approximately 38 patent families representing approximately 120 granted or allowed patents and 58 patent applications in various stages of review and prosecution around the world.
Many of our patents and patent applications claim electronic and mechanical aspects of hardware, software and methods related to ultrasonic ablation of tissue. The intellectual property assets are largely directed to (i) using real time MRI imaging as a tool to plan, monitor or control said ultrasonic ablation; (ii) MRI thermometry methods, especially in respect of our ultrasound therapy processes and devices; (iii) the phasing, beam-forming, and control of acoustic arrays and similar energy sources; (iv) computational method to improve filtering, imaging and analyzing the results of MRI-guided thermal therapy processes; and (v) secondary and support systems such as active cooling of near-target tissues. The portfolio covers both the “TULSA” and the “Sonalleve” families of products, as well as generic technologies and applications and extensions of our products.
We believe that the protection of our intellectual property is an essential element of our business and we intend to continue our investment in the development of our intellectual property portfolio. We have worked over the past year to pursue, maintain and expand on the intellectual property portfolio acquired from Philips in 2017. This intellectual property has been strengthened and extended to many jurisdictions around the globe in support of our sales, development and marketing efforts.
We pursue a global intellectual property strategy, registering for patent protection in all jurisdictions where we intend to carry on business, including the United States, Canada, Japan, major European markets (e.g., Germany, France, U.K., Italy, Spain and Turkey) and the emerging markets (e.g., Brazil, Russia, India, and China).
We also rely upon trade secrets, know-how and other proprietary, confidential information for the protection of our technology. We require all employees, consultants, scientific advisors and other contractors to enter into confidentiality agreements to protect against the disclosure of such proprietary information. Each inventor is required to execute a formal assignment specific to each invention that he or she has listed, and which is officially recorded in the proper patent office.
Licenses
In addition to developing our own intellectual property portfolio, we have licensed and acquired intellectual property rights from third parties through exclusive licenses, collaborative research and asset purchase agreements. Material license agreements include an exclusive license with Sunnybrook entered into on May 16, 2011 (the “Sunnybrook License”). Under the Sunnybrook License, Sunnybrook granted us an exclusive worldwide and royalty-free right to use certain defined Sunnybrook technology in connection with, among other things, manufacturing, marketing and selling products such as the TULSA-PRO system, in the field of MRI-guided transurethral ultrasound therapy. Under the license, we are subject to various obligations, including a milestone payment of C$250,000 that was paid in connection with our recent FDA clearance of TULSA-PRO. In addition, we are required to pay legal costs associated with patent application preparation, filing and maintenance. If either party to the Sunnybrook License breaches or fails to perform a material obligation and fails to cure such breach or perform such obligations within a 30 day cure period, the non-breaching party may terminate the agreement. Material obligations include our agreement not to use the technology or intellectual property outside of the license scope, not to use the technology or intellectual property outside the field of MRI-guided transurethral ultrasound therapy (or permitting our customers to do so) and not to breach confidentiality obligations.
C. Organizational Structure
For the organizational structure of our company, see Item 4.A, “History and Development of the Company—Summary Corporate History and Intercorporate Relationships—Intercorporate Relationships”.
D. Property, Plants and Equipment
We operate from leased premises in three different locations. We do not own any real estate property.
| Location | | Area | | Premise Use | | Expiry Date |
| 2400 Skymark Ave, Unit 6, Mississauga, ON, Canada | | 38,148 ft2 | | Corporate offices and administration, Manufacturing, Research and Development | | September 30, 2026 |
| Äyritie 4B, 01510 Vantaa, Finland | | 6,372 ft2 | | Manufacturing, Research and Development | | December 31, 2021 |
| Kehrwieder 9, 20457 Hamburg, Germany | | 162 ft2 | | Sales and Marketing | | month to month |
We assemble and test TULSA-PRO and Sonalleve systems at dedicated manufacturing facilities located in Canada and Finland which are ISO 13485 certified. Our manufacturing model consists primarily of outsourcing manufacturing of the components of our systems where it is most cost effective to do so, while assembling and quality testing the final products in-house. Additionally, single use products are assembled entirely in the Mississauga facility within a class 300 clean room which became operational in August 2017. Our manufacturing facilities have sufficient capacity to meet our manufacturing needs through the foreseeable future.
ITEM 4A UNRESOLVED STAFF COMMENTS
Not applicable.
ITEM 5. OPERATING AND FINANCIAL REVIEW AND PROSPECTS
A. Operating Results
The following discussion and analysis of our financial condition and results of operations should be read in conjunction with our interim unaudited financial statements as at and for the three and six months ended June 30, 2019 and 2018 and our audited financial statements as at and for the fiscal years ended December 31, 2018, 2017 and 2016 in each case, together with the notes thereto. The financial information contained in this Registration Statement is derived from the financial statements prepared in accordance with IFRS.
Overview
We are an early commercial-stage medical device company focused on the development and marketing of customizable, incision-free therapeutic systems for the ablation of diseased tissue using our platform technology. Our leading approved product is our TULSA-PRO system, which in August 2019 received FDA clearance as a Class II device in the United States for thermal ablation of prescribed prostate tissue, benign and malignant, using transurethral ultrasound ablation (“TULSA”) based on our TACT Pivotal Clinical Trial, and is also CE marked in the European Union for ablation of targeted prostate tissue (benign or malignant). In addition, our Sonalleve system is CE marked in the EU for the treatment of uterine fibroids and palliative pain relief associated with metastases in bone, and is also approved in China for the treatment of non-invasive treatment of uterine fibroids. Our systems are designed to be used with MRI scanners and are currently compatible with MRI scanners manufactured by Philips and Siemens. To date, we have primarily generated revenues from our limited commercialization of our systems in the EU (principally in Germany) and Asia. We intend to commence commercialization of the TULSA-PRO system in the United States in the near term following our recent FDA clearance. We also continue to pursue additional regulatory approvals, research and development, clinical studies and acquisitions in order to expand the applications of our platform technology and expand our commercial footprint.
Our financial strategy to date has been to raise sufficient funds through securities offerings and bank financings in order to fund specific programs within a focused budget, and following FDA clearance of our TULSA-PRO system that we received in August 2019, commercialization in the United States. As our commercialization efforts increase and/or further program development costs increase, we may need to raise additional capital. See Item 3.D, “Risk Factors” and Item 5.B, “Liquidity and Capital Resources” for more information.
Trend Information and Outlook
We believe the following significant trends and uncertainties are likely to influence our results of operations, cash flows and/or financial condition in the future:
| · | We have recently obtained FDA clearance for the TULSA-PRO system in the United States, and expect to commence commercialization in the United States in the near team. |
| · | We plan to increase our in-house sales and marketing capabilities to commercialize the TULSA-PRO system in the United States, which we expect will increase our expenses in the near term. |
| · | We are pursuing increased compatibility of our systems, including the TULSA-PRO system, with additional MRI scanners, and we may also pursue additional distribution relationships to facilitate our U.S. commercialization efforts; these efforts may require significant management time and could result in increased expenses. |
| · | We are also pursuing reimbursement coverage for the TULSA-PRO system by third-party payers, such as private insurance plans offered by medical insurance companies; the amount of such coverage or reimbursement, however, is uncertain, as we may be required to conduct additional research and clinical trials. |
| · | We estimate that our general and administrative expenses will increase in the near term, primarily due to the continued expansion of our management team as well as compliance costs associated with becoming subject to reporting and other requirements under applicable U.S. securities laws and Nasdaq rules. |
| · | We also estimate that the costs for further developing our products and future product candidates based on our platform technology may increase in future years. |
Our ability to achieve our commercialization goals, continue our growth and achieve profitability depends, in part, on the level of market acceptance of our products (in particular, the TULSA-PRO system in the United States), as well as the success of our efforts to increase our U.S. sales and marketing capabilities, increase compatibility of our systems with additional MRI scanners and procure reimbursement coverage, and also depends on changes in trends in the standard of care for the patient populations in which our products are indicated for use. In addition, our results may be adversely affected if, among other things, there is an economic slowdown or future clinical trial results are adverse.
While we believe that some of the trends and plans described above will present significant opportunities for us, they also pose significant challenges, uncertainties and risks, including those described under Item 3.D, “Risk Factors” above.
Results of Operations
The following selected financial information as at and for the three and six month periods ended June 30, 2019 and 2018, and selected financial information as at and for the years ended December 31, 2018, 2017 and 2016, have been derived from the interim unaudited financial statements and from the annual audited financial statements, respectively, included elsewhere in this Registration Statement, and should be read in conjunction with those respective financial statements and the related notes thereto.
| | | Three Months
Ended June 30, | | | Six Months
Ended June 30, | | | Year Ended
December 31, | |
| | | 2019 | | | 2018 | | | 2019 | | | 2018 | | | 2018 | | | 2017 | | | 2016 | |
| | | C$ | | | C$ | | | C$ | | | C$ | | | C$ | |
| Revenue | | | 574,109 | | | | 213,343 | | | | 2,049,897 | | | | 589,678 | | | | 2,602,278 | | | | 4,904,550 | | | | - | |
| Cost of sales | | | 224,066 | | | | 126,259 | | | | 777,422 | | | | 357,334 | | | | 1,778,501 | | | | 3,032,208 | | | | - | |
| Gross profit | | | 330,043 | | | | 87,084 | | | | 1,272,475 | | | | 232,344 | | | | 823,777 | | | | 1,872,342 | | | | - | |
| | | | | | | | | | | | | | | | | | | | | | | | | | | | | |
| Operating Expenses | | | | | | | | | | | | | | | | | | | | | | | | | | | | |
| Research and development - net of investment tax credits | | | 3,186,355 | | | | 2,347,909 | | | | 5,864,101 | | | | 4,864,690 | | | | 10,265,388 | | | | 9,638,190 | | | | 9,988,693 | |
| General and administrative | | | 1,586,323 | | | | 2,236,529 | | | | 3,100,436 | | | | 3,539,733 | | | | 6,656,723 | | | | 5,935,215 | | | | 4,369,288 | |
| Selling and distribution | | | 1,154,869 | | | | 1,113,225 | | | | 625,524 | | | | 2,060,127 | | | | 4,091,347 | | | | 3,925,804 | | | | 1,282,433 | |
| Total operating expenses | | | 5,927,547 | | | | 5,697,663 | | | | 9,590,061 | | | | 10,464,550 | | | | 21,013,458 | | | | 19,499,209 | | | | 15,640,414 | |
| | | | | | | | | | | | | | | | | | | | | | | | | | | | | |
| Finance costs | | | 337,220 | | | | 313,606 | | | | 651,905 | | | | 633,569 | | | | 826,312 | | | | 1,249,084 | | | | 829,899 | |
| Finance income | | | (110,790 | ) | | | (117,357 | ) | | | (252,671 | ) | | | (157,161 | ) | | | (483,788 | ) | | | (127,732 | ) | | | (157,598 | ) |
| Net finance costs | | | 226,430 | | | | 196,249 | | | | 399,234 | | | | 476,408 | | | | 342,524 | | | | 1,121,352 | | | | 672,301 | |
| | | | | | | | | | | | | | | | | | | | | | | | | | | | | |
| Loss before income taxes | | | 5,823,934 | | | | 5,806,828 | | | | 8,716,820 | | | | 10,708,614 | | | | 20,532,205 | | | | 18,748,219 | | | | 16,312,715 | |
| Income tax expense | | | 20,200 | | | | 24,200 | | | | 54,000 | | | | 60,600 | | | | 230,784 | | | | 74,123 | | | | 14,054 | |
| | | | | | | | | | | | | | | | | | | | | | | | | | | | | |
| Net loss attributable to shareholders for the period | | | 5,844,134 | | | | 5,831,028 | | | | 8,770,820 | | | | 10,769,214 | | | | 20,762,989 | | | | 18,822,342 | | | | 16,326,769 | |
| | | | | | | | | | | | | | | | | | | | | | | | | | | | | |
| Other comprehensive loss | | | | | | | | | | | | | | | | | | | | | | | | | | | | |
| Item that may be reclassified to profit or loss | | | | | | | | | | | | | | | | | | | | | | | | | | | | |
| Foreign currency translation adjustment - net of tax | | | (11,843 | ) | | | 57,943 | | | | (58,232 | ) | | | 14,695 | | | | 29,226 | | | | (69,245 | ) | | | 11,316 | |
| | | | | | | | | | | | | | | | | | | | | | | | | | | | | |
| Net loss and comprehensive loss for the period | | | 5,832,291 | | | | 5,888,971 | | | | 8,712,588 | | | | 10,783,909 | | | | 20,792,215 | | | | 18,753,097 | | | | 16,338,085 | |
| | | | | | | | | | | | | | | | | | | | | | | | | | | | | |
| Basic and diluted net loss per common share | | | 0.05 | | | | 0.05 | | | | 0.08 | | | | 0.12 | | | | 0.21 | | | | 0.31 | | | | 0.39 | |
Financial Overview
Revenue
For the TULSA-PRO system, we generate revenue from the sale of the capital equipment, procedure-related sales of disposable single-use components of the system (which are sold on a per patient basis), and service revenue for ongoing maintenance of the systems. Sales of Sonalleve systems are primarily a one-time capital sale with limited recurring service revenue.
For the historical financial periods presented herein, we have generated revenues primarily from sales of our systems and disposables through our partnerships with Siemens and Philips in the EU and Asia. In August 2019, we received FDA clearance for our TULSA-PRO system in the United States, and accordingly we anticipate generating future revenues in the U.S. market. As we expand our commercialization efforts, we anticipate generating revenues through our in-house sales and marketing efforts, as well as from our collaborative partnerships.
In addition, because we have been in our pilot sales launch phase, our revenues for the historical periods presented herein have fluctuated significantly on a quarter-over-quarter and year-over-year basis. We expect that our revenues will likewise fluctuate from period-to-period in the near term as we pursue our commercialization strategy.
Cost of Sales
Cost of sales include cost of finished goods, inventory provisions, warranties, freight and direct overhead expenses. We expect cost of sales to increase or decrease corresponding with fluctuations in our revenues.
Operating Expenses
Our operating expenses consist of three components: research and development (“R&D”), general and administrative (“G&A”) and selling, marketing and distribution expenses. Historically, our R&D expenses have exceeded our selling, marketing and distribution expenses; however, in the future we expect our selling, marketing and distribution expenses to increase as we commercialize the TULSA-PRO system in the United States.
R&D Expenses
Our R&D expenses are comprised of costs incurred in performing R&D activities, including new product development, continuous product improvement, investment in clinical trials and related clinical manufacturing costs, materials and supplies, salaries and benefits, contract research costs, patent procurement costs, and occupancy costs related to R&D activity.
G&A Expenses
Our G&A expenses are comprised of management costs, including salaries and benefits, various management and administrative support functions, insurance and other operating and occupancy costs related to G&A activity.
Selling, Marketing and Distribution Expenses
Our selling, marketing and distribution expenses are comprised of business development costs related to the market development activities and commercialization of our systems, including salaries and benefits, marketing support functions, marketing-related occupancy costs and other miscellaneous marketing costs.
Finance Costs
Finance costs are primarily comprised of interest and accretion expenses, among others, historically relating to the following: (i) the Federal Economic Development Agency Loan accreting to the principal amount repayable; (ii) the Health Technology Exchange Loan accreting to the principal amount repayable and its related interest expense; (iii) the Knight Loan accreting to the principal amount repayable and its related interest expense; (iv) the 0.5% royalty liability to Knight accreting to the estimated amount payable; (v) the change in fair value of the contingent consideration payable to Philips under the Philips Share Purchase Agreement; (vi) the CIBC Loan accreting to the principal amount repayable and its related interest expense; (vii) the change in the fair value of the derivative liability warrants; (viii) the lease liability interest expense related to the adoption of IFRS 16 and (ix) foreign exchange gains or losses. We repaid the Health Technology Exchange Loan on March 31, 2019 and each of the Federal Economic Development Agency Loan and the Knight Loan on July 25, 2018, and the Knight royalty terminated on May 20, 2019.
Comparison of the Three and Six Months Ended June 30, 2019 to the Three and Six Months Ended June 30, 2018
Revenue
For the three months ended June 30, 2019, we recorded revenue totaling C$574,109 with C$465,840 from the sale of products and C$108,269 from installation and training services related to the commercial sales of the systems and disposables, primarily in the European Union. For the three months ended June 30, 2018, we recorded revenue totaling C$213,343, with C$170,931 from sale of products and C$42,412 from installation and training services. The increase in revenue in the second quarter of 2019 over the second quarter of 2018 was the result of increased system and disposable sales as well as increased service contracts. However, our revenues in the second quarter of 2019 were lower than in the first quarter of 2019 and the fourth quarter of 2018 because of decreased system and disposable sales due to fluctuating revenues in our early pilot launch phase. See “—Quarterly Results of Operations” below.
For the six months ended June 30, 2019, we recorded revenue totaling C$2,049,897, with C$1,813,621 from the sale of products and C$236,276 from installation and training services related to the commercial sales of the systems and disposables, primarily in the European Union. For the six months ended June 30, 2018, we recorded revenue totaling C$589,678, with C$543,425 from the sale of products and C$46,253 from installation and training services. The increase in revenue in the six months ended June 30, 2019 was the result of increased system and disposable sales as well as increased service contracts.
Cost of Sales
For the three months ended June 30, 2019, we recorded a cost of sales of C$244,066 related to the sale of systems and disposables, which reflects a 58% gross margin. For the three months ended June 30, 2018, we recorded a cost of sales of C$126,259 related to the commercial sale of systems and disposables, which reflects a 41% gross margin. The gross margin was higher in the second quarter of 2019 due to increased disposable and service revenue, which have higher margins.
For the six months ended June 30, 2019, we recorded a cost of sales of C$777,422 related to the commercial sale of the systems and disposables, which reflects a 62% gross margin. For the six months ended June 30, 2018, we recorded a cost of sales of C$357,334 related to the commercial sale of systems and disposables, which reflects a 39% gross margin. The gross margin was higher in the six months ended June 30, 2019 due to increased disposable and service revenue, which have higher margins.
Operating Expenses
R&D Expenses
For the three months ended June 30, 2019, R&D expenses were higher by C$838,446 compared to the three months ended June 30, 2018. Clinical trial costs, materials, share based compensation and salaries and benefits increased period-over-period by C$219,569, C$294,225, C$33,986, and C$244,263, respectively. These increases were due to increased spending and testing for R&D and activity related to pursuing U.S. regulatory approvals, analysis of TACT clinical data, options awarded to employees, increased R&D personnel and investment tax credits decreasing by C$60,000 because of lower eligibility for refundable tax credits. Offsetting these amounts were decreases in rent of C$57,456, due to the adoption of IFRS 16 resulting in the recognition of lower rental costs. Depreciation expenses increased by C$26,762 due to the adoption of IFRS 16 with the depreciation of the right-of-use assets.
For the six months ended June 30, 2019, R&D expenses were higher by C$999,411 compared to the six months ended June 30, 2018. Materials, share based compensation, salaries and benefits and other expenses increased by C$777,683, C$51,238, C$214,155 and C$61,277, respectively. These costs were higher compared to the six months ended June 30, 2018, due to increased spending and testing on R&D and US regulatory projects, options awarded to employees, increased R&D personnel and investment tax credits decreasing by C$120,000 because of lower eligibility for refundable tax credits. Offsetting these amounts was a decrease in clinical trial costs, consulting fees and rent by C$107,052, C$67,474 and C$95,486, respectively, resulting from the completion of the TACT Pivotal Clinical Trial enrollment initiatives, insourcing manufacturing and regulatory projects and the adoption of IFRS 16 resulting in the recognition of lower rental costs. Depreciation expenses increased by C$54,929 due to the adoption of IFRS 16 with the depreciation of the right-of-use assets.
G&A Expenses
G&A expenses for the three months ended June 30, 2019 decreased by C$650,206 compared to the three months ended June 30, 2018. Salaries and benefits, consulting fees and travel decreased by C$386,996, C$386,594 and C$24,337, respectively due to no bonuses awarded to management this quarter, lower legal costs and decreased travel to customer sites. In addition, the second quarter of 2018 was affected by increased management compensation due to the hiring of key management personnel. These costs were offset by an increase in share based compensation of C$111,871 in the second quarter of 2019, due to options awarded to various employees. Depreciation expenses increased by C$59,759 due to the adoption of IFRS 16 with the depreciation of the right-of-use assets.
G&A expenses for the six months ended June 30, 2019 were lower by C$439,297 compared to the six months ended June 30, 2018. Salaries and benefits, consulting fees, rent and travel decreased by C$191,845, C$400,874, C$31,289 and C$17,609, respectively, due to no bonuses awarded to management, lower legal costs, adoption of IFRS 16 resulting in the recognition of lower rental costs and decreased travel to customer sites. Depreciation expenses increased by C$121,191 due to the adoption of IFRS 16 with the depreciation of the right-of-use assets.
Selling, Marketing and Distribution Expenses
Selling, marketing and distribution expenses for the three months ended June 30, 2019 were higher by C$41,644 compared to the three months ended June 30, 2018. Consulting fees increased by C$247,992 related to the additional consultants hired in various countries to help market and promote our approved products. Marketing and salaries and benefits expenses decreased by C$49,351 and C$128,834, respectively, due to decreased tradeshow attendance, marketing initiatives in the second quarter of 2019 a regional re-alignment of marketing personnel.
Selling, marketing and distribution expenses for the six months ended June 30, 2019 were lower by C$1,434,603 compared to the six months ended June 30, 2018. Salaries and benefits, share based compensation, marketing and travel expenses decreased by C$164,123, C$182,320, C$125,469 and C$32,220, respectively, due to a regional re-alignment of marketing personnel, employee forfeiture of options, decreased trade show attendance, product branding development and decreased travel. In addition, in the first quarter of 2019, our revenue share obligation decreased by C$1,209,205 related to the replacement of the Original Siemens Agreement with the New Siemens Agreement whereby all prior financial commitments and obligations owed to Siemens were released, resulting in a recovery of expenses recorded in the six months ended June 30, 2019. These costs were offset by an increase in consulting fees of C$296,803 due to consultants hired in various countries to help market and promote our approved products.
Finance Costs
Finance costs for the three months ended June 30, 2019 were higher by C$30,181 compared to the three months ended June 30, 2018. During the three months ended June 30, 2019, we recognized C$26,298 of foreign exchange loss and a C$25,072 gain on the change in fair value to the contingent consideration under the Philips Share Purchase Agreement and a C$3,251 gain on the change in fair value of the derivative liability warrants, respectively. We recognized CIBC Loan interest of C$312,050 and lease liability interest expense of C$33,556.
Finance costs for the six months ended June 30, 2019 were lower by C$77,174 compared to the six months ended June 30, 2018. During the six months ended June 30, 2019, we recognized C$34,786 of foreign exchange gain, a C$48,787 gain on the change in fair value to the contingent consideration and a C$54,220 loss on the change in fair value of the derivative liability warrants, respectively. We recognized CIBC Loan interest of C$617,559 and lease liability interest expense of C$67,149.
Income Tax Expense
During the three and six months ended June 30, 2019, we recorded an income tax expense of C$20,200 and C$54,000, respectively, compared to C$24,200 and C$60,600 for the three and six months ended June 30, 2018, which primarily related to taxes in certain foreign jurisdictions.
Net Loss
Net loss for the three months ended June 30, 2019 was C$5,844,134 or C$0.05 per Common Share, compared to a net loss of C$5,831,028 or C$0.05 per Common Share for the three months ended June 30, 2018. The increase in net loss was primarily attributed to an increase in R&D expenses of C$838,446, an increase in selling and distribution expenses of C$41,644 and an increase in net finance costs of C$30,181. This was offset by a decrease in G&A expenses of C$650,206 and an increase in gross profits of C$242,959. However, our net loss in the second quarter of 2019 was greater than in the first quarter of 2019. See “—Quarterly Results of Operations” below.
Net loss for the six months ended June 30, 2019 was C$8,770,820 or C$0.08 per common share, compared to a net loss of C$10,769,214 or C$0.12 per common share for the six months ended June 30, 2018. The decrease in net loss was primarily attributed to a decrease in G&A expenses of C$439,297, a decrease in selling and distribution expenses of C$1,434,603, a decrease in net finance costs of C$77,174 and an increase in gross profit of C$1,040,131. This was offset by an increase in R&D expenses of C$999,411.
Comparison of the Year Ended December 31, 2018 to the Year Ended December 31, 2017
Revenue
For the year ended December 31, 2018, we recorded revenue totaling C$2,602,278, with C$2,421,331 from the sale of products and C$180,947 from installation and training services, related to the commercial sales of the systems and disposables, primarily in the EU. For the year ended December 31, 2017, we recorded revenue totaling C$4,904,550, with C$4,663,986 from sale of products and C$240,564 from installation and training services. The decrease in revenue was the result of fewer new system and disposable sales in 2018 due to fluctuating revenues in our early pilot launch phase.
Cost of Sales
For the year ended December 31, 2018, we recorded a cost of sales of C$1,778,501, related to the sale of the systems and disposables, which reflects a 32% gross margin. For the year ended December 31, 2017, we recorded a cost of sales of C$3,032,208, related to the commercial sale of systems and disposables, which reflects a 38% gross margin. The gross margin was lower in 2018 due to changes in the product mix as a result of the Sonalleve Transaction and lower gross margin on disposables compared to the systems based on initial low volumes.
Operating Expenses
R&D Expenses
For the year ended December 31, 2018, R&D expenses were higher by C$627,198 compared to the year ended December 31, 2017. Overall, the increase in R&D spending was attributed to the Sonalleve Transaction, which occurred in the third quarter of 2017. Materials, rent, salaries and benefits and other expenses increased by C$125,035, C$110,756, C$1,224,691 and C$177,625, respectively. These costs were higher compared to the year ended December 31, 2017, due to a higher number of R&D personnel, new initiatives with our Sonalleve system and a new facility in Finland. Offsetting these amounts was a decrease in clinical trial costs, travel and share based compensation by C$1,544,191, C$26,194 and C$67,403, respectively, resulting from the completion of the TACT Pivotal Clinical Trial enrollment initiatives and the forfeiture of certain share options. Amortization of intangible assets increased by C$626,593 due to the Sonalleve Transaction which represented 12 months amortization in 2018 versus 5 months amortization in 2017.
G&A Expenses
G&A expenses for the year ended December 31, 2018 were higher by C$721,508 compared to the year ended December 31, 2017. Salaries and benefits, travel and office and other increased by C$885,846, C$60,982 and C$28,879, respectively, due to increased number of G&A personnel and board members, bonus payments, salary increases, including as a result of the Sonalleve Transaction, and increased insurance expenses and travel to customer sites. These costs were offset by a decrease in share-based compensation expense and occupancy costs (resulting in lower utility bills and repairs to the facilities) by C$326,501 and C$106,427, respectively. Depreciation expense increased by C$167,970 primarily due to leasehold improvements for the new facility that was constructed in the latter part of 2017.
Selling, Marketing and Distribution Expenses
Selling, marketing and distribution expenses for the year ended December 31, 2018 were higher by C$165,543 compared to the year ended December 31, 2017. Salaries and benefits, consulting fees, travel, marketing and share based compensation increased by C$400,470, C$175,152, C$77,295, C$138,644 and C$145,229, respectively, due to additional direct sales force personnel, awards issued to new employees, increased marketing-related efforts, product branding development and conference attendance. These costs were offset by a reduced revenue share obligation expense of C$787,858 related to the Siemens revenue share payments compared to the minimum amounts contractually stipulated.
Finance Costs
Finance costs for the year ended December 31, 2018 were lower by C$422,772 compared to the year ended December 31, 2017. During the year ended December 31, 2018, we recognized C$214,226 of foreign exchange loss, a C$325,253 and C$96,619 gain on the change in fair value to the contingent consideration under the Philips Share Purchase Agreement and the change in fair value of the derivative liability warrants, respectively. We recognized a decrease in the Health Technology Exchange Loan and Federal Economic Development Agency Loan and Knight Loan interest and accretion expense of C$57,149 and C$752,358, respectively and an increase in CIBC Loan interest and accretion expense of C$517,409.
Income Tax Expense
During the year ended December 31, 2018, we recorded an income tax expense of C$230,784, compared to C$74,123 for the year ended December 31, 2017 which primarily related to taxes in certain foreign jurisdictions. The increase was a direct result of increased commercial efforts.
Net Loss
Net loss for the year ended December 31, 2018 was C$20,762,989 or C$0.21 per Common Share, compared to a net loss of C$18,822,342 or C$0.31 per Common Share for the year ended December 31, 2017. The increase in net loss was primarily attributed to an increase in R&D expenses of C$627,198, an increase in G&A expenses of C$721,508, an increase selling and distribution expenses of C$165,543, and a decrease in gross profit of C$1,048,565. These were offset by a decrease in net finance costs of C$778,828.
Comparison of the Year Ended December 31, 2017 to the Year Ended December 31, 2016
Revenue
For the year ended December 31, 2017, we recorded revenues totaling C$4,904,550, with C$4,663,986 from sale of products and C$240,564 from installation and training services, related to the commercial sales of the systems and disposables, primarily in the EU. In 2016, we had no revenues as we were in the pre-commercial stage of our development.
Cost of Sales
For the year ended December 31, 2017, we recorded cost of sales of C$3,032,208, related to the sales of the systems and disposables. In 2016, we had no revenues or related cost of sales as we were in the pre-commercial stage of our development.
Operating Expenses
R&D Expenses
For the year ended December 31, 2017, R&D expenses were lower by C$350,503 compared to the year ended December 31, 2016. Overall, the decrease in R&D spending reflected the advanced stages of development of our products and the ramp-up of commercial operations in approved jurisdictions. Materials, contractors and other expenses were lower by C$2,523,608, C$136,386 and C$204,711, respectively due to lower material costs and R&D initiatives associated with our TACT Pivotal Clinical Trials. Offsetting this amount was an increase in clinical trial costs, salaries and benefits, amortization of intangible assets, consulting fees and travel by C$1,311,878, C$562,626, C$458,980, C$80,763 and C$66,248, respectively, resulting from ongoing activities related to the initiation of clinical site visits, enrollment initiatives, patient treatment and workforce costs.
G&A Expenses
G&A expenses for the year ended December 31, 2017 were higher by C$1,565,927 compared to the year ended December 31, 2016. Salaries and benefit expenses increased by C$88,190, primarily related to a separation payment to a former executive officer and the addition of key executives. In addition, professional and consulting fees increased by C$976,380 due to legal fees associated with the Sonalleve Transaction and the inclusion of Sonalleve-related operations. Share-based compensation and rent increased by C$289,689 and C$20,364, respectively, due to new options issued to executive officers while rent was due to relocation to a larger facility in July 2016. Depreciation expense increased by C$195,218 primarily due to the new property and equipment for the new facility.
Selling, Marketing and Distribution Expenses
Selling and distribution expenses for the year ended December 31, 2017 were higher by C$2,643,371 compared to the year ended December 31, 2016. The increase is largely attributable to recognizing commissions payable on commercial sales of C$73,046 and a provision of C$953,429 related to the estimated shortfall of revenue share payments compared to the minimum amounts contractually required. In addition, shared based compensation and salaries and benefits increased by C$32,820 and C$650,391, respectively, resulting from additional direct sales force personnel. Professional and consulting fees, marketing, office and other and travel expenses increased by C$353,974, C$257,074, C$90,676 and C$231,961, respectively. These increases relate directly to marketing-related efforts and an increased direct sales force.
Finance Costs
Finance costs for the year ended December 31, 2017 were higher by C$419,185 compared to the year ended December 31, 2016. During the year ended December 31, 2017, we revised the fair value of the royalty payable to Knight, using future revenue forecasts for the term of the Knight Loan and recognized an interest accretion recovery of C$36,438. As part of the Sonalleve Transaction, we were required to repay the Knight Loan at an accelerated rate and therefore recognized C$333,997 of accelerated accretion expense. During the year, we revised the fair value of the contingent consideration under the Philips Share Purchase Agreement and recognized a change in fair value of C$82,578.
Income Tax Expense
During the year ended December 31, 2017, we recorded an income tax expense C$74,123, compared to the year ended December 31, 2016 of C$14,054 with the increase primarily related to the Sonalleve Transaction.
Net Loss
Net loss for the year ended December 31, 2017 was C$18,822,342 or C$0.31 per common share, compared to a net loss of C$16,326,769 or C$0.39 per Common Share for the year ended December 31, 2016. The increase in net loss was primarily attributed to an increase in selling and distribution expenses of C$2,643,371, G&A expenses of C$1,565,927 and an increase in financing costs of C$419,185. These increases were offset by a gross profit of C$1,872,342.
Quarterly Results of Operations
The following table summarizes selected unaudited consolidated financial data for each of the last eight quarters. The summary financial information provided below is derived from our interim financial statements for each of the last eight quarters that are prepared under IFRS in Canadian dollars. These quarterly operating results are not necessarily indicative of our operating results for a full year or any future period.
| | | 2019 | | | 2018 | | | 2017 | |
| | | Q2 | | | Q1 | | | Q4 | | | Q3 | | | Q2 | | | Q1 | | | Q4 | | | Q3(1) | |
| | | C$ | | | C$ | | | C$ | | | C$ | | | C$ | | | C$ | | | C$ | | | C$ | |
| Revenue(3) | | | 574,109 | | | | 1,475,788 | | | | 1,708,936 | | | | 303,664 | | | | 213,343 | | | | 376,335 | | | | 1,890,482 | | | | 1,465,412 | |
| Cost of Sales | | | 244,066 | | | | 533,356 | | | | 1,180,481 | | | | 240,686 | | | | 126,259 | | | | 231,075 | | | | 1,063,950 | | | | 1,185,674 | |
| Gross profit | | | 330,043 | | | | 942,432 | | | | 528,455 | | | | 62,978 | | | | 87,084 | | | | 145,260 | | | | 826,532 | | | | 279,738 | |
| | | | | | | | | | | | | | | | | | | | | | | | | | | | | | | | | |
| Operating expenses | | | 5,927,547 | | | | 3,662,514 | | | | 5,309,931 | | | | 5,238,977 | | | | 5,697,663 | | | | 4,766,887 | | | | 5,155,423 | | | | 5,148,434 | |
| Net finance costs(2) | | | 226,430 | | | | 172,804 | | | | (60,151 | ) | | | (73,733 | ) | | | 196,249 | | | | 280,159 | | | | 130,632 | | | | 651,378 | |
| Loss before income taxes | | | 5,823,934 | | | | 2,892,886 | | | | 4,721,325 | | | | 5,102,266 | | | | 5,806,828 | | | | 4,901,786 | | | | 4,459,523 | | | | 5,520,074 | |
| | | | | | | | | | | | | | | | | | | | | | | | | | | | | | | | | |
| Income taxes | | | 20,200 | | | | 33,800 | | | | 136,884 | | | | 32,700 | | | | 24,200 | | | | 36,400 | | | | 69,470 | | | | - | |
| | | | | | | | | | | | | | | | | | | | | | | | | | | | | | | | | |
| Net loss for the period | | | 5,844,134 | | | | 2,926,686 | | | | 4,858,809 | | | | 5,134,966 | | | | 5,831,028 | | | | 4,938,186 | | | | 4,528,993 | | | | 5,520,074 | |
| | | | | | | | | | | | | | | | | | | | | | | | | | | | | | | | | |
| Loss per common share | | | | | | | | | | | | | | | | | | | | | | | | | | | | | | | | |
| Basic and diluted | | | 0.05 | | | | 0.03 | | | | 0.04 | | | | 0.05 | | | | 0.05 | | | | 0.06 | | | | 0.06 | | | | 0.09 | |
| (1) | The fourth quarter of 2018 was impacted by increased commercial sales of systems primarily in Germany and Asia, resulting in increased revenues. |
| (2) | The third and fourth quarters of 2018 net finance costs were lower due to a gain on the change in fair value of contingent consideration under the Philips Share Purchase Agreement and share warrants being recognized. |
Recently Issued Accounting Pronouncements
In conjunction with the transition to the new IFRS 16, Leases and IFRIC 23, Uncertainty over Income Tax Treatments, we have determined that the adoption of these new accounting standards did not have a significant impact on our control environment.
The preparation of financial statements in conformity with IFRS requires management to make estimates and judgements that affect the reported amounts of assets and liabilities at the date of the financial statements, and the reported amounts of revenue and expenses during the period. Actual results could differ from these estimates. As additional information becomes available or actual amounts are determinable, the recorded estimates are revised and reflected in operating results in the period in which they are determined.
Critical Accounting Policies and Estimates
Revenue
To determine revenue recognition for arrangements we performs the following five steps: (i) identify the contract(s) with a customer; (ii) identify the performance obligations in the contract; (iii) determine the transaction price; (iv) allocate the transaction price to the performance obligations in the contract; and (v) recognize revenue when (or as) we satisfy a performance obligation. We only apply the five-step model to contracts when it is probable that we will collect the consideration it is entitled to in exchange for the goods or services it transfers to the customer.
Revenue is recognized when a contractual promise to a customer (performance obligation) has been fulfilled by transferring control over the promised goods or services, generally at the point in time of shipment to or receipt of the products by the customer or when the services are performed. When contracts contain customer acceptance provisions, revenue is recognized on the satisfaction of the specific acceptance criteria.
The amount of revenue to be recognized is based on the consideration we expect to receive in exchange for its goods and services. For contracts that contain multiple performance obligations, we allocate the consideration to which we expect to be entitled to each performance obligation based on relative standalone selling prices and we recognize the related revenue when or as control of each individual performance obligation is transferred to customers.
Service revenue related to installation and training is recognized over the period in which the services are performed. Service revenue related to extended warranty service is deferred and recognized on a straight-line basis over the extended warranty period covered by the respective customer contract.
Under the terms of certain of our partnership agreements with Philips and Siemens, we retain a percentage of all amounts earned with the remaining percentage due to the partner. Accordingly, associated revenue is recognized net of the consideration due to the partner.
Complex financial instruments and provisions
We make various judgments when determining the accounting for certain complex financial instruments. We have concluded that the contingent consideration in a business combination represents a financial liability measured at fair value through profit or loss.
Accounts receivable and allowance for credit losses
Accounts receivable are generally non-interest bearing, unsecured obligations due from customers. We make a provision to allow for potentially uncollectible amounts owed from customers. The allowance is reviewed by management periodically based on an analysis of the age of the outstanding accounts receivable. The balance of accounts receivable after the allowance for credit losses represents management’s estimate of the net realizable value of receivables after discounts and contractual adjustments.
Impairment of goodwill and long-lived assets
Management tests at least annually whether goodwill suffered any impairment. Property and equipment are reviewed for impairment whenever events or changes in circumstances indicate the carrying amount may not be recoverable. An impairment loss is recognized as the amount by which the asset’s carrying amount exceeds its recoverable amount. The recoverable amount is the higher of an asset’s fair value less costs to sell and value in use. For the purposes of assessing impairment, assets are grouped at the lowest levels for which there are separately identifiable cash flows.
Management makes key assumptions and estimates in determining the recoverable amount of our cash generating units (“CGUs”) or groups of CGUs, including future cash flows based on historical and budgeted operating results, growth rates, tax rates and appropriate after-tax discount rates.
We evaluate our long-lived assets (property and equipment) and intangible assets, other than goodwill, for impairment whenever indicators of impairment exist. The accounting standards require that if the sum of the undiscounted expected future cash flows from a long-lived asset or definite-lived intangible asset is less than the carrying value of that asset, an asset impairment charge must be recognized. The amount of the impairment charge is calculated as the excess of the asset’s carrying value over its fair value, which generally represents the discounted future cash flows from that asset.
Impairment of non-financial assets
We review amortized non-financial assets for impairment whenever events or changes in circumstances indicate the carrying amount of the assets may be impaired. We also review goodwill annually for impairment. If the recoverable amount of the respective non-financial asset is less than our carrying amount, it is considered to be impaired. In the process of measuring the recoverable amount, management makes assumptions about future events and circumstances. The actual results may vary and may cause significant adjustments.
Accounting for acquisitions and contingent consideration
Areas of estimation include the determination and fair value measurement of the contingent consideration, which include us developing our best estimate of projected revenue, the probability of the contingency being achieved and the discount rate. Management is also required to make estimates of the fair value of assets acquired and liabilities assumed.
Clinical trial expenses
Clinical trial expenses are accrued based on the services received and efforts expended pursuant to agreements with clinical trial sites and other vendors. In the normal course of business we contract third parties to perform various clinical trial activities. The financial terms of these agreements vary from contract to contract, are subject to negotiation and may result in uneven payment flows. Payments under the contracts depend on factors such as the achievement of certain events, the successful enrollment of patients or the completion of certain portions of a clinical trial. We determine the accrual by reviewing contracts, vendor agreements and through discussions with internal personnel and external clinical trial sites as to the progress or stage of completion of the clinical trial and the agreed-upon fees to be paid for such services. Actual costs and timing of the clinical trial is uncertain, subject to risks and may change depending on a number of factors.
JOBS Act
As a company with less than US$1.07 billion in revenue during the last fiscal year, we qualify as an “emerging growth company” pursuant to the JOBS Act. An emerging growth company may take advantage of specified exemptions from various requirements that are otherwise applicable generally to public companies in the United States.
The JOBS Act also permits an emerging growth company such as us to take advantage of an extended transition period to comply with new or revised accounting standards applicable to public companies. We will not take advantage of the extended transition period provided in Section 7(a)(2)(B) of the Securities Act for complying with new or revised accounting standards. This election is irrevocable. We will remain an emerging growth company until the earliest of:
| · | the last day of our fiscal year during which we have total annual gross revenues of at least US$1.07 billion; |
| · | the last day of our fiscal year following the fifth anniversary of the completion of an initial public offering; |
| · | the date on which we have, during the previous three-year period, issued more than US$1 billion in non-convertible debt securities; or |
| · | the date on which we are deemed to be a “large accelerated filer” under the Exchange Act, which would occur if the market value of our Common Shares that are held by non-affiliates exceeds US$700 million as of the last business day of our most recently completed second fiscal quarter. |
As a result of our status as an emerging growth company, the information that we provide shareholders may be less comprehensive than what you might receive from other public companies that are not emerging growth companies. When we are no longer deemed to be an emerging growth company, we will not be entitled to the exemptions provided in the JOBS Act.
B. Liquidity and Capital Resources
Overview
Our primary sources of capital to date have been from securities offerings and bank financings, including the Bought Deals and CIBC Loan as described below. At June 30, 2019, we had cash of C$20,493,470 compared to C$30,687,183 at December 31, 2018. Following FDA clearance of our TULSA-PRO system in August 2019, we paid a C$250,000 milestone payment to Sunnybrook under the Sunnybrook License. See Item 4.B, “Business Overview—Intellectual Property—Licenses”. As of June 30, 2019, our total borrowings were C$12,500,000, related to the CIBC Loan described below. Our funding and treasury activities are conducted within corporate practices to maximize investment returns while maintaining appropriate liquidity for both our short and long-term needs. Cash is held primarily in Canadian dollars.
For the six months ended June 30, 2019 and for the year ended December 31, 2018, we had no capital expenditures, compared to C$430,569 for the year ended December 31, 2017 and C$863,991 for the year ended December 31, 2016, most of which were used for the purchase of production and research and development equipment, office furniture and equipment and computers and self-manufactured equipment.
Our working capital has decreased by C$9,825,322 with a surplus of C$20,215,107 at June 30, 2019 compared to the surplus of C$30,040,429 at December 31, 2018. For a calculation of working capital, see “Working Capital” below. The change in working capital was due to a decrease in current assets of C$10,239,005, which was primarily the result of the decreased cash balance of C$20,493,470 resulting from general working capital payments. We believe that our working capital is sufficient for our present requirements.
We may require additional capital to fund our commercialization efforts in the United States and future clinical trials and/or R&D activities. Potential sources of capital could include equity and/or debt financings, development agreements or marketing agreements, the collection of revenue resulting from future commercialization activities and/or new strategic partnership agreements to fund some or all costs of development. There can be no assurance that we will be able to obtain the capital sufficient to meet any or all of our needs. The availability of equity or debt financing will be affected by, among other things, the success of our commercialization efforts, the follow-up results of our clinical trials and our future R&D activity, our ability to obtain additional regulatory approvals, the state of the capital markets generally, strategic alliance agreements and other relevant considerations. See Item 3.D., “Risk Factors” elsewhere in this Registration Statement. In addition, if we raise additional funds by issuing equity securities, existing security holders will likely experience dilution, and any additional incurrence of indebtedness would result in increased debt service obligations and could require us to agree to additional operating and financial covenants that could further restrict our operations. Any failure to raise additional funds on terms favorable to us or at all may require us to significantly change or curtail our current or planned operations in order to conserve cash until such time, if ever, that sufficient proceeds from operations are generated, and could result in us not being in a position to advance our commercialization strategy or take advantage of business opportunities, and may results in the termination or delay of clinical trial results for our products or future clinical trials for other product candidates, in the curtailment of product development programs designed to improve our existing products or identify new product candidates, in the sale or assignment of rights to our intellectual property, and/or cause us to delay or suspend applications for regulatory approvals at all or in time to competitively market our products and future product candidates.
Recent Sources and Uses of Financing
Bought Deals
On March 20, 2018, we closed a bought deal financing, resulting in the issuance of 34,500,000 units at a price of C$1.00 per unit, for gross proceeds of C$34,500,000 (C$32,027,502, net of cash transaction costs) (the “2018 Bought Deal”). Each unit consisted of one Common Share and one-half of one Common Share purchase warrant, resulting in the issuance of 34,500,000 Common Shares and 17,250,000 warrants. Each whole warrant has a five-year term and entitles the holder thereof to acquire one Common Share at an exercise price of C$1.40 per Common Share.
We have allocated the net proceeds of the 2018 Bought Deal to (i) support certain costs and expenses of other clinical trial support and the ongoing TACT Pivotal Clinical Trial follow-up and finalization; (ii) ongoing expansion of infrastructure to execute on global sales and marketing plans with respect to the TULSA-PRO system and the Sonalleve system; (iii) support ongoing research and development and continue to invest in additional research and development and acquisitions in order to expand the applications for current and future platforms; (iv) scheduled repayment under the Knight Loan and other indebtedness; and (v) other general corporate purposes.
On September 20, 2017, we closed a bought deal financing, resulting in the issuance of 10,000,000 units at a price of C$1.00 per unit, for gross proceeds of C$10,000,000 (C$8,913,868, net of cash transaction costs) (the “2017 Bought Deal”). Each unit consisted of one Common Share and one-half of one Common Share purchase warrant, resulting in the issuance of 10,000,000 Common Shares and 5,000,000 warrants. Each whole warrant has a three-year term and entitles the holder thereof to acquire one Common Share at a price of C$1.40 per Common Share.
On November 14, 2016, we closed a bought deal financing, resulting in the issuance of 15,820,000 Common Shares at a price of C$1.10 per Common Share for gross proceeds of C$17,402,000 (C$16,182,997, net of cash transaction costs) (the “2016 Bought Deal”).
CIBC Loan
PMI entered into the CIBC Loan Agreement, for initial gross proceeds of C$12,500,000, maturing on July 29, 2022, with an interest rate based on prime plus 2.5% (the “CIBC Loan”). PMI is required to make interest only payments for the first 15 months (until October 31, 2019) and monthly repayments on the principal of C$378,788 plus accrued interest afterwards for 33 months. All obligations of PMI under the CIBC Loan Agreement are guaranteed by Profound and certain of its current and future subsidiaries, and are secured by first priority security interests in the assets of Profound and such subsidiaries. PMI has the ability to draw an additional C$6,250,000 subject to the achievement of certain financing and FDA approval milestones. The CIBC Loan Agreement also contains a financial covenant that requires our unrestricted cash to be greater than operating cash expenditures for a trailing three-month period, reportable to CIBC on a monthly basis. We are currently in compliance with this financial covenant.
In connection with the CIBC Loan Agreement, we also issued 321,714 Common Share purchase warrants to CIBC, with each warrant entitling the holder to acquire one Common Share at a price of C$0.97 per Common Share until the date that is 60 months from the closing of the CIBC Loan Agreement, with a cashless exercise feature. The cashless exercise feature causes the conversion ratio to be variable and the warrants are therefore classified as a financial liability. Gains and losses on the warrants are recorded within finance costs on the consolidated statements of loss and comprehensive loss. A pricing model with observable market-based inputs was used to estimate the fair value of the warrants issued. The estimated fair value of the warrants at June 30, 2019 and December 31, 2018 was C$152,423 and C$98,203, respectively. As at June 30, 2019, the principal balance outstanding on the CIBC Loan Agreement was C$12,500,000.
Knight Loan
In August 2015, Knight provided us with a secured loan of C$4,000,000 bearing interest at 15% per annum (the “Knight Loan”) under the Knight Loan Agreement. On July 25, 2018, the full amount of the Knight Loan, including prepayment fees, was repaid for a total payment of C$3,188,023.
We also granted Knight a 0.5% royalty on global net sales of our products until the original maturity date of the Knight Loan on May 20, 2019. The royalty was initially recorded at fair value and subsequently carried at amortized cost using the effective interest rate method. The initial fair value of the royalty was determined using future revenue forecasts for the term of the Knight Loan and a discount rate of 18%. During the three and six months ended June 30, 2019, we revised the fair value of the royalty to reflect that the royalty had expired during the period.
In connection with the Knight Loan Agreement, in April 2015 we also entered into a distribution, license and supply agreement with Knight pursuant to which Knight will act as our exclusive distributor in Canada for an initial 10-year term, renewable for successive 10-year terms by either party. In connection with these arrangements in April 2015, we issued Knight a total of 1,717,450 Common Shares.
Federal Economic Development Agency Loan
Pursuant to a loan agreement dated December 16, 2011, the Federal Economic Development Agency provided us with an unsecured and non-interest bearing loan of $867,000 (the “Federal Economic Development Agency Loan”) with the final repayment of $563,550 made on July 25, 2018.
Health Technology Exchange Loan
Pursuant to a loan agreement dated May 25, 2011, as amended April 1, 2012, and a loan agreement dated May 31, 2014, the Health Technology Exchange provided us with an unsecured loan of $1,500,000 bearing interest at 4.5% per annum (the “Health Technology Exchange Loan”). The final payment of $1,094,698 including accrued interest was made on March 31, 2018.
Cash Flows
We manage liquidity risk by monitoring actual and projected cash flows. A cash flow forecast is performed regularly to ensure that we have sufficient cash to meet operational needs while maintaining sufficient liquidity. We do not use any financial instruments for hedging currencies.
Our cash flows for the three and six months ended June 30, 2019 and 2018 are summarized in the table below.
| | | Three months ended | | | Six months ended | |
| | | June 30, | | | June 30, | | | June 30, | | | June 30, | |
| | | 2019 | | | 2018 | | | 2019 | | | 2018 | |
| | | C$ | | | C$ | | | C$ | | | C$ | |
| Cash provided by (used in) operating activities | | | (6,286,215 | ) | | | (5,414,430 | ) | | | (9,504,257 | ) | | | (9,135,773 | ) |
| Cash provided by (used in) investing activities | | | – | | | | – | | | | – | | | | – | |
| Cash provided by (used in) financing activities | | | (269,152 | ) | | | (604,614 | ) | | | (689,456 | ) | | | 30,028,469 | |
| Net increase (decrease) in cash | | | (6,555,367 | ) | | | (6,019,044 | ) | | | (10,193,713 | ) | | | 20,892,696 | |
Net cash provided by (used in) operating activities for the three months ended June 30, 2019 was C$(6,286,215) versus C$(5,414,430) for the three months ended June 30, 2018. The principal use of the operating cash flows during this period related to increased workforce costs and expenses associated with seeking U.S. regulatory approval for the TULSA-PRO system.
Net cash provided by (used in) operating activities for the six months ended June 30, 2019 was C$(9,504,257) versus C$(9,135,773) for the six months ended June 30, 2018. The principal uses of the operating cash flows during this period related to additional costs associated with increased workforce and seeking U.S. regulatory approval for the TULSA-PRO system and consultant costs.
Net cash provided by (used in) financing activities for the three months ended June 30, 2019 were C$(269,152) versus C$(604,614) for the three months ended June 30, 2018. These cash flows related to the CIBC Loan interest payments in 2019 which had a lower interest rate versus the Health Technology Exchange Loan, and the Knight Loan interest payments in 2018 which had a higher cost of borrowing.
Net cash provided by (used in) financing activities for the six months ended June 30, 2019 were C$(689,456) versus C$30,028,469 for the six months ended June 30, 2018. These cash flows related to the CIBC Loan interest payments in 2019 versus the Health Technology Exchange Loan, and the Knight Loan and gross proceeds from the 2018 Bought Deal, less cash transactions costs paid.
Our cash flows for the years ended December 31, 2018, 2017 and 2016 are summarized in the table below.
| | | Year ended | |
| | | December 31, | | | December 31, | | | December 31 | |
| | | 2018 | | | 2017 | | | 2016 | |
| | | C$ | | | C$ | | | C$ | |
| Cash provided by (used in) operating activities | | | (18,294,637 | ) | | | (15,571,227 | ) | | | (14,502,266 | ) |
| Cash provided by (used in) investing activities | | | - | | | | (280,661 | ) | | | 8,912,835 | |
| Cash provided by (used in) financing activities | | | 37,878,597 | | | | 6,122,050 | | | | 15,899,972 | |
| Net increase (decrease) in cash | | | 19,583,960 | | | | (9,729,838 | ) | | | 10,310,541 | |
Net cash provided by (used in) operating activities for the year ended December 31, 2018 was C$(18,294,637) versus C$(15,571,227) for the year ended December 31, 2017 and C$(14,502,266) for the year ended December 31, 2016. The principal uses of the operating cash flows during 2018 related to additional costs associated with Sonalleve that were only present for 5 months in 2017, increased TACT expenses and increased workforce costs,. In the year ended December 31, 2016, the principal uses of operating cash flows were related to the preparations for the IDE submission and the TACT Pivotal Trial in 14 clinical sites, designed to support the 510(k) submission in the United States to provide a pathway for Class II classification for the TULSA-PRO system and increased employee headcount.
Net cash provided by (used in) investing activities for the year ended December 31, 2018 was C$nil versus C$(280,661) for the year ended December 31, 2017 and C$8,912,835 for the year ended December 31, 2016. The change in the year ended December 31, 2018 compared to the year ended December 31, 2017 related to no purchases of property and equipment and intangible assets during the year ended December 31, 2018 compared to the year ended December 31, 2017. The change in the year ended December 31, 2017 compared to the year ended December 31, 2016 related to the redemption of short term investments, offset by cash outflows related to purchase of enterprise resource planning implementation and leasehold improvements at the new office building.
Net cash provided by (used in) financing activities for the year ended December 31, 2018 were C$37,878,597 versus C$6,122,050 for the year ended December 31, 2017 and C$15,899,972 for the year ended December 31, 2016. These cash flows in 2018 related to the CIBC Loan, 2018 Bought Deal proceeds less cash transactions costs paid and debt repayments of the Health Technology Exchange Loan, Federal Economic Development Agency Loan and the Knight Loan. Cash flows provided by financing activities in 2017 related to 2017 Bought Deal proceeds and were offset by the repayment of long term debt. Cash flows provided by financing activities in 2016 related to 2016 Bought Deal proceeds and were offset by the repayment of long term debt.
Working Capital
Our working capital as at June 30, 2019 and December 31, 2018, with reconciliations to current assets are set forth in the table below.
| | | As of June 30, | | | As of December 31, | |
| | | 2019 | | | 2018 | |
| | | C$ | | | C$ | |
| Current assets | | | 27,680,784 | | | | 37,919,789 | |
| Less: Current liabilities | | | 7,465,677 | | | | 7,879,360 | |
| Working capital | | | 20,215,107 | | | | 30,040,429 | |
C. Research and Development, Patents and Licenses, etc.
Research and Development
Our R&D expenses are comprised of costs incurred in performing R&D activities, including new product development, continuous product improvement, investment in clinical trials and related clinical manufacturing costs, materials and supplies, salaries and benefits, contract research costs, patent procurement costs, and R&D-related occupancy costs. Since January 1, 2016, the majority of these expenses have related to the TACT Pivotal Clinical Trial and development costs of our systems, primarily our TULSA-PRO system.
For information regarding our intellectual property, see Item 4.B, “Business Overview—Intellectual Property”.
D. Trend Information
See 5.A, “Operating Results—Trend Information and Outlook”.
E. Off-Balance Sheet Arrangements
We have no off-balance sheet arrangements within the meaning of U.S. or Canadian securities laws.
F. Tabular Disclosure of Contractual Obligations
The following table summarizes our significant contractual obligations as of December 31, 2018:
| | | Total | | | Less than 1 Year | | | Between
1 year and
5 years | | | Greater than
5 years | |
| | | C$ | | | C$ | | | C$ | | | C$ | |
| Accounts payables and accrued liabilities | | | 3,912,350 | | | | 3,912,350 | | | | - | | | | - | |
| Long-term debt(1) | | | 14,497,042 | | | | 1,936,455 | | | | 12,560,587 | | | | - | |
| Other liabilities(2) | | | 1,365,217 | | | | 429,426 | | | | 935,791 | | | | - | |
| Total(3) | | | 19,774,609 | | | | 6,278,231 | | | | 13,496,378 | | | | - | |
| (1) | Represents the CIBC Loan. Carrying amount: C$11,955,245. See Item 5.B, “Liquidity and Capital Resources—Recent Sources and Uses of Financing—CIBC Loan” and note 10 to our audited annual financial statements included in this Registration Statement. |
| (2) | Represents contingent consideration under the Philips Share Purchase Agreement, which is valued based on estimated projected net sales, the likelihood of certain levels being reached and a discount rate of 15%, and warranty liability relating to warrants issued in the 2017 Bought Deal and 2018 Bought Deal, and to CIBC in connection with the CIBC Loan. Carrying amount: C$1,275,394. For information regarding the Philips Share Purchase Agreement and our recorded contingent consideration thereunder, see Item 4.B, “Business Overview—Alliances and Partnerships—Philips” and note 4 to our audited annual financial statements included in this Registration Statement. For information regarding the warrants and warranty liability, see Item 5.B, “Liquidity and Capital Resources—Recent Sources and Uses of Financing” and note 12 to our audited annual financial statements included in this Registration Statement. |
| (3) | Carrying amount: C$17,142,989. In addition, following FDA clearance of our TULSA-PRO system in August 2019, we were required to pay a C$250,000 milestone payment to Sunnybrook under the Sunnybrook License, which we have paid as of the date of this Registration Statement. See Item 4.B, “Business Overview—Intellectual Property—Licenses”. |
G. Safe Harbor
See “Cautionary Note Regarding Forward-Looking Statements” in the introduction to this Registration Statement.
ITEM 6. DIRECTORS, SENIOR MANAGEMENT AND EMPLOYEES
A. Directors and Senior Management
Directors
Set out below is information with respect to our directors. Our directors are elected by our shareholders at each annual general meeting.
Name, Age and
Residence | | Positions with
the Company | | Date First Appointed to the Board | | Principal Occupation |
Arun Menawat
Age: 64
Oakville, Ontario, Canada | | Chief Executive Officer and Director | | June 4, 2015 | | Chief Executive Officer and Director of the Company (since August 2016); Chairman, President and Chief Executive Officer of Novadaq Technologies Inc. (from 2003 to 2016). |
| | | | | | | |
Brian Ellacott(1)
Age: 62
Sanibel Island, Florida, USA | | Director | | June 14, 2018 | | Chief Executive Officer Belmont Instrument Corporation, a medical device company (since 2017); President and Chief Executive Officer Laborie Medical Technologies, a medical device company (from 2013 to 2017). |
| | | | | | | |
Steve Forte(1) Age: 40 Montréal, Québec, Canada | | Director | | August 6, 2019 | | Chief Financial Officer Clementia Pharmaceutical (from August 2018 to July 2019); Chief Financial Officer Thinking First (from September 2015 to August 2018); Executive Director of Finance (from September 2014 to September 2015); Vice-President, Financial Reporting Aptalis Pharma Inc. (from April 2011 to May 2014) |
Name, Age and
Residence | | Positions with
the Company | | Date First Appointed to the Board | | Principal Occupation |
Kenneth Galbraith(1)(2)(3)
Age: 56
Vancouver, British Columbia, Canada | | Director | | January 17, 2017 | | Chief Executive Officer Prometic Life Sciences (since April 2019); Founder of Five Corners Capital, a venture capital management company (since 2013). |
| | | | | | | |
Linda Maxwell (2)
Age: 45
Toronto, Ontario, Canada | | Director | | October 9, 2018 | | Surgeon (since 2005); Executive Director, Biomedical Zone at Ryerson University (since June 2015); Technology Transfer Manager University of Oxford (from June 2013 to July 2014) |
| | | | | | | |
Jean-François Pariseau(2)
Age: 50
Montréal, Québec, Canada | | Director | | June 4, 2015 | | Co-Founder and Partner at Amplitude Ventures (since July 2018); Partner, BDC Capital Healthcare Fund, a venture capital company (since July 2001 to June 2018). |
| | | | | | | |
Arthur Rosenthal(4)
Age: 72
Oro Valley, Arizona, USA | | Director | | June 14, 2018 | | Professor of Practice in the Biomedical Engineering Department at Boston University (since 2010); Chief Executive Officer of gEyeCue, Ltd., a medical technology company (since 2011). |
| (1) | Member of the Audit Committee. |
| (2) | Member of the Human Resources and Corporate Governance Committee. |
| (3) | Chair of the Audit Committee. |
| (4) | Chair of the Human Resources and Corporate Governance Committee. |
Director Biographies
Arun Menawat – Chief Executive Officer and Director – Dr. Menawat has an accomplished history of executive leadership success in the healthcare industry. Since April 2003 until to joining Profound, he served as the Chairman, President and CEO of Novadaq Technologies Inc., a TSX and Nasdaq listed company that marketed medical imaging and therapeutic devices for use in the operating room. Previously, he was President and Chief Operating Officer and Director of another publicly listed medical imaging software company, Cedara Software. His educational background includes a Bachelor of Science in Biology, University of District of Columbia, Washington, D.C., and a Ph.D. in Chemical Engineering, from the University of Maryland, College Park, MD, including graduate research in Biomedical Engineering from the National Institute of Health, Bethesda, MD. He also earned an Executive M.B.A. from the J.L. Kellogg School of Management, Northwestern University, Evanston, IL.
Brian Ellacott – Director – Mr. Ellacott is an experienced global medical device executive. Mr. Ellacott joined Belmont Instrument as Chief Executive Officer in December 2017. Belmont Instrument is a Boston based private equity owned medical device company with a leading global position in fluid warming and infusion systems. Prior to Belmont Instrument, Mr. Ellacott was the President and CEO of Laborie. Laborie is a Urology and Gastroenterology medical device company based in Toronto with manufacturing facilities in Toronto, Montreal, Enschede NL, Attikon Switzerland and Portsmouth New Hampshire. Mr. Ellacott joined private equity owned Laborie as President and CEO in July 2013 and in four years completed 14 global acquisitions tripling Laborie’s revenue and increasing EBITDA eight fold. The company was ranked as one of the fastest growing and most profitable medical device companies in the world. Prior to joining Laborie Medical Technologies (“Laborie”), Mr. Ellacott served as Executive Vice President and General Manager of Invacare’s (NYSE: IVC) $1 billion North and South American homecare and rehabilitation business. Mr. Ellacott has also held executive positions with Baxter International and American Hospital Supply, with assignments in Canada, Australia and the United States. Mr. Ellacott serves on the board of Belmont Instrument and is the past Chairman of the board of the Canadian Assistive Devices Association. Mr. Ellacott holds a Bachelor of Business Administration Degree from Wilfrid Laurier University, Waterloo, Ontario, Canada and is a dual United States and Canadian citizen.
Steve Forte – Director – Mr. Forte is a senior finance leader with broad experience managing complex, large-scale finance environments. Mr. Forte was most recently CFO of Clementia Pharmaceuticals (NASDAQ: CMTA), which was sold earlier this year to Ipsen S.A. in a transaction valued at US$1.3 billion. His experience includes nearly a decade at Aptalis Pharma Inc., where he was responsible for the overall corporate controllership function of a multinational pharmaceutical company with approximately $700 million in annual revenue. At Aptalis, Mr. Forte was responsible for SEC reporting and led the preparation of an SEC S-1 registration statement for a U.S. IPO on Nasdaq prior to the successful sale of the company to Forest Labs. Mr. Forte’s prior experience also includes Chief Financial Officer of Thinking Capital Financial Corporation, a leading Canadian financial technology firm. Mr. Forte received his Bachelor of Commerce in Accountacy from Concordia University and is a Certified Professional Accountant in the Province of Quebec and a Certified Information Systems Auditor with ISACA.
Kenneth Galbraith – Director – Mr. Galbraith is an accomplished life sciences industry veteran with over 30 years of experience acting as an executive, director, investor and advisor to companies in the biotechnology, medical device, pharmaceutical and healthcare sectors. Mr. Galbraith currently serves as the Chief Executive Officer of Prometic Life Sciences Inc. (TSX: PLI), a biotechnology company. Mr. Galbraith joined Ventures West as a General Partner in 2007 and led the firm’s biotechnology practice prior to founding Five Corners Capital in 2013 to continue management of the Ventures West investment portfolio. Previously, he served as the Chairman and Interim CEO of AnorMED until its sale to Genzyme Corp. in a cash transaction worth almost US$600 million. Starting his career in the life sciences sector in 1987, Mr. Galbraith spent 13 years in senior management with QLT Inc., retiring in 2000 from his position as Executive VP and CFO when QLT Inc.’s market capitalization exceeded US$5 billion. He has served on the board of directors of several public and private companies, including Angiotech Pharmaceuticals, Arbutus Biopharma and Cardiome Pharma. Mr. Galbraith currently serves on the board of directors of Macrogenics and Prometic Life Sciences Inc. Mr. Galbraith earned a Bachelor of Commerce (Honors) degree from the University of British Columbia in 1985 and was appointed a Fellow of the Chartered Accountants of British Columbia in 2013.
Linda Maxwell – Director – Dr. Maxwell, a seasoned surgeon and entrepreneur, is the Founding and Executive Director of the Biomedical Zone, a business incubator for emerging health technology companies. It is an innovative strategic partnership between St. Michael’s Hospital and Ryerson University. Under Dr. Maxwell’s stewardship, the Biomedical Zone has gone from concept to creation to going concern, supporting Toronto’s leading health technology businesses and driving disruption and innovation adoption in the clinical setting. Dr. Maxwell’s breadth of experience and scope of expertise is founded on over a decade and a half as an accomplished head and neck/facial plastic surgeon. Her academic medical career is distinguished by university appointments as a clinical instructor, medical school faculty member, and published scientific author. A frequent public speaker and panelist, Dr. Maxwell has addressed national and international communities on scientific research, innovation, and entrepreneurship. Additionally, Dr. Maxwell has worked internationally as a senior tech transfer manager and partnership leader for innovation and commercialization for the National Health Service and University of Oxford. She also worked for Medtronic on business strategy for South America (Brazil) and continues to consult to Medtronic on international clinical trials as an external medical monitor. In addition to her professional endeavors, Dr. Maxwell is a member of the Institute of Corporate Directors. She serves as a director for Profound, Gardiner Museum, and the Economic Club of Canada. She serves as an innovation and health technology subject matter expert for the Federal government’s Canadian Space Agency, Canadian Medical Association, and the Ontario Chief Innovation Strategist. Dr. Maxwell earned a Bachelor’s degree with honors from Harvard University (Biology, cum laude), M.D. from Yale University, and M.B.A. from University of Oxford. She completed six years of residency and fellowship training in surgery at the University of Toronto. Additionally, Dr. Maxwell successfully completed the Royal College of Canada, American College of Surgery, and American Board of Facial Plastic Reconstructive Surgery certifications.
Jean-François Pariseau – Director – Mr. Pariseau is co-founder and Partner at Amplitude Ventures. Amplitude Ventures is a capital catalyst for highly innovative companies at the point of value acceleration. Amplitude Ventures works with Canada’s most promising healthcare companies, with a shared vision of bringing groundbreaking technologies to patients. Amplitude Ventures is focused on building world-class Canadian companies in precision medicine and next-generation medical devices. Before co-founding Amplitude Ventures, Mr. Pariseau was Partner at the Healthcare Fund of BDC Capital and an investment manager with CDP Capital Technology Ventures, a $2 billion global fund investing in healthcare, information technology and advanced technologies, where he was responsible for healthcare investments in Canada and the United States. Prior to joining the investment world, Jean-Francois was CEO of a consulting company specializing in regulatory affairs, and VP, R&D for a pharmaceutical-product distribution company, both of which he founded. Mr. Pariseau holds a Bachelor of Science in Biotechnology from Université de Sherbrooke, a Master of Science in Biomedical Sciences from Université de Montréal, and an M.B.A. from HEC Montréal.
Arthur L. Rosenthal – Director – Dr. Rosenthal is director and Chair of Compensation Committee for LivaNova PLC, a UK global medical technology company. Prior, Dr. Rosenthal served on the Cyberonics board of directors as a non-executive director and Chair of the Compensation Committee from January 2007 to October 2015. Since June 2010, Dr. Rosenthal has served as Professor of Practice in the Biomedical Engineering Department at Boston University. Since December 2011, Dr. Rosenthal has also served as CEO of gEyeCue, Ltd., which he co-founded, a development stage medical device company working on a guided biopsy for lower and upper gastrointestinal cancer screening. From June 2011 until July 2012, Dr. Rosenthal served as executive vice chairman of Cappella Medical Devices Ltd. (now ArraVasc Ltd.), a development-stage company focused on novel device solutions for coronary artery disease. From June 2009 until June 2011, Dr. Rosenthal served as President and CEO of Cappella, Inc. Dr. Rosenthal served as chairman, from January 2002, and CEO, commencing in January 2005, of Labcoat, Ltd. until its acquisition by Boston Scientific Corporation in December 2008. From January 1994 to May 2000, Dr. Rosenthal was a Senior Vice President, Corporate Officer, and Chief Development Officer of Boston Scientific, and from May 2000 until his retirement in January 2005, he was a Senior Vice President, Chief Scientific Officer, and Executive Committee Member of Boston Scientific. From 2000 until 2010, Dr. Rosenthal served as a non-executive director, and from 2006 through 2009, as chairman of the Remuneration Committee, of Renovo, Ltd., a U.K. based pharmaceutical company that became publicly traded in 2006. In July 2009, Dr. Rosenthal joined the board of Interface Biologics, Inc., a Toronto-based development stage company focused on drug delivery devices, as a non-executive director. In April 2011, Dr. Rosenthal was elected Chairman at Interface Biologics, Inc. From April 2013 to May 2015, Dr. Rosenthal served as non-executive director and Member of the Compensation Committee of Arch Technologies, Inc. and is currently a member of Arch’s Clinical Advisory Board. In 2015, Dr. Rosenthal was appointed to the Industrial Advisory Committee, CURAM (National University in Galway, Ireland). Since 2003, Dr. Rosenthal has been a Fellow of the American Institute of Medical and Biological Engineering.
Senior Management
Set out below is information with respect to our senior management. Our officers serve for an indefinite term, subject to the terms of their employment agreements.
| Name | | Position | | Date Appointed |
| Arun Menawat | | Chief Executive Officer and Director | | August 15, 2016 |
| Mathieu Burtnyk | | Vice-President of Clinical Affairs | | July 7, 2011 |
| Aaron Davidson | | Chief Financial Officer and Senior Vice-President of Corporate Development | | May 1, 2018 |
| Rashed Dewan | | Vice President of Finance, Manufacturing and Service | | July 5, 2016 |
| Guruprit (Goldy) Singh | | Vice President of Regulatory Affairs and Product Management | | December 1, 2011 |
Senior Management Biographies
Arun Menawat – Chief Executive Officer and Director – see “Director Biographies” above.
Mathieu Burtnyk – Vice President of Clinical Affairs – Dr. Mathieu Burtnyk has over 15 years of experience creating and developing imaging technologies and therapeutic ultrasound solutions, from benchtop to bedside, with a focus on prostate disease. He started his career in academia, obtaining his PhD in Medical Biophysics at the University of Toronto and Sunnybrook Health Sciences Center. He is the inventor of the patented closed-loop temperature feedback control algorithm used by the TULSA-PRO today in clinic. Mathieu joined Profound in 2011 as Scientist progressing to Clinical Scientist, Director of Clinical Affairs and now VP Clinical Affairs, where he has led the scientific design and execution of pre-clinical, Phase I and TACT Pivotal clinical studies.
Aaron Davidson – Chief Financial Officer and Senior Vice-President of Corporate Development – Mr. Aaron Davidson has been the CFO and Senior Vice President of Corporate Development of Profound since May 2018, a medical technology company that is developing real-time MRI-guided thermal ultrasound systems for incision-free ablation of abnormal or cancerous tissue. Before joining Profound, Mr. Davidson served as Co-Head and Managing Director of H.I.G. BioHealth Partners from January 2004 through May 2018, where he focused on investment opportunities with emerging life sciences companies. Mr. Davidson began his career with Eli Lilly and Company, where he spent a decade in various operating management roles in the United States and Canada, including financial management, business development, strategic planning, market research and general management. Mr. Davidson continues to serve as a Venture Partner at H.I.G. Previously, Mr. Davidson led investments in, worked with the management teams of, and represented H.I.G. as a board member of several successful companies, including Alder Biopharmaceuticals (public), Forsight Vision5 (acquired), Gemin X Pharmaceuticals (acquired), HyperBranch Medical Technology (acquired), Intact Vascular, OnTarget Laboratories, Novadaq Technologies (public/acquired), and Salmedix (acquired). Mr. Davidson earned his M.B.A. from Harvard Business School and a Bachelor’s Degree in Finance from McGill University.
Rashed Dewan – Vice President of Finance, Manufacturing and Service – Mr. Dewan joined Profound in 2015 as Director of Finance and Corporate Controller. He has also served as Vice President, Finance and Interim Chief Financial Officer, and most recently, since 2018, as our Vice President of Finance, Manufacturing and Service. Prior to joining us, Mr. Dewan previously held senior finance and management roles with Xylem Canada from September 2013 to June 2015, Natus Medical from March 2010 to August 2013 and Psion Teklogix from 2001 to 2009. Mr. Dewan has over 20 years of finance and accounting experience in public and private companies, with expertise in the medical device sector. Mr. Dewan has extensive experience with systems design and implementation and a strong track record of success in accounting, finance, sales and operations management. Mr. Dewan is a Certified Public Accountant, and has a Bachelor of Science Degree with a concentration in Accounting from the University of Southern California.
Guruprit (Goldy) Singh – Vice President of Regulatory Affairs and Product Management – Ms. Singh is Vice President Regulatory Affairs & Product Management of Profound. She joined the Company in December 2011 as a VP Quality Assurance and Regulatory Affairs. In this role, she provided strategic direction on regulatory affairs, quality assurance, risk management, and clinical trials ensuring the product is introduced to markets efficiently and effectively. In 2019, she was given responsibility for the overall product management process of a particular product line. She works closely with internal and external stakeholders such as researchers, engineers, clinicians, hospital administrations, regulatory bodies etc. to ensure that the strategies are executable and achieve desired results. Before joining Profound, Ms. Singh spent 22 years in medical device companies in the Greater Toronto Area. Prior to Profound, she worked for Natus, as Director Quality Assurance and Regulatory Affairs, managed compliance and day-to-day operations through a substantial growth period including six acquisitions and commercialization of high-tech medical devices. She also worked for Philips and C.R. Bard. Ms. Singh has a Bachelor’s Degree with a major in Biology and Physics from Ranchi University, India.
B. Compensation
Executive Compensation
Compensation Discussion and Analysis
Objectives
We have relied on the experience of the Board and the Human Resources and Corporate Governance Committee in setting executive compensation. In considering compensation awards, the Human Resources and Corporate Governance Committee has considered the skill level of its executives as well as comparable levels of compensation for individuals with similar capabilities and experience. In regard to our current executive compensation arrangements, the Human Resources and Corporate Governance Committee has considered such factors as our current financial situation, our estimated financial situation in the mid-term and the need to attract and retain the key executives necessary for our long term success. The Human Resources and Corporate Governance Committee has determined that at this stage of the Company’s development it is appropriate that compensation be in the form of base salary, options, a potential bonus award and certain benefits plans.
Compensation Philosophy and Objectives
The executive compensation program adopted by us and applied to our executive officers is designed to:
| (a) | attract and retain qualified and experienced executives who have international business and operations experience and will contribute to our success; |
| (b) | ensure that the compensation of the executive officers provides a competitive base compensation package, with additional compensation to reward success and create a strong link between corporate performance and compensation; and |
| (c) | motivate executive officers to enhance long term shareholder value, with current compensation being weighted toward at-risk long-term incentives in the form of options and other security based incentives so as to foster alignment with the interests of our shareholders. |
The goals of the compensation program are to attract and retain the most qualified people with relevant experience, to motivate and reward such individuals on a short term and long term basis, and to create alignment between corporate performance and compensation. The Human Resources and Corporate Governance Committee and the Board intend that the total cash components of compensation (base salary plus discretionary cash bonus) target the median of a benchmark group in comparable industries with similar market capitalization (the “Compensation Peer Group”).
We do not believe that our compensation programs encourage excessive or inappropriate risk taking as: (i) our employees receive both fixed and variable compensation, and the fixed (salary) portion provides a steady income regardless of Common Share value which allows employees to focus on our business; and (ii) the Share Option Plan encourages a long term perspective due to the vesting provisions of the options (see “—Share Option Plan” below). We believe that our compensation program is appropriately structured and balanced to motivate our executives and reward the achievement of annual performance goals, as well as the achievement of long term growth in shareholder value.
Elements of Compensation
Base Salary
Base salary is intended to reflect an executive officer’s position within the corporate structure, his or her years of experience and level of responsibility, and salary norms in the sector and the general marketplace. As such, decisions with respect to base salary levels for executive officers are not based on objective identifiable performance measures but for the most part are determined by reference to competitive market information for similar roles and levels of responsibility, as well as more subjective performance factors such as leadership, commitment, accountability, industry experience and contribution. Our view is that a competitive base salary is a necessary element for retaining qualified executive officers, as it creates a meaningful incentive for individuals to remain with us and not be unreasonably susceptible to recruiting efforts by our competitors.
In determining the base salary compensation of the Named Executive Officers (as defined herein), the Board considered: (i) recruiting and retaining executives critical to the success of the Company and the enhancement of shareholder value; (ii) providing fair and competitive compensation; (iii) balancing the interests of management and our shareholders; and (iv) rewarding performance, both on an individual basis and with respect to operations in general.
Long-Term Incentives
Long-term incentives, in the form of options, are intended to align the interests of our directors and our executive officers with those of our shareholders, to provide a long-term incentive that rewards these individuals for their contribution to the creation of shareholder value and to reduce the cash compensation we would otherwise have to pay. The Share Option Plan is administered by the Board. In establishing the number of options to be granted to any particular executive officer, reference was made to the number of options granted to officers of other companies involved in similar businesses. The Board also considers previous grants of options and the overall number of options that are outstanding relative to the number of outstanding Common Shares in determining whether to make any new grants of options and the size and terms of any such grants, as well as the level of effort, time, responsibility, ability, experience and level of commitment of the executive officer in determining the level of incentive stock option compensation.
Bonus Awards
The Board will consider whether it is appropriate and in our best interests to award a discretionary cash bonus to executive officers for the most recently completed financial year and if so, in what amount. A cash bonus may be awarded to reward extraordinary performance that has led to increased value for our shareholders through property acquisitions or divestitures, the formation of new strategic or joint venture relationships and/or capital raising efforts.
Quantitative performance objectives include the achievement of our revenue targets, departmental and individual goals, which may be quantitative or qualitative in nature. These have been established for each individual executive officer by the Board with alignment of such corporate/individual goals with the CEO and include objectives such as research and product development, company productivity, revenue growth and our long-term strategic guidance. These corporate, departmental and individual goals form the basis for the review of the executive officers and the determination of cash bonuses at the end of each year with the Board. These awards are reviewed yearly to ensure that corporate performance metrics and individual goals are consistent from year to year.
Bonus award payments are based on the following assessment of:
| (a) | whether or not the executive officers have successfully met or exceeded the established corporate, departmental and individual performance metrics and goals; |
| (b) | the executive officers’ decisions and actions and whether or not they are aligned with our long-term growth strategy and have created value for our shareholders; |
| (c) | whether any near-term goals and objectives were not met because the executive officers made decisions in our best long-term interests or due to factors outside of the executive officers’ control; and/or |
| (d) | additional initiatives undertaken by the executive officers, which were not contemplated in the initial objectives. |
The following targets, as a percentage of base salary, were approved for each NEO for the fiscal year ending December 31, 2018:
| Position | | Target | |
| CEO | | | 65% | |
| Other NEOs | | | 20-45% | |
Benefits Plans
The Named Executive Officers, as defined below, are entitled to life insurance, health and dental benefits.
Performance Graph
The following graph illustrates the cumulative return to shareholders of a C$100 investment in Common Shares from June 8, 2015 to December 31, 2018, as compared to the cumulative total return on the Standard & Poor’s/TSX Index and Standard & Poor’s/TSX Venture Index for the same period, assuming the reinvestment of cash distributions and/or dividends.
| | | June 8, 2015 | | | December 31, 2015 | | | December 31, 2016 | | | December 31, 2017 | | | December 31, 2018 | |
| Profound Medical | | C$ | 100.00 | | | C$ | 53.33 | | | C$ | 74.67 | | | C$ | 56.00 | | | C$ | 36.67 | |
| S&P/TSX Composite Index | | C$ | 100.00 | | | C$ | 88.25 | | | C$ | 103.69 | | | C$ | 109.94 | | | C$ | 97.14 | |
| S&P/TSX Venture Composite Index | | C$ | 100.00 | | | C$ | 76.68 | | | C$ | 111.08 | | | C$ | 124.05 | | | C$ | 81.20 | |
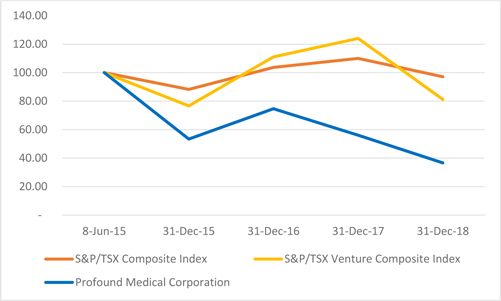
The trend shown in the above graph does not necessarily correspond to our trend of compensation for the NEOs (as defined herein) for the period disclosed above. We consider a number of factors in connection with our determination of appropriate levels of compensation including, but not limited to, the demand for and supply of skilled professionals with experience in the medical device industry, individual performance, our performance (which is not necessarily tied exclusively to the trading price of the Common Shares on the TSX or any other stock exchanges on which our Common Shares are listed and other factors discussed under “Compensation Discussion and Analysis” above).
Named Executive Officers
The following individuals are considered the “Named Executive Officers” or “NEOs” for the purposes of the disclosure:
| (a) | each individual who, during any part of the most recently completed financial year, served as our Chief Executive Officer (“CEO”), including an individual performing functions similar to a CEO; |
| (b) | each individual who, during any part of the most recently completed financial year, served as our Chief Financial Officer (“CFO”), including an individual performing functions similar to a CFO; |
| (c) | each of our three most highly compensated executive officers, or the three highly compensated officers acting in a similar capacity, other than the CEO and CFO, at the end of the most recently completed financial year whose total compensation was more than C$150,000 for the fiscal year ended December 31, 2018; and |
| (d) | each individual who would be a Named Executive Officer under paragraph (c) but for the fact the individual was not one of our executive officers and was not acting in a similar capacity as of December 31, 2018. |
Summary Compensation Table
The following table sets forth information concerning the total compensation for the three most recently completed financial years paid to the Named Executive Officers for the year ended December 31, 2018. Dr. Menawat is our only officer who also serves as one of our directors.
| | | | | | | | | | | | Non-Equity Incentive
Plan Compensation | | | | | | | | | |
| Name and Principal Position | | Year | | | Salary | | | Option-
Based
Awards | | | Annual
Incentive
Plan | | | Long
Term
Incentive
Plan | | Pension
Value | | | All Other
Compensation | | Total
Compensation | |
| | | | | | (C$) | | | (C$) | | | (C$) | | | (C$) | | | (C$) | | (C$) | |
| Arun Menawat(1) | | | 2018 | | | | 647,665 | | | | Nil | | | | 208,000 | | | Nil | | | Nil | | | Nil | | | 855,665 | |
| Chief Executive Officer and Director | | | 2017 | | | | 331,500 | | | | Nil | | | | Nil | | | Nil | | | Nil | | | Nil | | | 331,500 | |
| | | | 2016 | | | | 125,370 | | | | 2,197,221 | (5) | | | 24,363 | | | Nil | | | Nil | | | Nil | | | 2,346,954 | |
| Aaron Davidson(2) | | | 2018 | | | | 209,446 | | | | 913,015 | (6) | | | Nil | | | Nil | | | Nil | | | Nil | | | 1,122,461 | |
| Chief Financial Officer and Senior Vice- | | | 2017 | | | | Nil | | | | Nil | | | | Nil | | | Nil | | | Nil | | | Nil | | | Nil | |
| President of Corporate Development | | | 2016 | | | | Nil | | | | Nil | | | | Nil | | | Nil | | | Nil | | | Nil | | | Nil | |
| Ian Heynen(3) | | | 2018 | | | | 200,976 | | | | 730,412 | (6) | | | Nil | | | Nil | | | Nil | | | Nil | | | 931,388 | |
| Senior Vice-President of Sales and | | | 2017 | | | | Nil | | | | Nil | | | | Nil | | | Nil | | | Nil | | | Nil | | | Nil | |
| Marketing | | | 2016 | | | | Nil | | | | Nil | | | | Nil | | | Nil | | | Nil | | | Nil | | | Nil | |
| Rashed Dewan | | | 2018 | | | | 190,102 | | | | - | | | | 26,010 | | | Nil | | | Nil | | | Nil | | | 216,112 | |
| Vice-President of Finance | | | 2017 | | | | 184,301 | | | | 23,598 | (7) | | | - | | | Nil | | | Nil | | | Nil | | | 207,899 | |
| | | | 2016 | | | | 178,500 | | | | 124,513 | (8) | | | 12,888 | | | Nil | | | Nil | | | Nil | | | 315,901 | |
| Guruprit (Goldy) Singh | | | 2018 | | | | 209,131 | | | | Nil | | | | 15,604 | | | Nil | | | Nil | | | Nil | | | 224,735 | |
| Vice-President of Regulatory Affairs and | | | 2017 | | | | 205,020 | | | | Nil | | | | - | | | Nil | | | Nil | | | Nil | | | 205,020 | |
| Product Management | | | 2016 | | | | 204,000 | | | | Nil | | | | 14,800 | | | Nil | | | Nil | | | Nil | | | 218,800 | |
| (1) | Dr. Menawat was appointed CEO on August 15, 2016, as such he no longer receives any Director or Committee fees. |
| (2) | Mr. Davidson was hired as CFO and Senior Vice-President of Corporate Development on May 1, 2018. |
| (3) | Mr. Heynen was hired as Senior Vice-President Sales & Marketing on April 23, 2018 and resigned on January 7, 2019. |
| (4) | Nil indicates that perquisites and other personal benefits did not exceed C$50,000 or 10% of the total salary of the NEO for the financial year. |
| (5) | Option based awards granted utilize the Black-Scholes model to determine the fair value. The input factors to determine the fair value were volatility 99%, exercise price C$1.23, interest rate 1.35% and expected life of 6 years. |
| (6) | Option based awards granted utilize the Black-Scholes model to determine the fair value. The input factors to determine the fair value were volatility 82%, exercise price C$1.06, interest rate 2.30% and expected life of 6 years. |
| (7) | Option based awards granted utilize the Black-Scholes model to determine the fair value. The input factors to determine the fair value were volatility 135%, exercise price C$0.85, interest rate 1.90% and expected life of 6 years. |
| (8) | Option based awards granted utilize the Black-Scholes model to determine the fair value. The input factors to determine the fair value were volatility 99%, exercise price C$1.20, interest rate 0.94% and expected life of 6 years. |
Option-Based Awards
The following table sets forth information with respect to the unexercised options granted under the Share Option Plan to the NEOs that were outstanding as of December 31, 2018.
| | | | | | Option-Based Awards | |
| Name and Principal Position | | Number of
Common Shares
Underlying
Unexercised
Options | | | Option Exercise
Price | | | Option
Expiration Date | | Value of
Unexercised In-
the-Money
Options(6) | |
| | | | | | (C$) | | | | | (C$) | |
| Arun Menawat(1) | | | 33,000 | | | | 1.50 | | | Nov 12, 2024 | | | Nil | |
| Chief Executive Officer and Director | | | 934,055 | | | | 1.46 | | | Aug 22, 2026 | | | Nil | |
| | | | 16,500 | | | | 1.35 | | | Sep 15, 2026 | | | Nil | |
| | | | 364,141 | | | | 1.10 | | | Nov 24, 2026 | | | Nil | |
| | | | 1,417,583 | | | | 1.10 | | | Dec 21, 2026 | | | Nil | |
| | | | 2,000,000 | | | | 0.92 | | | May 16, 2029 | | | Nil | |
| Aaron Davidson(2) | | | 500,000 | | | | 1.19 | | | May 22, 2028 | | | Nil | |
| Chief Financial Officer and Senior Vice- | | | 500,000 | | | | 0.93 | | | Aug 23, 2028 | | | Nil | |
| President of Corporate Development | | | 1,000,000 | | | | 0.92 | | | May 16, 2029 | | | Nil | |
| Ian Heynen(3) | | | 400,000 | | | | 1.19 | | | May 22, 2028 | | | Nil | |
| Senior Vice-President of Sales and Marketing | | | 400,000 | | | | 0.93 | | | Aug 23, 2028 | | | Nil | |
| Rashed Dewan(4) | | | 30,000 | | | | 1.50 | | | Sept 8, 2025 | | | Nil | |
| Vice-President of Finance | | | 50,000 | | | | 1.35 | | | July 19, 2026 | | | Nil | |
| | | | 75,000 | | | | 1.10 | | | Nov 24, 2026 | | | Nil | |
| | | | 45,000 | | | | 0.85 | | | Nov 16, 2027 | | | Nil | |
| | | | 25,000 | | | | 0.92 | | | May 16, 2029 | | | Nil | |
| Guruprit (Goldy) Singh(5) | | | 50,000 | | | | 0.24 | | | Dec 1, 2021 | | | 15,500 | |
| Vice-President of Regulatory Affairs and | | | 25,000 | | | | 0.24 | | | Sept 12, 2022 | | | 7,750 | |
| Product Management | | | 300,000 | | | | 1.50 | | | Sept 8, 2025 | | | Nil | |
| | | | 200,000 | | | | 0.92 | | | May 16, 2029 | | | Nil | |
| (1) | As of December 31, 2018, Dr. Menawat held 2,765,279 options, with 1,549,389 of these options exercisable and the remaining balance vesting over a three-year period. In addition, Dr. Menawat was granted 2,000,000 additional options on May 16, 2019. |
| (2) | As of December 31, 2018, Mr. Davidson held 1,000,000 options, all options remain unvested and will vest over a three-year period. In addition, Mr. Davidson was granted 1,000,000 additional options on May 16, 2019. |
| (3) | Mr. Heynen was hired as Senior Vice-President Sales & Marketing on April 23, 2018 and resigned on January 7, 2019. All of these options expired upon his resignation. |
| (4) | As of December 31, 2018, Mr. Dewan held 200,000 options, with 110,003 of these options exercisable and the remaining balance vesting over a three-year period. In addition, Mr. Dewan was granted 25,000 additional options on May 16, 2019. |
| (5) | As of December 31, 2018, Ms. Singh held 375,000 options, with 325,000 of these options exercisable and the remaining balance vesting over a three-year period. In addition, Ms. Singh was granted 200,000 additional options on May 16, 2019. |
| (6) | The value shown is the product of the number of Common Shares underlying the option multiplied by the difference between the Common Share TSX closing price on December 31, 2018 of C$0.55 and the exercise price. |
Executive Employment Agreements – Termination and Change of Control Benefits
Each of Dr. Menawat, Mr. Davidson, Mr. Dewan, Ms. Singh and Dr. Burtnyk are party to executive employment agreements (the “Executive Employment Agreements”) with us. The Executive Employment Agreements have an indefinite term and contain standard confidentiality and non-solicitation provisions. We have agreed pursuant to the Executive Employment Agreements that each of Dr. Menawat, Mr. Davidson, Mr. Dewan, Ms. Singh and Dr. Burtnyk will receive base salaries determined by the Board and may receive discretionary bonuses, grants of options, reimbursement of expenses, benefits and certain perquisites as set forth in the Executive Employment Agreements, copies of which are filed as exhibits to this Registration Statement. The amounts paid in 2018 with respect to the applicable Executive Employment Agreements are set forth in the Summary Compensation Table above.
The following table sets forth information with respect to the estimated aggregate dollar amount to which each current NEO would have been entitled under his or her Executive Employment Agreement if an event resulting in termination of employment occurred on December 31, 2018.
| Name | | Triggering Event | | Cash Payment | | Value of Bonus and other Benefits | | | Value of Option Awards | | | Total Payout |
| Arun Menawat | | Termination with cause/resignation | | Nil(1) | | Nil | | | Nil(4) | | | Nil |
| | | Termination without cause | | C$682,100(2) | | C$446,472(2) | | | Nil(4) | | | C$1,128,572(2) |
| | | Change of control | | C$1,364,200(2) | | C$443,365(2) | | | Nil | | | C$1,807,565(2) |
| Aaron Davidson | | Termination with cause/resignation | | Nil(1) | | Nil | | | Nil(4) | | | Nil |
| | | Termination without cause | | C$158,500 | | C$95,100(3) | | | Nil(4) | | | C$253,600 |
| | | Change of control | | C$317,000 | | C$142,650 | | | Nil | | | C$459,650 |
| Rashed Dewan | | Termination with cause/resignation | | Nil(1) | | Nil | | | Nil(4) | | | Nil |
| | | Termination without cause | | C$95,051(6) | | C$12,966(3) | | | Nil(4) | | | C$108,017 |
| | | Change of control | | Nil | | Nil | | | Nil | | | Nil |
| Guruprit (Goldy) Singh | | Termination with cause/resignation | | Nil(1) | | Nil | | | C$23,250(4) | | | C$23,250 |
| | | Termination without cause | | C$106,110(7) | | C$10,135(3) | | | C$23,250 (4) | | | C$147,658 |
| | | Change of control | | Nil | | Nil | | | C$23,250 (5) | | | C$23,250 |
| (1) | In the event of a termination for just cause or resignation, we will have no further obligation to Dr. Menawat, Mr. Davidson, Mr. Dewan or Ms. Singh, as applicable, other than the payment of unpaid base salary, any bonus declared but not yet paid, plus all outstanding vacation pay and expense reimbursement. |
| (2) | Amounts paid in United States dollars and converted to Canadian dollars for reporting purposes. On December 31, 2018, the exchange rate for United States dollars expressed in Canadian dollars (as reported by the Bank of Canada) was US$1.00 = C$1.3642. |
| (3) | The value shown is a multiple of the annual cost of benefits and the average cash bonus paid in respect of the years ended December 31, 2018, 2017 and 2016. |
| (4) | The value shown is the product of the number of Common Shares underlying the vested options multiplied by the difference between the Common Share TSX closing price on December 31, 2018 of C$0.55 and the exercise price. |
| (5) | The value shown is the product of the number of Common Shares underlying the options multiplied by the difference between the Common Share TSX closing price on December 31, 2018 of C$0.55 and the exercise price. |
| (6) | If Mr. Dewan’s employment is terminated without cause, he is entitled to the greater of: (i) six months’ notice; or (ii) the minimum notice (or pay in lieu) and minimum severance, if any, to which he would be entitled under employments standards legislation. |
| (7) | If Ms. Singh’s employment is terminated without cause, she is entitled to six months’ notice and minimum severance, if any, to which she would be entitled under employments standards legislation. |
Director Compensation
Our directors were paid an annual fee of C$20,000 for their services in the year ended December 31, 2018, other than Dr. Menawat, who was compensated as CEO and Mr. Damian Lamb and Mr. Jean-François Pariseau, who were compensated by their employers (affiliates of the Company). Members of the Audit Committee received an additional C$5,000 for the year. Members of the Human Resources and Corporate Governance Committee received an additional C$2,500 for the year, and the Chair of the Audit Committee received an additional C$10,000 and the Chair of the Human Resources and Corporate Governance Committee received an additional C$5,000 for the year. Director and committee fees were prorated for partial year terms of service. Our directors are also eligible to receive an initial grant of options when joining the Board and additional grants on an annual basis. During 2018, each of Ms. Samira Sakhia, Mr. Kenneth Galbraith and Mr. William Curran were granted 16,500 options. Mr. Brian Ellacott, Dr. Arthur Rosenthal and Dr. Linda Maxwell were granted 33,000 options for joining the Board in 2018. Except as set out above, Directors are not eligible to receive any other compensation.
Summary Compensation Table
The following table sets forth information concerning compensation paid to the non-executive directors for the year ended December 31, 2018.
| Name | | Fees Earned | | | Option-based
awards | | | All Other
Compensation | | Total | |
| | | (C$) | | | (C$) | | | (C$) | | (C$) | |
| Damian Lamb(3) | | | Nil | | | | Nil | | | Nil | | | Nil | |
| Jean-François Pariseau | | | Nil | | | | Nil | | | Nil | | | Nil | |
| William Curran(3) | | | 32,500 | | | | 11,960 | (1) | | Nil | | | 44,460 | |
| Kenneth Galbraith | | | 35,625 | | | | 11,960 | (1) | | Nil | | | 47,585 | |
| Samira Sakhia(3) | | | 29,875 | | | | 11,960 | (1) | | Nil | | | 41,835 | |
| Brian Ellacott(4) | | | 12,250 | | | | 23,920 | (1) | | Nil | | | 36,170 | |
| Arthur Rosenthal(4) | | | 11,250 | | | | 23,920 | (1) | | Nil | | | 35,170 | |
| Linda Maxwell(5) | | | 5,000 | | | | 13,793 | (2) | | Nil | | | 18,793 | |
| (1) | Option based awards granted utilize the Black-Scholes model to determine the fair value. The input factors to determine the fair value were volatility 83%, exercise price C$1.02, interest rate 2.19% and expected life of 6 years. |
| (2) | Option based awards granted utilize the Black-Scholes model to determine the fair value. The input factors to determine the fair value were volatility 80%, exercise price C$0.60, interest rate 2.47% and expected life of 6 years. |
| (3) | Mr. Lamb, Mr. Curran, and Ms. Sakhia stepped down from the Board on June 13, 2019. Ms. Sakhia’s options will expire 90 days after the date of such resignation, and Mr. Curran’s options will expire as indicated in the table under “Option-Based Awards” below. |
| (4) | Mr. Ellacott and Mr. Rosenthal joined the Board on June 14, 2018. |
| (5) | Ms. Maxwell joined the Board on October 9, 2018. |
Option-Based Awards
The following table sets forth information with respect to the unexercised options granted under the Share Option Plan to the non-executive directors that were outstanding as of December 31, 2018.
| | | | | | Option-Based Awards | |
| Name | | Number of
Common Shares
Underlying
Unexercised
Options | | | Option Exercise
Price | | | Option
Expiration Date | | Value of
Unexercised In-
the-Money
Options(7) | |
| | | | | | (C$) | | | | | (C$) | |
| Samira Sakhia(1)(8) | | | 16,500 | | | | 0.97 | | | Apr 25, 2027 | | | Nil | |
| | | | 16,500 | | | | 1.02 | | | June 15, 2028 | | | Nil | |
| Kenneth Galbraith(2) | | | 33,000 | | | | 0.97 | | | Apr 25, 2027 | | | Nil | |
| | | | 16,500 | | | | 1.02 | | | June 15, 2028 | | | Nil | |
| William Curran(3)(8) | | | 33,000 | | | | 0.24 | | | Mar 16, 2022 | | | 10,230 | |
| | | | 16,500 | | | | 1.35 | | | Sep 15, 2026 | | | Nil | |
| | | | 16,500 | | | | 0.97 | | | Apr 24, 2027 | | | Nil | |
| | | | 16,500 | | | | 1.02 | | | June 15, 2028 | | | Nil | |
| Brian Ellacott(4) | | | 33,000 | | | | 1.02 | | | June 15, 2028 | | | Nil | |
| Arthur Rosenthal(5) | | | 33,000 | | | | 1.02 | | | June 15, 2028 | | | Nil | |
| Linda Maxwell(6) | | | 33,000 | | | | 0.60 | | | Nov 19, 2028 | | | Nil | |
| Damian Lamb(8) | | | Nil | | | | Nil | | | Nil | | | Nil | |
| Jean-François Pariseau | | | Nil | | | | Nil | | | Nil | | | Nil | |
| (1) | As of December 31, 2018, Ms. Sakhia held 33,000 options, with 16,500 of these options exercisable and the remaining balance vesting over a three-year period. |
| (2) | As of December 31, 2018, Mr. Galbraith held 49,500 options, with 11,000 of these options exercisable and the remaining balance vesting over a three-year period. |
| (3) | As of December 31, 2018, Mr. Curran held 82,500 options, with 66,000 of these options exercisable and the remaining balance vesting over a three-year period. |
| (4) | As of December 31, 2018, Mr. Ellacott held 33,000 options, all options remain unvested and will vest over a three-year period. |
| (5) | As of December 31, 2018, Dr. Rosenthal held 33,000 options, all options remain unvested and will vest over a three-year period. |
| (6) | As of December 31, 2018, Dr. Maxwell held 33,000 options, all options remain unvested and will vest over a three-year period. |
| (7) | The value shown is the product of the number of Common Shares underlying the Option multiplied by the difference between the Common Share TSX closing price on December 31, 2018 of C$0.55 and the exercise price. |
| (8) | Mr. Lamb, Mr. Curran, and Ms. Sakhia stepped down from the board on June 13, 2019. Ms. Sakhia’s options will expire 90 days after the date of such resignation, and Mr. Curran’s options will expire as indicated in the table above. |
Share Option Plan
The Share Option Plan is administered by the Board which may, from time to time, delegate to a committee of the Board, all or any of the powers conferred to the Board under the Share Option Plan. The Share Option Plan was originally adopted by the Board on June 4, 2015, and then amended and restated on December 8, 2016 effective January 26, 2017 and again on July 13, 2018.
The Share Option Plan provides that the Board may from time to time, in its discretion, grant to directors, officers, employees, consultants and any other person or entity engaged to provide ongoing services to the Company non-transferable options to purchase Common Shares, provided that the maximum number of Common Shares reserved for issuance under the Share Option Plan is equal to 13% of the issued and outstanding shares in the capital of the Company at the time of any option grant. If any option is exercised, cancelled, expired, surrendered or otherwise terminated for any reason, the number of Common Shares in respect of which the option is exercised, cancelled, expired, surrendered or otherwise terminated, as the case may be, will again be available for purchase pursuant to options granted under the plan. As at August 26, 2019, 10,373,929 options have been granted under the Share Option Plan, and 3,675,553 options are available for future grant under the Share Option Plan.
The aggregate number of Common Shares that may be (i) issued to insiders of the Company within any one-year period, or (ii) issuable to insiders of the Company at any time, in each case, under the Share Option Plan alone or when combined with all other security-based compensation arrangements of the Company, cannot exceed 10% of the outstanding Common Shares (the “Insider Participation Limits”).
The Board shall determine the exercise price of the options, provided that, it cannot be less than the Market Price of the Common Shares on the date of grant. For the purposes of the Share Option Plan, “Market Price” means the volume-weighted average price of the Common Shares on the stock exchange where the majority of trading volume and value of the Common Shares occurs (currently, the TSX), for the five trading days immediately preceding the relevant date on which the Market Price is to be determined.
The expiry date for an option under the Share Option Plan shall not be later than the 10th anniversary of the date such option is granted, subject to the expiry date falling with a corporate blackout period or within 5 business days following the expiry of such a blackout period, in which case the expiry date will be extended to the 10th business day following the expiry of the blackout period.
Unless otherwise specified by the Board, each option under the Share Option Plan generally vests and becomes exercisable as to 1/4 on the first anniversary of the date of grant and as to 1/36 on the first day of each calendar month thereafter. The Board has the discretion to permit accelerated vesting of options.
We do not provide any financial assistance to optionees to facilitate the purchase of Common Shares issued pursuant to the exercise of options under the Share Option Plan. Options granted under the Share Option Plan are not transferable or assignable (except to an optionee’s estate) and no options may be exercised by anyone other than the optionee or his or her legal representative during the lifetime of the optionee.
We intend to adopt and approve material changes to the Share Option Plan, and any other equity incentive plans that we may have in the future, in accordance with TSX listing rules, which do not impose a requirement of shareholder approval for such actions.
In addition, following our proposed listing on Nasdaq, we plan to file a registration statement on Form S-8 to register the Common Shares issuable upon exercise of options granted under the Share Option Plan.
C. Board Practices
Our directors are elected by shareholders at each annual general meeting.
Audit Committee
Our audit committee (the “Audit Committee”) consists of all independent directors within the meaning of Nasdaq listing standards and Rule 10A-3 under the U.S. Exchange Act. Currently, the members of the Audit Committee are Kenneth Galbraith (Chair), Brian Ellacott and Steve Forte. The Audit Committee oversees the accounting and financial reporting practices and procedures of our financial statements. The principal responsibilities of the Audit Committee include: (i) overseeing the quality and integrity of our internal controls and accounting procedures, including reviewing our procedures for internal control with our external auditor and CFO; (ii) reviewing and assessing the quality and integrity of our annual and quarterly financial statements and related management discussion and analysis, as well as all other material continuous disclosure documents; (iii) monitoring compliance with legal and regulatory requirements related to financial reporting; (iv) reviewing and approving the engagement of our external auditor and independent audit fees; (v) reviewing the qualifications, performance and independence of our external auditor, considering the external auditor’s recommendations and managing the relationship with the external auditor, including meeting with the external auditor as required in connection with the audit services provided to us; (vi) assessing our financial and accounting personnel; (vii) reviewing our risk management procedures; (viii) reviewing any significant transactions outside of our ordinary course of business and any pending litigation involving us; and (ix) examining improprieties or suspected improprieties with respect to accounting and other matters that affect financial reporting.
Audit Committee Charter
The Audit Committee reviews and reassesses the adequacy of its charter periodically as it deems appropriate and recommend changes to the Board. The performance of the Audit Committee is evaluated with reference to its charter annually or otherwise periodically as deemed appropriate by the Board. A copy of our Audit Committee’s charter is available on our website at https://profoundmedical.com/investors/#governance. The information on our website is not incorporated by reference into this Registration Statement and should not be considered a part of this Registration Statement, and the reference to our website in this Registration Statement is an inactive textual reference only.
Audit Committee Oversight
At no time since the commencement of our most recently completed financial period was a recommendation of the Audit Committee to nominate or compensate an external auditor not adopted by the Board.
External Auditor Service Fees by Category
The aggregate fees billed (excluding out-of-pocket expenses) by our external auditor in the last two fiscal years are as follows:
| Financial Year Ending | | | Audit
Fees(1) | | | Audit
Related
Fees(2) | | | Tax Fees(3) | | | All Other
Fees(4) | |
| December 31, 2018 | | | C$ | 365,776 | | | | - | | | C$ | 61,215 | | | | - | |
| December 31, 2017 | | | C$ | 313,400 | | | C$ | 29,700 | | | C$ | 186,000 | | | | - | |
| (1) | Audit fees include annual audit, quarterly reviews and work performed in relation to the 2018 Bought Deal. |
| (2) | Audit related fees includes work performed on acquisitions. |
| (3) | Tax fees includes fees related to annual tax returns and scientific research credit return along with tax and transfer pricing advice. |
Human Resources and Corporate Governance Committee
Our Human Resources and Corporate Governance Committee is comprised of four independent directors; currently, Arthur Rosenthal (Chair), Kenneth Galbraith, Jean-Francois Pariseau and Linda Maxwell. The Human Resources and Corporate Governance Committee oversees our remuneration policies and practices. The principal responsibilities of the Human Resources and Corporate Governance Committee include:
| (a) | with respect to human resources: (i) assist the Board in ensuring that the necessary policies and processes are in place by which all of our employees, with special attention to the executive group, will be fairly and competitively compensated; and (ii) produce a report on executive compensation for inclusion in our proxy statement as required by applicable rules and regulations; and |
| (b) | with respect to corporate governance: (i) identify individuals qualified to become Board members, and recommend that the Board select the director nominees for the next annual meeting of shareholders; and (ii) develop and recommend to the Board the corporate governance guidelines and processes applicable to us, review these guidelines and processes at least annually and recommend changes to the Board. |
A copy of our Human Resources and Corporate Governance Committee’s charter is available on our website at https://profoundmedical.com/investors/#governance. The information on our website is not incorporated by reference into this Registration Statement and should not be considered a part of this Registration Statement, and the reference to our website in this Registration Statement is an inactive textual reference only.
Statement of Corporate Governance Practices
The Board is committed to a high standard of corporate governance practices. The Board believes that this commitment is not only in the best interests of our shareholders but that it also promotes effective decision making at the Board level. The Board is of the view that its approach to corporate governance is appropriate and continues to work to align with the recommendations currently in effect and contained in National Policy 58-201 - Corporate Governance Guidelines which are addressed below. In connection with our Nasdaq listing, we will become subject to certain U.S. corporate governance requirements. However, we intend to comply with home country jurisdiction rules, including the rules of the TSX, instead of certain applicable Nasdaq rules, including with respect to shareholder approvals of equity compensation plans and additional issuances of our Common Shares and the minimum quorum requirement for a shareholders meeting. Under Nasdaq listing rules, the required minimum quorum for a shareholders meeting is 33 1/3% of the outstanding common shares, and our minimum quorum requirement is only 10% of the total number of voting rights attaching to all outstanding Common Shares. See Item 10.B, “Additional Information—Memorandum and Articles of Association—Meetings”.
Mandate of the Board
The Board has responsibility for stewardship of the Company. The Board has adopted a written mandate for the Board (the “Mandate”) to confirm and enhance the Board’s ongoing duty and responsibility for stewardship of the Company, a copy of which is available on our website at www.profoundmedical.com. The information on our website is not incorporated by reference into this Registration Statement and should not be considered a part of this Registration Statement, and the reference to our website in this Registration Statement is an inactive textual reference only. The Board is ultimately responsible for supervising the management of our business and affairs and, in doing so, is required to act in our best interests. The Board generally discharges its responsibilities either directly or through the Audit Committee and the Human Resources and Corporate Governance Committee. Specific responsibilities of the Board set out in the Mandate include:
| (a) | Appointing Management – including approval of the CEO, the compensation of the executive officers and the oversight of succession planning programs; |
| (b) | Board Organization – including responding to recommendations received from the Human Resources and Corporate Governance Committee, but the Board retains the responsibility for managing its own affairs; |
| (c) | Strategic Planning – including the review and approval of our business, financial and strategic plans on at least an annual basis; |
| (d) | Monitoring of Financial Performance and Other Financial Reporting Matters – including the review of our ongoing financial performance and results of operations and review and approval of our audited and interim consolidated financial statements and management’s discussion and analysis of financial conditions and results of operations; |
| (e) | Risk Management – including the identification of our principal business risks and the implementation of appropriate systems to effectively monitor and manage such risks; |
| (f) | Policies and Procedures – including the approval and monitoring of all policies and procedures including those related to corporate governance, ethics and confidentiality; |
| (g) | Communication and Reporting – including the oversight of the timely and accurate disclosure of financial reports and other material corporate developments; and |
| (h) | Other Responsibilities – including those related to position descriptions, orientation and continuing education, nomination of directors and Board evaluations and matters in respect of any disposition, material commitment or venture, or significant expenditure in either monetary or business terms. |
Composition of the Board
Director Independence
Jean-François Pariseau, Brian Ellacott, Arthur Rosenthal, Linda Maxwell, Kenneth Galbraith and Steve Forte are all “independent” as such term is defined by National Instrument 58-101 – Disclosure of Corporate Governance Practices and applicable Nasdaq listing rules. Arun Menawat is non-independent as he is our CEO. Each of the independent directors has no direct or indirect material relationship with us, including any business or other relationship, which could reasonably be expected to interfere with the director’s ability to act with a view to our best interests or which could reasonably be expected to interfere with the exercise of the director’s independent judgment.
If the Chairman is not independent, the independent directors may select one of their members to be appointed Lead Director of the Board for such term as the independent directors may determine. The Lead Director is responsible for chairing regular meetings of the independent directors and seeking to ensure that the Board is able to carry out its role.
Dr. Arun Menawat acts as Chairman of the Board. Since Dr. Menawat is not independent, Brian Ellacott has been appointed Lead Director of the Board.
The table below shows the current Board and committee membership.
| | Committees |
| | Year Appointed | | Audit | | Human Resources and
Corporate Governance
Committee |
| Not Independent – Management | | | | | |
| Arun Menawat (Chairman) | 2019 (2015 as director) | | | | |
| Independent Board Members | | | | | |
| Jean-François Pariseau | 2015 | | | | Member |
| Kenneth Galbraith | 2017 | | Chair | | Member |
| Arthur Rosenthal | 2018 | | | | Chair |
| Brian Ellacott | 2018 | | Member | | |
| Linda Maxwell | 2018 | | | | Member |
| Steve Forte | 2019 | | Member | | |
Meetings of Independent Directors
All independent directors on the Board and each of the committees meet regularly without management present. The Chairman of the Board conducts these sessions at Board meetings and the Chair of each committee conducts them at committee meetings. During the year ended December 31, 2018, there were 7 such meetings of the independent directors.
Chairman of the Board
Our Chairman, Dr. Arun Menawat, is our Chief Executive Officer and as a result does not meet the Board’s independence standards. The primary functions of the Chairman are to facilitate the operations and deliberations of the Board and the satisfaction of the Board’s responsibilities under its mandate. The Chairman’s key responsibilities include duties relating to providing overall leadership to the Board, chairing Board and shareholder meetings, acting as a liaison between management, the members of the Board and the Chairs of the various committees of the Board, and communicating with shareholders and regulators. The responsibilities of the Chairman are reviewed by the Human Resources and Corporate Governance Committee and considered by the Board for approval each year.
Director Term Limits and Other Mechanics of Board Renewal
The Board has not established any term limits for directors, as the Board takes the view that term limits are an arbitrary mechanism for removing directors which can result in valuable, experienced directors being forced to leave the Board solely because of length of service. The Board’s priorities continue to be ensuring the appropriate skill sets are present amongst the Board to optimize the benefit to us. The Board conducts annual evaluations of the individual directors, the committees of the Board and the Chairman of the Board, which are overseen by the Human Resources and Corporate Governance Committee, to ensure these objectives are met.
Other Reporting Issuer Experience
The following table sets out our current directors who are presently directors of other issuers that are public companies in the United States, Canada or a foreign jurisdiction, the name of such public companies and the name of the exchange or market applicable to such public companies:
| Name | | Name of Public Company | | Name of Exchange or Market
(if applicable) |
| Kenneth Galbraith | | Macrogenics, Inc., Prometic Life Sciences Inc. | | Nasdaq, Toronto Stock Exchange |
| Arthur Rosenthal | | LivaNova PLC | | Nasdaq |
Board Meetings
The Board holds a minimum of one regular meeting per quarter and a corporate strategy session each year, as well as additional meetings as required. An in camera session of the directors is held at each regularly scheduled Board and committee meeting so that the independent members of the Board have an opportunity to meet without the presence of management members of the Board.
Meeting Attendance
| | | Board Meetings Attended
in 2018 | | Committee Meetings
Attended in 2018 | |
| Name | | No. | | % | | | No. | | | % | |
| Damian Lamb(5) | | 7 of 7 | | | 100 | % | | | - | | | | - | |
| Jean-François Pariseau | | 7 of 7 | | | 100 | % | | | 4 of 4(3) | | | | 100 | % |
| Arun Menawat | | 7 of 7 | | | 100 | % | | | - | | | | - | |
| William Curran(5) | | 7 of 7 | | | 100 | % | | | 8 of 8(3) (4) | | | | 100 | % |
| Kenneth Galbraith | | 5 of 7 | | | 71 | % | | | 6 of 8(3) (4) | | | | 75 | % |
| Samira Sakhia(5) | | 4 of 7 | | | 57 | % | | | 1 of 2(4) | | | | 50 | % |
| Arthur Rosenthal | | 5 of 5(1) | | | 100 | % | | | 2 of 2(3) | | | | 100 | % |
| Brian Ellacott | | 5 of 5(1) | | | 100 | % | | | 2 of 2(4) | | | | 100 | % |
| Linda Maxwell | | 1 of 2(2) | | | 50 | % | | | - | | | | - | |
| (1) | Dr. Rosenthal and Mr. Ellacott joined the Board on June 14, 2018. |
| (2) | Dr. Maxwell joined the Board on October 9, 2018. |
| (3) | Human Resources and Compensation Committee. |
| (5) | Mr. Lamb, Mr. Curran, and Ms. Sakhia stepped down from the board on June 13, 2019. |
Orientation and Education
We will provide new directors with copies of relevant financial, technical and other information regarding our programs. Board members are also encouraged to communicate with management and the external auditor and, to keep themselves current with industry trends and developments. Board members have full access to our records.
D. Employees
As of June 30, 2019, we had 67 full-time employees, 14 of whom in Vantaa, Finland that were unionized. We believe that our relations with our employees are positive. We intend to add staff and consulting resources in order to support product development, market access, field support and additional clinical trials.
E. Share Ownership
As of August 26, 2019, our NEOs and directors in 2018, as a group, beneficially owned a total of 18,547,317 Common Shares, representing beneficial ownership of 17.2% of the Common Shares.
The following table states the number of Common Shares beneficially owned by each of our NEOs and directors in 2018 as of August 26, 2019. The persons listed below are deemed to be the beneficial owners of Common Shares underlying options and/or warrants that are exercisable within 60 days from the above date. The percentages shown below are based on an aggregate total of 108,027,939 outstanding Common Shares as of August 26, 2019, plus the number of Common Shares underlying options and warrants that are exercisable within 60 days for the indicated beneficial owner.
| Name of Beneficial Owner | | Number of
Common Shares
Beneficially Owned | | | Percent of
Outstanding
Common Shares | |
| Named Executive Officers (2018) | | | | | | | | |
| Arun Menawat(1) | | | 3,006,862 | | | | 2.7 | % |
| Aaron Davidson | | | * | | | | * | |
| Rashed Dewan | | | * | | | | * | |
| Ian Heynen(2) | | | - | | | | - | |
| Guruprit (Goldy) Singh | | | * | | | | * | |
| | | | | | | | | |
| Non-Executive Directors (2018) | | | | | | | | |
| William Curran(3) | | | * | | | | * | |
| Brian Ellacott | | | * | | | | * | |
| Kenneth Galbraith | | | - | | | | - | |
| Damian Lamb(3)(4) | | | 14,828,144 | | | | 13.6 | % |
| Linda Maxwell | | | * | | | | * | |
| Jean-Francois Pariseau | | | - | | | | - | |
| Arthur Rosenthal | | | - | | | | - | |
| Samira Sakhia(3) | | | * | | | | * | |
* Represents less than 1% beneficial ownership of the Common Shares.
(1) Includes 1,888,862 Common Shares underlying options issued under our Share Option Plan (see Item 6.B, “Compensation—Director Compensation” and Item 6.B, “Compensation—Share Option Plan”) and pursuant to a shareholder-approved option grant in January 2017 (see Item 7.B, “Related Party Transactions”) and 150,000 Common Shares underlying warrants purchased in connection with the 2017 Bought Deal and the 2018 Bought Deal (see Item 5.B, “Liquidity and Capital Resources—Recent Sources and Uses of Financing—Bought Deals” and Item 7.B, “Related Party Transactions”).
(2) Mr. Heynen resigned on January 7, 2019.
(3) Mr. Curran, Mr. Lamb and Ms. Sakhia stepped down from the Board on June 13, 2019.
(4) Represents beneficial ownership of 13,328,144 Common Shares and 750,000 Common Shares underlying warrants directly held by Genesys, of which entity Mr. Lamb is an officer. See Item 7.A, “Major Shareholders”.
ITEM 7. MAJOR SHAREHOLDERS AND RELATED PARTY TRANSACTIONS
A. Major Shareholders
As of August 26, 2019, we had 108,027,939 issued and outstanding Common Shares.
The following table states the number of Common Shares beneficially owned by each person known to us who beneficially owns more than 5% of our issued and outstanding Common Shares as of August 26, 2019. The persons listed below are deemed to be the beneficial owners of Common Shares underlying options and/or warrants that are exercisable within 60 days from the above date. The percentages shown below are based on an aggregate total of 108,027,939 outstanding Common Shares as of August 26, 2019, plus the number of Common Shares underlying options or warrants that are exercisable within 60 days for the indicated beneficial owner.
| Name | | Number of
Common Shares
Beneficially Owned | | | Percent of
Outstanding
Common Shares | |
| BDC Capital Inc. (“BDC Capital”) | | | 13,441,792 | | | | 12.4 | % |
| Genesys Ventures II LP (“Genesys”) (1) | | | 14,828,144 | | | | 13.6 | % |
| Gagnon Securities LLC | | | 11,305,534 | | | | 10.5 | % |
(1) Includes 750,000 Common Shares underlying warrants purchased in connection with the 2018 Bought Deal. See also Item 5.B, “Liquidity and Capital Resources—Recent Sources and Uses of Financing—Bought Deals” and Item 7.B, “Related Party Transactions”.
Significant Changes in the Ownership of Major Shareholders
During the past three years, to our knowledge, the significant changes in the percentage ownership of our major shareholders were as follows:
| · | On January 8, 2019, Gagnon Securities LLC reported that it became the beneficial owner of more than 10% of our Common Shares. |
| · | On March 20, 2018, Genesys acquired 1,500,000 Common Shares and 750,000 warrants to purchase Common Shares in the 2018 Bought Deal. |
| · | On November 14, 2016, Genesys acquired 2,727,272 Common Shares in the 2016 Bought Deal. |
| · | On November 14, 2016, BDC Capital acquired 3,636,363 Common Shares in the 2016 Bought Deal. |
Major Shareholders Voting Rights
Our major shareholders do not have different voting rights from other holders of our Common Shares.
Record Holders
Based on our records and a review of the information provided to us by the TSX, as of August 2, 2019, there were 2,420 holders of record of our ordinary shares, of which 896 record holders, holding approximately 36% of our outstanding ordinary shares, had registered addresses in the United States. These numbers are not representative of the number of beneficial holders of our ordinary shares nor is it representative of where such beneficial holders reside primarily because many of these ordinary shares may be held of record by brokers or other nominees.
B. Related Party Transactions
Except as disclosed below, none of our directors or officers, nor any of our proposed nominees for election as a director, nor any of our other insiders, nor any associate or affiliate of any one of them, has or has had, at any time since the beginning of our financial year ended December 31, 2016, any material interest, direct or indirect, in any transaction or proposed transaction that has materially affected or would materially affect us.
In March 2018, Genesys, of which entity Mr. Lamb (our former director) is an officer, purchased 1,500,000 of units in the 2018 Bought Deal at a price of C$1.00 per unit, for total consideration of C$1,500,000.
Three members of our senior management, Dr. Menawat, Mr. Davidson and Mr. Dewan, also purchased our units in the 2018 Bought Deal, in the amounts of 150,000 units (150,000 Common Shares and 75,000 warrants), 125,000 units (125,000 Common Shares and 62,500 warrants) and 50,000 units (50,000 Common Shares and 25,000 warrants), respectively, at a price of C$1.00 per unit, for total consideration of C$150,000, C$125,000 and C$50,000 respectively. The units were issued on the same terms as the units issued in the 2018 Bought Deal. For more information, see Item 5.B, “Liquidity and Capital Resources—Recent Sources and Uses of Financing—Bought Deals”.
In September 2017, three members of our senior management, Dr. Menawat, Mr. Dewan and Ms. Singh, purchased our units in the 2017 Bought Deal, in the amounts of 150,000 units (150,000 Common Shares and 75,000 warrants), 100,000 units (100,000 Common Shares and 50,000 warrants) and 100,000 units (100,000 Common Shares and 50,000 warrants), respectively, at a price of C$1.00 per unit, for total consideration of C$150,000, C$100,000 and C$100,000, respectively. The units were issued on the same terms as the units issued in the 2017 Bought Deal. For more information, see Item 5.B, “Liquidity and Capital Resources—Recent Sources and Uses of Financing—Bought Deals”.
At the Special Meeting of Shareholders of the Company held in January 2017, the disinterested shareholders approved the grant of an option to purchase 1,417,583 Common Shares for an exercise price of C$1.10 to Arun Menawat.
In November 2016, Genesys, of which entity Mr. Lamb is an officer, purchased 2,727,272 Common Shares in the 2016 Bought Deal at a price of C$1.10 per Common Share, representing aggregate consideration of C$2,999,999.20. Genesys acquired the Common Shares for investment purposes.
In November 2016, BDC Capital purchased 3,636,363 Common Shares in the 2016 Bought Deal at a price of C$1.10 per Common Share, representing aggregate consideration of C$3,999,999.30. BDC Capital acquired the Common Shares for investment purposes.
Agreements with Directors and Officers
We have employment agreements in place with our Chief Executive Officer, Arun Menawat; our Chief Financial Officer, Aaron Davidson; our Vice President, Finance, Rashed Dewan and our Vice-President of Regulatory Affairs and Product Management, Guruprit (Goldy) Singh and Mathieu Burtnyk, our Vice President Clinical Affairs. See Item 6.B, “Compensation—Named Executive Officers—Executive Employment Agreements – Termination and Change of Control Benefits”.
C. Interests of Experts and Counsel
Not Applicable.
ITEM 8. FINANCIAL INFORMATION
A. Consolidated Statements and Other Financial Information
Our unaudited consolidated financial statements as at and for the three and six months ended June 30, 2019 and 2018 and our audited consolidated financial statements as at and for the years ended December 31, 2018, 2017 and 2016 are attached hereto and found immediately following the text of this Registration Statement, beginning on page F-1. The audit report of PwC is included herein immediately preceding the audited consolidated financial statements.
Legal Proceedings
From time to time, we may become involved in legal or regulatory proceedings arising in the ordinary course of business. During the most recently completed fiscal year: (a) there were no legal proceedings to which we were a party, or by which any of our property was subject, which would be material to it and are not aware of any such proceedings being contemplated, (b) there were no penalties or sanctions imposed by a court relating to securities legislation, or other penalties or sanctions imposed by a court or regulatory body against us that would likely be considered important to a reasonable investor making an investment decision and (c) we have not entered into any settlement agreements before a court relating to securities legislation or with a securities regulatory authority.
Dividend Policy
We have not declared or paid any dividends since incorporation and we have no present intention to declare or pay any dividends in the foreseeable future. Any decision to declare or pay dividends on the Common Shares will be made by the board of directors based upon our earnings, financial requirements and other conditions existing at such future time.
B. Significant Changes
Except as otherwise disclosed in this Registration Statement, there have been no significant changes in our financial condition since the most recent consolidated financial statements for the three and six months ended June 30, 2019.
ITEM 9. THE OFFER AND LISTING
A. Offer and Listing Details
Our Common Shares are listed and posted for trading on the TSX under the trading symbol “PRN”. We intend to apply for our Common Shares to be listed on Nasdaq under the trading symbol “PROF”. Such a listing is dependent upon this Registration Statement being declared effective as well as our meeting all the necessary listing requirements of the Nasdaq.
As of the date of this Registration Statement, our authorized capital consisted of an unlimited number of Common Shares without par value. Our issued and outstanding Common Shares are fully paid. We have no other authorized class of equity securities.
Our Common Shares are in registered form and the transfer of our common shares is managed by our transfer agent, TSX Trust Company, 301 – 100 Adelaide St. W., Toronto, ON, M5H 4H1 (Tel: (416) 342-1091). Our transfer agent in the United States will be Computershare Trust Company, N.A., Canton, MA.
For additional details regarding our Common Shares, see Item 10.A, “Share Capital”.
B. Plan of Distribution
Not applicable.
C. Markets
See Item 9.A, “Offer and Listing Details”.
D. Selling Shareholders
Not applicable.
E. Dilution
Not applicable.
F. Expenses of the Issue
Not applicable.
ITEM 10. ADDITIONAL INFORMATION
A. Share Capital
Our authorized capital consists of an unlimited number of Common Shares without par value.
As at August 26, 2019, there were a total of 108,027,939 Common Shares issued and outstanding. The holders of the Common Shares are entitled to receive notice of and to attend all annual and special meetings of our shareholders and to one vote in respect of each common share held at such meetings. Since January 1, 2016, we have issued a total of 68,599,612 Common Shares, principally in connection with the Bought Deals and issuances upon exercise of options and warrants
As at August 26, 2019, there were a total of 10,373,929 outstanding share options issued under our Share Option Plan and 22,571,714 outstanding warrants issued pursuant to the Bought Deals and the CIBC Loan Agreement. See Item 5.B, “Liquidity and Capital Resources—Recent Sources and Uses of Financing”. In addition, as at August 26, 2019, 3,675,553 options remain available for future grant under the Share Option Plan. See Item 6.B, “Compensation—Share Option Plan”.
B. Memorandum and Articles of Association
Set out below is a description of our articles of incorporation (our “Articles”) and of the Business Corporations Act (Ontario) (as currently in effect) related to our articles of incorporation. Our articles of incorporation are filed as an exhibit to this Registration Statement.
Incorporation
Profound is organized under the Business Corporations Act (Ontario) (“OBCA”). Profound’s Ontario corporation number is 2426652.
Objects and Purposes of our Company
Our Articles do not contain and are not required to contain a description of our objects and purposes. There is no restriction contained in our Articles of the business that we may carry on.
Voting on Certain Proposal, Arrangement, Contract or Compensation by Directors
Neither our Articles nor our by-laws restrict our directors’ power to: (a) vote on a proposal, arrangement or contract in which the directors are materially interested; (b) to vote with regard to compensation payable to themselves or any other members of their body in the absence of an independent quorum; or (c) borrow money. Additionally, a director is not required to hold a share in our capital as qualification for his or her office but must be qualified as required by the OBCA to become, act or continue to act as a director.
Share Rights
The holders of the Common Shares are entitled to receive notice of and to attend all annual and special meetings of the shareholders of the Company and to one vote in respect of each common share held at such meetings.
Procedures to Change the Rights of Shareholders
The rights, privileges, restrictions and conditions attaching to the Common Shares are contained in our Articles and such rights, privileges, restrictions and conditions may be changed by amending our Articles. In order to amend such Articles, the OBCA requires a resolution to be passed by a majority of not less than two-thirds of the votes cast by the shareholders entitled to vote thereon. In addition, if we resolve to make certain amendments to its Articles, a holder of Common Shares may dissent with regard to such resolution and, if such shareholder so elects, we would have to pay such shareholder the fair value of the Common Shares so held. The types of amendment that would be subject to dissent rights include without limitation: (a) to add, remove or change restrictions on the issue, transfer or ownership of shares of a class or series of our shares; and (b) to add, remove or change any restriction upon the business that we may carry on or upon the powers we may exercise.
Meetings
Each director holds office until our next annual general meeting or until his or her office is earlier vacated in accordance with the provisions of the OBCA. A director appointed or elected to fill a vacancy on our board of directors also holds office until our next annual general meeting.
Annual meetings of our shareholders must be held at such time in each year not more than fifteen (15) months after the last annual meeting, as the board of directors may determine. Pursuant to our by-laws, notice of the time and place of a meeting of shareholders must be sent not less than twenty-one (21) days and not more than fifty (50) days, before such meeting.
The only persons entitled to attend a meeting of our shareholders are voting persons, the directors, the auditor and, if any, the chairperson, the managing director and the President, as well as others permitted by the chairperson of the meeting.
The OBCA provides that our shareholders may requisition a special meeting in accordance with the OBCA. The OBCA provides that the holders of not less than five (5) percent of our issued shares that carry the right to vote at a meeting may requisition our directors to call a special meeting of shareholders for the purposes stated in the requisition.
Under our by-laws, the quorum for the transaction of business at a meeting of our shareholders is two or more voting persons present in person and authorized to cast in the aggregate not less than ten (10) percent of the total number of votes attaching to all Common Shares. Under Nasdaq listing rules, the required minimum quorum for a shareholders meeting is 33 1/3% of the outstanding common shares; however, we are relying on an exception for “foreign private issuers” to this quorum requirement insofar as the provisions of our Articles are permitted under the OBCA.
Limitations on Ownership of Securities
Except as provided in the Investment Canada Act (Canada), there are no limitations specific to the rights of non-Canadians to hold or vote the Common Shares under the laws of Canada or Ontario, or in our Articles or by-laws.
Change in Control
There are no provisions in our Articles or by-laws that would have the effect of delaying, deferring or preventing a change in control of us, and that would operate only with respect to a merger, acquisition or corporate restructuring involving us or any of our subsidiaries.
Ownership Threshold
Neither our by-laws nor our Articles contain any provisions governing the ownership threshold above which shareholder ownership must be disclosed. In addition, securities legislation in Canada requires that we disclose in our proxy information circular for our annual meeting and certain other disclosure documents filed by us under such legislation, holders who beneficially own more than ten (10) percent of our issued and outstanding Common Shares.
C. Material Contracts
Except for contracts entered into in the ordinary course of business, the following are our only material agreements (the “Material Contracts”):
| · | Amended and Restated Technology License Agreement dated May 16, 2011 between PMI and Sunnybrook (the “Sunnybrook License”); |
| · | Loan Agreement with Canadian Imperial Bank of Commerce dated July 30, 2018 (the “CIBC Loan Agreement”); |
| · | Asset and Share Purchase Agreement dated July 31, 2017 between Philips and PMI (the “Philips Share Purchase Agreement”); |
| · | Supply Agreement dated July 31, 2017 between PMI and Philips Medical Systems Nederland B.V. (the “Philips Supply Agreement”); |
| · | Noncompetition, Nonsolicitation and Confidentiality Agreement dated July 31, 2017 between Philips and PMI (the “Philips Confidentiality Agreement”); |
| · | Resale Purchasing Agreement dated July 31, 2017 between Philips Medical and PMI (the “Philips Resale Purchasing Agreement”); and |
| · | Agreement between PMI and Siemens, dated February 11, 2019 (the “New Siemens Agreement”) and effective as of January 21, 2019. |
Sunnybrook License
See Item 4.B, “Business Overview—Intellectual Property—Licenses”.
CIBC Loan Agreement
See Item 5.B, “Liquidity and Capital Resources—Recent Sources and Uses of Financing—CIBC Loan”.
Philips Share Purchase Agreement
See Item 4.A, “Business Overview—Alliances and Partnerships—Philips”.
Philips Supply Agreement
On July 31, 2017, we entered into the Philips Supply Agreement with Philips Medical Systems Nederland B.V. (“Philips Medical”) in connection with the Sonalleve Transaction. Under the terms of the Philips Supply Agreement and until such time as the manufacturing of our Sonalleve systems is assumed by us, Philips Medical agrees to serve as a contract manufacturer to us for our Sonalleve systems. We work together with Philips Medical to ensure that production capacity and delivery times are appropriate to meet our sales forecasts.
Philips Confidentiality Agreement
On July 31, 2017, we entered into the Philips Confidentiality Agreement with Philips in connection with the Sonalleve Transaction. Under the terms of the Philips Confidentiality Agreement, Philips has agreed to (i) not compete in related lines of business, anywhere in the world, for period of three years after closing; (ii) not solicit any of our employees for so long as agreements related to the Sonalleve Transaction are in force, plus an additional two years; and (iii) maintain in confidence any confidential information that if disseminated would be detrimental to our business, for a period of ten years after closing.
Philips Resale Purchasing Agreement
On July 31, 2017, we entered into the Philips Resale Purchasing Agreement with Philips Medical in connection with the Sonalleve Transaction. Under the terms of the agreement, Philips Medical is permitted to purchase certain of our products for the purpose of reselling such products to its customers. In addition, we are permitted to sell additional products directly to customers of Philips Medical upon an initial sale of the Philips products to such customers.
New Siemens Agreement
See Item 4.A, “Business Overview—Alliances and Partnerships—Siemens”.
D. Exchange Controls
We are not aware of any Canadian federal or provincial laws, decrees, or regulations that restrict the export or import of capital, including foreign exchange controls, or that affect the remittance of dividends, interest or other payments to non-Canadian holders of the Common Shares. There are no limitations under the laws of Canada or by the charter or our other constituent documents, except the Investment Canada Act which may require review and approval by the Minister of Industry (Canada) of certain acquisition of control of us by non-Canadians. The threshold for acquisitions of control is generally defined as being one-third or more of our voting shares. If the investment is potentially injurious to national security it may be subject to review under the Investment Canada Act notwithstanding the percentage interest acquired or amount of the investment. “Non-Canadian” generally means an individual who is not a Canadian citizen, or a corporation, partnership, trust or joint venture that is ultimately controlled by non-Canadians.
E. Taxation
Canadian Federal Income Taxation
We consider that the following general summary fairly describes the principal Canadian federal income tax consequences applicable to a holder of our Common Shares who is a resident of the United States, who is not, will not be and will not be deemed to be a resident of Canada for purposes of the Income Tax Act (Canada) and any applicable tax treaty and who does not use or hold, and is not deemed to use or hold, his, her or its Common Shares in the capital of our Company in connection with carrying on a business in Canada (a “non-resident holder”).
This summary is based upon the current provisions of the Income Tax Act (Canada), the regulations thereunder (the “Regulations”), the current publicly announced administrative and assessing policies of the Canada Revenue Agency and the Canada-United States Tax Convention as amended by the Protocols thereto (the “Treaty”). This summary also takes into account the amendments to the Income Tax Act (Canada) and the Regulations publicly announced by the Minister of Finance (Canada) prior to the date hereof (the “Tax Proposals”) and assumes that all such Tax Proposals will be enacted in their present form. However, no assurances can be given that the Tax Proposals will be enacted in the form proposed, or at all. This summary is not exhaustive of all possible Canadian federal income tax consequences applicable to a holder of our Common Shares and, except for the foregoing, this summary does not take into account or anticipate any changes in law, whether by legislative, administrative or judicial decision or action, nor does it take into account provincial, territorial or foreign income tax legislation or considerations, which may differ from the Canadian federal income tax consequences described herein.
This summary is of a general nature only and is not intended to be, and should not be construed to be, legal, business or tax advice to any particular holder or prospective holder of our Common Shares, and no opinion or representation with respect to the tax consequences to any holder or prospective holder of our Common Shares is made. Accordingly, holders and prospective holders of our Common Shares should consult their own tax advisors with respect to the income tax consequences of purchasing, owning and disposing of our Common Shares in their particular circumstances.
Dividends
Dividends paid on our Common Shares to a non-resident holder will be subject under the Income Tax Act (Canada) to withholding tax at a rate of 25% subject to a reduction under the provisions of an applicable tax treaty, which tax is deducted at source by our Company. The Treaty provides that the Income Tax Act (Canada) standard 25% withholding tax rate is reduced to 15% on dividends paid on shares of a corporation resident in Canada (such as our Company) to residents of the United States who are entitled to the benefits of the Treaty, and also provides for a further reduction of this rate to 5% where the beneficial owner of the dividends is a corporation resident in the United States entitled to the benefits of the Treaty that owns at least 10% of the voting shares of the corporation paying the dividend.
Capital Gains
A non-resident holder is not subject to tax under the Income Tax Act (Canada) in respect of a capital gain realized upon the disposition of a common share of our Company unless such share represents “taxable Canadian property”, as defined in the Income Tax Act (Canada), to the holder thereof. Our Common Shares generally will not be considered taxable Canadian property to a non-resident holder provided that:
| · | the non-resident holder; |
| · | persons with whom the non-resident holder did not deal at arm’s length; |
| · | the non-resident holder and persons with whom such non-resident holder did not deal at arm’s length; or |
| · | partnerships in which the non-resident holder or a person with whom the non-resident holder did not deal at arm’s length holds a membership interest directly or indirectly through one or more partnerships, |
did not own, or have an interest in, or an option in, respect of, 25% or more of the issued shares of any class of our capital stock at any time during the 60 month period immediately preceding the disposition of such shares. In the case of a non-resident holder to whom shares of our Company represent taxable Canadian property and who is resident in the United States and entitled to the benefits of the Treaty, no Canadian taxes will generally be payable on a capital gain realized on such shares by reason of the Treaty unless the value of such shares is derived principally from real property situated in Canada.
Certain U.S. Federal Income Tax Considerations
The following is a summary of the U.S. federal income tax considerations generally applicable to a U.S. Holder (as defined below) of the acquisition, ownership, and disposition of Common Shares. This summary does not purport to address all U.S. federal income tax matters that may be relevant to a particular U.S. Holder of Common Shares, nor is it a complete analysis of all potential U.S. federal income tax consequences. This summary does not address any tax consequences arising under any state, local or non-U.S. tax laws or U.S. federal estate or gift tax laws. This summary is based on the provisions of the Internal Revenue Code of 1986, as amended (the “Code”), the Treasury regulations thereunder, and administrative and judicial interpretations thereof, all as in effect on the date hereof and all of which are subject to change, possibly with retroactive effect. This summary applies only to a U.S. Holder that acquires Common Shares and holds Common Shares as capital assets for U.S. federal income tax purposes (generally, property held for investment). This summary does not address all U.S. federal income tax considerations that may be relevant to shareholders that are subject to special tax rules, including, without limitation, expatriates and certain former citizens of the United States, partnerships and other pass-through entities, financial institutions, insurance companies, brokers, dealers or traders in securities, commodities or currencies, tax-exempt organizations, tax qualified retirement plans and individual retirement accounts, regulated investment companies, real estate investment trusts, persons subject to the alternative minimum tax, persons whose functional currency for U.S. federal income tax purposes is not the U.S. dollar, persons holding Common Shares as part of a hedge, straddle or other risk reduction strategy or as part of a hedging or conversion transaction or other integrated investment, persons that own or have owned (directly, indirectly, or by attribution) 10% or more of the total combined voting power or value of the outstanding shares (including Common Shares) of the Company, and persons who acquired Common Shares through stock option or shares purchase plan programs or in other compensatory arrangements.
If a partnership (or other entity taxed as a partnership for U.S. federal income tax purposes) holds Common Shares, the tax treatment of a partner in the partnership generally will depend upon the status of the partner and the activities of the partnership. Partnerships and partners in such a partnership are urged to consult their tax advisers regarding the tax consequences of acquiring, owning, and disposing of Common Shares.
For purposes of this discussion, a “U.S. Holder” is a beneficial owner of Common Shares that is: (i) a citizen or an individual who is a resident of the United States as determined for U.S. federal income tax purposes; (ii) a corporation (or other entity taxable as a corporation for U.S. federal income tax purposes) created or organized under the laws of the United States, any State or political subdivision thereof or the District of Columbia; (iii) an estate, the income of which is subject to U.S. federal income taxation regardless of its source; or (iv) a trust (1) if a court within the United States is able to exercise primary supervision over its administration and one or more U.S. persons has the authority to control all of the substantial decisions of the trust; or (2) that has a valid election in effect under applicable Treasury regulations to be treated as a U.S. person.
This summary is of a general nature only and is not intended to be tax advice to any prospective investor, and no representation with respect to the tax consequences to any particular investor is made. Prospective investors are urged to consult their tax advisers with respect to the U.S. federal, state, local and non-U.S. income and other tax considerations relevant to them, having regard to their particular circumstances.
Distributions
Subject to the discussion under “— Passive Foreign Investment Company Considerations” below, the gross amount of a distribution paid to a U.S. Holder with respect to Common Shares (including amounts withheld to pay Canadian withholding taxes) will be included in such holder’s gross income as dividend income to the extent that the distribution is paid out of our current or accumulated earnings and profits (as determined under U.S. federal income tax principles). To the extent that the amount of a distribution exceeds our current and accumulated earnings and profits, it will be treated first as a tax-free return of a U.S. Holder’s tax basis in Common Shares, and to the extent the amount of the distribution exceeds such U.S. Holder’s tax basis, the excess will be taxed as capital gain. Because we do not expect to calculate our earnings and profits in accordance with U.S. federal income tax principles, U.S. Holders should expect that a distribution generally will be treated as a dividend for U.S. federal income tax purposes.
Dividends received by individuals and other non-corporate U.S. Holders of Common Shares generally will be subject to tax at preferential rates applicable to long-term capital gains, provided that such holders meet certain holding period and other requirements and that the Company is not treated as a PFIC (as defined below) for the taxable year in which the dividend is paid or for the preceding taxable year. Dividends on Common Shares generally will not be eligible for the dividends-received deduction allowed to corporations. U.S. Holders are urged to consult their tax advisers regarding the application of the relevant rules to their particular circumstances.
Dividends paid on Common Shares generally will constitute foreign-source income classified as “passive category” income for foreign tax credit limitation purposes. A U.S. Holder may be entitled to deduct or credit any Canadian withholding taxes on dividends in determining its U.S. income tax liability, subject to certain limitations (including that the election to deduct or credit foreign taxes applies to all of such U.S. Holder’s foreign taxes for a particular taxable year). The rules governing the foreign tax credit are complex. U.S. Holders are urged to consult their tax advisers regarding the availability of the foreign tax credit under their particular circumstances.
Receipt of Foreign Currency
The U.S. dollar value of any distribution on Common Shares made in Canadian dollars generally will be calculated by reference to the exchange rate between U.S. dollars and Canadian dollars in effect on the date of actual or constructive receipt of such distribution by the U.S. Holder, regardless of whether the Canadian dollars so received are in fact converted into U.S. dollars. If the Canadian dollars so received are converted into U.S. dollars on the date of receipt, then a U.S. Holder generally will not recognize foreign currency gain or loss on such conversion. If the Canadian dollars so received are not converted into U.S. dollars on the date of receipt, then a U.S. Holder generally will have a tax basis in the Canadian dollars equal to the U.S. dollar value of such Canadian dollars on the date of receipt. Any gain or loss on a subsequent conversion or other disposition of the Canadian dollars generally will be treated as ordinary income or loss to a U.S. Holder and generally will be U.S.-source income or loss for U.S. foreign tax credit purposes. U.S. Holders are urged to consult their tax advisers regarding the U.S. federal income tax consequences of receiving distributions on Common Shares in Canadian dollars.
Sale or Other Disposition of Common Shares
Subject to the discussion under “—Passive Foreign Investment Company Considerations” below, a U.S. Holder will recognize taxable gain or loss upon the sale, exchange, or other taxable disposition of Common Shares equal to the difference, if any, between the amount realized for Common Shares and the U.S. Holder’s tax basis in such Common Shares. The gain or loss will be capital gain or loss. Non-corporate U.S. Holders, including individual U.S. Holders that have held Common Shares for more than one year, currently are eligible for reduced tax rates. The deductibility of capital losses is subject to limitations. Any such gain or loss recognized by a U.S. Holder generally will be treated as U.S.-source gain or loss for foreign tax credit limitation purposes.
Passive Foreign Investment Company Considerations
Certain adverse tax consequences could apply to a U.S. Holder if we are treated as a “passive foreign investment company” (a “PFIC”) for any taxable year during which the U.S. Holder holds Common Shares. In general, a non-U.S. corporation is a PFIC for any taxable year in which (i) 75% or more of its gross income consists of passive income (the “income test”) or (ii) 50% or more of the average quarterly value of its assets consists of assets that produce, or are held for the production of, passive income (the “asset test”). Generally, “passive income” includes interest, dividends, rents, royalties and certain gains, and cash is a passive asset for PFIC purposes. For purposes of the asset test and income test, a non-U.S. corporation that directly or indirectly owns at least 25% by value of the shares of another corporation is treated as if it held its proportionate share of the assets of the other corporation and received directly its proportionate share of the income of the other corporation.
We have made no determination as to whether we are classified as a PFIC for U.S. federal income tax purposes. The determination of whether we are a PFIC depends on the particular facts and circumstances (such as the valuation of our assets, including goodwill and other intangible assets) and is also affected by the application of the PFIC rules, which are subject to differing interpretations. The fair market value of our assets is expected to depend, in part, upon (i) the market price of Common Shares, which is likely to fluctuate, and (ii) the composition of our income and assets, which will be affected by how, and how quickly, we spend any cash that is raised in any financing transaction. Moreover, our PFIC status is determined on an annual basis after the end of each taxable year. In light of the foregoing, no assurance can be provided that we are not currently a PFIC or that we will not become a PFIC in any future taxable year.
In general, if we were a PFIC for any taxable year during which a U.S. Holder held Common Shares, gain recognized upon a disposition of Common Shares by the U.S. Holder would be allocated ratably over the U.S. Holder’s holding period for such Common Shares. The amounts allocated to the taxable year of disposition and to taxable years prior to the first taxable year in which we were a PFIC would be taxed as ordinary income. The amount allocated to each other taxable year would be subject to tax at the highest tax rate in effect for that taxable year for individuals or corporations, as appropriate, and an interest charge would be imposed on the resulting tax liability for each such year. Further, to the extent that any distribution received by a U.S. Holder on Common Shares exceeded 125% of the average of the annual distributions received on such Common Shares during the preceding three years or the U.S. Holder’s holding period, whichever is shorter, that distribution would be subject to taxation in the same manner.
Alternatively, if we were a PFIC and if Common Shares were “regularly traded” on a “qualified exchange,” a U.S. Holder might be able to make a mark-to-market election with respect to Common Shares that would result in tax treatment different from the general tax treatment for PFICs described above. The Common Shares would be treated as “regularly traded” in any calendar year in which more than a de minimis quantity of Common Shares were traded on a qualified exchange on at least 15 days during each calendar quarter. Nasdaq, where Common Shares are expected to be listed, is a qualified exchange for this purpose. If a U.S. Holder makes the mark-to-market election, in each year that we are a PFIC the U.S. Holder generally will recognize as ordinary income any excess of the fair market value of Common Shares at the end of the taxable year over their adjusted tax basis, and will recognize an ordinary loss in respect of any excess of the adjusted tax basis of Common Shares over their fair market value at the end of the taxable year (but only to the extent of the net amount of income previously included as a result of the mark-to-market election). If a U.S. Holder makes the election, the U.S. Holder’s tax basis in Common Shares will be adjusted to reflect these income or loss amounts. In addition, if a U.S. Holder makes the mark-to-market election, any gain that the U.S. Holder recognizes on the sale or other disposition of Common Shares in a year in which we are a PFIC will be treated as ordinary income and any loss will be treated as an ordinary loss (but only to the extent of the net amount of income previously included as a result of the mark-to-market election). U.S. Holders should consult their tax advisers regarding the availability and advisability of making a mark-to-market election in their particular circumstances.
We do not intend to provide information necessary for U.S. Holders to make qualified electing fund elections, which, if available, would result in a further alternative tax treatment.
If we were a PFIC for any year during which a U.S. Holder owned Common Shares, we generally would continue to be treated as a PFIC with respect to such U.S. Holder’s Common Shares unless (i) we ceased to be a PFIC and (ii) the U.S. Holder had made a “deemed sale” election under the PFIC rules to recognize gain (but not loss) under the PFIC rules described above, without the receipt of corresponding cash.
If we were a PFIC or, with respect to a particular U.S. Holder, we were treated as a PFIC for the taxable year in which we pay a dividend or for the prior taxable year, the preferential rates discussed above with respect to dividends paid to certain non-corporate U.S. Holders would not apply. In addition, if we were a PFIC for any taxable year during which a U.S. Holder owns Common Shares, the U.S. Holder would be required to file annual reports with the Internal Revenue Service, subject to certain exceptions.
The application of the PFIC rules to U.S. Holders is uncertain in certain respects, and the PFIC rules remain subject to recently proposed Treasury Regulations yet to be made final. Each U.S. Holder should consult its own tax adviser regarding the application of the PFIC rules, including the foregoing filing requirements and the recently proposed Treasury Regulations, as well as the advisability of making any available election under the PFIC rules, with regard to such holder’s ownership and disposition of Common Shares.
Additional Tax on Net Investment Income
Certain U.S. Holders that are individuals, estates or trusts are subject to a 3.8% tax on all or a portion of their “net investment income,” which may include all or a portion of their dividend income and net gains from the disposition of Common Shares. Each U.S. Holder that is an individual, estate or trust is urged to consult its tax advisers regarding the applicability of this tax to its income and gains in respect of Common Shares.
Foreign Financial Asset Reporting
Citizens or individual residents of the United States holding “specified foreign financial assets” (which generally include shares and other securities issued by a foreign person unless held in an account maintained by a financial institution) that exceed certain U.S. dollar thresholds are required to report information relating to such assets, which could include Common Shares, by filing a completed Internal Revenue Service Form 8938 (Statement of Specified Foreign Financial Assets) with their tax returns. Significant penalties may apply for the failure to satisfy this reporting obligation. U.S. Holders are urged to consult their tax advisers regarding the foregoing reporting obligation with regard to their ownership of Common Shares.
Information Reporting and Backup Withholding
Distributions with respect to Common Shares and proceeds from the sale, exchange, or other taxable disposition of Common Shares may be subject to information reporting to the Internal Revenue Service and U.S. backup withholding. Backup withholding will not apply, however, to a U.S. Holder who furnishes a correct taxpayer identification number and makes other required certifications, or who is otherwise exempt from backup withholding and properly establishes such exempt status. Backup withholding is not an additional tax. Amounts withheld as backup withholding may be credited against a U.S. Holder’s U.S. federal income tax liability, and a U.S. Holder generally may obtain a refund of any excess amounts withheld under the backup withholding rules by timely filing the appropriate claim for refund with the Internal Revenue Service and furnishing any required information.
F. Dividends and Paying Agents
Not applicable.
G. Statement by Experts
The consolidated financial statements as of December 31, 2018, 2017 and 2016 and the related consolidated statements of loss and comprehensive loss, changes in shareholders’ equity, and cash flows for each of the three years in the period ended December 31, 2018 and a summary of significant accounting policies and other explanatory information included in this Registration Statement have been audited by PricewaterhouseCoopers LLP, 354 Davis Road, Suite 600, Oakville, ON, Canada L6J 0C5, an independent registered public accounting firm, as stated in their report appearing herein. Such consolidated financial statements are included in reliance upon the report of such firm given upon their consent and authority as experts in accounting and auditing.
H. Documents on Display
This Registration Statement and the related exhibits are available for viewing at the offices of Profound Medical Corp., 2400 Skymark Avenue, Unit 6, Mississauga, Ontario L4W 5K5, telephone: (647) 476-1350. Copies of our financial statements and other continuous disclosure documents required under the Securities Act (Ontario) are available for viewing on SEDAR at www.sedar.com. All of the documents referred to are in English.
The SEC maintains an Internet site (http://www.sec.gov) that makes available reports and other information that the Company files or furnishes electronically with it. The Company’s Internet site can be found at http://www.profoundmedical.com. The information on our website is not incorporated by reference into this Registration Statement and should not be considered a part of this Registration Statement, and the reference to our website in this Registration Statement is an inactive textual reference only.
I. Subsidiary Information
Not applicable.
ITEM 11. QUANTITATIVE AND QUALITATIVE DISCLOSURES ABOUT MARKET RISK
We are exposed to various risks associated with our assets, liabilities and anticipated transactions, including credit risk, market risk (including interest rate price risk and foreign currency risk) and liquidity risk. See note 18 of our audited consolidated financial statements for the years ended December 31, 2018, 2017 and 2016 for a qualitative and quantitative discussion of our exposure to these market risks. There were no material changes in these risks for the three and six months ended June 30, 2019.
ITEM 12. DESCRIPTION OF SECURITIES OTHER THAN EQUITY SECURITIES
Not applicable.
PART II
ITEM 13. DEFAULTS, DIVIDEND ARREARAGES AND DELINQUENCIES
Not Applicable.
ITEM 14. MATERIAL MODIFICATIONS TO THE RIGHTS OF SECURITY HOLDERS AND USE OF PROCEEDS
Not Applicable.
ITEM 15. CONTROLS AND PROCEDURES
Not Applicable.
ITEM 16A AUDIT COMMITTEE FINANCIAL EXPERT
Not Applicable.
ITEM 16B CODE OF ETHICS
Not Applicable.
ITEM 16C PRINCIPAL ACCOUNTANT FEES AND SERVICES
Not Applicable.
ITEM 16D EXEMPTIONS FROM LISTING STANDARDS FOR AUDIT COMMITTEES
Not applicable.
ITEM 16E PURCHASES OF EQUITY SECURITIES BY THE ISSUER AND AFFILIATED PURCHASERS
Not applicable.
ITEM 16F CHANGE IN REGISTRANT'S CERTIFYING ACCOUNTANT
Not applicable.
ITEM 16G CORPORATE GOVERNANCE
Not Applicable.
ITEM 16H MINE SAFETY DISCLOSURE
Not applicable.
PART III
ITEM 17. FINANCIAL STATEMENTS
See Item 18, “Financial Statements”.
ITEM 18. FINANCIAL STATEMENTS
The following financial statements are attached hereto, incorporated herein and found immediately following the text of this Registration Statement:
| 1. | Our audited consolidated financial statements as at and for the years ended December 31, 2018, 2017 and 2016, together with the notes thereto and our independent auditor’s report thereon. |
| 2. | Our unaudited interim condensed consolidated financial statements as at and for the three and six months ended June 30, 2019 and 2018, together with the notes thereto. |
ITEM 19. EXHIBITS
SIGNATURES
The Registrant hereby certifies that it meets all of the requirements for filing on Form 20-F and that it has duly caused and authorized the undersigned to sign this Registration Statement on its behalf.
| | | PROFOUND MEDICAL CORP. |
| | | |
| DATED: | August 29, 2019 | | By: | /s/ Aaron Davidson |
| | | | | Aaron Davidson Chief Financial Officer |
INDEX TO CONSOLIDATED FINANCIAL STATEMENTS

PROFOUND MEDICAL CORP.
CONSOLIDATED FINANCIAL STATEMENTS
FOR THE YEARS ENDED DECEMBER 31, 2018,
2017 AND 2016
PRESENTED IN CANADIAN DOLLARS

Report of Independent Registered Public Accounting Firm
To the Board of Directors and Shareholders of Profound Medical Corp.
Opinion on the financial statements
We have audited the accompanying consolidated balance sheets of Profound Medical Corp. and its subsidiaries (together, the company) as of December 31, 2018 and 2017, and the related consolidated statements of loss and comprehensive loss, shareholders’ equity and cash flows for each of the three years in the period ended December 31, 2018, including the related notes (collectively referred to as the consolidated financial statements). In our opinion, the consolidated financial statements present fairly, in all material respects, the financial position of the company as of December 31, 2018 and 2017, and their financial performance and their cash flows for each of the three years in the period ended December 31, 2018 in conformity with International Financial Reporting Standards as issued by the International Accounting Standards Board (IFRS).
Basis for opinion
These consolidated financial statements are the responsibility of the company’s management. Our responsibility is to express an opinion on the company’s consolidated financial statements based on our audits. We are a public accounting firm registered with the Public Company Accounting Oversight Board (United States) (PCAOB) and are required to be independent with respect to the company in accordance with the U.S. federal securities laws and the applicable rules and regulations of the Securities and Exchange Commission and the PCAOB.
We conducted our audits of these consolidated financial statements in accordance with the standards of the PCAOB. Those standards require that we plan and perform the audit to obtain reasonable assurance about whether the consolidated financial statements are free of material misstatement, whether due to error or fraud.
PricewaterhouseCoopers LLP
PwC Centre, 354 Davis Road, Suite 600, Oakville, Ontario, Canada L6J 0C5
T: +1 905 815 6300, F: +1 905 815 6499
“PwC” refers to PricewaterhouseCoopers LLP, an Ontario limited liability partnership.
Our audits included performing procedures to assess the risks of material misstatement of the consolidated financial statements, whether due to error or fraud, and performing procedures that respond to those risks. Such procedures included examining, on a test basis, evidence regarding the amounts and disclosures in the consolidated financial statements. Our audits also included evaluating the accounting principles used and significant estimates made by management, as well as evaluating the overall presentation of the consolidated financial statements. We believe that our audits provide a reasonable basis for our opinion.
/s/ PricewaterhouseCoopers LLP
Chartered Professional Accountants, Licensed Public Accountants
Oakville, Canada
August 14, 2019
We have served as the company’s auditor since 2013.
Profound Medical Corp.
Consolidated Balance Sheets
As at December 31, 2018 and 2017
| | | 2018 | | | 2017 | |
| | | $ | | | $ | |
| | | | | | | |
| Assets (note 10) | | | | | | | | |
| | | | | | | | | |
| Current assets | | | | | | | | |
| Cash | | | 30,687,183 | | | | 11,103,223 | |
| Trade and other receivables (note 5) | | | 2,686,112 | | | | 4,251,658 | |
| Investment tax credits receivable | | | 480,000 | | | | 240,000 | |
| Inventory (note 6) | | | 3,631,623 | | | | 1,431,157 | |
| Prepaid expenses and deposits (note 20) | | | 434,871 | | | | 576,028 | |
| Total current assets | | | 37,919,789 | | | | 17,602,066 | |
| | | | | | | | | |
| Property and equipment (note 7) | | | 1,207,357 | | | | 1,726,150 | |
| Intangible assets (note 8) | | | 4,013,561 | | | | 5,141,998 | |
| Goodwill (note 8) | | | 3,409,165 | | | | 3,409,165 | |
| | | | | | | | | |
| Total assets | | | 46,549,872 | | | | 27,879,379 | |
| | | | | | | | | |
| Liabilities | | | | | | | | |
| | | | | | | | | |
| Current liabilities | | | | | | | | |
| Accounts payable and accrued liabilities | | | 3,912,350 | | | | 5,081,704 | |
| Deferred revenue (note 2) | | | 312,558 | | | | 132,364 | |
| Long-term debt (note 10) | | | 1,339,583 | | | | 4,701,214 | |
| Provisions (note 9) | | | 1,352,017 | | | | 93,222 | |
| Other liabilities (notes 10 and 11) | | | 567,296 | | | | 534,958 | |
| Derivative financial instrument (note 10) | | | 98,203 | | | | - | |
| Income taxes payable | | | 297,353 | | | | 72,779 | |
| Total current liabilities | | | 7,879,360 | | | | 10,616,241 | |
| | | | | | | | | |
| Long-term debt (note 10) | | | 10,615,662 | | | | 443,875 | |
| Deferred revenue (note 2) | | | 379,044 | | | | 108,952 | |
| Provisions (note 9) | | | 49,319 | | | | 988,239 | |
| Other liabilities (notes 10 and 11) | | | 1,000,153 | | | | 1,580,933 | |
| | | | | | | | | |
| Total liabilities | | | 19,923,538 | | | | 13,738,240 | |
| | | | | | | | | |
| Shareholders’ Equity | | | | | | | | |
| | | | | | | | | |
| Share capital (note 12) | | | 120,932,404 | | | | 98,365,770 | |
| Contributed surplus | | | 16,756,294 | | | | 6,103,970 | |
| Accumulated other comprehensive loss | | | (28,703 | ) | | | (57,929 | ) |
| Deficit | | | (111,033,661 | ) | | | (90,270,672 | ) |
| | | | | | | | | |
| Total Shareholders’ Equity | | | 26,626,334 | | | | 14,141,139 | |
| | | | | | | | | |
| Total Liabilities and Shareholders’ Equity | | | 46,549,872 | | | | 27,879,379 | |
| | | | | | | | | |
| Commitments and contingencies (note 20) | | | | | | | | |
The accompanying notes are an integral part of these consolidated financial statements.
Profound Medical Corp.
Consolidated Statements of Loss and Comprehensive Loss
For the years ended December 31, 2018 and 2017 and 2016
| | | 2018 | | | 2017 | | | 2016 | |
| | | $ | | | $ | | | $ | |
| | | | | | | | | | |
| Revenue | | | | | | | | | | | | |
| Products | | | 2,421,331 | | | | 4,663,986 | | | | - | |
| Services | | | 180,947 | | | | 240,564 | | | | - | |
| | | | 2,602,278 | | | | 4,904,550 | | | | - | |
| Cost of sales (note 14) | | | 1,778,501 | | | | 3,032,208 | | | | - | |
| Gross profit | | | 823,777 | | | | 1,872,342 | | | | - | |
| | | | | | | | | | | | | |
| Operating expenses (note 14) | | | | | | | | | | | | |
| Research and development – net of investment tax credits of $240,000 (2017 – $240,000, 2016 – $240,000) | | | 10,265,388 | | | | 9,638,190 | | | | 9,988,693 | |
| General and administrative | | | 6,656,723 | | | | 5,935,215 | | | | 4,369,288 | |
| Selling and distribution | | | 4,091,347 | | | | 3,925,804 | | | | 1,282,433 | |
| Total operating expenses | | | 21,013,458 | | | | 19,499,209 | | | | 15,640,414 | |
| | | | | | | | | | | | | |
| Operating Loss | | | 20,189,681 | | | | 17,626,867 | | | | 15,640,414 | |
| | | | | | | | | | | | | |
| Other income and expense | | | | | | | | | | | | |
| Finance costs (note 15) | | | 826,312 | | | | 1,249,084 | | | | 829,899 | |
| Finance income | | | (483,788 | ) | | | (127,732 | ) | | | (157,598 | ) |
| | | | 342,524 | | | | 1,121,352 | | | | 672,301 | |
| Loss before taxes | | | 20,532,205 | | | | 18,748,219 | | | | 16,312,715 | |
| | | | | | | | | | | | | |
| Income taxes (note 16) | | | 230,784 | | | | 74,123 | | | | 14,054 | |
| | | | | | | | | | | | | |
| Net loss for the year | | | 20,762,989 | | | | 18,822,342 | | | | 16,326,769 | |
| | | | | | | | | | | | | |
| Other comprehensive loss (income) | | | | | | | | | | | | |
| Item that may be reclassified to profit or loss | | | | | | | | | | | | |
| Foreign currency translation adjustment – net of tax | | | 29,226 | | | | (69,245 | ) | | | 11,316 | |
| | | | | | | | | | | | | |
| Net loss and comprehensive loss for the year | | | 20,792,215 | | | | 18,753,097 | | | | 16,338,085 | |
| | | | | | | | | | | | | |
| Loss per share (note 17) | | | | | | | | | | | | |
| Basic and diluted loss per common share | | | 0.21 | | | | 0.31 | | | | 0.39 | |
The accompanying notes are an integral part of these consolidated financial statements.
Profound Medical Corp.
Consolidated Statements of Changes in Shareholders’ Equity
For the years ended December 31, 2018 and 2017 and 2016
| | | Number
of shares | | | Share
capital
$ | | | Contributed
surplus
$ | | | Accumulated
other
comprehensive
income (loss)
$ | | | Deficit
$ | | | Total
$ | |
| | | | | | | | | | | | | | | | | | | |
| Balance - January 1, 2016 | | | 39,473,327 | | | | 67,082,821 | | | | 2,002,190 | | | | - | | | | (55,121,561 | ) | | | 13,963,450 | |
| | | | | | | | | | | | | | | | | | | | | | | | | |
| Net loss for the year | | | - | | | | - | | | | - | | | | - | | | | (16,326,769 | ) | | | (16,326,769 | ) |
| Cumulative translation adjustment – net of tax | | | - | | | | - | | | | - | | | | 11,316 | | | | - | | | | 11,316 | |
| Exercise of share options | | | 12,250 | | | | 6,860 | | | | (3,185 | ) | | | - | | | | - | | | | 3,675 | |
| Share-based compensation (note 13) | | | - | | | | - | | | | 1,001,558 | | | | - | | | | - | | | | 1,001,558 | |
| Issuance of units on bought deal financing (note 12) | | | 15,820,000 | | | | 16,182,997 | | | | - | | | | - | | | | - | | | | 16,182,997 | |
| Balance - December 31, 2016 | | | 55,305,577 | | | | 83,272,678 | | | | 3,000,563 | | | | 11,316 | | | | (71,448,330 | ) | | | 14,836,227 | |
| | | | | | | | | | | | | | | | | | | | | | | | | |
| Net loss for the year | | | - | | | | - | | | | - | | | | - | | | | (18,822,342 | ) | | | (18,822,342 | ) |
| Cumulative translation adjustment – net of tax | | | - | | | | - | | | | - | | | | (69,245 | ) | | | - | | | | (69,245 | ) |
| Exercise of share options | | | 411,800 | | | | 271,471 | | | | (171,170 | ) | | | - | | | | - | | | | 100,301 | |
| Share-based compensation (note 13) | | | - | | | | - | | | | 1,338,330 | | | | - | | | | - | | | | 1,338,330 | |
| Issuance of common shares on acquisition (note 4) | | | 7,400,000 | | | | 7,844,000 | | | | - | | | | - | | | | - | | | | 7,844,000 | |
| Issuance of units on bought deal financing (note 12) | | | 10,000,000 | | | | 6,977,621 | | | | 1,936,247 | | | | - | | | | - | | | | 8,913,868 | |
| Balance - December 31, 2017 | | | 73,117,377 | | | | 98,365,770 | | | | 6,103,970 | | | | (57,929 | ) | | | (90,270,672 | ) | | | 14,141,139 | |
| | | | | | | | | | | | | | | | | | | | | | | | | |
| Net loss for the year | | | - | | | | - | | | | - | | | | - | | | | (20,762,989 | ) | | | (20,762,989 | ) |
| Cumulative translation adjustment – net of tax | | | - | | | | - | | | | - | | | | 29,226 | | | | - | | | | 29,226 | |
| Exercise of share options | | | 437,562 | | | | 306,882 | | | | (201,625 | ) | | | - | | | | - | | | | 105,257 | |
| Share-based compensation (note 13) | | | - | | | | - | | | | 1,086,199 | | | | - | | | | - | | | | 1,086,199 | |
| Issuance of units on bought deal financing (note 12) | | | 34,500,000 | | | | 22,259,752 | | | | 9,767,750 | | | | - | | | | - | | | | 32,027,502 | |
| Balance - December 31, 2018 | | | 108,054,939 | | | | 120,932,404 | | | | 16,756,294 | | | | (28,703 | ) | | | (111,033,661 | ) | | | 26,626,334 | |
The accompanying notes are an integral part of these consolidated financial statements.
Profound Medical Corp.
Consolidated Statements of Cash Flows
For the years ended December 31, 2018 and 2017 and 2016
| | | 2018
$ | | | 2017
$ | | | 2016
$ | |
| | | | | | | | | | |
| Operating activities | | | | | | | | | | | | |
| Net loss for the year | | | (20,762,989 | ) | | | (18,822,342 | ) | | | (16,326,769 | ) |
| Adjustment to reconcile net loss to net cash flows from operating activities | | | | | | | | | | | | |
| Depreciation of property and equipment | | | 546,001 | | | | 371,320 | | | | 167,335 | |
| Amortization of intangible assets | | | 1,128,437 | | | | 500,518 | | | | 19,673 | |
| Loss on disposal of property and equipment | | | - | | | | - | | | | 10,248 | |
| Share-based compensation | | | 1,086,199 | | | | 1,338,330 | | | | 1,001,558 | |
| Interest and accretion expense (note 15) | | | 1,028,843 | | | | 1,347,825 | | | | 829,899 | |
| Change in deferred rent | | | 7,108 | | | | 123,627 | | | | - | |
| Deferred revenue | | | 450,286 | | | | 241,316 | | | | - | |
| Change in fair value of derivative financial instrument | | | (96,619 | ) | | | - | | | | - | |
| Change in fair value of contingent consideration | | | (325,253 | ) | | | 82,578 | | | | - | |
| Change in non-cash working capital balances | | | | | | | | | | | | |
| Investment tax credits receivable | | | (240,000 | ) | | | 24,000 | | | | (91,000 | ) |
| Trade and other receivables | | | 1,565,546 | | | | (3,985,322 | ) | | | (173,857 | ) |
| Prepaid expenses and deposits | | | 141,157 | | | | 120,881 | | | | (557,604 | ) |
| Inventory | | | (2,200,466 | ) | | | (1,014,334 | ) | | | (416,823 | ) |
| Accounts payable and accrued liabilities | | | (1,167,336 | ) | | | 3,245,048 | | | | 775,781 | |
| Provisions | | | 319,875 | | | | 1,041,842 | | | | - | |
| Customer deposits | | | - | | | | (259,293 | ) | | | 259,293 | |
| Income taxes payable | | | 224,574 | | | | 72,779 | | | | - | |
| Total cash used in operating activities | | | (18,294,637 | ) | | | (15,571,227 | ) | | | (14,502,266 | ) |
| | | | | | | | | | | | | |
| Investing activities | | | | | | | | | | | | |
| Cash acquired in business acquisition (note 4) | | | - | | | | 183,988 | | | | - | |
| Sale of short-term investment | | | - | | | | - | | | | 10,000,000 | |
| Purchase of intangible assets | | | - | | | | (34,080 | ) | | | (223,174 | ) |
| Purchase of property and equipment | | | - | | | | (430,569 | ) | | | (863,991 | ) |
| Total cash (used in) from investing activities | | | - | | | | (280,661 | ) | | | 8,912,835 | |
| | | | | | | | | | | | | |
| Financing activities | | | | | | | | | | | | |
| Issuance of common shares | | | 34,500,000 | | | | 10,000,000 | | | | 17,402,000 | |
| Transaction costs paid on issuance of common shares | | | (2,472,498 | ) | | | (1,086,132 | ) | | | (1,219,003 | ) |
| Proceeds from bank loan | | | 12,500,000 | | | | - | | | | - | |
| Bank loan costs paid | | | (735,698 | ) | | | - | | | | - | |
| Payment of long-term debt and interest | | | (5,851,489 | ) | | | (2,877,050 | ) | | | (286,700 | ) |
| Payment of other liabilities | | | (166,975 | ) | | | (15,069 | ) | | | - | |
| Proceeds from share options exercised | | | 105,257 | | | | 100,301 | | | | 3,675 | |
| Total cash from financing activities | | | 37,878,597 | | | | 6,122,050 | | | | 15,899,972 | |
| | | | | | | | | | | | | |
| Net change in cash during the year | | | 19,583,960 | | | | (9,729,838 | ) | | | 10,310,541 | |
| Cash – Beginning of year | | | 11,103,223 | | | | 20,833,061 | | | | 10,522,520 | |
| Cash – End of year | | | 30,687,183 | | | | 11,103,223 | | | | 20,833,061 | |
The accompanying notes are an integral part of these consolidated financial statements.
Profound Medical Corp.
Notes to Consolidated Financial Statements
December 31, 2018 and 2017 and 2016
Profound Medical Corp. (Profound) and its subsidiaries (together, the Company) were incorporated under the Ontario Business Corporations Act on July 16, 2014. The Company is a medical technology company developing treatments to ablate the prostate gland, uterine fibroids and nerves for palliative pain relief for patients with metastatic bone disease.
The Company’s registered address is 2400 Skymark Avenue, Unit 6, Mississauga, Ontario, L4W 5K5.
| 2 | Summary of significant accounting policies and basis of preparation |
Basis of preparation
The Company prepares its consolidated financial statements in accordance with International Financial Reporting Standards as issued by the International Accounting Standards Board (IFRS). The Board of Directors approved these consolidated financial statements on August 14, 2019. These consolidated financial statements comply with IFRS.
Adoption of new accounting standards
A number of new amended standards became applicable for the current reporting period and the Company had to change its accounting policies as a result. The impact of the adoption of these standards is disclosed below:
| · | IFRS 9, Financial Instruments |
IFRS 9, Financial Instruments (IFRS 9) replaces the provisions of International Accounting Standard (IAS) 39, Financial Instruments – Recognition and Measurement (IAS 39) that relate to the recognition, classification and measurement of financial assets and financial liabilities, derecognition of financial instruments, impairment of financial assets and hedge accounting. The adoption of IFRS 9 from January 1, 2018 resulted in changes in the Company’s accounting policies but it did not result in any adjustments.
The Company has applied IFRS 9 retrospectively, but has elected not to restate comparative information. As a result, the comparative information provided continues to be accounted for in accordance with the Company’s previous accounting policy.
The Company has one type of financial asset that is subject to IFRS 9’s new expected credit loss model, which is trade and other receivables. The Company was required to revise its impairment methodology under IFRS 9 for trade and other receivables and this resulted in no adjustments as at January 1, 2018. The Company applies the IFRS 9 simplified approach to measuring expected credit losses, which uses a lifetime expected loss allowance for all trade and other receivables. To measure the expected credit losses, trade and other receivables have been grouped based on shared credit risk characteristics and the days past due. On that basis, the loss allowance as at January 1, 2018 and December 31, 2018 is nominal as the Company only transacts with hospitals and private clinics and has not incurred any credit losses since revenue began.
Profound Medical Corp.
Notes to Consolidated Financial Statements
December 31, 2018 and 2017 and 2016
Trade and other receivables are written off when there is no reasonable expectation of recovery. Indicators that there is no reasonable expectation of recovery include, among others, failure to make contractual payments for an extended period of time.
There was no impact on the Company’s financial liabilities as a result of the adoption of IFRS 9 and no material change to the Company’s accounting policies for financial liabilities. All historical changes to the Company’s debt agreements were accounted for as extinguishments under IAS 39, which is consistent with the required treatment under IFRS 9.
| · | IFRS 15, Revenue from Contracts with Customers |
IFRS 15, Revenue from Contracts with Customers (IFRS 15) amends revenue recognition requirements and establishes principles for reporting information about the nature, amount, timing and uncertainty of revenue and cash flows arising from contracts with customers. The adoption of IFRS 15 from January 1, 2018 resulted in changes in the Company’s revenue recognition accounting policy but it did not result in any adjustments. In accordance with the transitional provisions in IFRS 15, the Company has adopted the new rules on a full retrospective basis.
The Company sells separately priced extended warranty service contracts that extend maintenance coverage beyond the base warranty for its medical devices. The separately priced service contracts typically range from 12 to 24 months. As at December 31, 2018, the Company had $691,602 (2017 – $241,316) of deferred revenue related to unfulfilled performance obligations associated with these extended warranty service contracts. The Company expects to recognize the revenue associated with the unfulfilled performance obligations over the following annual periods:
| | | December 31,
2018
$ | | | December 31,
2017
$ | |
| | | | | | | |
| 2018 | | | - | | | | 132,364 | |
| 2019 | | | 312,558 | | | | 96,910 | |
| 2020 | | | 249,808 | | | | 12,042 | |
| 2021 | | | 64,618 | | | | - | |
| 2022 | | | 64,618 | | | | - | |
| | | | | | | | | |
| | | | 691,602 | | | | 241,316 | |
Use of estimates and judgments
The preparation of consolidated financial statements in conformity with IFRS requires the use of certain critical accounting estimates. It also requires management to exercise its judgment in the process of applying the Company’s accounting policies. The areas involving a higher degree of judgment or complexity, or areas where assumptions and estimates are significant to the consolidated financial statements are disclosed in note 3.
Profound Medical Corp.
Notes to Consolidated Financial Statements
December 31, 2018 and 2017 and 2016
Consolidation
Subsidiaries are all entities over which the Company has control. The Company controls an entity when it is exposed to, or has rights to, variable returns from its involvement with the entity and has the ability to affect those returns through its power over the entity. The wholly owned subsidiaries of Profound are consolidated from the date control is obtained. All intercompany transactions, balances, income and expenses on transactions with the subsidiaries are fully eliminated.
These consolidated financial statements include the following wholly owned subsidiaries of the Company: Profound Medical Inc., Profound Medical Oy, Profound Medical GmbH and Profound Medical (U.S.) Inc.
Business combinations
The acquisition method of accounting is used to account for business combinations. The consideration transferred in a business combination is measured at fair value at the date of acquisition. Acquisition-related transaction costs are recognized in the consolidated statements of loss and comprehensive loss as incurred. At the acquisition date, the identifiable assets acquired and the liabilities assumed are initially recognized at their fair value. Goodwill is measured as the excess of the sum of the consideration transferred and the fair value of the acquirer’s previously held equity interest in the acquiree (if any) over the net of the acquisition date amounts of the identifiable assets acquired and liabilities assumed. When the consideration transferred by the Company in a business combination includes assets or liabilities resulting from a contingent consideration arrangement, the contingent consideration is measured at its acquisition date fair value and is included as part of the consideration transferred in a business combination. Changes in the acquisition date fair values of the identifiable assets, liabilities and contingent consideration that qualify as measurement period adjustments are adjusted retrospectively, with corresponding adjustments against goodwill. Measurement period adjustments are adjustments that arise from additional information obtained during the measurement period (which cannot exceed one year from the acquisition date) about facts and circumstances that existed at the acquisition date.
Other than measurement period adjustments, contingent consideration that is classified as a financial liability is remeasured at subsequent reporting dates, with the corresponding gain or loss recognized in the consolidated statements of loss and comprehensive loss.
Segment reporting
Operating segments are reported in a manner consistent with the internal reporting provided to the chief operating decision maker. The chief operating decision maker has been identified as the chief executive officer.
Foreign currency translation
The Company has a functional currency of Canadian dollars and the functional currency of each subsidiary is determined based on facts and circumstances relevant for each subsidiary. Where the Company’s presentation currency of Canadian dollars differs from the functional currency of a subsidiary, the assets and liabilities of the subsidiary are translated from the functional currency into the presentation currency at the exchange rates as at the reporting date. The income and expenses of the subsidiaries are translated at rates approximating the exchange rates at the dates of the transactions. Exchange differences arising on the translation of the financial statements of the Company’s subsidiaries are recognized in other comprehensive loss (income).
Profound Medical Corp.
Notes to Consolidated Financial Statements
December 31, 2018 and 2017 and 2016
Foreign currency transactions are translated into the functional currency of the Company or its subsidiaries, using the exchange rates prevailing at the dates of these transactions. Foreign exchange gains and losses resulting from the settlement of foreign currency transactions and from the translation at year-end exchange rates of monetary assets and liabilities denominated in currencies other than an entity’s functional currency are recognized in the consolidated statements of loss and comprehensive loss, within finance costs.
Investment tax credits
The benefits of refundable investment tax credits (ITCs) for scientific research and experimental development (SR&ED) expenditures are recognized in the year the qualifying expenditure is made providing there is reasonable assurance of recoverability. The refundable ITCs recorded are based on management’s estimates of amounts expected to be recovered and are subject to audit by taxation authorities. The refundable ITCs reduce the research and development expenses to which they relate.
Accounting policy applied from January 1, 2018 – financial assets
From January 1, 2018, the Company classifies its financial assets in the following measurement categories:
| · | those to be measured subsequently at fair value (either through other comprehensive income, or through profit or loss); and |
| · | those to be measured at amortized cost. |
The classification depends on the Company’s business model for managing the financial assets and the contractual terms of the cash flows. The Company does not currently have any assets measured subsequently at fair value.
At initial recognition, the Company measures a financial asset at its fair value plus, in the case of a financial asset not at fair value through profit or loss, transaction costs that are directly attributable to the acquisition of the financial asset.
Financial assets are derecognized when the rights to receive cash flows from the financial assets have expired or have been transferred and the Company has transferred substantially all the risks and rewards of ownership.
The Company assesses on a forward-looking basis the expected credit losses associated with its financial assets carried at amortized cost. For trade and other receivables, the Company applies the simplified approach permitted by IFRS 9, which requires lifetime expected credit losses to be recognized at the time of initial recognition of the receivables.
Inventories
Inventories are valued at the lower of cost and net realizable value. Net realizable value is the estimated selling price in the ordinary course of business less the estimated costs of completion and the estimated costs necessary to make the sale. Cost is determined using the first-in, first-out method for finished goods and weighted average cost for raw materials.
Profound Medical Corp.
Notes to Consolidated Financial Statements
December 31, 2018 and 2017 and 2016
Property and equipment
Property and equipment are stated at cost, less accumulated depreciation and accumulated impairment losses. Cost includes expenditures that are directly attributable to the acquisition of the asset. The carrying amount of a replaced asset is derecognized when replaced. Repairs and maintenance costs are charged to the consolidated statements of loss and comprehensive loss during the year in which they are incurred.
The major categories of property and equipment are depreciated on a straight-line basis as follows:
| Furniture and fittings | | 20% per year |
| Research and manufacturing equipment | | 30% per year |
| Computer equipment | | 45% per year |
| Computer software | | 100% per year |
| Leasehold improvements | | over the term of the lease |
Residual values, methods of depreciation and useful lives of the assets are reviewed annually and adjusted if appropriate.
Goodwill
Goodwill represents the excess fair value of the consideration transferred over the fair value of the underlying net assets in a business combination and is measured at cost less accumulated impairment losses. Goodwill is not amortized but is tested for impairment on an annual basis or more frequently if there are indications the goodwill may be impaired. For the purposes of impairment testing, goodwill is allocated to each of the Company’s cash generating units (CGUs) or group of CGUs that are expected to benefit from the synergies of the acquisition. If the recoverable amount of the CGU or group of CGUs is less than the carrying amount, the impairment loss is allocated first to reduce the carrying amount of any goodwill and then to other assets of the CGU or group of CGUs.
Identifiable intangible assets
The Company’s intangible assets are stated at cost, less accumulated amortization and are amortized on a straight-line basis in the consolidated statements of loss and comprehensive loss over their estimated useful lives.
The major categories of intangible assets are amortized as follows:
| Exclusive licence agreement | | 20 years |
| Software | | 5 years |
| Brand | | 5 years |
| Proprietary technology | | 5 years |
Impairment of non-financial assets
Property and equipment and intangible assets are tested for impairment when events or changes in circumstances indicate the carrying amount may not be recoverable. For the purpose of measuring recoverable amounts, assets are grouped at the lowest levels for which there are separately identifiable cash flow CGUs.
Profound Medical Corp.
Notes to Consolidated Financial Statements
December 31, 2018 and 2017 and 2016
The recoverable amount is the higher of an asset’s fair value, less costs of disposal and value in use (which is the present value of the expected future cash flows of the relevant asset or CGU). An impairment loss is recognized as the amount by which the asset’s carrying amount exceeds its recoverable amount. The Company evaluates impairment losses for potential reversals when events or circumstances warrant such consideration.
Accounts payable and accrued liabilities
These amounts represent liabilities for goods and services provided to the Company before the end of the financial year, which are unpaid. Accounts payable and accrued liabilities are presented as current liabilities unless payment is not due within 12 months after the reporting period. They are recognized initially at their fair value and subsequently measured at amortized cost using the effective interest method.
Long-term debt
Long-term debt is initially recognized at fair value, net of transaction costs incurred. Long-term debt is subsequently measured at amortized cost. Any difference between the proceeds (net of transaction costs) and the redemption amount is recognized in the consolidated statements of loss and comprehensive loss over the period of the long-term debt using the effective interest method.
Long-term debt is removed from the consolidated balance sheets when the obligation specified in the contract is discharged, cancelled or expired. The difference between the carrying amount of a financial liability that has been extinguished and the consideration paid is recognized in the consolidated statements of loss and comprehensive loss within finance costs.
Financial liabilities and equity instruments
| · | Classification as debt or equity |
Instruments issued by the Company are classified as either financial liabilities or as equity in accordance with the substance of the contractual arrangements and the definitions of a financial liability and an equity instrument.
The Knight Loan contained a financial liability in accordance with the terms of the contractual arrangements. At the date of issue, the host financial liability was recorded at fair value. The financial liability was measured on an amortized cost basis using the effective interest method over the expected life and was subsequently remeasured at fair value through profit or loss.
Provisions
A provision is recognized when the Company has a legal or constructive obligation as result of a past event, it is probable that an outflow of economic benefits will be required to settle the obligation and a reliable estimate can be made of the amount of the obligation. If the effect is material, provisions are determined by discounting the expected future cash flows at a pre-tax rate that reflects current market assessments of the time value of money and, where appropriate, the risks specific to the liability.
Profound Medical Corp.
Notes to Consolidated Financial Statements
December 31, 2018 and 2017 and 2016
Revenue
To determine revenue recognition for arrangements the Company performs the following five steps: (i) identify the contract(s) with a customer; (ii) identify the performance obligations in the contract; (iii) determine the transaction price; (iv) allocate the transaction price to the performance obligations in the contract; and (v) recognize revenue when (or as) the entity satisfies a performance obligation. The Company only applies the five-step model to contracts when it is probable that the entity will collect the consideration it is entitled to in exchange for the goods or services it transfers to the customer.
The Company derives its revenues primarily from the sale of medical devices. Revenue is recognized when a contractual promise to a customer (performance obligation) has been fulfilled by transferring control over the promised goods or services, generally at the point in time of shipment to or receipt of the products by the customer or when the services are performed. When contracts contain customer acceptance provisions, revenue is recognized on the satisfaction of the specific acceptance criteria.
The amount of revenue to be recognized is based on the consideration the Company expects to receive in exchange for its goods and services. For contracts that contain multiple performance obligations, the Company allocates the consideration to which it expects to be entitled to each performance obligation based on relative standalone selling prices and recognizes the related revenue when or as control of each individual performance obligation is transferred to customers.
Service revenue related to installation and training is recognized over the period in which the services are performed. Service revenue related to extended warranty service is deferred and recognized on a straight-line basis over the extended warranty period covered by the respective customer contract.
Under the terms of certain of the Company’s partnership agreements, the Company retains a percentage of all amounts earned with the remaining percentage due to the partner. Accordingly, associated revenue is recognized net of the consideration due to the partner.
Cost of sales
Cost of sales primarily includes the cost of finished goods, inventory provisions, royalties, warranty expense, freight and direct overhead expenses necessary to acquire or manufacture the finished goods.
Income taxes
Income taxes are accounted for using the liability method. Deferred tax assets and liabilities are recognized for the differences between the tax basis and carrying amounts of assets and liabilities, for operating losses and for tax credit carry-forwards. Deferred tax assets are recognized to the extent that it is probable that future taxable income will be available against which temporary differences can be utilized. Deferred tax assets and liabilities are measured using enacted or substantively enacted tax rates and laws.
Profound Medical Corp.
Notes to Consolidated Financial Statements
December 31, 2018 and 2017 and 2016
Share-based compensation
The Company grants share options periodically to certain employees, directors, officers and advisers.
Options currently outstanding vest over four years and have a contractual life of ten years. Each tranche in an award is considered a separate award with its own vesting period and grant date fair value. The fair value of each tranche is measured at the date of grant using the Black-Scholes option pricing model. Compensation expense is recognized over the tranche’s vesting period using the graded vesting method by increasing contributed surplus based on the number of awards expected to vest.
Leases
Leases are classified as finance leases when the lease arrangement transfers substantially all of the risks and rewards related to the ownership of the leased asset. All other leases are treated as operating leases. Payments on operating lease agreements are recognized as an expense on a straight-line basis over the lease term. Associated costs, such as maintenance and insurance, are expensed as incurred.
Research and development costs
Research costs are charged to expense as incurred. Development costs are capitalized and amortized when the criteria for capitalization are met, otherwise they are expensed as incurred. No development costs have been capitalized to date.
Clinical trial expenses result from obligations under contracts with vendors, consultants and clinical site agreements in connection with conducting clinical trials. The financial terms of these contracts are subject to negotiations, which vary from contract to contract and may result in payment flows that do not match the periods over which materials or services are provided to the Company. The appropriate level of clinical trial expenses is reflected in the Company’s consolidated financial statements by matching period expenses with period services and efforts expended. These expenses are recorded according to the progress of the clinical trial as measured by patient progression and the timing of various aspects of the clinical trial. Clinical trial accrual estimates are determined through discussions with internal clinical personnel and outside service providers as to the progress or state of completion of clinical trials, or the services completed. Service provider status is then compared to the contractually obligated fees to be paid for such services. During the course of a clinical trial, the Company may adjust the rate of clinical expense recognized if actual results differ from management’s estimates.
Loss per share
Basic loss per share is calculated by dividing the net loss by the weighted average number of common shares outstanding during the year. Diluted loss per share is calculated by dividing the applicable net loss by the sum of the weighted average number of shares outstanding during the year and all additional common shares that would have been outstanding if potentially dilutive common shares had been issued during the year. The computation of diluted loss per share is equal to the basic loss per share due to the anti-dilutive effect of the share options and warrants.
Profound Medical Corp.
Notes to Consolidated Financial Statements
December 31, 2018 and 2017 and 2016
Reclassification
Certain prior year figures have been reclassified to conform with the current year presentation.
Accounting standards issued but not yet adopted
| · | IFRS 16, Leases (IFRS 16) |
IFRS 16 sets out the principles for the recognition, measurement and disclosure of leases. IFRS 16 provides revised guidance on identifying a lease and for separating lease and non-lease components of a contract. IFRS 16 introduces a single accounting model for all lessees, thereby removing the distinction between operating and finance leases. IFRS 16 requires a lessee to recognize an asset (right-to-use the leased item) and a financial liability to pay rentals on the interim condensed consolidated balance sheets with terms of more than 12 months, unless the underlying asset is of low value. The standard permits either a full retrospective or a modified retrospective approach for the adoption. IFRS 16 was effective for annual periods beginning on or after January 1, 2019.
The Company has adopted IFRS 16 retrospectively from January 1, 2019, but did not restate comparative information, as permitted under the specific transitional provisions in the standard in accordance with the modified retrospective approach for adoption. The reclassifications and the adjustments arising from the new leasing standard were therefore recognized in the opening consolidated balance sheet on January 1, 2019.
Adjustments recognized on adoption of IFRS 16
On adoption of IFRS 16, the Company recognized lease liabilities in relation to leases, which had previously been classified as operating leases under the principles of IAS 17, Leases (IAS 17). These liabilities were measured at the present value of the remaining lease payments, discounted using the incremental borrowing rate as of January 1, 2019. The weighted average lessee’s incremental borrowing rate applied to the lease liabilities on January 1, 2019 was 4%.
| | | $ | |
| | | | |
| Operating lease commitments as at December 31, 2018 | | | 3,313,292 | |
| Asset retirement obligation | | | 111,100 | |
| Discounted using the Company’s average incremental borrowing rate of 4.0% | | | (836,665 | ) |
| Lease liabilities recognized as at January 1, 2019 | | | 2,587,727 | |
The change in accounting policy affected the following items in the consolidated balance sheet on January 1, 2019:
Profound Medical Corp.
Notes to Consolidated Financial Statements
December 31, 2018 and 2017 and 2016
| | | Increase
(decrease)
$ | |
| | | | |
| Right-of-use assets | | | 2,616,773 | |
| Lease liabilities | | | 2,587,727 | |
| Prepaid expenses and deposits | | | (210,000 | ) |
| Provisions | | | (49,319 | ) |
| Other liabilities | | | (292,054 | ) |
| Deficit | | | 160,419 | |
Practical expedients applied
The Company elected to apply the practical expedient not to recognize right-of-use assets and lease liabilities for short-term leases that have a lease term of 12 months or less and leases of low value assets. The lease payments associated with these leases are recognized as an expense on a straight-line basis over the lease term.
The Company also elected not to reassess whether a contract is, or contains a lease at the date of initial application. Instead, for contracts entered into before the transition date, the Company has relied on its assessment made applying IAS 17 and IFRIC 4, Determining whether an Arrangement contains a Lease.
| · | IFRIC 23, Uncertainty over Income Tax Treatments (IFRIC 23) |
In June 2017, the IASB issued IFRIC 23, with a mandatory effective date of January 1, 2019. The interpretations provide guidance on how to value uncertain income tax positions based on the probability of whether the relevant tax authorities will accept the Company’s tax treatments. A Company is to assume that a taxation authority with the right to examine any amounts reported to it will examine those amounts and will have full knowledge of all relevant information when doing so. IFRIC 23 is to be applied by recognizing the cumulative effect of initially applying these guidelines in opening deficit without adjusting comparative information. There was no impact in applying the new standard.
| 3 | Critical accounting estimates and judgments |
Critical accounting judgments
| · | Complex financial instruments and provisions |
The Company makes various judgments when determining the accounting for certain complex financial instruments and provisions. The Company has concluded that the contingent consideration in a business combination represents a financial liability measured at fair value through profit or loss. The revenue share obligation represents an executory contract and is accounted for as a best estimate provision.
Profound Medical Corp.
Notes to Consolidated Financial Statements
December 31, 2018 and 2017 and 2016
| · | Accounting for acquisitions |
The Company assesses whether an acquisition should be accounted for as an asset acquisition or a business combination under IFRS 3. This assessment requires management to assess whether the assets acquired and liabilities assumed constitute a business as defined in IFRS 3 and if the integrated set of activities, including inputs and processes acquired, is capable of being conducted and managed as a business and the Company obtains control of the business. The Company’s acquisition has been accounted for as a business combination.
Critical accounting estimates
The Company makes estimates and assumptions concerning the future. The resulting accounting estimates will, by definition, seldom equal the related actual results. The estimates and assumptions that have a significant risk of causing a material adjustment to the carrying amounts of assets and liabilities within the next financial year are addressed as follows:
| · | Revenue share obligation |
The revenue share obligation provision was determined using certain assumptions described in note 9. The Company uses its judgment to select a variety of methods and make assumptions that are mainly based on conditions existing at the end of each reporting period.
| · | Impairment of non-financial assets |
The Company reviews amortized non-financial assets for impairment whenever events or changes in circumstances indicate the carrying amount of the assets may be impaired. It also reviews goodwill annually for impairment. If the recoverable amount of the respective non-financial asset is less than its carrying amount, it is considered to be impaired. In the process of measuring the recoverable amount, management makes assumptions about future events and circumstances. The actual results may vary and may cause significant adjustments.
| · | Accounting for acquisitions and contingent consideration |
Areas of estimation include the determination and fair value measurement of the contingent consideration, which includes the Company developing its best estimate of projected revenue, the probability of the contingency being achieved and the discount rate. Management is also required to make estimates of the fair value of assets acquired and liabilities assumed.
Clinical trial expenses are accrued based on the services received and efforts expended pursuant to agreements with clinical trial sites and other vendors. In the normal course of business, the Company contracts third parties to perform various clinical trial activities. The financial terms of these agreements vary from contract to contract, are subject to negotiation and may result in uneven payment flows. Payments under the contracts depend on factors such as the achievement of certain events, the successful enrollment of patients or the completion of certain portions of a clinical trial. The Company determines the accrual by reviewing contracts, vendor agreements and through discussions with internal personnel and external clinical trial sites as to the progress or stage of completion of the clinical trial and the agreed on fees to be paid for such services. Actual costs and timing of the clinical trial are uncertain, subject to risks and may change depending on a number of factors.
Profound Medical Corp.
Notes to Consolidated Financial Statements
December 31, 2018 and 2017 and 2016
On July 31, 2017, the Company entered into an Asset and Share Purchase Agreement (the agreement) to acquire all of the issued and outstanding shares and certain assets of Royal Philips’ (Philips) Sonalleve MR-HIFU business (Sonalleve). Under the terms of the agreement, Philips transferred its Sonalleve assets to the Company for an upfront consideration of 7,400,000 common shares of the Company. The agreement includes certain contingent consideration payments payable monthly in euro tied to future revenue levels of the Sonalleve business summarized as follows:
| · | 5% of revenue between the date of acquisition and December 31, 2017; |
| · | 6% of revenue during the year ending December 31, 2018; |
| · | 7% of revenue during the years ending December 31, 2019 and 2020; and |
if total revenues are in excess of a defined amount from the date of acquisition to December 31, 2020, then the Company will be required to pay 7% of revenue from the date of acquisition to December 31, 2019.
As part of closing the agreement, the Company committed to repay all amounts outstanding under the Knight Loan (note 10) on or before December 31, 2018. The Knight Loan was repaid on July 25, 2018.
The non-exclusive strategic sales relationship with Philips was expanded to include distribution of Sonalleve. Under the terms of the agreement, Philips will also provide other services, including, but not limited to, manufacturing and installation of Sonalleve MR-HIFU for a certain period of time at market rates.
The contingent consideration (note 11) is classified as a Level 3 financial liability within the fair value hierarchy given its fair value is estimated using the discounted value of estimated future payments. The key assumptions in valuing the contingent consideration include: estimated projected net sales; the likelihood of certain levels being reached; and a discount rate of 15%. During the year ended December 31, 2018, the change in fair value of the contingent consideration was a gain of $325,253 (2017 – loss of $82,578, 2016 - $nil).
Profound Medical Corp.
Notes to Consolidated Financial Statements
December 31, 2018 and 2017 and 2016
The Company accounted for this transaction as a business combination and has applied the acquisition method of accounting. The purchase price allocation of assets acquired and liabilities assumed and the fair value of the total consideration transferred is as follows:
| | | $ | |
| | | | |
| Assets acquired and liabilities assumed | | | | |
| Cash | | | 183,988 | |
| Accounts payable and accrued liabilities | | | (183,988 | ) |
| Property and equipment (note 7) | | | 713,872 | |
| Intangible assets (note 8) | | | 5,372,435 | |
| Goodwill | | | 3,409,165 | |
| | | | 9,495,472 | |
| | | | | |
| Consideration paid or payable | | | | |
| Common shares issued | | | 7,844,000 | |
| Fair value of contingent consideration (note 11) | | | 1,651,472 | |
| | | | 9,495,472 | |
Goodwill of $3,409,165 arising from the acquisition is attributable to the acquired workforce and synergies expected from combining the operations of the Company.
Had the Sonalleve MR-HIFU business been consolidated from January 1, 2017, the consolidated statements of loss and comprehensive loss would be pro forma revenue of $6,883,850 and a pro forma net loss and comprehensive loss of $21,657,797 for the year ended December 31, 2017.
During the period from July 31, 2017 to December 31, 2017, there was revenue of $2,484,804 and a net loss and comprehensive loss of $1,166,582 recorded in the consolidated statements of loss and comprehensive loss related to the former Sonalleve MR-HIFU business.
Acquisition related costs of $716,767 have been charged to general and administrative expenses in the consolidated statements of loss and comprehensive loss.
| 5 | Trade and other receivables |
The trade and other receivables balance comprises the following:
| | | 2018
$ | | | 2017
$ | |
| | | | | | | |
| Trade receivables | | | 1,791,688 | | | | 3,971,768 | |
| Interest receivable | | | 55,730 | | | | - | |
| Indirect tax receivables | | | 565,832 | | | | 279,890 | |
| Other receivables | | | 272,862 | | | | - | |
| | | | | | | | | |
| Total trade and other receivables | | | 2,686,112 | | | | 4,251,658 | |
Profound Medical Corp.
Notes to Consolidated Financial Statements
December 31, 2018 and 2017 and 2016
Trade receivables include the gross revenue amount billed to customers and certain amounts that are included in deferred revenue. Included in accounts payable and accrued liabilities is an amount of $nil (2017 – $2,534,259) payable to the same counterparty as the corresponding trade receivable balance of $nil (2017 –$3,505,423) as there is no legal right of offset with respect to the receivable and payable balances.
An aging of trade receivable balances past due is as follows:
| | | 2018
$ | | | 2017
$ | |
| | | | | | | |
| Past due 1 – 30 days | | | - | | | | 16,057 | |
| Past due 31 – 60 days | | | - | | | | 1,553,215 | |
| | | | | | | | | |
| | | | - | | | | 1,569,272 | |
Amounts past due represent trade receivables past due based on the customer’s contractual terms. The Company applies the simplified approach to providing for expected credit losses prescribed by IFRS 9, which permits the use of the lifetime expected loss provision for all trade receivables (note 18).
| | | 2018
$ | | | 2017
$ | |
| | | | | | | |
| Finished goods | | | 2,305,746 | | | | 715,193 | |
| Raw materials | | | 1,383,572 | | | | 799,589 | |
| Inventory provision | | | (57,695 | ) | | | (83,625 | ) |
| | | | | | | | | |
| Total inventory | | | 3,631,623 | | | | 1,431,157 | |
During the year ended December 31, 2018, $1,648,728 (2017 – $2,255,727, 2016 – $nil) of inventory was recognized in cost of sales. The Company decreased its inventory provision by $25,930 during the year ended December 31, 2018 (2017 – $44,603). There were no other inventory writedowns charged to cost of sales during the year ended December 31, 2018.
Profound Medical Corp.
Notes to Consolidated Financial Statements
December 31, 2018 and 2017 and 2016
Property and equipment consist of the following:
| | | Furniture
and
fittings
$ | | | Research
and
manufact-
uring
equipment
$ | | | Leasehold
Improve-
ments
$ | | | Computer
equipment
$ | | | Computer
software
$ | | | Total
$ | |
| | | | | | | | | | | | | | | | | | | |
| Year ended December 31, 2017 | | | | | | | | | | | | | | | | | | |
| Opening net book value | | | 173,201 | | | | 180,395 | | | | 530,148 | | | | 69,285 | | | | - | | | | 953,029 | |
| Additions | | | - | | | | 254,378 | | | | 140,181 | | | | 19,860 | | | | - | | | | 414,419 | |
| Acquisition (note 4) | | | - | | | | 713,872 | | | | - | | | | - | | | | - | | | | 713,872 | |
| Foreign exchange | | | - | | | | 16,150 | | | | - | | | | - | | | | - | | | | 16,150 | |
| Depreciation | | | (38,318 | ) | | | (217,207 | ) | | | (64,540 | ) | | | (51,255 | ) | | | - | | | | (371,320 | ) |
| Closing net book value | | | 134,883 | | | | 947,588 | | | | 605,789 | | | | 37,890 | | | | - | | | | 1,726,150 | |
| | | | | | | | | | | | | | | | | | | | | | | | | |
| At December 31, 2017 | | | | | | | | | | | | | | | | | | | | | | | | |
| Cost | | | 235,169 | | | | 1,386,692 | | | | 718,742 | | | | 212,541 | | | | 176,462 | | | | 2,729,606 | |
| Accumulated depreciation | | | (100,286 | ) | | | (439,104 | ) | | | (112,953 | ) | | | (174,651 | ) | | | (176,462 | ) | | | (1,003,456 | ) |
| Net book value | | | 134,883 | | | | 947,588 | | | | 605,789 | | | | 37,890 | | | | - | | | | 1,726,150 | |
| | | | | | | | | | | | | | | | | | | | | | | | | |
| Year ended December 31, 2018 | | | | | | | | | | | | | | | | | | | | | | | | |
| Opening net book value | | | 134,883 | | | | 947,588 | | | | 605,789 | | | | 37,890 | | | | - | | | | 1,726,150 | |
| Foreign exchange | | | - | | | | 27,208 | | | | - | | | | - | | | | - | | | | 27,208 | |
| Depreciation | | | (38,318 | ) | | | (403,554 | ) | | | (69,282 | ) | | | (34,847 | ) | | | - | | | | (546,001 | ) |
| Closing net book value | | | 96,565 | | | | 571,242 | | | | 536,507 | | | | 3,043 | | | | - | | | | 1,207,357 | |
| | | | | | | | | | | | | | | | | | | | | | | | | |
| At December 31, 2018 | | | | | | | | | | | | | | | | | | | | | | | | |
| Cost | | | 235,169 | | | | 1,386,692 | | | | 718,742 | | | | 212,541 | | | | 176,462 | | | | 2,729,606 | |
| Accumulated depreciation | | | (138,604 | ) | | | (815,450 | ) | | | (182,235 | ) | | | (209,498 | ) | | | (176,462 | ) | | | (1,522,249 | ) |
| Net book value | | | 96,565 | | | | 571,242 | | | | 536,507 | | | | 3,043 | | | | - | | | | 1,207,357 | |
Profound Medical Corp.
Notes to Consolidated Financial Statements
December 31, 2018 and 2017 and 2016
Intangible assets consist of the following:
| | | Exclusive
licence
agreement
$ | | | Software
$ | | | Proprietary
technology
$ | | | Brand
$ | | | Total
$ | |
| | | | | | | | | | | | | | | | |
| Year ended December 31, 2017 | | | | | | | | | | | | | | | | | | | | |
| Opening net book value | | | 30,000 | | | | 232,685 | | | | - | | | | - | | | | 262,685 | |
| Additions | | | - | | | | 34,080 | | | | - | | | | - | | | | 34,080 | |
| Acquisition (note 4) | | | - | | | | - | | | | 4,489,295 | | | | 883,140 | | | | 5,372,435 | |
| Disposals | | | - | | | | (26,684 | ) | | | - | | | | - | | | | (26,684 | ) |
| Amortization | | | (2,500 | ) | | | (50,315 | ) | | | (374,108 | ) | | | (73,595 | ) | | | (500,518 | ) |
| Closing net book value | | | 27,500 | | | | 189,766 | | | | 4,115,187 | | | | 809,545 | | | | 5,141,998 | |
| | | | | | | | | | | | | | | | | | | | | |
| As at December 31, 2017 | | | | | | | | | | | | | | | | | | | | |
| Cost | | | 50,000 | | | | 257,254 | | | | 4,489,295 | | | | 883,140 | | | | 5,679,689 | |
| Accumulated amortization | | | (22,500 | ) | | | (67,488 | ) | | | (374,108 | ) | | | (73,595 | ) | | | (537,691 | ) |
| Net book value | | | 27,500 | | | | 189,766 | | | | 4,115,187 | | | | 809,545 | | | | 5,141,998 | |
| | | | | | | | | | | | | | | | | | | | | |
| Year ended December 31, 2018 | | | | | | | | | | | | | | | | | | | | |
| Opening net book value | | | 27,500 | | | | 189,766 | | | | 4,115,187 | | | | 809,545 | | | | 5,141,998 | |
| Amortization | | | (2,500 | ) | | | (51,450 | ) | | | (897,859 | ) | | | (176,628 | ) | | | (1,128,437 | ) |
| Closing net book value | | | 25,000 | | | | 138,316 | | | | 3,217,328 | | | | 632,917 | | | | 4,013,561 | |
| | | | | | | | | | | | | | | | | | | | | |
| As at December 31, 2018 | | | | | | | | | | | | | | | | | | | | |
| Cost | | | 50,000 | | | | 257,254 | | | | 4,489,295 | | | | 883,140 | | | | 5,679,689 | |
| Accumulated amortization | | | (25,000 | ) | | | (118,938 | ) | | | (1,271,967 | ) | | | (250,223 | ) | | | (1,666,128 | ) |
| Net book value | | | 25,000 | | | | 138,316 | | | | 3,217,328 | | | | 632,917 | | | | 4,013,561 | |
The Company has a licence agreement (the licence) with Sunnybrook Health Sciences Centre (Sunnybrook), pursuant to which Sunnybrook licenses to the Company certain intellectual property. Pursuant to the licence, the Company has exclusively licenced-in rights that enable the Company to use Sunnybrook’s technology for MRI-guided trans-urethral ultrasound therapy. Under the licence, the Company is subject to various obligations, including milestone payments of up to $250,000 (on FDA approval) and legal costs associated with patent application preparation, filing and maintenance. Subject to certain buyout provisions as defined in the licence, the Company has the option to acquire ownership of the licensed technology and intellectual property. In addition, the Company has a further option to acquire rights to improvements to the relevant technology and intellectual property. If the Company fails to comply with any of its obligations or otherwise breaches this agreement, Sunnybrook may have the right to terminate the licence.
Profound Medical Corp.
Notes to Consolidated Financial Statements
December 31, 2018 and 2017 and 2016
In accordance with the Company’s accounting policy, the carrying value of goodwill is assessed annually as well as assessed for impairment triggers at each reporting date to determine whether there exists any indicators of impairment. When there is an indicator of impairment of non-current assets within a CGU or group of CGUs containing goodwill, the Company tests the non-current assets for impairment first and recognizes any impairment loss on goodwill before applying any remaining impairment loss against the non-current assets within the CGU.
The Company completed its annual goodwill impairment testing on the goodwill related to the Sonalleve MR-HIFU CGU, which comprises all of the goodwill of the Company, on December 31, 2018. The recoverable amount of the Sonalleve MR-HIFU CGU was calculated using fair value less costs of disposal (FVLCD).
The calculation of the recoverable amount of the Sonalleve MR-HIFU CGU was determined using discounted cash flow projections based on financial forecasts approved by management covering a four-year period (Level 3 of the fair value hierarchy) and a terminal growth assumption of 4%. The key assumptions and estimates used in determining the FVLCD are related to revenue and EBITDA assumptions, which are based on the financial forecast and assumed growth rates, working capital assumptions, the effective tax rate of 26.5% and the discount rate of 20.3% applied to the cash flow projections. As a result of the impairment testing performed, it was determined that the recoverable amount of the Sonalleve MR-HIFU CGU of $13,864,000 exceeded the carrying value of $7,659,000 and no impairment writedown was required.
| | | Asset
retirement
obligation
$ | | | Revenue
share
obligation
$ | | | Warranty
provision
$ | | | Total
$ | |
| | | | | | | | | | | | | |
| As at January 1, 2017 | | | 39,619 | | | | - | | | | - | | | | 39,619 | |
| Additions | | | - | | | | 921,906 | | | | 115,351 | | | | 1,037,257 | |
| Accretion expense | | | 4,585 | | | | - | | | | - | | | | 4,585 | |
| As at December 31, 2017 | | | 44,204 | | | | 921,906 | | | | 115,351 | | | | 1,081,461 | |
| Additions | | | - | | | | 208,242 | | | | 65,079 | | | | 273,321 | |
| Expiry | | | - | | | | - | | | | (74,582 | ) | | | (74,582 | ) |
| Foreign exchange | | | - | | | | 111,509 | | | | 4,512 | | | | 116,021 | |
| Accretion expense | | | 5,115 | | | | - | | | | - | | | | 5,115 | |
| As at December 31, 2018 | | | 49,319 | | | | 1,241,657 | | | | 110,360 | | | | 1,401,336 | |
| Less: Current portion | | | - | | | | 1,241,657 | | | | 110,360 | | | | 1,352,017 | |
| Long-term portion | | | 49,319 | | | | - | | | | - | | | | 49,319 | |
Asset retirement obligation
The asset retirement obligation is related to the Company’s leasehold improvements.
Profound Medical Corp.
Notes to Consolidated Financial Statements
December 31, 2018 and 2017 and 2016
Revenue share obligation
The Company has certain minimum amounts payable under a co-marketing and co-selling agreement with Siemens Healthcare GmbH (Siemens). The provision was determined using the following assumptions:
| · | estimated probability of a new agreement being signed based on the facts and circumstances in place as at December 31, 2018 that eliminated these minimum amounts payable; |
| · | future revenue forecasts related to the revenue share agreement; and |
The amount has been included in selling and distribution expenses in the consolidated statements of loss and comprehensive loss.
Subsequent to year-end, the Company replaced the original co-marketing and co-selling agreement with Siemens with a new agreement. Under the new agreement, all prior financial commitments and obligations owed to Siemens are released and replaced with a non-exclusive licence resulting in a one-time fixed licence fee and a per annum payment per device interfaced to a Siemens MRI scanner. In exchange for the one-time fixed licence fee and per annum payments, the Company obtained a non-exclusive licence and reasonable support for the term of the agreement.
Warranty provision
The warranty provision is related to the Company’s estimate of future warranty obligations on product sales, which generally have a term of 12 to 24 months.
A summary of the long-term debt is as follows:
| | | 2018
$ | | | 2017
$ | |
| | | | | | | |
| CIBC loan | | | 11,955,245 | | | | - | |
| FedDev and HTX loans | | | - | | | | 1,607,195 | |
| Knight Loan | | | - | | | | 3,537,894 | |
| Balance – End of year | | | 11,955,245 | | | | 5,145,089 | |
| Less: Current portion | | | 1,339,583 | | | | 4,701,214 | |
| Long-term portion | | | 10,615,662 | | | | 443,875 | |
The Federal Economic Development Agency (FedDev) loan with total proceeds of $867,000 was unsecured and non-interest bearing. The final repayment of $563,550 was made on July 25, 2018.
Profound Medical Corp.
Notes to Consolidated Financial Statements
December 31, 2018 and 2017 and 2016
During the year ended December 31, 2018, the Company recognized $90,775 of interest and accretion expense on this loan (2017 – $54,024, 2016 – $57,076).
The Health Technology Exchange (HTX) loans with total proceeds of $1,500,000 were unsecured and bearing interest at 4.50% per annum. The final repayment of $1,094,698, including accrued interest, was made on March 31, 2018.
During the year, the Company recognized $18,078 of interest and accretion expense on this loan (2017 – $111,978, 2016 – $107,046).
A reconciliation of the FedDev and HTX loans is as follows:
| | | 2018
$ | | | 2017
$ | |
| | | | | | | |
| Balance – Beginning of year | | | 1,607,195 | | | | 2,027,893 | |
| Repayment | | | (1,716,048 | ) | | | (586,700 | ) |
| Interest and accretion expense | | | 108,853 | | | | 166,002 | |
| Balance – End of year | | | - | | | | 1,607,195 | |
| Less: Current portion | | | - | | | | 1,163,320 | |
| Long-term portion | | | - | | | | 443,875 | |
On April 30, 2015, Profound Medical Inc. signed an agreement with Knight Therapeutics Inc. (Knight) to provide a secured loan of $4,000,000 (the Knight Loan) for an initial period of four years with an interest rate of 15% per annum, with payments of interest and principal deferred until June 30, 2017. As part of the agreement, Knight was also granted a royalty of 0.5% on net sales resulting from global sales of the Company’s products until May 20, 2019 (the royalty). In addition, the Company also entered into a distribution, licence and supply agreement with Knight pursuant to which Knight will act as the exclusive distributor of the Company’s product in Canada for an initial ten-year term, renewable for successive ten-year terms by either party. In connection with these arrangements, the Company issued to Knight 4% of the common shares of the Company (1,717,450 common shares). On July 25, 2018, the full amount of the Knight Loan, including prepayment fees, was repaid for a total payment of $3,188,023.
A reconciliation of the Knight Loan balance is as follows:
| | | 2018
$ | | | 2017
$ | |
| | | | | | | |
| Balance – Beginning of year | | | 3,537,894 | | | | 4,609,983 | |
| Repayment | | | (4,003,797 | ) | | | (2,290,350 | ) |
| Interest and accretion expense | | | 465,903 | | | | 1,218,261 | |
| Balance – End of year | | | - | | | | 3,537,894 | |
| Less: Current portion | | | - | | | | 3,537,894 | |
| Long-term portion | | | - | | | | - | |
Profound Medical Corp.
Notes to Consolidated Financial Statements
December 31, 2018 and 2017 and 2016
The royalty was initially recorded at fair value and was subsequently carried at amortized cost using the effective interest rate method. The initial fair value of the royalty was determined using future revenue forecasts for the term of the loan and a discount rate of 18%. During the year, the Company revised the fair value of the royalty, using future revenue forecasts for the term of the loan and a discount rate of 18%, and recognized an interest accretion recovery of $63,322 (2017 – $36,438, 2016 – $249,413). This liability is included within other liabilities on the consolidated balance sheets.
On July 30, 2018, the Company signed a term loan agreement with CIBC Innovation Banking (CIBC) to provide a secured loan for total initial gross proceeds of $12,500,000 maturing on July 29, 2022 with an interest rate based on prime plus 2.5%. The Company is required to make interest only payments until October 31, 2019 and monthly repayments on the principal of $378,788 plus accrued interest commencing on October 31, 2019. All obligations of the Company under the term loan agreement are guaranteed by current and future subsidiaries of the Company and include security of first priority interests in the assets of the Company and its subsidiaries. The Company has the ability to draw an additional $6,250,000 subject to the achievement of certain financing and product development milestones. The Company has a financial covenant in relation to the CIBC loan where unrestricted cash is required to be greater than operating cash expenditures for a trailing three-month period, reported on a monthly basis. The Company is in compliance with this financial covenant as at December 31, 2018.
| | | $ | |
| | | | |
| Balance – Beginning of year | | | - | |
| Proceeds received | | | 12,500,000 | |
| Transaction costs | | | (930,520 | ) |
| Interest and accretion expense | | | 517,409 | |
| Repayment | | | (131,644 | ) |
| Balance – End of year | | | 11,955,245 | |
| Less: Current portion | | | 1,339,583 | |
| Long-term portion | | | 10,615,662 | |
In connection with this term loan agreement, on July 31, 2018 the Company also issued 321,714 common share purchase warrants to CIBC, with each warrant entitling the holder to acquire one common share at a price of $0.97 per common share until the date that is 60 months from the closing of the term loan agreement, with a cashless exercise feature. The cashless exercise feature causes the conversion ratio to be variable and the warrants are therefore classified as a financial liability. Gains and losses on the warrants are recorded within finance costs on the consolidated statements of loss and comprehensive loss. A pricing model with observable market based inputs was used to estimate the fair value of the warrants issued. The estimated fair value of the warrants as at July 31, 2018 and December 31, 2018 was $194,822 and $98,203, respectively.
Profound Medical Corp.
Notes to Consolidated Financial Statements
December 31, 2018 and 2017 and 2016
The variables used to determine the fair values are as follows:
| | | December 31,
2018 | | | July 31,
2018 | |
| | | | | | | |
| Share price | | $ | 0.55 | | | $ | 1.00 | |
| Volatility | | | 86 | % | | | 72 | % |
| Expected life of warrants | | | 4.6 years | | | | 5 years | |
| Risk-free interest rate | | | 1.88 | % | | | 2.19 | % |
| Dividend yield | | | - | | | | - | |
| | | Knight
royalty
payable
$ | | | Contingent
consideration
(note 4)
$ | | | Deferred
rent
$ | | | Total
$ | |
| | | | | | | | | | | | | |
| As at January 1, 2017 | | | 148,401 | | | | - | | | | 161,320 | | | | 309,721 | |
| Additions | | | - | | | | 1,651,472 | | | | 123,627 | | | | 1,775,099 | |
| Amounts paid | | | (15,069 | ) | | | - | | | | - | | | | (15,069 | ) |
| Change in fair value (note 15) | | | - | | | | 82,578 | | | | - | | | | 82,578 | |
| Accretion recovery (note 15) | | | (36,438 | ) | | | - | | | | - | | | | (36,438 | ) |
| As at December 31, 2017 | | | 96,894 | | | | 1,734,050 | | | | 284,947 | | | | 2,115,891 | |
| Additions | | | - | | | | - | | | | 7,108 | | | | 7,108 | |
| Amounts paid | | | (13,919 | ) | | | (153,056 | ) | | | - | | | | (166,975 | ) |
| Change in fair value (note 15) | | | - | | | | (325,253 | ) | | | - | | | | (325,253 | ) |
| Accretion recovery (note 15) | | | (63,322 | ) | | | - | | | | - | | | | (63,322 | ) |
| As at December 31, 2018 | | | 19,653 | | | | 1,255,741 | | | | 292,055 | | | | 1,567,449 | |
| Less: Current portion | | | 19,653 | | | | 547,643 | | | | - | | | | 567,296 | |
| Long-term portion | | | - | | | | 708,098 | | | | 292,055 | | | | 1,000,153 | |
Knight royalty payable
As part of the Knight Loan, Knight was granted a royalty of 0.5% on net sales resulting from global sales of the Company’s products until May 20, 2019.
Deferred rent
The deferred rent obligation is related to the Company’s straight-line rent accrual for its current premises.
Profound Medical Corp.
Notes to Consolidated Financial Statements
December 31, 2018 and 2017 and 2016
Common shares
The Company is authorized to issue an unlimited number of common shares.
Issued and outstanding (with no par value)
| | | 2018
$ | | | 2017
$ | | | 2016
$ | |
| | | | | | | | | | | | | |
| 108,054,939 (2017 – 73,117,377, 2016 – 55,305,577) common shares | | | 120,932,404 | | | | 98,365,770 | | | | 83,272,678 | |
On March 20, 2018, the Company closed a bought deal financing, resulting in the issuance of 34,500,000 units at a price of $1.00 per unit, for gross proceeds of $34,500,000 ($32,027,502, net of cash transaction costs). Each unit consisted of one common share of the Company and one-half of one warrant, with each whole warrant entitling the holder to acquire one common share at a price of $1.40 per common share until the date that is 60 months from the closing of the bought deal financing.
On September 20, 2017, the Company closed a bought deal financing, resulting in the issuance of 10,000,000 units at a price of $1.00 per unit for gross proceeds of $10,000,000 ($8,913,868, net of cash transaction costs). Each unit consisted of one common share of the Company and one-half of one warrant, with each whole warrant entitling the holder to acquire one common share at a price of $1.40 per common share until the date that is 36 months from the closing of the bought deal financing.
On November 14, 2016, the Company closed a bought deal financing, resulting in the issuance of 15,820,000 common shares at a price of $1.10 per common share for gross proceeds of $17,402,000 ($16,182,997, net of transaction costs).
Warrants
As a result of the March 20, 2018 bought deal financing, 17,250,000 warrants were issued.
As a result of the July 30, 2018 CIBC loan, 321,714 warrants were issued on July 31, 2018 (note 10).
As a result of the September 20, 2017 bought deal financing, 5,000,000 warrants were issued.
A summary of warrants outstanding is shown below:
| | | Number of
warrants | | | Weighted
average
exercise price
$ | | | Weighted
average
remaining
contractual life
(years) | |
| | | | | | | | | | |
| Balance – January 1, 2017 | | | - | | | | - | | | | - | |
| Granted | | | 5,000,000 | | | | 1.40 | | | | 2.72 | |
| Balance – December 31, 2017 | | | 5,000,000 | | | | 1.40 | | | | 2.72 | |
| Granted | | | 17,571,714 | | | | 1.39 | | | | 4.23 | |
| Balance – December 31, 2018 | | | 22,571,714 | | | | 1.39 | | | | 3.67 | |
Profound Medical Corp.
Notes to Consolidated Financial Statements
December 31, 2018 and 2017 and 2016
The Company estimated the fair value of the warrants issued using the Black-Scholes option pricing model with the following assumptions:
| | | March 20,
2018 | | | September 20, 2017 | |
| | | | | | | |
| Share price on date of issuance | | $ | 1.06 | | | $ | 0.95 | |
| Volatility | | | 71 | % | | | 77 | % |
| Expected life of warrants | | | 5 years | | | | 3 years | |
| Risk-free interest rate | | | 2.00 | % | | | 1.56 | % |
| Dividend yield | | | - | | | | - | |
Due to the absence of company specific volatility rates for the expected life of the warrants, the Company chose comparable companies in the medical device industry. The fair value of the warrants issued as part of the March 20, 2018 bought deal financing was $9,767,750, or $0.57 per warrant, and was recorded in contributed surplus.
The estimated fair value of the warrants issued as part of the September 20, 2017 bought deal financing was $1,936,247 or $0.39 per warrant and was recorded in contributed surplus.
Share options
Effective January 26, 2017, the Company adopted amendments to the share option plan (the Share Option Plan). The maximum number of common shares reserved for issuance under this plan is 14,047,142 common shares or such other number as may be approved by the holders of the voting shares of the Company. As at December 31, 2018, 6,244,779 (2017 – 5,318,279, 2016 – 4,689,839) options are outstanding. Each option granted allows the holder to purchase one common share, at an exercise price not less than the lesser of the closing trading price of the common shares on the TSX, on the date a share option is granted and the volume-weighted average price of the common shares for the five trading shares immediately preceding the date the share option is granted. Share options granted under the Share Option Plan generally have a maximum term of ten years and vest over a period of up to four years.
Profound Medical Corp.
Notes to Consolidated Financial Statements
December 31, 2018 and 2017 and 2016
A summary of the share option changes during the years presented and the total number of share options outstanding as at those dates are set forth below:
| | | Number of options | | | Weighted average exercise price $ | |
| | | | | | | |
| Balance – January 1, 2016 | | | 3,407,283 | | | | 1.05 | |
| Granted | | | 1,650,696 | | | | 1.33 | |
| Exercised | | | (12,250 | ) | | | 0.30 | |
| Forfeited/expired | | | (355,890 | ) | | | 1.44 | |
| Balance – December 31, 2016 | | | 4,689,839 | | | | 1.13 | |
| Granted | | | 2,141,583 | | | | 1.02 | |
| Exercised | | | (411,800 | ) | | | 0.24 | |
| Forfeited/expired | | | (1,101,343 | ) | | | 1.42 | |
| Balance – December 31, 2017 | | | 5,318,279 | | | | 1.09 | |
| Granted | | | 1,999,500 | | | | 1.05 | |
| Exercised | | | (436,562 | ) | | | 0.24 | |
| Forfeited/expired | | | (636,438 | ) | | | 1.12 | |
| Balance – December 31, 2018 | | | 6,244,779 | | | | 1.13 | |
The following table summarizes information about the share options outstanding as at December 31, 2018:
Exercise price $ | | | Number of options outstanding | | | Weighted average remaining contractual life (years) | | | Number of options exercisable | |
| | | | | | | | | | | |
| | 0.24 | | | | 213,000 | | | | 3.69 | | | | 213,000 | |
| | 0.30 | | | | 18,000 | | | | 0.41 | | | | 18,000 | |
| | 0.60 | | | | 33,000 | | | | 9.89 | | | | - | |
| | 0.85 | | | | 340,000 | | | | 8.88 | | | | 92,076 | |
| | 0.93 | | | | 900,000 | | | | 9.65 | | | | - | |
| | 0.97 | | | | 66,000 | | | | 8.32 | | | | 44,000 | |
| | 0.99 | | | | 28,000 | | | | 9.25 | | | | - | |
| | 1.02 | | | | 115,500 | | | | 9.47 | | | | - | |
| | 1.10 | | | | 1,971,724 | | | | 7.97 | | | | 997,411 | |
| | 1.19 | | | | 918,000 | | | | 9.40 | | | | - | |
| | 1.35 | | | | 132,500 | | | | 7.65 | | | | 101,712 | |
| | 1.46 | | | | 934,055 | | | | 7.65 | | | | 544,865 | |
| | 1.50 | | | | 575,000 | | | | 6.67 | | | | 470,240 | |
| | | | | | 6,244,779 | | | | 8.17 | | | | 2,481,304 | |
The Company estimated the fair value of the share options granted during the year using the Black-Scholes option pricing model with the weighted average assumptions below. Due to the absence of company specific volatility rates for the expected life of the share options, the Company chose comparable companies in the medical device industry.
Profound Medical Corp.
Notes to Consolidated Financial Statements
December 31, 2018 and 2017 and 2016
| | | May 4, 2016 | | | July 19, 2016 | | | August 22, 2016 | | | September 15,
2016 | | | November 24,
2016 | |
| | | | | | | | | | | | | | | | |
| Volatility | | | 73 | % | | | 73 | % | | | 101 | % | | | 99 | % | | | 99 | % |
| Expected life of share options | | | 6 years | | | | 6 years | | | | 6 years | | | | 6 years | | | | 6 years | |
| Risk-free interest rate | | | 1.18 | % | | | 0.89 | % | | | 0.86 | % | | | 0.82 | % | | | 0.94 | % |
| Dividend yield | | | - | | | | - | | | | - | | | | - | | | | - | |
| Number of share options issued | | | 30,000 | | | | 50,000 | | | | 934,055 | | | | 82,500 | | | | 554,141 | |
| | | January 26,
2017 | | | April 25,
2017 | | | November 16,
2017 | |
| | | | | | | | | | |
| Volatility | | | 99 | % | | | 97 | % | | | 135 | % |
| Expected life of share options | | | 6 years | | | | 6 years | | | | 6 years | |
| Risk-free interest rate | | | 1.35 | % | | | 1.37 | % | | | 1.90 | % |
| Dividend yield | | | - | | | | - | | | | - | |
| Number of share options issued | | | 1,417,538 | | | | 66,000 | | | | 658,000 | |
| | | March 28, 2018 | | | May 22, 2018 | | | June 15, 2018 | | | August 23,
2018 | | | November 19,
2018 | |
| | | | | | | | | | | | | | | | |
| Volatility | | | 96 | % | | | 82 | % | | | 83 | % | | | 70 | % | | | 80 | % |
| Expected life of share options | | | 6 years | | | | 6 years | | | | 6 years | | | | 6 years | | | | 6 years | |
| Risk-free interest rate | | | 2.14 | % | | | 2.30 | % | | | 2.19 | % | | | 2.25 | % | | | 2.47 | % |
| Dividend yield | | | - | | | | - | | | | - | | | | - | | | | - | |
| Number of share options issued | | | 33,000 | | | | 918,000 | | | | 115,500 | | | | 900,000 | | | | 33,000 | |
Compensation expense related to share options recorded in the consolidated statements of loss and comprehensive loss for the year was $1,086,199 (2017 – $1,338,330, 2016 – $1,001,558).
| | | 2018
$ | | | 2017
$ | | | 2016
$ | |
| | | | | | | | | | |
| Production and manufacturing costs | | | 1,303,246 | | | | 2,561,600 | | | | - | |
| Salaries and benefits | | | 9,692,860 | | | | 7,131,741 | | | | 5,642,202 | |
| Consulting fees | | | 5,041,562 | | | | 6,506,457 | | | | 3,783,832 | |
| Research and development expenses | | | 1,005,843 | | | | 950,473 | | | | 3,125,364 | |
| Sales and marketing expenses | | | 1,236,712 | | | | 1,644,971 | | | | 129,461 | |
| Amortization and depreciation | | | 1,674,438 | | | | 871,838 | | | | 187,008 | |
| Share-based compensation | | | 1,086,199 | | | | 1,338,330 | | | | 1,001,558 | |
| Rent | | | 738,198 | | | | 591,243 | | | | 555,759 | |
| Other expenses | | | 1,012,901 | | | | 934,764 | | | | 1,215,230 | |
| | | | 22,791,959 | | | | 22,531,417 | | | | 15,640,414 | |
Profound Medical Corp.
Notes to Consolidated Financial Statements
December 31, 2018 and 2017 and 2016
| | | 2018
$ | | | 2017
$ | | | 2016
$ | |
| | | | | | | | | | |
| HTX and FedDev loans (note 10) | | | 108,853 | | | | 166,002 | | | | 164,122 | |
| Knight Loan (note 10) | | | 465,903 | | | | 1,218,261 | | | | 913,080 | |
| CIBC loan (note 10) | | | 517,409 | | | | - | | | | - | |
| Royalty interest recovery (notes 10 and 11) | | | (63,322 | ) | | | (36,438 | ) | | | (249,413 | ) |
| Change in fair value of contingent consideration (note 11) | | | (325,253 | ) | | | 82,578 | | | | - | |
| Change in fair value of derivative financial instrument (note 10) | | | (96,619 | ) | | | - | | | | - | |
| Provisions (note 9) | | | 5,115 | | | | 4,585 | | | | 2,110 | |
| Foreign exchange loss (gain) | | | 214,226 | | | | (185,904 | ) | | | - | |
| | | | 826,312 | | | | 1,249,084 | | | | 829,899 | |
Income tax expense differs from the tax recovery amount that would be obtained by applying the statutory income tax rate to the respective year’s loss before income taxes as follows:
| | | 2018
$ | | | 2017
$ | | | 2016
$ | |
| | | | | | | | | | |
| Loss before income taxes | | | 20,532,205 | | | | 18,748,219 | | | | 16,312,715 | |
| | | | | | | | | | | | | |
| Recovery based on combined federal and provincial statutory rate of 26.5% (2017 – 26.5%, 2016 – 26.5%) | | | (5,441,034 | ) | | | (4,968,278 | ) | | | (4,322,869 | ) |
| Permanent differences | | | (770,593 | ) | | | (301,808 | ) | | | (802,664 | ) |
| Change in deferred tax assets not recognized | | | 6,460,542 | | | | 5,334,312 | | | | 5,132,948 | |
| Effect of tax rates in foreign jurisdictions | | | (18,131 | ) | | | 9,897 | | | | 6,639 | |
| Net income tax expense | | | 230,784 | | | | 74,123 | | | | 14,054 | |
Deferred tax assets are recognized for tax loss carry-forwards and unused tax credits to the extent that the realization of the related tax benefit through future taxable profits is probable. The Company has not recognized deferred tax assets that can be carried forward against future taxable income.
Permanent differences are primarily comprised of non-refundable tax credits and deductible finance fees not recorded in the consolidated statements of loss and comprehensive loss, offset by non-deductible share-based compensation and accretion expense.
The Company has non-capital loss carry-forwards of approximately $55,564,000 as at December 31, 2018 that expire in varying amounts from 2028 to 2038.
The Company has SR&ED expenditures of approximately $15,806,000 as at December 31, 2018, which can be carried forward indefinitely to reduce future years’ taxable income.
Profound Medical Corp.
Notes to Consolidated Financial Statements
December 31, 2018 and 2017 and 2016
The Company has approximately $2,890,000 of federal and provincial tax credits that are available to be applied against federal and provincial taxes otherwise payable in future years and that expire in varying amounts from 2028 to 2038.
The following table shows the calculation of basic and diluted loss per share:
| | | 2018
$ | | | 2017
$ | | | 2016
$ | |
| | | | | | | | | | |
| Net loss for the year | | | 20,762,989 | | | | 18,822,342 | | | | 16,326,769 | |
| Weighted average number of common shares | | | 100,395,649 | | | | 61,404,141 | | | | 41,510,145 | |
| Basic and diluted loss per share | | | 0.21 | | | | 0.31 | | | | 0.39 | |
For the years noted above, the computation of diluted loss per share is equal to the basic loss per share due to the anti-dilutive effect on the share options and warrants.
Of the 6,244,779 (2017 – 5,318,279, 2016 – 4,689,839) share options and 22,571,714 (2017 – 5,000,000, 2016 – nil) warrants not included in the calculation of diluted loss per share for the year ended December 31, 2018, 25,053,018 (2017 – 7,052,894, 2016 – 2,315,602) were exercisable.
| 18 | Financial assets and liabilities |
Classification of financial instruments
On January 1, 2018 (the date of initial application of IFRS 9), the Company assessed which business models to apply to the financial assets held by the Company and has classified its financial instruments into the appropriate IFRS 9 categories. A summary of the classifications under IFRS 9 as at December 31, 2018 and under IAS 39 as at December 31, 2017 is shown below.
| | | 2018 – IFRS 9 | |
| | | Fair value
through
profit or
loss
$ | | | Financial
assets at
amortized
cost
$ | | | Financial
liabilities at
amortized
cost
$ | |
| | | | | | | | | | |
| Cash | | | - | | | | 30,687,183 | | | | - | |
| Trade and other receivables | | | - | | | | 2,686,112 | | | | - | |
| Accounts payable and accrued liabilities | | | - | | | | - | | | | 3,912,350 | |
| Long-term debt | | | - | | | | - | | | | 11,955,245 | |
| Other liabilities | | | 1,255,741 | | | | - | | | | 19,653 | |
| Derivative financial instrument | | | 98,203 | | | | - | | | | - | |
| | | | 1,353,944 | | | | 33,373,295 | | | | 15,887,248 | |
Profound Medical Corp.
Notes to Consolidated Financial Statements
December 31, 2018 and 2017 and 2016
| | | 2017 – IAS 39 | |
| | | Fair value
through
profit or loss
$ | | | Loans and
receivables
$ | | | Other
financial
liabilities
$ | |
| | | | | | | | | | |
| Cash | | | - | | | | 11,103,223 | | | | - | |
| Trade and other receivables | | | - | | | | 4,251,658 | | | | - | |
| Accounts payable and accrued liabilities | | | - | | | | - | | | | 5,081,704 | |
| Long-term debt | | | - | | | | - | | | | 5,145,089 | |
| Other liabilities | | | 1,734,050 | | | | - | | | | 96,894 | |
| | | | 1,734,050 | | | | 15,354,881 | | | | 10,323,687 | |
Credit risk
Credit risk is the risk of a financial loss to the Company if a counterparty to a financial instrument fails to meet its contractual obligation. The Company is exposed to credit risk on its cash and trade and other receivable balances. The Company’s cash management policies include ensuring cash is deposited in Canadian chartered banks.
The Company applies the IFRS 9 simplified approach to measuring expected credit losses, which uses a lifetime expected loss allowance for all trade and other receivables. To measure the expected credit losses, trade and other receivables are grouped based on shared credit risk characteristics and the days past due. On that basis, the loss allowance as at January 1, 2018 and December 31, 2018 is nominal as the Company only transacts with hospitals and private clinics and has not incurred any credit losses since revenue began.
Trade and other receivables are written off when there is no reasonable expectation of recovery. Indicators that there is no reasonable expectation of recovery include, amongst others, failure to make contractual payments for a period of greater than 120 days past due.
Market risk
Market risk is the risk the fair value or future cash flows of a financial instrument will fluctuate because of changes in market prices, including interest rate risk and foreign currency risk.
| · | Interest rate price risk |
Interest rate price risk is the risk the cash flows of a financial instrument will fluctuate due to changes in market interest rates. The Company is exposed to such fluctuations relating to the long-term debt, as it bears interest at a floating rate, whose interest rates are based on the prime rate.
If interest rates had been 1% higher on the average long-term debt balance, with all other variables held constant, loss before income taxes would have been $52,083 higher for the year ended December 31, 2018.
Profound Medical Corp.
Notes to Consolidated Financial Statements
December 31, 2018 and 2017 and 2016
Foreign currency risk occurs as a result of foreign exchange rate fluctuations between the time a transaction is recorded and the time it is settled.
The Company purchases goods and services denominated in foreign currencies and, accordingly, is subject to foreign currency risk. The Company’s financial instruments denominated in foreign currencies are shown below in Canadian dollars.
| | | 2018 | |
| | | US
dollars
$ | | | Euro
$ | | | Canadian
dollars
$ | | | Total
$ | |
| | | | | | | | | | | | | |
| Cash | | | 136,879 | | | | 1,039,205 | | | | 29,511,099 | | | | 30,687,183 | |
| Trade and other receivables | | | 613,890 | | | | 1,450,661 | | | | 621,561 | | | | 2,686,112 | |
| Accounts payable and accrued liabilities | | | (472,431 | ) | | | (2,758,294 | ) | | | (681,625 | ) | | | (3,912,350 | ) |
| Other liabilities (excluding deferred rent) | | | - | | | | (1,255,741 | ) | | | (19,653 | ) | | | (1,275,394 | ) |
| | | 2017 | |
| | | US
dollars
$ | | | Euro
$ | | | Canadian
dollars
$ | | | Total
$ | |
| | | | | | | | | | | | | |
| Cash | | | 18,479 | | | | 338,743 | | | | 10,746,001 | | | | 11,103,223 | |
| Trade and other receivables | | | 747,180 | | | | 3,396,317 | | | | 108,161 | | | | 4,251,658 | |
| Accounts payable and accrued liabilities | | | (774,814 | ) | | | (2,156,360 | ) | | | (2,150,530 | ) | | | (5,081,704 | ) |
| Other liabilities (excluding deferred rent) | | | - | | | | (1,734,050 | ) | | | (96,894 | ) | | | (1,830,944 | ) |
As at December 31, 2018, if foreign exchange rates had been 5% higher, with all other variables held constant, loss before income taxes would have been $62,292 (2017 – $8,225) higher, mainly as a result of the translation of foreign currency denominated cash, trade and other receivables, accounts payable and accrued liabilities and other liabilities.
The Company does not use derivatives to reduce exposure to foreign currency risk.
Liquidity risk
Liquidity risk is the risk the Company may encounter difficulties in meeting its financial liability obligations as they come due. The Company has a planning and budgeting process in place to help determine the funds required to support the Company’s normal operating requirements on an ongoing basis.
The Company controls liquidity risk through management of working capital, cash flows and the availability and sourcing of financing. The Company’s ability to accomplish all of its future strategic plans is dependent on obtaining additional financing or executing other strategic options; however, there is no assurance the Company will achieve these objectives.
Profound Medical Corp.
Notes to Consolidated Financial Statements
December 31, 2018 and 2017 and 2016
The following table summarizes the Company’s significant contractual, undiscounted cash flows related to its financial liabilities.
| | | 2018 | |
| | | Carrying
amount
$ | | | Future
cash
flows
$ | | | Less than
1 year
$ | | | Between
1 year and
5 years
$ | | | Greater
than 5
years
$ | |
| | | | | | | | | | | | | | | | |
| Accounts payable and accrued liabilities | | | 3,912,350 | | | | 3,912,350 | | | | 3,912,350 | | | | - | | | | - | |
| Long-term debt | | | 11,955,245 | | | | 14,497,042 | | | | 1,936,455 | | | | 12,560,587 | | | | - | |
| Other liabilities (excluding deferred rent) | | | 1,275,394 | | | | 1,365,217 | | | | 429,426 | | | | 935,791 | | | | - | |
| | | | 17,142,989 | | | | 19,774,609 | | | | 6,278,231 | | | | 13,496,378 | | | | - | |
| | | 2017 | |
| | | Carrying
amount
$ | | | Future
cash
flows
$ | | | Less than
1 year
$ | | | Between
1 year and
5 years
$ | | | Greater
than 5
years
$ | |
| | | | | | | | | | | | | | | | |
| Accounts payable and accrued liabilities | | | 5,081,704 | | | | 5,081,704 | | | | 5,081,704 | | | | - | | | | - | |
| Long-term debt | | | 5,145,089 | | | | 5,802,658 | | | | 5,268,011 | | | | 534,647 | | | | - | |
| Other liabilities (excluding deferred rent) | | | 1,830,944 | | | | 2,161,552 | | | | 419,121 | | | | 1,742,431 | | | | - | |
| | | | 12,057,737 | | | | 13,045,914 | | | | 10,768,836 | | | | 2,277,078 | | | | - | |
Fair value
The fair values of cash, trade and other receivables and accounts payable and accrued liabilities approximate their carrying values, due to their relatively short periods to maturity. The fair value of long-term debt approximates its carrying amount as it has a floating interest rate.
| 19 | Related party transactions |
Key management includes the Company’s directors and senior management team. The remuneration of directors and the senior management team was as follows during the years ended December 31:
| | | 2018
$ | | | 2017
$ | | | 2016
$ | |
| | | | | | | | | | |
| Salaries and employee benefits | | | 1,746,024 | | | | 1,021,568 | | | | 1,247,563 | |
| Termination benefits | | | 114,750 | | | | 138,125 | | | | - | |
| Directors’ fees | | | 113,132 | | | | 88,232 | | | | 63,616 | |
| Share-based compensation | | | 959,234 | | | | 1,220,655 | | | | 862,798 | |
| Total related party transactions | | | 2,933,140 | | | | 2,468,580 | | | | 2,173,977 | |
Profound Medical Corp.
Notes to Consolidated Financial Statements
December 31, 2018 and 2017 and 2016
Executive employment agreements allow for additional payments in the event of a liquidity event, or if the executive is terminated without cause.
| 20 | Commitments and contingencies |
The Company has commitments under operating leases for the rental of office space. On March 28, 2016, the Company signed a lease for office space and took possession of this office space effective July 1, 2016. Included in prepaid expenses and deposits as at December 31, 2018 is an amount of $210,000 (2017 – $330,000) related to prepaid rent for this lease that is drawn down at $10,000 per month starting October 1, 2016. The future minimum obligations, including prepaid rent, are as follows:
| | | $ | |
| | | | |
| No later than 1 year | | | 452,574 | |
| Later than 1 year and no later than 5 years | | | 1,775,583 | |
| Later than 5 years | | | 1,085,135 | |
| Total commitments and contingencies | | | 3,313,292 | |
All directors and officers of the Company are indemnified by the Company for various items including, but not limited to, all costs to settle lawsuits or actions due to their association with the Company, subject to certain restrictions. The Company has purchased directors’ and officers’ liability insurance to mitigate the cost of any potential future lawsuits or actions. The term of the indemnification is not explicitly defined, but is limited to events for the period during which the indemnified party served as a director or officer of the Company. The maximum amount of any potential future payment cannot be reasonably estimated but could have a material adverse effect on the Company.
The Company has also indemnified certain lenders and underwriters in relation to certain debt and equity offerings and their respective affiliates and directors, officers, employees, shareholders, partners, advisers and agents and each other person, if any, controlling any of the underwriters or lenders or their affiliates against certain liabilities.
The Company’s capital management objectives are to safeguard its ability to continue as a going concern and to provide returns for shareholders and benefits for other stakeholders by ensuring it has sufficient cash resources to fund its research and development activities, to pursue its commercialization efforts and to maintain its ongoing operations. The Company includes its share capital, deficit and long-term debt in the definition of capital.
Profound Medical Corp.
Notes to Consolidated Financial Statements
December 31, 2018 and 2017 and 2016
A summary of the Company’s capital structure is as follows:
| | | 2018
$ | | | 2017
$ | |
| | | | | | | |
| Common shares | | | 120,932,404 | | | | 98,365,770 | |
| Deficit | | | (111,033,661 | ) | | | (90,270,672 | ) |
| Long-term debt | | | 11,955,245 | | | | 5,145,089 | |
| | | | 21,853,988 | | | | 13,240,187 | |
The Company’s operations are categorized into one industry segment, which is medical technology focused on magnetic resonance guided ablation procedures for the treatment of prostate disease, uterine fibroids and palliative pain treatment for patients with metastatic bone disease. The Company is managed geographically in Canada, Germany and Finland.
For the year ended December 31, 2018:
| | | Canada
$ | | | Germany
$ | | | Finland
$ | | | Total
$ | |
| | | | | | | | | | | | | |
| Revenue | | | 1,436,654 | | | | 1,165,624 | | | | - | | | | 2,602,278 | |
| Cost of sales | | | 844,015 | | | | 934,486 | | | | - | | | | 1,778,501 | |
| Gross profit | | | 592,639 | | | | 231,138 | | | | - | | | | 823,777 | |
| | | | | | | | | | | | | | | | | |
| Operating expenses | | | | | | | | | | | | | | | | |
| Research and development | | | 7,844,125 | | | | - | | | | 2,421,263 | | | | 10,265,388 | |
| General and administrative | | | 6,256,746 | | | | - | | | | 399,977 | | | | 6,656,723 | |
| Selling and distribution | | | 2,004,143 | | | | 1,676,389 | | | | 410,815 | | | | 4,091,347 | |
| Total operating expense | | | 16,105,014 | | | | 1,676,389 | | | | 3,232,055 | | | | 21,013,458 | |
| | | | | | | | | | | | | | | | | |
| Operating loss | | | 15,512,375 | | | | 1,445,251 | | | | 3,232,055 | | | | 20,189,681 | |
| Net finance costs | | | | | | | | | | | | | | | 342,524 | |
| Loss for the year before income taxes | | | | | | | | | | | | | | | 20,532,205 | |
Profound Medical Corp.
Notes to Consolidated Financial Statements
December 31, 2018 and 2017 and 2016
For the year ended December 31, 2017:
| | | Canada
$ | | | Germany
$ | | | Finland
$ | | | Total
$ | |
| | | | | | | | | | | | | |
| Revenue | | | 3,331,606 | | | | 1,572,944 | | | | - | | | | 4,904,550 | |
| Cost of sales | | | 1,967,677 | | | | 1,064,531 | | | | - | | | | 3,032,208 | |
| Gross profit | | | 1,363,929 | | | | 508,413 | | | | - | | | | 1,872,342 | |
| | | | | | | | | | | | | | | | | |
| Operating expenses | | | | | | | | | | | | | | | | |
| Research and development | | | 8,952,890 | | | | - | | | | 685,300 | | | | 9,638,190 | |
| General and administrative | | | 5,617,214 | | | | - | | | | 318,001 | | | | 5,935,215 | |
| Selling and distribution | | | 1,950,204 | | | | 1,819,814 | | | | 155,786 | | | | 3,925,804 | |
| Total operating expense | | | 16,520,308 | | | | 1,819,814 | | | | 1,159,087 | | | | 19,499,209 | |
| | | | | | | | | | | | | | | | | |
| Operating loss | | | 15,156,379 | | | | 1,311,401 | | | | 1,159,087 | | | | 17,626,867 | |
| Net finance costs | | | | | | | | | | | | | | | 1,121,352 | |
| Loss for the year before income taxes | | | | | | | | | | | | | | | 18,748,219 | |
Other financial information by segment as at December 31, 2018:
| | | Canada
$ | | | Germany
$ | | | Finland
$ | | | Total
$ | |
| | | | | | | | | | | | | |
| Total assets | | | 42,437,691 | | | | 1,093,184 | | | | 3,018,997 | | | | 46,549,872 | |
| Goodwill and intangible assets | | | 7,422,726 | | | | - | | | | - | | | | 7,422,726 | |
| Property and equipment | | | 797,296 | | | | 266 | | | | 409,795 | | | | 1,207,357 | |
| Amortization of intangible assets | | | 1,128,437 | | | | - | | | | - | | | | 1,128,437 | |
| Depreciation of property and equipment | | | 296,093 | | | | 3,100 | | | | 246,808 | | | | 546,001 | |
Other financial information by segment as at December 31, 2017:
| | | Canada
$ | | | Germany
$ | | | Finland
$ | | | Total
$ | |
| | | | | | | | | | | | | |
| Total assets | | | 25,546,183 | | | | 1,227,216 | | | | 1,105,980 | | | | 27,879,379 | |
| Goodwill and intangible assets | | | 8,551,163 | | | | - | | | | - | | | | 8,551,163 | |
| Property and equipment | | | 1,093,389 | | | | 3,366 | | | | 629,395 | | | | 1,726,150 | |
| Amortization of intangible assets | | | 500,518 | | | | - | | | | - | | | | 500,518 | |
| Depreciation of property and equipment | | | 268,403 | | | | 2,290 | | | | 100,627 | | | | 371,320 | |
| Intangible assets and goodwill additions or acquisition | | | 8,815,680 | | | | - | | | | - | | | | 8,815,680 | |
| Property and equipment additions or acquisition | | | 409,435 | | | | 4,984 | | | | 730,022 | | | | 1,144,441 | |
PROFOUND MEDICAL CORP.
INTERIM CONDENSED CONSOLIDATED
FINANCIAL STATEMENTS
June 30, 2019
PRESENTED IN CANADIAN DOLLARS
Profound Medical Corp.
Interim Condensed Consolidated Balance Sheet
(Unaudited)
| | | June 30,
2019
$ | | | December 31,
2018
$ | |
| | | | | | | |
| Assets | | | | | | | | |
| | | | | | | | | |
| Current assets | | | | | | | | |
| Cash | | | 20,493,470 | | | | 30,687,183 | |
| Trade and other receivables (note 3) | | | 2,934,283 | | | | 2,686,112 | |
| Investment tax credits receivable | | | 480,000 | | | | 480,000 | |
| Inventory (note 4) | | | 3,611,346 | | | | 3,631,623 | |
| Prepaid expenses and deposits | | | 161,685 | | | | 434,871 | |
| Total current assets | | | 27,680,784 | | | | 37,919,789 | |
| | | | | | | | | |
| Property and equipment (note 5) | | | 914,848 | | | | 1,207,357 | |
| Intangible assets (note 6) | | | 3,449,342 | | | | 4,013,561 | |
| Right-of-use assets (notes 2 and 7) | | | 2,408,572 | | | | - | |
| Goodwill | | | 3,409,165 | | | | 3,409,165 | |
| | | | | | | | | |
| Total assets | | | 37,862,711 | | | | 46,549,872 | |
| | | | | | | | | |
| Liabilities | | | | | | | | |
| | | | | | | | | |
| Current liabilities | | | | | | | | |
| Accounts payable and accrued liabilities | | | 2,339,451 | | | | 3,912,350 | |
| Deferred revenue | | | 420,741 | | | | 312,558 | |
| Long-term debt (note 9) | | | 3,475,358 | | | | 1,339,583 | |
| Provisions (note 8) | | | 87,741 | | | | 1,352,017 | |
| Other liabilities (notes 9 and 10) | | | 614,285 | | | | 567,296 | |
| Derivative financial instrument (note 9) | | | 152,423 | | | | 98,203 | |
| Lease liabilities (notes 2 and 11) | | | 211,599 | | | | - | |
| Income taxes payable | | | 164,079 | | | | 297,353 | |
| Total current liabilities | | | 7,465,677 | | | | 7,879,360 | |
| | | | | | | | | |
| Long-term debt (note 9) | | | 8,562,737 | | | | 10,615,662 | |
| Deferred revenue | | | 658,026 | | | | 379,044 | |
| Provisions (note 8) | | | 45,162 | | | | 49,319 | |
| Other liabilities (notes 9 and 10) | | | 432,545 | | | | 1,000,153 | |
| Lease liabilities (notes 2 and 11) | | | 2,279,037 | | | | - | |
| | | | | | | | | |
| Total liabilities | | | 19,443,184 | | | | 19,923,538 | |
| | | | | | | | | |
| Shareholders’ Equity | | | | | | | | |
| | | | | | | | | |
| Share capital (note 12) | | | 120,942,484 | | | | 120,932,404 | |
| Contributed surplus | | | 17,208,040 | | | | 16,756,294 | |
| Accumulated other comprehensive loss | | | (86,935 | ) | | | (28,703 | ) |
| Deficit | | | (119,644,062 | ) | | | (111,033,661 | ) |
| | | | | | | | | |
| Total Shareholders’ Equity | | | 18,419,527 | | | | 26,626,334 | |
| | | | | | | | | |
| Total Liabilities and Shareholders’ Equity | | | 37,862,711 | | | | 46,549,872 | |
The accompanying notes are an integral part of these interim condensed consolidated financial statements.
Profound Medical Corp.
Interim Condensed Consolidated Statement of Loss and Comprehensive Loss
(Unaudited)
| | | Three
months
ended
June 30,
2019
$ | | | Three
months
ended
June 30,
2018
$ | | | Six months
ended
June 30,
2019
$ | | | Six months
ended
June 30,
2018
$ | |
| | | | | | | | | | | | | |
| Revenue | | | | | | | | | | | | | | | | |
| Products | | | 465,840 | | | | 170,931 | | | | 1,813,621 | | | | 543,425 | |
| Services | | | 108,269 | | | | 42,412 | | | | 236,276 | | | | 46,253 | |
| | | | 574,109 | | | | 213,343 | | | | 2,049,897 | | | | 589,678 | |
| Cost of sales (note 14) | | | 244,066 | | | | 126,259 | | | | 777,422 | | | | 357,334 | |
| Gross profit | | | 330,043 | | | | 87,084 | | | | 1,272,475 | | | | 232,344 | |
| | | | | | | | | | | | | | | | | |
| Operating Expenses (note 14) | | | | | | | | | | | | | | | | |
| Research and development – net of investment tax credits of $nil (2018 – $120,000) | | | 3,186,355 | | | | 2,347,909 | | | | 5,864,101 | | | | 4,864,690 | |
| General and administrative | | | 1,586,323 | | | | 2,236,529 | | | | 3,100,436 | | | | 3,539,733 | |
| Selling and distribution – net of revenue share obligation reversal (note 8) | | | 1,154,869 | | | | 1,113,225 | | | | 625,524 | | | | 2,060,127 | |
| Total operating expenses | | | 5,927,547 | | | | 5,697,663 | | | | 9,590,061 | | | | 10,464,550 | |
| | | | | | | | | | | | | | | | | |
| Operating Loss | | | 5,597,504 | | | | 5,610,579 | | | | 8,317,586 | | | | 10,232,206 | |
| | | | | | | | | | | | | | | | | |
| Other income and expense | | | | | | | | | | | | | | | | |
| Finance costs (note 15) | | | 337,220 | | | | 313,606 | | | | 651,905 | | | | 633,569 | |
| Finance income | | | (110,790 | ) | | | (117,357 | ) | | | (252,671 | ) | | | (157,161 | ) |
| | | | 226,430 | | | | 196,249 | | | | 399,234 | | | | 476,408 | |
| Loss before income taxes | | | 5,823,934 | | | | 5,806,828 | | | | 8,716,820 | | | | 10,708,614 | |
| | | | | | | | | | | | | | | | | |
| Income taxes | | | 20,200 | | | | 24,200 | | | | 54,000 | | | | 60,600 | |
| | | | | | | | | | | | | | | | | |
| Net loss for the period | | | 5,844,134 | | | | 5,831,028 | | | | 8,770,820 | | | | 10,769,214 | |
| | | | | | | | | | | | | | | | | |
| Other comprehensive loss | | | | | | | | | | | | | | | | |
| Item that may be reclassified to profit or loss | | | | | | | | | | | | | | | | |
| Foreign currency translation adjustment - net of tax | | | (11,843 | ) | | | 57,943 | | | | (58,232 | ) | | | 14,695 | |
| Net loss and comprehensive loss for the period | | | 5,832,291 | | | | 5,888,971 | | | | 8,712,588 | | | | 10,783,909 | |
| | | | | | | | | | | | | | | | | |
| Loss per share (note 16) | | | | | | | | | | | | | | | | |
| Basic and diluted net loss per share | | | 0.05 | | | | 0.05 | | | | 0.08 | | | | 0.12 | |
The accompanying notes are an integral part of these interim condensed consolidated financial statements.
Profound Medical Corp.
Interim Condensed Consolidated Statement of Changes in Shareholders’ Equity
(Unaudited)
| | | Number
of shares | | | Share
capital
$ | | | Contributed
surplus
$ | | | Accumulated
other
comprehensive
income (loss)
$ | | | Deficit
$ | | | Total
$ | |
| | | | | | | | | | | | | | | | | | | |
| Balance – January 1, 2018 | | | 73,117,377 | | | | 98,365,770 | | | | 6,103,970 | | | | (57,929 | ) | | | (90,270,672 | ) | | | 14,141,139 | |
| | | | | | | | | | | | | | | | | | | | | | | | | |
| Net loss for the period | | | - | | | | - | | | | - | | | | - | | | | (10,769,214 | ) | | | (10,769,214 | ) |
| Cumulative translation adjustment – net of tax | | | - | | | | - | | | | - | | | | 14,695 | | | | - | | | | 14,695 | |
| Exercise of share options | | | 426,562 | | | | 295,781 | | | | (193,406 | ) | | | - | | | | - | | | | 102,375 | |
| Share-based compensation (note 13) | | | - | | | | - | | | | 476,931 | | | | - | | | | - | | | | 476,931 | |
| Issuance of units on bought deal financing (note 12) | | | 34,500,000 | | | | 22,276,555 | | | | 9,767,750 | | | | - | | | | - | | | | 32,044,305 | |
| Balance – June 30, 2018 | | | 108,043,939 | | | | 120,938,106 | | | | 16,155,245 | | | | (43,234 | ) | | | (101,039,886 | ) | | | 36,010,231 | |
| | | | | | | | | | | | | | | | | | | | | | | | | |
| Balance – January 1, 2019 | | | 108,054,939 | | | | 120,932,404 | | | | 16,756,294 | | | | (28,703 | ) | | | (111,033,661 | ) | | | 26,626,334 | |
| Change in accounting policy for IFRS 16 (note 2) | | | - | | | | - | | | | - | | | | - | | | | 160,419 | | | | 160,419 | |
| Restated balance – January 1, 2019 | | | 108,054,939 | | | | 120,932,404 | | | | 16,756,294 | | | | (28,703 | ) | | | (110,873,242 | ) | | | 26,786,753 | |
| | | | | | | | | | | | | | | | | | | | | | | | | |
| Net loss for the period | | | - | | | | - | | | | - | | | | - | | | | (8,770,820 | ) | | | (8,770,820 | ) |
| Cumulative translation adjustment – net of tax | | | - | | | | - | | | | - | | | | (58,232 | ) | | | - | | | | (58,232 | ) |
| Exercise of share options | | | 18,000 | | | | 10,080 | | | | (4,681 | ) | | | - | | | | - | | | | 5,399 | |
| Share-based compensation (note 13) | | | - | | | | - | | | | 456,427 | | | | - | | | | - | | | | 456,427 | |
| Balance – June 30, 2019 | | | 108,072,939 | | | | 120,942,484 | | | | 17,208,040 | | | | (86,935 | ) | | | (119,644,062 | ) | | | 18,419,527 | |
The accompanying notes are an integral part of these interim condensed consolidated financial statements.
Profound Medical Corp.
Interim Condensed Consolidated Statement of Cash Flows
(Unaudited)
| | | Six months
ended
June 30,
2019
$ | | | Six months
ended
June 30,
2018
$ | |
| | | | | | | |
| Operating activities | | | | | | | | |
| Net loss for the period | | | (8,770,820 | ) | | | (10,769,214 | ) |
| Adjustments to reconcile net loss to net cash flows from operating activities: | | | | | | | | |
| Depreciation of property and equipment (note 5) | | | 257,299 | | | | 284,167 | |
| Amortization of intangible assets (note 6) | | | 564,219 | | | | 564,219 | |
| Depreciation of right-of-use assets (note 7) | | | 204,126 | | | | - | |
| Share-based compensation (note 13) | | | 456,427 | | | | 476,931 | |
| Interest and accretion expense (note 15) | | | 681,258 | | | | 522,215 | |
| Change in deferred rent | | | - | | | | 20,670 | |
| Deferred revenue | | | 387,165 | | | | 28,520 | |
| Change in fair value of derivative financial instrument (note 9) | | | 54,220 | | | | - | |
| Change in fair value of contingent consideration (note 10) | | | (208,911 | ) | | | (24,546 | ) |
| Changes in non-cash working capital balances | | | | | | | | |
| Investment tax credits receivable | | | - | | | | (120,000 | ) |
| Trade and other receivables | | | (248,171 | ) | | | 3,227,089 | |
| Prepaid expenses and deposits | | | 63,186 | | | | (93,660 | ) |
| Inventory | | | 20,277 | | | | (1,144,721 | ) |
| Accounts payable and accrued liabilities | | | (1,612,144 | ) | | | (2,320,795 | ) |
| Provisions | | | (1,219,114 | ) | | | 151,263 | |
| Income taxes payable | | | (133,274 | ) | | | 62,089 | |
| Net cash flow used in operating activities | | | (9,504,257 | ) | | | (9,135,773 | ) |
| | | | | | | | | |
| Financing activities | | | | | | | | |
| Issuance of common shares | | | - | | | | 34,500,000 | |
| Transaction costs paid | | | - | | | | (2,455,695 | ) |
| Payment of other liabilities | | | (16,203 | ) | | | (164,389 | ) |
| Payment of long-term debt and interest | | | (534,709 | ) | | | (1,953,822 | ) |
| Proceeds from share options exercised | | | 5,399 | | | | 102,375 | |
| Payment of lease liabilities | | | (143,943 | ) | | | - | |
| Total cash (used in) from financing activities | | | (689,456 | ) | | | 30,028,469 | |
| | | | | | | | | |
| Net change in cash during the period | | | (10,193,713 | ) | | | 20,892,696 | |
| Cash – Beginning of period | | | 30,687,183 | | | | 11,103,223 | |
| Cash – End of period | | | 20,493,470 | | | | 31,995,919 | |
The accompanying notes are an integral part of these interim condensed consolidated financial statements.
Profound Medical Corp.
Notes to Interim Condensed Consolidated Financial Statements
(Unaudited)
June 30, 2019
Profound Medical Corp. (Profound) and its subsidiaries (together, the Company) were incorporated under the Ontario Business Corporations Act on July 16, 2014. The Company is a medical technology company developing treatments to ablate the prostate gland, uterine fibroids and nerves for palliative pain relief for patients with metastatic bone disease.
The Company’s registered address is 2400 Skymark Avenue, Unit 6, Mississauga, Ontario, L4W 5K5.
| 2 | Summary of significant accounting policies and basis of preparation |
Basis of preparation
These interim condensed consolidated financial statements have been prepared in accordance with International Financial Reporting Standards as issued by the International Accounting Standards Board (IFRS), applicable to the preparation of interim condensed consolidated financial statements, including International Accounting Standard (IAS) 34, Interim Financial Reporting. These interim condensed consolidated financial statements are presented in Canadian dollars and should be read in conjunction with the Company’s annual financial statements for the year ended December 31, 2018, which were prepared in accordance with IFRS.
These interim condensed consolidated financial statements were authorized for issue by the Board of Directors on August 14, 2019.
The interim condensed consolidated financial statements were prepared on a going concern basis under the historical cost convention.
The accounting policies adopted are consistent with those of the previous financial year except as noted below.
A new standard became applicable for the current reporting period and the Company had to change its accounting policies as a result. The impact of the adoption of this standard and the new accounting policy is disclosed below.
| · | IFRS 16, Leases (IFRS 16) |
IFRS 16 sets out the principles for the recognition, measurement and disclosure of leases. IFRS 16 provides revised guidance on identifying a lease and for separating lease and non-lease components of a contract. IFRS 16 introduces a single accounting model for all lessees, thereby removing the distinction between operating and finance leases. IFRS 16 requires a lessee to recognize an asset (right-to-use the leased item) and a financial liability to pay rentals on the interim condensed consolidated balance sheets with terms of more than 12 months, unless the underlying asset is of low value. The standard permits either a full retrospective or a modified retrospective approach for the adoption. IFRS 16 was effective for annual periods beginning on or after January 1, 2019.
Profound Medical Corp.
Notes to Interim Condensed Consolidated Financial Statements
(Unaudited)
June 30, 2019
The Company has adopted IFRS 16 retrospectively from January 1, 2019, but has not restated comparative information, as permitted under the specific transitional provisions in the standard in accordance with the modified retrospective approach for adoption. The reclassifications and the adjustments arising from the new leasing standard are therefore recognized in the opening interim condensed consolidated balance sheet on January 1, 2019.
Adjustments recognized on adoption of IFRS 16
On adoption of IFRS 16, the Company recognized lease liabilities in relation to leases, which had previously been classified as operating leases under the principles of IAS 17, Leases (IAS 17). These liabilities were measured at the present value of the remaining lease payments, discounted using the incremental borrowing rate as of January 1, 2019. The weighted average lessee’s incremental borrowing rate applied to the lease liabilities on January 1, 2019 was 4%.
| | | $ | |
| | | | |
| Operating lease commitments as at December 31, 2018 | | | 3,313,292 | |
| Asset retirement obligation | | | 111,100 | |
| Discounted using the Company’s average incremental borrowing rate of 4.0% | | | (836,665 | ) |
| Lease liabilities recognized as at January 1, 2019 | | | 2,587,727 | |
The change in accounting policy affected the following items in the interim condensed consolidated balance sheet on January 1, 2019:
| | | Increase
(decrease)
$ | |
| | | | |
| Right-of-use assets | | | 2,616,773 | |
| Lease liabilities | | | 2,587,727 | |
| Prepaid expenses and deposits | | | (210,000 | ) |
| Provisions | | | (49,319 | ) |
| Other liabilities | | | (292,054 | ) |
| Deficit | | | 160,419 | |
Practical expedients applied
The Company has elected to apply the practical expedient not to recognize right-of-use assets and lease liabilities for short-term leases that have a lease term of 12 months or less and leases of low value assets. The lease payments associated with these leases are recognized as an expense on a straight-line basis over the lease term.
The Company has also elected not to reassess whether a contract is, or contains a lease at the date of initial application. Instead, for contracts entered into before the transition date, the Company has relied on its assessment made applying IAS 17 and IFRIC 4, Determining whether an Arrangement contains a Lease.
Profound Medical Corp.
Notes to Interim Condensed Consolidated Financial Statements
(Unaudited)
June 30, 2019
Accounting policy
At inception of a contract, the Company assesses whether a contract is, or contains, a lease based on whether the contract conveys the right to control the use of an identified asset for a period of time in exchange for consideration.
The Company recognizes a right-of-use asset and a lease liability at the lease commencement date. The right-of-use asset is initially measured based on the initial amount of the lease liability adjusted for any lease payments made at or before the commencement date, plus any initial direct costs incurred and an estimate of costs to dismantle and remove the underlying asset or to restore the underlying asset or the site on which it is located, less any lease incentives received. The assets are depreciated to the earlier of the end of the useful life of the right-of-use asset or the lease term using the straight-line method as this most closely reflects the expected pattern of consumption of the future economic benefits. The lease term includes periods covered by an option to extend if the Company is reasonably certain to exercise that option. Lease terms range from four to ten years for offices. In addition, the right-of-use asset is periodically reduced by impairment losses, if any, and adjusted for certain remeasurements of the lease liability.
The lease liability is initially measured at the present value of the lease payments that are not paid at the commencement date, discounted using the interest rate implicit in the lease or, if that rate cannot be readily determined, the Company’s incremental borrowing rate.
The lease liability is measured at amortized cost using the effective interest method. It is remeasured when there is a change in future lease payments arising from a change in an index or rate, if there is a change in the Company’s estimate of the amount expected to be payable under a residual value guarantee, or if the Company changes its assessment of whether it will exercise a purchase, extension or termination option.
When the lease liability is remeasured in this way, a corresponding adjustment is made to the carrying amount of the right-of-use asset, or is recorded in profit or loss if the carrying amount of the right-of-use asset has been reduced to zero.
Profound Medical Corp.
Notes to Interim Condensed Consolidated Financial Statements
(Unaudited)
June 30, 2019
| 3 | Trade and other receivables |
The trade and other receivables balance comprises the following:
| | | June 30,
2019
$ | | | December 31,
2018
$ | |
| | | | | | | |
| Trade receivables | | | 2,350,477 | | | | 1,791,688 | |
| Interest receivable | | | 33,877 | | | | 55,730 | |
| Indirect tax receivables | | | 510,851 | | | | 565,832 | |
| Other receivables | | | 39,078 | | | | 272,862 | |
| | | | | | | | | |
| Total trade and other receivables | | | 2,934,283 | | | | 2,686,112 | |
Amounts past due represent trade receivables past due based on the customer’s contractual terms. The Company applies the simplified approach to providing for expected credit losses prescribed by IFRS 9, which permits the use of the lifetime expected loss provision for all trade receivables. At June 30, 2019 and December 31, 2018, there were no trade receivables that are past due.
| | | June 30,
2019
$ | | | December 31,
2018
$ | |
| | | | | | | |
| Finished goods | | | 2,017,634 | | | | 2,305,746 | |
| Raw materials | | | 1,633,565 | | | | 1,383,572 | |
| Inventory provision | | | (39,853 | ) | | | (57,695 | ) |
| Total inventory | | | 3,611,346 | | | | 3,631,623 | |
During the three and six months ended June 30, 2019, $254,319 and $726,402 (three and six months ended June 30, 2018, $61,198 and $330,696, respectively) of inventory was recognized in cost of sales. The Company decreased its inventory provision by $3,606 and $17,842 during the three and six months ended June 30, 2019 (three and six months ended June 30, 2018 – decrease of $2,198 and $40,549). There were no other inventory writedowns charged to cost of sales during the period ended June 30, 2019.
Profound Medical Corp.
Notes to Interim Condensed Consolidated Financial Statements
(Unaudited)
June 30, 2019
Property and equipment consist of the following:
| | | Furniture and fittings $ | | | Research and manufact-
uring equipment $ | | | Leasehold improve-
ments $ | | | Computer equipment $ | | | Computer software $ | | | Total $ | |
| | | | | | | | | | | | | | | | | | | |
| At January 1, 2019 | | | | | | | | | | | | | | | | | | | | | | | | |
| Cost | | | 235,169 | | | | 1,386,692 | | | | 718,742 | | | | 212,541 | | | | 176,462 | | | | 2,729,606 | |
| Accumulated depreciation | | | (138,604 | ) | | | (815,450 | ) | | | (182,235 | ) | | | (209,498 | ) | | | (176,462 | ) | | | (1,522,249 | ) |
| Net book value | | | 96,565 | | | | 571,242 | | | | 536,507 | | | | 3,043 | | | | - | | | | 1,207,357 | |
| | | | | | | | | | | | | | | | | | | | | | | | | |
| Six months ended June 30, 2019 | | | | | | | | | | | | | | | | | | | | | | | | |
| Opening net book value | | | 96,565 | | | | 571,242 | | | | 536,507 | | | | 3,043 | | | | - | | | | 1,207,357 | |
| Foreign exchange | | | - | | | | (35,210 | ) | | | - | | | | - | | | | - | | | | (35,210 | ) |
| Depreciation | | | (19,159 | ) | | | (200,734 | ) | | | (34,641 | ) | | | (2,765 | ) | | | - | | | | (257,299 | ) |
| Closing net book value | | | 77,406 | | | | 335,298 | | | | 501,866 | | | | 278 | | | | - | | | | 914,848 | |
| | | | | | | | | | | | | | | | | | | | | | | | | |
| At June 30, 2019 | | | | | | | | | | | | | | | | | | | �� | | | | | |
| Cost | | | 235,169 | | | | 1,388,922 | | | | 718,742 | | | | 212,541 | | | | 176,462 | | | | 2,731,836 | |
| Accumulated depreciation | | | (157,763 | ) | | | (1,053,624 | ) | | | (216,876 | ) | | | (212,263 | ) | | | (176,462 | ) | | | (1,816,988 | ) |
| Net book value | | | 77,406 | | | | 335,298 | | | | 501,866 | | | | 278 | | | | - | | | | 914,848 | |
Intangible assets consist of the following:
| | | Exclusive
licence
agreement
$ | | | Software
$ | | | Proprietary
technology
$ | | | Brand
$ | | | Total
$ | |
| | | | | | | | | | | | | | | | |
| As at January 1, 2019 | | | | | | | | | | | | | | | | | | | | |
| Cost | | | 50,000 | | | | 257,254 | | | | 4,489,295 | | | | 883,140 | | | | 5,679,689 | |
| Accumulated amortization | | | (25,000 | ) | | | (118,938 | ) | | | (1,271,967 | ) | | | (250,223 | ) | | | (1,666,128 | ) |
| Net book value | | | 25,000 | | | | 138,316 | | | | 3,217,328 | | | | 632,917 | | | | 4,013,561 | |
| | | | | | | | | | | | | | | | | | | | | |
| Six months ended June 30, 2019 | | | | | | | | | | | | | | | | | | | | |
| Opening net book value | | | 25,000 | | | | 138,316 | | | | 3,217,328 | | | | 632,917 | | | | 4,013,561 | |
| Amortization | | | (1,250 | ) | | | (25,725 | ) | | | (448,929 | ) | | | (88,315 | ) | | | (564,219 | ) |
| Closing net book value | | | 23,750 | | | | 112,591 | | | | 2,768,399 | | | | 544,602 | | | | 3,449,342 | |
| | | | | | | | | | | | | | | | | | | | | |
| As at June 30, 2019 | | | | | | | | | | | | | | | | | | | | |
| Cost | | | 50,000 | | | | 257,254 | | | | 4,489,295 | | | | 883,140 | | | | 5,679,689 | |
| Accumulated amortization | | | (26,250 | ) | | | (144,663 | ) | | | (1,720,896 | ) | | | (338,538 | ) | | | (2,230,347 | ) |
| Net book value | | | 23,750 | | | | 112,591 | | | | 2,768,399 | | | | 544,602 | | | | 3,449,342 | |
Profound Medical Corp.
Notes to Interim Condensed Consolidated Financial Statements
(Unaudited)
June 30, 2019
| | | Leased
premises
$ | |
| | | | |
| As at January 1, 2019 | | | | |
| Cost | | | 2,616,773 | |
| Accumulated depreciation | | | - | |
| Net book value | | | 2,616,773 | |
| | | | | |
| Six months ended June 30, 2019 | | | | |
| Opening net book value | | | 2,616,773 | |
| Foreign exchange | | | (4,075 | ) |
| Depreciation | | | (204,126 | ) |
| Closing net book value | | | (2,408,572 | ) |
| | | | | |
| As at June 30, 2019 | | | | |
| Cost | | | 2,616,773 | |
| Accumulated depreciation | | | (208,201 | ) |
| Net book value | | | 2,408,572 | |
The Company leases office premises in Mississauga, Canada and Vantaa, Finland. These lease agreements are typically entered into for four to ten-year periods.
| | | Asset
retirement
obligation
$ | | | Revenue
share
obligation
$ | | | Warranty
provision
$ | | | Total
$ | |
| | | | | | | | | | | | | |
| As at January 1, 2019 | | | 49,319 | | | | 1,241,657 | | | | 110,360 | | | | 1,401,336 | |
| Change in accounting policy for IFRS 16 (note 2) | | | (49,319 | ) | | | - | | | | - | | | | (49,319 | ) |
| Restated balance as at January 1, 2019 | | | - | | | | 1,241,657 | | | | 110,360 | | | | 1,352,017 | |
| Additions | | | - | | | | - | | | | 65,922 | | | | 65,922 | |
| Expiry | | | - | | | | (1,241,657 | ) | | | (40,998 | ) | | | (1,282,655 | ) |
| Foreign exchange | | | - | | | | - | | | | (2,381 | ) | | | (2,381 | ) |
| As at June 30, 2019 | | | - | | | | - | | | | 132,903 | | | | 132,903 | |
| Less: Current portion | | | - | | | | - | | | | 87,741 | | | | 87,741 | |
| Long-term portion | | | - | | | | - | | | | 45,162 | | | | 45,162 | |
Asset retirement obligation
The asset retirement obligation was related to the Company’s leasehold improvements. This amount was transferred as part of the adoption of IFRS 16 (note 2).
Profound Medical Corp.
Notes to Interim Condensed Consolidated Financial Statements
(Unaudited)
June 30, 2019
Revenue share obligation
During January 2019, the Company replaced the original co-marketing and co-selling agreement with Siemens with a new agreement. Under the new agreement, all prior financial commitments and obligations owed to Siemens are released and replaced with a non-exclusive licence resulting in a one-time fixed licence fee of US$100,000 and a per annum payment per device interfaced to a Siemens MRI scanner. In exchange for the one-time fixed licence fee and per annum payments, the Company obtained a non-exclusive licence and reasonable support for the term of the agreement.
Warranty provision
The warranty provision is related to the Company’s estimate of future warranty obligations on product sales, which generally have a term of 12 to 24 months.
A summary of the long-term debt is as follows:
| | | June 30,
2019
$ | | | December 31,
2018
$ | |
| | | | | | | |
| CIBC loan | | | 12,038,095 | | | | 11,955,245 | |
| Less: Current portion | | | 3,475,358 | | | | 1,339,583 | |
| Long-term portion | | | 8,562,737 | | | | 10,615,662 | |
On July 30, 2018, the Company signed a term loan agreement with CIBC Innovation Banking (CIBC) to provide a secured loan for total initial gross proceeds of $12,500,000 maturing on July 29, 2022 with an interest rate based on prime plus 2.5%. The Company is required to make interest only payments until October 31, 2019 and monthly repayments on the principal of $378,788 plus accrued interest commencing on October 31, 2019. All obligations of the Company under the term loan agreement are guaranteed by current and future subsidiaries of the Company and include security of first priority interests in the assets of the Company and its subsidiaries. The Company has the ability to draw an additional $6,250,000 subject to the achievement of certain financing and product development milestones. The Company has a financial covenant in relation to the CIBC loan where unrestricted cash is required to be greater than operating cash expenditures for a trailing three-month period, reported on a monthly basis. The Company is in compliance with this financial covenant as at June 30, 2019.
Profound Medical Corp.
Notes to Interim Condensed Consolidated Financial Statements
(Unaudited)
June 30, 2019
| | | June 30,
2019
$ | | | December 31,
2018
$ | |
| | | | | | | |
| Balance – Beginning of period | | | 11,955,245 | | | | - | |
| Proceeds received | | | - | | | | 12,500,000 | |
| Transaction costs | | | - | | | | (930,520 | ) |
| Interest and accretion expense | | | 617,559 | | | | 517,409 | |
| Repayment | | | (534,709 | ) | | | (131,644 | ) |
| Balance – End of period | | | 12,038,095 | | | | 11,955,245 | |
| Less: Current portion | | | 3,475,358 | | | | 1,339,583 | |
| Long-term portion | | | 8,562,737 | | | | 10,615,662 | |
In connection with this term loan agreement on July 31, 2018, the Company also issued 321,714 common share purchase warrants to CIBC, with each warrant entitling the holder to acquire one common share at a price of $0.97 per common share until the date that is 60 months from the closing of the term loan agreement, with a cashless exercise feature. The cashless exercise feature causes the conversion ratio to be variable and the warrants are therefore classified as a financial liability. Gains and losses on the warrants are recorded within finance costs on the interim condensed consolidated statements of loss and comprehensive loss. A pricing model with observable market based inputs was used to estimate the fair value of the warrants issued. The estimated fair value of the warrants as at June 30, 2019 and December 31, 2018 was $152,423 and $98,203, respectively. The variables used to determine the fair values are as follows:
| | | June 30,
2019 | | | December 31,
2018 | |
| | | | | | | |
| Share price | | $ | 0.79 | | | $ | 0.55 | |
| Volatility | | | 88 | % | | | 86 | % |
| Expected life of warrants | | | 4.1 years | | | | 4.6 years | |
| Risk free interest rate | | | 1.41 | % | | | 1.88 | % |
| Dividend yield | | | - | | | | - | |
The Federal Economic Development Agency (FedDev) loan with total proceeds of $867,000 was unsecured and non-interest bearing. The final repayment of $563,550 was made on July 25, 2018.
During the three and six months ended June 30, 2019 and 2018, the Company recognized $nil of interest and accretion expense on this loan (three and six months ended June 30, 2018 - $77,783 and $90,775, respectively).
The Health Technology Exchange (HTX) loans with total proceeds of $1,500,000 were unsecured and bore interest at 4.50% per annum. The final repayment of $1,094,698, including accrued interest, was made on March 31, 2018.
During the three and six months ended June 30, 2019 and 2018, the Company recognized $nil of interest and accretion expense on these loans (three and six months ended June 30, 2018 - $nil and $18,078, respectively).
Profound Medical Corp.
Notes to Interim Condensed Consolidated Financial Statements
(Unaudited)
June 30, 2019
On April 30, 2015, Profound Medical Inc. signed an agreement with Knight Therapeutics Inc. (Knight) to provide a secured loan of $4,000,000 (the Knight Loan) for an initial period of four years with an interest rate of 15% per annum, with payments of interest and principal deferred until June 30, 2017. As part of the agreement, Knight was also granted a royalty of 0.5% on net sales resulting from global sales of the Company’s products until May 20, 2019 (the royalty). In addition, the Company also entered into a distribution, licence and supply agreement with Knight pursuant to which Knight will act as the exclusive distributor of the Company’s product in Canada for an initial ten-year term, renewable for successive ten-year terms by either party. In connection with these arrangements, the Company issued to Knight 4% of the common shares of the Company (1,717,450 common shares). On July 25, 2018, the full amount of the Knight Loan, including prepayment fees, was repaid for a total payment of $3,188,023.
The royalty was initially recorded at fair value and was subsequently carried at amortized cost using the effective interest rate method. The initial fair value of the royalty was determined using future revenue forecasts for the term of the loan and a discount rate of 18%. During the three and six months ended June 30, 2019, the Company revised the fair value of the royalty, using future revenue forecasts for the term of the loan and a discount rate of 18%, and recognized an interest accretion recovery of $6,361 and $3,450, respectively (three and six months ended June 30, 2018 - accretion recovery of $7,931 and $3,383, respectively). This liability is included within other liabilities on the interim condensed consolidated balance sheets.
| | | Knight
royalty
payable
$ | | | Contingent
consideration
$ | | | Deferred
rent
$ | | | Total
$ | |
| | | | | | | | | | | | | |
| As at January 1, 2019 | | | 19,653 | | | | 1,255,741 | | | | 292,055 | | | | 1,567,449 | |
| Change in accounting policy for IFRS 16 (note 2) | | | - | | | | - | | | | (292,055 | ) | | | (292,055 | ) |
| Restated balance as at January 1, 2019 | | | 19,653 | | | | 1,255,741 | | | | - | | | | 1,275,394 | |
| Amounts paid | | | (16,203 | ) | | | - | | | | - | | | | (16,203 | ) |
| Change in fair value | | | - | | | | (208,911 | ) | | | - | | | | (208,911 | ) |
| Accretion recovery (note 15) | | | (3,450 | ) | | | - | | | | - | | | | (3,450 | ) |
| As at June 30, 2019 | | | - | | | | 1,046,830 | | | | - | | | | 1,046,830 | |
| Less: Current portion | | | - | | | | 614,285 | | | | - | | | | 614,285 | |
| Long-term portion | | | - | | | | 432,545 | | | | - | | | | 432,545 | |
Knight royalty payable
As part of the Knight Loan, Knight was granted a royalty of 0.5% on net sales resulting from global sales of the Company’s products until May 20, 2019.
Contingent consideration
On July 31, 2017, the Company entered into an Asset and Share Purchase Agreement (the agreement) to acquire all of the issued and outstanding shares and certain assets of Royal Philips’ (Philips) Sonalleve MR-HIFU business (Sonalleve). The agreement includes certain contingent consideration payments payable monthly in euro tied to future revenue levels of the Sonalleve business summarized as follows:
Profound Medical Corp.
Notes to Interim Condensed Consolidated Financial Statements
(Unaudited)
June 30, 2019
| · | 5% of revenue between the date of acquisition and December 31, 2017; |
| · | 6% of revenue during the year ending December 31, 2018; |
| · | 7% of revenue during the years ending December 31, 2019 and 2020; and |
| · | if total revenues are in excess of a defined amount from the date of acquisition to December 31, 2020, then the Company will be required to pay 7% of revenue from the date of acquisition to December 31, 2019. |
The contingent consideration is classified as a Level 3 financial liability within the fair value hierarchy given its fair value is estimated using the discounted value of estimated future payments. The key assumptions in valuing the contingent consideration include: estimated projected net sales; the likelihood of certain levels being reached; and a discount rate of 15%.
Deferred rent
The deferred rent obligation was related to the Company’s straight-line rent accrual for its current premises. This amount was transferred as part of the adoption of IFRS 16 (note 2).
| | | June 30,
2019
$ | |
| | | | |
| As at January 1, 2019 | | | 2,587,727 | |
| Repayments | | | (143,943 | ) |
| Foreign exchange | | | (20,297 | ) |
| Interest and accretion expense | | | 67,149 | |
| Balance – End of period | | | 2,490,636 | |
| Less: Current portion | | | 211,599 | |
| Long-term portion | | | 2,279,037 | |
Common shares
The Company is authorized to issue an unlimited number of common shares.
Issued and outstanding (with no par value)
| | | June 30,
2019
$ | | | December 31,
2018
$ | |
| | | | | | | |
| 108,072,939 (December 31, 2018 – 108,054,939) common shares | | | 120,942,484 | | | | 120,932,404 | |
Profound Medical Corp.
Notes to Interim Condensed Consolidated Financial Statements
(Unaudited)
June 30, 2019
Warrants
As a result of the March 20, 2018 bought deal financing, 17,250,000 warrants were issued.
A summary of warrants outstanding is shown below:
| | | Number of
warrants | | | Weighted
average
exercise
price
$ | | | Weighted average remaining contractual life (years) | |
| | | | | | | | | | |
| Balance – January 1, 2019 and June 30, 2019 | | | 22,571,714 | | | | 1.39 | | | | 3.17 | |
Share options
Compensation expense related to share options for the three and six months ended June 30, 2019 was $383,789 and $456,427, respectively (three and six months ended June 30, 2018 - $235,873 and $476,931, respectively).
A summary of the share option changes during the period presented and the total number of share options outstanding as at those dates are set forth below:
| | | Number of options | | | Weighted average exercise price $ | |
| | | | | | | |
| Balance – January 1, 2019 | | | 6,244,779 | | | | 1.13 | |
| Granted | | | 4,982,400 | | | | 0.92 | |
| Exercised | | | (18,000 | ) | | | 0.30 | |
| Forfeited/expired | | | (835,250 | ) | | | 1.06 | |
| Balance – June 30, 2019 | | | 10,373,929 | | | | 1.04 | |
The company estimated the fair value of the share options granted during the period using the Black-Scholes option pricing model with the weighted average assumptions below. Due to the absence of company-specific volatility rates for the expected life of the share options, the company chose comparable companies in the medical device industry.
| | | May 15,
2019 | | | May 16,
2019 | |
| | | | | | | |
| Share price on date of issuance | | $ | 0.91 | | | $ | 0.94 | |
| Expected volatility | | | 82 | % | | | 82 | % |
| Expected life of share options | | | 6 years | | | | 6 years | |
| Risk-free interest rate | | | 1.59 | % | | | 1.59 | % |
| Dividend yield | | | - | | | | - | |
| Number of share options issued | | | 133,000 | | | | 4,849,400 | |
Profound Medical Corp.
Notes to Interim Condensed Consolidated Financial Statements
(Unaudited)
June 30, 2019
The following table summarizes information about the share options outstanding as at June 30, 2019:
Exercise price $ | | Number of options outstanding | | | Weighted average remaining contractual life (years) | | | Number of options exercisable | |
| | | | | | | | | | |
| 0.24 | | | 212,750 | | | | 3.19 | | | | 212,750 | |
| 0.60 | | | 33,000 | | | | 9.40 | | | | - | |
| 0.85 | | | 315,000 | | | | 8.38 | | | | 124,663 | |
| 0.91 | | | 133,000 | | | | 9.88 | | | | - | |
| 0.92 | | | 4,849,400 | | | | 9.88 | | | | - | |
| 0.93 | | | 500,000 | | | | 9.16 | | | | - | |
| 0.97 | | | 66,000 | | | | 7.82 | | | | 55,000 | |
| 0.99 | | | 28,000 | | | | 8.75 | | | | 8,747 | |
| 1.02 | | | 115,500 | | | | 8.97 | | | | 71,500 | |
| 1.10 | | | 1,971,724 | | | | 7.47 | | | | 1,243,874 | |
| 1.19 | | | 518,000 | | | | 8.90 | | | | 140,291 | |
| 1.35 | | | 132,500 | | | | 7.15 | | | | 107,961 | |
| 1.46 | | | 934,055 | | | | 7.15 | | | | 661,622 | |
| 1.50 | | | 565,000 | | | | 6.17 | | | | 528,621 | |
| | | | 10,373,929 | | | | 8.64 | | | | 3,155,029 | |
| | | Three months
ended
June 30,
2019
$ | | | Three months
ended
June 30,
2018
$ | | | Six months
ended
June 30,
2019
$ | | | Six months
ended
June 30,
2018
$ | |
| | | | | | | | | | | | | |
| Production and manufacturing costs | | | 68,171 | | | | 45,537 | | | | 464,477 | | | | 237,590 | |
| Salaries and benefits | | | 2,473,969 | | | | 2,657,601 | | | | 5,012,176 | | | | 5,095,979 | |
| Consulting fees | | | 1,378,418 | | | | 1,286,739 | | | | 2,297,765 | | | | 2,552,083 | |
| Research and development expense | | | 613,821 | | | | 266,463 | | | | 1,096,785 | | | | 320,255 | |
| Sales and marketing expenses | | | 368,339 | | | | 427,721 | | | | (696,955 | ) | | | 685,885 | |
| Amortization and depreciation | | | 516,350 | | | | 424,548 | | | | 1,026,028 | | | | 848,386 | |
| Share-based compensation | | | 383,789 | | | | 235,873 | | | | 456,427 | | | | 476,931 | |
| Rent | | | 125,974 | | | | 193,075 | | | | 216,133 | | | | 348,741 | |
| Other expenses | | | 242,782 | | | | 286,365 | | | | 494,647 | | | | 256,035 | |
| | | | 6,171,613 | | | | 5,823,922 | | | | 10,367,483 | | | | 10,821,885 | |
Profound Medical Corp.
Notes to Interim Condensed Consolidated Financial Statements
(Unaudited)
June 30, 2019
| | | Three
months
ended
June 30,
2019
$ | | | Three
months
ended
June 30,
2018
$ | | | Six months
ended
June 30,
2019
$ | | | Six months
ended
June 30,
2018
$ | |
| | | | | | | | | | | | | |
| Knight loan (note 9) | | | - | | | | 264,766 | | | | - | | | | 416,745 | |
| Change in fair value of contingent consideration | | | (185,197 | ) | | | (73,193 | ) | | | (208,911 | ) | | | (24,546 | ) |
| CIBC loan (note 9) | | | 312,050 | | | | - | | | | 617,559 | | | | - | |
| HTX and FedDev loans (note 9) | | | - | �� | | | 77,783 | | | | - | | | | 108,853 | |
| Change in fair value of derivative financial instrument (note 9) | | | (3,251 | ) | | | - | | | | 54,220 | | | | - | |
| Lease liability interest expense (note 11) | | | 33,556 | | | | - | | | | 67,149 | | | | - | |
| Royalty interest accretion recovery (note 9 and 10) | | | (6,361 | ) | | | (7,931 | ) | | | (3,450 | ) | | | (3,383 | ) |
| Provisions (note 8) | | | - | | | | 1,261 | | | | - | | | | 2,488 | |
| Foreign exchange (gain) loss | | | 186,423 | | | | 50,920 | | | | 125,338 | | | | 133,412 | |
| | | | 337,220 | | | | 313,606 | | | | 651,905 | | | | 633,569 | |
The following table shows the calculation of basic and diluted loss per share:
| | | Three months
ended
June 30,
2019
$ | | | Three months
ended
June 30,
2018
$ | | | Six months
ended
June 30,
2019
$ | | | Six months
ended
June 30,
2018
$ | |
| | | | | | | | | | | | | |
| Net loss for the period | | | 5,844,134 | | | | 5,831,028 | | | | 8,770,820 | | | | 10,769,214 | |
| Weighted average number of common shares | | | 108,061,539 | | | | 107,727,319 | | | | 108,058,221 | | | | 92,614,640 | |
| Basic and diluted loss per share | | | 0.05 | | | | 0.05 | | | | 0.08 | | | | 0.12 | |
For the periods noted above, the computation of diluted loss per share is equal to the basic loss per share due to the anti-dilutive effect of the share options and warrants.
Of the 10,373,929 (June 30, 2018 – 5,535,029) share options and 22,571,714 (June 30, 2018 – 22,250,000) warrants not included in the calculation of diluted loss per share for the period ended June 30, 2019, 25,726,743 (June 30, 2018 – 24,347,875) were exercisable.
Profound Medical Corp.
Notes to Interim Condensed Consolidated Financial Statements
(Unaudited)
June 30, 2019
| 17 | Related party transactions |
Key management includes the Company’s directors and senior management team. The remuneration of directors and the senior management team was as follows:
| | | Three months
ended
June 30,
2019
$ | | | Three months
ended
June 30,
2018
$ | | | Six months
ended
June 30,
2019
$ | | | Six months
ended
June 30,
2018
$ | |
| | | | | | | | | | | | | |
| Salaries and employee benefits | | | 347,258 | | | | 705,127 | | | | 696,848 | | | | 908,853 | |
| Termination benefits | | | - | | | | - | | | | - | | | | 114,750 | |
| Directors’ fees | | | 37,500 | | | | 20,084 | | | | 75,000 | | | | 40,031 | |
| Share-based compensation | | | 315,536 | | | | 228,792 | | | | 372,170 | | | | 401,596 | |
| | | | 700,294 | | | | 954,003 | | | | 1,144,018 | | | | 1,456,230 | |
Executive employment agreements allow for additional payments in the event of a liquidity event, or if the executive is terminated without cause.
The Company’s operations are categorized into one industry segment, which is medical technology focused on magnetic resonance guided ablation procedures for the treatment of prostate disease, uterine fibroids and palliative pain treatment for patients with metastatic bone disease. The Company is managed geographically in Canada, Germany and Finland.
For the three-month period ended June 30, 2019:
| | | Canada
$ | | | Germany
$ | | | Finland
$ | | | Total
$ | |
| | | | | | | | | | | | | |
| Revenue | | | | | | | | | | | | | | | | |
| Product | | | 351,822 | | | | 114,018 | | | | - | | | | 465,840 | |
| Services | | | 19,590 | | | | 88,679 | | | | - | | | | 108,269 | |
| | | | 371,412 | | | | 202,697 | | | | - | | | | 574,109 | |
| Cost of sales | | | 59,698 | | | | 184,368 | | | | - | | | | 244,066 | |
| Gross profit | | | 311,714 | | | | 18,329 | | | | - | | | | 330,043 | |
| | | | | | | | | | | | | | | | | |
| Operating expenses | | | | | | | | | | | | | | | | |
| Research and development | | | 2,548,997 | | | | - | | | | 637,358 | | | | 3,186,355 | |
| General and administrative | | | 1,507,414 | | | | - | | | | 78,909 | | | | 1,586,323 | |
| Selling and distribution | | | 659,343 | | | | 412,861 | | | | 82,665 | | | | 1,154,869 | |
| Total operating expense | | | 4,715,754 | | | | 412,861 | | | | 798,932 | | | | 5,927,547 | |
| | | | | | | | | | | | | | | | | |
| Operating loss | | | 4,404,040 | | | | 394,532 | | | | 798,932 | | | | 5,597,504 | |
| Net finance costs | | | | | | | | | | | | | | | 226,430 | |
| Loss for the period before income taxes | | | | | | | | | | | | | | | 5,823,934 | |
Profound Medical Corp.
Notes to Interim Condensed Consolidated Financial Statements
(Unaudited)
June 30, 2019
For the six-month period ended June 30, 2019:
| | | Canada
$ | | | Germany
$ | | | Finland
$ | | | Total
$ | |
| | | | | | | | | | | | | |
| Revenue | | | | | | | | | | | | | | | | |
| Product | | | 1,289,131 | | | | 524,490 | | | | - | | | | 1,813,621 | |
| Services | | | 31,768 | | | | 204,508 | | | | - | | | | 236,276 | |
| | | | 1,320,899 | | | | 728,998 | | | | - | | | | 2,049,897 | |
| Cost of sales | | | 215,140 | | | | 562,282 | | | | - | | | | 777,422 | |
| Gross profit | | | 1,105,759 | | | | 166,716 | | | | - | | | | 1,272,475 | |
| | | | | | | | | | | | | | | | | |
| Operating expenses | | | | | | | | | | | | | | | | |
| Research and development | | | 4,444,216 | | | | - | | | | 1,419,885 | | | | 5,864,101 | |
| General and administrative | | | 2,908,411 | | | | - | | | | 192,025 | | | | 3,100,436 | |
| Selling and distribution | | | (332,591 | ) | | | 789,449 | | | | 168,666 | | | | 625,524 | |
| Total operating expense | | | 7,020,035 | | | | 789,449 | | | | 1,780,577 | | | | 9,590,061 | |
| | | | | | | | | | | | | | | | | |
| Operating loss | | | 5,914,276 | | | | 622,733 | | | | 1,780,577 | | | | 8,317,586 | |
| Net finance costs | | | | | | | | | | | | | | | 399,234 | |
| Loss for the period before income taxes | | | | | | | | | | | | | | | 8,716,820 | |
For the three-month period ended June 30, 2018:
| | | Canada
$ | | | Germany
$ | | | Finland
$ | | | Total
$ | |
| | | | | | | | | | | | | |
| Revenue | | | | | | | | | | | | | | | | |
| Product | | | - | | | | 170,931 | | | | - | | | | 170,931 | |
| Services | | | 12,119 | | | | 30,293 | | | | - | | | | 42,412 | |
| | | | 12,119 | | | | 201,224 | | | | - | | | | 213,343 | |
| Cost of sales | | | - | | | | 126,259 | | | | - | | | | 126,259 | |
| Gross profit | | | 12,119 | | | | 74,965 | | | | - | | | | 87,084 | |
| | | | | | | | | | | | | | | | | |
| Operating expenses | | | | | | | | | | | | | | | | |
| Research and development | | | 2,009,586 | | | | - | | | | 338,323 | | | | 2,347,909 | |
| General and administrative | | | 2,236,529 | | | | - | | | | - | | | | 2,236,529 | |
| Selling and distribution | | | 599,998 | | | | 333,040 | | | | 180,187 | | | | 1,113,225 | |
| Total operating expense | | | 4,846,113 | | | | 333,040 | | | | 518,510 | | | | 5,697,663 | |
| | | | | | | | | | | | | | | | | |
| Operating loss | | | 4,833,994 | | | | 258,075 | | | | 518,510 | | | | 5,610,579 | |
| Net finance costs | | | | | | | | | | | | | | | 196,249 | |
| Loss for the period before income taxes | | | | | | | | | | | | | | | 5,806,828 | |
Profound Medical Corp.
Notes to Interim Condensed Consolidated Financial Statements
(Unaudited)
June 30, 2019
For the six-month period ended June 30, 2018:
| | | Canada
$ | | | Germany
$ | | | Finland
$ | | | Total
$ | |
| | | | | | | | | | | | | |
| Revenue | | | | | | | | | | | | | | | | |
| Product | | | - | | | | 543,425 | | | | - | | | | 543,425 | |
| Services | | | 12,119 | | | | 34,134 | | | | - | | | | 46,253 | |
| | | | 12,119 | | | | 577,559 | | | | - | | | | 589,678 | |
| Cost of sales | | | - | | | | 357,334 | | | | - | | | | 357,334 | |
| Gross profit | | | 12,119 | | | | 220,225 | | | | - | | | | 232,344 | |
| | | | | | | | | | | | | | | | | |
| Operating expenses | | | | | | | | | | | | | | | | |
| Research and development | | | 3,835,311 | | | | - | | | | 1,029,379 | | | | 4,864,690 | |
| General and administrative | | | 3,359,195 | | | | - | | | | 180,538 | | | | 3,539,733 | |
| Selling and distribution | | | 1,003,598 | | | | 726,324 | | | | 330,205 | | | | 2,060,127 | |
| Total operating expense | | | 8,198,104 | | | | 726,324 | | | | 1,540,122 | | | | 10,464,550 | |
| | | | | | | | | | | | | | | | | |
| Operating loss | | | 8,185,985 | | | | 506,099 | | | | 1,540,122 | | | | 10,232,206 | |
| Net finance costs | | | | | | | | | | | | | | | 476,408 | |
| Loss for the period before income taxes | | | | | | | | | | | | | | | 10,708,614 | |
Other financial information by segment as at June 30, 2019:
| | | Canada
$ | | | Germany
$ | | | Finland
$ | | | Total
$ | |
| | | | | | | | | | | | | |
| Total assets | | | 34,015,086 | | | | 896,755 | | | | 2,950,871 | | | | 37,862,711 | |
| Goodwill and intangible assets | | | 6,858,507 | | | | - | | | | - | | | | 6,858,507 | |
| Property and equipment | | | 662,624 | | | | - | | | | 252,224 | | | | 914,848 | |
| Right-of-use assets | | | 2,127,101 | | | | - | | | | 281,471 | | | | 2,408,572 | |
| Amortization of intangible assets | | | 564,219 | | | | - | | | | - | | | | 564,219 | |
| Depreciation of property and equipment | | | 134,672 | | | | 267 | | | | 122,360 | | | | 257,299 | |
| Depreciation of right-of-use asset | | | 146,697 | | | | - | | | | 57,429 | | | | 204,126 | |
Other financial information by segment as at December 31, 2018:
| | | Canada
$ | | | Germany
$ | | | Finland
$ | | | Total
$ | |
| | | | | | | | | | | | | |
| Total assets | | | 42,437,691 | | | | 1,093,184 | | | | 3,018,997 | | | | 46,549,872 | |
| Goodwill and intangible assets | | | 7,422,726 | | | | - | | | | - | | | | 7,422,726 | |
| Property and equipment | | | 797,296 | | | | 266 | | | | 409,795 | | | | 1,207,357 | |
| Amortization of intangible assets | | | 1,128,437 | | | | - | | | | - | | | | 1,128,437 | |
| Depreciation of property and equipment | | | 296,093 | | | | 3,100 | | | | 246,808 | | | | 546,001 | |