
0 40th Annual J.P. Morgan Healthcare Conference Investor Presentation January 12, 2022
1 Safe Harbor Statement Certain statements made in this report and in other written or oral statements made by us or on our behalf are “forward-looking statements” within the meaning of the Private Securities Litigation Reform Act of 1995 (“PSLRA”). A forward-looking statement is a statement that is not a historical fact and, without limitation, includes any statement that may predict, forecast, indicate or imply future results, performance or achievements, and may contain words like: “believe,” “anticipate,” “expect,” “estimate,” “aim,” “predict,” “potential,” “continue,” “plan,” “project,” “will,” “should,” “shall,” “may,” “might” and other words or phrases with similar meaning in connection with a discussion of future operating or financial performance. In particular, these include statements relating to future actions, trends, opportunities and growth in our businesses and in the markets we serve, prospective services, future performance or financial results. We claim the protection afforded by the safe harbor for forward-looking statements provided by the PSLRA. These statements are only predictions based on our current expectations and projections about future events. Forward-looking statements involve risks and uncertainties that may cause actual results, level of activity, performance or achievements to differ materially from the results contained in the forward-looking statements. Risks and uncertainties that may cause actual results to vary materially, some of which are described within the forward-looking statements, include, among others: the significant portion of revenue we derive from our largest partners, and the potential loss, non-renewal, termination or renegotiation of our relationship or contract with any significant partner, or multiple partners in the aggregate; evolution in the market for value-based care; uncertainty in the health care regulatory framework, including the potential impact of policy changes; our ability to offer new and innovative products and services; risks related to completed and future acquisitions, investments, alliances and joint ventures, including the acquisition of Vital Decisions, which may be difficult to integrate, divert management resources, or result in unanticipated costs or dilute our stockholders; the financial benefits we expect to receive as a result of the sale of certain assets of Passport may not be realized; the growth and success of our partners, which is difficult to predict and is subject to factors outside of our control, including governmental funding reductions and other policy changes, enrollment numbers for our partners’ plans, premium pricing reductions, selection bias in at-risk membership and the ability to control and, if necessary, reduce health care costs; risks relating to our ability to maintain profitability for our total cost of care and New Century Health’s performance-based contracts and products, including capitation and risk-bearing contracts; our ability to effectively manage our growth and maintain an efficient cost structure, and to successfully implement cost cutting measures; the potential negative impact of the COVID-19 pandemic and other public health emergencies; our ability to recover the significant upfront costs in our partner relationships; our ability to attract new partners and successfully capture new growth opportunities; the increasing number of risk-sharing arrangements we enter into with our partners; our ability to estimate the size of our target markets; our ability to maintain and enhance our reputation and brand recognition; consolidation in the health care industry; competition which could limit our ability to maintain or expand market share within our industry; risks related to governmental payer audits and actions, including whistleblower claims; our ability to partner with providers due to exclusivity provisions in our contracts; risks related to our offshore operations; our ability to contain health care costs, implement increases in premium rates on a timely basis, maintain adequate reserves for policy benefits or maintain cost effective provider agreements; our dependency on our key personnel, and our ability to attract, hire, integrate and retain key personnel; the impact of additional goodwill and intangible asset impairments on our results of operations; our indebtedness, our ability to service our indebtedness, and our ability to obtain additional financing; our ability to achieve profitability in the future; the impact of litigation, including the ongoing class action lawsuit; material weaknesses in the future may impact our ability to conclude that our internal control over financial reporting is not effective and we may be unable to produce timely and accurate financial statements; restrictions and penalties as a result of privacy and data protection laws; data loss or corruption due to failures or errors in our systems and service disruptions at our data centers; restrictions and penalties as a result of privacy and data protection laws; adequate protection of our intellectual property, including trademarks; any alleged infringement, misappropriation or violation of third-party proprietary rights; our use of “open source” software; our ability to protect the confidentiality of our trade secrets, know-how and other proprietary information; our reliance on third parties and licensed technologies; our ability to use, disclose, de-identify or license data and to integrate third-party technologies; our reliance on Internet infrastructure, bandwidth providers, data center providers, other third parties and our own systems for providing services to our partners; our reliance on third-party vendors to host and maintain our technology platform; our obligations to make payments to certain of our pre-IPO investors for certain tax benefits we may claim in the future; our ability to utilize benefits under the tax receivables agreement described herein; our obligations to make payments under the tax receivables agreement that may be accelerated or may exceed the tax benefits we realize; the terms of agreements between us and certain of our pre-IPO investors; the conditional conversion features of the 2024 and 2025 convertible notes, which, if triggered, could require us to settle the 2024 or 2025 convertible notes in cash; the impact of the accounting method for convertible debt securities that may be settled in cash; the potential volatility of our Class A common stock price; the potential impact of our securities class action litigation; the potential decline of our Class A common stock price if a substantial number of shares are sold or become available for sale; provisions in our second amended and restated certificate of incorporation and third amended and restated by-laws and provisions of Delaware law that discourage or prevent strategic transactions, including a takeover of us; the ability of certain of our investors to compete with us without restrictions; provisions in our second amended and restated certificate of incorporation which could limit our stockholders’ ability to obtain a favorable judicial forum for disputes with us or our directors, officers or employees; and our intention not to pay cash dividends on our Class A common stock. The risks included here are not exhaustive. Although we believe the expectations reflected in the forward-looking statements are reasonable, we cannot guarantee future results, level of activity, performance or achievements. Our periodic reports and other documents filed with the SEC include additional factors that could affect our businesses and financial performance. Moreover, we operate in a rapidly changing and competitive environment. New risk factors emerge from time to time, and it is not possible for management to predict all such risk factors. Further, it is not possible to assess the effect of all risk factors on our businesses or the extent to which any factor, or combination of factors, may cause actual results to differ materially from those contained in any forward-looking statements. Given these risks and uncertainties, investors should not place undue reliance on forward-looking statements as a prediction of actual results. In addition, we disclaim any obligation to update any forward-looking statements to reflect events or circumstances that occur after the date of this presentation. This presentation is for informational purposes only and does not constitute an offer to sell or a solicitation of an offer to purchase any securities of any nature whatsoever, and it may not be relied upon in connection with the purchase of securities. The contents of this presentation do not constitute legal, tax or business advice. Anyone reading this presentation should seek advice based on their particular circumstances from independent legal, tax and business advisors.

2 AGENDA Investment Considerations Financial Model, Capital Allocation, and Outlook Evolent Health Overview Segment Overviews
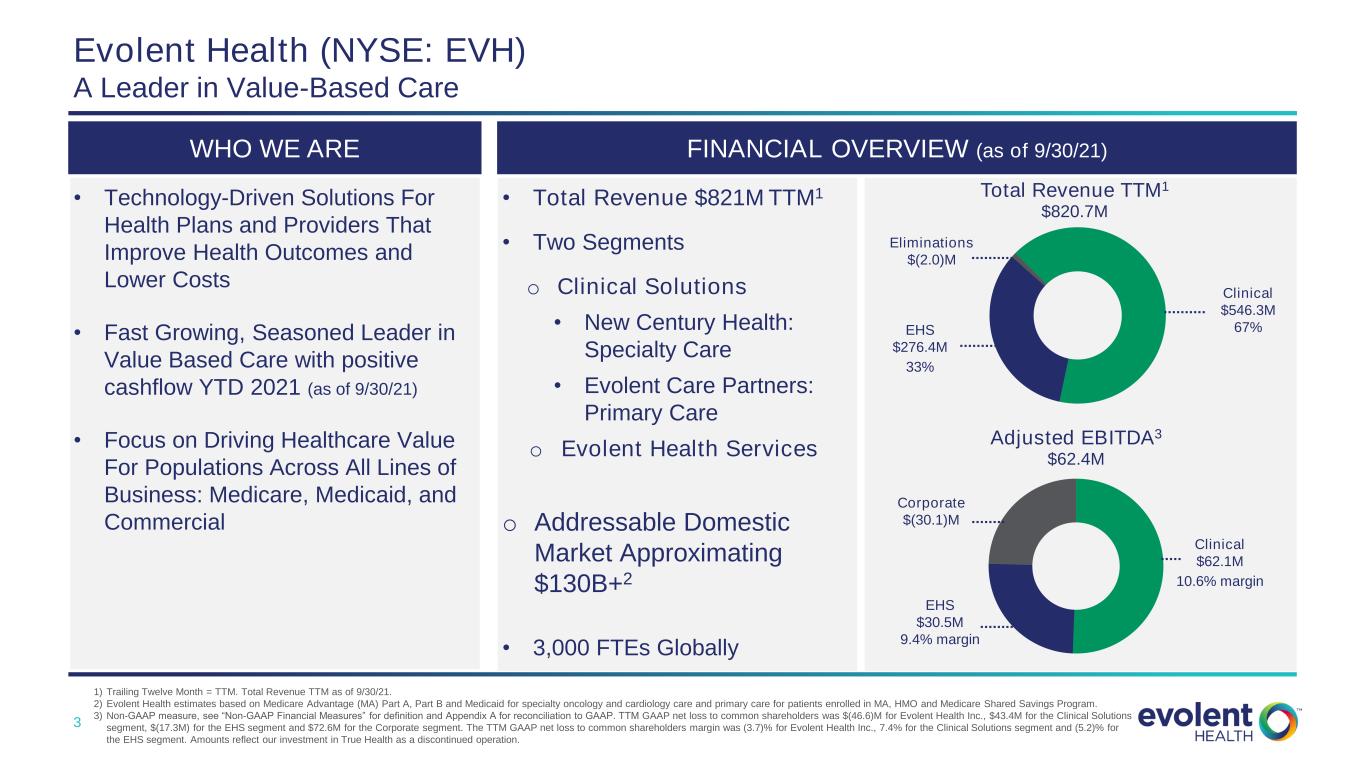
3 FINANCIAL OVERVIEW (as of 9/30/21)WHO WE ARE • Technology-Driven Solutions For Health Plans and Providers That Improve Health Outcomes and Lower Costs • Fast Growing, Seasoned Leader in Value Based Care with positive cashflow YTD 2021 (as of 9/30/21) • Focus on Driving Healthcare Value For Populations Across All Lines of Business: Medicare, Medicaid, and Commercial • Total Revenue $821M TTM1 • Two Segments o Clinical Solutions • New Century Health: Specialty Care • Evolent Care Partners: Primary Care o Evolent Health Services o Addressable Domestic Market Approximating $130B+2 • 3,000 FTEs Globally Evolent Health (NYSE: EVH) A Leader in Value-Based Care Adjusted EBITDA3 $62.4M Clinical $62.1M 10.6% margin Corporate $(30.1)M EHS $30.5M 9.4% margin Total Revenue TTM1 $820.7M Clinical $546.3M 67%EHS $276.4M 33% Eliminations $(2.0)M 1) Trailing Twelve Month = TTM. Total Revenue TTM as of 9/30/21. 2) Evolent Health estimates based on Medicare Advantage (MA) Part A, Part B and Medicaid for specialty oncology and cardiology care and primary care for patients enrolled in MA, HMO and Medicare Shared Savings Program. 3) Non-GAAP measure, see “Non-GAAP Financial Measures” for definition and Appendix A for reconciliation to GAAP. TTM GAAP net loss to common shareholders was $(46.6)M for Evolent Health Inc., $43.4M for the Clinical Solutions segment, $(17.3M) for the EHS segment and $72.6M for the Corporate segment. The TTM GAAP net loss to common shareholders margin was (3.7)% for Evolent Health Inc., 7.4% for the Clinical Solutions segment and (5.2)% for the EHS segment. Amounts reflect our investment in True Health as a discontinued operation.
4 Our Mission: To change the way health care is delivered 1) “Value-based programs reward health care providers with incentive payments for the quality of care they give to people with Medicare. Value-based programs also support our three-part aim: (1) Better care for individuals, (2) Better health for populations, and (3) Lower cost.” Source: CMS.gov: https://www.cms.gov/Medicare/Quality-Initiatives-Patient-Assessment-Instruments/Value-Based-Programs/Value-Based-Programs. Evolent supports our health plan and provider partners with our value-based care1 solutions to improve their performance and help address the $1T of annual waste in US healthcare
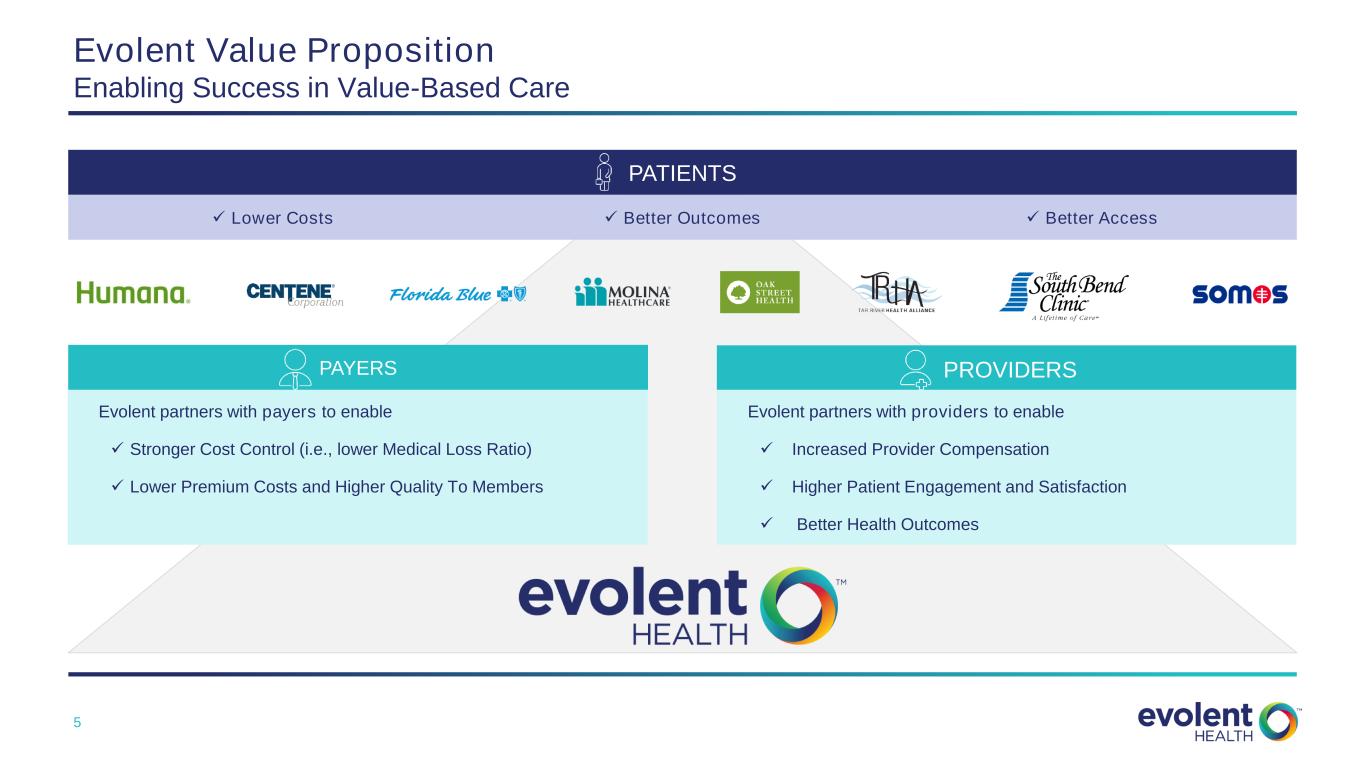
5 Evolent Value Proposition Enabling Success in Value-Based Care PATIENTS PAYERS PROVIDERS ✓ Lower Costs ✓ Better Outcomes ✓ Better Access Evolent partners with payers to enable ✓ Stronger Cost Control (i.e., lower Medical Loss Ratio) ✓ Lower Premium Costs and Higher Quality To Members Evolent partners with providers to enable ✓ Increased Provider Compensation ✓ Higher Patient Engagement and Satisfaction ✓ Better Health Outcomes

6 Providing Intelligent Clinical and Administrative Technology Services Value-Based Care Ecosystem Next-Generation Payers Independent Physician Groups Risk Bearing Ambulatory Providers Traditional Payers Oncology / Cardiology Specialty Benefit Management Companies Primary Care Non-Employed Primary Care Risk Models CollaboratorsCustomers Competitors EHR / HCIT / RCM Consumer / Point of Care Applications Pharma / Rx Channel Administrative Services Population Health and Administrative Platforms
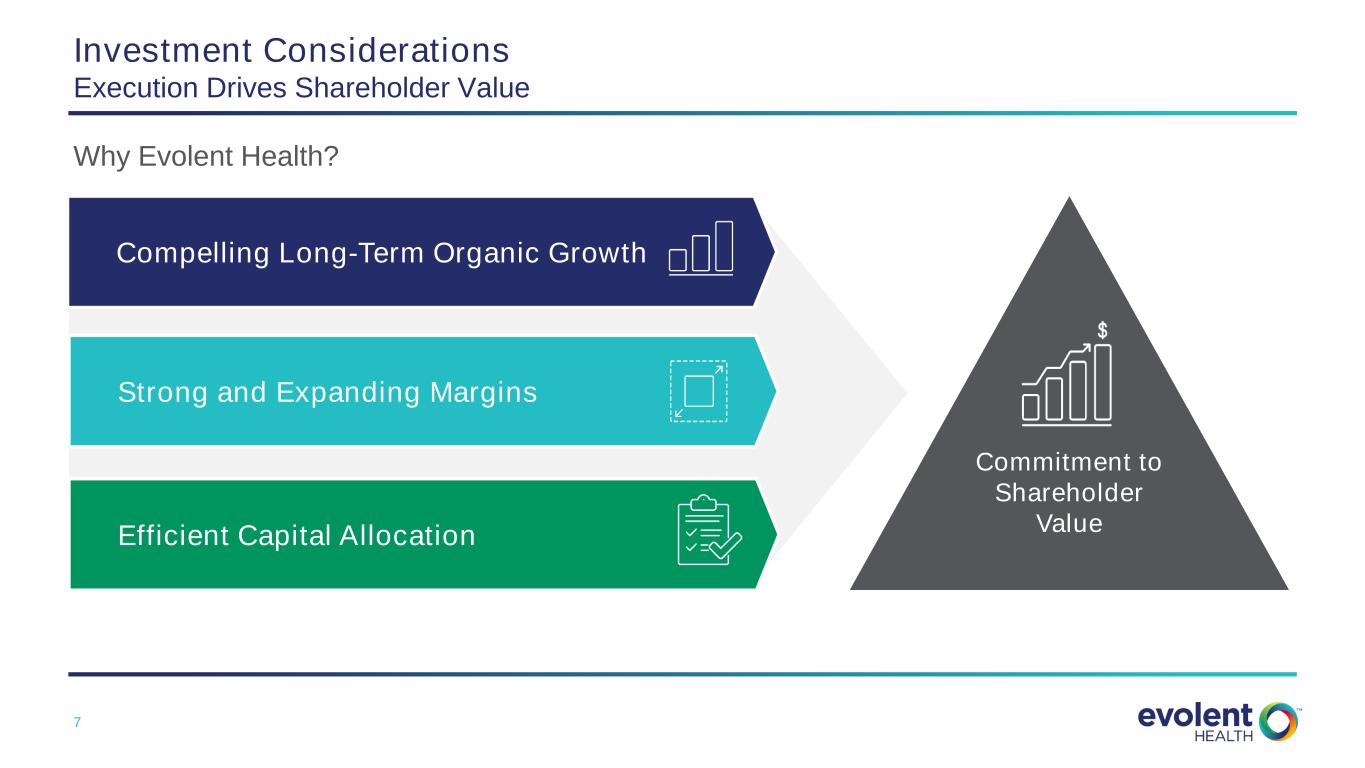
7 Why Evolent Health? Investment Considerations Execution Drives Shareholder Value Efficient Capital Allocation Strong and Expanding Margins Compelling Long-Term Organic Growth Commitment to Shareholder Value
8 Investment Considerations >30% Non-GAAP Revenue CAGR1 Since 2019 • Anticipate $884M-$900M in total revenue in 20212 – annual growth over 30% since 2019 excluding revenue from divested assets1 • Target of mid-teens annual growth on revenue by 20243 • Revenue mix of approximately 60% new customers and 40% existing customer expansion drive annual revenue growth average since 2017 • Average revenue renewal rate of approximately 110% since 20194. Significant expansion opportunity in current partner base • Per Member Per Month revenue model includes long-term contracts enabling revenue visibility and stability Compelling Long-Term Organic Growth 1) Non-GAAP measure, see “Non-GAAP Financial Measures” for definition and Appendix B for reconciliation to GAAP. CAGR calculated from Q1 2019 through Q3 2021 and excludes revenue from divested assets. 2) The 2021 revenue presented herein represents the Company’s guidance for the year ended 12/31/2021, as reaffirmed on 1/12/2022. Amounts reflect our investment in True Health as a discontinued operation. 3) Based on non-GAAP revenue target originally provided on 9/20/2020. 4) Revenue renewal rate represents current year revenue from prior year customers divided by total prior year revenue.

9 Multifold Growth Opportunity Within Existing Partnership Base Illustrates Long-Term Growth Potential New Century Health Example Evolent Care Partners Example $5 $10 $50+ $210+ MSSP Shared Savings MSSP Network Expansion New Line of Business: Capitation 25% Capture of Total Market Potential Single Market Annual Revenue Potential ($M) Early in capturing significant expansion and upsell opportunity with current partners e.g., 25% capture of opportunity with largest five NCH customers represents ~$4 BILLION POTENTIAL annual revenue 2022 Forecast 2022 Forecast Source: Evolent Health, Inc. Company estimates $3 $7 $75 $200+ Tech & Services Relationship Tech & Services Relationship - Geographic Expansion Up-sell to Performance Suite 25% Capture of Total Partner Potential Single Health Plan Partner Annual Revenue Potential ($M) Contracted Potential to contract Contracted Potential to contract
10 Investment Considerations Mix Shift, Scale, Operating Leverage Drive Margin Expansion • Adjusted EBITDA margin 6.4%1 YTD 9/30/21, target of growth in mid-teens2 during 2024 • Adjusted EBITDA and cash flow positive through Q3 2021 with multiple opportunities for growth and expansion • Mix shift to full risk performance suite in oncology and cardiology drives opportunity for multifold growth in margins • Margin growth driven primarily by volume, mix and lengthening partner tenure in Clinical Solutions Strong and Expanding Margins 1) Non-GAAP measure, see “Non-GAAP Financial Measures” for definition and Appendix A for reconciliation to Adjusted EBITDA for YTD 9/30/21, excluding divestments and eliminations. 2) The Company’s long-term Adjusted EBITDA margin target by the year 2024, as reaffirmed on 1/12/2022.
11 Investment Considerations Relatively Low Capital Intensity + Cash Flow = Enhanced Returns Efficient Capital Allocation • Generate sufficient cash flow from operations to support organic growth • Capital expenditures1 equal approximately 2.5% of year-to-date 2021 revenue • Selective, accretive M&A on high value solution adjacencies or share accelerators in focus markets: e.g., 2021 acquisition of Vital Decisions • Available Cash of $191M and Net Leverage Ratio of 2.0x3 as of 9/30/2021 1) Equals software development capital expenditures totaling $16.5 million of internal-use software development costs for the nine months ended September 30, 2021, divided by revenue for the same period of $659.6M. 2) Percentage based on Evolent Health’s outlook of 2021 full year revenue of $884M - $900M. The 2021 revenue presented herein represents the Company’s guidance for the year ended 12/31/2021, as reaffirmed on 1/12/2022. Amounts reflect our investment in True Health as a discontinued operation. 3) Non-GAAP measure, see “Non-GAAP Financial Measures” for definition and Appendix C for reconciliation to GAAP. Net Leverage calculated based on TTM Adjusted EBITDA, a non-GAAP measure. Please see Appendix C for reconciliation. Consolidated net loss for the TTM ended 9.30.21 is ($46.6)M.

12 AGENDA Investment Considerations Financial Model, Capital Allocation, and Outlook Evolent Health Overview Segment Overviews
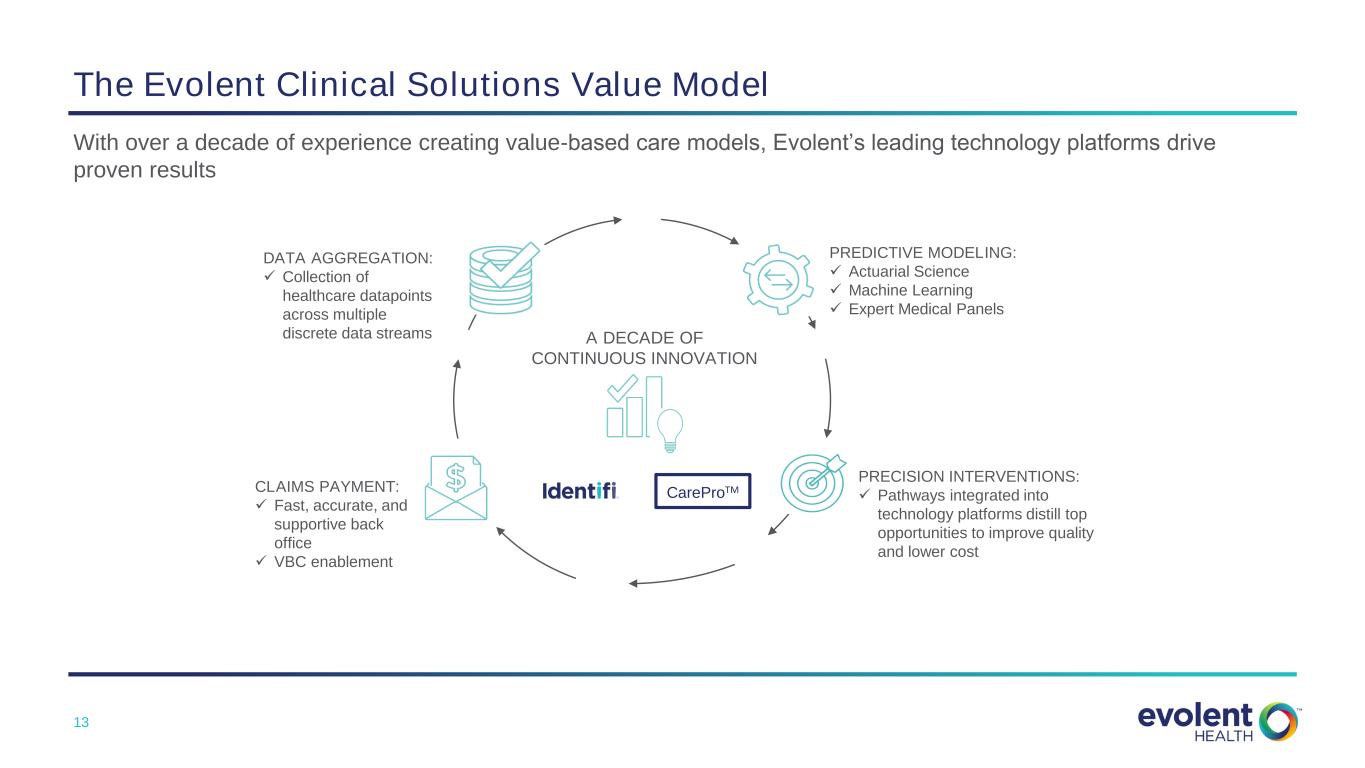
13 With over a decade of experience creating value-based care models, Evolent’s leading technology platforms drive proven results The Evolent Clinical Solutions Value Model PREDICTIVE MODELING: ✓ Actuarial Science ✓ Machine Learning ✓ Expert Medical Panels DATA AGGREGATION: ✓ Collection of healthcare datapoints across multiple discrete data streams CLAIMS PAYMENT: ✓ Fast, accurate, and supportive back office ✓ VBC enablement PRECISION INTERVENTIONS: ✓ Pathways integrated into technology platforms distill top opportunities to improve quality and lower cost A DECADE OF CONTINUOUS INNOVATION CareProTM

14 The Evolent Clinical Solutions Value Model Proven Results 7-10% first year savings to payer for each specialty1 >20% savings for payer in long-term1 $25,000 first year income increase for ECP PCPs2 7:1 savings for every dollar of direct ECP cost invested2 Proven ResultsClinical Technology Platforms • Precision Pathways • 15+ years of longitudinal oncology and cardiology data • Panel Insight used to prioritize clinical interventions and integrate highest priorities into practice workflow • Portal UI built for clinicians by clinicians CareProTM PREDICTIVE MODELING DATA AGGREGATION CLAIMS PAYMENT PRECISION INTERVENTIONS A DECADE OF CONTINUOUS INNOVATION CareProTM 1) Based on New Century Health payer trends for years 1-8 following go-live. 2) Based off 2020 performance year.
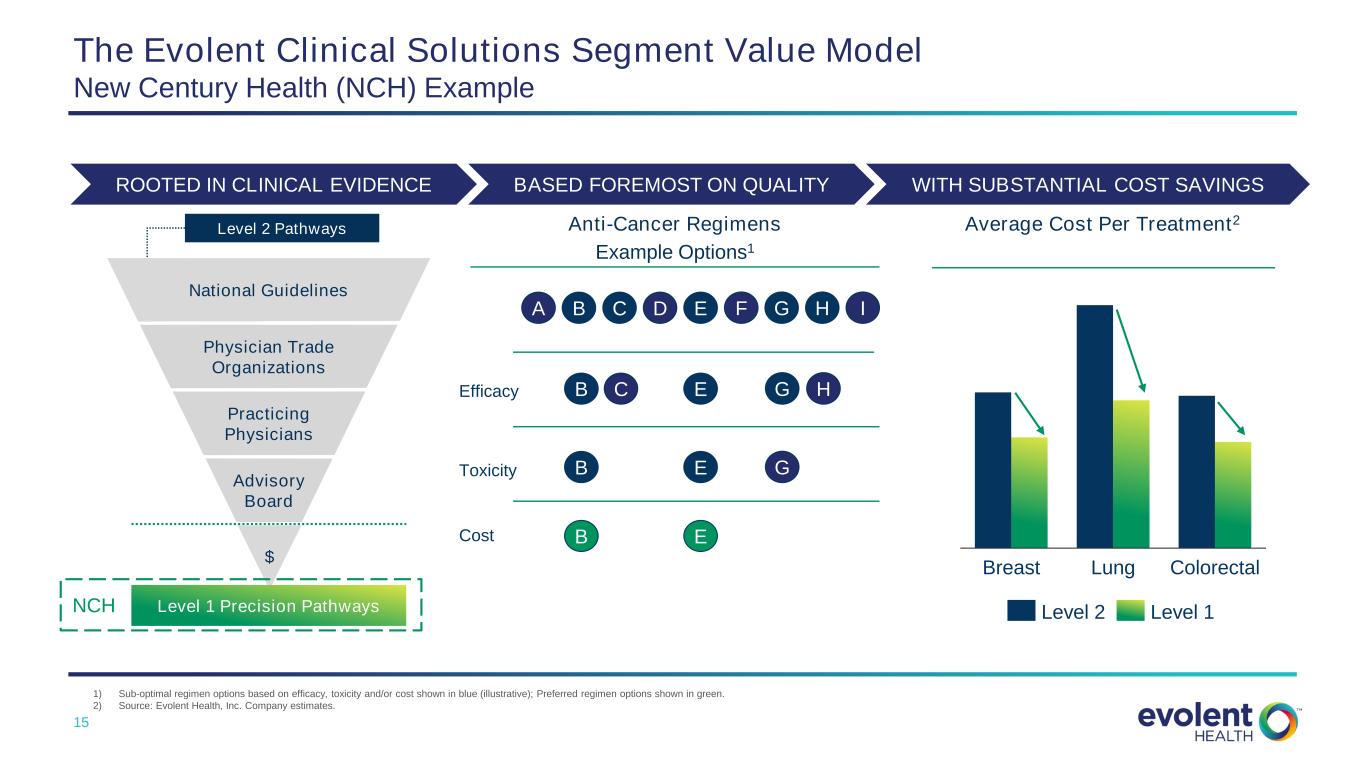
15 The Evolent Clinical Solutions Segment Value Model New Century Health (NCH) Example ROOTED IN CLINICAL EVIDENCE WITH SUBSTANTIAL COST SAVINGS Breast Lung Colorectal Level 1Level 2 Average Cost Per Treatment2 BASED FOREMOST ON QUALITY Advisory Board $ Practicing Physicians Physician Trade Organizations National Guidelines Level 2 Pathways Level 1 Precision Pathways Efficacy Toxicity A B C D E G Cost B C E G B E G B E H H Anti-Cancer Regimens Example Options1 IF NCH 1) Sub-optimal regimen options based on efficacy, toxicity and/or cost shown in blue (illustrative); Preferred regimen options shown in green. 2) Source: Evolent Health, Inc. Company estimates.

16 $90 $93 $95 $98 $100 $81 $82 $82 $82 $83 Year 1 Year 2 Year 3 Year 4 Year 5 The Evolent Clinical Solutions Segment Value Model New Century Health Example: NCH Performance Suite Generates Immediate and Ongoing Savings Total Medical Expense on Oncology & Cardiology Illustrative Savings for Medicare Advantage Population (Part B), PMPM ($) Unmanaged Trend NCH Managed Trend 21 1 Immediate MLR $ savings to payer Y1 2 Ongoing MLR $ savings versus unmanaged trend ~$79M Illustrative Savings to Customer Over Five Years Same or Higher Quality, Lower Cost Higher Quality, Higher Cost Higher Quality, Same Cost Health Outcomes Under NCH Source: Evolent Health, Inc. Company estimates based on data for a MA payer’s book of business. Total five-year savings to customer assumes 100K MA lives under management.
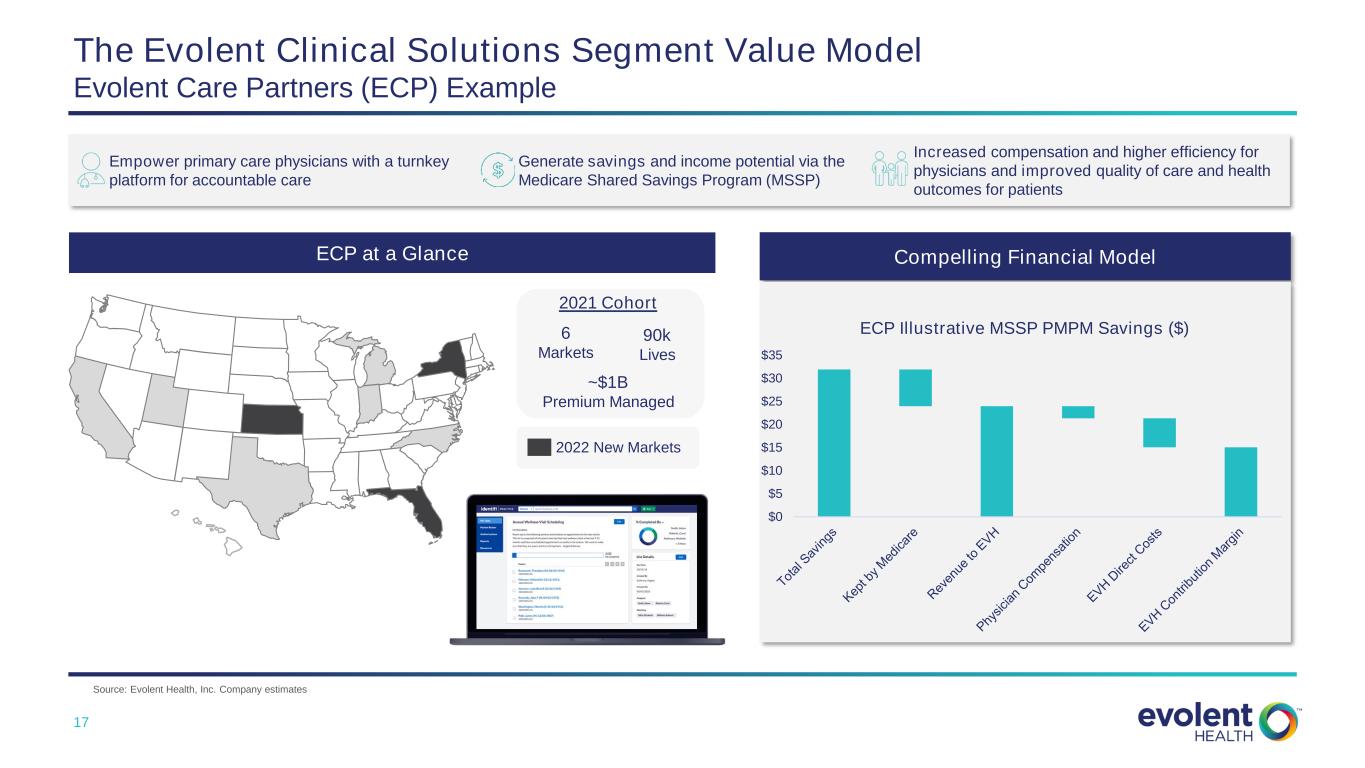
17 Empower primary care physicians with a turnkey platform for accountable care Generate savings and income potential via the Medicare Shared Savings Program (MSSP) Increased compensation and higher efficiency for physicians and improved quality of care and health outcomes for patients The Evolent Clinical Solutions Segment Value Model Evolent Care Partners (ECP) Example 90k Lives ~$1B Premium Managed 6 Markets ECP at a Glance Compelling Financial Model $0 $5 $10 $15 $20 $25 $30 $35 ECP Illustrative MSSP PMPM Savings ($) Source: Evolent Health, Inc. Company estimates 2021 Cohort 2022 New Markets
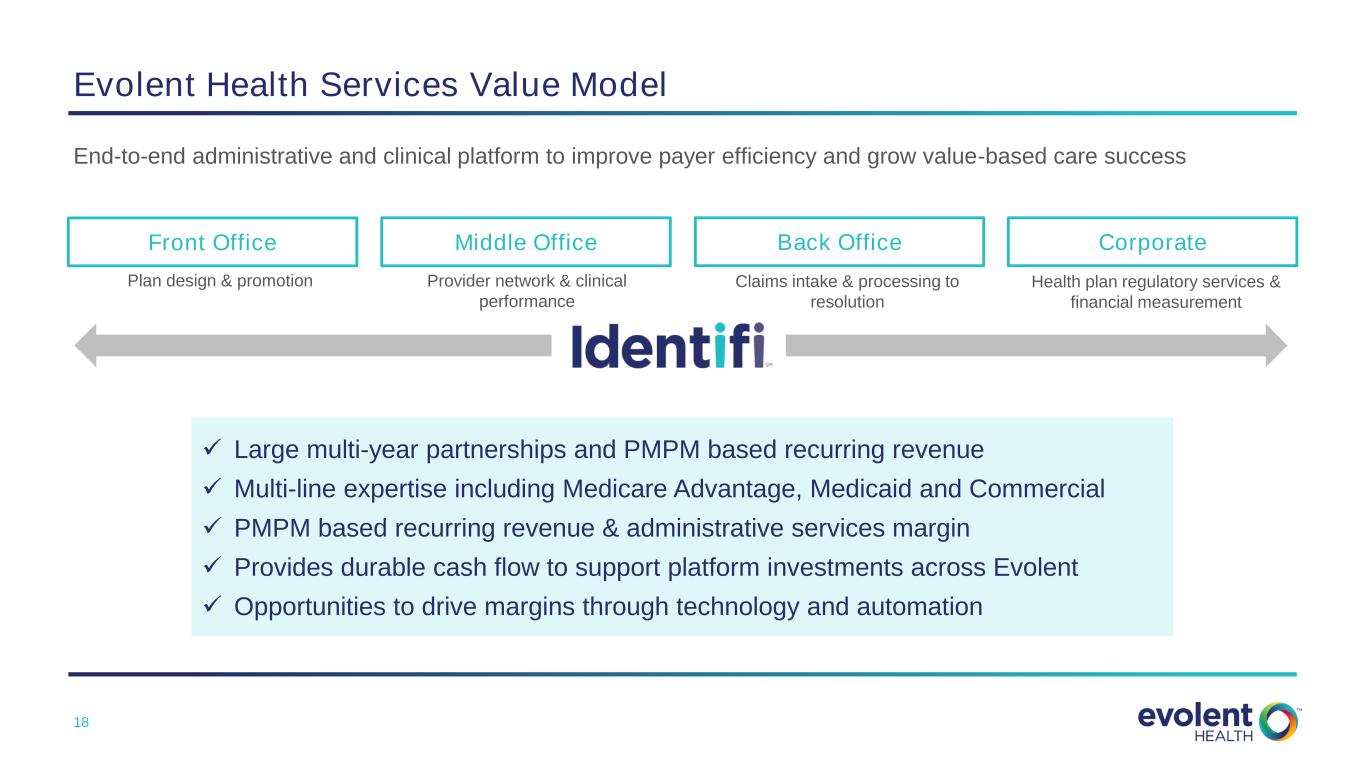
18 End-to-end administrative and clinical platform to improve payer efficiency and grow value-based care success Evolent Health Services Value Model Back Office Plan design & promotion Provider network & clinical performance Claims intake & processing to resolution Health plan regulatory services & financial measurement CorporateMiddle OfficeFront Office ✓ Large multi-year partnerships and PMPM based recurring revenue ✓ Multi-line expertise including Medicare Advantage, Medicaid and Commercial ✓ PMPM based recurring revenue & administrative services margin ✓ Provides durable cash flow to support platform investments across Evolent ✓ Opportunities to drive margins through technology and automation

19 AGENDA Investment Considerations Financial Model, Capital Allocation, and Outlook Evolent Health Overview Segment Overviews
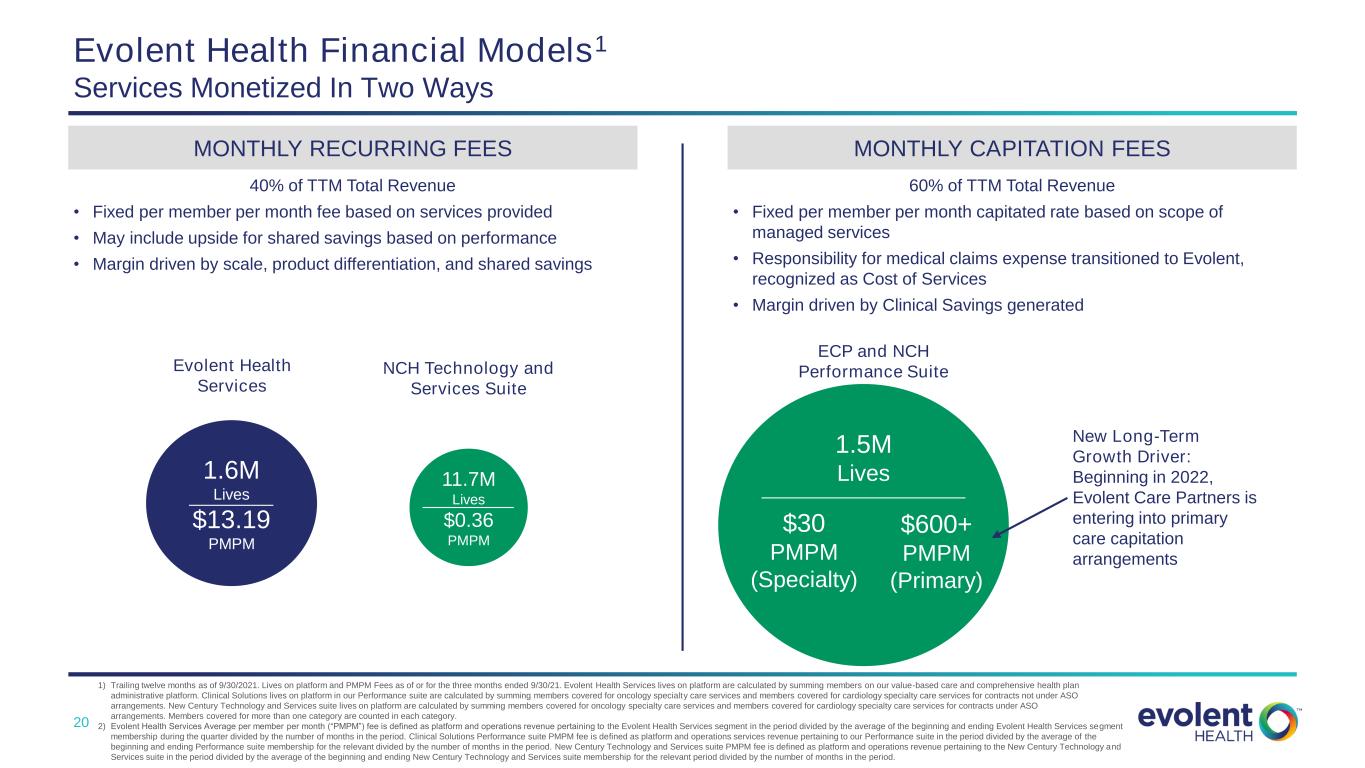
20 Evolent Health Financial Models1 Services Monetized In Two Ways MONTHLY RECURRING FEES MONTHLY CAPITATION FEES 40% of TTM Total Revenue • Fixed per member per month fee based on services provided • May include upside for shared savings based on performance • Margin driven by scale, product differentiation, and shared savings 60% of TTM Total Revenue • Fixed per member per month capitated rate based on scope of managed services • Responsibility for medical claims expense transitioned to Evolent, recognized as Cost of Services • Margin driven by Clinical Savings generated 1.6M Lives $13.19 PMPM 11.7M Lives $0.36 PMPM Evolent Health Services NCH Technology and Services Suite ECP and NCH Performance Suite New Long-Term Growth Driver: Beginning in 2022, Evolent Care Partners is entering into primary care capitation arrangements 1.5M Lives $30 PMPM (Specialty) $600+ PMPM (Primary) 1) Trailing twelve months as of 9/30/2021. Lives on platform and PMPM Fees as of or for the three months ended 9/30/21. Evolent Health Services lives on platform are calculated by summing members on our value-based care and comprehensive health plan administrative platform. Clinical Solutions lives on platform in our Performance suite are calculated by summing members covered for oncology specialty care services and members covered for cardiology specialty care services for contracts not under ASO arrangements. New Century Technology and Services suite lives on platform are calculated by summing members covered for oncology specialty care services and members covered for cardiology specialty care services for contracts under ASO arrangements. Members covered for more than one category are counted in each category. 2) Evolent Health Services Average per member per month (“PMPM”) fee is defined as platform and operations revenue pertaining to the Evolent Health Services segment in the period divided by the average of the beginning and ending Evolent Health Services segment membership during the quarter divided by the number of months in the period. Clinical Solutions Performance suite PMPM fee is defined as platform and operations services revenue pertaining to our Performance suite in the period divided by the average of the beginning and ending Performance suite membership for the relevant divided by the number of months in the period. New Century Technology and Services suite PMPM fee is defined as platform and operations revenue pertaining to the New Century Technology and Services suite in the period divided by the average of the beginning and ending New Century Technology and Services suite membership for the relevant period divided by the number of months in the period.
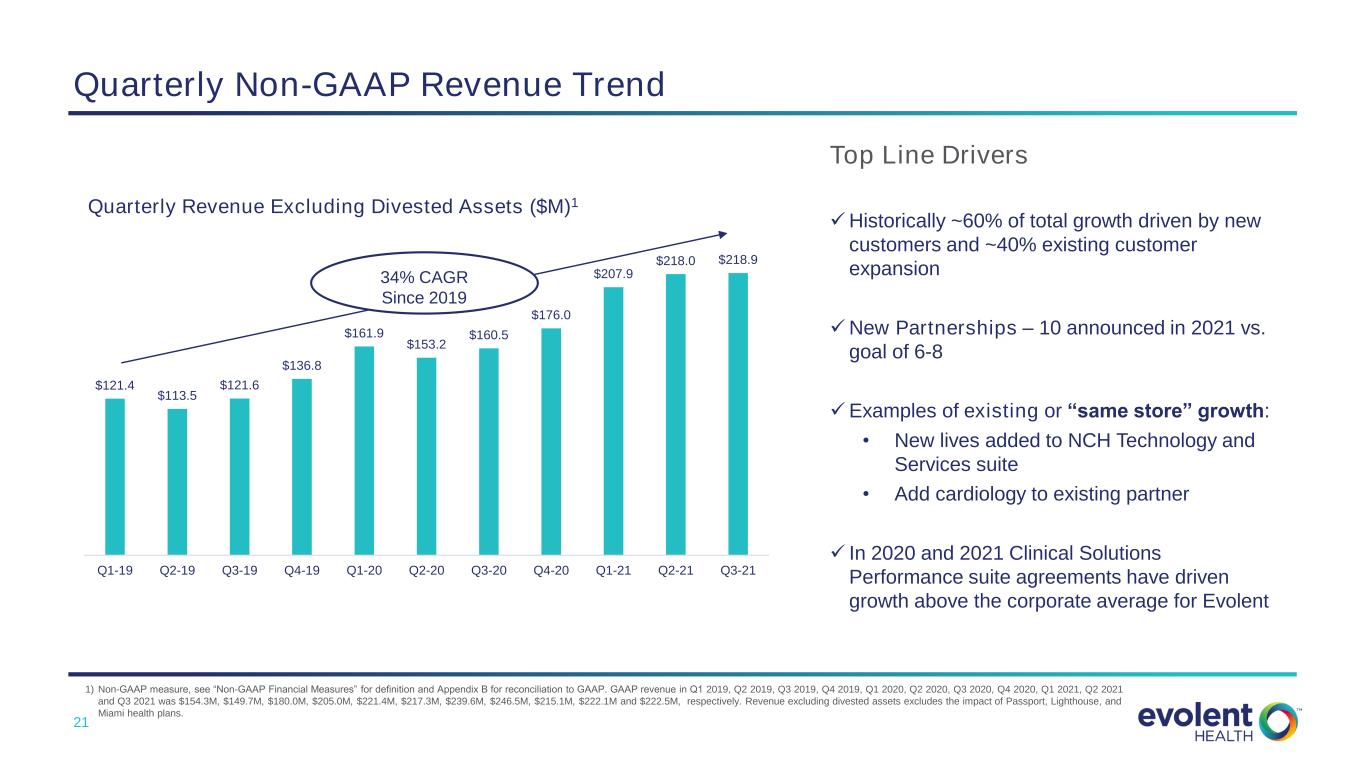
21 $121.4 $113.5 $121.6 $136.8 $161.9 $153.2 $160.5 $176.0 $207.9 $218.0 $218.9 Q1-19 Q2-19 Q3-19 Q4-19 Q1-20 Q2-20 Q3-20 Q4-20 Q1-21 Q2-21 Q3-21 Quarterly Revenue Excluding Divested Assets ($M)1 Quarterly Non-GAAP Revenue Trend Top Line Drivers ✓Historically ~60% of total growth driven by new customers and ~40% existing customer expansion ✓New Partnerships – 10 announced in 2021 vs. goal of 6-8 ✓Examples of existing or “same store” growth: • New lives added to NCH Technology and Services suite • Add cardiology to existing partner ✓ In 2020 and 2021 Clinical Solutions Performance suite agreements have driven growth above the corporate average for Evolent 1) Non-GAAP measure, see “Non-GAAP Financial Measures” for definition and Appendix B for reconciliation to GAAP. GAAP revenue in Q1 2019, Q2 2019, Q3 2019, Q4 2019, Q1 2020, Q2 2020, Q3 2020, Q4 2020, Q1 2021, Q2 2021 and Q3 2021 was $154.3M, $149.7M, $180.0M, $205.0M, $221.4M, $217.3M, $239.6M, $246.5M, $215.1M, $222.1M and $222.5M, respectively. Revenue excluding divested assets excludes the impact of Passport, Lighthouse, and Miami health plans. 34% CAGR Since 2019
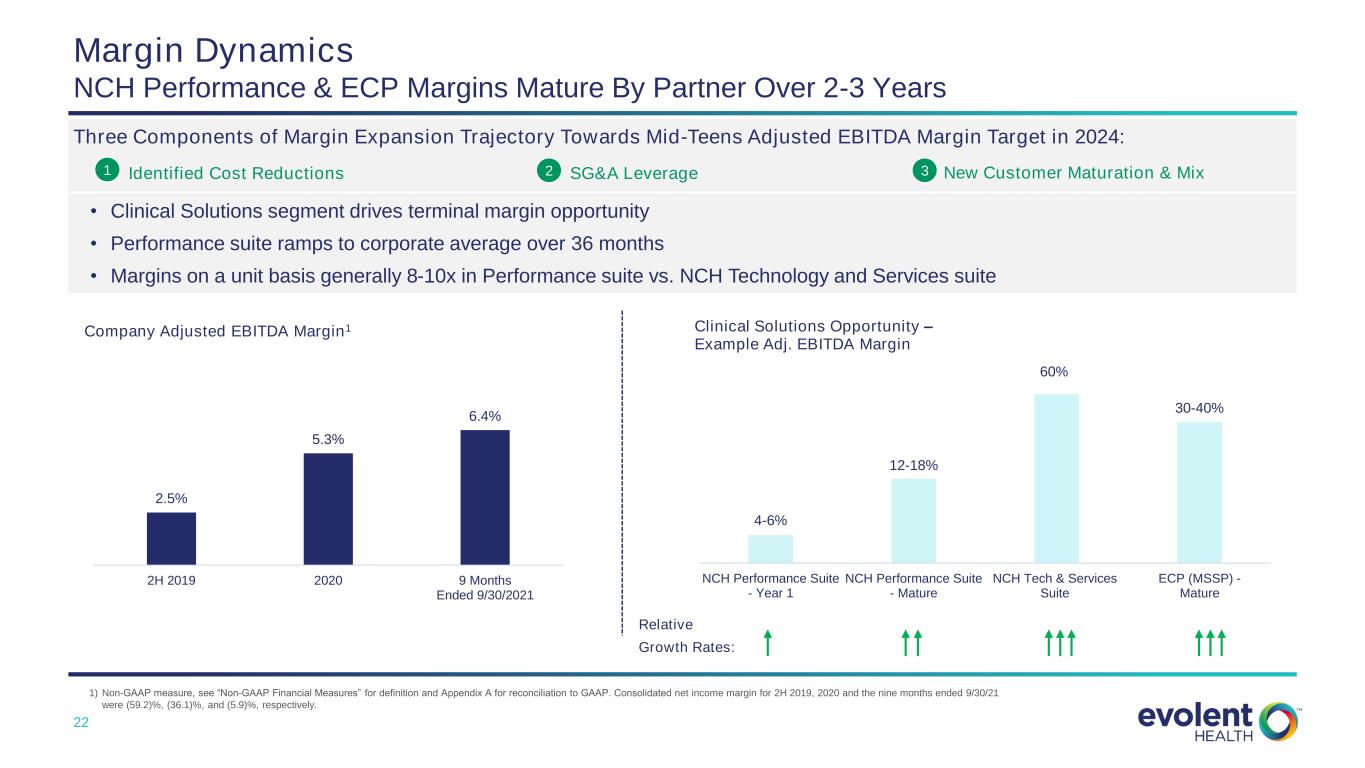
22 Margin Dynamics NCH Performance & ECP Margins Mature By Partner Over 2-3 Years 1) Non-GAAP measure, see “Non-GAAP Financial Measures” for definition and Appendix A for reconciliation to GAAP. Consolidated net income margin for 2H 2019, 2020 and the nine months ended 9/30/21 were (59.2)%, (36.1)%, and (5.9)%, respectively. • Clinical Solutions segment drives terminal margin opportunity • Performance suite ramps to corporate average over 36 months • Margins on a unit basis generally 8-10x in Performance suite vs. NCH Technology and Services suite 2.5% 5.3% 6.4% 2H 2019 2020 9 Months Ended 9/30/2021 Company Adjusted EBITDA Margin1 4-6% 12-18% 60% 30-40% NCH Performance Suite - Year 1 NCH Performance Suite - Mature NCH Tech & Services Suite ECP (MSSP) - Mature Clinical Solutions Opportunity – Example Adj. EBITDA Margin Relative Growth Rates: Three Components of Margin Expansion Trajectory Towards Mid-Teens Adjusted EBITDA Margin Target in 2024: 1 Identified Cost Reductions SG&A Leverage New Customer Maturation & Mix2 3
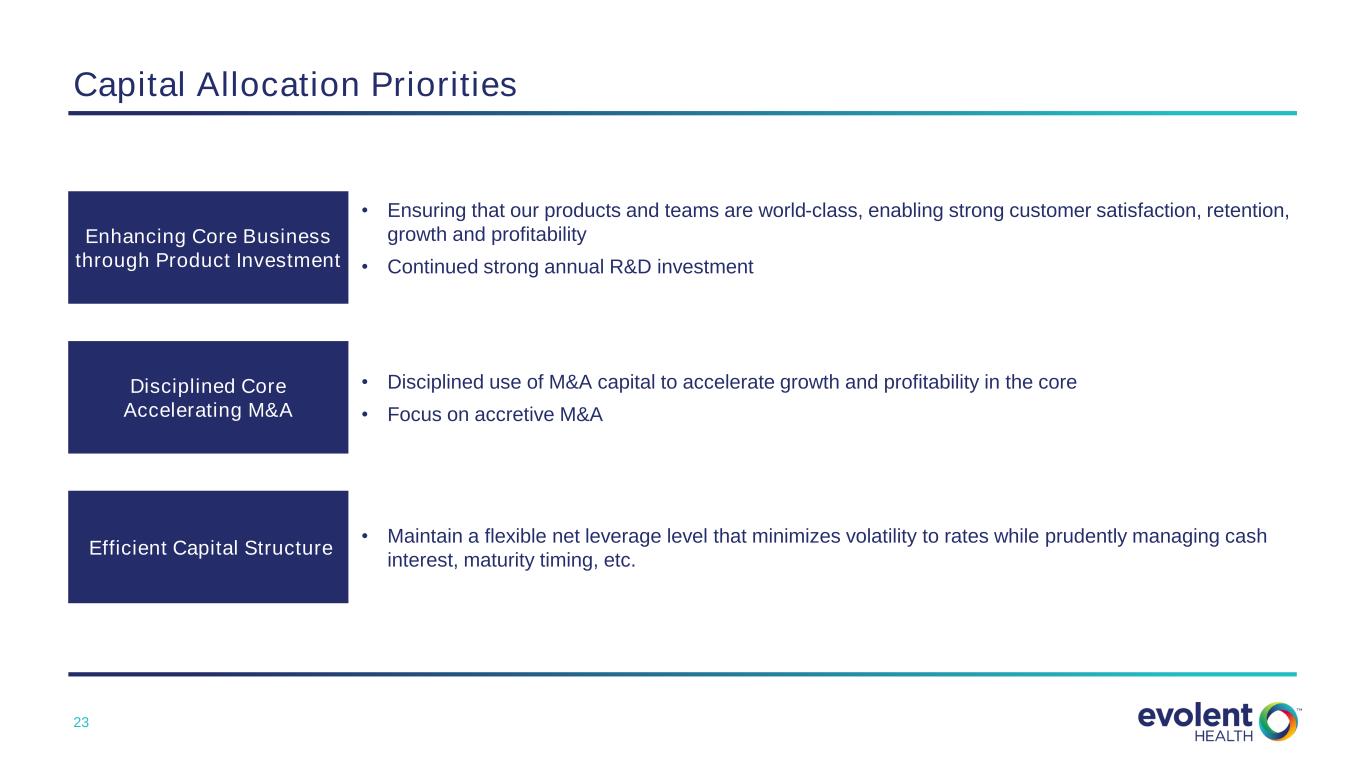
23 Capital Allocation Priorities Disciplined Core Accelerating M&A Efficient Capital Structure • Ensuring that our products and teams are world-class, enabling strong customer satisfaction, retention, growth and profitability • Continued strong annual R&D investment • Disciplined use of M&A capital to accelerate growth and profitability in the core • Focus on accretive M&A • Maintain a flexible net leverage level that minimizes volatility to rates while prudently managing cash interest, maturity timing, etc. Enhancing Core Business through Product Investment
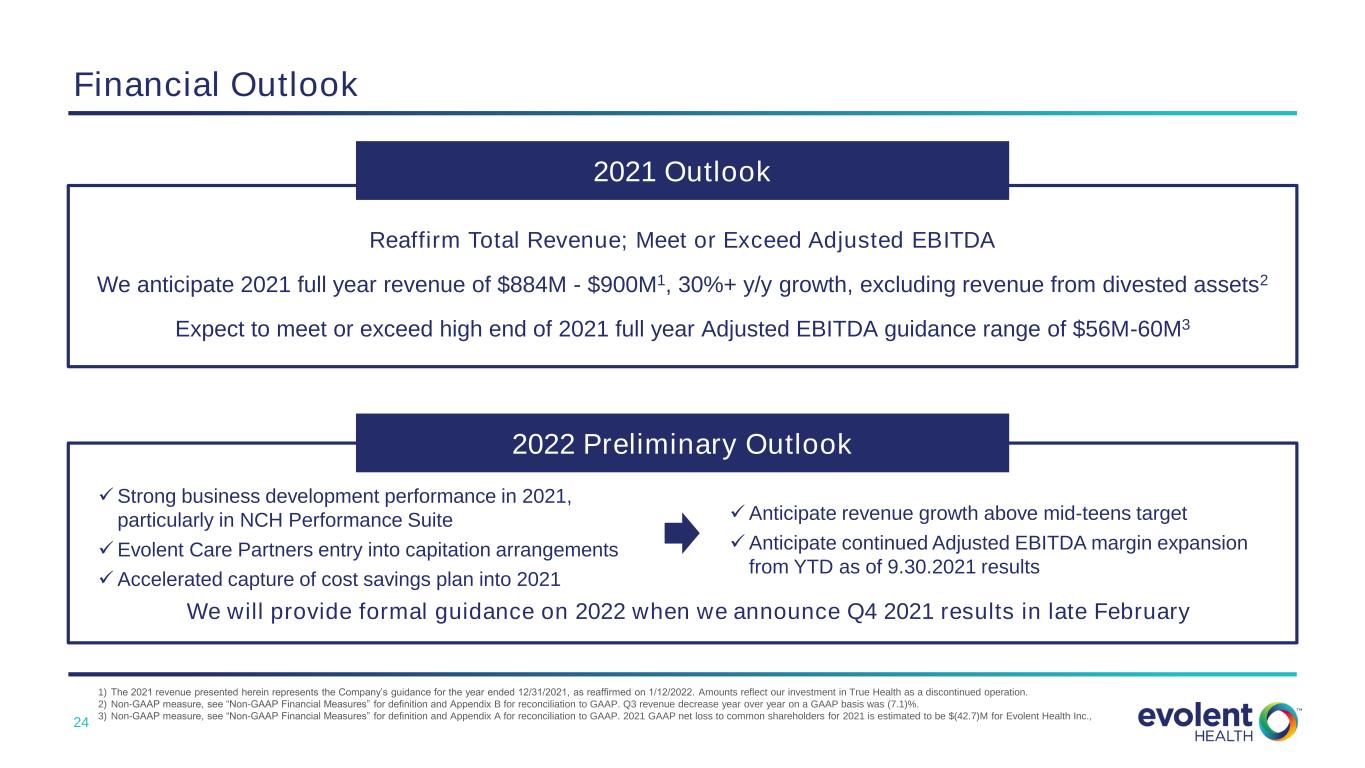
24 Financial Outlook We will provide formal guidance on 2022 when we announce Q4 2021 results in late February 2022 Preliminary Outlook 2021 Outlook Reaffirm Total Revenue; Meet or Exceed Adjusted EBITDA We anticipate 2021 full year revenue of $884M - $900M1, 30%+ y/y growth, excluding revenue from divested assets2 Expect to meet or exceed high end of 2021 full year Adjusted EBITDA guidance range of $56M-60M3 1) The 2021 revenue presented herein represents the Company’s guidance for the year ended 12/31/2021, as reaffirmed on 1/12/2022. Amounts reflect our investment in True Health as a discontinued operation. 2) Non-GAAP measure, see “Non-GAAP Financial Measures” for definition and Appendix B for reconciliation to GAAP. Q3 revenue decrease year over year on a GAAP basis was (7.1)%. 3) Non-GAAP measure, see “Non-GAAP Financial Measures” for definition and Appendix A for reconciliation to GAAP. 2021 GAAP net loss to common shareholders for 2021 is estimated to be $(42.7)M for Evolent Health Inc., ✓Strong business development performance in 2021, particularly in NCH Performance Suite ✓Evolent Care Partners entry into capitation arrangements ✓Accelerated capture of cost savings plan into 2021 ✓Anticipate revenue growth above mid-teens target ✓Anticipate continued Adjusted EBITDA margin expansion from YTD as of 9.30.2021 results

25 Execution Drives Shareholder Value Key Takeaways Efficient Capital Allocation Strong and Expanding Margins Compelling Long-Term Organic Growth Commitment to Shareholder Value

26 Appendix

27 Non-GAAP Financial Measures In addition to disclosing financial results that are determined in accordance with GAAP, we present and discuss certain non-GAAP financial measures, as supplemental measures to help investors evaluate our fundamental operational performance. Revenue Excluding Divested Assets is defined as the sum of revenue less revenue from our divested health plan assets. Management uses Revenue Excluding Divested Assets as a supplemental performance measure because it reflects our on-going operational results. The measures is useful to investors because it reflects the full view of our operational performance in line with how we generate our long-term forecasts. Available Cash is defined as cash and cash equivalents and investments determined in accordance with GAAP adjusted to exclude cash, cash equivalents and investments held at Passport Health Plan. Management uses Available Cash a supplemental performance measure as it excludes cash held by Passport that is not readily accessible for expenditures outside of the Passport corporate entity without regulatory approval from the Kentucky Department of Insurance. Net Debt is defined as the carrying value outstanding under the Company’s 2021 Notes, 2024 Notes and 2025 Notes adjusted to exclude the impact of net discounts and deferred financing costs less Available Cash. Management uses Net Debt as a supplemental performance measure because the netting of cash and cash equivalents from the principal amount of debt outstanding allows us to determine our debt repayment requirements in excess of available cash. We believe that this measure is also useful to investors because it allows further insight into the capital requirements of the Company that is comparable to other organizations in our industry and in the market in general. Net Leverage Ratio to is defined as Net Debt divided by TTM Adjusted EBITDA. Management uses Net Debt to LTM Adjusted EBITDA as a supplemental performance measure because it allows the investor to understand capital requirements compared to operating performance over time. We believe that this measure is also useful to investors because it allows further insight into the period over period operational performance in a manner that is comparable to other organizations in our industry and in the market in general. Adjusted EBITDA is defined as EBITDA (net loss attributable to common shareholders of Evolent Health, Inc. before interest income, interest expense, (provision) benefit for income taxes, depreciation and amortization expenses, adjusted to exclude impairment of equity method investees, gain on transfer of membership, loss on repayment/extinguishment of debt, goodwill impairment, gain (loss) from equity method investees, gain (loss) on disposal of assets and consolidation, changes in fair value of contingent consideration and indemnification asset, net loss attributable to non-controlling interests, purchase price adjustments, other income (expense), net, repositioning costs, stock-based compensation expense, severance costs, amortization of contract cost assets, strategy and shareholder advisory services, acquisition-related costs and gain (loss) from discontinued operations. Management uses Adjusted EBITDA as a supplemental performance measure because the removal of acquisition-related costs, one-time or non-cash items (e.g. depreciation, amortization and stock-based compensation expenses) allows us to focus on operational performance. We believe that this measure is also useful to investors because it allows further insight into the period over period operational performance in a manner that is comparable to other organizations in our industry and in the market in general. Adjusted EBITDA Margin is as defined Adjusted EBITDA divided by Revenue. Management uses Adjusted EBITDA margin as a supplemental performance measure because it allows the investor to understand operational performance compared to revenues over time. We believe that this measure is also useful to investors because it allows further insight into the period over period operational performance in a manner that is comparable to other organizations in our industry and in the market in general. These adjusted measures do not represent and should not be considered as alternatives to GAAP measurements, and our calculations thereof may not be comparable to similarly entitled measures reported by other companies. A reconciliation of these adjusted measures to their most comparable GAAP financial measures is presented in the tables below. We believe these measures are useful across time in evaluating our fundamental core operating performance.
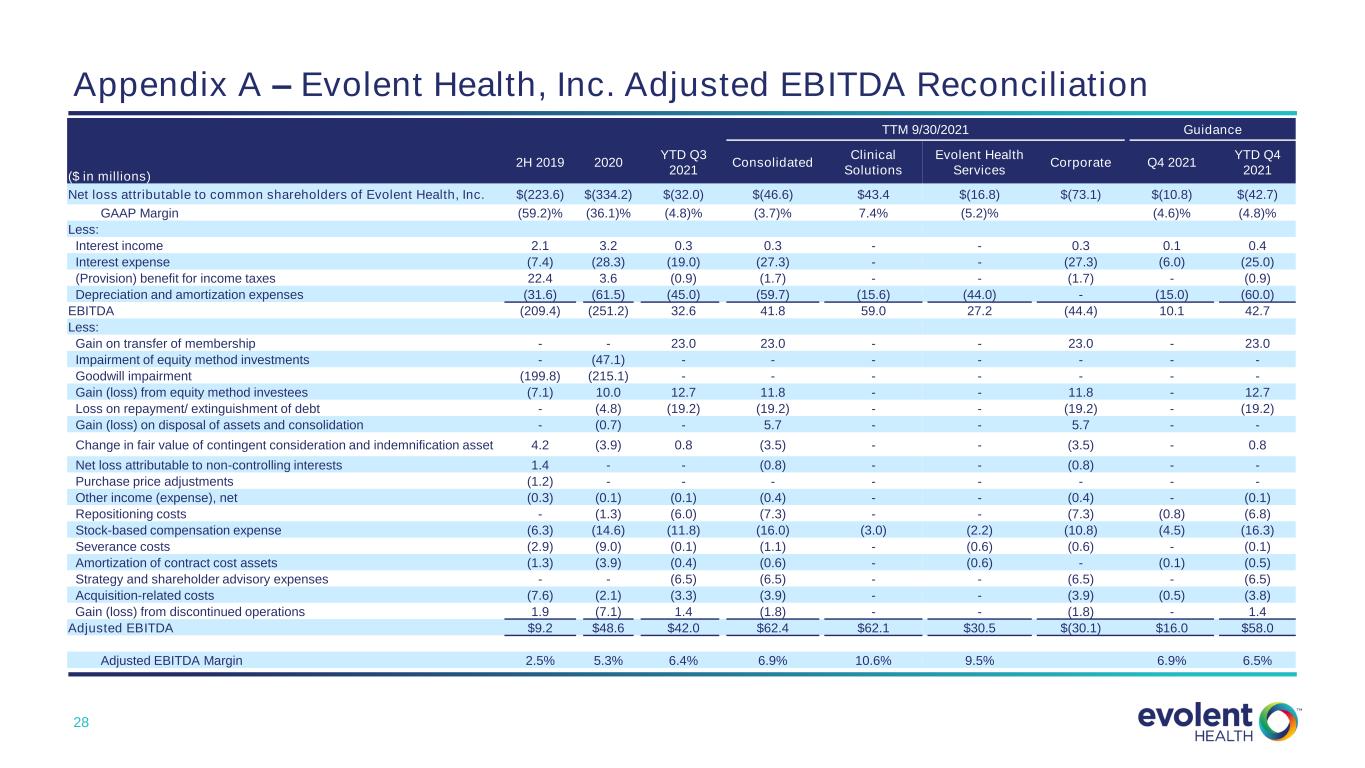
28 Appendix A – Evolent Health, Inc. Adjusted EBITDA Reconciliation TTM 9/30/2021 Guidance ($ in millions) 2H 2019 2020 YTD Q3 2021 Consolidated Clinical Solutions Evolent Health Services Corporate Q4 2021 YTD Q4 2021 Net loss attributable to common shareholders of Evolent Health, Inc. $(223.6) $(334.2) $(32.0) $(46.6) $43.4 $(16.8) $(73.1) $(10.8) $(42.7) GAAP Margin (59.2)% (36.1)% (4.8)% (3.7)% 7.4% (5.2)% (4.6)% (4.8)% Less: Interest income 2.1 3.2 0.3 0.3 - - 0.3 0.1 0.4 Interest expense (7.4) (28.3) (19.0) (27.3) - - (27.3) (6.0) (25.0) (Provision) benefit for income taxes 22.4 3.6 (0.9) (1.7) - - (1.7) - (0.9) Depreciation and amortization expenses (31.6) (61.5) (45.0) (59.7) (15.6) (44.0) - (15.0) (60.0) EBITDA (209.4) (251.2) 32.6 41.8 59.0 27.2 (44.4) 10.1 42.7 Less: Gain on transfer of membership - - 23.0 23.0 - - 23.0 - 23.0 Impairment of equity method investments - (47.1) - - - - - - - Goodwill impairment (199.8) (215.1) - - - - - - - Gain (loss) from equity method investees (7.1) 10.0 12.7 11.8 - - 11.8 - 12.7 Loss on repayment/ extinguishment of debt - (4.8) (19.2) (19.2) - - (19.2) - (19.2) Gain (loss) on disposal of assets and consolidation - (0.7) - 5.7 - - 5.7 - - Change in fair value of contingent consideration and indemnification asset 4.2 (3.9) 0.8 (3.5) - - (3.5) - 0.8 Net loss attributable to non-controlling interests 1.4 - - (0.8) - - (0.8) - - Purchase price adjustments (1.2) - - - - - - - - Other income (expense), net (0.3) (0.1) (0.1) (0.4) - - (0.4) - (0.1) Repositioning costs - (1.3) (6.0) (7.3) - - (7.3) (0.8) (6.8) Stock-based compensation expense (6.3) (14.6) (11.8) (16.0) (3.0) (2.2) (10.8) (4.5) (16.3) Severance costs (2.9) (9.0) (0.1) (1.1) - (0.6) (0.6) - (0.1) Amortization of contract cost assets (1.3) (3.9) (0.4) (0.6) - (0.6) - (0.1) (0.5) Strategy and shareholder advisory expenses - - (6.5) (6.5) - - (6.5) - (6.5) Acquisition-related costs (7.6) (2.1) (3.3) (3.9) - - (3.9) (0.5) (3.8) Gain (loss) from discontinued operations 1.9 (7.1) 1.4 (1.8) - - (1.8) - 1.4 Adjusted EBITDA $9.2 $48.6 $42.0 $62.4 $62.1 $30.5 $(30.1) $16.0 $58.0 Adjusted EBITDA Margin 2.5% 5.3% 6.4% 6.9% 10.6% 9.5% 6.9% 6.5%
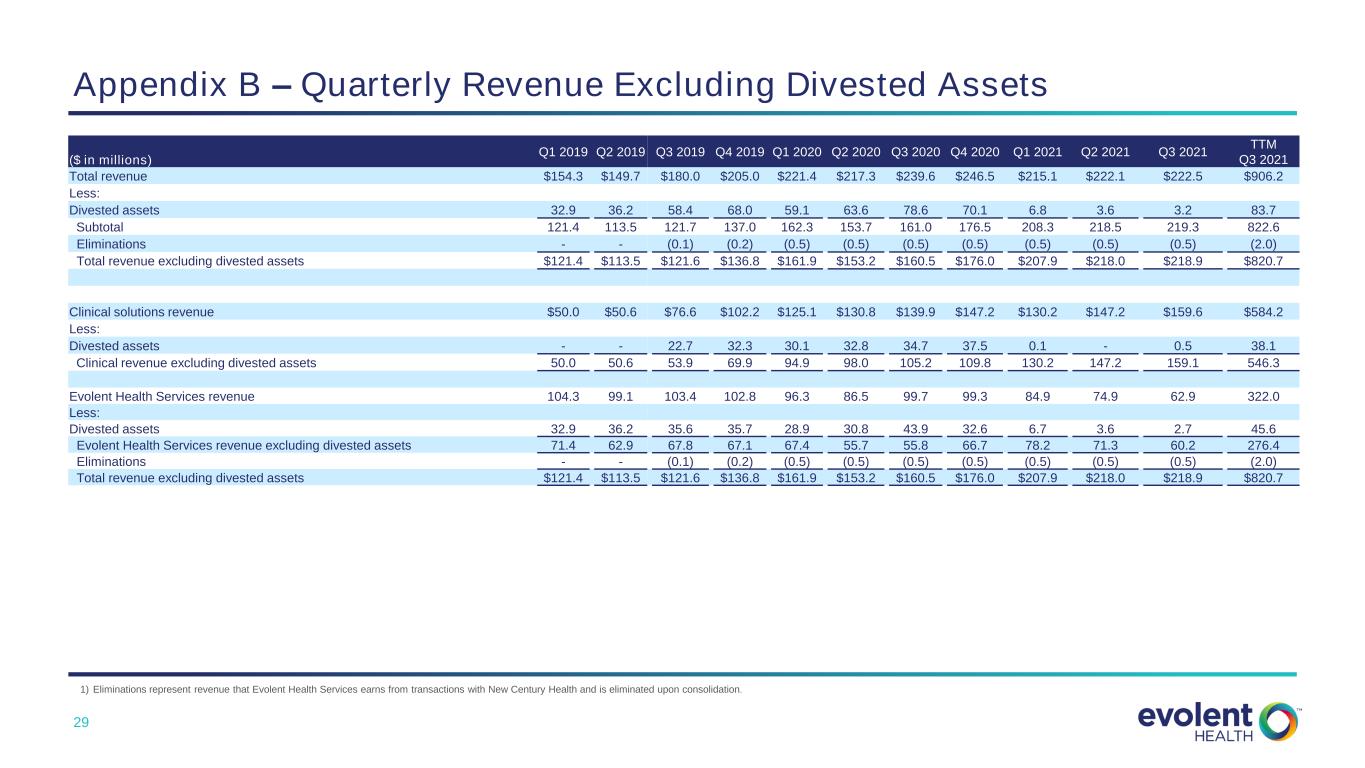
29 Appendix B – Quarterly Revenue Excluding Divested Assets ($ in millions) Q1 2019 Q2 2019 Q3 2019 Q4 2019 Q1 2020 Q2 2020 Q3 2020 Q4 2020 Q1 2021 Q2 2021 Q3 2021 TTM Q3 2021 Total revenue $154.3 $149.7 $180.0 $205.0 $221.4 $217.3 $239.6 $246.5 $215.1 $222.1 $222.5 $906.2 Less: Divested assets 32.9 36.2 58.4 68.0 59.1 63.6 78.6 70.1 6.8 3.6 3.2 83.7 Subtotal 121.4 113.5 121.7 137.0 162.3 153.7 161.0 176.5 208.3 218.5 219.3 822.6 Eliminations - - (0.1) (0.2) (0.5) (0.5) (0.5) (0.5) (0.5) (0.5) (0.5) (2.0) Total revenue excluding divested assets $121.4 $113.5 $121.6 $136.8 $161.9 $153.2 $160.5 $176.0 $207.9 $218.0 $218.9 $820.7 Clinical solutions revenue $50.0 $50.6 $76.6 $102.2 $125.1 $130.8 $139.9 $147.2 $130.2 $147.2 $159.6 $584.2 Less: Divested assets - - 22.7 32.3 30.1 32.8 34.7 37.5 0.1 - 0.5 38.1 Clinical revenue excluding divested assets 50.0 50.6 53.9 69.9 94.9 98.0 105.2 109.8 130.2 147.2 159.1 546.3 Evolent Health Services revenue 104.3 99.1 103.4 102.8 96.3 86.5 99.7 99.3 84.9 74.9 62.9 322.0 Less: Divested assets 32.9 36.2 35.6 35.7 28.9 30.8 43.9 32.6 6.7 3.6 2.7 45.6 Evolent Health Services revenue excluding divested assets 71.4 62.9 67.8 67.1 67.4 55.7 55.8 66.7 78.2 71.3 60.2 276.4 Eliminations - - (0.1) (0.2) (0.5) (0.5) (0.5) (0.5) (0.5) (0.5) (0.5) (2.0) Total revenue excluding divested assets $121.4 $113.5 $121.6 $136.8 $161.9 $153.2 $160.5 $176.0 $207.9 $218.0 $218.9 $820.7 1) Eliminations represent revenue that Evolent Health Services earns from transactions with New Century Health and is eliminated upon consolidation.
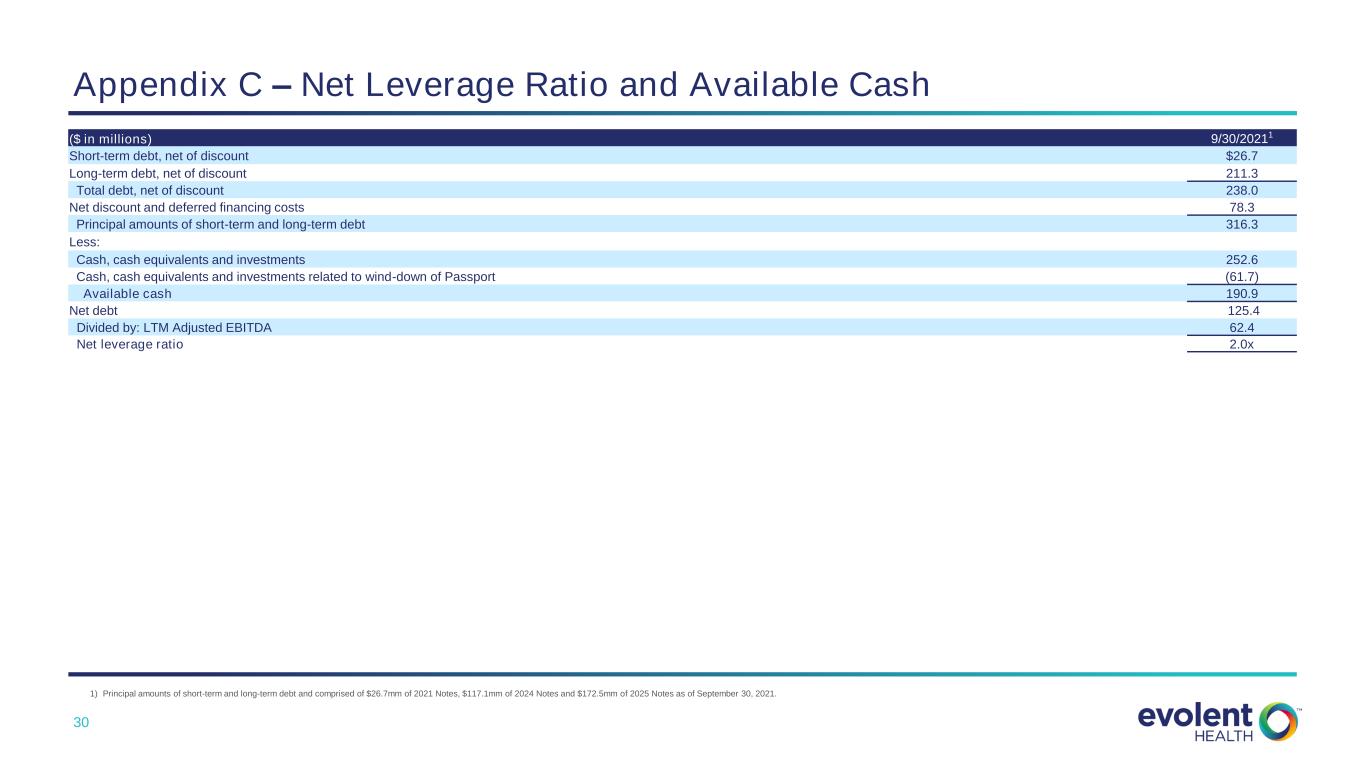
30 Appendix C – Net Leverage Ratio and Available Cash ($ in millions) 9/30/20211 Short-term debt, net of discount $26.7 Long-term debt, net of discount 211.3 Total debt, net of discount 238.0 Net discount and deferred financing costs 78.3 Principal amounts of short-term and long-term debt 316.3 Less: Cash, cash equivalents and investments 252.6 Cash, cash equivalents and investments related to wind-down of Passport (61.7) Available cash 190.9 Net debt 125.4 Divided by: LTM Adjusted EBITDA 62.4 Net leverage ratio 2.0x 1) Principal amounts of short-term and long-term debt and comprised of $26.7mm of 2021 Notes, $117.1mm of 2024 Notes and $172.5mm of 2025 Notes as of September 30, 2021.


