
1 41st Annual J.P. Morgan Healthcare Conference Investor Presentation January 11, 2023 Exhibit 99.1
2 Safe Harbor Statement Certain statements, including but not limited to estimates of Adjusted EBITDA, earnings growth, expected cost synergies and net leverage ratios, made in this presentation and in other written or oral statements made by us or on our behalf are “forward-looking statements” within the meaning of the Private Securities Litigation Reform Act of 1995 (“PSLRA”). A forward-looking statement is a statement that is not a historical fact and, without limitation, includes any statement that may predict, forecast, indicate or imply future results, performance or achievements, and may contain words like: “believe,” “anticipate,” “expect,” “estimate,” “aim,” “predict,” “potential,” “continue,” “plan,” “project,” “will,” “should,” “shall,” “may,” “might” and other words or phrases with similar meaning in connection with a discussion of future operating or financial performance. In particular, these include statements relating to our guidance and business outlook and future performance, leverage or financial results, including of NIA, and our strategy. We claim the protection afforded by the safe harbor for forward-looking statements provided by the PSLRA. These statements are only predictions based on our current expectations and projections about future events. Forward-looking statements involve risks and uncertainties that may cause actual results, level of activity, performance or achievements to differ materially from the results contained in the forward-looking statements. Risks and uncertainties that may cause actual results to vary materially, some of which are described within the forward-looking statements, include, among others: risks and uncertainties related to the possibility that the closing of the NIA transaction may be delayed or may not occur, and the risk that litigation or other matters could affect the closing, the significant portion of revenue we derive from our largest partners, and the potential loss, non-renewal, termination or renegotiation of our relationship or contract with any significant partner, or multiple partners in the aggregate; evolution in the market for value-based care; uncertainty in the health care regulatory framework, including the potential impact of policy changes; our ability to offer new and innovative products and services; risks related to completed and future acquisitions, investments, alliances and joint ventures, divert management resources, or result in unanticipated costs or dilute our stockholders; the financial benefits we expect to receive as a result of the sale of certain assets of Passport may not be realized; the growth and success of our partners, which is difficult to predict and is subject to factors outside of our control, including governmental funding reductions and other policy changes, enrollment numbers for our partners’ plans, premium pricing reductions, selection bias in at-risk membership and the ability to control and, if necessary, reduce health care costs; risks relating to our ability to maintain profitability for our total cost of care and New Century Health’s performance-based contracts and products, including capitation and risk-bearing contracts; our ability to effectively manage our growth and maintain an efficient cost structure, and to successfully implement cost cutting measures; changes in general economic conditions nationally and regionally in our markets, including inflation and economic and business conditions and the impact thereof on the economy resulting from the COVID-19 pandemic and other public health emergencies our ability to recover the significant upfront costs in our partner relationships; our ability to attract new partners and successfully capture new growth opportunities; the increasing number of risk-sharing arrangements we enter into with our partners; our ability to estimate the size of our target markets; our ability to maintain and enhance our reputation and brand recognition; consolidation in the health care industry; competition which could limit our ability to maintain or expand market share within our industry; risks related to governmental payer audits and actions, including whistleblower claims; our ability to partner with providers due to exclusivity provisions in our contracts; risks related to our offshore operations; our ability to contain health care costs, implement increases in premium rates on a timely basis, maintain adequate reserves for policy benefits or maintain cost effective provider agreements; our dependency on our key personnel, and our ability to attract, hire, integrate and retain key personnel; the impact of additional goodwill and intangible asset impairments on our results of operations; our indebtedness, our ability to service our indebtedness, and our ability to obtain additional financing; our ability to achieve profitability in the future; the impact of litigation, including the ongoing class action lawsuit; material weaknesses in the future may impact our ability to conclude that our internal control over financial reporting is not effective and we may be unable to produce timely and accurate financial statements; restrictions and penalties as a result of privacy and data protection laws; data loss or corruption due to failures or errors in our systems and service disruptions at our data centers; restrictions and penalties as a result of privacy and data protection laws; adequate protection of our intellectual property, including trademarks; any alleged infringement, misappropriation or violation of third-party proprietary rights; our use of “open source” software; our ability to protect the confidentiality of our trade secrets, know-how and other proprietary information; our reliance on third parties and licensed technologies; our ability to use, disclose, de-identify or license data and to integrate third-party technologies; our reliance on Internet infrastructure, bandwidth providers, data center providers, other third parties and our own systems for providing services to our partners; our reliance on third-party vendors to host and maintain our technology platform; our obligations to make payments to certain of our pre-IPO investors for certain tax benefits we may claim in the future; our ability to utilize benefits under the tax receivables agreement described herein; our obligations to make payments under the tax receivables agreement that may be accelerated or may exceed the tax benefits we realize; the terms of agreements between us and certain of our pre-IPO investors; the conditional conversion features of the 2024 and 2025 convertible notes, which, if triggered, could require us to settle the 2024 or 2025 convertible notes in cash; the potential volatility of our Class A common stock price; the potential decline of our Class A common stock price if a substantial number of shares are sold or become available for sale; provisions in our second amended and restated certificate of incorporation and third amended and restated by-laws and provisions of Delaware law that discourage or prevent strategic transactions, including a takeover of us; the ability of certain of our investors to compete with us without restrictions; provisions in our second amended and restated certificate of incorporation which could limit our stockholders’ ability to obtain a favorable judicial forum for disputes with us or our directors, officers or employees; and our intention not to pay cash dividends on our Class A common stock.

3 Safe Harbor Statement - continued The risks included here are not exhaustive. Although we believe the expectations reflected in the forward-looking statements are reasonable, we cannot guarantee future results, level of activity, performance or achievements. Our Annual Report on Form 10-K for the year ended December 31, 2021 (the "2021 Form 10-K") subsequent quarterly reports on Form 10-Q and other documents filed with the SEC include additional factors that could affect our businesses and financial performance. Moreover, we operate in a rapidly changing and competitive environment. New risk factors emerge from time to time, and it is not possible for management to predict all such risk factors. Further, it is not possible to assess the effect of all risk factors on our businesses or the extent to which any factor, or combination of factors, may cause actual results to differ materially from those contained in any forward-looking statements. Given these risks and uncertainties, investors should not place undue reliance on forward-looking statements as a prediction of actual results. In addition, we disclaim any obligation to update any forward-looking statements to reflect events or circumstances that occur after the date of this presentation. This presentation is for informational purposes only and does not constitute an offer to sell or a solicitation of an offer to purchase any securities of any nature whatsoever, and it may not be relied upon in connection with the purchase of securities. The contents of this presentation do not constitute legal, tax or business advice. Anyone reading this presentation should seek advice based on their circumstances from independent legal, tax and business advisors. Because the Company's financial statements for the year ended December 31, 2022 have not been finalized or audited, preliminary statements regarding the Company's estimated full-year revenue and Adjusted EBITDA are subject to change and the Company's actual results as of the end of this period may differ materially from these preliminary statements. Accordingly, you should not place undue reliance on these statements.

4 Year in Review and Drivers for 2023 Evolent Health Overview AGENDA Investment Considerations

5 Evolent Health Mission - Driving Better Outcomes Across Healthcare Patients Health PlansProviders Our User Selected Customers Our Customer Our Motivation Less Friction. More Care. Higher Quality. Lower Costs. Better Treatment. Better Health. What We Do: Evolent supports health plans and risk-taking providers with clinical technology and services that seek to improve patient outcomes and lower costs for patients with complex medical specialties
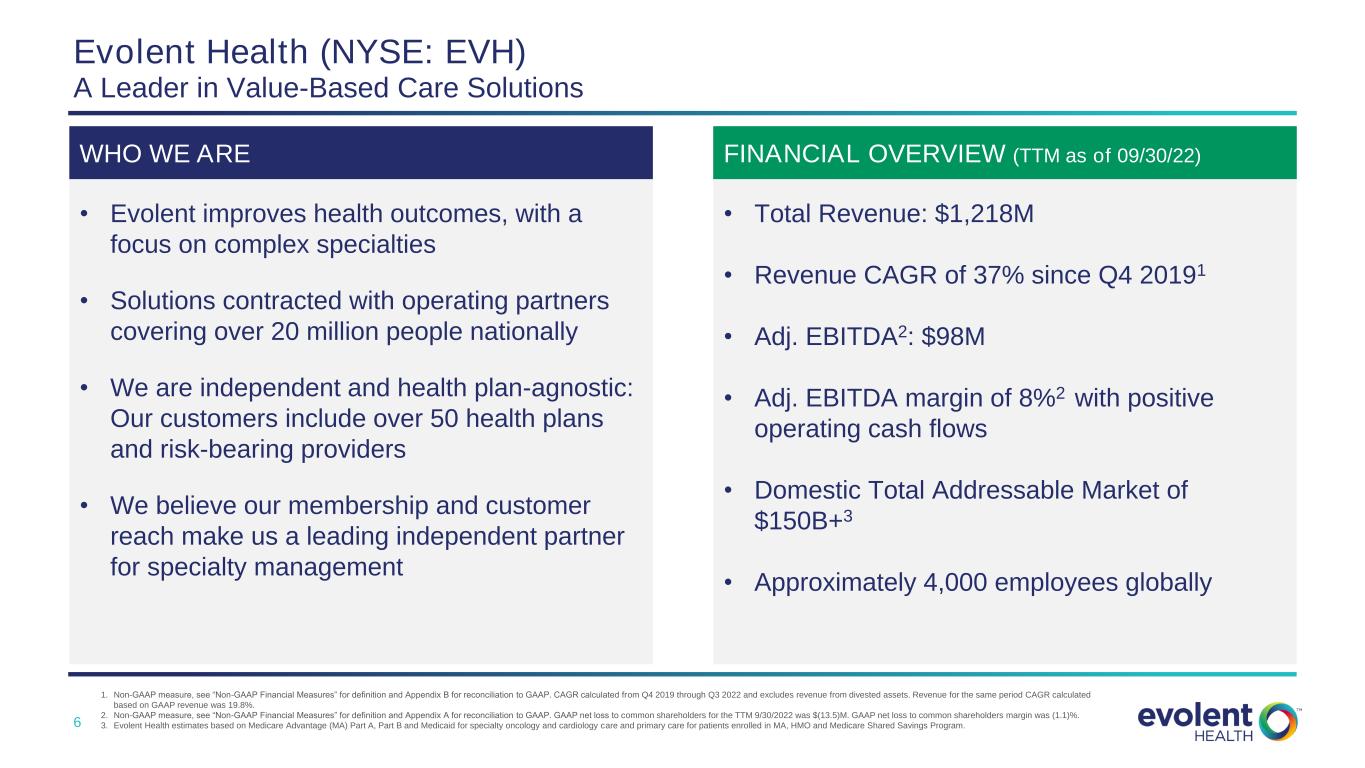
6 FINANCIAL OVERVIEW (TTM as of 09/30/22)WHO WE ARE • Evolent improves health outcomes, with a focus on complex specialties • Solutions contracted with operating partners covering over 20 million people nationally • We are independent and health plan-agnostic: Our customers include over 50 health plans and risk-bearing providers • We believe our membership and customer reach make us a leading independent partner for specialty management Evolent Health (NYSE: EVH) A Leader in Value-Based Care Solutions 1. Non-GAAP measure, see “Non-GAAP Financial Measures” for definition and Appendix B for reconciliation to GAAP. CAGR calculated from Q4 2019 through Q3 2022 and excludes revenue from divested assets. Revenue for the same period CAGR calculated based on GAAP revenue was 19.8%. 2. Non-GAAP measure, see “Non-GAAP Financial Measures” for definition and Appendix A for reconciliation to GAAP. GAAP net loss to common shareholders for the TTM 9/30/2022 was $(13.5)M. GAAP net loss to common shareholders margin was (1.1)%. 3. Evolent Health estimates based on Medicare Advantage (MA) Part A, Part B and Medicaid for specialty oncology and cardiology care and primary care for patients enrolled in MA, HMO and Medicare Shared Savings Program. • Total Revenue: $1,218M • Revenue CAGR of 37% since Q4 20191 • Adj. EBITDA2: $98M • Adj. EBITDA margin of 8%2 with positive operating cash flows • Domestic Total Addressable Market of $150B+3 • Approximately 4,000 employees globally

7 Comprehensive Service Offerings Oncology Cardiology Physical Medicine* Radiology* Genetic Testing* Advance Care Planning Complex Care (aka Evolent Care Partners) * Denotes specialty added or expanded through pending acquisition of NIA / Magellan Specialty 1 2 3 4 Depth of offering: Advanced clinical evidence and pathways intended to drive better outcomes Breadth of offering: EVH solutions cover more than 40% of total healthcare spend, providing simpler administration for health plan partner Technology can drive better provider experience: Portal “built by clinicians for clinicians” simplifies and automates the approval process Independence: Evolent is not a health plan Why do Health Plans Partner with Evolent Health? Administrative and Technology Platform (Evolent Health Services) Note: Clinical and Administrative revenue percentages based on Trailing Twelve Months ended September 30, 2022. Musculo- skeletal* Clinical Segment 70% of Revenue and Expected to Expand Admin Segment 30% of Revenue
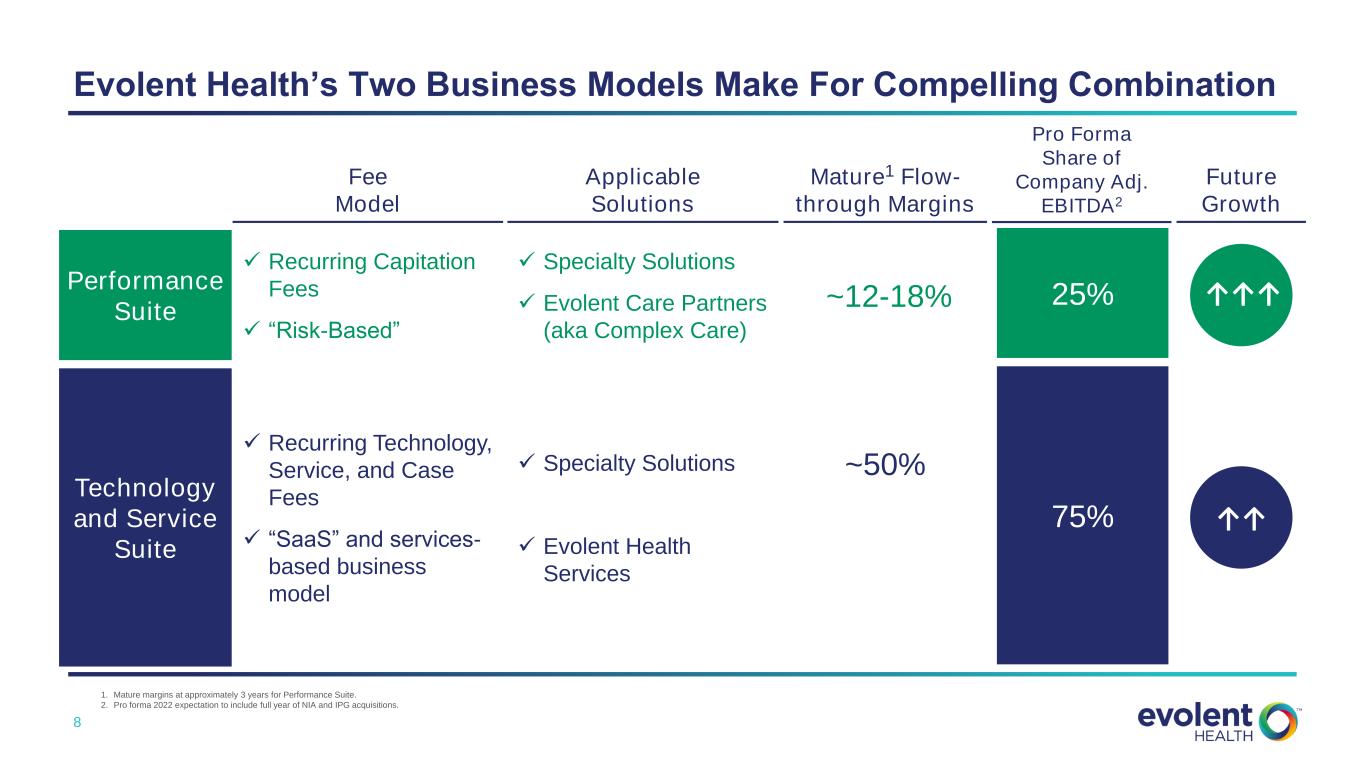
8 Evolent Health’s Two Business Models Make For Compelling Combination Performance Suite Technology and Service Suite Fee Model Applicable Solutions Mature1 Flow- through Margins Pro Forma Share of Company Adj. EBITDA2 Future Growth ✓ Recurring Capitation Fees ✓ “Risk-Based” ✓ Recurring Technology, Service, and Case Fees ✓ “SaaS” and services- based business model ✓ Specialty Solutions ✓ Evolent Care Partners (aka Complex Care) ✓ Specialty Solutions ✓ Evolent Health Services ~12-18% ~50% 25% 75% ↑↑↑ ↑↑ 1. Mature margins at approximately 3 years for Performance Suite. 2. Pro forma 2022 expectation to include full year of NIA and IPG acquisitions.

9 Year in Review and Drivers for 2023 Evolent Health Overview AGENDA Investment Considerations

10 Why Evolent Health? Investment Considerations Execution Drives Shareholder Value Efficient Capital Allocation Strong and Expanding Margins Compelling Long-Term Organic Growth Commitment to Shareholder Value

11 Investment Considerations Approximately 37% Revenue CAGR1 Since Q4 2019 • 2022 outlook: $1.33B-$1.35B of total revenue • Revenue growth driven by new customer additions and growth with existing customers • Average revenue renewal rate of approximately 110% since 20192 • Significant expansion opportunity in current partner base • PMPM revenue model includes long-standing contracts, resulting in revenue visibility and consistency Compelling Long-Term Organic Growth 1. CAGR calculated from Q4 2019 through Q3 2022 and excludes revenue from divested assets. 2. Revenue renewal rate represents current year revenue from prior year customers divided by total prior year revenue.
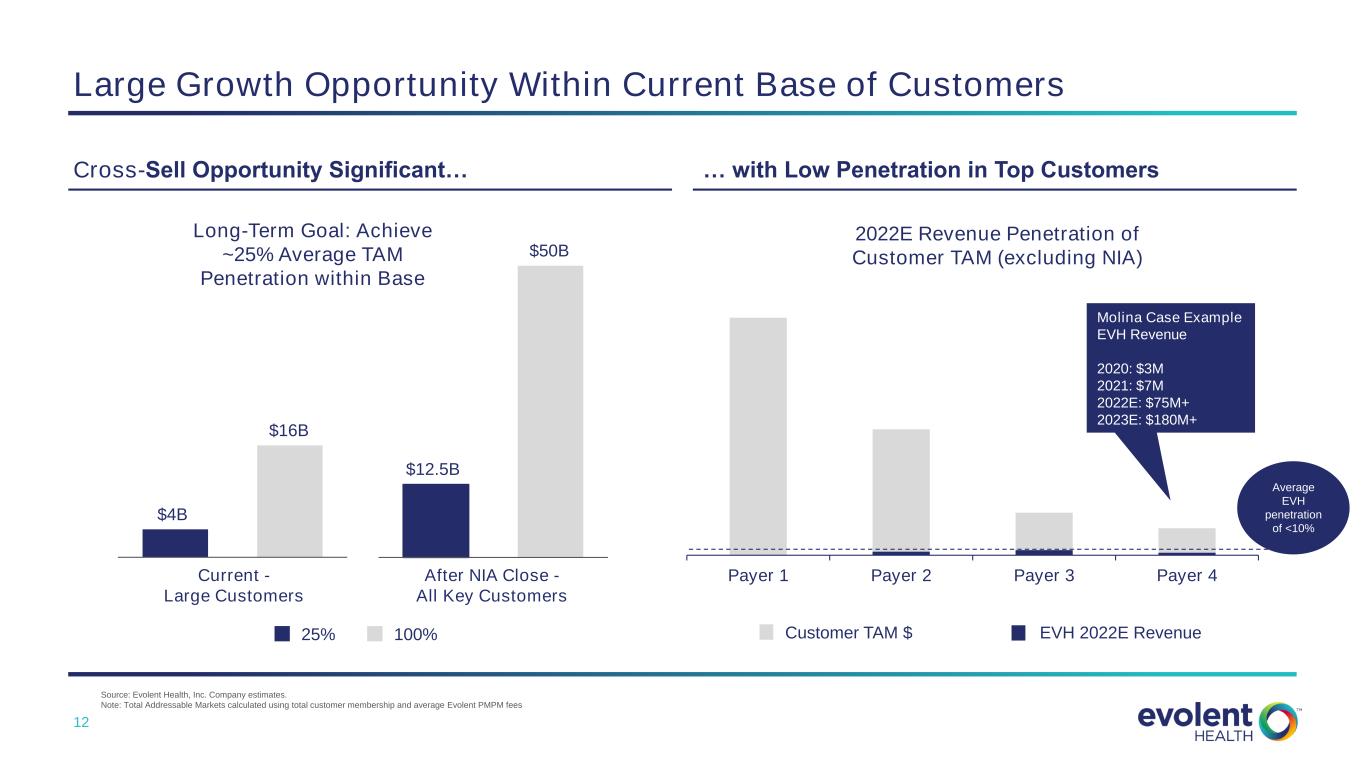
12 Large Growth Opportunity Within Current Base of Customers Source: Evolent Health, Inc. Company estimates. Note: Total Addressable Markets calculated using total customer membership and average Evolent PMPM fees Cross-Sell Opportunity Significant… … with Low Penetration in Top Customers $4B $16B $4B $16B $12.5B $50B Current - Large Customers After NIA Close - All Key Customers Payer 1 Payer 2 Payer 3 Payer 4 $75 2022E Revenue Penetration of Customer TAM (excluding NIA) 25% 100% Long-Term Goal: Achieve ~25% Average TAM Penetration within Base Customer TAM $ EVH 2022E Revenue Average EVH penetration of <10% Molina Case Example EVH Revenue 2020: $3M 2021: $7M 2022E: $75M+ 2023E: $180M+
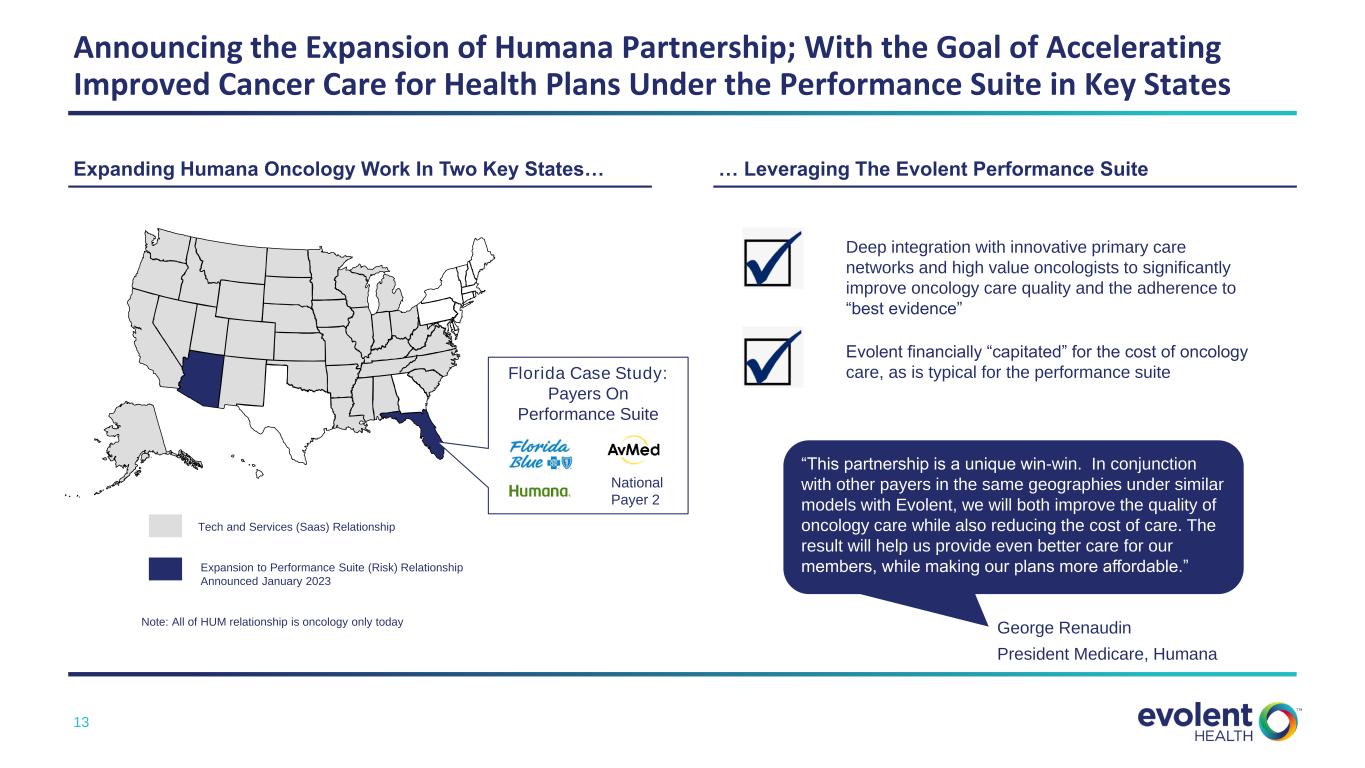
13 Announcing the Expansion of Humana Partnership; With the Goal of Accelerating Improved Cancer Care for Health Plans Under the Performance Suite in Key States Tech and Services (Saas) Relationship Expansion to Performance Suite (Risk) Relationship Announced January 2023 Expanding Humana Oncology Work In Two Key States… … Leveraging The Evolent Performance Suite Deep integration with innovative primary care networks and high value oncologists to significantly improve oncology care quality and the adherence to “best evidence” Note: All of HUM relationship is oncology only today Evolent financially “capitated” for the cost of oncology care, as is typical for the performance suite “This partnership is a unique win-win. In conjunction with other payers in the same geographies under similar models with Evolent, we will both improve the quality of oncology care while also reducing the cost of care. The result will help us provide even better care for our members, while making our plans more affordable.” George Renaudin President Medicare, Humana Florida Case Study: Payers On Performance Suite National Payer 2
14 Investment Considerations Mix Shift, Scale, Operating Leverage Drive Margin Expansion • Reiterating 2022 outlook: $98-$103M of Adjusted EBITDA, implying a 7.4% Adjusted EBITDA margin at the midpoint1 • Adjusted EBITDA and cash flow positive with multiple opportunities for growth and expansion • Mix shift to full risk performance suite in oncology and cardiology drives opportunity for growth in margins • Margin growth driven primarily by volume, mix and lengthening partner tenure in Clinical Solutions Strong and Expanding Margins 1. Non-GAAP measure, see “Non-GAAP Financial Measures” for definition and Appendix A for reconciliation to Adjusted EBITDA for 2022. GAAP net loss to common shareholders for the 2022 was $(13.3)M. GAAP net loss to common shareholders margin was (1.0)%
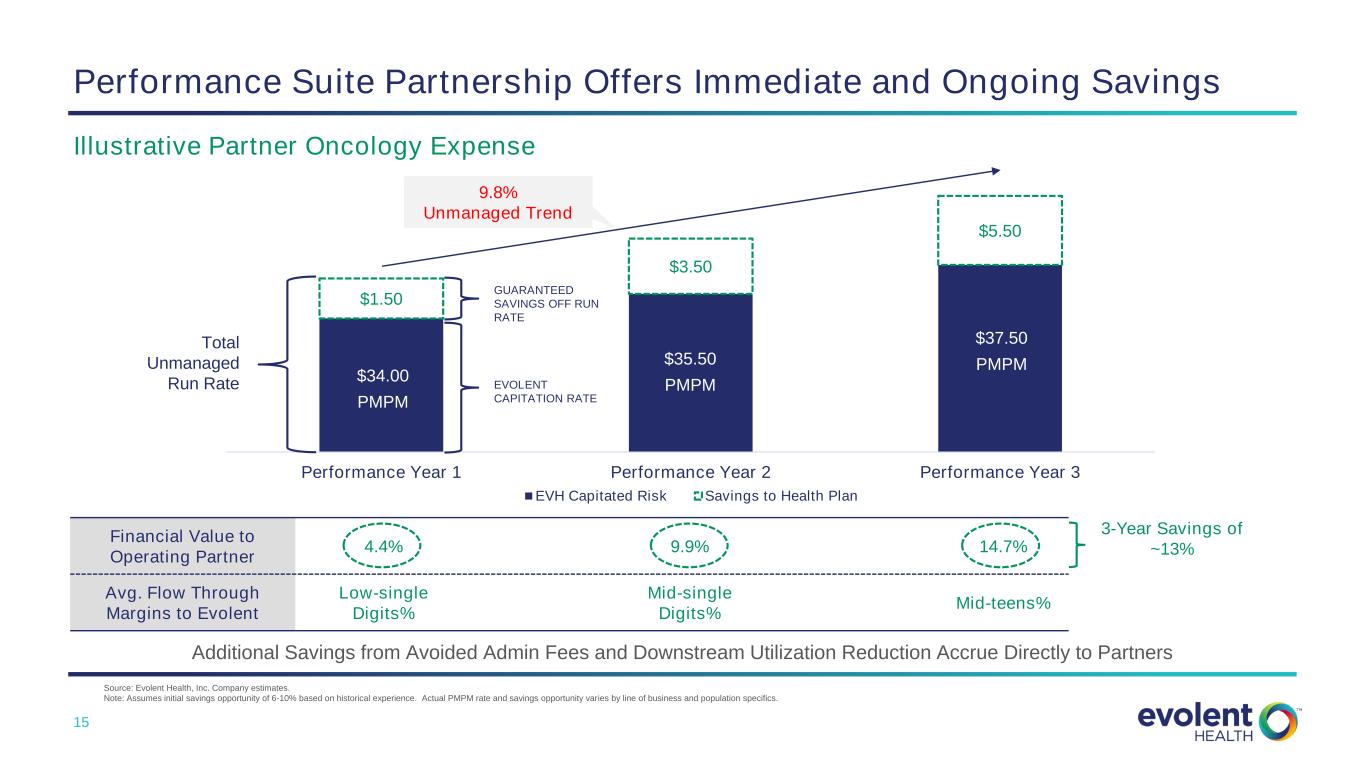
15 Performance Suite Partnership Offers Immediate and Ongoing Savings Source: Evolent Health, Inc. Company estimates. Note: Assumes initial savings opportunity of 6-10% based on historical experience. Actual PMPM rate and savings opportunity varies by line of business and population specifics. Additional Savings from Avoided Admin Fees and Downstream Utilization Reduction Accrue Directly to Partners $1.50 $3.50 $5.50 Performance Year 1 Performance Year 2 Performance Year 3 EVH Capitated Risk Savings to Health Plan GUARANTEED SAVINGS OFF RUN RATE EVOLENT CAPITATION RATE $34.00 PMPM Total Unmanaged Run Rate 9.8% Unmanaged Trend Financial Value to Operating Partner 4.4% 9.9% 14.7% Avg. Flow Through Margins to Evolent Low-single Digits% Mid-single Digits% Mid-teens% 3-Year Savings of ~13% $35.50 PMPM $37.50 PMPM Illustrative Partner Oncology Expense
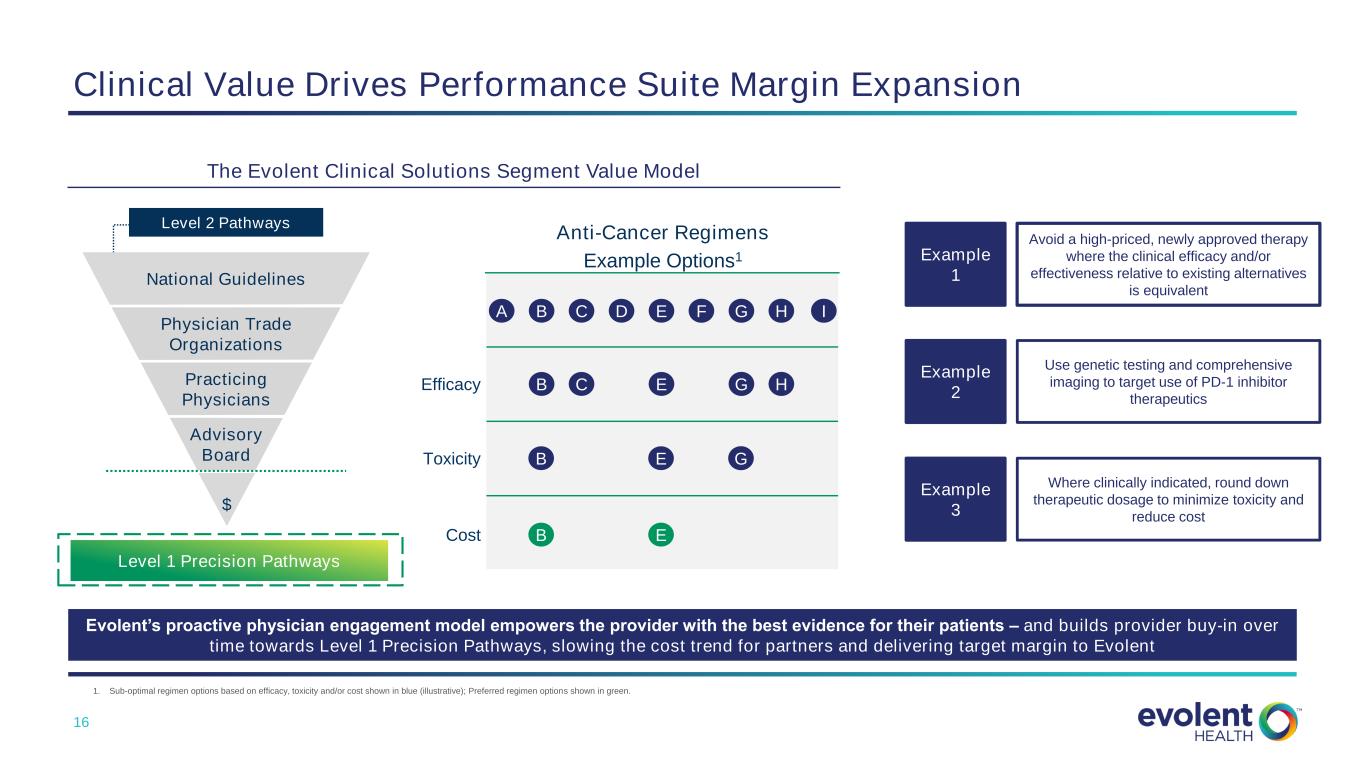
16 Clinical Value Drives Performance Suite Margin Expansion Use genetic testing and comprehensive imaging to target use of PD-1 inhibitor therapeutics Where clinically indicated, round down therapeutic dosage to minimize toxicity and reduce cost Advisory Board $ Practicing Physicians Physician Trade Organizations National Guidelines Level 2 Pathways Level 1 Precision Pathways The Evolent Clinical Solutions Segment Value Model Example 2 Example 3 Example 1 Avoid a high-priced, newly approved therapy where the clinical efficacy and/or effectiveness relative to existing alternatives is equivalent Evolent’s proactive physician engagement model empowers the provider with the best evidence for their patients – and builds provider buy-in over time towards Level 1 Precision Pathways, slowing the cost trend for partners and delivering target margin to Evolent Anti-Cancer Regimens Example Options1 Efficacy Toxicity A B C D E G Cost H IF B C E G H B E G B E 1. Sub-optimal regimen options based on efficacy, toxicity and/or cost shown in blue (illustrative); Preferred regimen options shown in green.
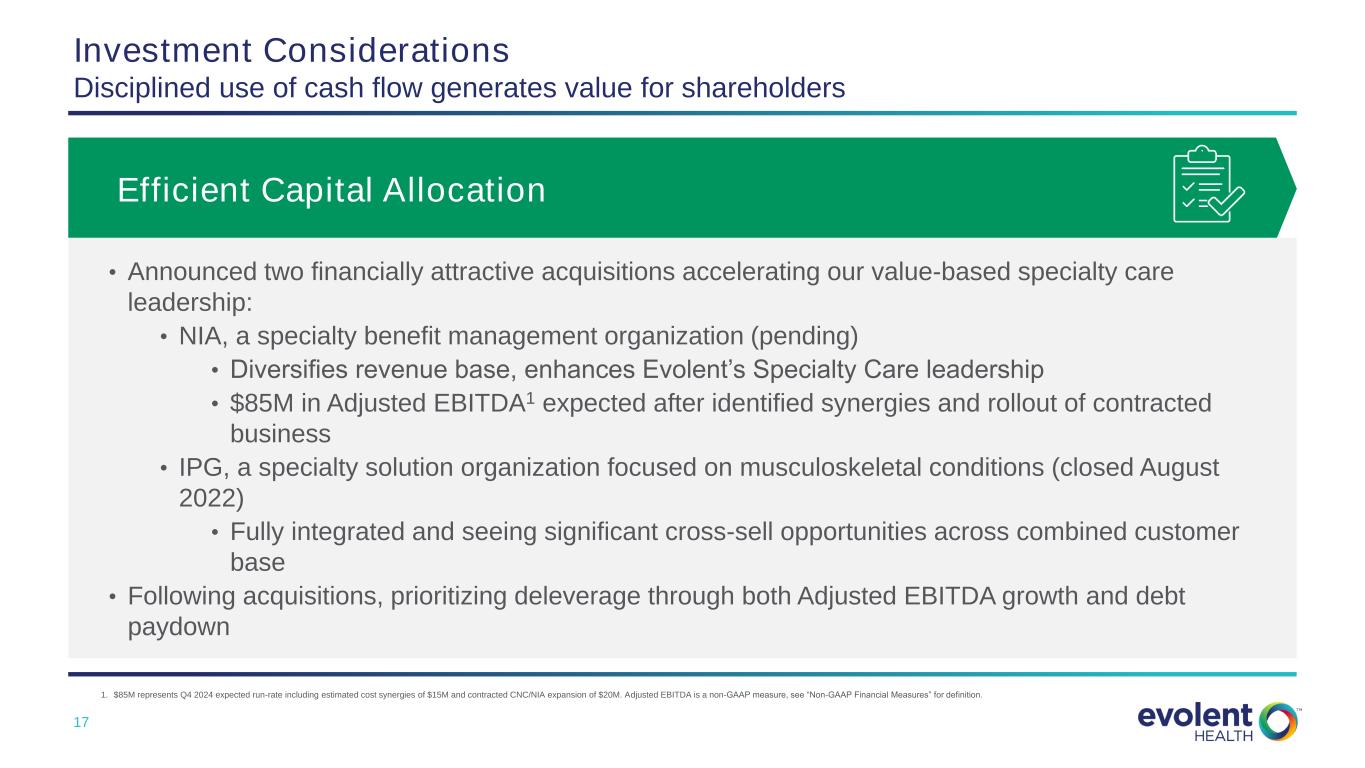
17 Investment Considerations Disciplined use of cash flow generates value for shareholders Efficient Capital Allocation • Announced two financially attractive acquisitions accelerating our value-based specialty care leadership: • NIA, a specialty benefit management organization (pending) • Diversifies revenue base, enhances Evolent’s Specialty Care leadership • $85M in Adjusted EBITDA1 expected after identified synergies and rollout of contracted business • IPG, a specialty solution organization focused on musculoskeletal conditions (closed August 2022) • Fully integrated and seeing significant cross-sell opportunities across combined customer base • Following acquisitions, prioritizing deleverage through both Adjusted EBITDA growth and debt paydown 1. $85M represents Q4 2024 expected run-rate including estimated cost synergies of $15M and contracted CNC/NIA expansion of $20M. Adjusted EBITDA is a non-GAAP measure, see “Non-GAAP Financial Measures” for definition.

18 Deal Close 12/31/2023 12/31/2024 Plan to Efficiently De-Lever Post Close of NIA Acquisition Capital Allocation Priorities Enhancing Core Business through Product Investment • Ensuring our products and teams are world- class, enabling strong customer satisfaction, retention, growth and profitability • Continued strong annual R&D investment Disciplined Core Accelerating M&A • Disciplined use of M&A capital to accelerate growth and profitability in the core business • Focus on accretive M&A Efficient Capital Structure • Maintain a flexible net leverage level that minimizes volatility to rates while prudently managing cash interest, maturity timing, etc. Prioritize debt paydown post close 3.7x <3.0x <2.0x Net Senior Secured DebtConvertible Notes Pro Forma Net Leverage Ratio Targets1 Cash flow provides path to de-leveraging 2.5x <2.1x <1.2x 1. Non-GAAP measure. Target leverage ratios calculated as total debt less cash divided by trailing twelve month Adjusted EBITDA. Net debt excludes $24M of in-the-money 2024 Convertible Notes (conversion price of $18.23).
19 Year in Review and Drivers for 2023 Evolent Health Overview AGENDA Investment Considerations
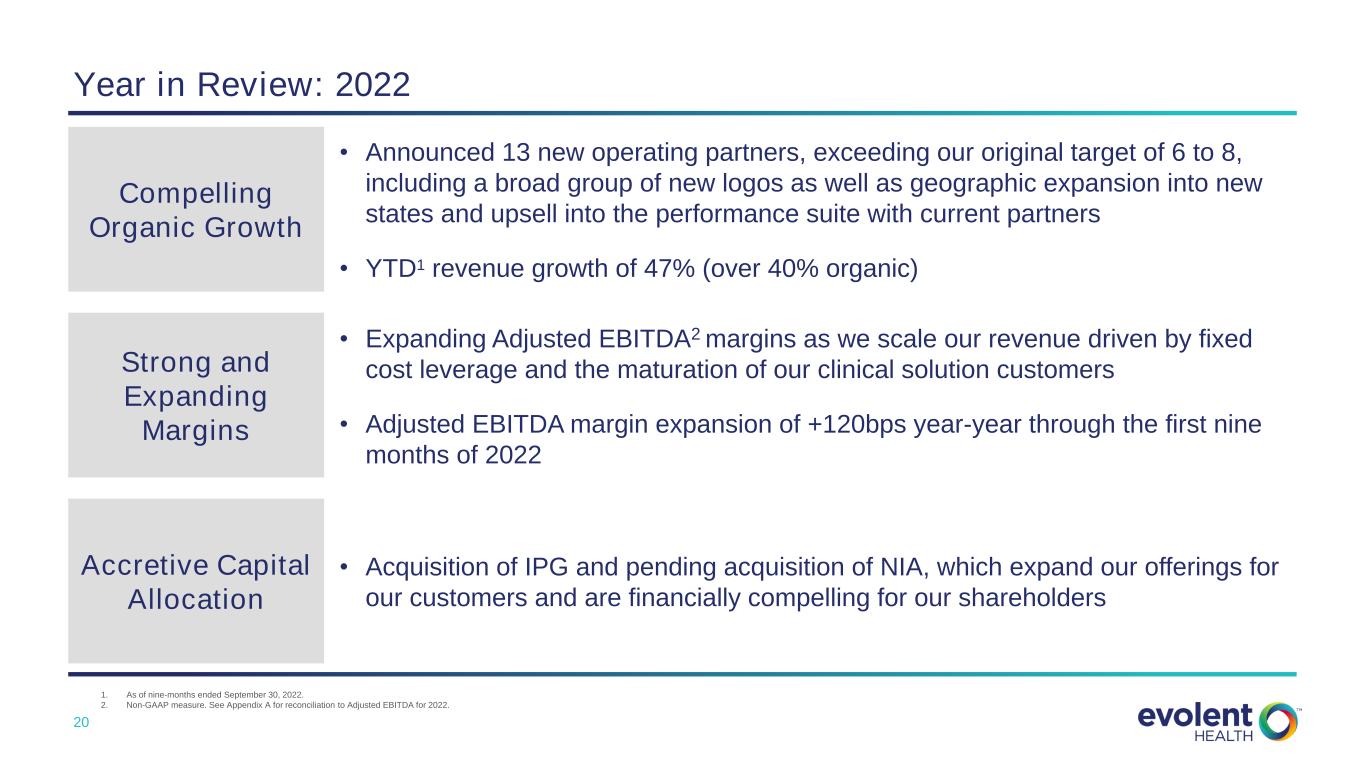
20 Year in Review: 2022 Compelling Organic Growth Strong and Expanding Margins Accretive Capital Allocation • Announced 13 new operating partners, exceeding our original target of 6 to 8, including a broad group of new logos as well as geographic expansion into new states and upsell into the performance suite with current partners • YTD1 revenue growth of 47% (over 40% organic) • Expanding Adjusted EBITDA2 margins as we scale our revenue driven by fixed cost leverage and the maturation of our clinical solution customers • Adjusted EBITDA margin expansion of +120bps year-year through the first nine months of 2022 • Acquisition of IPG and pending acquisition of NIA, which expand our offerings for our customers and are financially compelling for our shareholders 1. As of nine-months ended September 30, 2022. 2. Non-GAAP measure. See Appendix A for reconciliation to Adjusted EBITDA for 2022.
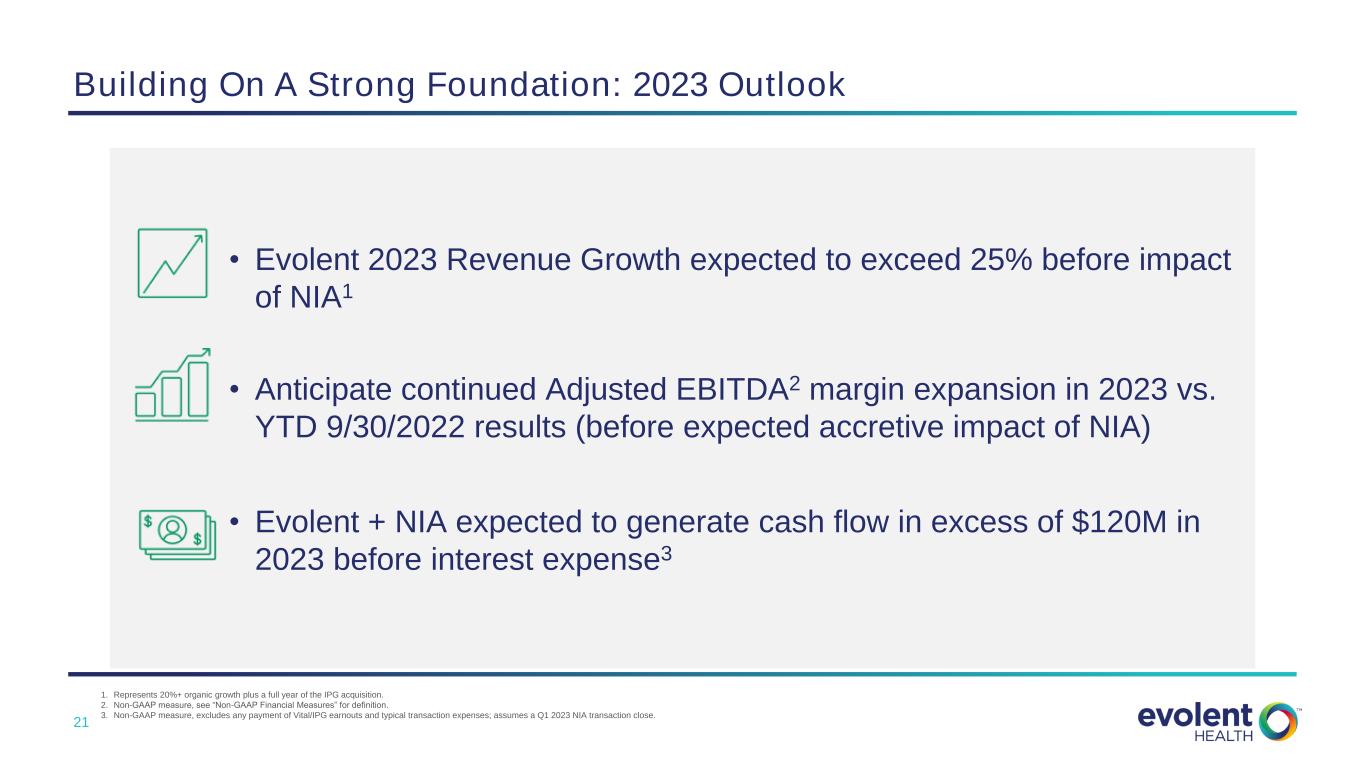
21 • Evolent 2023 Revenue Growth expected to exceed 25% before impact of NIA1 • Anticipate continued Adjusted EBITDA2 margin expansion in 2023 vs. YTD 9/30/2022 results (before expected accretive impact of NIA) • Evolent + NIA expected to generate cash flow in excess of $120M in 2023 before interest expense3 1. Represents 20%+ organic growth plus a full year of the IPG acquisition. 2. Non-GAAP measure, see “Non-GAAP Financial Measures” for definition. 3. Non-GAAP measure, excludes any payment of Vital/IPG earnouts and typical transaction expenses; assumes a Q1 2023 NIA transaction close. Building On A Strong Foundation: 2023 Outlook
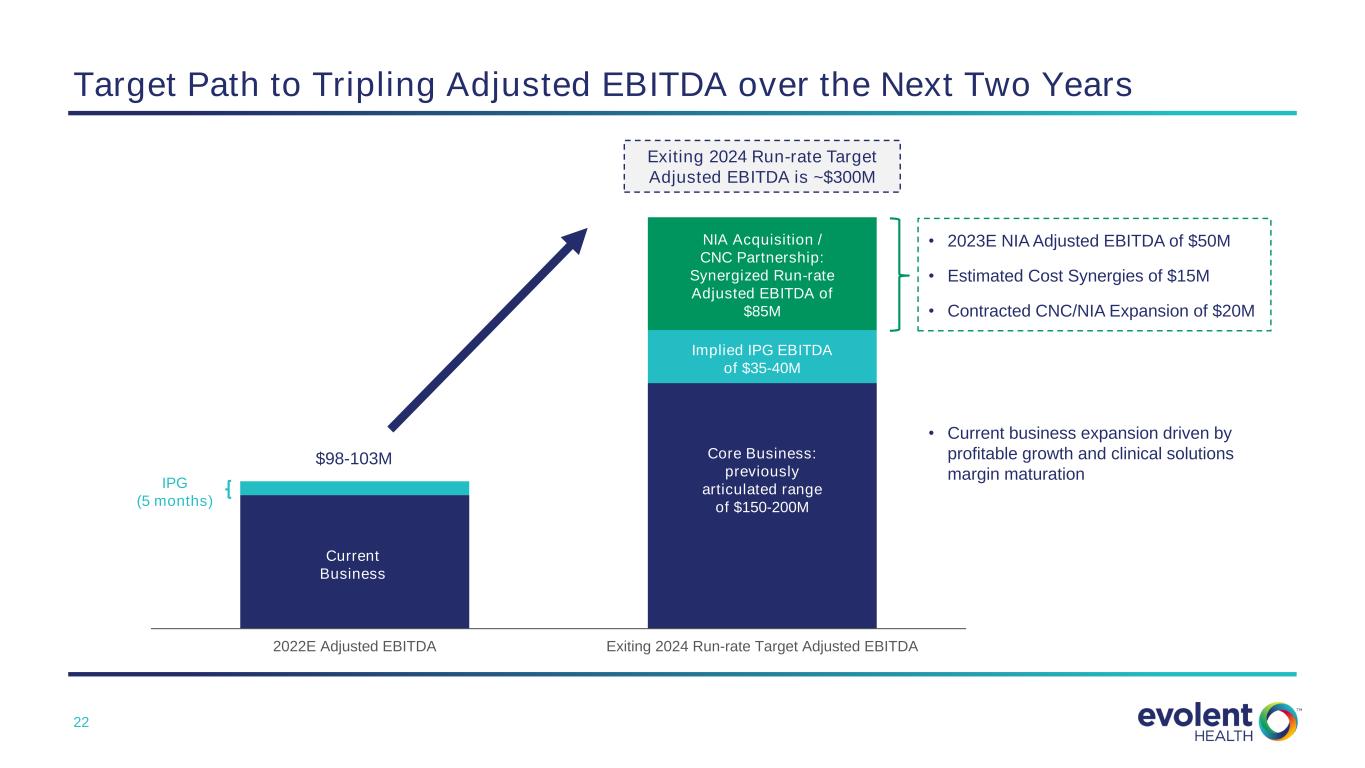
22 Target Path to Tripling Adjusted EBITDA over the Next Two Years 2022E Adjusted EBITDA Exiting 2024 Run-rate Target Adjusted EBITDA Current Business IPG (5 months) Core Business: previously articulated range of $150-200M Exiting 2024 Run-rate Target Adjusted EBITDA is ~$300M NIA Acquisition / CNC Partnership: Synergized Run-rate Adjusted EBITDA of $85M $98-103M Implied IPG EBITDA of $35-40M • 2023E NIA Adjusted EBITDA of $50M • Estimated Cost Synergies of $15M • Contracted CNC/NIA Expansion of $20M • Current business expansion driven by profitable growth and clinical solutions margin maturation

23 Confidential – Do Not Distribute Appendix

24 Non-GAAP Financial Measures In addition to disclosing financial results that are determined in accordance with GAAP, we present and discuss certain non-GAAP financial measures, as supplemental measures to help investors evaluate our fundamental operational performance. Net Debt is defined as Total Debt (the carrying value outstanding under the Company’s 2024 and 2025 Notes and Senior Credit Facility) adjusted to exclude the impact of net discounts and deferred financing costs less Available Cash, less the carrying value of the Company’s 2024, which are in the money. Management uses Net Debt as a supplemental performance measure because the netting of cash and cash equivalents from the principal amount of debt outstanding allows us to determine our debt repayment requirements in excess of available cash. We believe that this measure is also useful to investors because it allows further insight into the capital requirements of the Company that is comparable to other organizations in our industry and in the market in general. Net Leverage Ratio, or Net Debt to LTM Adjusted EBITDA, is defined as Net Debt divided by LTM Adjusted EBITDA. Management uses Net Debt to LTM Adjusted EBITDA as a supplemental performance measure because it allows the investor to understand capital requirements compared to operating performance over time. We believe that this measure is also useful to investors because it allows further insight into the period over period operational performance in a manner that is comparable to other organizations in our industry and in the market in general. Adjusted EBITDA is defined as net loss attributable to common shareholders of Evolent Health, Inc. before interest income, interest expense, provision for income taxes, depreciation and amortization expenses, adjusted to exclude gain on transfer of membership, loss on repayment/extinguishment of debt, net, gain from equity method investees, gain on disposal of assets, changes in fair value of contingent consideration, change in tax receivables agreement liability, net loss attributable to non-controlling interest, other income (expense), net, repositioning costs, stock-based compensation expense, severance costs, amortization of contract cost assets, strategy and shareholder advisory services, acquisition-related costs and gain from discontinued operations. Management uses Adjusted EBITDA as a supplemental performance measure because the removal of acquisition-related costs, one-time or non-cash items (e.g. depreciation, amortization and stock-based compensation expenses) allows us to focus on operational performance. We believe that this measure is also useful to investors because it allows further insight into the period over period operational performance in a manner that is comparable to other organizations in our industry and in the market in general. Adjusted EBITDA Margin is as defined Adjusted EBITDA divided by Revenue. Management uses Adjusted EBITDA margin as a supplemental performance measure because it allows the investor to understand operational performance compared to revenues over time. We believe that this measure is also useful to investors because it allows further insight into the period over period operational performance in a manner that is comparable to other organizations in our industry and in the market in general. Total Revenue Excluding Divested Assets is defined as the sum of revenue from our Clinical Solutions and Evolent Health Services segments, less revenue from our divested health plan assets. For purposes of calculating Total Revenue Excluding Divested Assets, the Company treats is former investment in True Health as a discontinued operation and excludes it from the calculation. Management uses Total Revenue Excluding Divested Assets as a supplemental performance measure because it reflects our on-going operational results. The measures is useful to investors because it reflects the full view of our operational performance in line with how we generate our long-term forecasts. These adjusted measures do not represent and should not be considered as alternatives to GAAP measurements, and our calculations thereof may not be comparable to similarly entitled measures reported by other companies. A reconciliation certain of these adjusted measures to their most comparable GAAP financial measures is presented in the tables below. We believe these measures are useful across time in evaluating our fundamental core operating performance. The information necessary to provide a reconciliation of the Company's target Q4 2024 target run-rate for NIA and cash flow before interest expense, forward-looking non-GAAP financial measures, to the most directly comparable GAAP measures, are not available at this time without unreasonable efforts in light of the fact that the applicable reconciling items are not determinable, and/or the inherent difficulty in quantifying such reconciling items, on a forward-looking basis at this time.
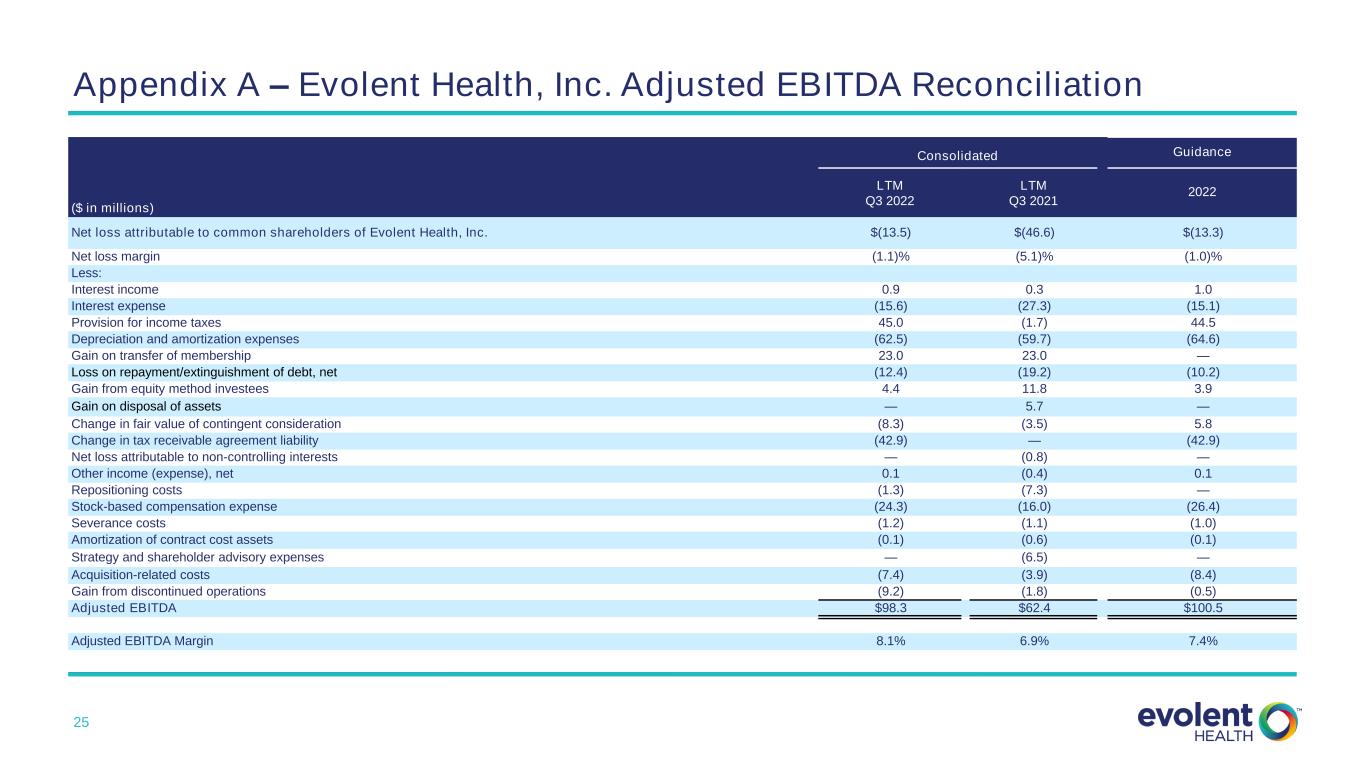
25 Appendix A – Evolent Health, Inc. Adjusted EBITDA Reconciliation Consolidated Guidance ($ in millions) LTM Q3 2022 LTM Q3 2021 2022 Net loss attributable to common shareholders of Evolent Health, Inc. $(13.5) $(46.6) $(13.3) Net loss margin (1.1)% (5.1)% (1.0)% Less: Interest income 0.9 0.3 1.0 Interest expense (15.6) (27.3) (15.1) Provision for income taxes 45.0 (1.7) 44.5 Depreciation and amortization expenses (62.5) (59.7) (64.6) Gain on transfer of membership 23.0 23.0 — Loss on repayment/extinguishment of debt, net (12.4) (19.2) (10.2) Gain from equity method investees 4.4 11.8 3.9 Gain on disposal of assets — 5.7 — Change in fair value of contingent consideration (8.3) (3.5) 5.8 Change in tax receivable agreement liability (42.9) — (42.9) Net loss attributable to non-controlling interests — (0.8) — Other income (expense), net 0.1 (0.4) 0.1 Repositioning costs (1.3) (7.3) — Stock-based compensation expense (24.3) (16.0) (26.4) Severance costs (1.2) (1.1) (1.0) Amortization of contract cost assets (0.1) (0.6) (0.1) Strategy and shareholder advisory expenses — (6.5) — Acquisition-related costs (7.4) (3.9) (8.4) Gain from discontinued operations (9.2) (1.8) (0.5) Adjusted EBITDA $98.3 $62.4 $100.5 Adjusted EBITDA Margin 8.1% 6.9% 7.4%

26 Appendix B – Revenue from Divested Assets ($ in millions) Q3 2022 Q4 2019 Total revenue $352.6 $205.0 Less: Divested assets - 68.0 Subtotal 352.6 137.0 Eliminations 0.3 (0.2) Total revenue from divested assets $352.9 $136.8 1) Eliminations represent revenue that Evolent Health Services charges New Century Health and is eliminated upon consolidation.


