November 2, 2021 Third Quarter 2021 Supplemental Information Exhibit 99.2
Forward-Looking Statements and Other Disclosures The information contained in this earnings presentation contains “forward‐looking statements” within the meaning of Section 27A of the Securities Act of 1933, as amended, and Section 21E of the Securities Exchange Act of 1934, as amended. These forward‐looking statements are subject to various risks and uncertainties, including, without limitation, statements relating to the performance of the investments of TPG RE Finance Trust, Inc. (the “Company” or “TRTX”); the ultimate geographic spread, severity and duration of pandemics such as the novel coronavirus (“COVID-19”) and its variants, actions that may be taken by governmental authorities to contain or address the impact of such pandemics, and the potential negative impacts of such pandemics on the global economy and the Company's financial condition and results of operations; the Company's ability to originate loans that are in the pipeline and under evaluation by the Company; financing needs and arrangements; and the risks, uncertainties and factors set forth under the heading “Risk Factors” in the Company’s Quarterly Report on Form 10-Q for the quarterly period ended September 30, 2021 and in the Company’s Annual Report on Form 10-K for the fiscal year ended December 31, 2020, as such risk factors may be updated from time to time in the Company’s periodic filings with the Securities and Exchange Commission (the “SEC”), which are accessible on the SEC’s website at www.sec.gov. Forward‐looking statements are generally identifiable by use of forward‐looking terminology such as “may,” “will,” “should,” “potential,” “intend,” “expect,” “endeavor,” “seek,” “anticipate,” “estimate,” “believe,” “could,” “project,” “predict,” “continue” or other similar words or expressions. Forward‐looking statements are based on certain assumptions, discuss future expectations, describe existing or future plans and strategies, contain projections of results of operations, liquidity and/or financial condition or state other forward‐looking information. Statements, among others, relating to the continuing impact of COVID-19 and its variants on the Company’s business, financial condition and results of operations and the Company’s ability to generate future growth and deliver returns are forward-looking statements, and the Company cannot assure you that TRTX will achieve such results. The ability of TRTX to predict future events or conditions or their impact or the actual effect of existing or future plans or strategies is inherently uncertain. Although the Company believes that such forward‐looking statements are based on reasonable assumptions, actual results and performance in the future could differ materially from those set forth in or implied by such forward‐looking statements. You are cautioned not to place undue reliance on these forward‐looking statements, which reflect the Company’s views only as of the date of this earnings presentation. Except as required by law, neither the Company nor any other person assumes responsibility for the accuracy and completeness of the forward‐looking statements appearing in this earnings presentation. The Company does not undertake any obligation to update any forward-looking statements contained in this earnings presentation as a result of new information, future events or otherwise. Past performance is not indicative nor a guarantee of future returns. Yield data are shown for illustrative purposes only and have limitations when used for comparison or for other purposes due to, among other matters, volatility, credit or other factors. TPG RE Finance Trust, Inc.| 3Q2021 2
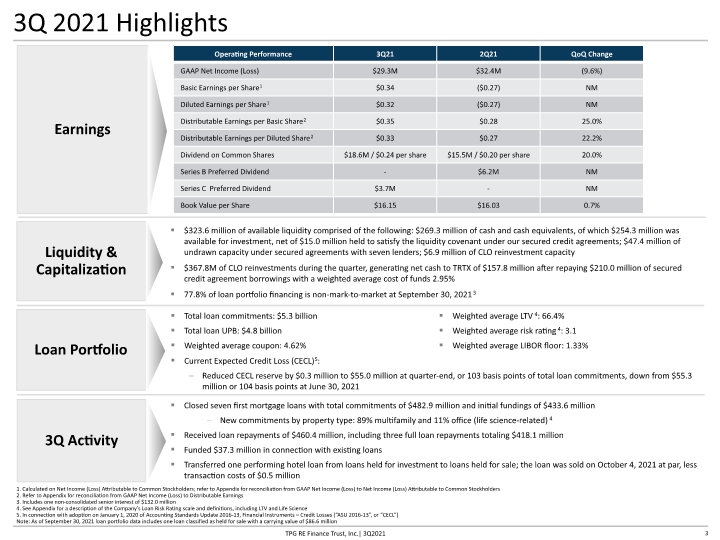
3Q 2021 Highlights Earnings Loan Portfolio Liquidity & Capitalization 1. Calculated on Net Income (Loss) Attributable to Common Stockholders; refer to Appendix for reconciliation from GAAP Net Income (Loss) to Net Income (Loss) Attributable to Common Stockholders 2. Refer to Appendix for reconciliation from GAAP Net Income (Loss) to Distributable Earnings 3. Includes one non-consolidated senior interest of $132.0 million 4. See Appendix for a description of the Company’s Loan Risk Rating scale and definitions, including LTV and Life Science 5. In connection with adoption on January 1, 2020 of Accounting Standards Update 2016-13, Financial Instruments – Credit Losses (“ASU 2016-13”, or “CECL”) Note: As of September 30, 2021 loan portfolio data includes one loan classified as held for sale with a carrying value of $86.6 million 3 TPG RE Finance Trust, Inc.| 3Q2021 3Q Activity
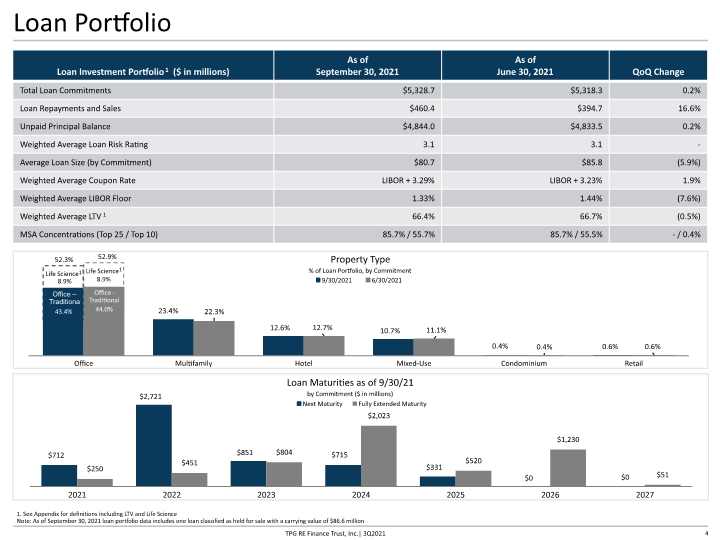
1. See Appendix for definitions including LTV and Life Science Note: As of September 30, 2021 loan portfolio data includes one loan classified as held for sale with a carrying value of $86.6 million Property Type % of Loan Portfolio, by Commitment Loan Maturities as of 9/30/21 by Commitment ($ in millions) Life Science 8.9% Life Science 8.9% Loan Portfolio TPG RE Finance Trust, Inc.| 3Q2021 4 1 1
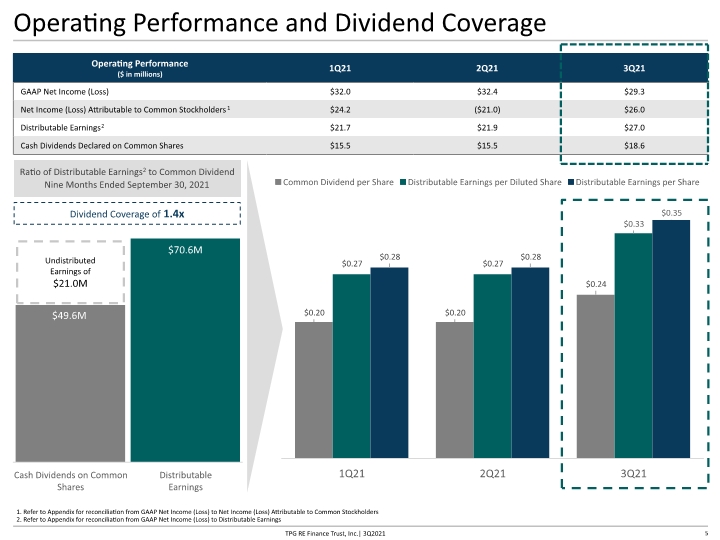
5 Operating Performance and Dividend Coverage Ratio of Distributable Earnings2 to Common Dividend Nine Months Ended September 30, 2021 1. Refer to Appendix for reconciliation from GAAP Net Income (Loss) to Net Income (Loss) Attributable to Common Stockholders 2. Refer to Appendix for reconciliation from GAAP Net Income (Loss) to Distributable Earnings Dividend Coverage of 1.4x TPG RE Finance Trust, Inc.| 3Q2021 Undistributed Earnings of $21.0M
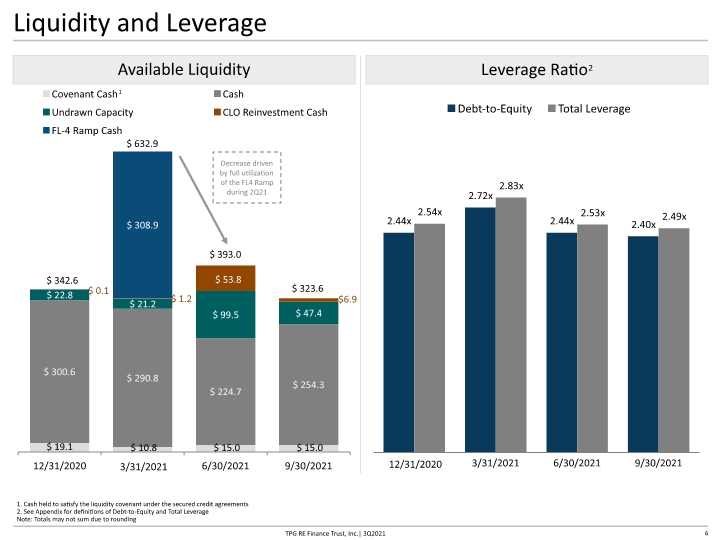
Liquidity and Leverage Available Liquidity Leverage Ratio2 1. Cash held to satisfy the liquidity covenant under the secured credit agreements 2. See Appendix for definitions of Debt-to-Equity and Total Leverage Note: Totals may not sum due to rounding 12/31/2020 6 TPG RE Finance Trust, Inc.| 3Q2021 Decrease driven by full utilization of the FL4 Ramp during 2Q21 $6.9

Book Value Walk 1. Does not reflect dilutive impact of 12M warrants held by an affiliate of Starwood Capital Group; book value per share reflecting pro forma dilution resulting from an assumed exercise of these warrants at September 30, 2021 is $15.21 Note: Totals may not sum due to rounding CECL Reserve per Share $0.72 1 CECL Reserve per Share $0.71 Net Income Excluding Credit Loss Benefit Covers Common Dividend 1.58x; Covers Common and Preferred Dividend 1.31x TPG RE Finance Trust, Inc.| 3Q2021 7
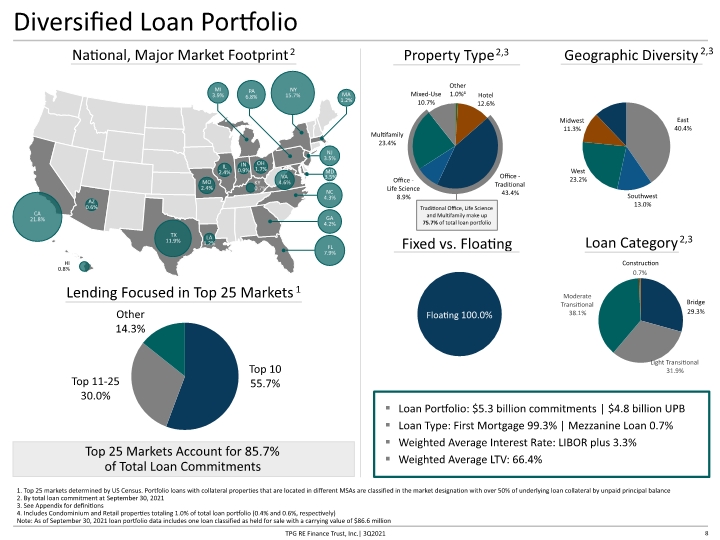
Top 25 Markets Account for 85.7% of Total Loan Commitments Diversified Loan Portfolio 1. Top 25 markets determined by US Census. Portfolio loans with collateral properties that are located in different MSAs are classified in the market designation with over 50% of underlying loan collateral by unpaid principal balance 2. By total loan commitment at September 30, 2021 3. See Appendix for definitions 4. Includes Condominium and Retail properties totaling 1.0% of total loan portfolio (0.4% and 0.6%, respectively) Note: As of September 30, 2021 loan portfolio data includes one loan classified as held for sale with a carrying value of $86.6 million 2,3 Loan Portfolio: $5.3 billion commitments | $4.8 billion UPB Loan Type: First Mortgage 99.3% | Mezzanine Loan 0.7% Weighted Average Interest Rate: LIBOR plus 3.3% Weighted Average LTV: 66.4% 2,3 Fixed vs. Floating CA 21.8% NY 15.7% TX 11.9% PA 6.8% FL 7.9% NC 4.3% GA 4.2% MI 3.9% NJ 3.5% VA 4.6% MA 1.2% MO 2.4% IL 2.4% LA 1.2% HI 0.8% KY 0.7% MD 3.5% Bridge 29.3% 8 IN 0.9% OH 1.7% TPG RE Finance Trust, Inc.| 3Q2021 AZ 0.6% Traditional Office, Life Science and Multifamily make up 75.7% of total loan portfolio
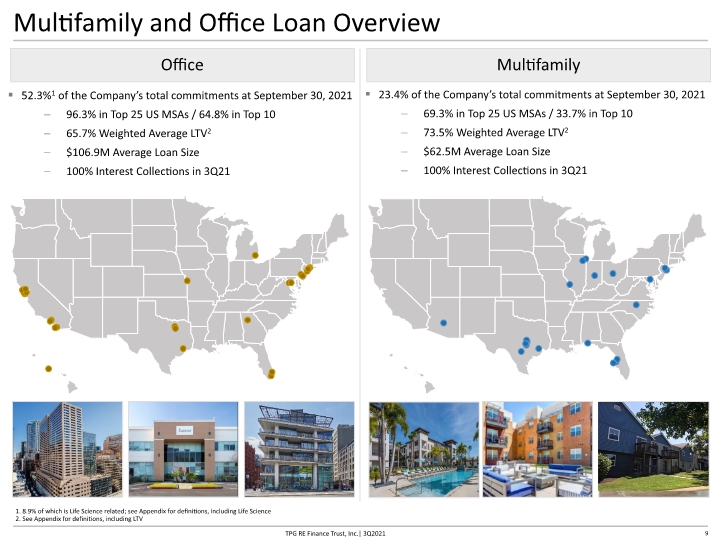
Multifamily and Office Loan Overview Office 52.3%1 of the Company’s total commitments at September 30, 2021 96.3% in Top 25 US MSAs / 64.8% in Top 10 65.7% Weighted Average LTV2 $106.9M Average Loan Size 100% Interest Collections in 3Q21 Multifamily 1. 8.9% of which is Life Science related; see Appendix for definitions, including Life Science 2. See Appendix for definitions, including LTV 9 TPG RE Finance Trust, Inc.| 3Q2021 23.4% of the Company’s total commitments at September 30, 2021 69.3% in Top 25 US MSAs / 33.7% in Top 10 73.5% Weighted Average LTV2 $62.5M Average Loan Size 100% Interest Collections in 3Q21
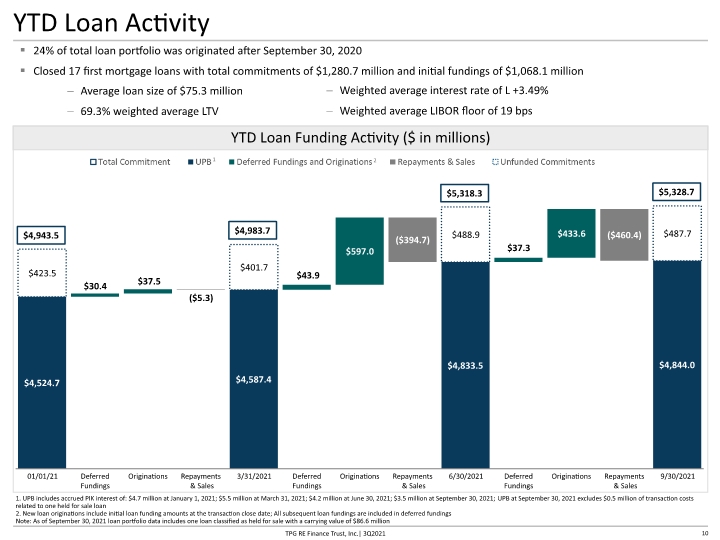
10 YTD Loan Activity 24% of total loan portfolio was originated after September 30, 2020 Closed 17 first mortgage loans with total commitments of $1,280.7 million and initial fundings of $1,068.1 million YTD Loan Funding Activity ($ in millions) 1. UPB includes accrued PIK interest of: $4.7 million at January 1, 2021; $5.5 million at March 31, 2021; $4.2 million at June 30, 2021; $3.5 million at September 30, 2021; UPB at September 30, 2021 excludes $0.5 million of transaction costs related to one held for sale loan 2. New loan originations include initial loan funding amounts at the transaction close date; All subsequent loan fundings are included in deferred fundings Note: As of September 30, 2021 loan portfolio data includes one loan classified as held for sale with a carrying value of $86.6 million $4,943.5 $4,983.7 $5,318.3 $5,328.7 1 2 TPG RE Finance Trust, Inc.| 3Q2021
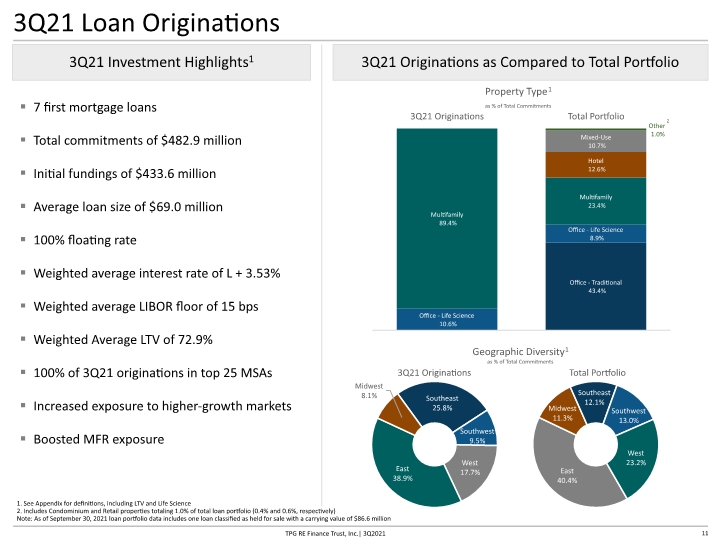
11 3Q21 Loan Originations 3Q21 Investment Highlights1 7 first mortgage loans Total commitments of $482.9 million Initial fundings of $433.6 million Average loan size of $69.0 million 100% floating rate Weighted average interest rate of L + 3.53% Weighted average LIBOR floor of 15 bps Weighted Average LTV of 72.9% 100% of 3Q21 originations in top 25 MSAs Increased exposure to higher-growth markets Boosted MFR exposure 3Q21 Originations as Compared to Total Portfolio TPG RE Finance Trust, Inc.| 3Q2021 Geographic Diversity1 as % of Total Commitments 3Q21 Originations Total Portfolio 2 1. See Appendix for definitions, including LTV and Life Science 2. Includes Condominium and Retail properties totaling 1.0% of total loan portfolio (0.4% and 0.6%, respectively) Note: As of September 30, 2021 loan portfolio data includes one loan classified as held for sale with a carrying value of $86.6 million
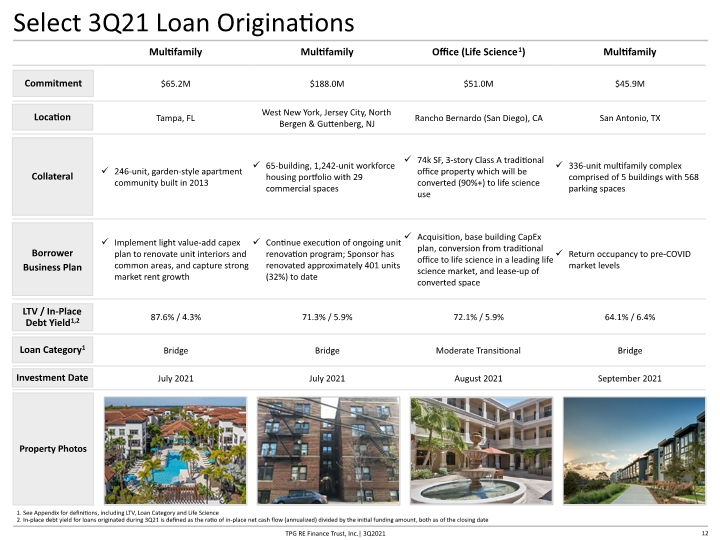
12 Select 3Q21 Loan Originations Commitment Location Collateral Borrower Business Plan LTV / In-Place Debt Yield1,2 Loan Category1 Property Photos Investment Date 1. See Appendix for definitions, including LTV, Loan Category and Life Science 2. In-place debt yield for loans originated during 3Q21 is defined as the ratio of in-place net cash flow (annualized) divided by the initial funding amount, both as of the closing date TPG RE Finance Trust, Inc.| 3Q2021
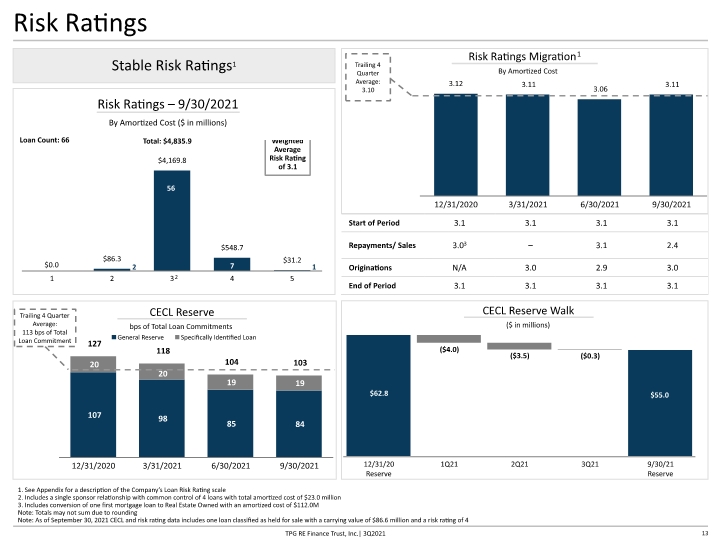
Risk Ratings 1. See Appendix for a description of the Company’s Loan Risk Rating scale 2. Includes a single sponsor relationship with common control of 4 loans with total amortized cost of $23.0 million 3. Includes conversion of one first mortgage loan to Real Estate Owned with an amortized cost of $112.0M Note: Totals may not sum due to rounding Note: As of September 30, 2021 CECL and risk rating data includes one loan classified as held for sale with a carrying value of $86.6 million and a risk rating of 4 Stable Risk Ratings1 $58.7 $83.0 $59.3 $62.8 By Amortized Cost By Amortized Cost $58.8 ($ in millions) Trailing 4 Quarter Average: 113 bps of Total Loan Commitment bps of Total Loan Commitments 13 TPG RE Finance Trust, Inc.| 3Q2021 2 1 Trailing 4 Quarter Average: 3.10
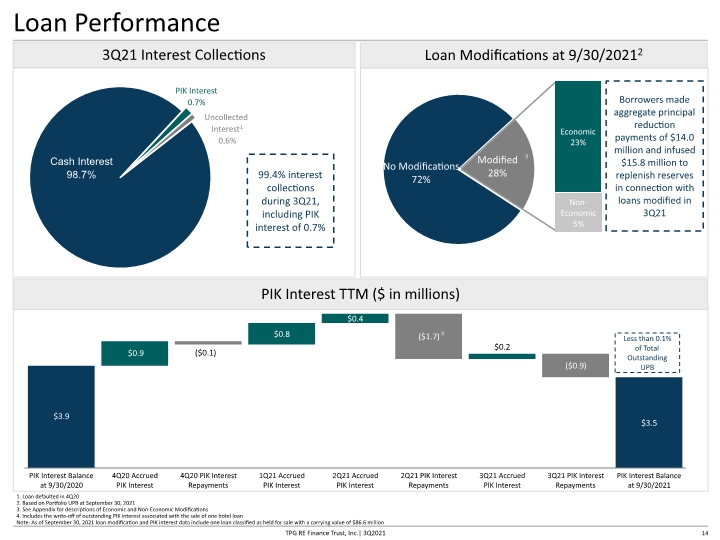
Loan Performance PIK Interest TTM ($ in millions) 1. Loan defaulted in 4Q20 2. Based on Portfolio UPB at September 30, 2021 3. See Appendix for descriptions of Economic and Non-Economic Modifications 4. Includes the write-off of outstanding PIK interest associated with the sale of one hotel loan Note: As of September 30, 2021 loan modification and PIK interest data include one loan classified as held for sale with a carrying value of $86.6 million 14 Less than 0.1% of Total Outstanding UPB TPG RE Finance Trust, Inc.| 3Q2021 4 3
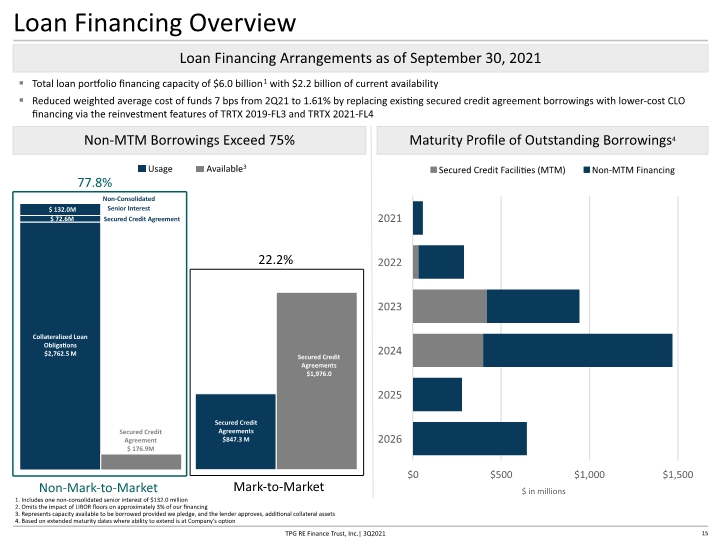
Loan Financing Overview 1. Includes one non-consolidated senior interest of $132.0 million 2. Omits the impact of LIBOR floors on approximately 3% of our financing 3. Represents capacity available to be borrowed provided we pledge, and the lender approves, additional collateral assets 4. Based on extended maturity dates where ability to extend is at Company’s option Loan Financing Arrangements as of September 30, 2021 Total loan portfolio financing capacity of $6.0 billion1 with $2.2 billion of current availability Reduced weighted average cost of funds 7 bps from 2Q21 to 1.61% by replacing existing secured credit agreement borrowings with lower-cost CLO financing via the reinvestment features of TRTX 2019-FL3 and TRTX 2021-FL4 Non-MTM Borrowings Exceed 75% Maturity Profile of Outstanding Borrowings4 2.54x 2.64x Collateralized Loan Obligations Secured Credit Agreements Secured Credit Agreements 3.38x 3.49x $249.5M Non-Mark-to-Market Mark-to-Market Collateralized Loan Obligations Secured Credit Agreements Secured Credit Agreements 77.8% 15 TPG RE Finance Trust, Inc.| 3Q2021 Secured Credit Agreement Non-Consolidated Senior Interest Secured Credit Agreements $1,976.0 22.2%
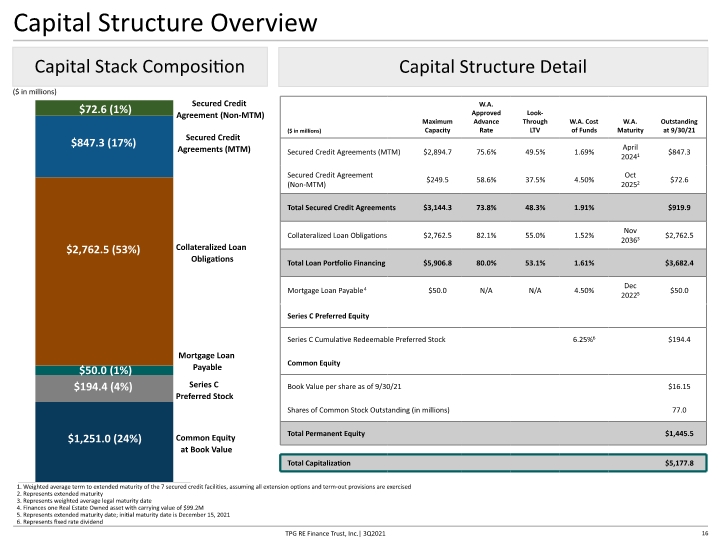
Capital Structure Overview $50.0 (1%) $2,762.5 (53%) $847.3 (17%) $194.4 (4%) $1,251.0 (24%) Series C Preferred Stock Mortgage Loan Payable Collateralized Loan Obligations Secured Credit Agreements (MTM) Common Equity at Book Value Capital Stack Composition Capital Structure Detail ($ in millions) 1. Weighted average term to extended maturity of the 7 secured credit facilities, assuming all extension options and term-out provisions are exercised 2. Represents extended maturity 3. Represents weighted average legal maturity date 4. Finances one Real Estate Owned asset with carrying value of $99.2M 5. Represents extended maturity date; initial maturity date is December 15, 2021 6. Represents fixed rate dividend 16 TPG RE Finance Trust, Inc.| 3Q2021 $72.6 (1%) Secured Credit Agreement (Non-MTM)
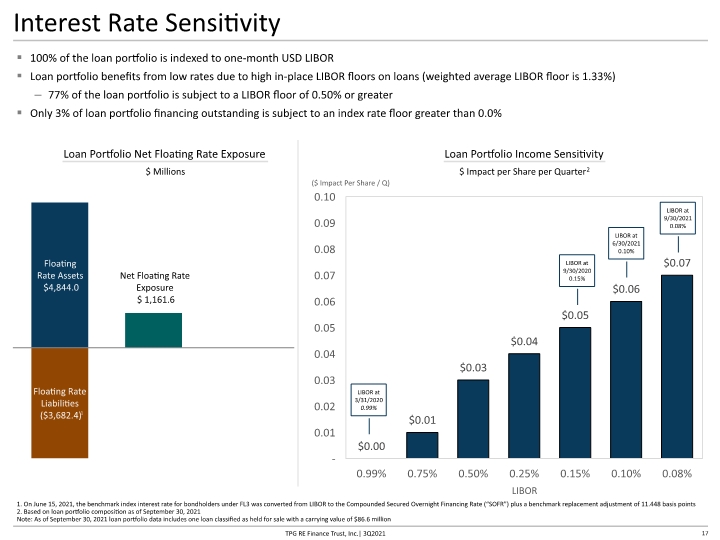
17 Interest Rate Sensitivity 100% of the loan portfolio is indexed to one-month USD LIBOR Loan portfolio benefits from low rates due to high in-place LIBOR floors on loans (weighted average LIBOR floor is 1.33%) 77% of the loan portfolio is subject to a LIBOR floor of 0.50% or greater Only 3% of loan portfolio financing outstanding is subject to an index rate floor greater than 0.0% 1. On June 15, 2021, the benchmark index interest rate for bondholders under FL3 was converted from LIBOR to the Compounded Secured Overnight Financing Rate (“SOFR”) plus a benchmark replacement adjustment of 11.448 basis points 2. Based on loan portfolio composition as of September 30, 2021 Note: As of September 30, 2021 loan portfolio data includes one loan classified as held for sale with a carrying value of $86.6 million LIBOR at 3/31/2020 0.99% LIBOR at 9/30/2020 0.15% LIBOR at 6/30/2021 0.10% LIBOR at 9/30/2021 0.08% LIBOR TPG RE Finance Trust, Inc.| 3Q2021 1
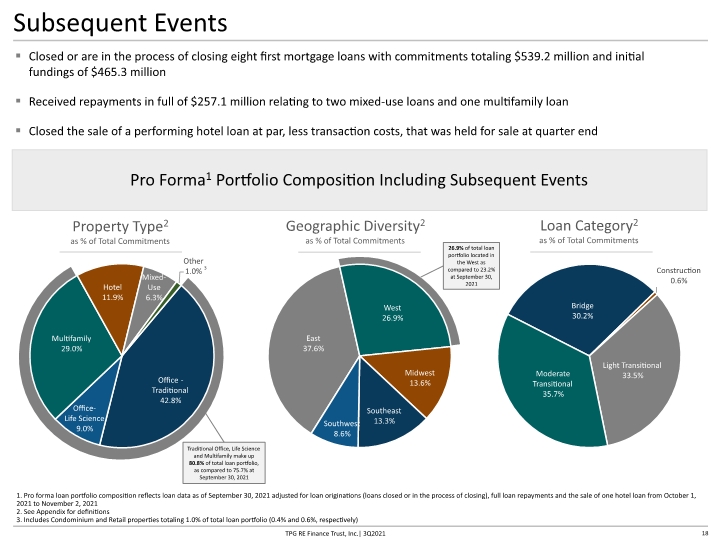
18 Subsequent Events Closed or are in the process of closing eight first mortgage loans with commitments totaling $539.2 million and initial fundings of $465.3 million Received repayments in full of $257.1 million relating to two mixed-use loans and one multifamily loan Closed the sale of a performing hotel loan at par, less transaction costs, that was held for sale at quarter end TPG RE Finance Trust, Inc.| 3Q2021 1. Pro forma loan portfolio composition reflects loan data as of September 30, 2021 adjusted for loan originations (loans closed or in the process of closing), full loan repayments and the sale of one hotel loan from October 1, 2021 to November 2, 2021 2. See Appendix for definitions 3. Includes Condominium and Retail properties totaling 1.0% of total loan portfolio (0.4% and 0.6%, respectively) Pro Forma1 Portfolio Composition Including Subsequent Events Geographic Diversity2 as % of Total Commitments Property Type2 as % of Total Commitments Loan Category2 as % of Total Commitments 3 Traditional Office, Life Science and Multifamily make up 80.8% of total loan portfolio, as compared to 75.7% at September 30, 2021 26.9% of total loan portfolio located in the West as compared to 23.2% at September 30, 2021

Appendix
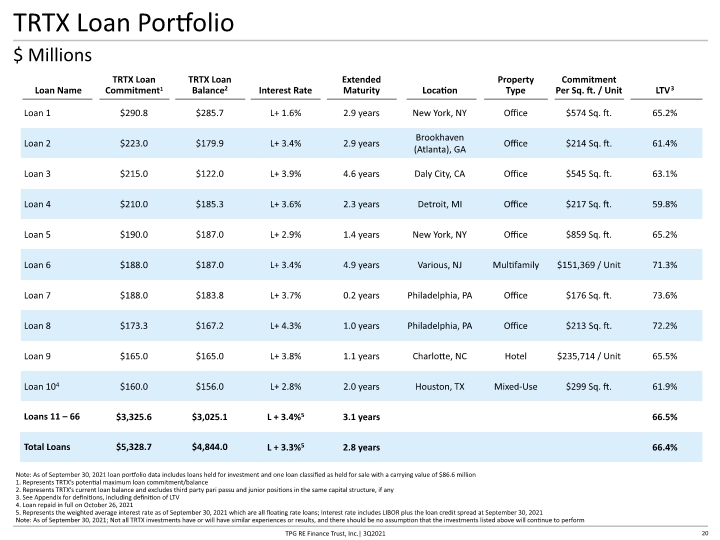
20 TRTX Loan Portfolio Note: As of September 30, 2021 loan portfolio data includes loans held for investment and one loan classified as held for sale with a carrying value of $86.6 million 1. Represents TRTX’s potential maximum loan commitment/balance 2. Represents TRTX’s current loan balance and excludes third party pari passu and junior positions in the same capital structure, if any 3. See Appendix for definitions, including definition of LTV 4. Loan repaid in full on October 26, 2021 5. Represents the weighted average interest rate as of September 30, 2021 which are all floating rate loans; Interest rate includes LIBOR plus the loan credit spread at September 30, 2021 Note: As of September 30, 2021; Not all TRTX investments have or will have similar experiences or results, and there should be no assumption that the investments listed above will continue to perform $ Millions TPG RE Finance Trust, Inc.| 3Q2021
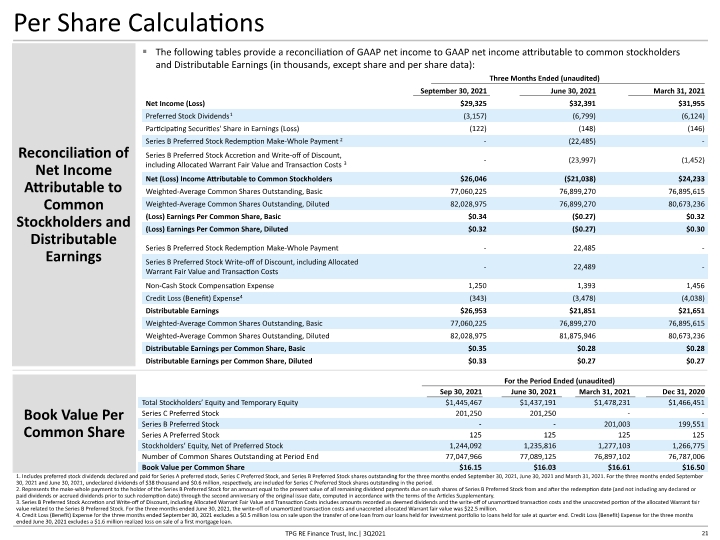
21 Per Share Calculations Reconciliation of Net Income Attributable to Common Stockholders and Distributable Earnings 1. Includes preferred stock dividends declared and paid for Series A preferred stock, Series C Preferred Stock, and Series B Preferred Stock shares outstanding for the three months ended September 30, 2021, June 30, 2021 and March 31, 2021. For the three months ended September 30, 2021 and June 30, 2021, undeclared dividends of $38 thousand and $0.6 million, respectively, are included for Series C Preferred Stock shares outstanding in the period. 2. Represents the make-whole payment to the holder of the Series B Preferred Stock for an amount equal to the present value of all remaining dividend payments due on such shares of Series B Preferred Stock from and after the redemption date (and not including any declared or paid dividends or accrued dividends prior to such redemption date) through the second anniversary of the original issue date, computed in accordance with the terms of the Articles Supplementary. 3. Series B Preferred Stock Accretion and Write-off of Discount, including Allocated Warrant Fair Value and Transaction Costs includes amounts recorded as deemed dividends and the write-off of unamortized transaction costs and the unaccreted portion of the allocated Warrant fair value related to the Series B Preferred Stock. For the three months ended June 30, 2021, the write-off of unamortized transaction costs and unaccreted allocated Warrant fair value was $22.5 million. 4. Credit Loss (Benefit) Expense for the three months ended September 30, 2021 excludes a $0.5 million loss on sale upon the transfer of one loan from our loans held for investment portfolio to loans held for sale at quarter end. Credit Loss (Benefit) Expense for the three months ended June 30, 2021 excludes a $1.6 million realized loss on sale of a first mortgage loan. TPG RE Finance Trust, Inc.| 3Q2021 The following tables provide a reconciliation of GAAP net income to GAAP net income attributable to common stockholders and Distributable Earnings (in thousands, except share and per share data): Book Value Per Common Share
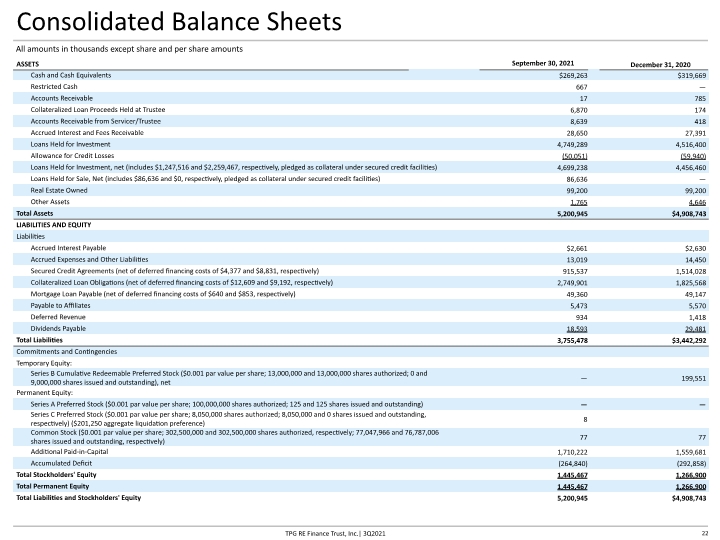
All amounts in thousands except share and per share amounts 22 Consolidated Balance Sheets TPG RE Finance Trust, Inc.| 3Q2021
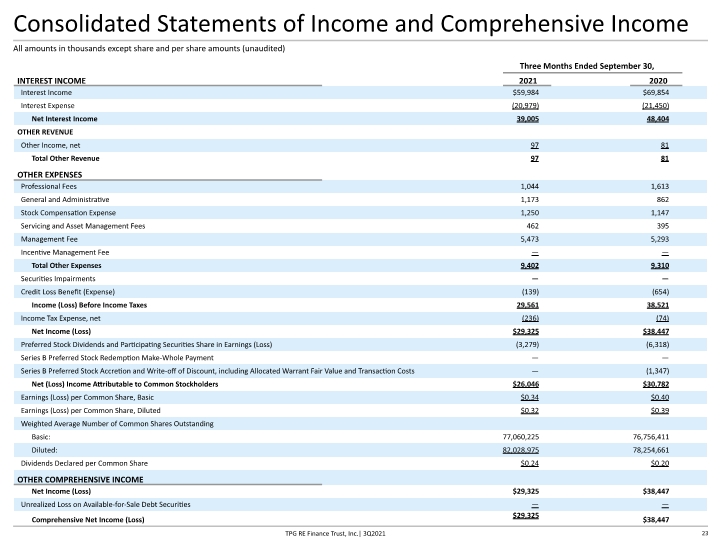
23 Consolidated Statements of Income and Comprehensive Income All amounts in thousands except share and per share amounts (unaudited) TPG RE Finance Trust, Inc.| 3Q2021
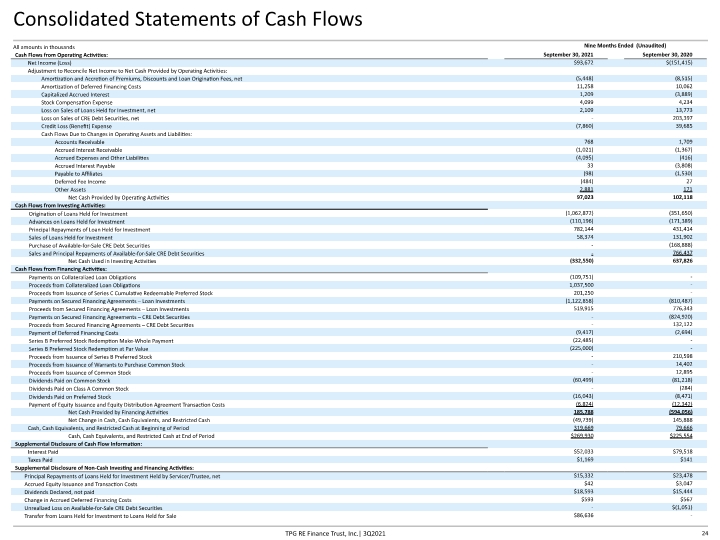
Consolidated Statements of Cash Flows All amounts in thousands Nine Months Ended (Unaudited) TPG RE Finance Trust, Inc.| 3Q2021 24
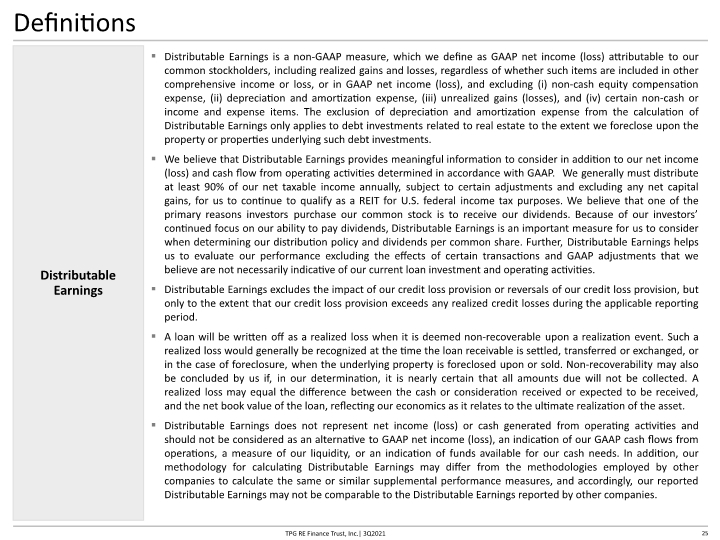
Definitions Distributable Earnings is a non-GAAP measure, which we define as GAAP net income (loss) attributable to our common stockholders, including realized gains and losses, regardless of whether such items are included in other comprehensive income or loss, or in GAAP net income (loss), and excluding (i) non-cash equity compensation expense, (ii) depreciation and amortization expense, (iii) unrealized gains (losses), and (iv) certain non-cash or income and expense items. The exclusion of depreciation and amortization expense from the calculation of Distributable Earnings only applies to debt investments related to real estate to the extent we foreclose upon the property or properties underlying such debt investments. We believe that Distributable Earnings provides meaningful information to consider in addition to our net income (loss) and cash flow from operating activities determined in accordance with GAAP. We generally must distribute at least 90% of our net taxable income annually, subject to certain adjustments and excluding any net capital gains, for us to continue to qualify as a REIT for U.S. federal income tax purposes. We believe that one of the primary reasons investors purchase our common stock is to receive our dividends. Because of our investors’ continued focus on our ability to pay dividends, Distributable Earnings is an important measure for us to consider when determining our distribution policy and dividends per common share. Further, Distributable Earnings helps us to evaluate our performance excluding the effects of certain transactions and GAAP adjustments that we believe are not necessarily indicative of our current loan investment and operating activities. Distributable Earnings excludes the impact of our credit loss provision or reversals of our credit loss provision, but only to the extent that our credit loss provision exceeds any realized credit losses during the applicable reporting period. A loan will be written off as a realized loss when it is deemed non-recoverable upon a realization event. Such a realized loss would generally be recognized at the time the loan receivable is settled, transferred or exchanged, or in the case of foreclosure, when the underlying property is foreclosed upon or sold. Non-recoverability may also be concluded by us if, in our determination, it is nearly certain that all amounts due will not be collected. A realized loss may equal the difference between the cash or consideration received or expected to be received, and the net book value of the loan, reflecting our economics as it relates to the ultimate realization of the asset. Distributable Earnings does not represent net income (loss) or cash generated from operating activities and should not be considered as an alternative to GAAP net income (loss), an indication of our GAAP cash flows from operations, a measure of our liquidity, or an indication of funds available for our cash needs. In addition, our methodology for calculating Distributable Earnings may differ from the methodologies employed by other companies to calculate the same or similar supplemental performance measures, and accordingly, our reported Distributable Earnings may not be comparable to the Distributable Earnings reported by other companies. Distributable Earnings 25 TPG RE Finance Trust, Inc.| 3Q2021
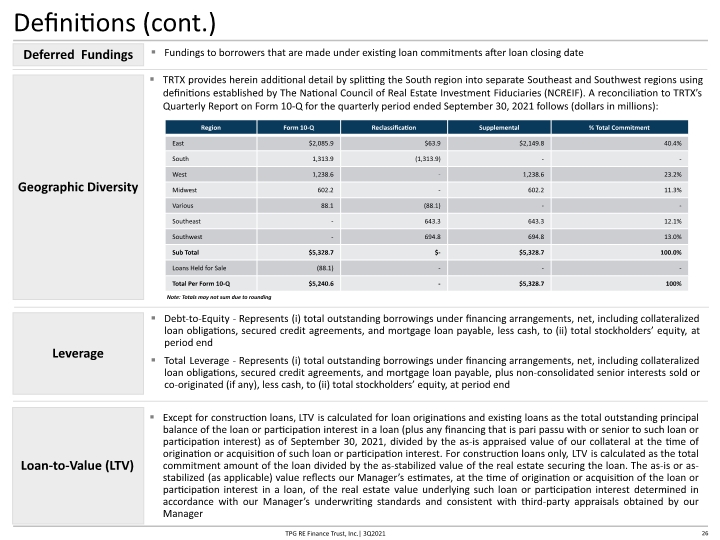
Definitions (cont.) Fundings to borrowers that are made under existing loan commitments after loan closing date Deferred Fundings Geographic Diversity TRTX provides herein additional detail by splitting the South region into separate Southeast and Southwest regions using definitions established by The National Council of Real Estate Investment Fiduciaries (NCREIF). A reconciliation to TRTX’s Quarterly Report on Form 10-Q for the quarterly period ended September 30, 2021 follows (dollars in millions): Note: Totals may not sum due to rounding 26 TPG RE Finance Trust, Inc.| 3Q2021 Except for construction loans, LTV is calculated for loan originations and existing loans as the total outstanding principal balance of the loan or participation interest in a loan (plus any financing that is pari passu with or senior to such loan or participation interest) as of September 30, 2021, divided by the as-is appraised value of our collateral at the time of origination or acquisition of such loan or participation interest. For construction loans only, LTV is calculated as the total commitment amount of the loan divided by the as-stabilized value of the real estate securing the loan. The as-is or as-stabilized (as applicable) value reflects our Manager’s estimates, at the time of origination or acquisition of the loan or participation interest in a loan, of the real estate value underlying such loan or participation interest determined in accordance with our Manager’s underwriting standards and consistent with third-party appraisals obtained by our Manager Loan-to-Value (LTV) Debt-to-Equity - Represents (i) total outstanding borrowings under financing arrangements, net, including collateralized loan obligations, secured credit agreements, and mortgage loan payable, less cash, to (ii) total stockholders’ equity, at period end Total Leverage - Represents (i) total outstanding borrowings under financing arrangements, net, including collateralized loan obligations, secured credit agreements, and mortgage loan payable, plus non-consolidated senior interests sold or co-originated (if any), less cash, to (ii) total stockholders’ equity, at period end Leverage
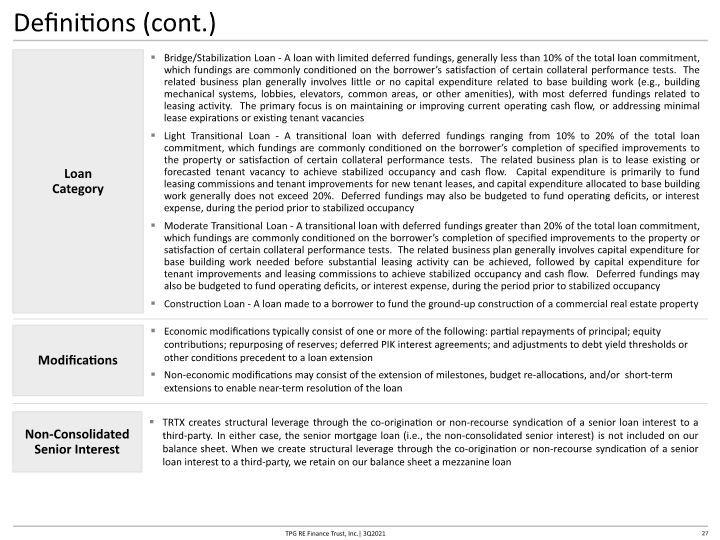
Definitions (cont.) 27 TPG RE Finance Trust, Inc.| 3Q2021 Bridge/Stabilization Loan - A loan with limited deferred fundings, generally less than 10% of the total loan commitment, which fundings are commonly conditioned on the borrower’s satisfaction of certain collateral performance tests. The related business plan generally involves little or no capital expenditure related to base building work (e.g., building mechanical systems, lobbies, elevators, common areas, or other amenities), with most deferred fundings related to leasing activity. The primary focus is on maintaining or improving current operating cash flow, or addressing minimal lease expirations or existing tenant vacancies Light Transitional Loan - A transitional loan with deferred fundings ranging from 10% to 20% of the total loan commitment, which fundings are commonly conditioned on the borrower’s completion of specified improvements to the property or satisfaction of certain collateral performance tests. The related business plan is to lease existing or forecasted tenant vacancy to achieve stabilized occupancy and cash flow. Capital expenditure is primarily to fund leasing commissions and tenant improvements for new tenant leases, and capital expenditure allocated to base building work generally does not exceed 20%. Deferred fundings may also be budgeted to fund operating deficits, or interest expense, during the period prior to stabilized occupancy Moderate Transitional Loan - A transitional loan with deferred fundings greater than 20% of the total loan commitment, which fundings are commonly conditioned on the borrower’s completion of specified improvements to the property or satisfaction of certain collateral performance tests. The related business plan generally involves capital expenditure for base building work needed before substantial leasing activity can be achieved, followed by capital expenditure for tenant improvements and leasing commissions to achieve stabilized occupancy and cash flow. Deferred fundings may also be budgeted to fund operating deficits, or interest expense, during the period prior to stabilized occupancy Construction Loan - A loan made to a borrower to fund the ground-up construction of a commercial real estate property Loan Category Modifications Economic modifications typically consist of one or more of the following: partial repayments of principal; equity contributions; repurposing of reserves; deferred PIK interest agreements; and adjustments to debt yield thresholds or other conditions precedent to a loan extension Non-economic modifications may consist of the extension of milestones, budget re-allocations, and/or short-term extensions to enable near-term resolution of the loan Non-Consolidated Senior Interest TRTX creates structural leverage through the co-origination or non-recourse syndication of a senior loan interest to a third-party. In either case, the senior mortgage loan (i.e., the non-consolidated senior interest) is not included on our balance sheet. When we create structural leverage through the co-origination or non-recourse syndication of a senior loan interest to a third-party, we retain on our balance sheet a mezzanine loan
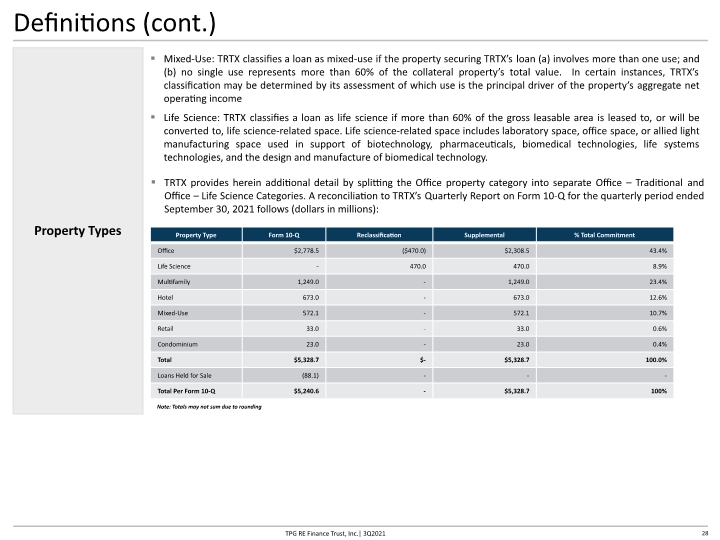
Definitions (cont.) 28 TPG RE Finance Trust, Inc.| 3Q2021 Property Types Mixed-Use: TRTX classifies a loan as mixed-use if the property securing TRTX’s loan (a) involves more than one use; and (b) no single use represents more than 60% of the collateral property’s total value. In certain instances, TRTX’s classification may be determined by its assessment of which use is the principal driver of the property’s aggregate net operating income Life Science: TRTX classifies a loan as life science if more than 60% of the gross leasable area is leased to, or will be converted to, life science-related space. Life science-related space includes laboratory space, office space, or allied light manufacturing space used in support of biotechnology, pharmaceuticals, biomedical technologies, life systems technologies, and the design and manufacture of biomedical technology. Note: Totals may not sum due to rounding TRTX provides herein additional detail by splitting the Office property category into separate Office – Traditional and Office – Life Science Categories. A reconciliation to TRTX’s Quarterly Report on Form 10-Q for the quarterly period ended September 30, 2021 follows (dollars in millions):
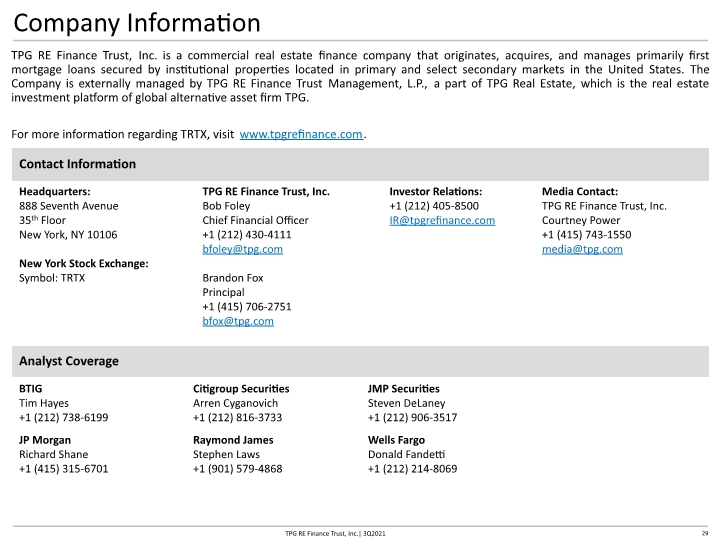
Company Information TPG RE Finance Trust, Inc. is a commercial real estate finance company that originates, acquires, and manages primarily first mortgage loans secured by institutional properties located in primary and select secondary markets in the United States. The Company is externally managed by TPG RE Finance Trust Management, L.P., a part of TPG Real Estate, which is the real estate investment platform of global alternative asset firm TPG. For more information regarding TRTX, visit www.tpgrefinance.com. 29 TPG RE Finance Trust, Inc.| 3Q2021


