
Investor Presentation January 2025 On solid footing for sustained growth 1 Exhibit 99.2
This presentation may include forward- looking statements. All statements other than statements of historical facts contained in this presentation, including statements regarding our future results of operations and financial position, strategy and plans, industry environment, potential growth opportunities, and our expectations for future operations, are forward-looking statements. The words “believe,” “may,” “will,” “estimate,” “continue,” “anticipate,” “design,” “intend,” “expect,” “could,” “plan,” “potential,” “predict,” “seek,” “should,” “would,” or the negative version of these words and similar expressions are intended to identify forward-looking statements. We have based these forward-looking statements on our current expectations and projections about future events and trends that we believe may affect our financial condition, results of operations, strategy, short- and long-term business operations and objectives, and financial needs. These forward-looking statements are subject to a number of risks, uncertainties and assumptions. These risks and uncertainties, many of which are beyond our control, include risks described in the section entitled Risk Factors in our filings made with the Securities and Exchange Commission (the “SEC”), including our Form 10-K for the year ended December 31, 2023, and any subsequent Quarterly Report on Form 10-Q or Current Report on Form 8-K. Except as required by applicable law, we do not plan to publicly update or revise any forward-looking statements contained herein, whether as a result of any new information, future events, changed circumstances or otherwise. No representations or warranties (expressed or implied) are made about the accuracy of any such forward-looking statements. Moreover, we operate in a very competitive and rapidly changing environment. New risks emerge from time to time. It is not possible for our management to predict all risks, nor can we assess the impact of all factors on our business or the extent to which any factor, or combination of factors, may cause actual results to differ materially from those contained in any forward-looking statements we may make. In light of these risks, uncertainties and assumptions, the forward-looking events and circumstances discussed in this presentation may not occur and actual results could differ materially and adversely from those anticipated or implied in the forward-looking statements. You should not rely upon forward-looking statements as predictions of future events. Although we believe that the expectations reflected in the forward-looking statements are reasonable, we cannot guarantee that the future results, levels of activity, performance or events and circumstances reflected in the forward-looking statements will be achieved or occur. Moreover, except as required by law, neither we nor any other person assumes responsibility for the accuracy and completeness of the forward-looking statements. We undertake no obligation to update publicly any forward-looking statements for any reason after the date of this presentation to conform these statements to actual results or to changes in our expectations. This presentation also contains estimates and other statistical data made by independent parties and by us relating to market size and growth and other data about our industry. This data involves a number of assumptions and limitations, and you are cautioned not to give undue weight to such estimates. In addition, projections, assumptions, and estimates of our future performance and the future performance of the markets in which we operate are necessarily subject to a high degree of uncertainty and risk. By attending or receiving this presentation you acknowledge that you will be solely responsible for your own assessment of the market and our market position and that you will conduct your own analysis and be solely responsible for forming your own view of the potential future performance of our business. Forward-Looking Statements 2

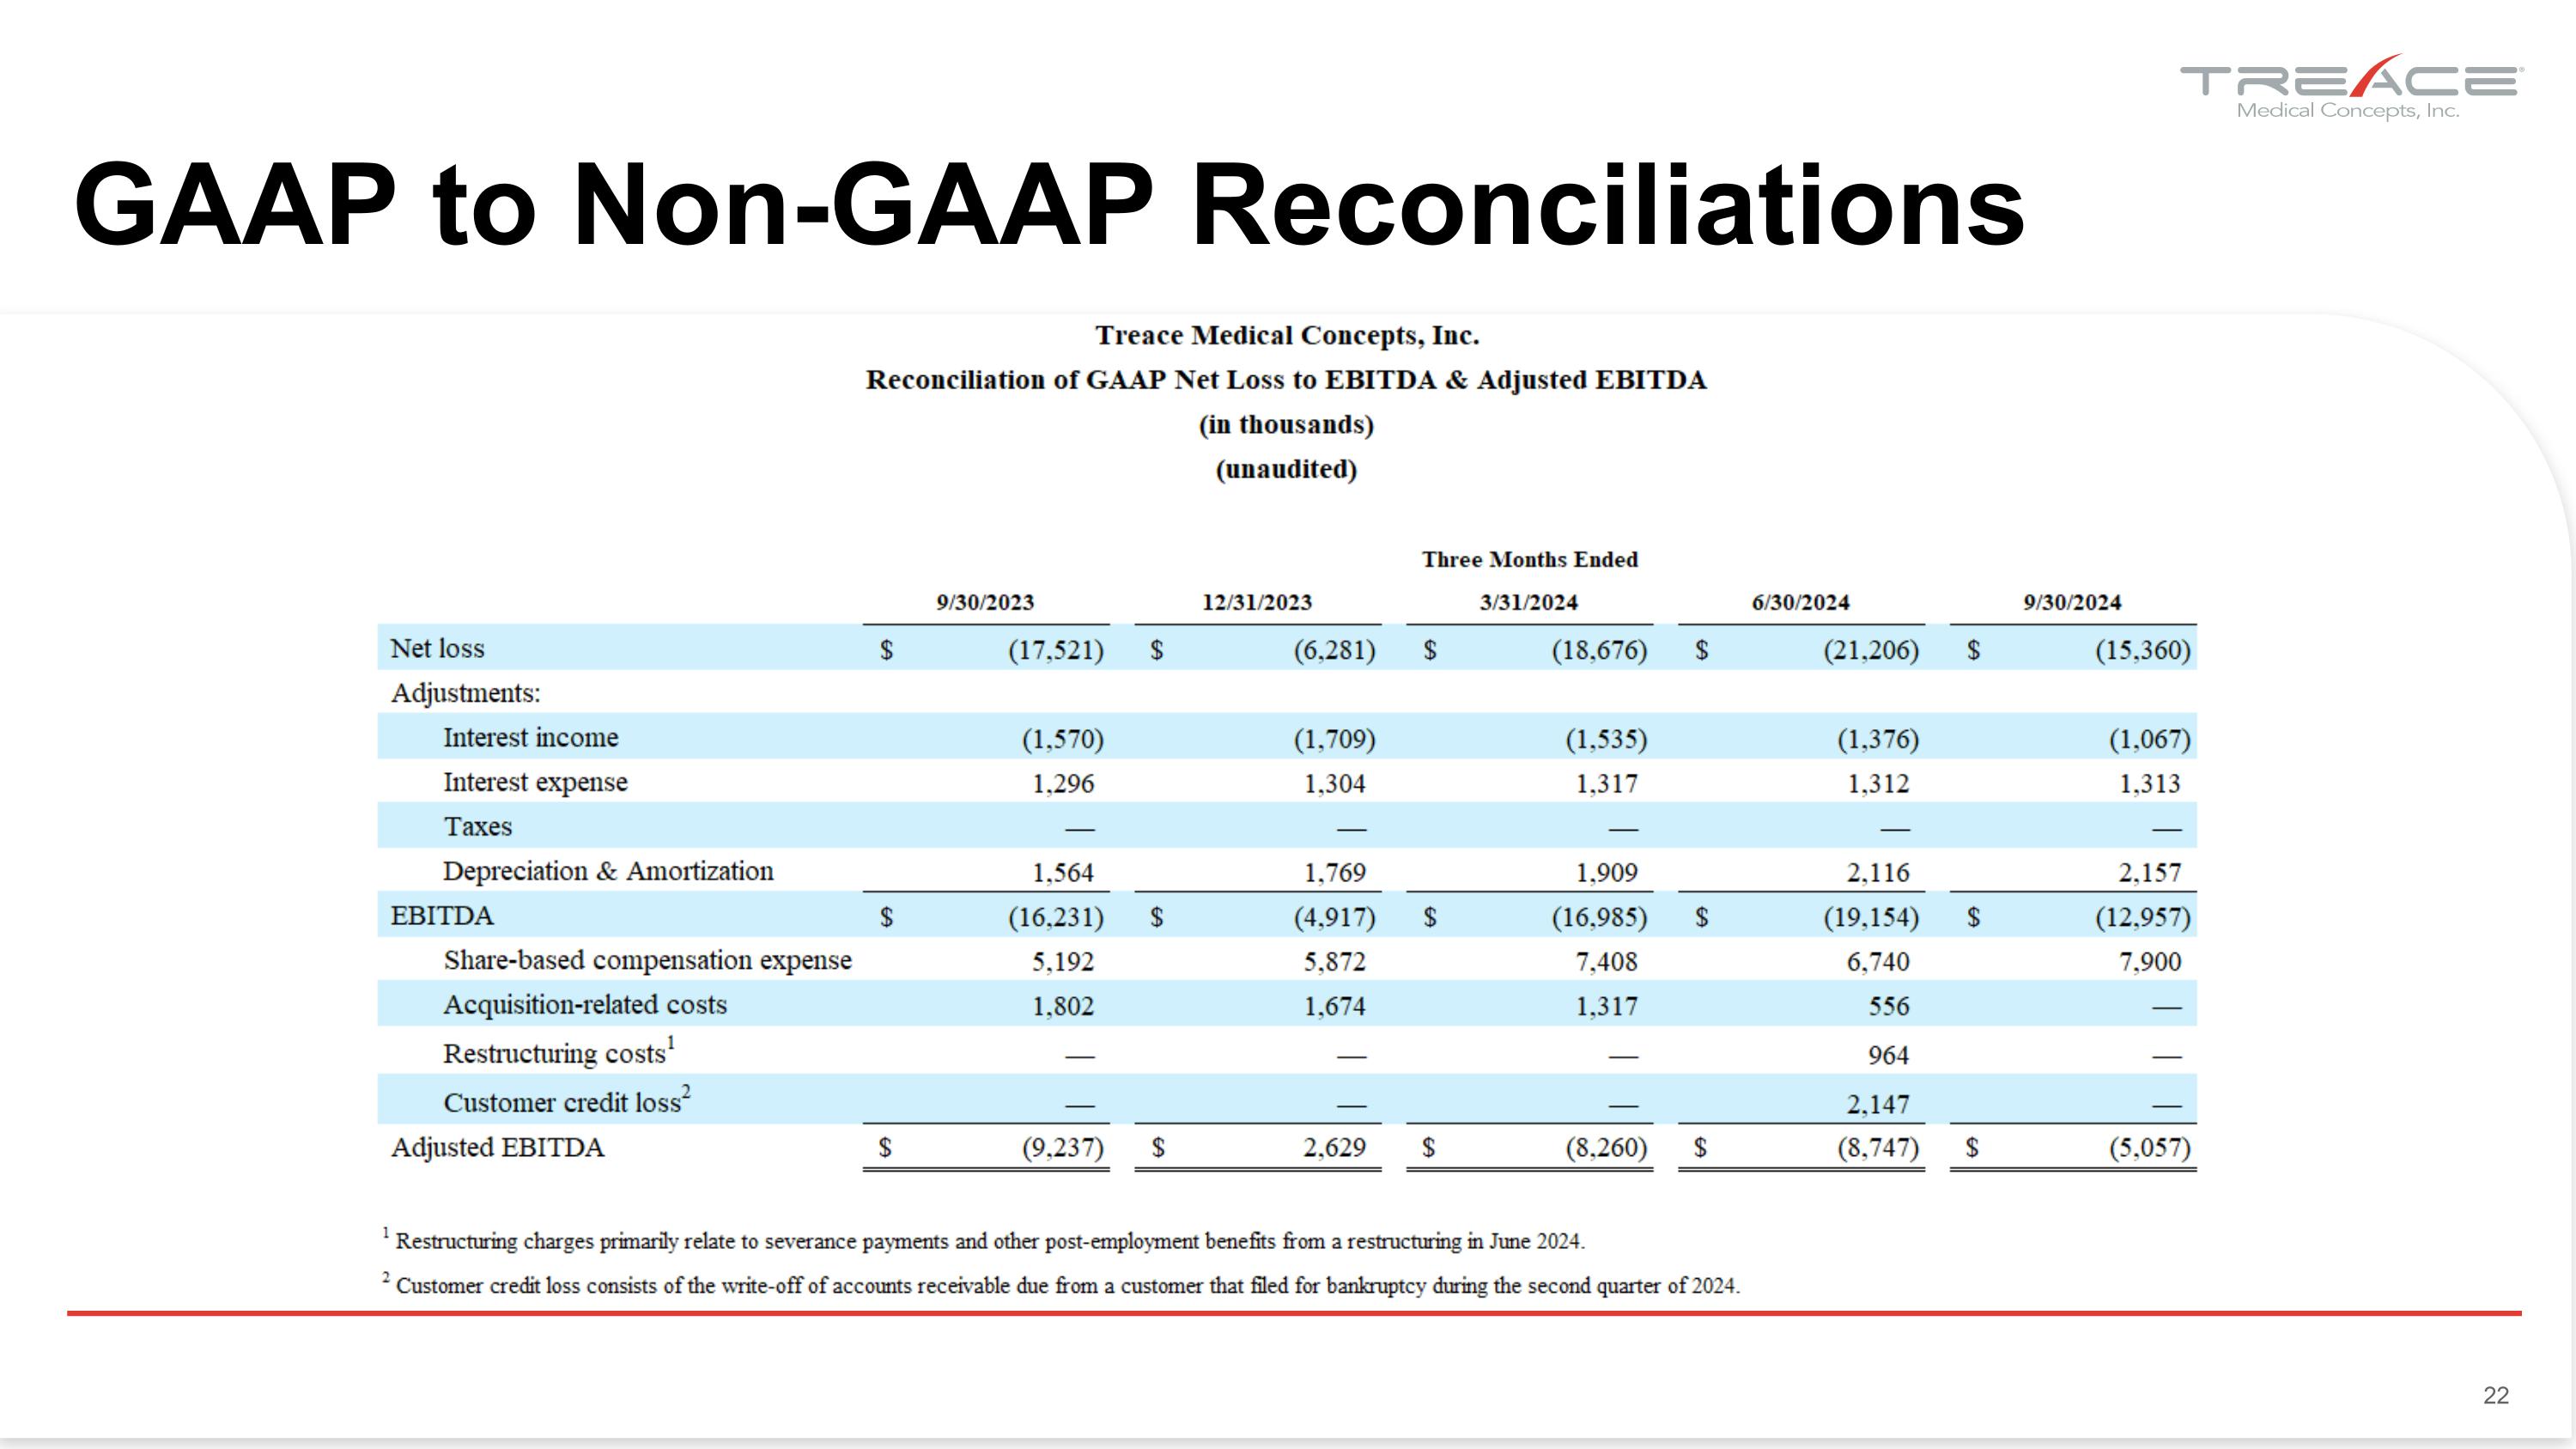
Non-GAAP Financial Measures 3 To supplement the financial results presented in accordance with GAAP, this presentation presents Adjusted EBITDA, which the Company defines as net loss before depreciation and amortization expense, interest income, interest expense, taxes, share-based compensation expense, acquisition-related costs, restructuring costs, customer credit loss and debt extinguishment loss. Non-GAAP financial measures such as Adjusted EBITDA are presented in addition to, and not as a substitute for, or superior to, financial measures calculated in accordance with GAAP. Management uses these non-GAAP financial measures to evaluate the Company’s operating performance and trends, as well as for making planning decisions. The Company believes that Adjusted EBITDA helps to identify underlying trends in the Company’s business that may otherwise be masked by the effect of the income and expenses and other items that it excludes in its calculation of Adjusted EBITDA. Accordingly, the Company believes these non-GAAP financial measures provide useful information to investors and others in understanding and evaluating the Company’s operating results, enhancing the overall understanding of its past performance and future prospects, and allowing for greater transparency with respect to key financial metrics used by the Company’s management in their financial and operational decision-making. The Company also presents these non-GAAP financial measures because it believes investors, analysts and rating agencies consider them to be a useful metrics in measuring the Company’s performance against other companies and its ability to meet its debt service obligations. There are limitations related to the use of non-GAAP financial measures such as Adjusted EBITDA because they are not prepared in accordance with GAAP, may exclude significant income and expenses required by GAAP to be recognized in the Company’s financial statements, and may not be comparable to non-GAAP financial measures used by other companies. The Company encourages investors to carefully consider its results under GAAP, as well as its supplemental non‐GAAP information and the reconciliation between these presentations, to more fully understand its business. Reconciliations between GAAP and non‐GAAP results are included at the end of this presentation.
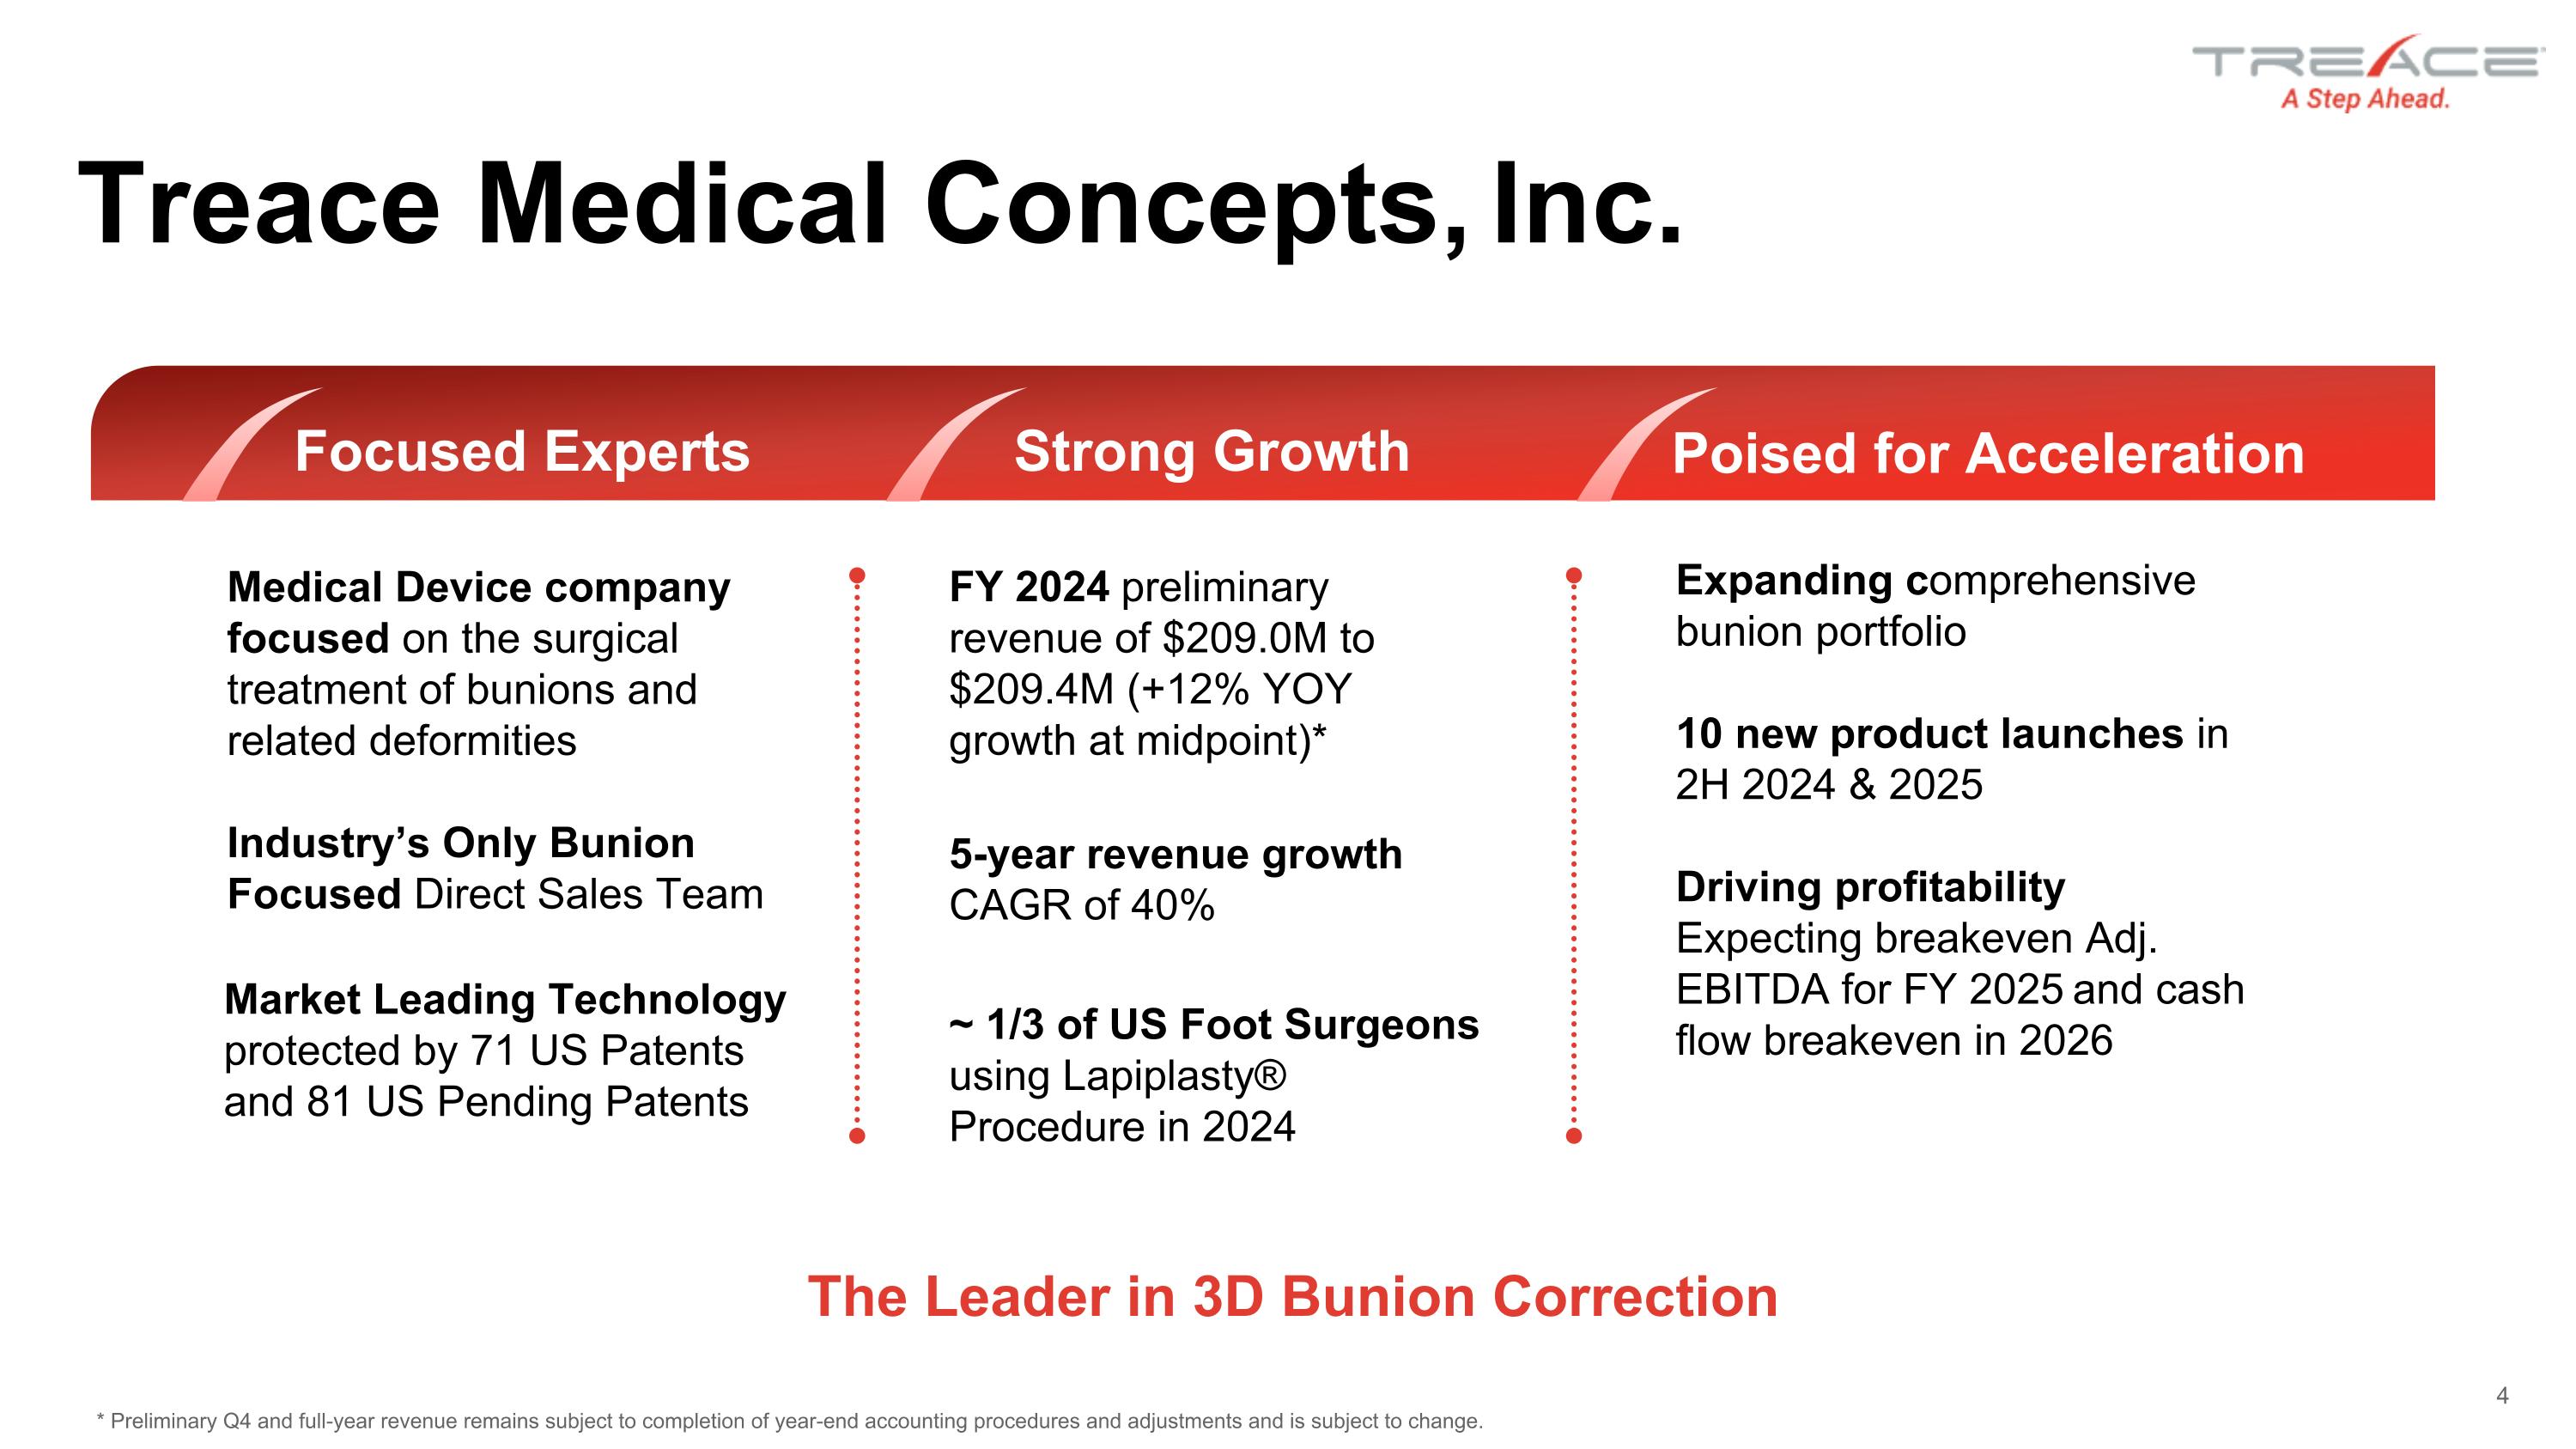
Treace Medical Concepts, Inc. Medical Device company focused on the surgical treatment of bunions and related deformities Industry’s Only Bunion Focused Direct Sales Team Market Leading Technology protected by 71 US Patents and 81 US Pending Patents Strong Growth FY 2024 preliminary revenue of $209.0M to $209.4M (+12% YOY growth at midpoint)* 5-year revenue growth CAGR of 40% ~ 1/3 of US Foot Surgeons using Lapiplasty® Procedure in 2024 Poised for Acceleration Expanding comprehensive bunion portfolio 10 new product launches in 2H 2024 & 2025 Driving profitability Expecting breakeven Adj. EBITDA for FY 2025 and cash flow breakeven in 2026 4 The Leader in 3D Bunion Correction Focused Experts * Preliminary Q4 and full-year revenue remains subject to completion of year-end accounting procedures and adjustments and is subject to change.

Emily Lapiplasty® patient $5B+ U.S. market opportunity A LARGE, underserved Bunions affect ~1 in 4 U.S. adults¹, a population of 65 million 10,000+ U.S. bunion surgeons 450k annual surgical procedures2: $2.3B current market 650k more in need of surgery: $3.3B market 5 Nix S, et al. J Foot Ankle Res 2010 iData Research, Inc., 2022
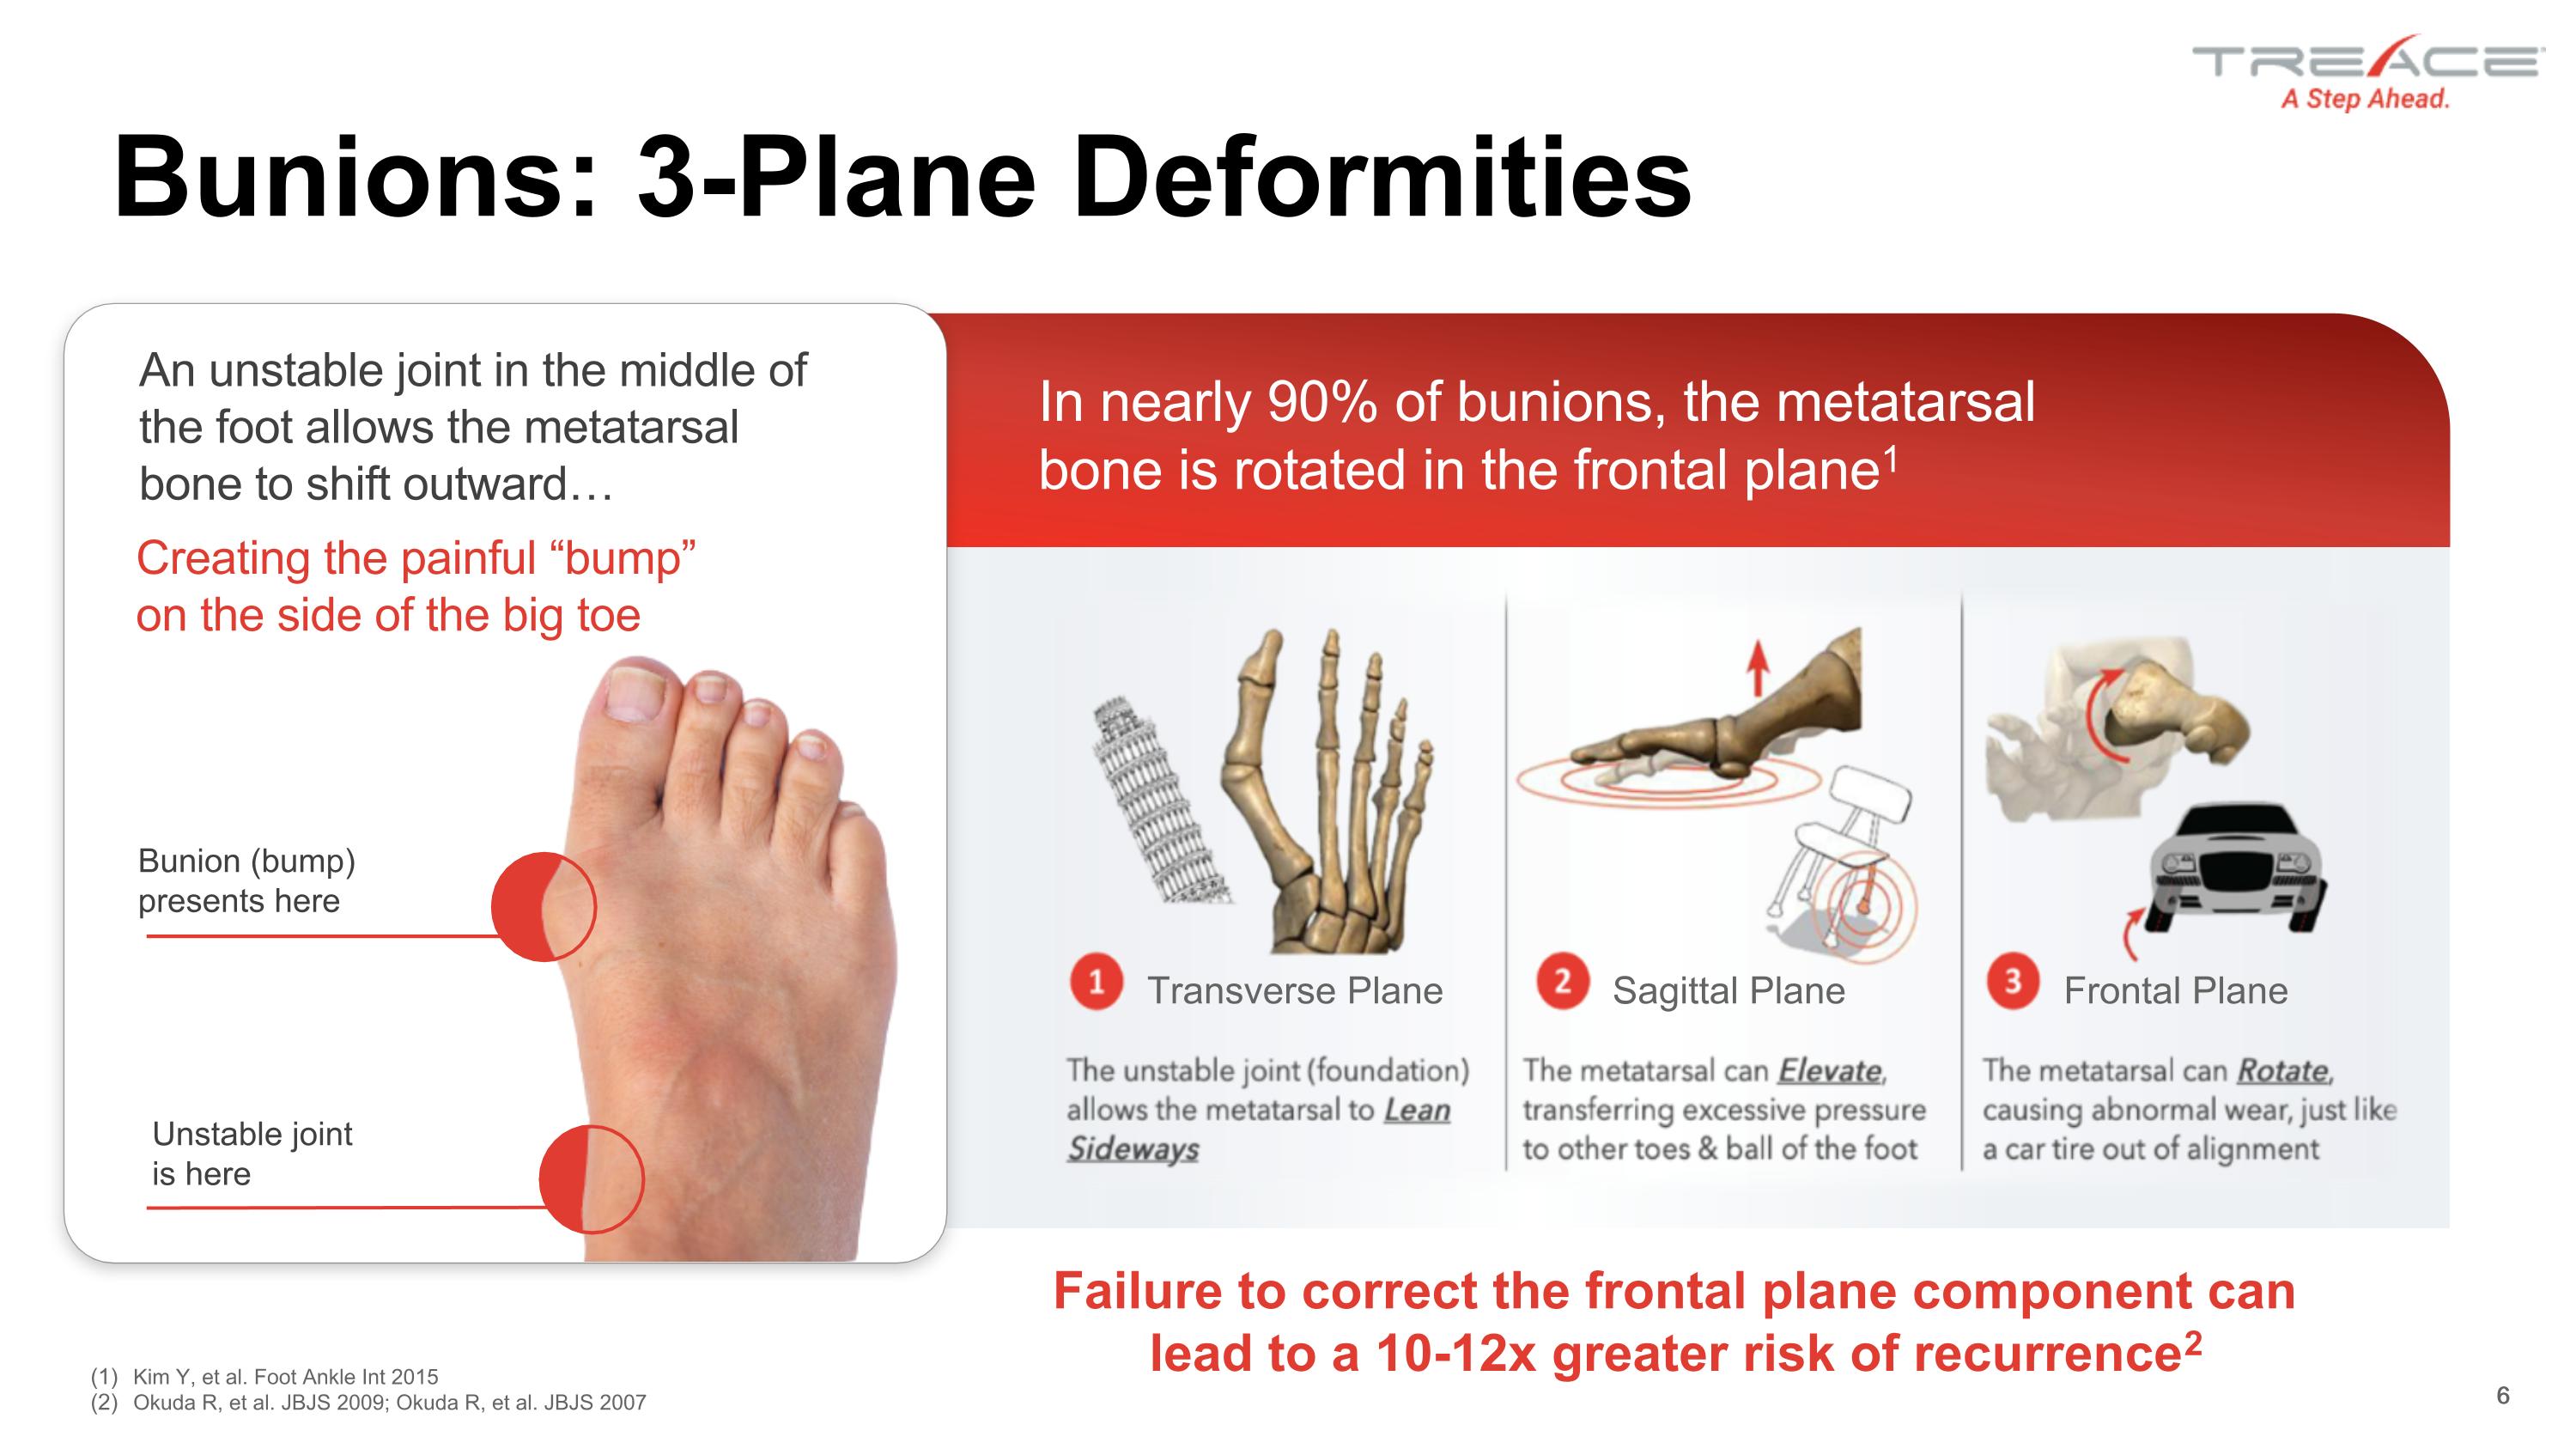
Transverse Plane Sagittal Plane Frontal Plane Bunions: 3-Plane Deformities 6 An unstable joint in the middle of the foot allows the metatarsal bone to shift outward… Bunion (bump) �presents here Unstable joint �is here In nearly 90% of bunions, the metatarsal bone is rotated in the frontal plane1 Creating the painful “bump” �on the side of the big toe Kim Y, et al. Foot Ankle Int 2015 Okuda R, et al. JBJS 2009; Okuda R, et al. JBJS 2007 6 Failure to correct the frontal plane component can lead to a 10-12x greater risk of recurrence2
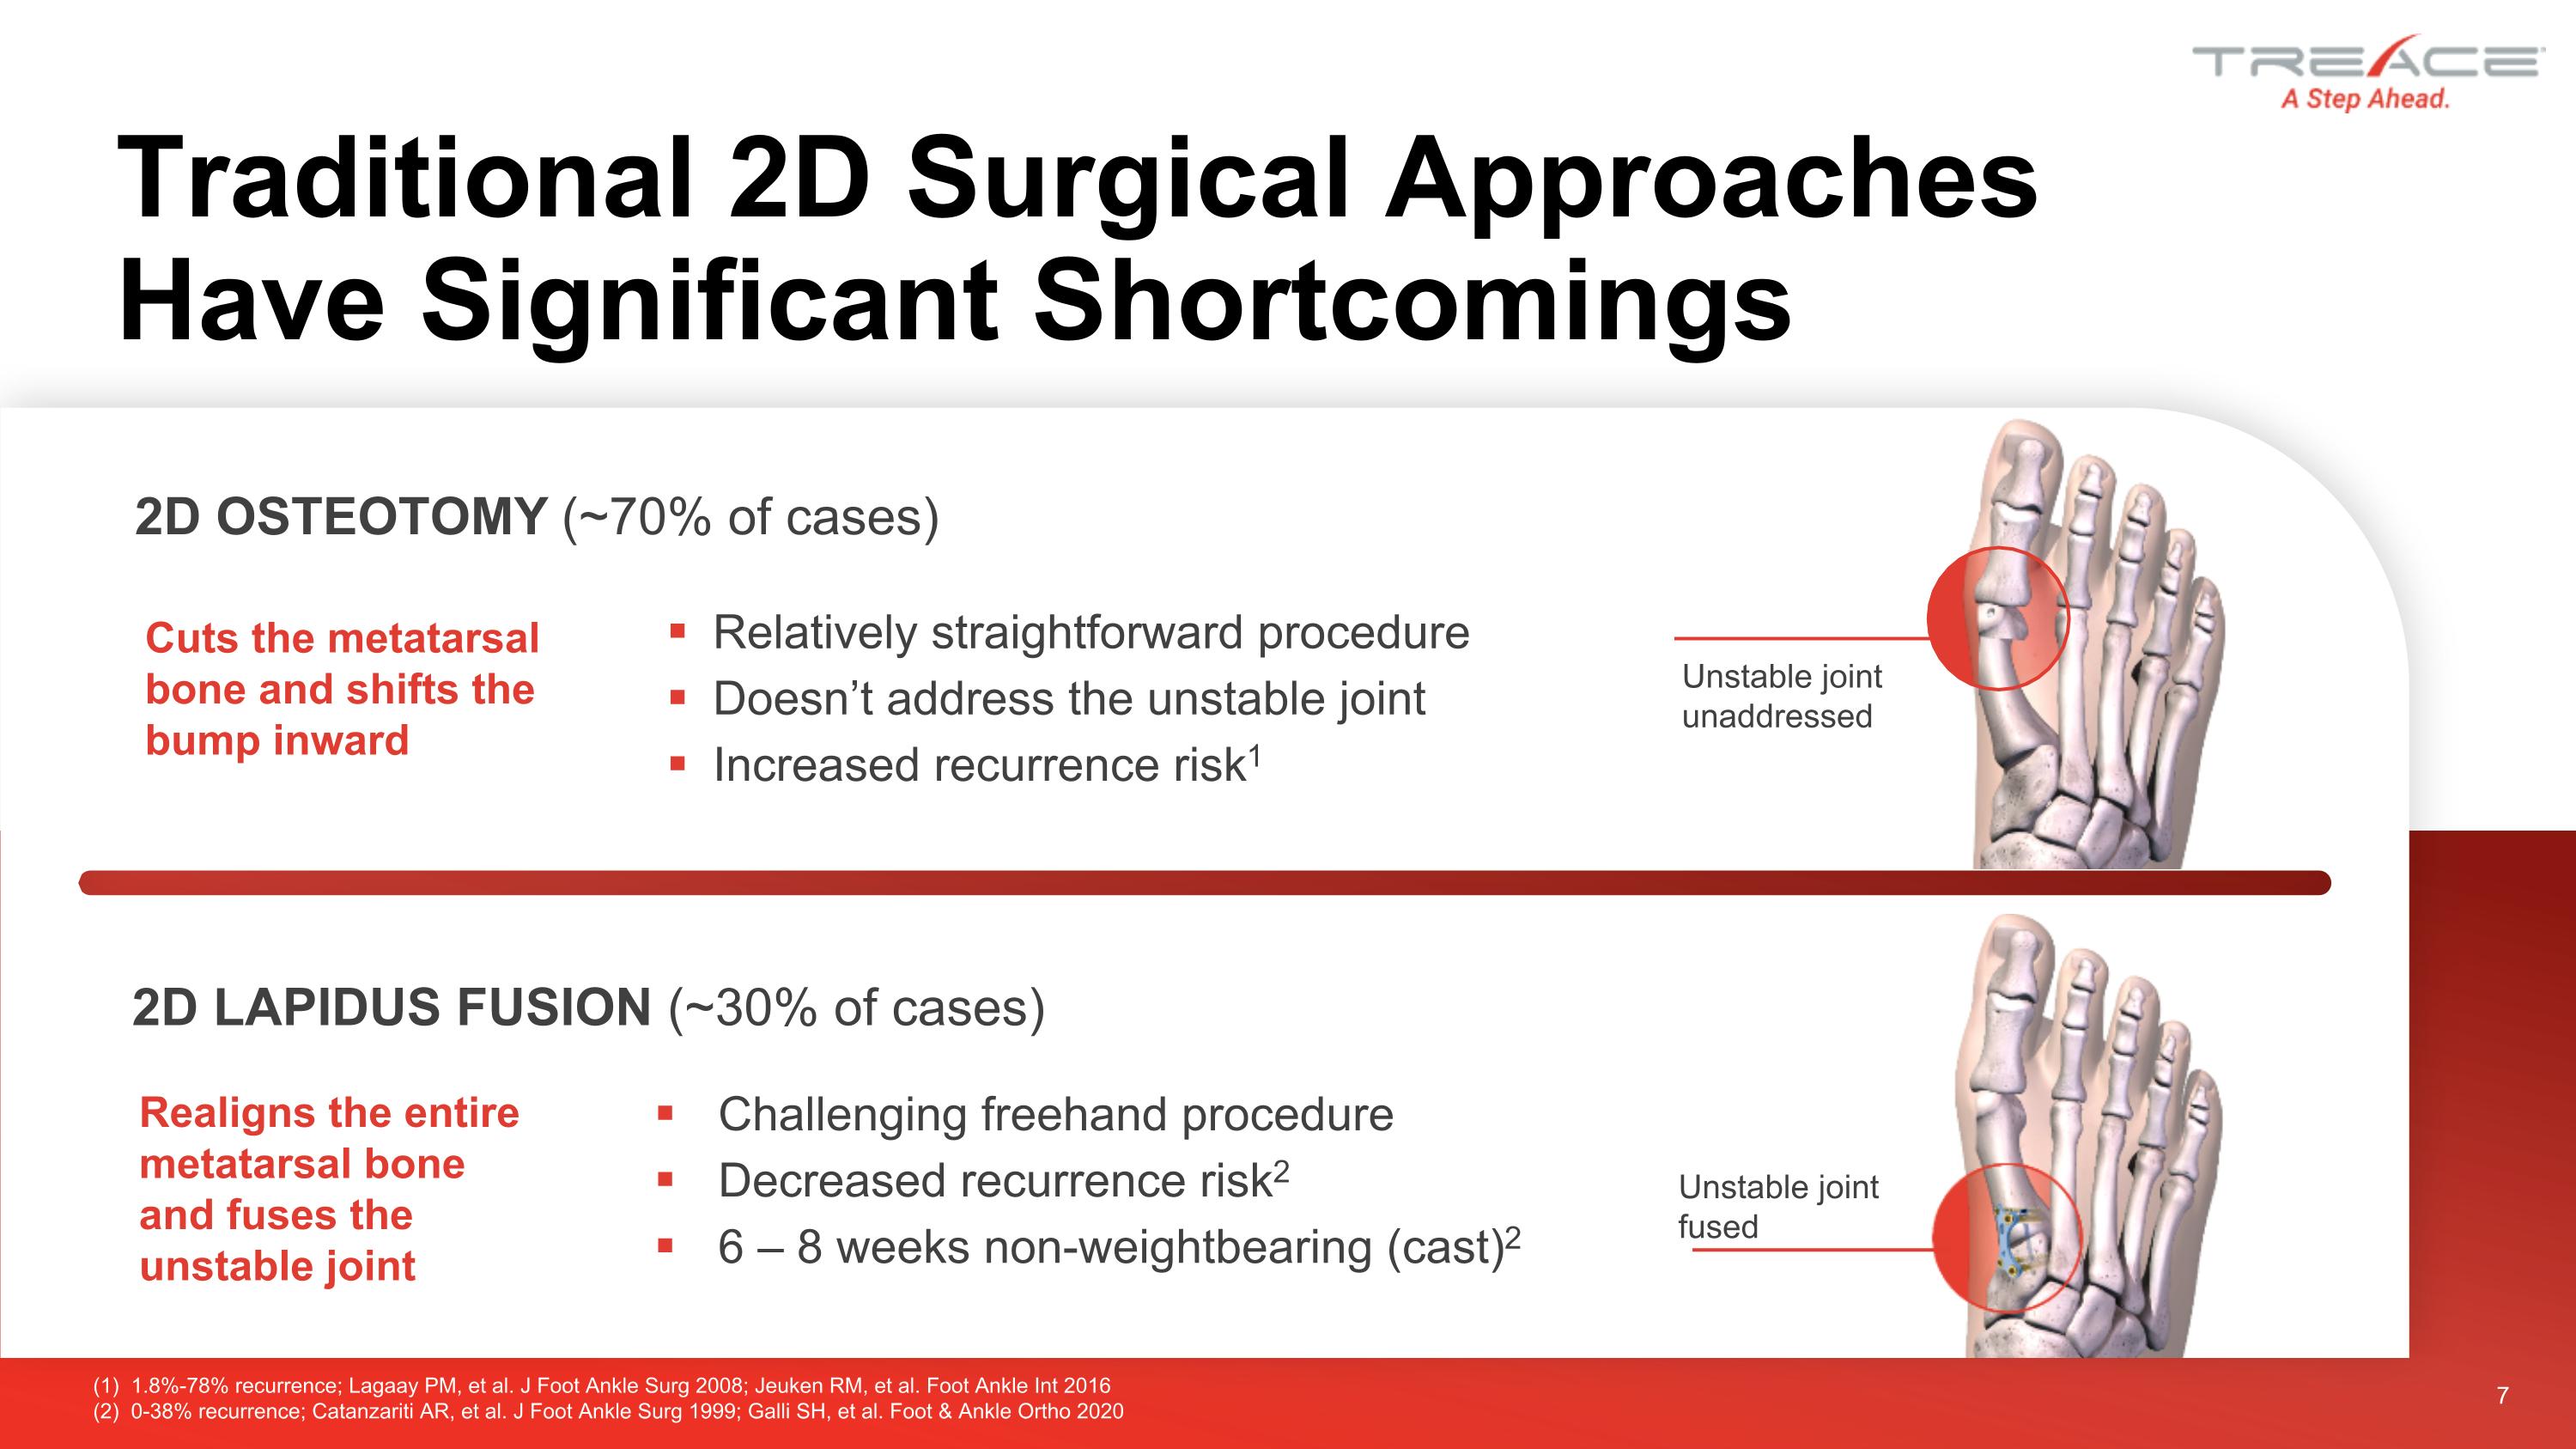
Traditional 2D Surgical Approaches Have Significant Shortcomings 7 Relatively straightforward procedure Doesn’t address the unstable joint Increased recurrence risk1 2D OSTEOTOMY (~70% of cases) Cuts the metatarsal bone and shifts the bump inward 2D LAPIDUS FUSION (~30% of cases) Realigns the entire metatarsal bone and fuses the unstable joint Challenging freehand procedure Decreased recurrence risk2 6 – 8 weeks non-weightbearing (cast)2 (1) 1.8%-78% recurrence; Lagaay PM, et al. J Foot Ankle Surg 2008; Jeuken RM, et al. Foot Ankle Int 2016 (2) 0-38% recurrence; Catanzariti AR, et al. J Foot Ankle Surg 1999; Galli SH, et al. Foot & Ankle Ortho 2020 Unstable joint unaddressed Unstable joint fused
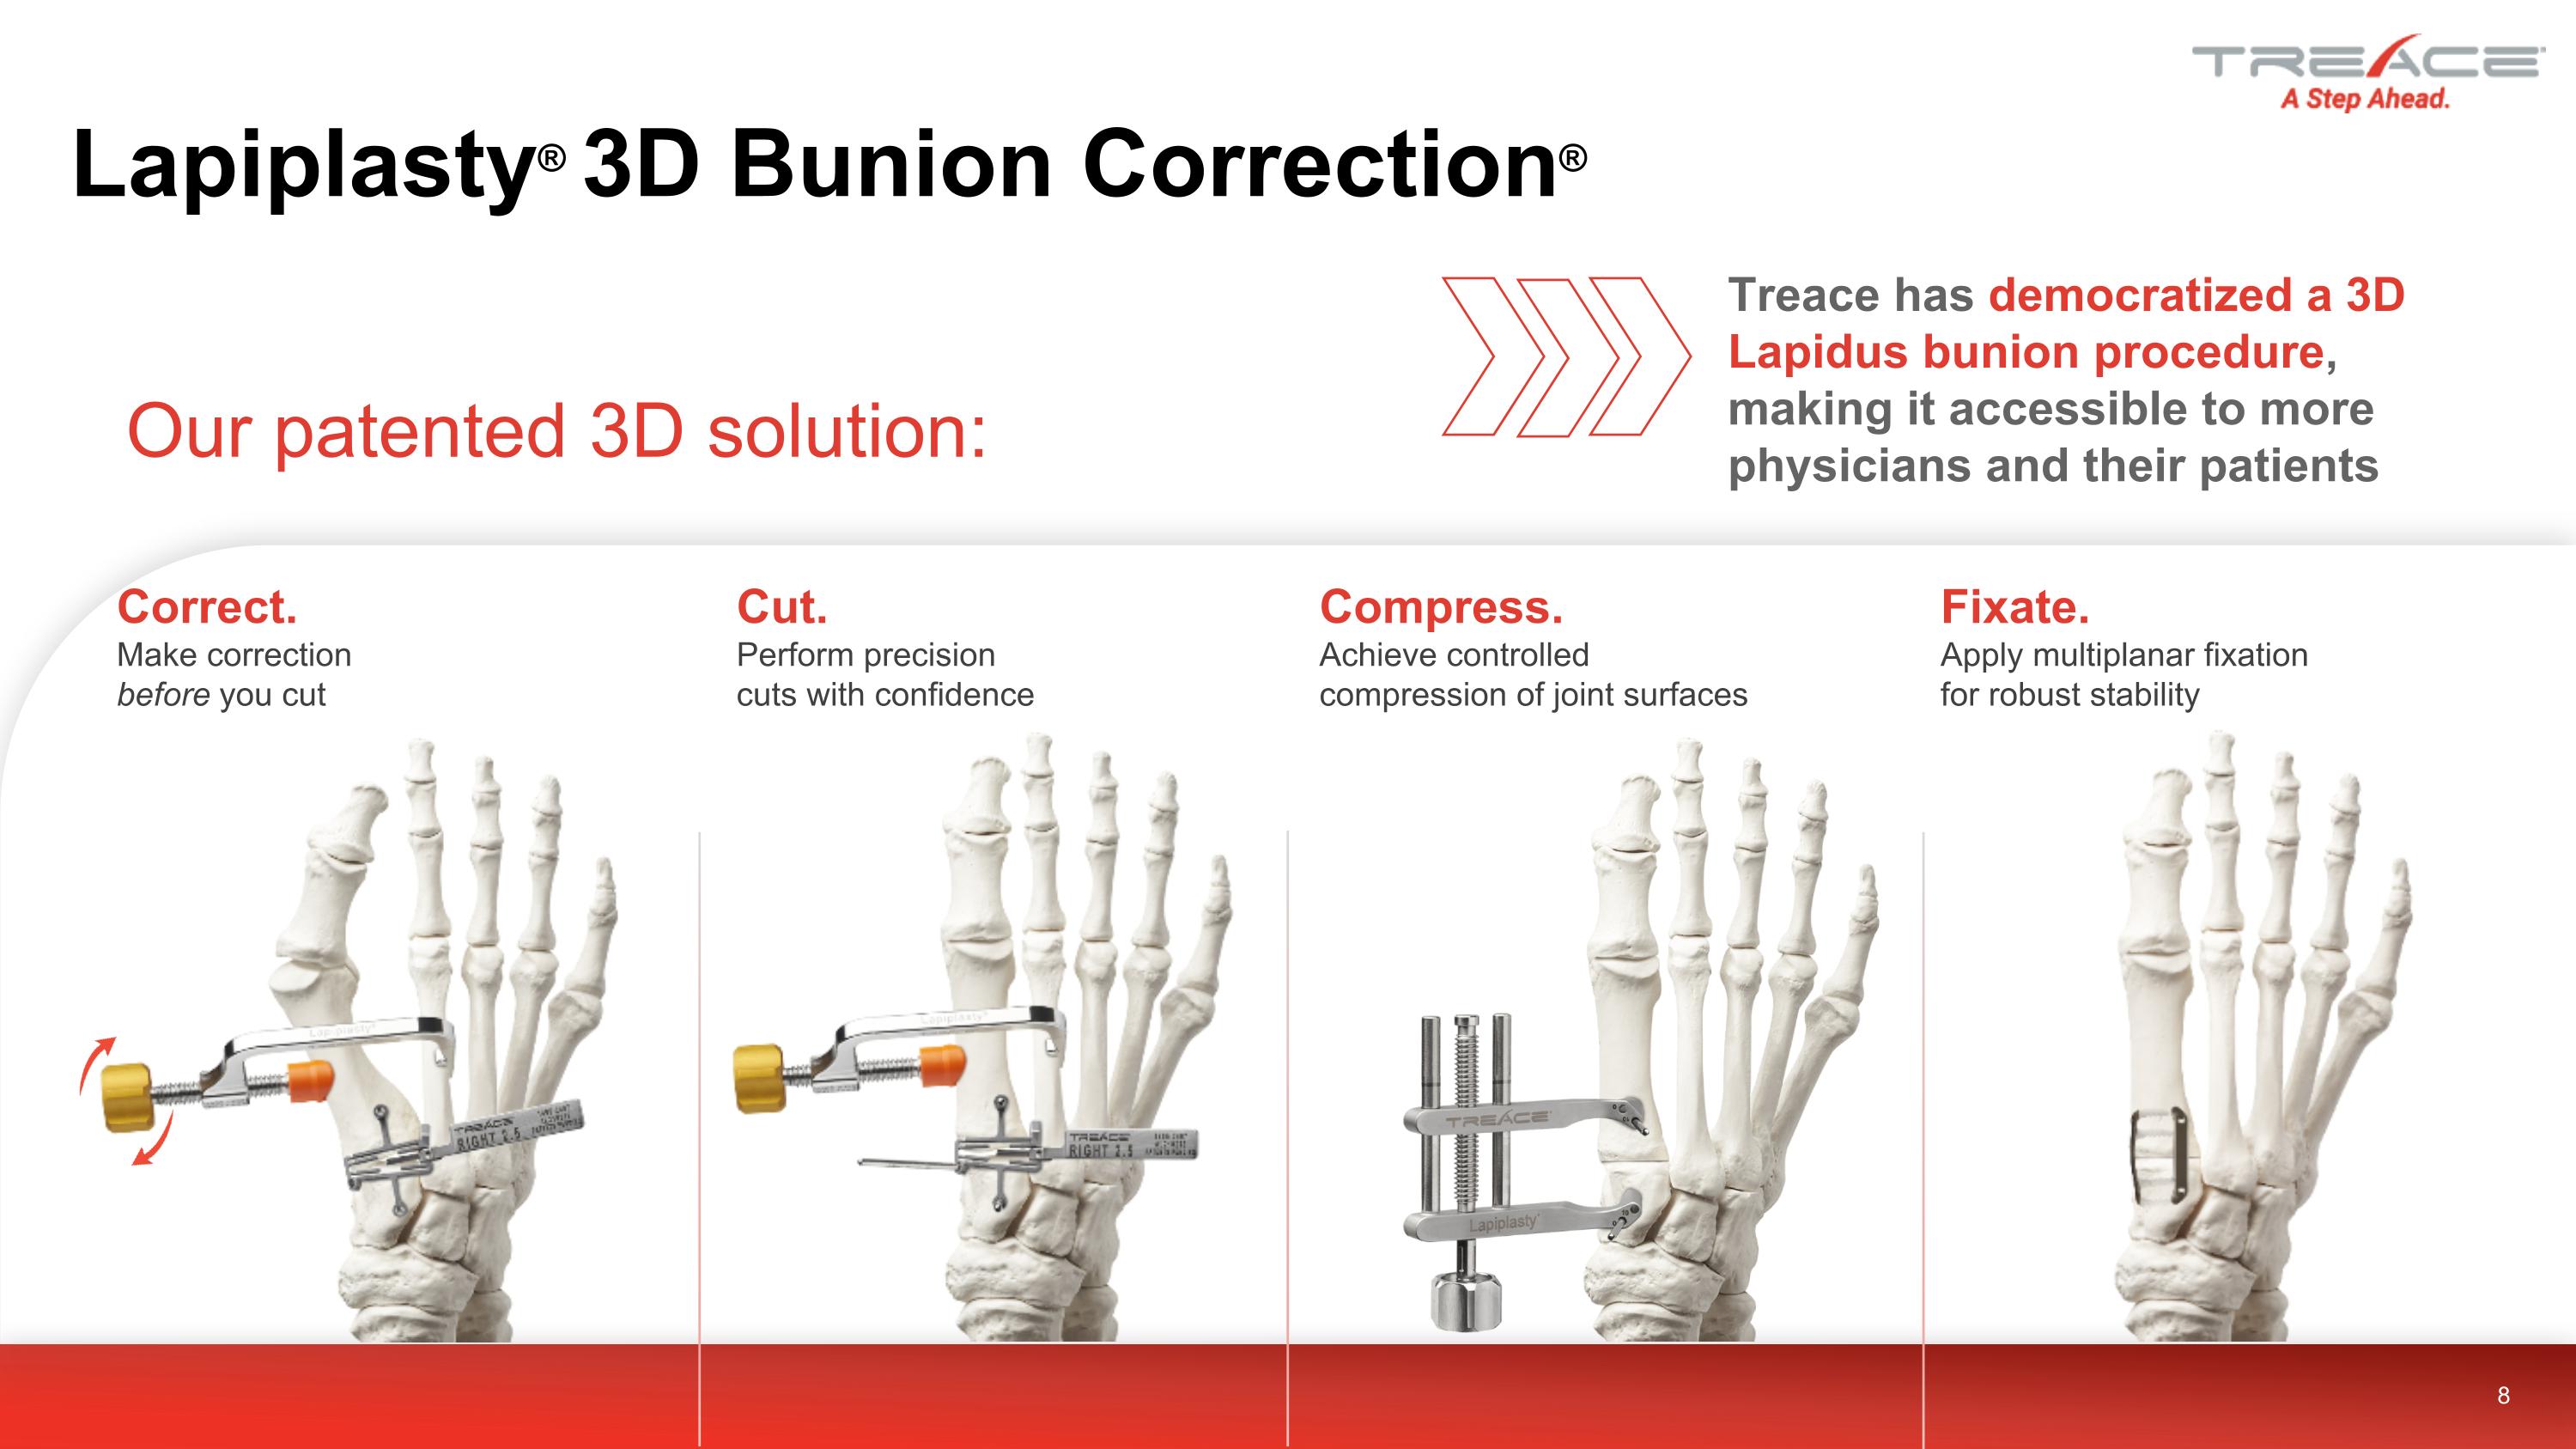
Lapiplasty® 3D Bunion Correction® Our patented 3D solution: 8 Correct. Make correction before you cut Fixate. Apply multiplanar fixation for robust stability Cut. Perform precision cuts with confidence Compress. Achieve controlled compression of joint surfaces Treace has democratized a 3D Lapidus bunion procedure, making it accessible to more physicians and their patients
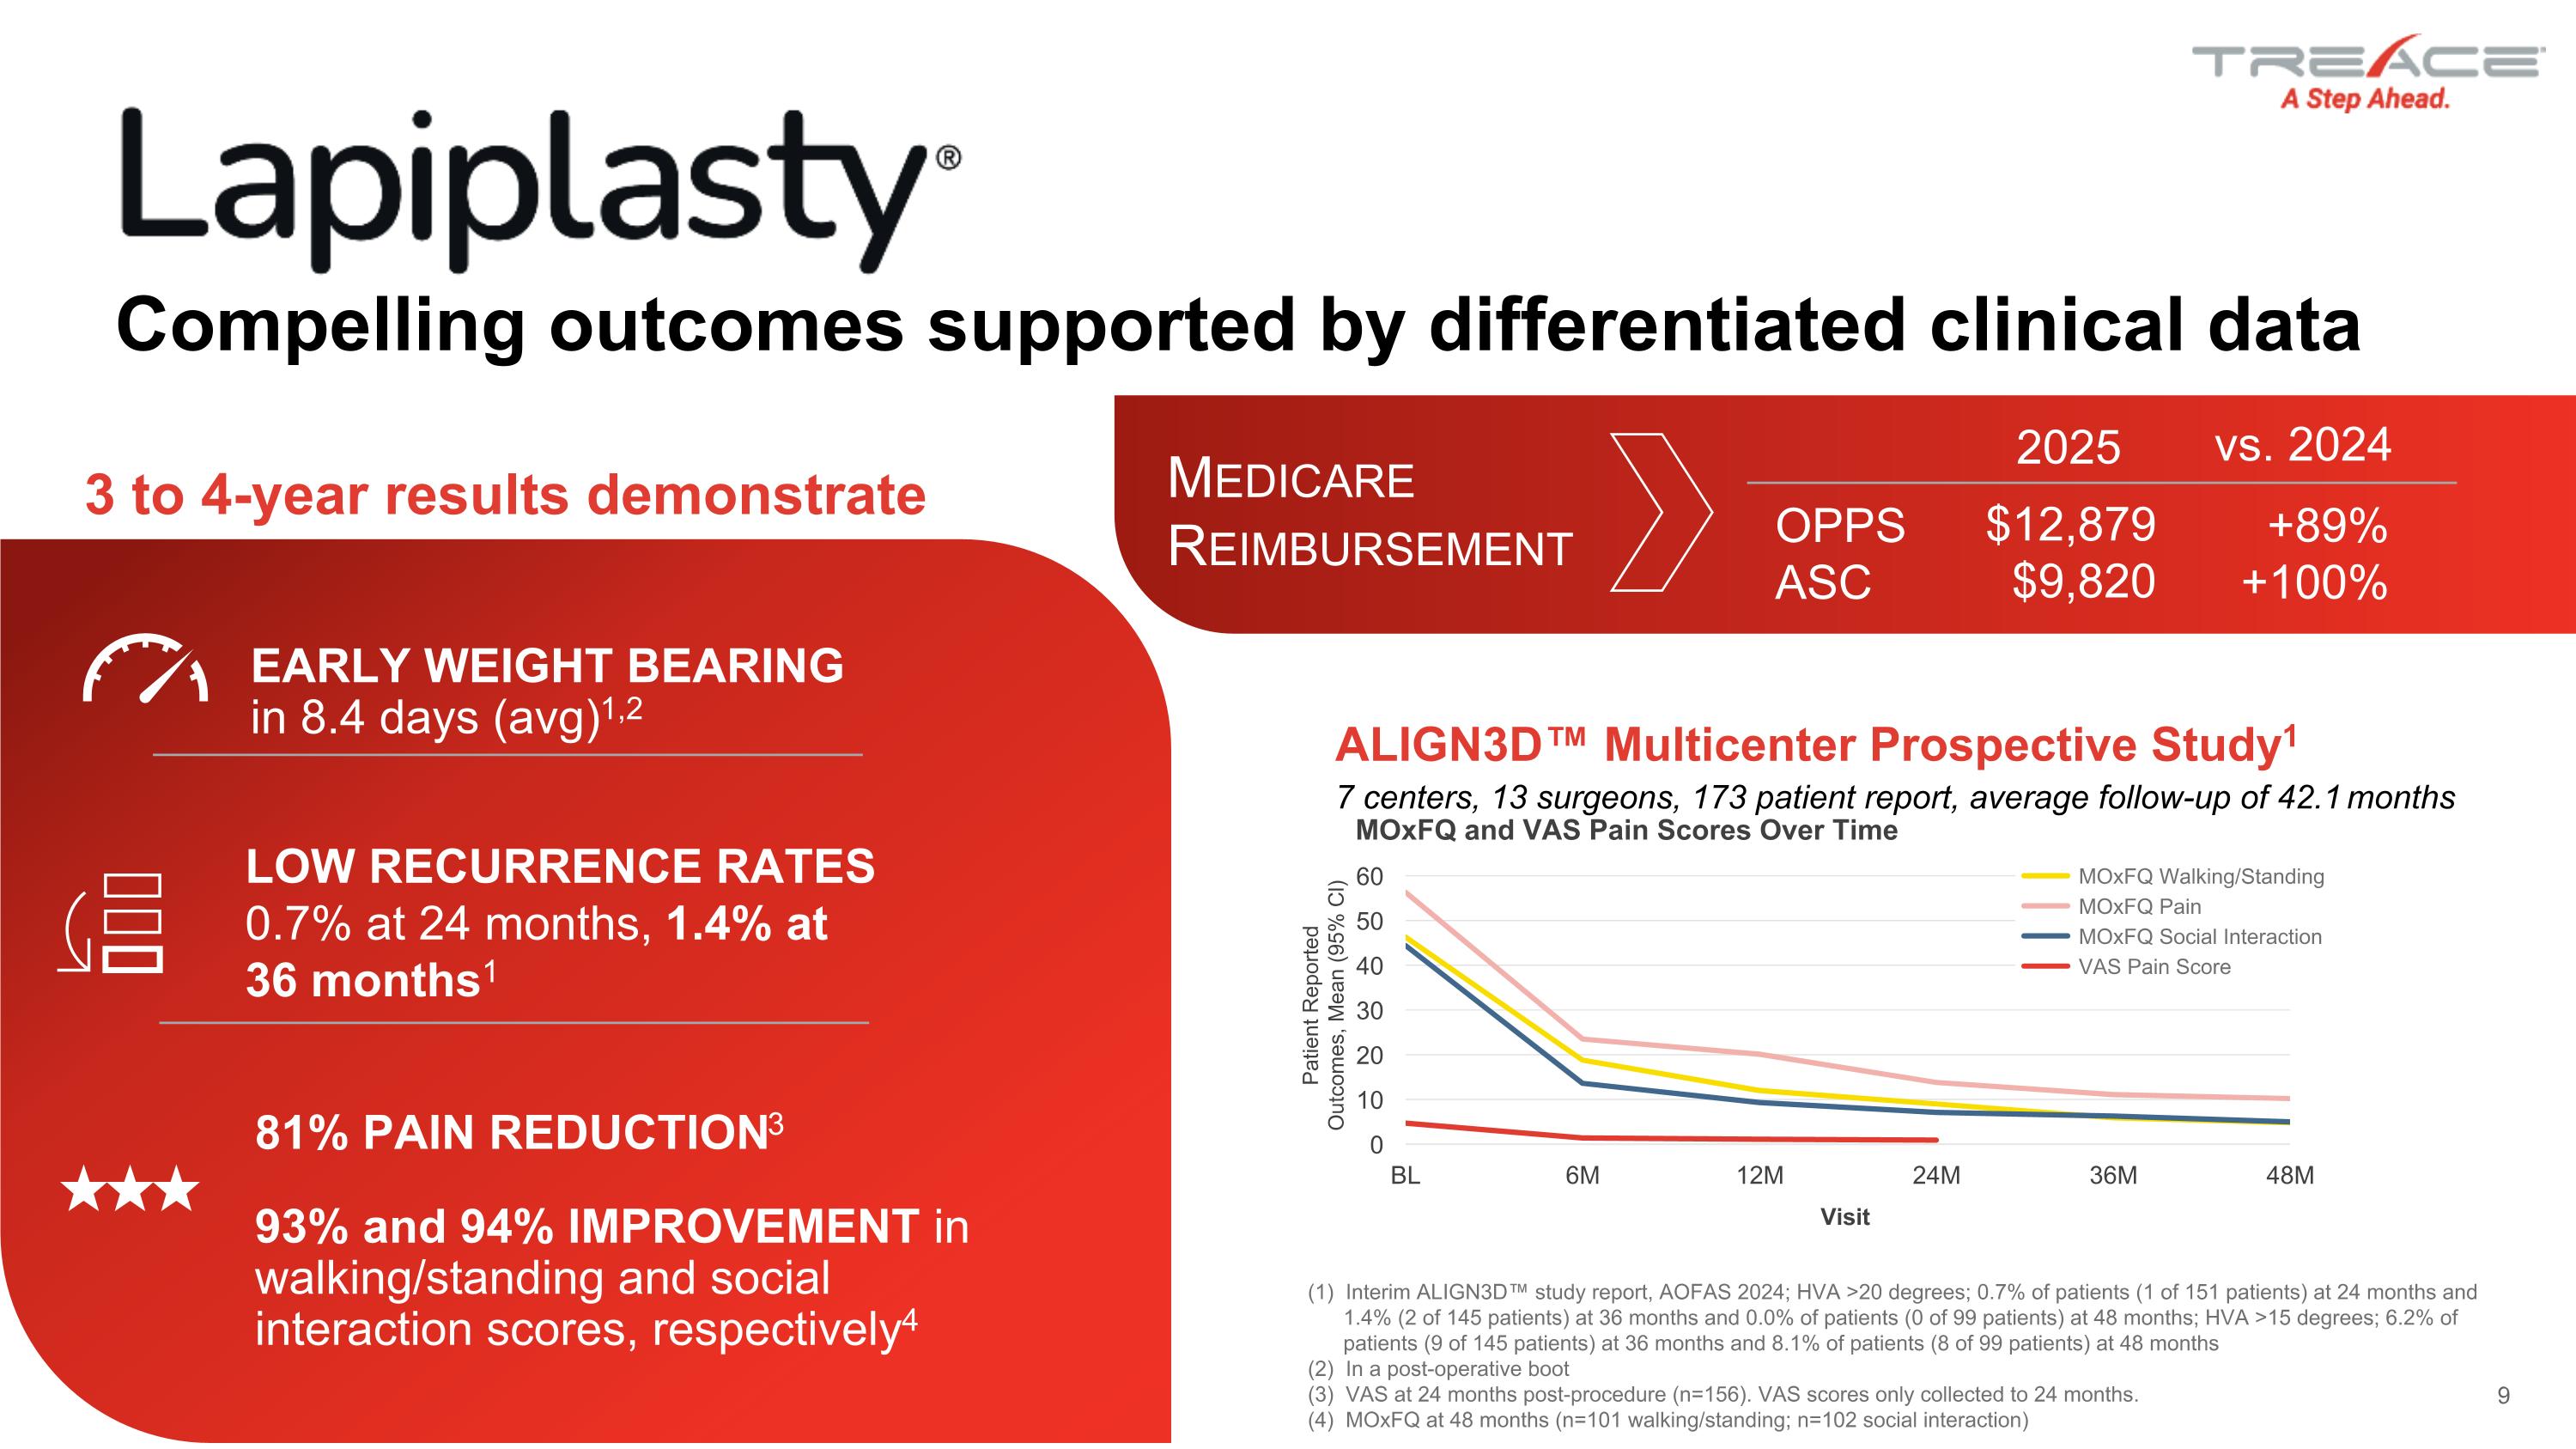
Patient Reported Outcomes, Mean (95% Cl) Visit MOxFQ and VAS Pain Scores Over Time Compelling outcomes supported by differentiated clinical data EARLY WEIGHT BEARING in 8.4 days (avg)1,2 (1) Interim ALIGN3D™ study report, AOFAS 2024; HVA >20 degrees; 0.7% of patients (1 of 151 patients) at 24 months and 1.4% (2 of 145 patients) at 36 months and 0.0% of patients (0 of 99 patients) at 48 months; HVA >15 degrees; 6.2% of patients (9 of 145 patients) at 36 months and 8.1% of patients (8 of 99 patients) at 48 months (2) In a post-operative boot (3) VAS at 24 months post-procedure (n=156). VAS scores only collected to 24 months. (4) MOxFQ at 48 months (n=101 walking/standing; n=102 social interaction) ALIGN3D™ Multicenter Prospective Study1 7 centers, 13 surgeons, 173 patient report, average follow-up of 42.1 months 81% pain reduction3 93% and 94% improvement in walking/standing and social interaction scores, respectively4 Low recurrence rates 0.7% at 24 months, 1.4% at 36 months1 3 to 4-year results demonstrate OPPS ASC $12,879 $9,820 +89% +100% 2025 vs. 2024 Medicare Reimbursement

Expanding comprehensive bunion portfolio 10 new product launches in 2H 2024 & 2025 Addressing all bunion types with new platforms �and technologies Poised for acceleration 10
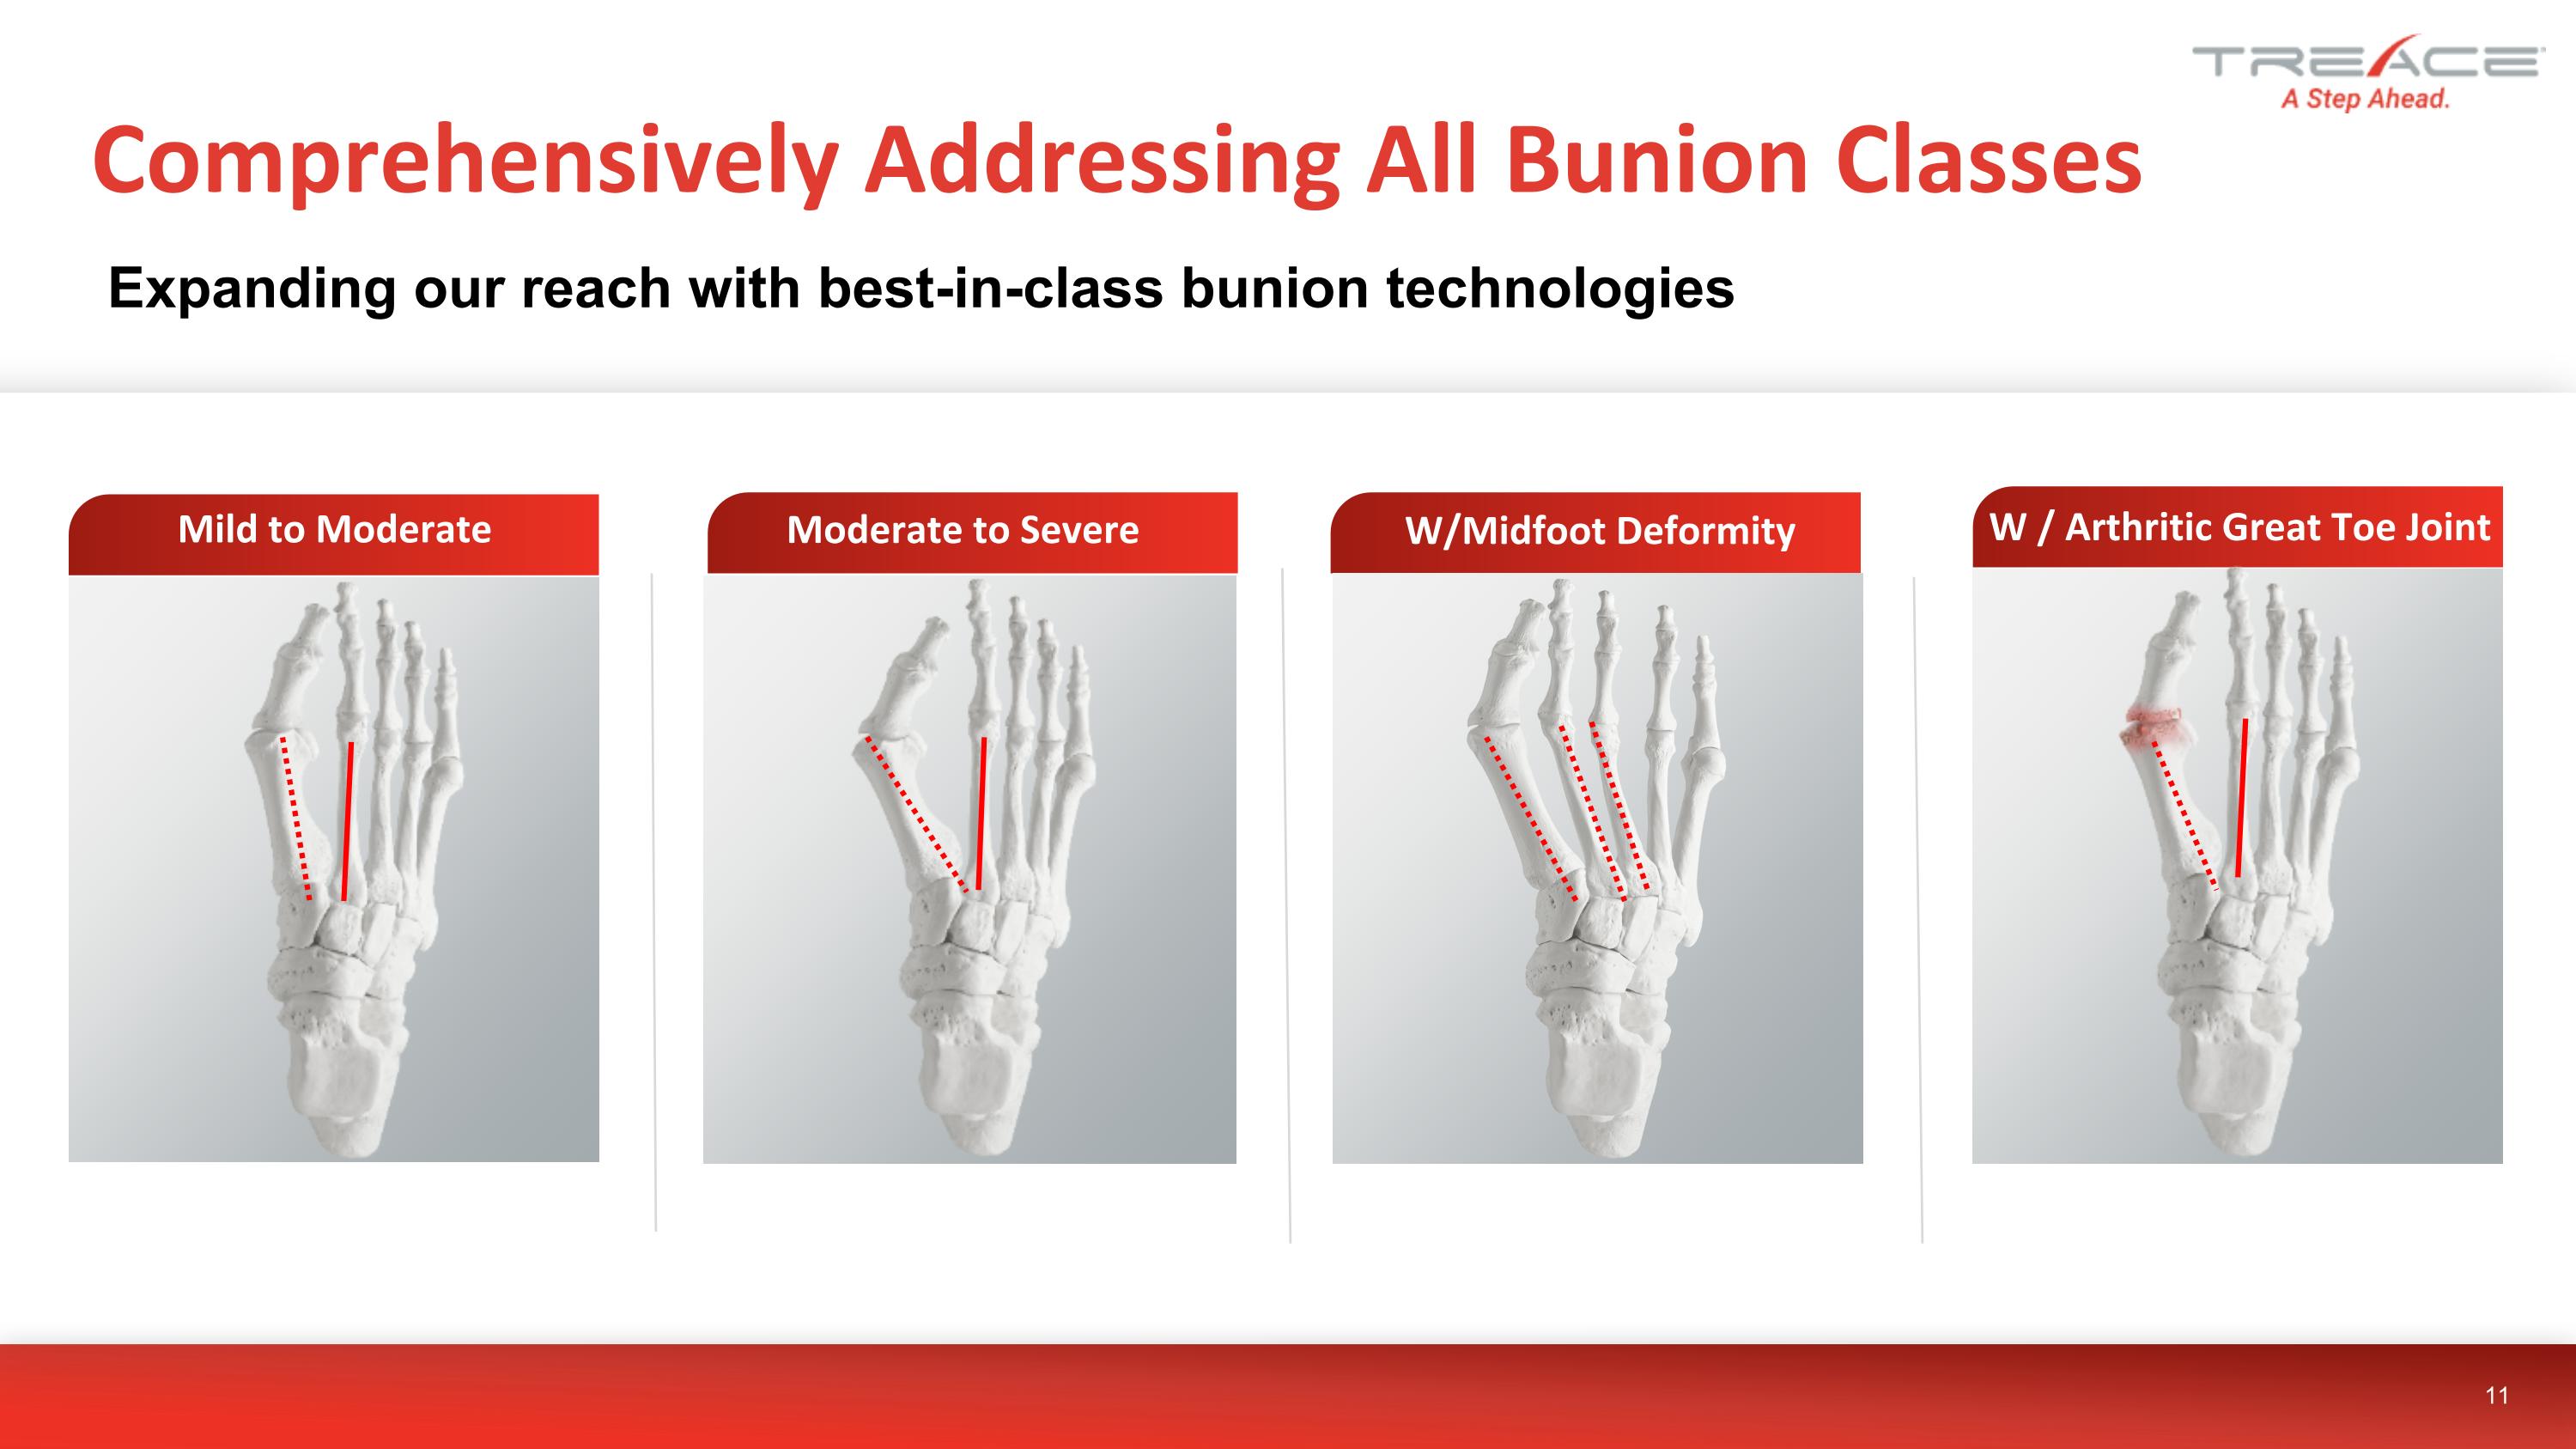
US Bunion Opportunity - Treace Flagship Platforms Mild to Moderate Moderate to Severe W/Midfoot Deformity W / Arthritic Great Toe Joint Comprehensively Addressing All Bunion Classes 11 Expanding our reach with best-in-class bunion technologies
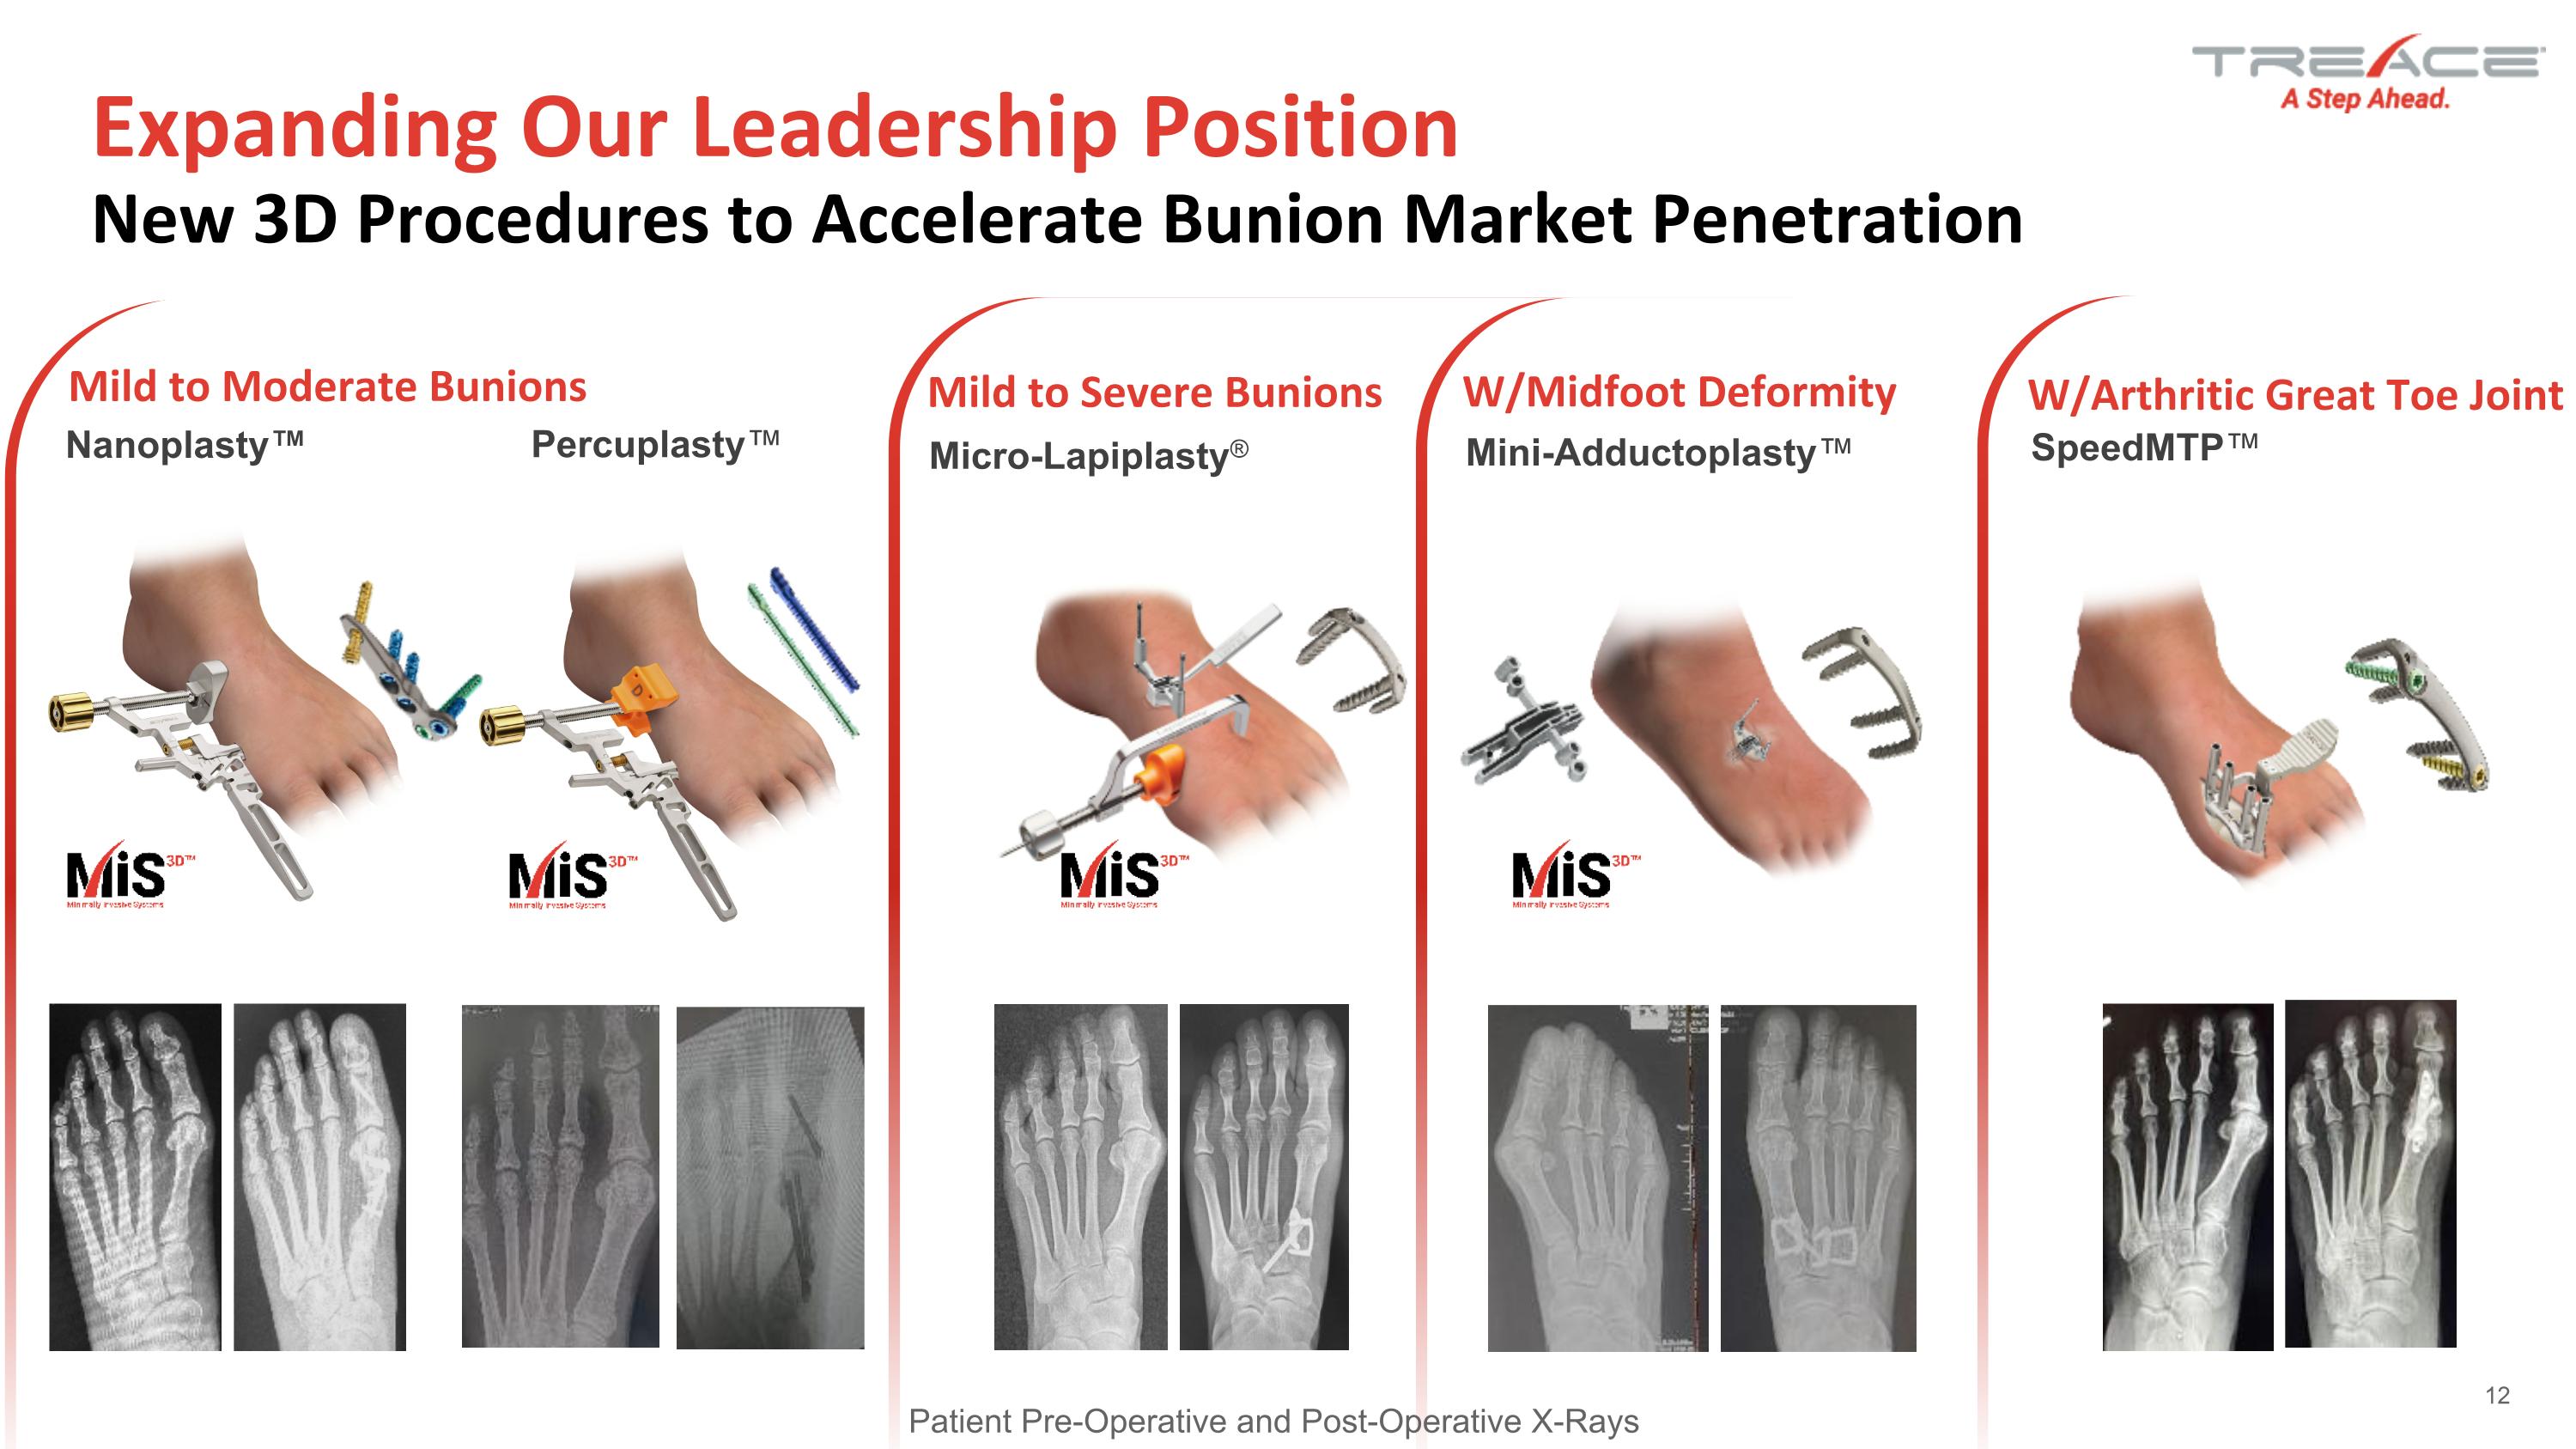
US Bunion Opportunity - Treace Flagship Platforms Mild to Moderate Bunions Mild to Severe Bunions W/Midfoot Deformity W/Arthritic Great Toe Joint Expanding Our Leadership Position�New 3D Procedures to Accelerate Bunion Market Penetration Micro-Lapiplasty® Nanoplasty™ Percuplasty™ Mini-Adductoplasty™ SpeedMTP™ 12 Patient Pre-Operative and Post-Operative X-Rays
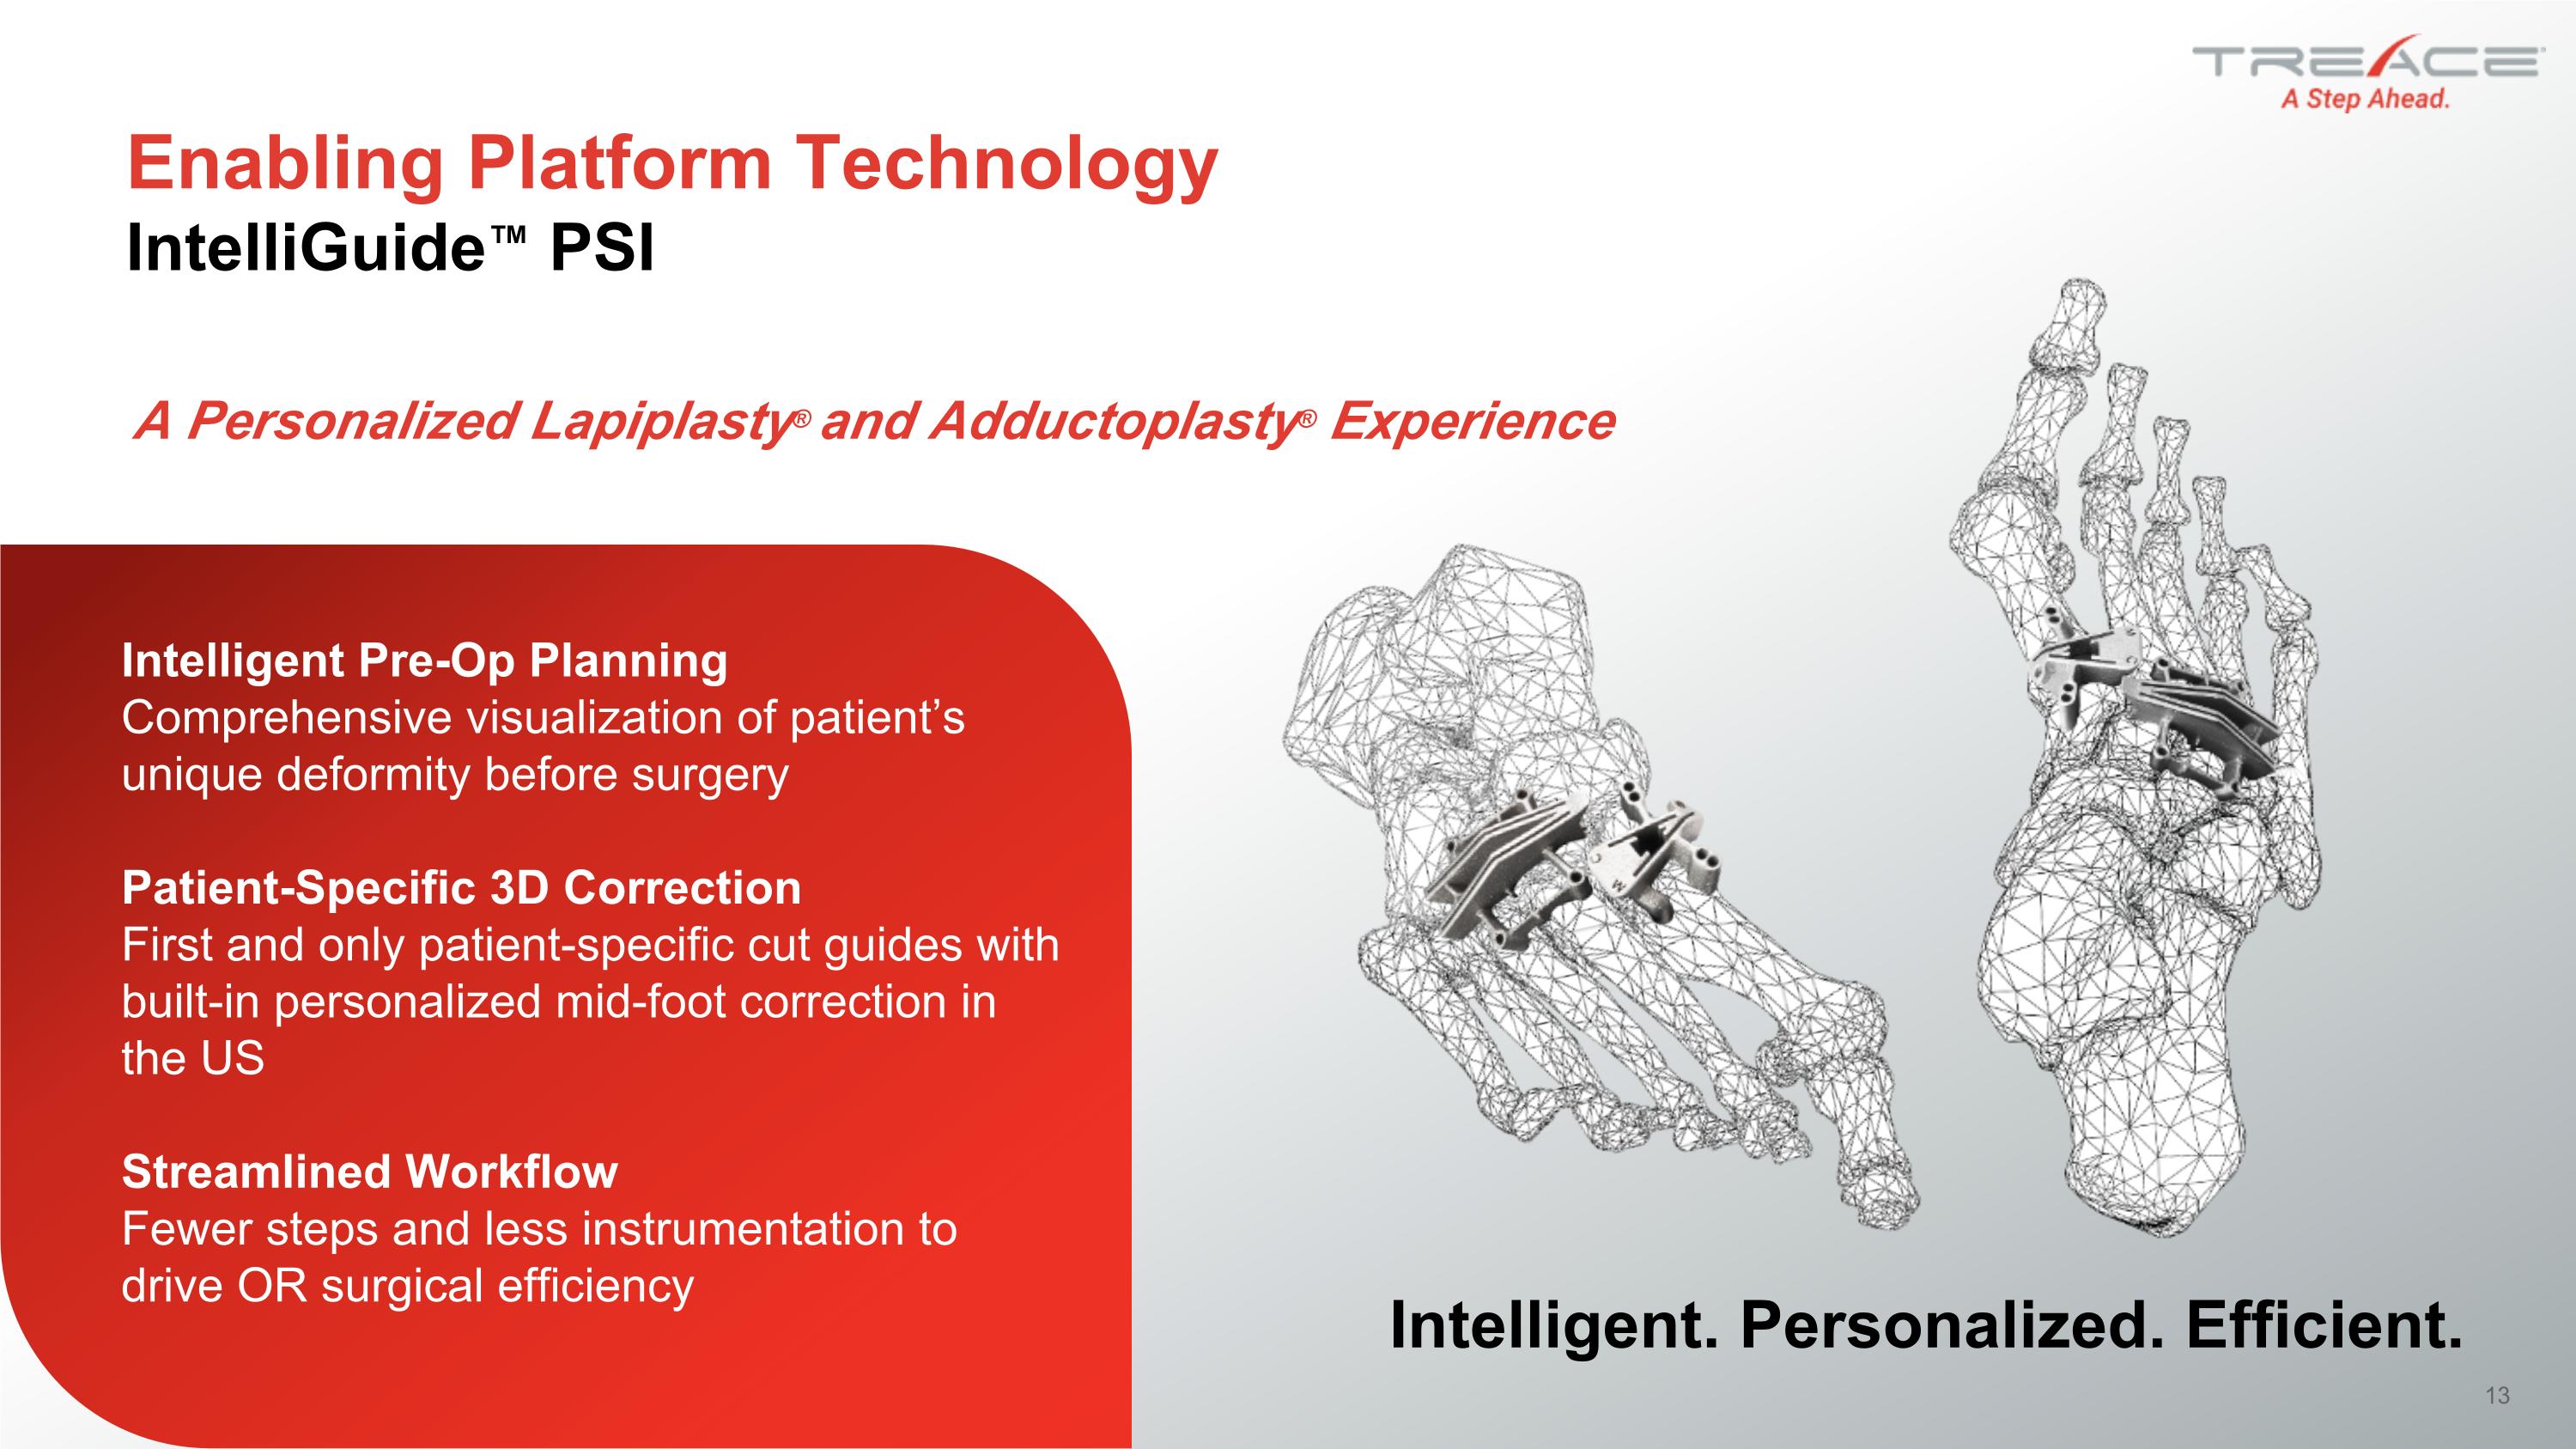
Intelligent Pre-Op Planning�Comprehensive visualization of patient’s unique deformity before surgery Patient-Specific 3D Correction�First and only patient-specific cut guides with built-in personalized mid-foot correction in the US Streamlined Workflow�Fewer steps and less instrumentation to drive OR surgical efficiency Intelligent. Personalized. Efficient. Enabling Platform Technology IntelliGuide™ PSI A Personalized Lapiplasty® and Adductoplasty® Experience 13
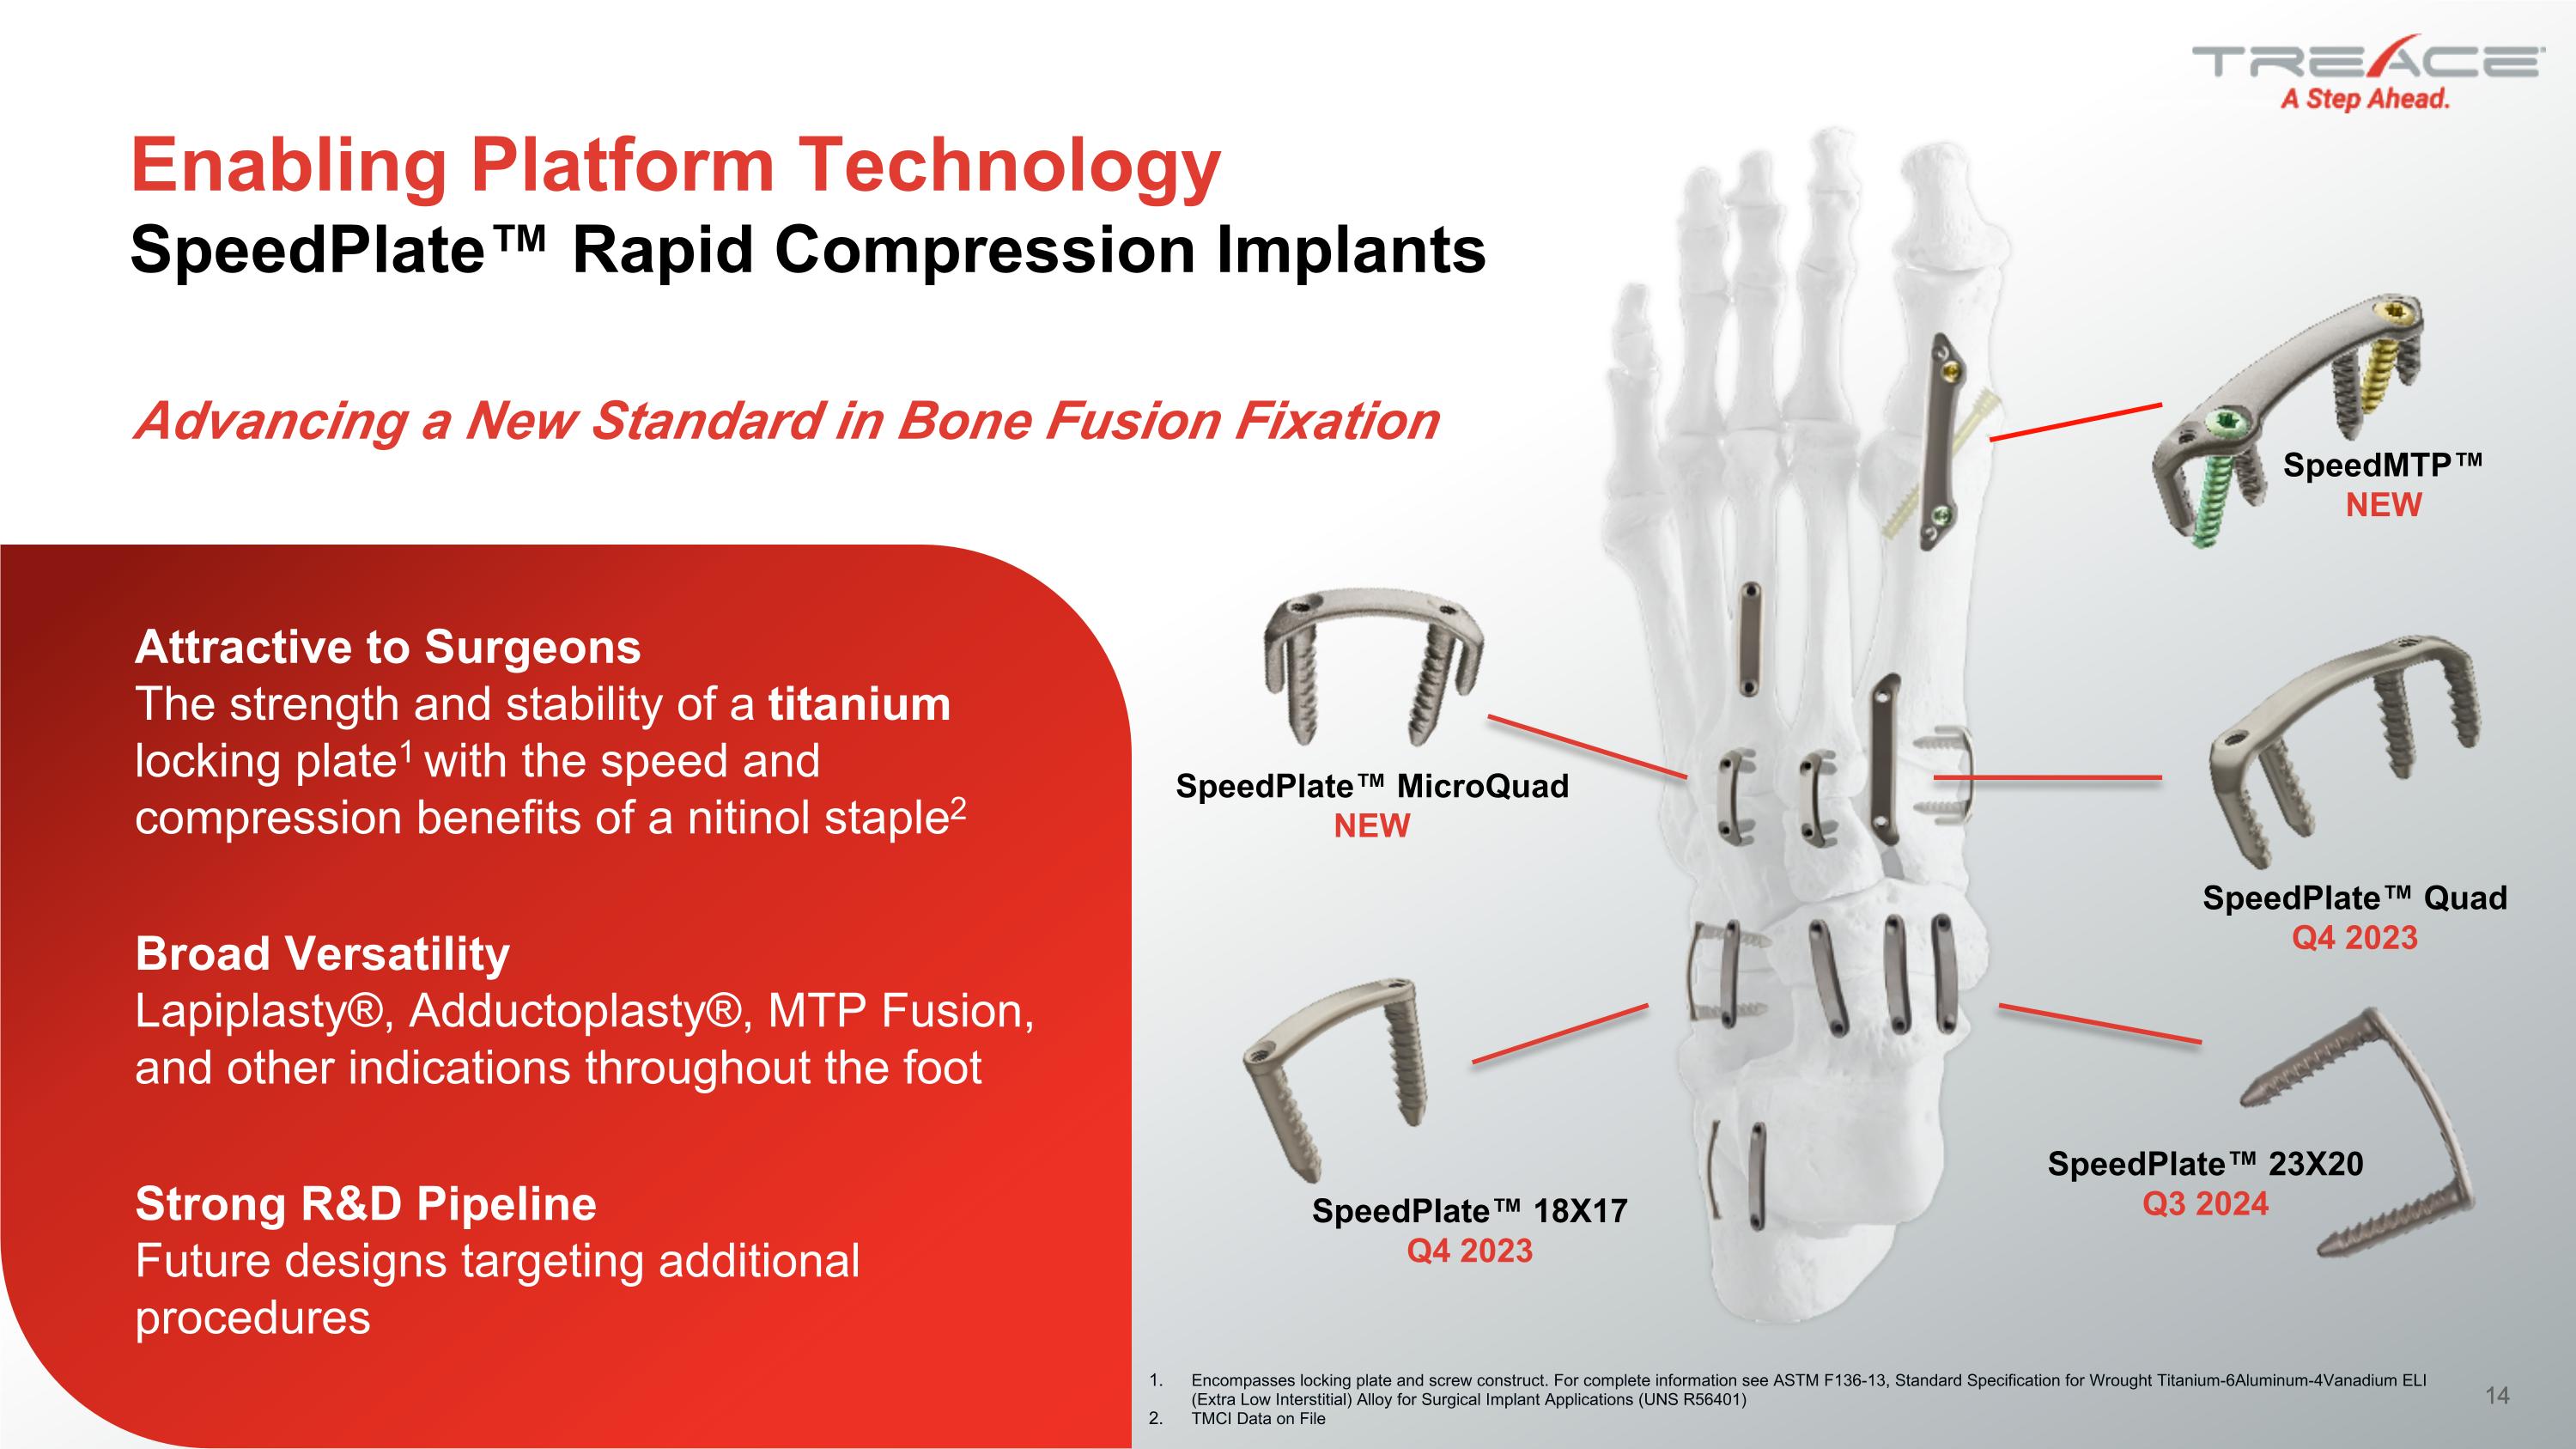
14 Enabling Platform Technology�SpeedPlate™ Rapid Compression Implants SpeedPlate™ MicroQuad NEW SpeedPlate™ 23X20 Q3 2024 Encompasses locking plate and screw construct. For complete information see ASTM F136-13, Standard Specification for Wrought Titanium-6Aluminum-4Vanadium ELI (Extra Low Interstitial) Alloy for Surgical Implant Applications (UNS R56401) TMCI Data on File SpeedPlate™ Quad Q4 2023 SpeedPlate™ 18X17 Q4 2023 SpeedMTP™ NEW Advancing a New Standard in Bone Fusion Fixation Attractive to Surgeons �The strength and stability of a titanium locking plate1 with the speed and compression benefits of a nitinol staple2 Broad Versatility�Lapiplasty®, Adductoplasty®, MTP Fusion, and other indications throughout the foot Strong R&D Pipeline�Future designs targeting additional procedures
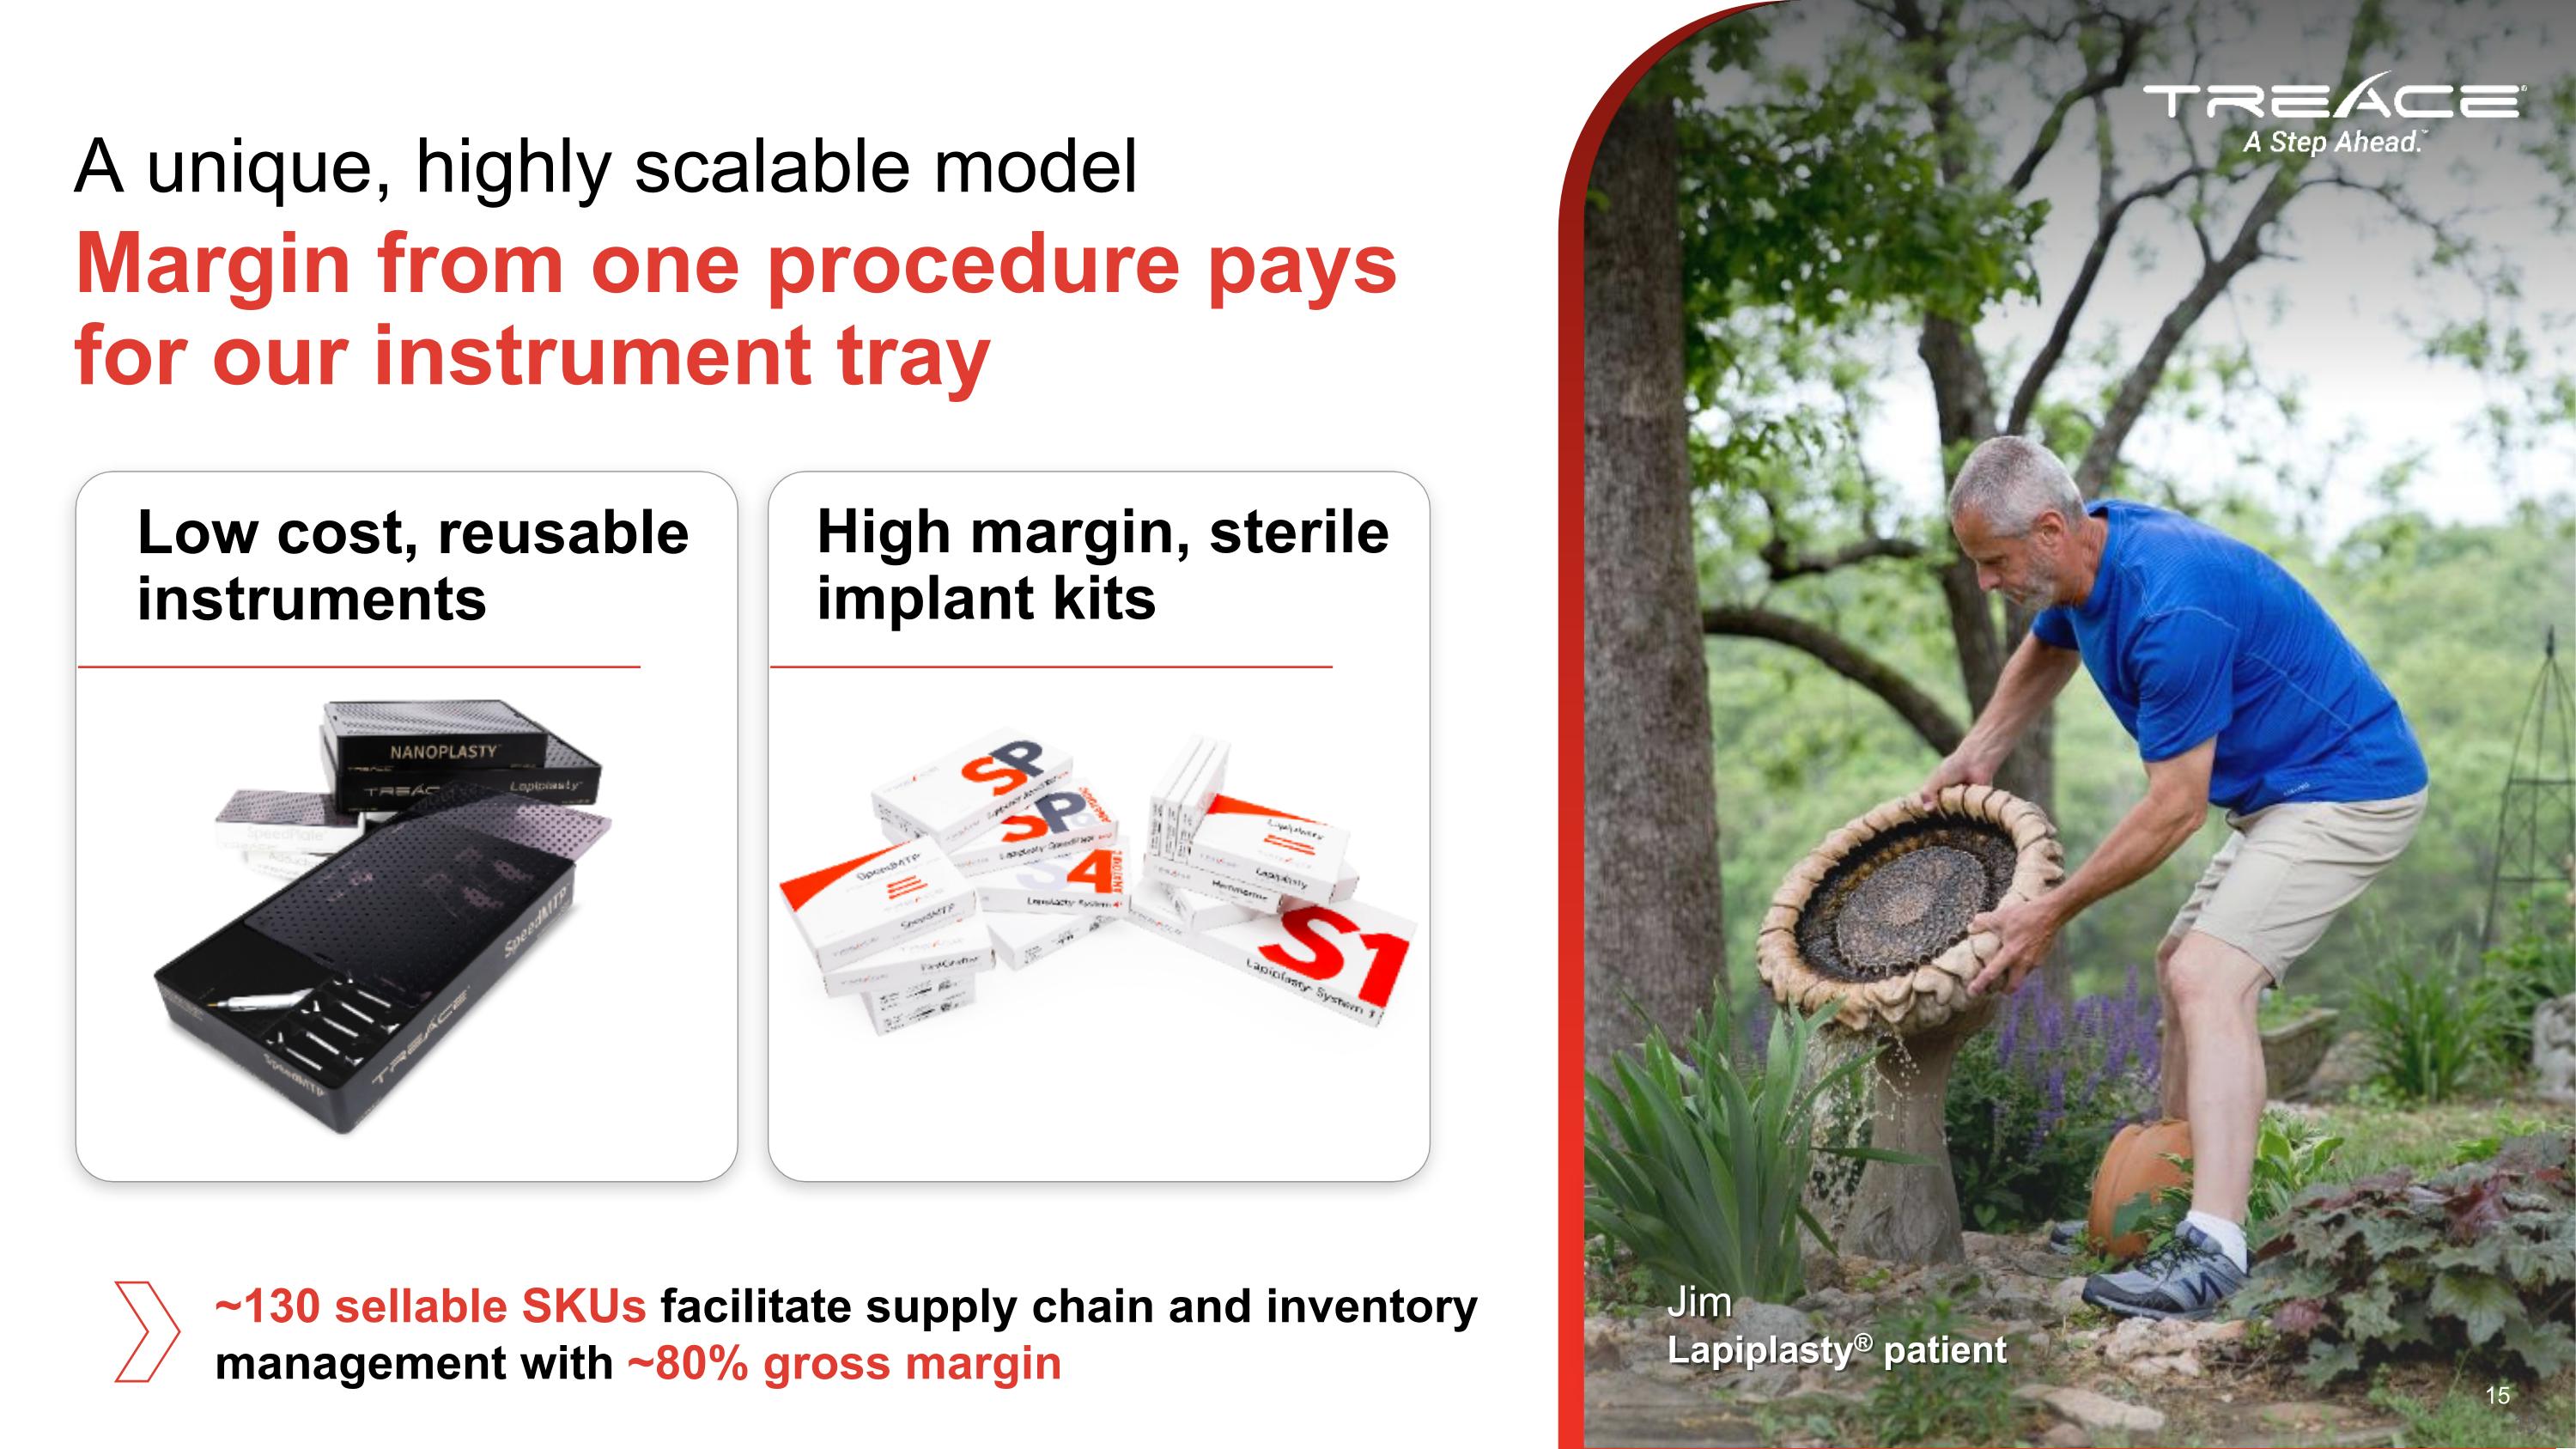
High margin, sterile implant kits Low cost, reusable instruments A unique, highly scalable model Margin from one procedure pays for our instrument tray 15 ~130 sellable SKUs facilitate supply chain and inventory management with ~80% gross margin 15 Jim Lapiplasty® patient
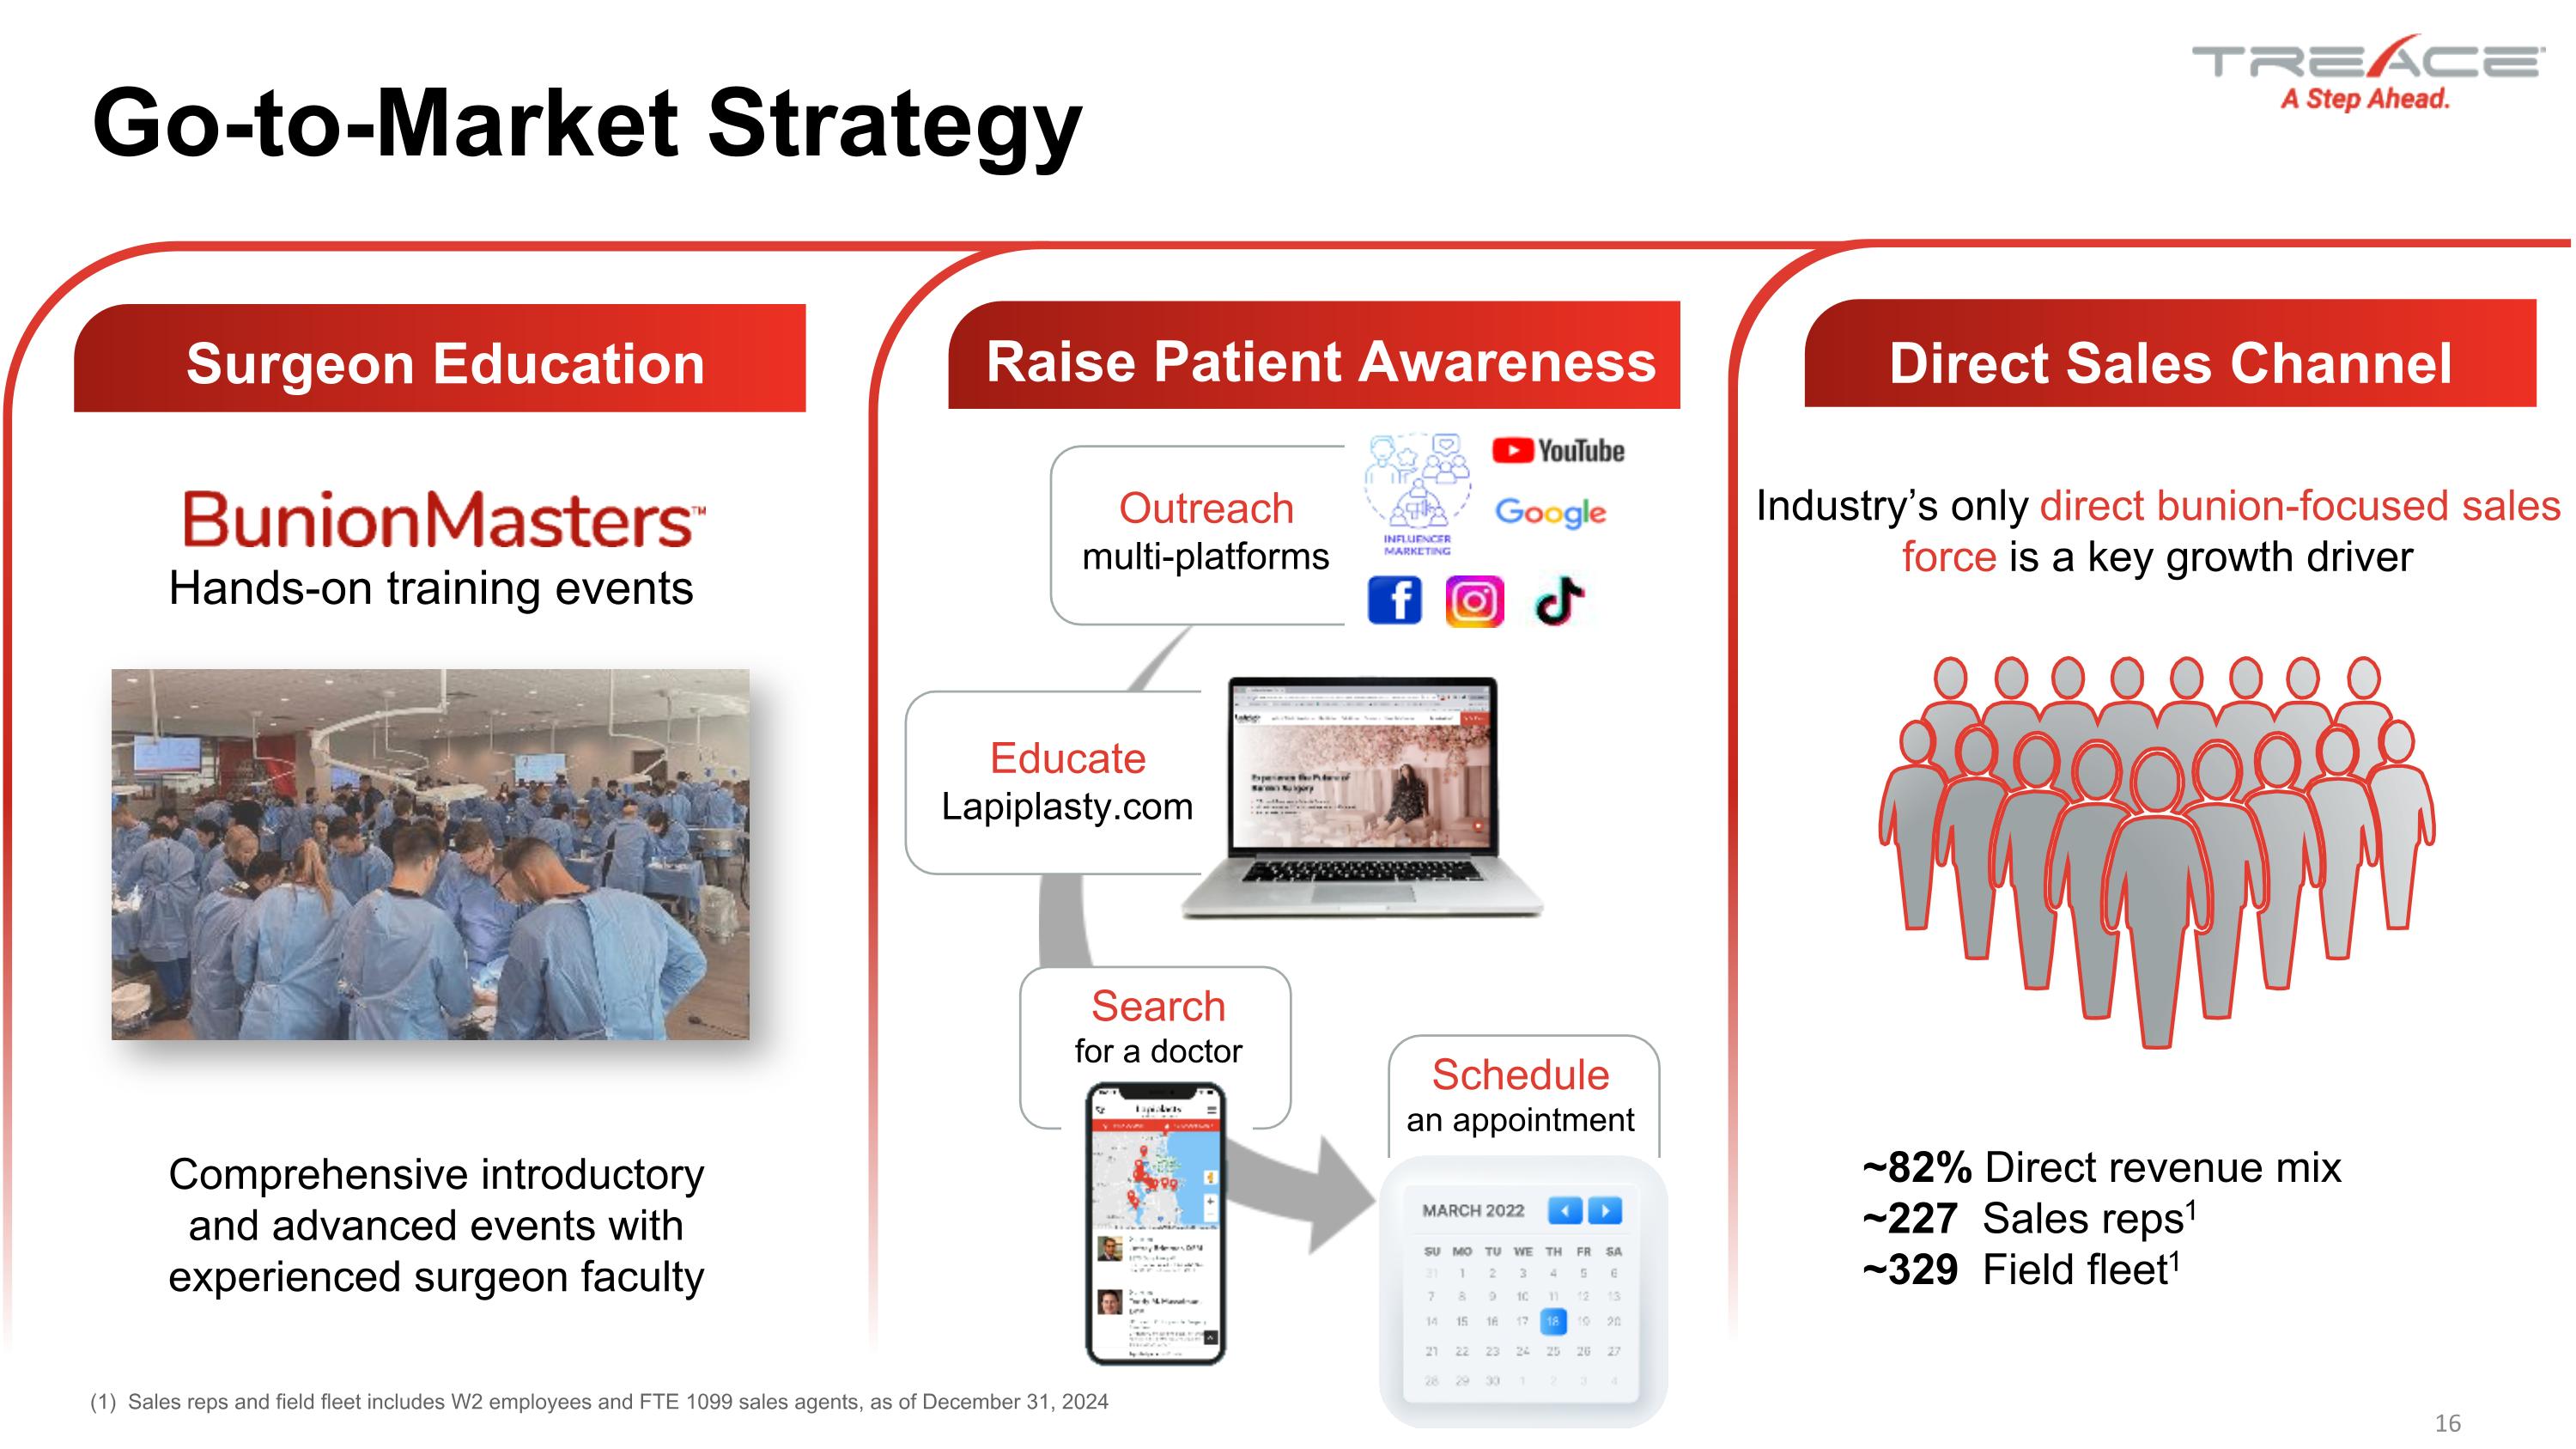
16 Go-to-Market Strategy Comprehensive introductory and advanced events with experienced surgeon faculty Hands-on training events Outreach�multi-platforms Educate�Lapiplasty.com Search for a doctor Schedule an appointment ~82% Direct revenue mix ~227 Sales reps1 ~329 Field fleet1 Industry’s only direct bunion-focused sales force is a key growth driver (1) Sales reps and field fleet includes W2 employees and FTE 1099 sales agents, as of December 31, 2024 Surgeon Education Raise Patient Awareness Direct Sales Channel
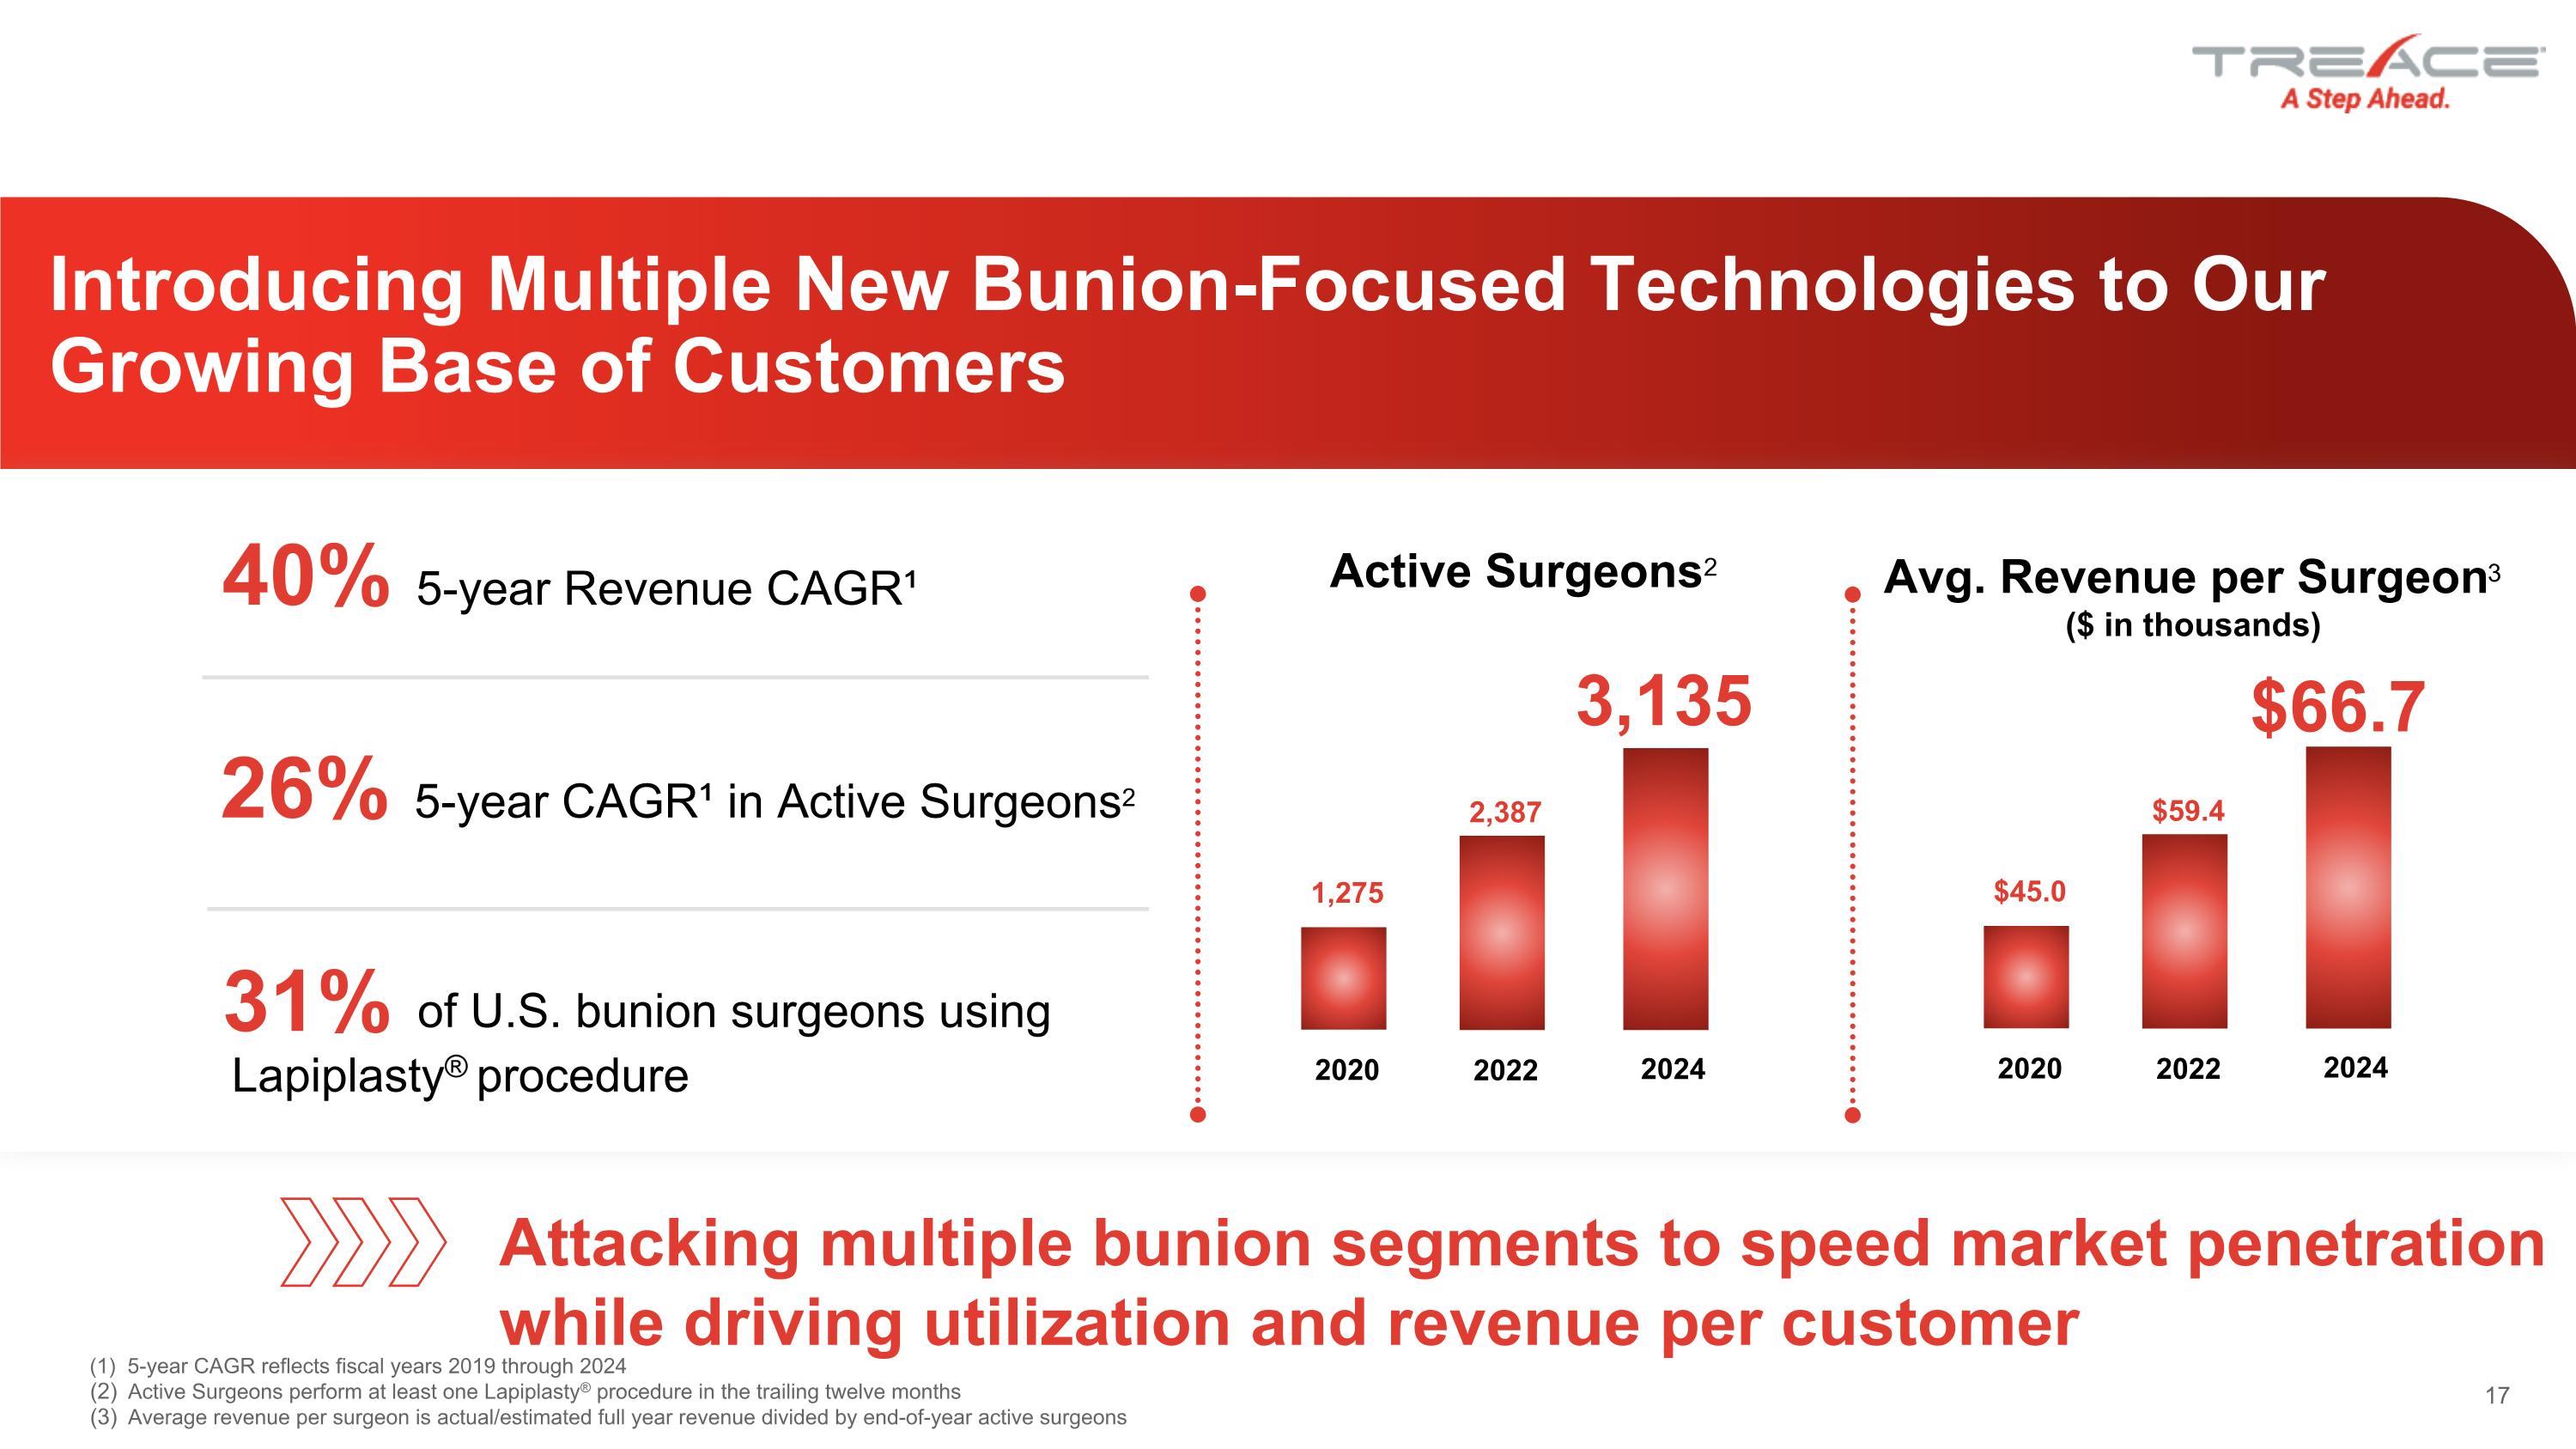
Introducing Multiple New Bunion-Focused Technologies to Our Growing Base of Customers (1) 5-year CAGR reflects fiscal years 2019 through 2024 Active Surgeons perform at least one Lapiplasty® procedure in the trailing twelve months Average revenue per surgeon is actual/estimated full year revenue divided by end-of-year active surgeons 26% 5-year CAGR¹ in Active Surgeons2 31% Lapiplasty® procedure of U.S. bunion surgeons using Attacking multiple bunion segments to speed market penetration while driving utilization and revenue per customer Avg. Revenue per Surgeon3 ($ in thousands) 40% 5-year Revenue CAGR¹ Active Surgeons2 2024 2020 1,275 2022 2,387 3,135 2024 2020 $45.0 2022 $59.4 $66.7
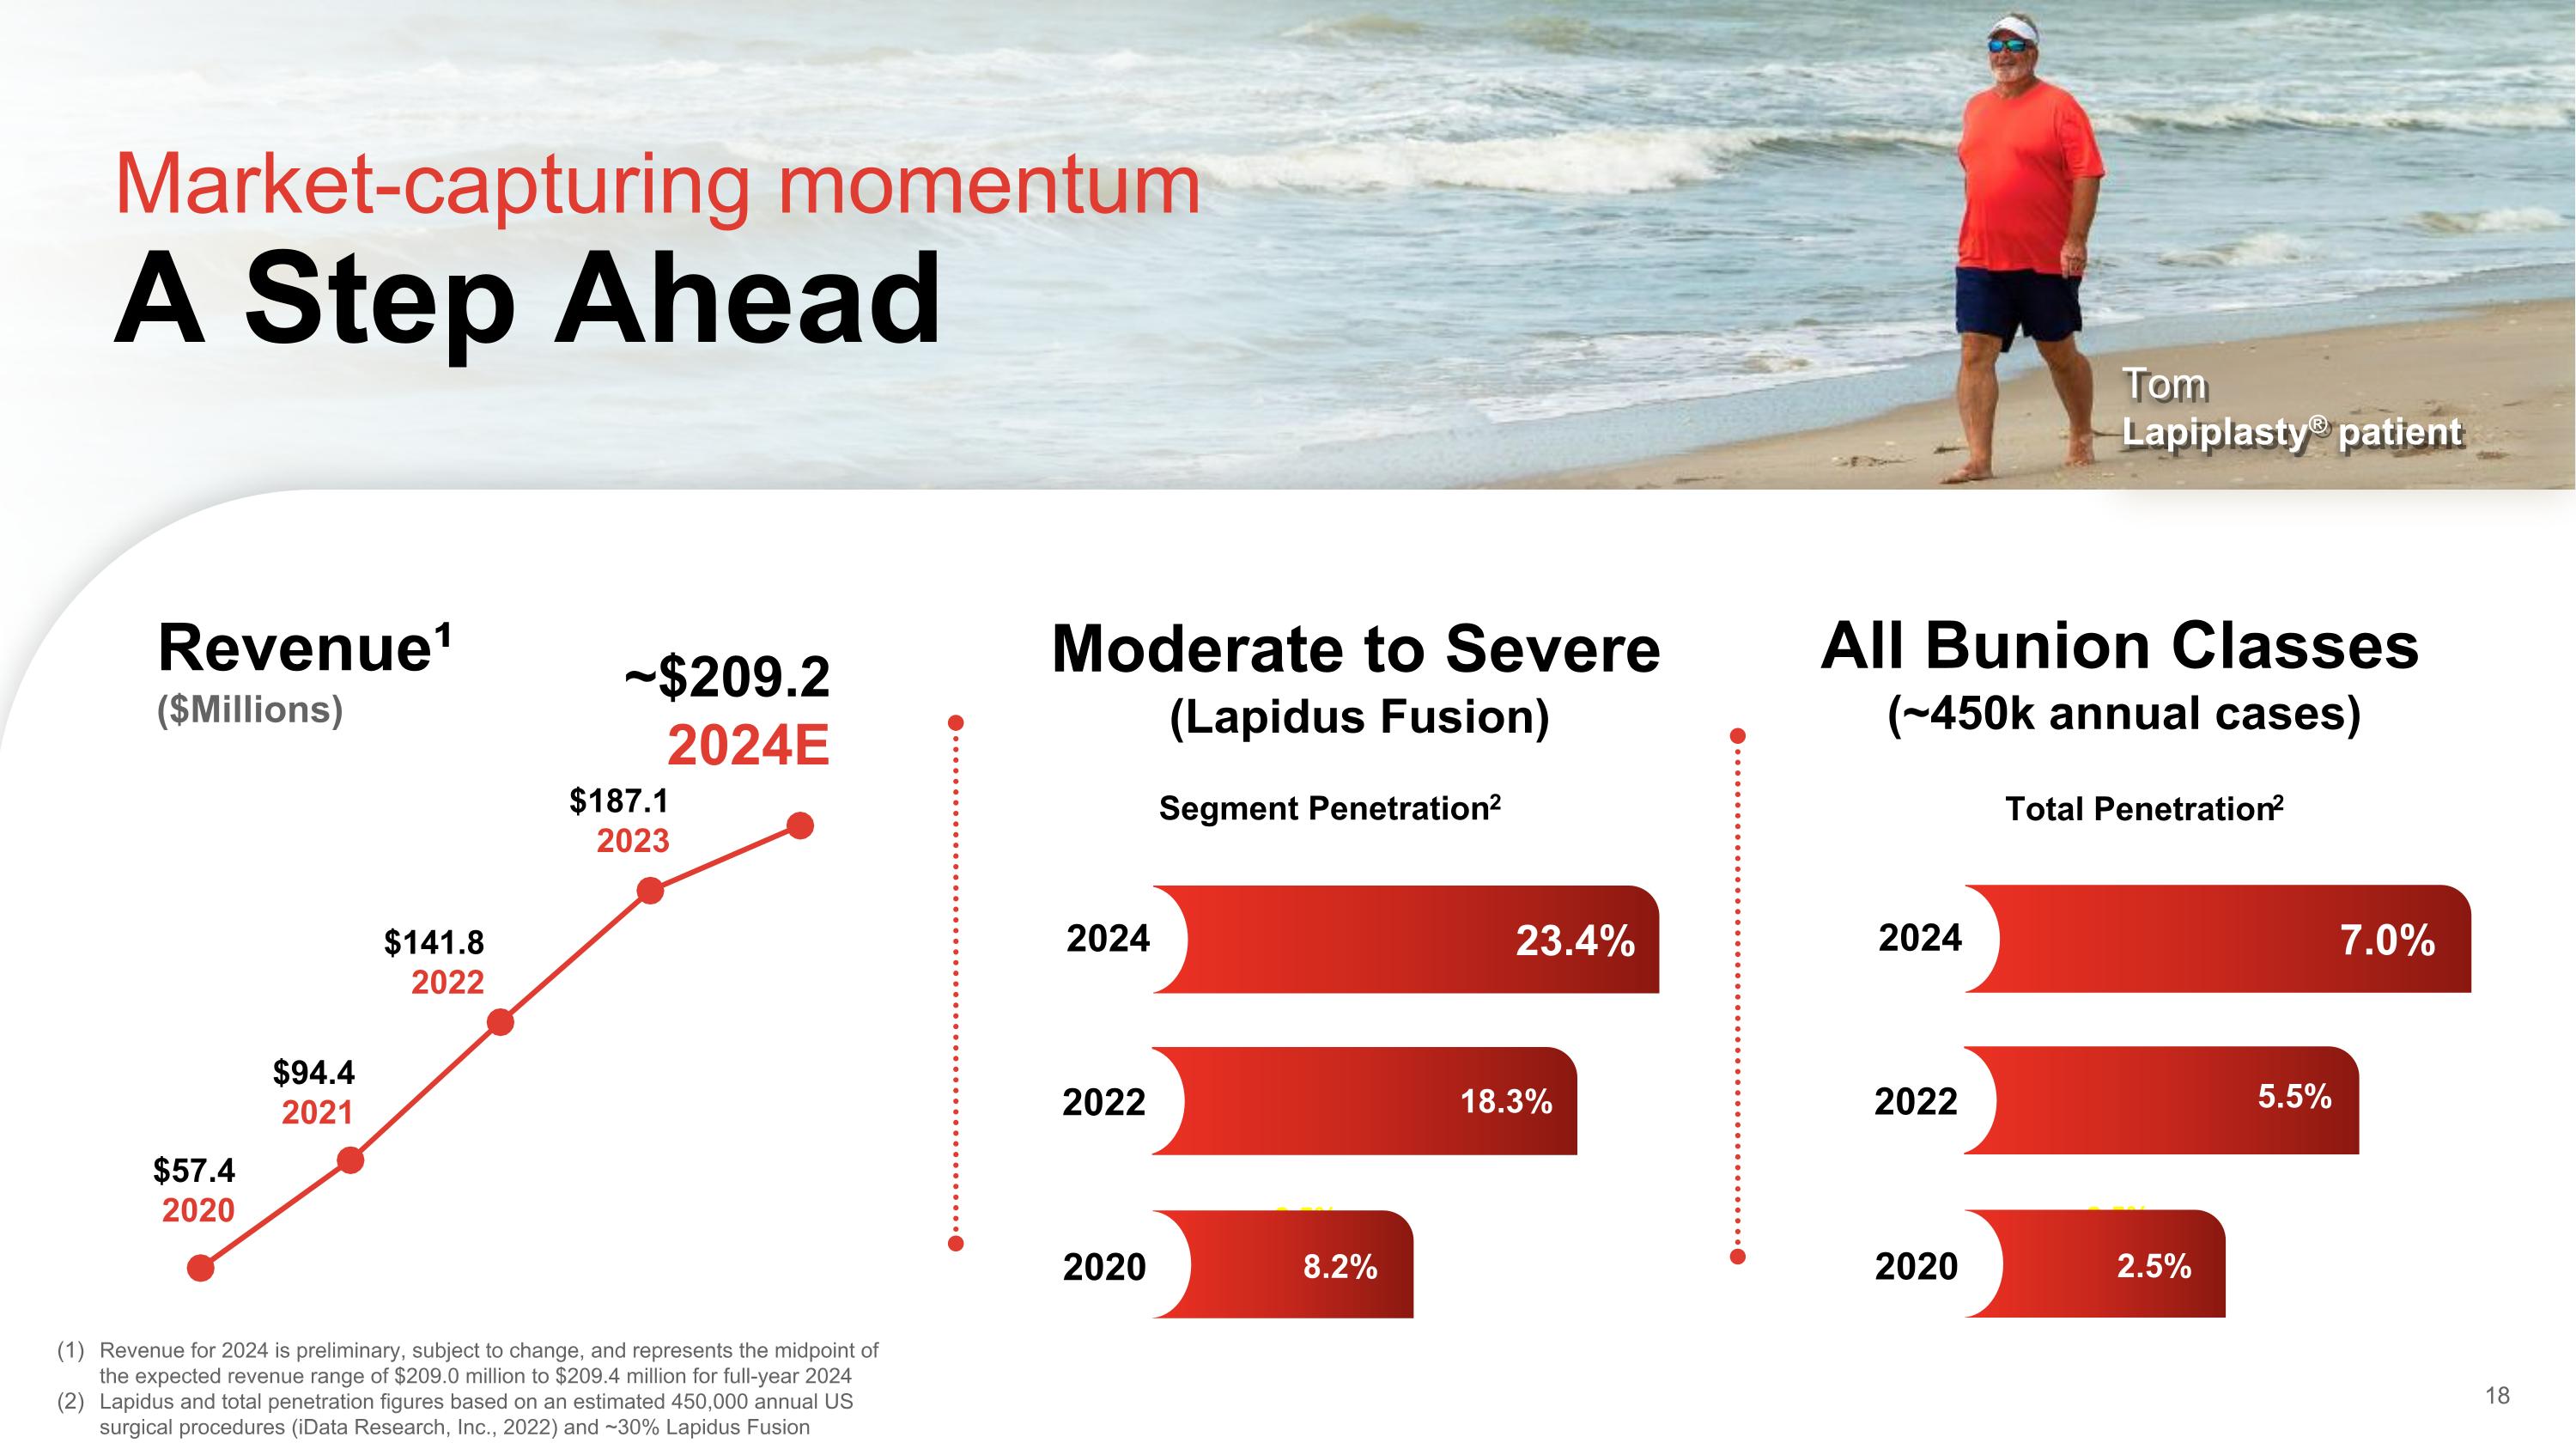
Segment Penetration2 Market-capturing momentum A Step Ahead $57.4 2020 $141.8 2022 $94.4 2021 ~$209.2 2024E Revenue¹ ($Millions) 18 Revenue for 2024 is preliminary, subject to change, and represents the midpoint of the expected revenue range of $209.0 million to $209.4 million for full-year 2024 Lapidus and total penetration figures based on an estimated 450,000 annual US surgical procedures (iData Research, Inc., 2022) and ~30% Lapidus Fusion $187.1 2023 Tom Lapiplasty® patient Moderate to Severe (Lapidus Fusion) All Bunion Classes (~450k annual cases) Total Penetration2 2.5% 5.5% 7.0% 5.5% 2.5% 2024 2022 2020 2.5% 5.5% 23.4% 18.3% 8.2% 2024 2022 2020
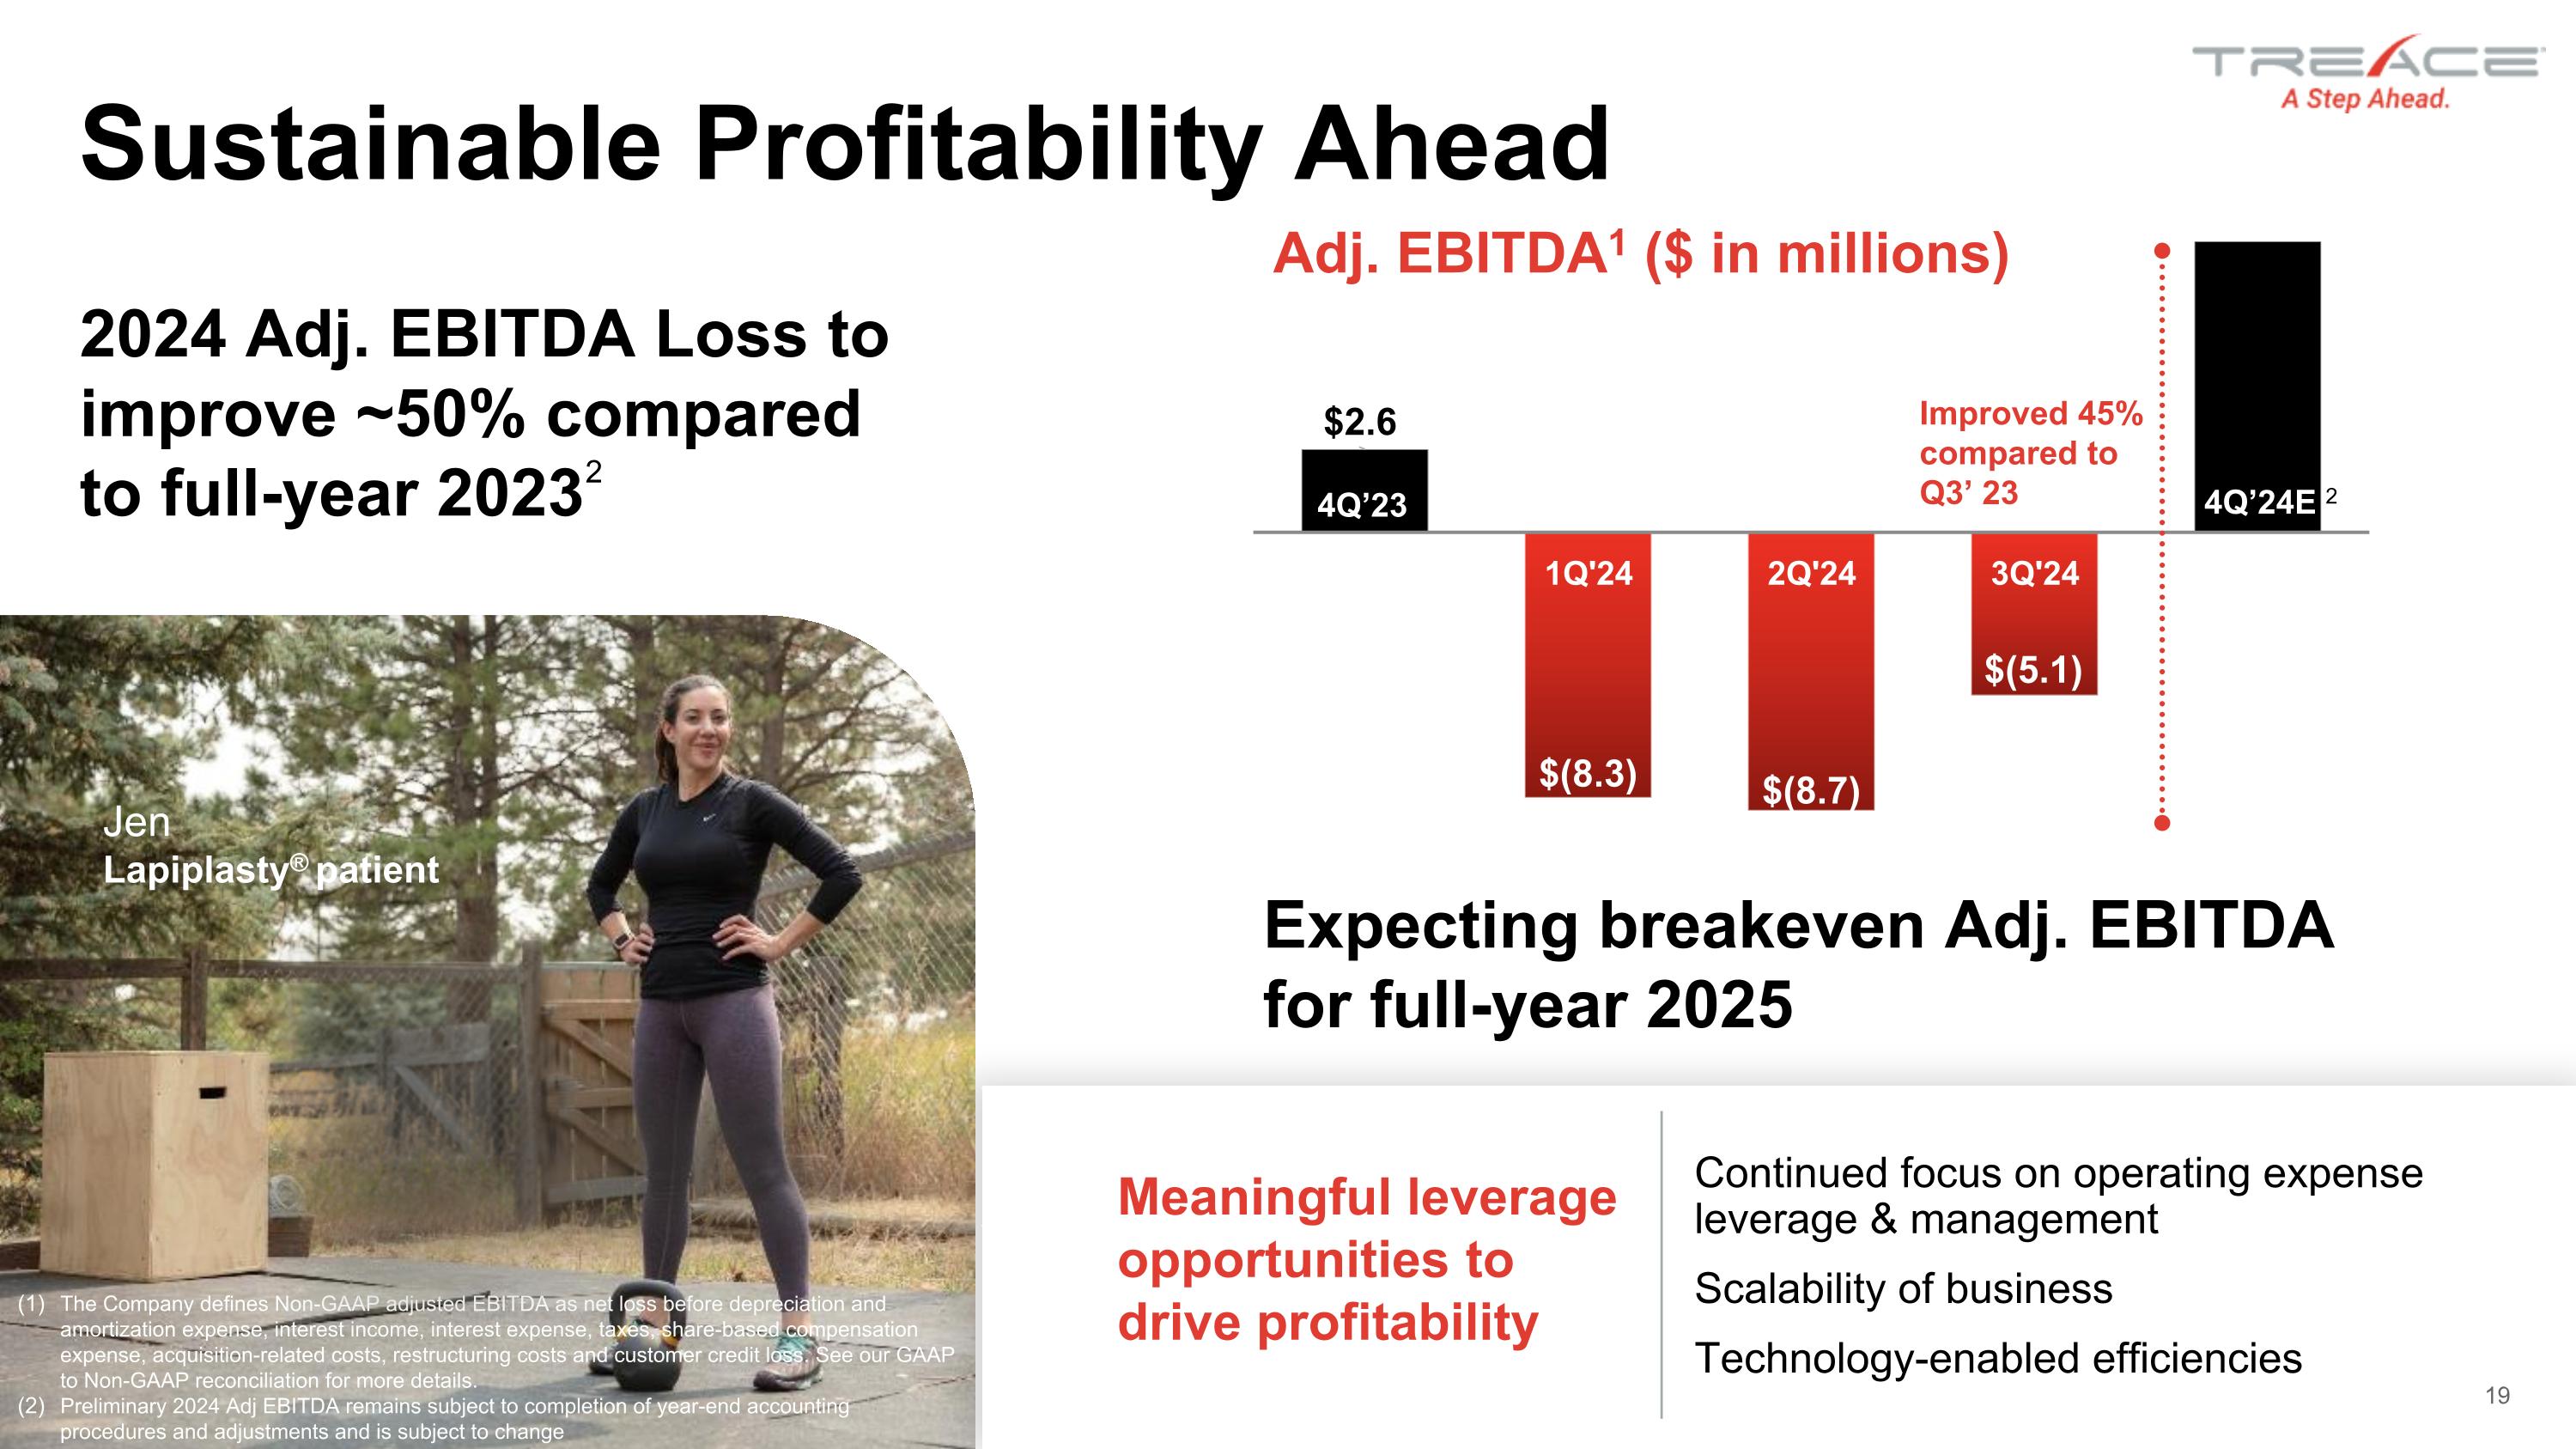
Meaningful leverage opportunities to drive profitability Continued focus on operating expense leverage & management Scalability of business Technology-enabled efficiencies Improved 45% compared to Q3’ 23 The Company defines Non-GAAP adjusted EBITDA as net loss before depreciation and amortization expense, interest income, interest expense, taxes, share-based compensation expense, acquisition-related costs, restructuring costs and customer credit loss. See our GAAP to Non-GAAP reconciliation for more details. Preliminary 2024 Adj EBITDA remains subject to completion of year-end accounting procedures and adjustments and is subject to change Expecting breakeven Adj. EBITDA for full-year 2025 19 Sustainable Profitability Ahead Jen Lapiplasty® patient 2024 Adj. EBITDA Loss to improve ~50% compared to full-year 20232 4Q’23 4Q’24E 2
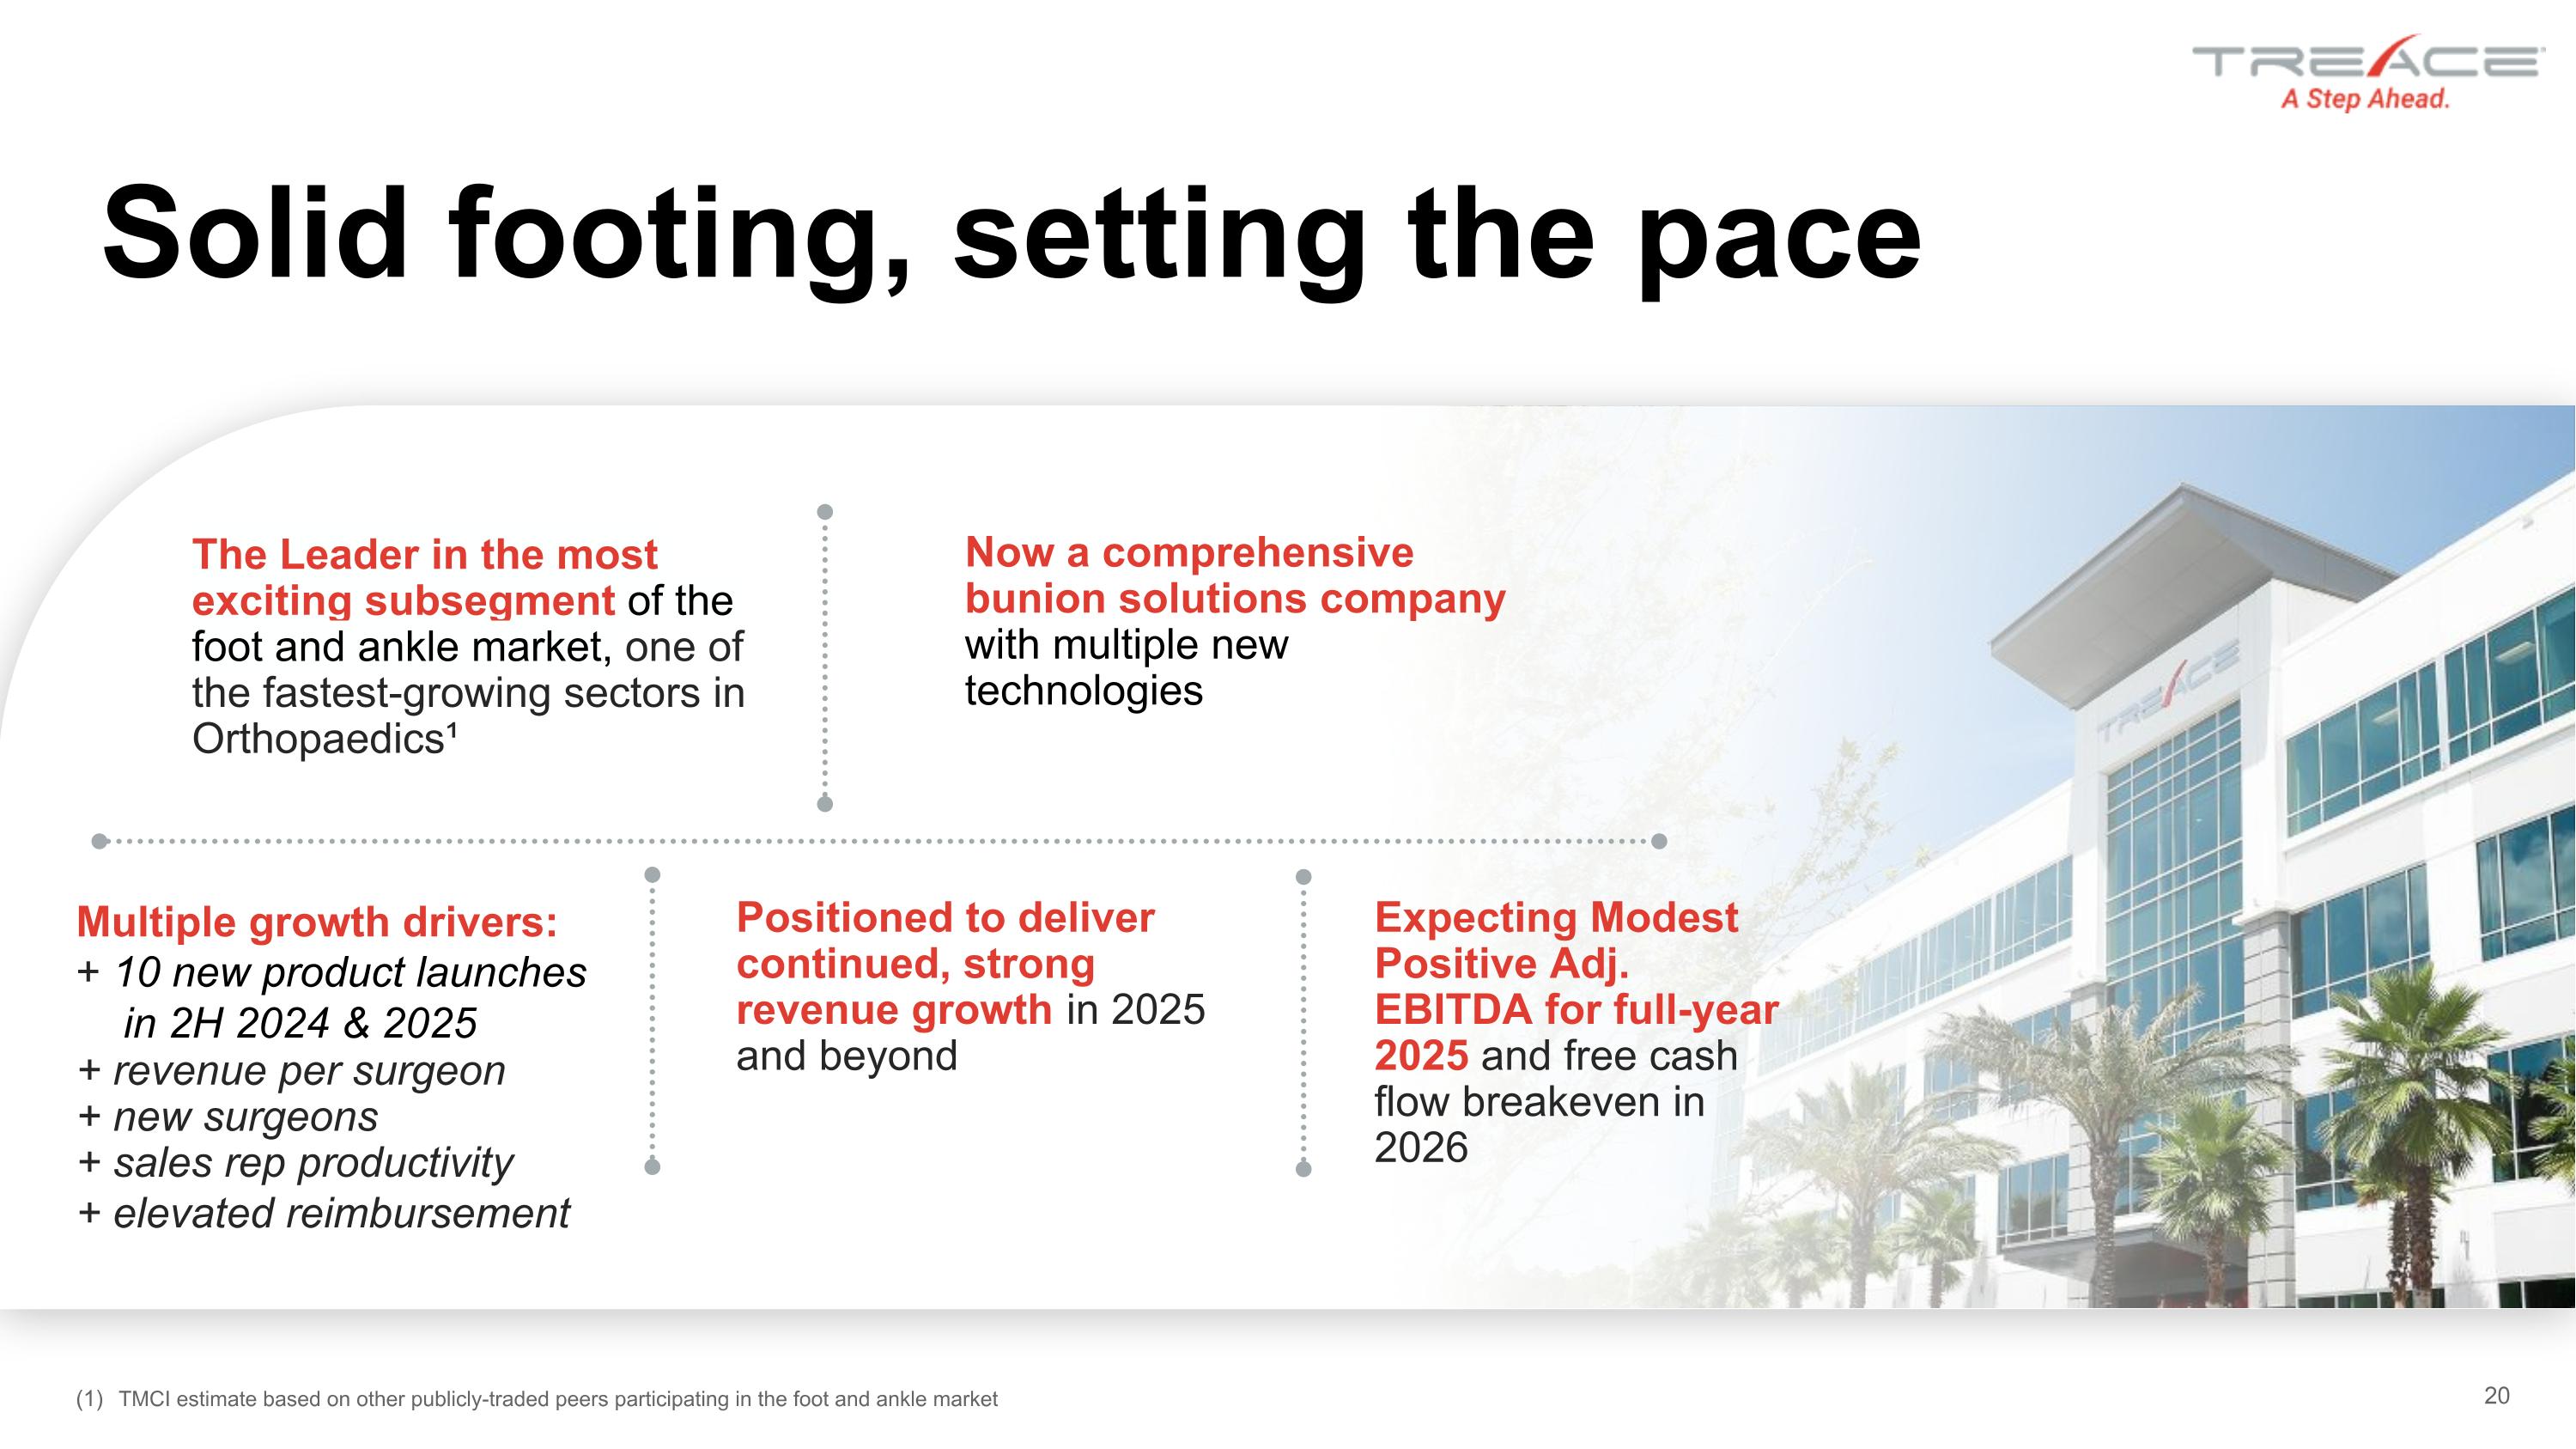
Solid footing, setting the pace Now a comprehensive bunion solutions company with multiple new technologies Positioned to deliver continued, strong revenue growth in 2025 and beyond Expecting Modest Positive Adj. EBITDA for full-year 2025 and free cash flow breakeven in 2026 The Leader in the most exciting subsegment of the foot and ankle market, one of the fastest-growing sectors in Orthopaedics¹ Multiple growth drivers: + 10 new product launches in 2H 2024 & 2025 + revenue per surgeon + new surgeons + sales rep productivity + elevated reimbursement TMCI estimate based on other publicly-traded peers participating in the foot and ankle market

21
GAAP to Non-GAAP Reconciliations 22


