Exhibit 99.1 KBS Growth & Income REIT Portfolio Update Meeting August 23, 2019
Important The information contained herein should be read in conjunction with, and is qualified by, the information in KBS Growth & Income Real Estate Investment Trust’s (the “Company or KBS Growth & Income REIT or KBS G&I REIT”) Annual Report on Form 10-K for the year ended December 31, 2018 (the “Annual Report”), and in the Company’s Quarterly Report on Form 10-Q for the Disclosures period ended June 30, 2019 (the “Quarterly Report”), including the “Risk Factors” contained therein. For a full description of the limitations, methodologies and assumptions used to value KBS G&I REIT’s assets and liabilities in connection with the calculation of KBS G&I REIT’s estimated value per share, see KBS G&I REIT’s Current Report on Form 8-K dated December 7, 2018. Forward-Looking Statements Certain statements contained herein may be deemed to be forward-looking statements within the meaning of the Federal Private Securities Litigation Reform Act of 1995. The Company intends that such forward-looking statements be subject to the safe harbors created by Section 27A of the Securities Act of 1933, as amended, and Section 21E of the Securities Exchange Act of 1934, as amended. These statements include statements regarding the intent, belief or current expectations of the Company and members of its management team, as well as the assumptions on which such statements are based, and generally are identified by the use of words such as “may,” “will,” “seeks,” “anticipates,” “believes,” “estimates,” “expects,” “plans,” “intends,” “should” or similar expressions. Readers are cautioned not to place undue reliance on these forward-looking statements, which speak only as of the date they are made. The Company undertakes no obligation to update or revise forward-looking statements to reflect changed assumptions, the occurrence of unanticipated events or changes to future operating results over time, unless required by law. Such statements are subject to known and unknown risks and uncertainties which could cause actual results to differ materially from those contemplated by such forward-looking statements. The Company makes no representation or warranty (express or implied) about the accuracy of any such forward-looking statements. These statements are based on a number of assumptions involving the judgment of management. The Company may fund distributions from any source including, without limitation, from offering proceeds or borrowings. Distributions paid through June 30, 2019 have been funded in part with cash flow from operating activities and in part with debt financing, including advances from the Company’s advisor. In addition, distributions have been funded with cash resulting from the advisor’s waiver and deferral of its asset management fee. There are no guarantees that the Company will continue to pay distributions or that distributions at the current rate are sustainable. Actual events may cause the value and returns on the Company’s investments to be less than that used for purposes of the Company’s estimated NAV per share. With respect to the NAV per share, the appraisal methodology used for the appraised properties assumes the properties realize the projected net operating income and expected exit cap rates and that investors would be willing to invest in such properties at yields equal to the expected discount rates. Though the appraisals of the appraised properties, with respect to Duff & Phelps, and the valuation estimates used in calculating the estimated value per share, with respect to Duff & Phelps, the Company’s advisor and the Company, are the respective party’s best estimates as of September 30, 2018, the Company can give no assurance in this regard. Even small changes to these assumptions could result in significant differences in the appraised values of the appraised properties and the estimated value per share. These statements herein also depend on factors such as: future economic, competitive and market conditions; the Company’s ability to maintain occupancy levels and rental rates at its real estate properties; and other risks identified in Part I, Item IA of the Company’s Annual Report. 2

Transactional volume in excess of $39.3 About KBS billion1, AUM of $11.4 billion1 and 36.1 million square feet under management1 Formed by Peter Bren and 8th Largest Office Owner Globally, National Chuck Schreiber in 1992. Real Estate Investor2. Over 26 years of investment Ranked among Top 53 Global Real Estate Investment Managers, Pensions & and management experience Investments3. with extensive long-term investor relationships. Buyer and seller of well-located, yield- generating office and industrial properties. Advisor to public and private pension plans, endowments, foundations, sovereign wealth funds and publicly- registered non-traded REITs. A trusted landlord to thousands of office and 1 As of June 30, 2019. industrial tenants nationwide. 2 The ranking by National Real Estate Investor is based on volume of office space owned globally, as of December 31, 2017. The results were generated from a survey conducted by National Real Estate Investor based on a A preferred partner with the nation’s combination of advertising and website promotion of the survey, direct solicitation of responses from participants, direct email to National Real Estate largest lenders. Investor subscribers and other identified office owners and daily newsletter promotion of the survey, all supplemented with a review of public company SEC filings. 3 Ranked by total worldwide real estate assets, in millions, as of June 30, A development partner for office, mixed-use 2017. Real estate assets were reported net of leverage, including contributions committed or received, but not yet invested. and multi-family developments. 3

Regional Focus Map Gateway Target First-tier Target Strong Employment / Growth KBS Growth & Income REIT Assets KBS Offices 4

Investment Objectives Achieve long-term growth in the value of the portfolio Build a diverse portfolio of core real estate properties Preserve and return stockholders’ capital contributions Provide investors with attractive and stable cash distributions 5
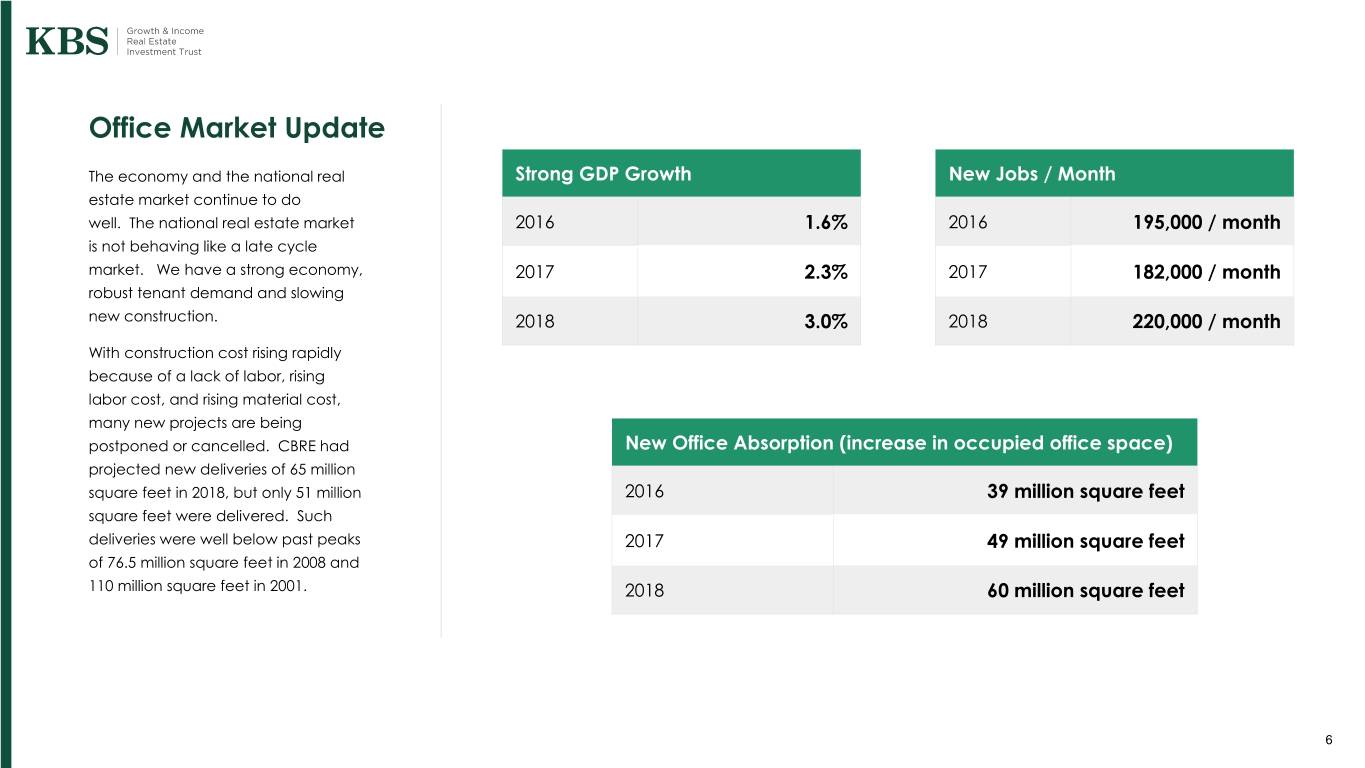
Office Market Update The economy and the national real Strong GDP Growth New Jobs / Month estate market continue to do well. The national real estate market 2016 1.6% 2016 195,000 / month is not behaving like a late cycle market. We have a strong economy, 2017 2.3% 2017 182,000 / month robust tenant demand and slowing new construction. 2018 3.0% 2018 220,000 / month With construction cost rising rapidly because of a lack of labor, rising labor cost, and rising material cost, many new projects are being postponed or cancelled. CBRE had New Office Absorption (increase in occupied office space) projected new deliveries of 65 million square feet in 2018, but only 51 million 2016 39 million square feet square feet were delivered. Such deliveries were well below past peaks 2017 49 million square feet of 76.5 million square feet in 2008 and 110 million square feet in 2001. 2018 60 million square feet 6

KBS Growth & Income REIT 2nd Quarter Portfolio Highlights* * Portfolio highlights exclude investment in an unconsolidated Joint Venture 7
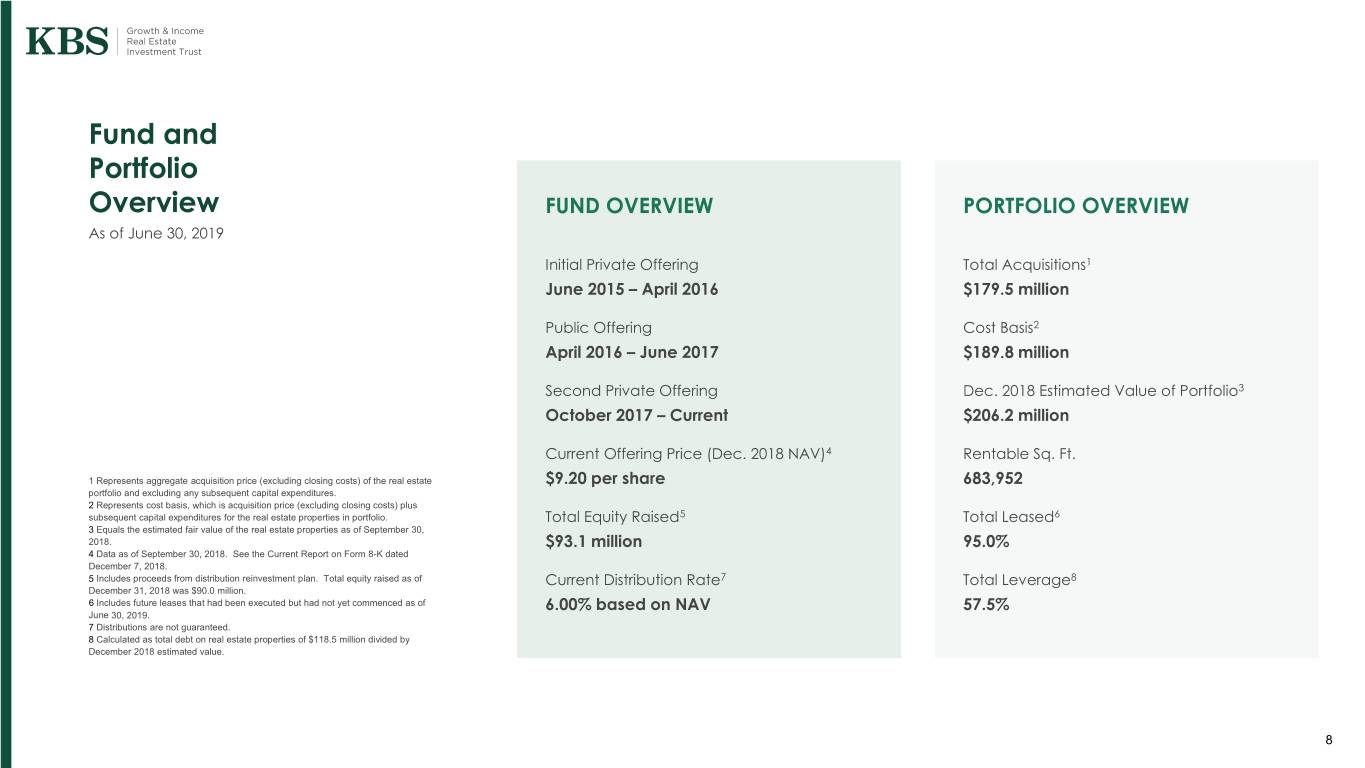
Fund and Portfolio Overview FUND OVERVIEW PORTFOLIO OVERVIEW As of June 30, 2019 Initial Private Offering Total Acquisitions1 June 2015 – April 2016 $179.5 million Public Offering Cost Basis2 April 2016 – June 2017 $189.8 million Second Private Offering Dec. 2018 Estimated Value of Portfolio3 October 2017 – Current $206.2 million Current Offering Price (Dec. 2018 NAV)4 Rentable Sq. Ft. 1 Represents aggregate acquisition price (excluding closing costs) of the real estate $9.20 per share 683,952 portfolio and excluding any subsequent capital expenditures. 2 Represents cost basis, which is acquisition price (excluding closing costs) plus subsequent capital expenditures for the real estate properties in portfolio. Total Equity Raised5 Total Leased6 3 Equals the estimated fair value of the real estate properties as of September 30, 2018. $93.1 million 95.0% 4 Data as of September 30, 2018. See the Current Report on Form 8-K dated December 7, 2018. 5 Includes proceeds from distribution reinvestment plan. Total equity raised as of Current Distribution Rate7 Total Leverage8 December 31, 2018 was $90.0 million. 6 Includes future leases that had been executed but had not yet commenced as of 6.00% based on NAV 57.5% June 30, 2019. 7 Distributions are not guaranteed. 8 Calculated as total debt on real estate properties of $118.5 million divided by December 2018 estimated value. 8
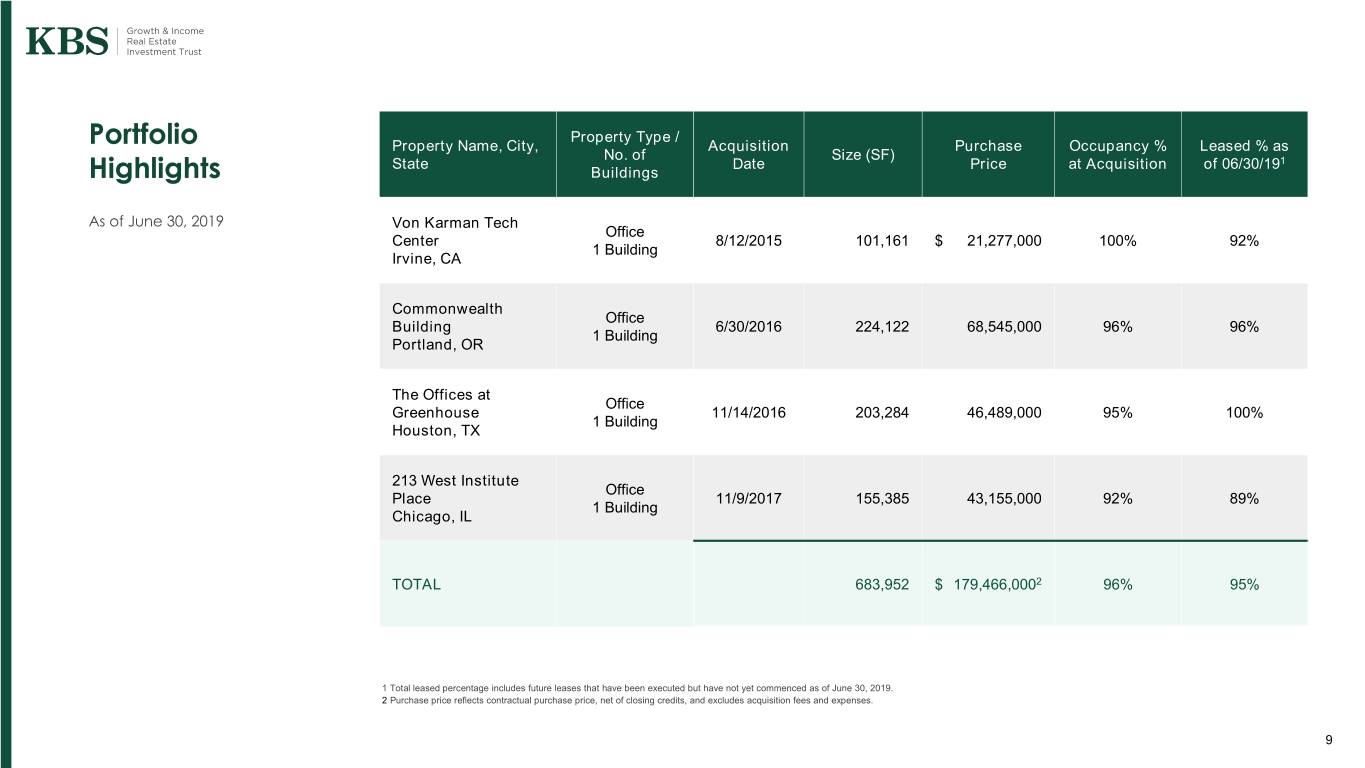
Property Type / Portfolio Property Name, City, Acquisition Purchase Occupancy % Leased % as No. of Size (SF) State Date Price at Acquisition of 06/30/191 Highlights Buildings As of June 30, 2019 Von Karman Tech Office Center 8/12/2015 101,161 $ 21,277,000 100% 92% 1 Building Irvine, CA Commonwealth Office Building 6/30/2016 224,122 68,545,000 96% 96% 1 Building Portland, OR The Offices at Office Greenhouse 11/14/2016 203,284 46,489,000 95% 100% 1 Building Houston, TX 213 West Institute Office Place 11/9/2017 155,385 43,155,000 92% 89% 1 Building Chicago, IL TOTAL 683,952 $ 179,466,0002 96% 95% 1 Total leased percentage includes future leases that have been executed but have not yet commenced as of June 30, 2019. 2 Purchase price reflects contractual purchase price, net of closing credits, and excludes acquisition fees and expenses. 9
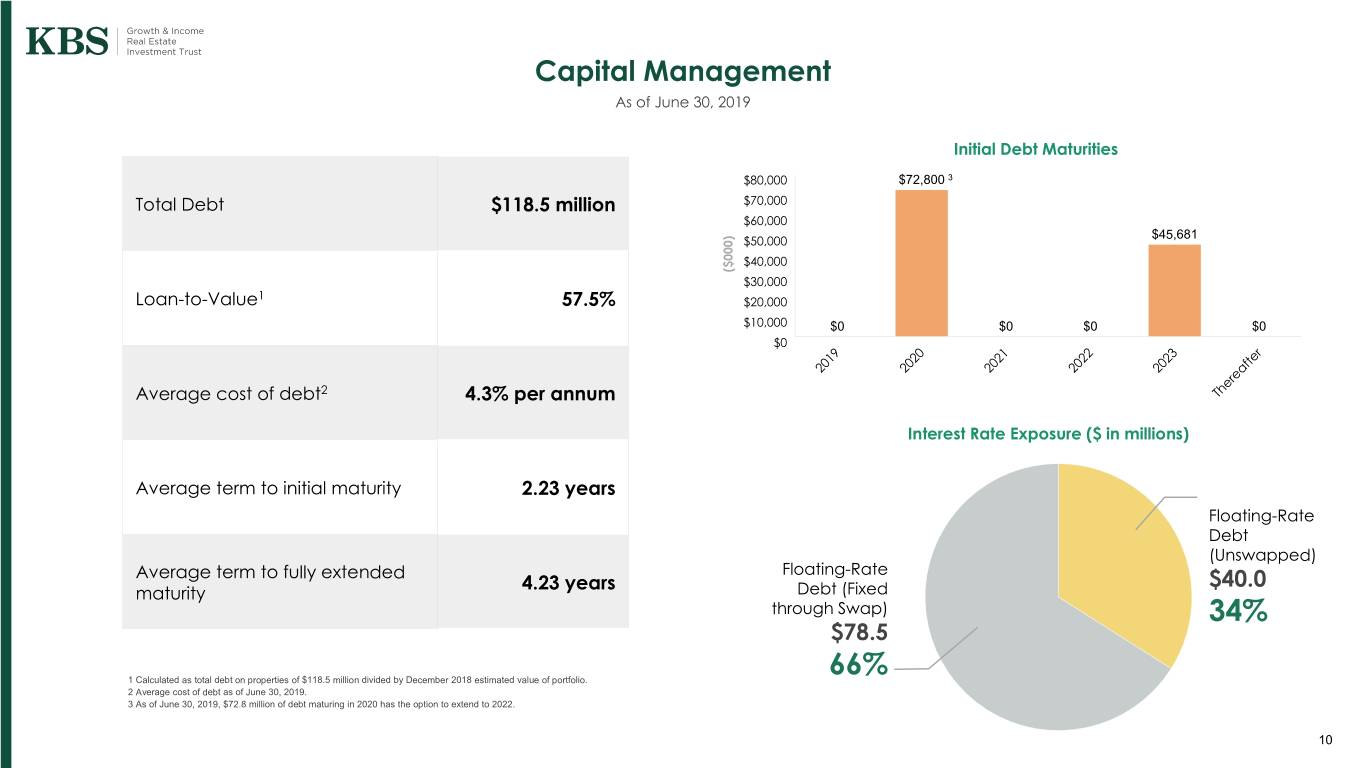
Capital Management As of June 30, 2019 Initial Debt Maturities $80,000 $72,800 3 Total Debt $118.5 million $70,000 $60,000 $45,681 $50,000 $40,000 ($000) $30,000 1 Loan-to-Value 57.5% $20,000 $10,000 $0 $0 $0 $0 $0 Average cost of debt2 4.3% per annum Interest Rate Exposure ($ in millions) Average term to initial maturity 2.23 years Floating-Rate Debt (Unswapped) Average term to fully extended Floating-Rate 4.23 years $40.0 maturity Debt (Fixed through Swap) 34% $78.5 66% 1 Calculated as total debt on properties of $118.5 million divided by December 2018 estimated value of portfolio. 2 Average cost of debt as of June 30, 2019. 3 As of June 30, 2019, $72.8 million of debt maturing in 2020 has the option to extend to 2022. 10
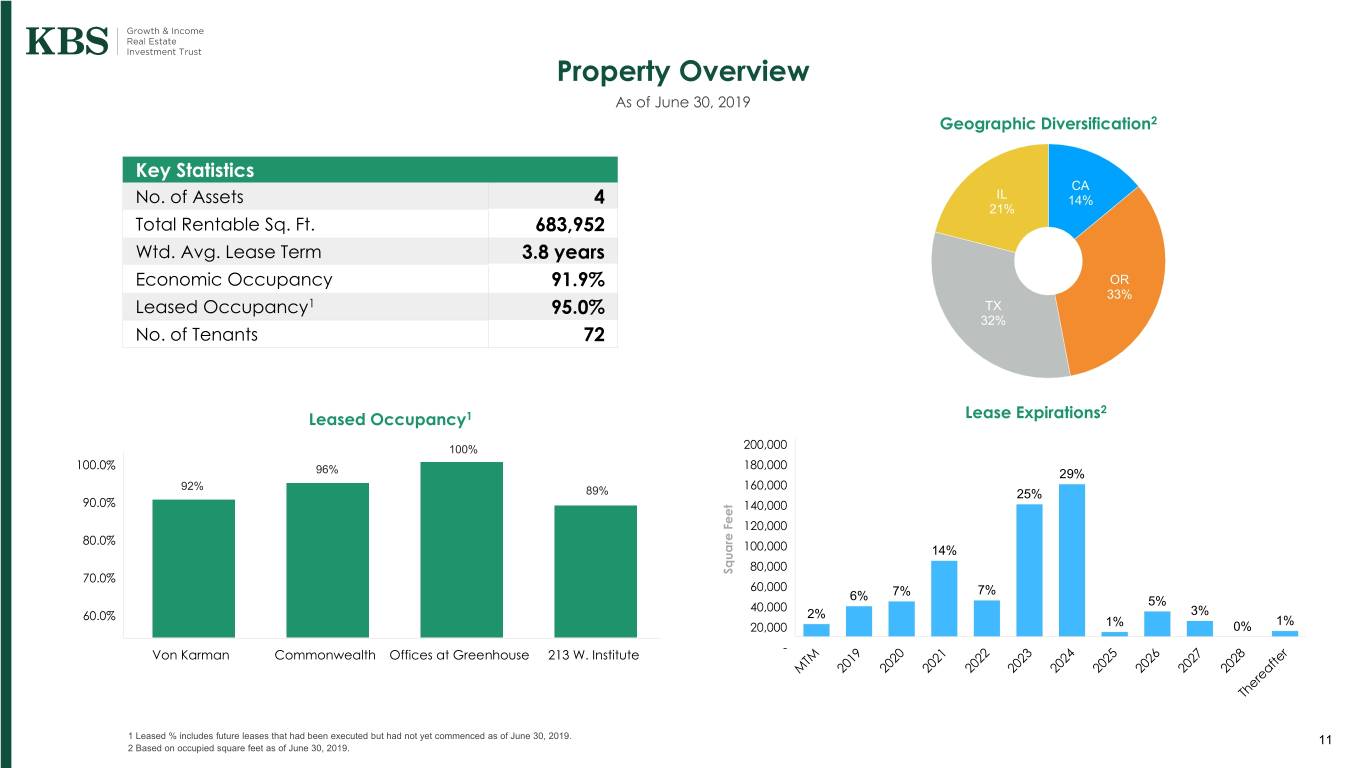
Property Overview As of June 30, 2019 Geographic Diversification2 Key Statistics CA No. of Assets 4 IL 14% 21% Total Rentable Sq. Ft. 683,952 Wtd. Avg. Lease Term 3.8 years Economic Occupancy 91.9% OR 33% Leased Occupancy1 95.0% TX 32% No. of Tenants 72 2 Leased Occupancy1 Lease Expirations 100% 200,000 100.0% 180,000 96% 29% 92% 160,000 89% 25% 90.0% 140,000 120,000 80.0% 100,000 14% 80,000 70.0% Feet Square 60,000 6% 7% 7% 40,000 5% 2% 3% 60.0% 1% 20,000 1% 0% - Von Karman Commonwealth Offices at Greenhouse 213 W. Institute 1 Leased % includes future leases that had been executed but had not yet commenced as of June 30, 2019. 11 2 Based on occupied square feet as of June 30, 2019.
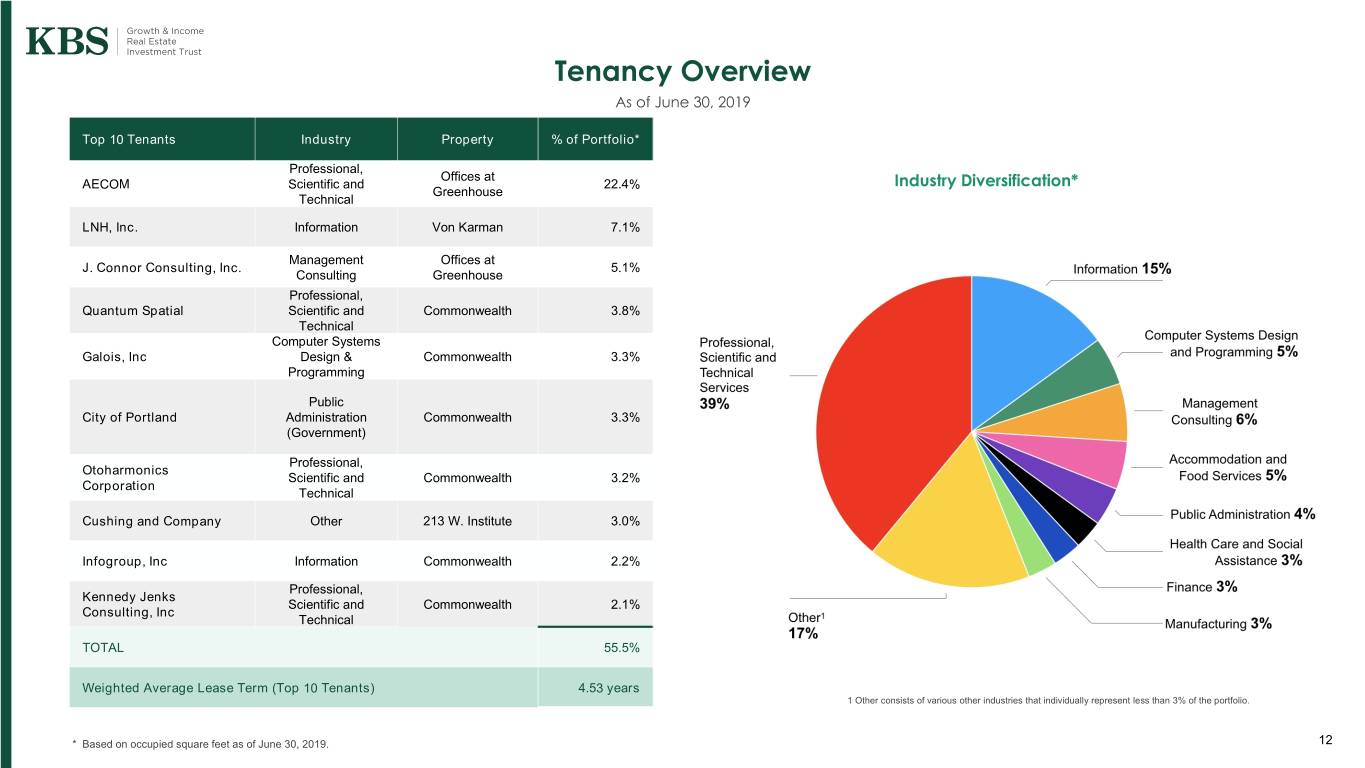
Tenancy Overview As of June 30, 2019 Top 10 Tenants Industry Property % of Portfolio* Professional, Offices at AECOM Scientific and 22.4% Industry Diversification* Greenhouse Technical LNH, Inc. Information Von Karman 7.1% Management Offices at J. Connor Consulting, Inc. 5.1% Consulting Greenhouse Professional, Quantum Spatial Scientific and Commonwealth 3.8% Technical Computer Systems Galois, Inc Design & Commonwealth 3.3% Programming Public City of Portland Administration Commonwealth 3.3% (Government) Professional, Otoharmonics Scientific and Commonwealth 3.2% Corporation Technical Cushing and Company Other 213 W. Institute 3.0% Infogroup, Inc Information Commonwealth 2.2% Professional, Kennedy Jenks Scientific and Commonwealth 2.1% Consulting, Inc Technical TOTAL 55.5% Weighted Average Lease Term (Top 10 Tenants) 4.53 years 1 Other consists of various other industries that individually represent less than 3% of the portfolio. * Based on occupied square feet as of June 30, 2019. 12

Von Karman Tech Center Investment at a Glance Location Irvine, CA Property Type Class B Office Acquisition Date August 12, 2015 Purchase Price $21,277,000 No. of Buildings 1 Stories 2 Total Rentable Square Feet 101,161 SF Site Size 4.61 Acres Year Built / Renovated 1980 / 2013 - 2014 Leased % at Acquisition 100% Current Leased Occupancy 6/30/19¹ 91.8% Avg. Rental Rate at Acquisition $20.16 / SF Avg. 2018 In-Place Rental Rate $23.11 / SF Current Market Rental Rate $34.00 / SF 2018 NOI Yield² 5.69% Submarket Irvine Airport Area Key Tenants % of Bldg. • LNH, Inc. 44.4% • Tadamerry Corp 9.2% 1 Includes future leases that have been executed but have not yet commenced as of June 30, 2019 • Lee & Sakahara Architects 7.8% 2 2018 NOI yield is calculated by taking the 2018 total NOI divided by the property’s average cost basis 13
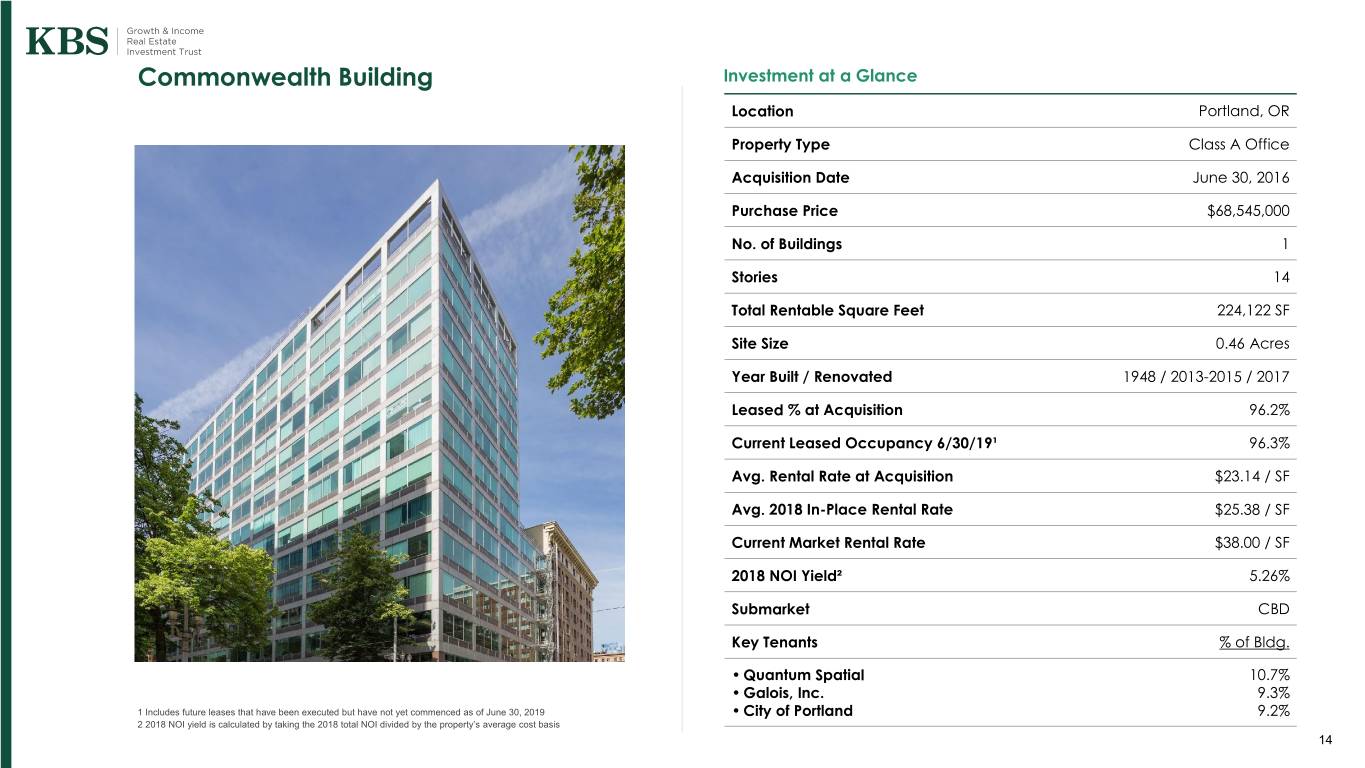
Commonwealth Building Investment at a Glance Location Portland, OR Property Type Class A Office Acquisition Date June 30, 2016 Purchase Price $68,545,000 No. of Buildings 1 Stories 14 Total Rentable Square Feet 224,122 SF Site Size 0.46 Acres Year Built / Renovated 1948 / 2013-2015 / 2017 Leased % at Acquisition 96.2% Current Leased Occupancy 6/30/19¹ 96.3% Avg. Rental Rate at Acquisition $23.14 / SF Avg. 2018 In-Place Rental Rate $25.38 / SF Current Market Rental Rate $38.00 / SF 2018 NOI Yield² 5.26% Submarket CBD Key Tenants % of Bldg. • Quantum Spatial 10.7% • Galois, Inc. 9.3% 1 Includes future leases that have been executed but have not yet commenced as of June 30, 2019 • City of Portland 9.2% 2 2018 NOI yield is calculated by taking the 2018 total NOI divided by the property’s average cost basis 14
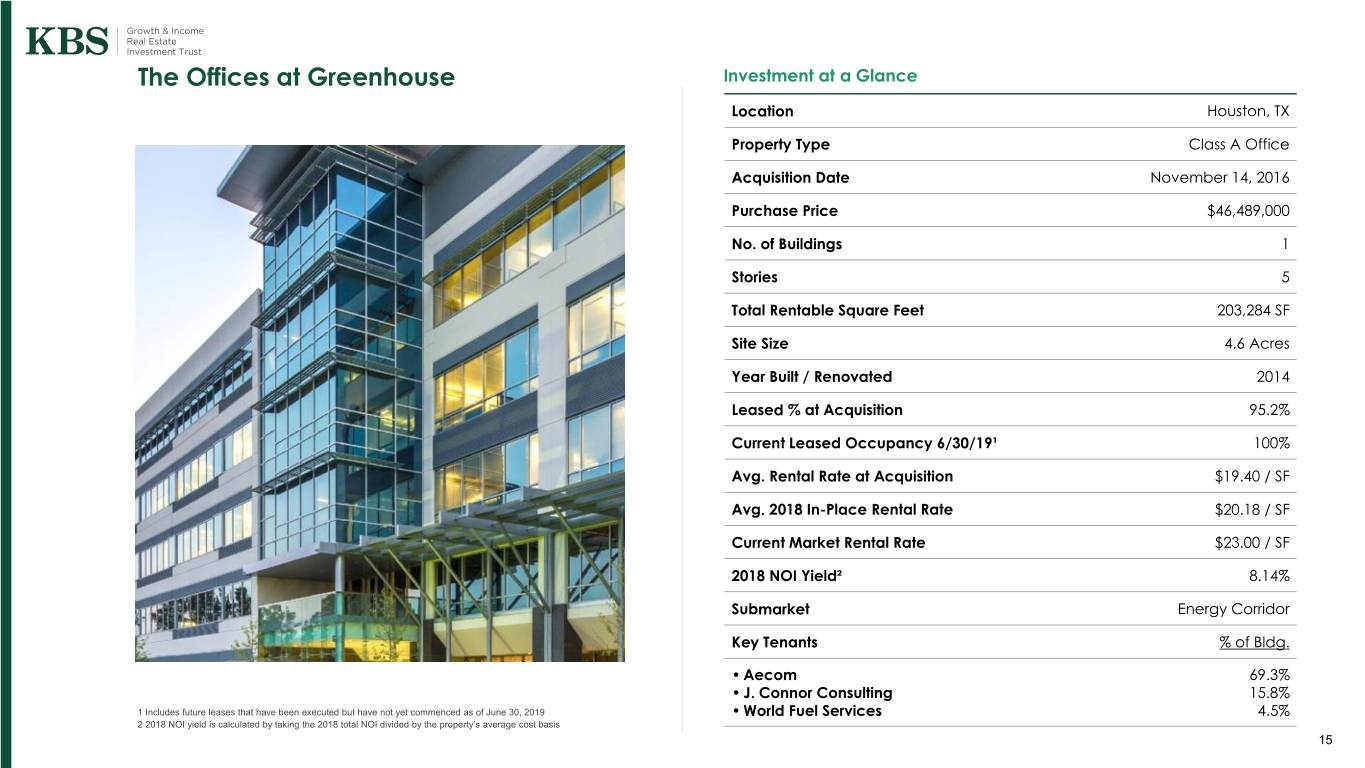
The Offices at Greenhouse Investment at a Glance Location Houston, TX Property Type Class A Office Acquisition Date November 14, 2016 Purchase Price $46,489,000 No. of Buildings 1 Stories 5 Total Rentable Square Feet 203,284 SF Site Size 4.6 Acres Year Built / Renovated 2014 Leased % at Acquisition 95.2% Current Leased Occupancy 6/30/19¹ 100% Avg. Rental Rate at Acquisition $19.40 / SF Avg. 2018 In-Place Rental Rate $20.18 / SF Current Market Rental Rate $23.00 / SF 2018 NOI Yield² 8.14% Submarket Energy Corridor Key Tenants % of Bldg. • Aecom 69.3% • J. Connor Consulting 15.8% 1 Includes future leases that have been executed but have not yet commenced as of June 30, 2019 • World Fuel Services 4.5% 2 2018 NOI yield is calculated by taking the 2018 total NOI divided by the property’s average cost basis 15

213 West Institute Investment at a Glance Location Chicago, IL Property Type Class B Office Acquisition Date November 9, 2017 Purchase Price $43,155,000 No. of Buildings 1 Stories 7 Total Rentable Square Feet 155,385 SF Site Size 0.67 Acres Year Built / Renovated 1908 / 2017 Leased % at Acquisition 92.4% Current Leased Occupancy 6/30/19¹ 88.8% Avg. Rental Rate at Acquisition $24.16 / SF Avg. 2018 In-Place Rental Rate $24.97 / SF Current Market Rental Rate $33.50 / SF 2018 NOI Yield² 5.20% Submarket River North Key Tenants % of Bldg. • Cushing and Company 12.2% • Downtown Entertainment 11.2% 1 Includes future leases that have been executed but have not yet commenced as of June 30, 2019 2 2018 NOI yield is calculated by taking the 2018 total NOI divided by the property’s average cost basis • Codingdojo 5.6% 16
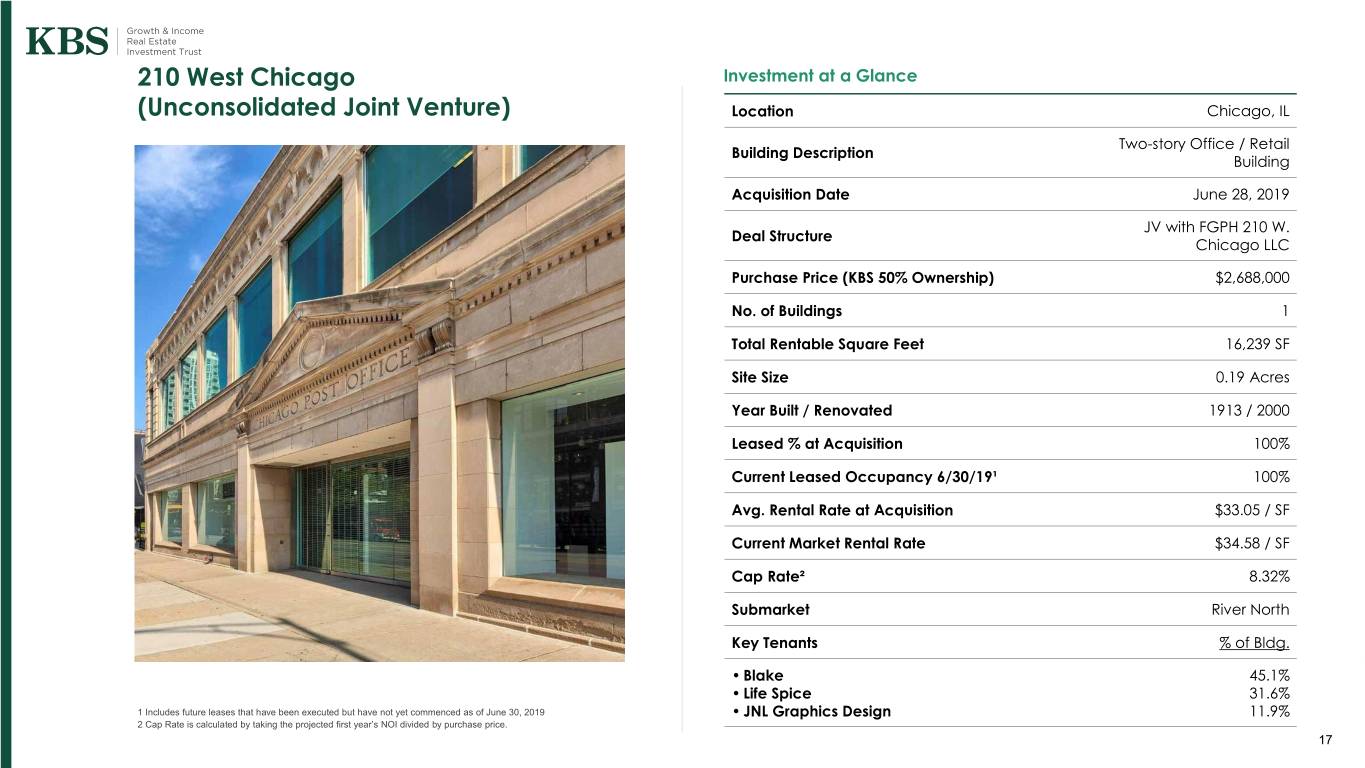
210 West Chicago Investment at a Glance (Unconsolidated Joint Venture) Location Chicago, IL Two-story Office / Retail Building Description Building Acquisition Date June 28, 2019 JV with FGPH 210 W. Deal Structure Chicago LLC Purchase Price (KBS 50% Ownership) $2,688,000 No. of Buildings 1 Total Rentable Square Feet 16,239 SF Site Size 0.19 Acres Year Built / Renovated 1913 / 2000 Leased % at Acquisition 100% Current Leased Occupancy 6/30/19¹ 100% Avg. Rental Rate at Acquisition $33.05 / SF Current Market Rental Rate $34.58 / SF Cap Rate² 8.32% Submarket River North Key Tenants % of Bldg. • Blake 45.1% • Life Spice 31.6% 1 Includes future leases that have been executed but have not yet commenced as of June 30, 2019 • JNL Graphics Design 11.9% 2 Cap Rate is calculated by taking the projected first year’s NOI divided by purchase price. 17
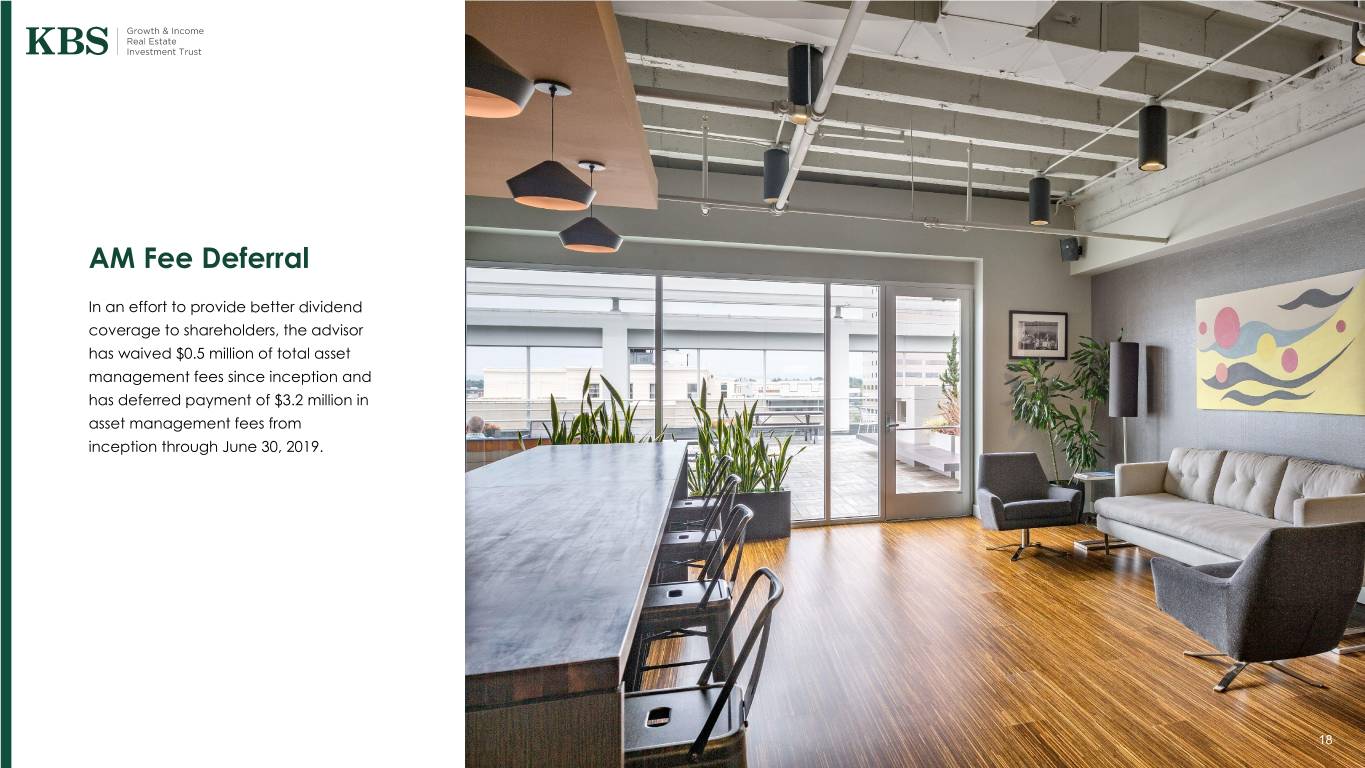
AM Fee Deferral In an effort to provide better dividend coverage to shareholders, the advisor has waived $0.5 million of total asset management fees since inception and has deferred payment of $3.2 million in asset management fees from inception through June 30, 2019. 18
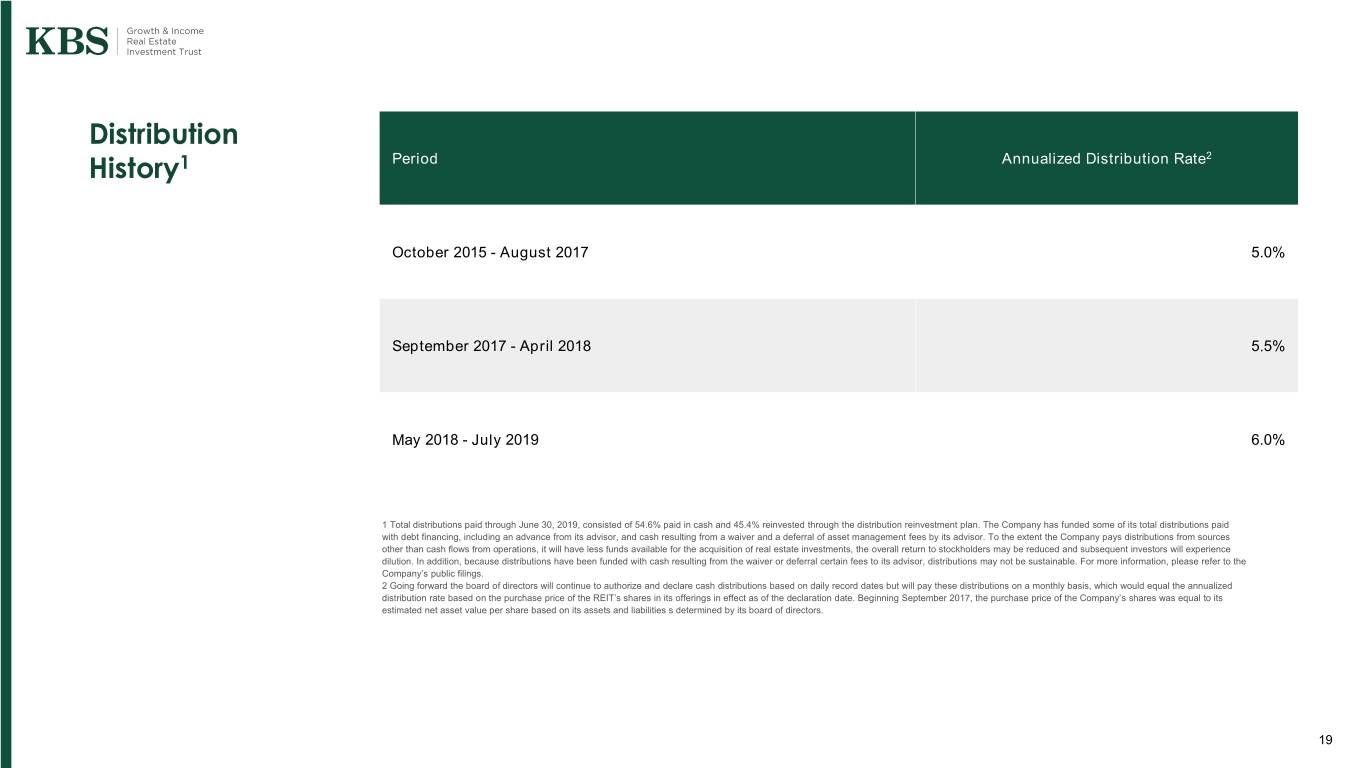
Distribution History1 Period Annualized Distribution Rate2 October 2015 - August 2017 5.0% September 2017 - April 2018 5.5% May 2018 - July 2019 6.0% 1 Total distributions paid through June 30, 2019, consisted of 54.6% paid in cash and 45.4% reinvested through the distribution reinvestment plan. The Company has funded some of its total distributions paid with debt financing, including an advance from its advisor, and cash resulting from a waiver and a deferral of asset management fees by its advisor. To the extent the Company pays distributions from sources other than cash flows from operations, it will have less funds available for the acquisition of real estate investments, the overall return to stockholders may be reduced and subsequent investors will experience dilution. In addition, because distributions have been funded with cash resulting from the waiver or deferral certain fees to its advisor, distributions may not be sustainable. For more information, please refer to the Company’s public filings. 2 Going forward the board of directors will continue to authorize and declare cash distributions based on daily record dates but will pay these distributions on a monthly basis, which would equal the annualized distribution rate based on the purchase price of the REIT’s shares in its offerings in effect as of the declaration date. Beginning September 2017, the purchase price of the Company’s shares was equal to its estimated net asset value per share based on its assets and liabilities s determined by its board of directors. 19
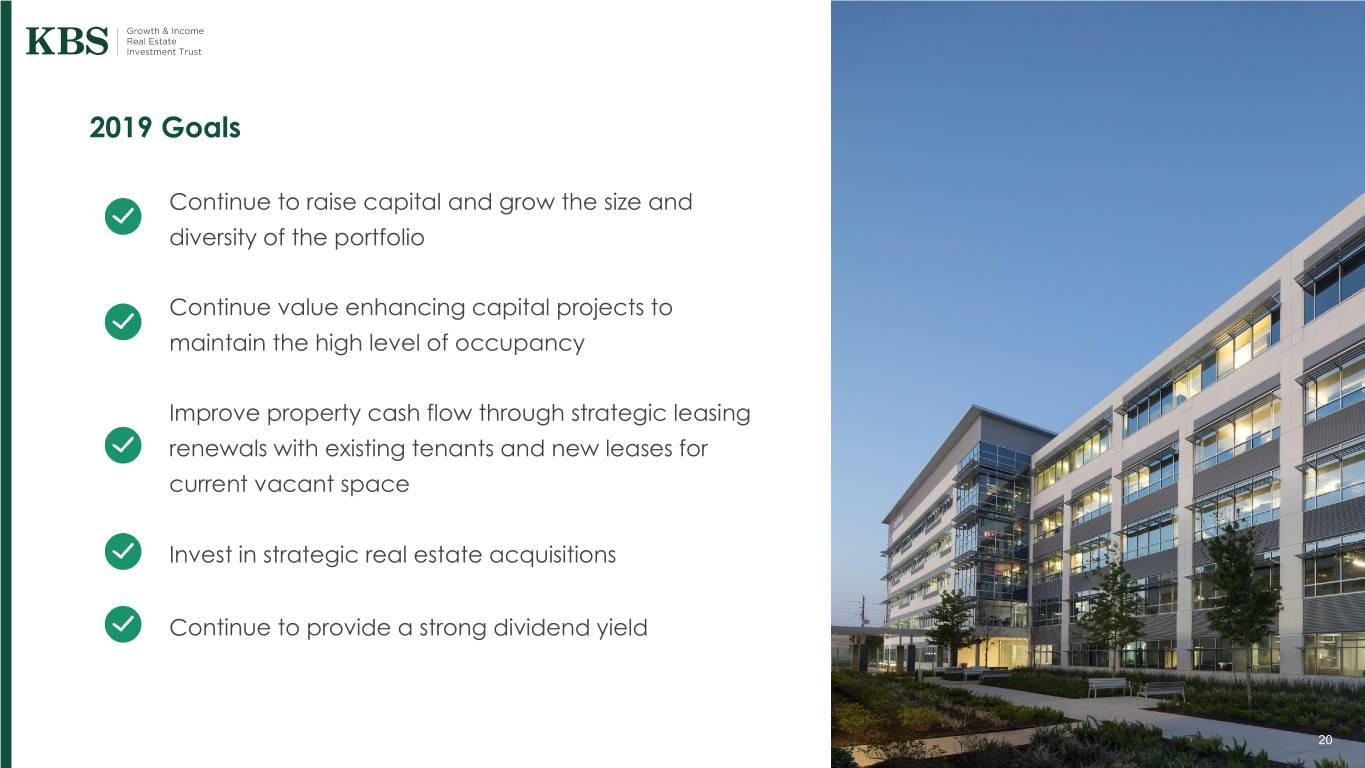
2019 Goals Continue to raise capital and grow the size and diversity of the portfolio Continue value enhancing capital projects to maintain the high level of occupancy Improve property cash flow through strategic leasing renewals with existing tenants and new leases for current vacant space Invest in strategic real estate acquisitions Continue to provide a strong dividend yield 20

Q&A For additional questions, contact KBS Capital Markets Group Investor Relations (866) 527-4264 21


