Exhibit 99.2
|
| | |
| | | |
| Community Healthcare Trust | | December 2015 |
| Incorporated | | |
Supplemental Information
Fourth Quarter 2015
|
|
| |
| |
| NYSE: CHCT |
| www.communityhealthcaretrust.com |
TABLE OF CONTENTS
Cautionary Note Regarding Forward-Looking Statements
In addition to the historical information contained within, the matters discussed in this supplemental operating and financial information package may contain forward-looking statements that involve risks and uncertainties. These risks and uncertainties are discussed from time to time in the Company's filings with the Securities and Exchange Commission. Readers are cautioned not to place undue reliance on the forward-looking statements contained herein which speak only as of the date hereof. The Company undertakes no obligation to update forward-looking statements, whether as the result of new information, future developments, or otherwise, except as may be required by law.
|
| | |
| Community Healthcare Trust / 4Q 2015 Supplemental Information | | Page 2 |
CORPORATE INFORMATION
|
| | | | |
| Corporate Headquarters |
| | | | | |
| Community Healthcare Trust Incorporated |
| 3326 Aspen Grove Drive, Suite 150 |
| Franklin, Tennessee 37067 |
| Phone: 615.771.3052 |
| E-mail: Investorrelations@communityhealthcaretrust.com |
| Website: www.communityhealthcaretrust.com |
| |
| |
| Board of Directors |
| | | | | |
| Timothy G. Wallace | Alan Gardner | Robert Hensley | Alfred Lumsdaine | R. Lawrence Van Horn |
Chairman of the Board, Chief Executive Officer and President | Lead Independent Director | Audit Committee Chair | Compensation Committee Chair | Governance Committee Chair |
| | | | | |
| | | | | |
| Management Team |
| | | | | |
| Timothy G. Wallace | W. Page Barnes | Steve Harrison | Roland H. Hart | Leigh Ann Stach |
Chief Executive Officer and President | Executive Vice President, Chief Financial Officer | Managing Director, Business Development | Vice President, Asset Management | Vice President, Financial Reporting and Chief Accounting Officer |
| | | | | |
| | Michael Willman | William R. Davis | James W. Short | |
| | Vice President, Real Estate | Vice President, Information Technology | Vice President, Special Projects | |
| | | | | |
| | | | | |
| Covering Analysts |
| | | | | |
| A. Goldfarb - Sandler O'Neil | | R. Stevenson - Janney Capital Markets |
| S. McGrath - Evercore ISI | | S. Manaker - Oppenheimer |
| E. Fleming - SunTrust Robinson Humphrey | | | |
| | | | | |
| | | | | |
| Professional Services |
| | | | | |
| Independent Registered Public Accounting Firm | Transfer Agent |
| BDO USA, LLP | American Stock Transfer & Trust Company, LLC |
| 414 Union Street, Suite 1800 | Operations Center |
| Nashville, Tennessee 37219 | 6201 15th Avenue |
| | | Brooklyn, NY 11219 |
| | | | 1.800.937.5449 |
|
| | |
| Community Healthcare Trust / 4Q 2015 Supplemental Information | | Page 3 |
HISTORICAL FFO AND NORMALIZED FFO (1) (2)
(dollars in thousands, except per share data)
|
| | | | | | | | | | | |
| | 2015 |
| | Q4 | | Q3 | | Q2 |
| Net income (loss) | $ | 121 |
| | $ | (67 | ) | | $ | (1,509 | ) |
| Real estate depreciation and amortization | 2,415 |
| | 2,211 |
| | 577 |
|
| Total adjustments | 2,415 |
| | 2,211 |
| | 577 |
|
| Funds from Operations | $ | 2,536 |
| | $ | 2,144 |
| | $ | (932 | ) |
| Transaction costs | 243 |
| | (101 | ) | | 1,546 |
|
| Normalized Funds From Operations | $ | 2,779 |
| | $ | 2,043 |
| | $ | 614 |
|
| Funds from Operations per Common Share-Diluted | $ | 0.34 |
| | $ | 0.29 |
| | $ | (0.26 | ) |
| Normalized Funds From Operations Per Common Share-Diluted | $ | 0.37 |
| | $ | 0.27 |
| | $ | 0.17 |
|
| Weighted Average Common Shares Outstanding-Diluted | 7,511,815 |
| | 7,507,460 |
| | 3,574,392 |
|
| Weighted Average Common Shares Outstanding-Diluted for Normalized FFO | 7,511,815 |
| | 7,507,460 |
| | 3,563,389 |
|
|
| | |
| (1 | ) | Historical cost accounting for real estate assets implicitly assumes that the value of real estate assets diminishes predictably over time. However, since real estate values have historically risen or fallen with market conditions, many industry investors deem presentations of operating results for real estate companies that use historical cost accounting to be insufficient by themselves. For that reason, the Company considers FFO and normalized FFO to be appropriate measures of operating performance of an equity REIT. In particular, the Company believes that normalized FFO is useful because it allows investors, analysts and Company management to compare the Company’s operating performance to the operating performance of other real estate companies and between periods on a consistent basis without having to account for differences caused by unanticipated items and other events.
The Company uses the NAREIT definition of FFO. Funds from operations ("FFO") and FFO per share are operating performance measures adopted by the National Association of Real Estate Investment Trusts, Inc. ("NAREIT"). NAREIT defines FFO as the most commonly accepted and reported measure of a REIT's operating performance equal to "net income (computed in accordance with GAAP), excluding gains (or losses) from sales of property, plus depreciation and amortization, and after adjustments for unconsolidated partnerships and joint ventures." The Company has included normalized FFO above which it has defined as FFO excluding certain expenses related to the Company's initial public offering and closing costs of properties acquired and mortgages funded. Normalized FFO presented herein may not be comparable to similar measures presented by other real estate companies due to the fact that not all real estate companies use the same definition.
FFO and normalized FFO should not be considered as alternatives to net income (determined in accordance with GAAP) as indicators of the Company’s financial performance or as alternatives to cash flow from operating activities (determined in accordance with GAAP) as measures of the Company’s liquidity, nor are they necessarily indicative of sufficient cash flow to fund all of the Company’s needs. The Company believes that in order to facilitate a clear understanding of the consolidated historical operating results of the Company, FFO and normalized FFO should be examined in conjunction with net income as presented elsewhere herein. |
| (2 | ) | There were no operations prior to the Company's initial public offering in May 2015, therefore, there were no funds from operations prior to the second quarter of 2015. |
|
| | |
| Community Healthcare Trust / 4Q 2015 Supplemental Information | | Page 4 |
BALANCE SHEET INFORMATION
(dollars in thousands, except per share data)
|
| | | | | | | | | | | | | | | |
| | 2015 | 2014 |
| | Q4 | Q3 | Q2 | Q1 | Q4 |
| ASSETS | | | | | |
| Real estate properties | | | | | |
| Land | $ | 13,216 |
| $ | 10,407 |
| $ | 9,357 |
| $ | — |
| $ | — |
|
| Buildings, improvements, and lease intangibles | 119,716 |
| 90,721 |
| 78,349 |
| — |
| — |
|
| Personal property | 35 |
| — |
| — |
| — |
| — |
|
| Total real estate properties | 132,967 |
| 101,128 |
| 87,706 |
| — |
| — |
|
| Less accumulated depreciation | (5,203 | ) | (2,788 | ) | (577 | ) | — |
| — |
|
| Total real estate properties, net | 127,764 |
| 98,340 |
| 87,129 |
| — |
| — |
|
| Cash and cash equivalents | 2,018 |
| 16,053 |
| 39,552 |
| 2 |
| 2 |
|
| Mortgage note receivable, net | 10,897 |
| 10,862 |
| — |
| — |
| — |
|
| Other assets, net | 2,124 |
| 1,795 |
| 1,139 |
| — |
| — |
|
| Total assets | $ | 142,803 |
| $ | 127,050 |
| $ | 127,820 |
| $ | 2 |
| $ | 2 |
|
| | | | | | |
| LIABILITIES AND STOCKHOLDERS' EQUITY | | | | | |
| Liabilities | | | | | |
| Revolving credit facility | $ | 17,000 |
| $ | — |
| $ | — |
| $ | — |
| $ | — |
|
| Accounts payable and accrued liabilities | 812 |
| 1,031 |
| 1,098 |
| — |
| — |
|
| Other liabilities | 2,721 |
| 1,060 |
| 687 |
| — |
| — |
|
| Total liabilities | 20,533 |
| 2,091 |
| 1,785 |
| — |
| — |
|
| | | | | | |
| Commitments and contingencies | | | | | |
| | | | | | |
| Stockholders' Equity | | | | | |
| Preferred stock, $0.01 par value; 50,000,000 shares authorized | — |
| — |
| — |
| — |
| — |
|
| Common stock, $0.01 par value; 450,000,000 shares authorized | 76 |
| 76 |
| 76 |
| 2 |
| 2 |
|
| Additional paid-in capital | 127,578 |
| 127,538 |
| 127,468 |
| — |
| — |
|
| Cumulative net loss | (1,456 | ) | (1,576 | ) | (1,509 | ) | — |
| — |
|
| Cumulative dividends | (3,928 | ) | (1,079 | ) | — |
| — |
| — |
|
| Total stockholders’ equity | 122,270 |
| 124,959 |
| 126,035 |
| 2 |
| 2 |
|
| Total liabilities and stockholders' equity | $ | 142,803 |
| $ | 127,050 |
| $ | 127,820 |
| $ | 2 |
| $ | 2 |
|
|
| | |
| Community Healthcare Trust / 4Q 2015 Supplemental Information | | Page 5 |
STATEMENTS OF OPERATIONS INFORMATION
(dollars in thousands, except per share data)
|
| | | | | | | | | | | | | | | |
| | 2015 | 2014 |
| | Q4 | Q3 | Q2 | Q1 | Q4 |
| | | | | | |
| REVENUES | | | | | |
| Rental income | $ | 3,050 |
| $ | 2,585 |
| $ | 729 |
| $ | — |
| $ | — |
|
| Tenant reimbursements | 1,202 |
| 655 |
| 107 |
| — |
| — |
|
| Mortgage interest | 304 |
| — |
| — |
| — |
| — |
|
| | 4,556 |
| 3,240 |
| 836 |
| — |
| — |
|
| | | | | | |
| EXPENSES | | | | | |
| Property operating | 1,123 |
| 751 |
| 138 |
| — |
| — |
|
| General and administrative | 646 |
| 223 |
| 1,603 |
| — |
| — |
|
| Depreciation and amortization | 2,416 |
| 2,211 |
| 577 |
| — |
| — |
|
| Bad debts | 71 |
| — |
| — |
| — |
| — |
|
| | 4,256 |
| 3,185 |
| 2,318 |
| — |
| — |
|
| OTHER INCOME (EXPENSE) | | | | | |
| Interest expense | (183 | ) | (140 | ) | (41 | ) | — |
| — |
|
| Interest and other income, net | 4 |
| 18 |
| 14 |
| — |
| — |
|
| | (179 | ) | (122 | ) | (27 | ) | — |
| — |
|
| NET INCOME (LOSS) AND COMPREHENSIVE INCOME (LOSS) | $ | 121 |
| $ | (67 | ) | $ | (1,509 | ) | $ | — |
| $ | — |
|
| | | | | | |
| INCOME (LOSS) PER COMMON SHARE | | | | | |
| Net income (loss) per common share – Basic | $ | 0.02 |
| $ | (0.01 | ) | $ | (0.42 | ) | $ | — |
| $ | — |
|
| Net income (loss) per common share – Diluted | $ | 0.02 |
| $ | (0.01 | ) | $ | (0.42 | ) | $ | — |
| $ | — |
|
| WEIGHTED AVERAGE COMMON SHARES OUTSTANDING-BASIC | 7,511,183 |
| 7,511,183 |
| 3,574,392 |
| 200,000 |
| 200,000 |
|
| WEIGHTED AVERAGE COMMON SHARES OUTSTANDING-DILUTED | 7,511,815 |
| 7,511,183 |
| 3,574,392 |
| 200,000 |
| 200,000 |
|
| DIVIDENDS DECLARED, PER COMMON SHARE, DURING THE PERIOD | $ | 0.375 |
| $ | 0.142 |
| $ | — |
| $ | — |
| $ | — |
|
|
| | |
| Community Healthcare Trust / 4Q 2015 Supplemental Information | | Page 6 |
INVESTMENT ACTIVITY
(dollars in thousands)
|
| | | | | | | | | | |
| 2015 INVESTMENT ACTIVITY | | | | |
| (As of December 31, 2015) | | | | | |
| | Location | Property Type | Acquisition/ Closing Date | Purchase Price/ Mortgage Funding | Square Feet | Aggregate Leased
% at Acquisition |
| | | | | | | |
| Property Acquisitions: | | | | | |
| | Portsmouth, VA | PC | 5/28/2015 | $ | 1,375 |
| 8,445 |
| 100.0 | % |
| | Circleville, OH | ASC | 5/28/2015 | 1,570 |
| 7,787 |
| 88.8 | % |
| | Tempe, AZ | ASC | 5/28/2015 | 2,700 |
| 13,000 |
| 100.0 | % |
| | Houston, TX | ASC | 5/28/2015 | 4,600 |
| 11,200 |
| 100.0 | % |
| | Brewton, AL | OC | 5/29/2015 | 1,154 |
| 3,971 |
| 100.0 | % |
| | Orlando, FL | PC | 5/29/2015 | 1,327 |
| 2,420 |
| 100.0 | % |
| | Lady Lake, FL | PC | 5/29/2015 | 1,585 |
| 2,894 |
| 100.0 | % |
| | Foley, AL | OC | 5/29/2015 | 1,786 |
| 6,146 |
| 100.0 | % |
| | Gulf Shores, AL | OC | 5/29/2015 | 1,860 |
| 6,398 |
| 100.0 | % |
| | Columbia, SC | ASC | 5/29/2015 | 2,200 |
| 16,969 |
| 94.0 | % |
| | Melbourne, FL | PC | 5/29/2015 | 2,858 |
| 5,228 |
| 100.0 | % |
| | Brook Park, OH | MOB | 5/29/2015 | 3,650 |
| 18,444 |
| 100.0 | % |
| | Shawnee, KS | MOB | 5/29/2015 | 4,236 |
| 24,840 |
| 89.5 | % |
| | Shawnee, KS | PC | 5/29/2015 | 4,978 |
| 24,557 |
| 100.0 | % |
| | Alamo, TX | MOB | 5/29/2015 | 5,300 |
| 41,797 |
| 96.1 | % |
| | Etowah, TN | DC | 6/1/2015 | 600 |
| 4,720 |
| 100.0 | % |
| | Fort Valley, GA | DC | 6/1/2015 | 1,100 |
| 4,920 |
| 100.0 | % |
| | Gallipolis, OH | DC | 6/1/2015 | 1,250 |
| 15,110 |
| 100.0 | % |
| | Gilbert, AZ | PC | 6/1/2015 | 1,700 |
| 8,200 |
| 100.0 | % |
| | Dahlonega, GA | MOB | 6/1/2015 | 3,450 |
| 20,621 |
| 100.0 | % |
| | Wichita, KS | MOB | 6/1/2015 | 7,350 |
| 43,945 |
| 92.5 | % |
| | Portage, WI | PC | 6/3/2015 | 3,000 |
| 14,000 |
| 100.0 | % |
| | Lancaster, PA | PC | 6/3/2015 | 3,100 |
| 20,000 |
| 100.0 | % |
| | Wichita, KS | PC | 6/5/2015 | 4,350 |
| 16,581 |
| 100.0 | % |
| | Pasadena, TX | MOB | 6/5/2015 | 6,500 |
| 51,316 |
| 67.8 | % |
| | Corsicana, TX | DC | 6/9/2015 | 2,625 |
| 17,699 |
| 82.6 | % |
| | Castle Rock, CO | DC | 6/12/2015 | 3,050 |
| 8,450 |
| 100.0 | % |
| | Florence, KY | DC | 6/30/2015 | 3,600 |
| 18,283 |
| 100.0 | % |
| | Florence, KY | MOB | 6/30/2015 | 4,600 |
| 36,362 |
| 86.6 | % |
| | Bourbonnais, IL | MOB | 7/1/2015 | 9,000 |
| 54,000 |
| 91.6 | % |
| | Eynon, PA | ASC | 8/13/2015 | 1,383 |
| 6,500 |
| 100.0 | % |
| | Canon City, CO | ASC | 9/24/2015 | 2,700 |
| 10,653 |
| 100.0 | % |
| | DeBary, FL | MOB | 10/22/2015 | 6,345 |
| 24,000 |
| 100.0 | % |
| | Winter Garden, FL | MOB | 11/5/2015 | 5,405 |
| 21,648 |
| 100.0 | % |
| | Anderson, IN | BF | 11/2/2015 | 2,900 |
| 10,200 |
| 100.0 | % |
| | Wichita, KS | PC | 11/20/2015 | 2,920 |
| 11,891 |
| 100.0 | % |
| | Farmington Hills, MI | ASC | 12/3/2015 | 5,895 |
| 27,217 |
| 82.0 | % |
| | Haleyville, AL | MOB | 12/30/2015 | 1,138 |
| 29,515 |
| 100.0 | % |
| | Winfield, AL | PC | 12/30/2015 | 3,178 |
| 60,592 |
| 100.0 | % |
| | Russellville, AL | MOB | 12/30/2015 | 1,385 |
| 29,129 |
| 100.0 | % |
| Total / Weighted Average | | | $ | 129,701 |
| 759,648 |
| 94.3 | % |
| | | | | | | |
| Mortgage Note Fundings: | | | | | |
| | Lafayette, LA | LTAC | 9/30/2015 | $ | 11,000 |
| 29,890 |
| 100.0 | % |
| Total / Weighted Average | | | $ | 11,000 |
| 29,890 |
| 100.0 | % |
|
| | |
| Community Healthcare Trust / 4Q 2015 Supplemental Information | | Page 7 |
LEASING INFORMATION
LEASE EXPIRATION SCHEDULE
|
| | | | | | | | | | | |
| | | Total Leased Square Footage | Annualized Lease Revenue |
| Year | Number of Leases Expiring | Amount | Percent (%) | Amount (in thousands) | Percent (%) |
| Q1 2016 | 2 |
| 1,689 |
| 0.2 | % | $ | 25 |
| 0.2 | % |
| Q2 2016 | 5 |
| 39,942 |
| 5.7 | % | 732 |
| 5.4 | % |
| Q3 2016 | 3 |
| 19,237 |
| 2.7 | % | 453 |
| 3.4 | % |
| Q4 2016 | 6 |
| 31,355 |
| 4.5 | % | 636 |
| 4.7 | % |
| 2017 | 8 |
| 64,369 |
| 9.1 | % | 1,596 |
| 11.8 | % |
| 2018 | 23 |
| 137,773 |
| 19.6 | % | 2,539 |
| 18.8 | % |
| 2019 | 18 |
| 94,297 |
| 13.4 | % | 2,138 |
| 15.8 | % |
| 2020 | 14 |
| 62,426 |
| 8.9 | % | 1,252 |
| 9.3 | % |
| 2021 | 3 |
| 26,590 |
| 3.8 | % | 557 |
| 4.1 | % |
| 2022 | 6 |
| 38,151 |
| 5.4 | % | 829 |
| 6.1 | % |
| 2023 | 2 |
| 11,800 |
| 1.7 | % | 162 |
| 1.2 | % |
| 2024 | 1 |
| 5,390 |
| 0.8 | % | 181 |
| 1.3 | % |
| 2025 | 6 |
| 28,696 |
| 4.1 | % | 857 |
| 6.3 | % |
| Thereafter | 12 |
| 139,978 |
| 19.8 | % | 1,504 |
| 11.3 | % |
| Month-to-Month | 2 |
| 2,066 |
| 0.3 | % | 38 |
| 0.3 | % |
| Totals | 111 |
| 703,759 |
| 100.0 | % | $ | 13,499 |
| 100.0 | % |
|
| | |
| Community Healthcare Trust / 4Q 2015 Supplemental Information | | Page 8 |
PROPERTY DIVERSIFICATION
(As of December 31, 2015)
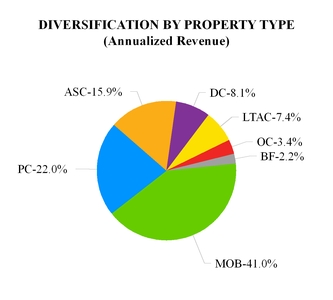
|
| | | | | | |
| Property Type | Number of Properties | (1) Annualized Revenue ($ in thousands) | Annualized Revenue (%) |
| Medical Office Building (MOB) | 12 | $ | 5,879 |
| 41.0 | % |
| Physicians Clinic (PC) | 11 | 3,155 |
| 22.0 | % |
| Ambulatory Surgery Center (ASC) | 7 | 2,276 |
| 15.9 | % |
| Dialysis Clinic (DC) | 6 | 1,172 |
| 8.1 | % |
| Long-term Acute Care Center (LTAC) (2) | 1 | 1,060 |
| 7.4 | % |
| Oncology Center (OC) | 3 | 493 |
| 3.4 | % |
| Behavioral Facility (BF) | 1 | 315 |
| 2.2 | % |
| Total | 41 | $ | 14,350 |
| 100.0 | % |
| ______________________ | | | |
| (1) Annualized revenue for leases was calculated by multiplying base rent for the month of December 2015 by 12 and for the mortgage was calculated based on the principal outstanding at December 31, 2015 in accordance with the mortgage note. |
| (2) Mortgage investment. | | | |
|
| | |
| Community Healthcare Trust / 4Q 2015 Supplemental Information | | Page 9 |
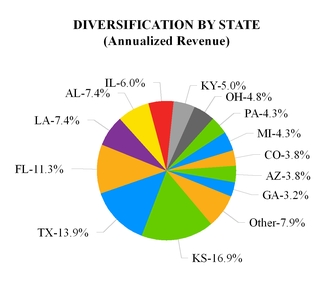
PROPERTY DIVERSIFICATION
(continued)
(As of December 31, 2015)
|
| | | | | | |
| State | Number of Properties | (1) Annualized Revenue ($ in thousands) | Annualized Revenue (%) |
| KS | 5 | $ | 2,428 |
| 16.9 | % |
| TX | 4 | 1,988 |
| 13.9 | % |
| FL | 5 | 1,615 |
| 11.3 | % |
| AL | 6 | 1,057 |
| 7.4 | % |
| LA (2) | 1 | 1,060 |
| 7.4 | % |
| IL | 1 | 857 |
| 6.0 | % |
| KY | 2 | 717 |
| 5.0 | % |
| OH | 3 | 692 |
| 4.8 | % |
| MI | 1 | 613 |
| 4.3 | % |
| PA | 2 | 615 |
| 4.3 | % |
| AZ | 2 | 539 |
| 3.8 | % |
| CO | 2 | 550 |
| 3.8 | % |
| GA | 2 | 461 |
| 3.2 | % |
| Other (Less than 3%) | 5 | 1,157 |
| 7.9 | % |
| Total | 41 | $ | 14,350 |
| 100.0 | % |
| _________________ | | | |
| (1) Annualized revenue for leases was calculated by multiplying base rent for the month of December 2015 by 12 and for the mortgage was calculated based on the principal outstanding at December 31, 2015 in accordance with the mortgage note. |
| (2) Mortgage investment. | | | |
|
| | |
| Community Healthcare Trust / 4Q 2015 Supplemental Information | | Page 10 |
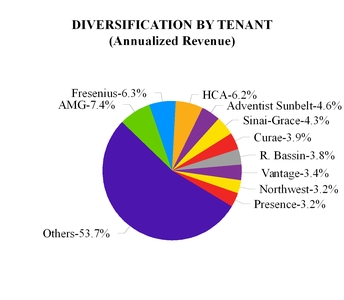
PROPERTY DIVERSIFICATION
(continued)
(As of December 31, 2015)
|
| | | | | |
| Tenant | (1) Annualized Revenue ($ in thousands) | Annualized Revenue (%) |
| AMG Specialty Hospital (2) | $ | 1,060 |
| 7.4 | % |
| Fresenius | 907 |
| 6.3 | % |
| HCA | 884 |
| 6.2 | % |
| Adventist Health System Sunbelt Healthcare Corporation | 655 |
| 4.6 | % |
| DMC Sinai-Grace Hospital | 613 |
| 4.3 | % |
| Curae Health | 564 |
| 3.9 | % |
| Roger E. Bassin | 543 |
| 3.8 | % |
| Vantage Oncology | 493 |
| 3.4 | % |
| Northwest Surgery Associates | 466 |
| 3.2 | % |
| Presence Health | 452 |
| 3.2 | % |
| Other (Less than 3%) | 7,713 |
| 53.7 | % |
| Total | $ | 14,350 |
| 100.0 | % |
| | | |
| (1) Annualized revenue for leases was calculated by multiplying base rent for the month of December 2015 by 12 and for the mortgage was calculated based on the principal outstanding at December 31, 2015 in accordance with the mortgage note. |
| (2) Mortgage investment. |
|
| | |
| Community Healthcare Trust / 4Q 2015 Supplemental Information | | Page 11 |