| | |
SUPPLEMENTAL INFORMATION Q2 2023 |
| | | | | | | | |
| Community Healthcare Trust | | 2Q 2023 | Supplemental Information |
ABOUT US
CHCT is a self-managed healthcare real estate investment trust (“REIT”) that owns a diverse portfolio of properties including medical office buildings, acute inpatient behavioral facilities, inpatient rehabilitation facilities, physician clinics, specialty centers, behavioral specialty facilities, and surgical centers and hospitals across the United States, primarily outside of urban centers. As a result of favorable demographic trends, increases in healthcare spending, and the shift in the delivery of healthcare services to community-based facilities, we believe our properties are essential for healthcare providers to serve their local markets.
TABLE OF CONTENTS
| | | | | | | | |
| Community Healthcare Trust | | 2Q 2023 | Supplemental Information |
COMPANY SNAPSHOT
| | | | | |
| June 30, 2023 |
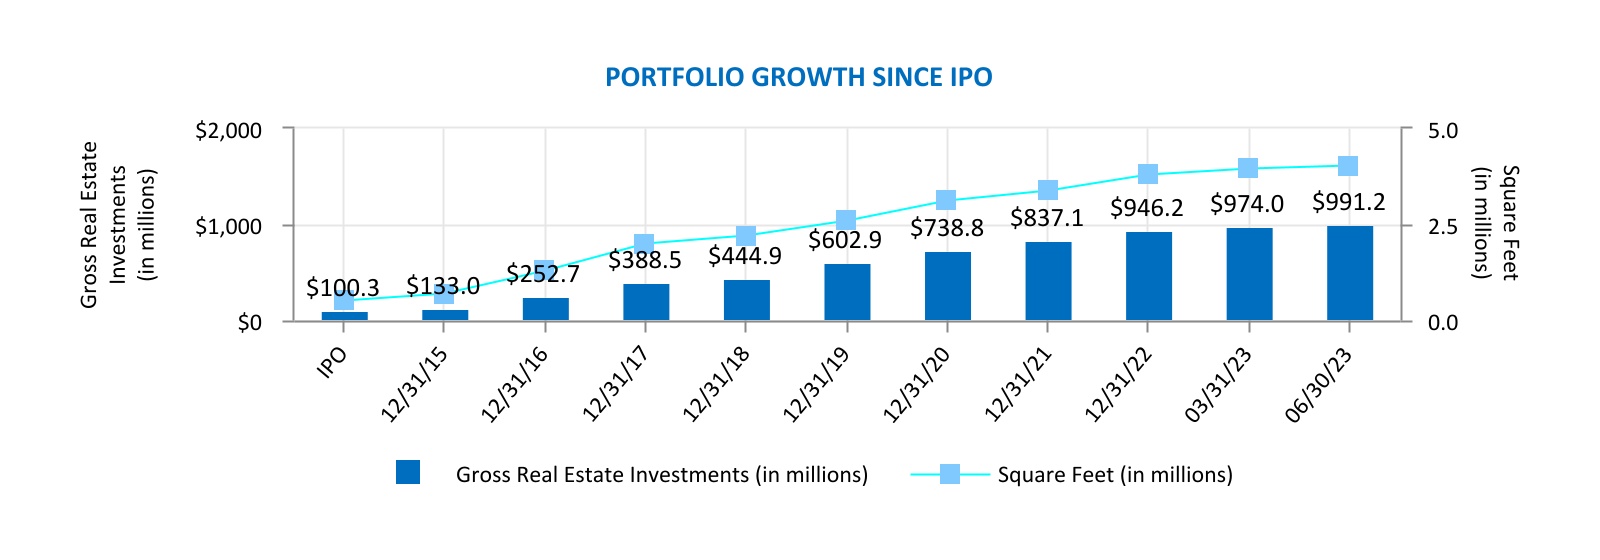
Gross real estate investments (in thousands) (1) | $991,218 | |
| Total properties | 184 | |
| % Leased | 91.7 | % |
| Total square feet owned | 4,025,960 | |
| Weighted Average remaining lease term (years) | 7.1 |
| Cash and cash equivalents and restricted cash (in thousands) | $3,676 | |
| Debt to Total Capitalization | 34.9 | % |
| Weighted average interest rate per annum on Revolving Line of Credit | 6.8 | % |
| Weighted average interest rate per annum on Term Loans | 4.3 | % |
| Equity market cap (in millions) | $876.4 | |
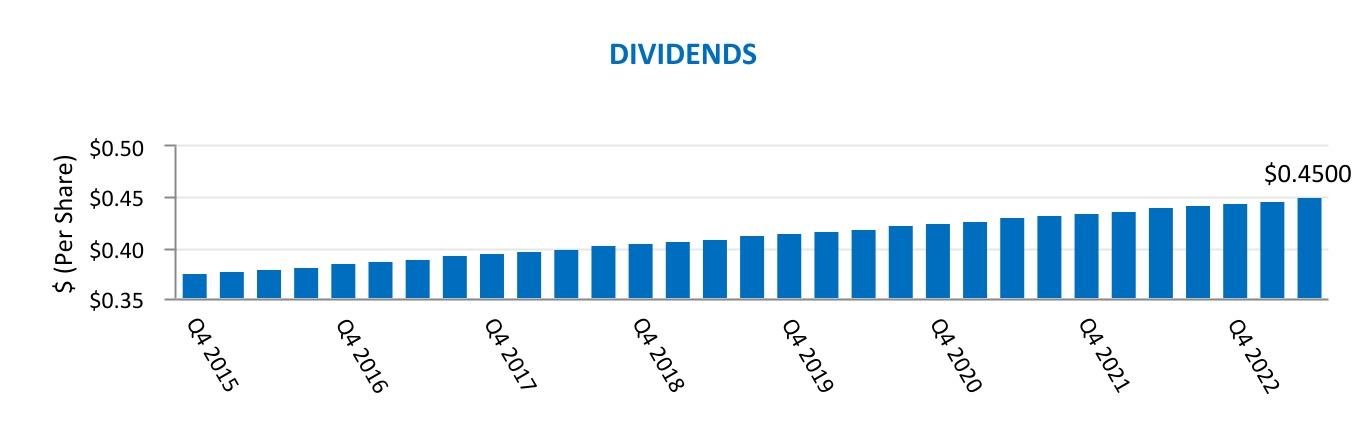
| Quarterly dividend paid in the period (per share) | $0.4500 | |
| Quarter end stock price (per share) | $33.02 | |
| Dividend yield | 5.45 | % |
| Common shares outstanding | 26,541,243 | |
| ___________ | |
(1) Includes a portion of one property accounted for as a sales-type lease and one property classified as held for sale. |
| | | | | | | | |
| Community Healthcare Trust | Page | 3 | 2Q 2023 | Supplemental Information |
CORPORATE INFORMATION
| | | | | | | | | | | | | | | | | |
| | | | | |
| Community Healthcare Trust Incorporated |
| 3326 Aspen Grove Drive, Suite 150 |
| Franklin, TN 37067 |
| Phone: 615-771-3052 |
| E-mail: Investorrelations@chct.reit |
Website: www.chct.reit |
| |
| |
| BOARD OF DIRECTORS | |
| | | | | |
| | | | | |
| Alan Gardner | Robert Hensley | Claire Gulmi | R. Lawrence Van Horn | Cathrine Cotman | David Dupuy |
Chairman of the
Board | Audit Committee
Chair | Compensation Committee
Chair | ESG Committee
Chair | Board
member | Board
member |
| | | | | |
| | | | | |
| | | | | | | | | | | | |
| EXECUTIVE MANAGEMENT TEAM |
| | | | |
| | | | |
| David H. Dupuy | William G. Monroe IV | Leigh Ann Stach | Timothy L. Meyer |
| Chief Executive Officer
and President | Executive Vice President
Chief Financial Officer | Executive Vice President
Chief Accounting Officer | Executive Vice President
Asset Management |
| | | | |
| | | | |
| | | | | |
| COVERING ANALYSTS |
| |
| |
| A. Goldfarb - Piper Sandler | M. Lewis - Truist Securities |
| S. Sakwa - Evercore ISI | R. Stevenson - Janney Capital Markets |
| D. Rodgers - Baird | D. Toti - Colliers International Securities |
| |
| |
| PROFESSIONAL SERVICES |
| |
| |
| Independent Registered Public Accounting Firm | Transfer Agent |
| BDO USA, P.A. | American Stock Transfer & Trust Company, LLC |
| 501 Commerce Street, Suite 1400 | Operations Center |
| Nashville, TN 37203 | 6201 15th Avenue |
| Brooklyn, NY 11219 |
| 1-800-937-5449 |
| | | | | | | | |
| Community Healthcare Trust | Page | 4 | 2Q 2023 | Supplemental Information |
FINANCIAL HIGHLIGHTS
| | | | | | | | | | | | | | | | | | | | |
| | Three Months Ended |
| | 2Q 2023 | 1Q 2023 | 4Q 2022 | 3Q 2022 | 2Q 2022 |
| | (Unaudited and in thousands, except per share data) |
| STATEMENTS OF OPERATIONS ITEMS | | | | | |
| Revenues | $ | 27,810 | | $ | 27,176 | | $ | 25,342 | | $ | 24,807 | | $ | 24,049 | |
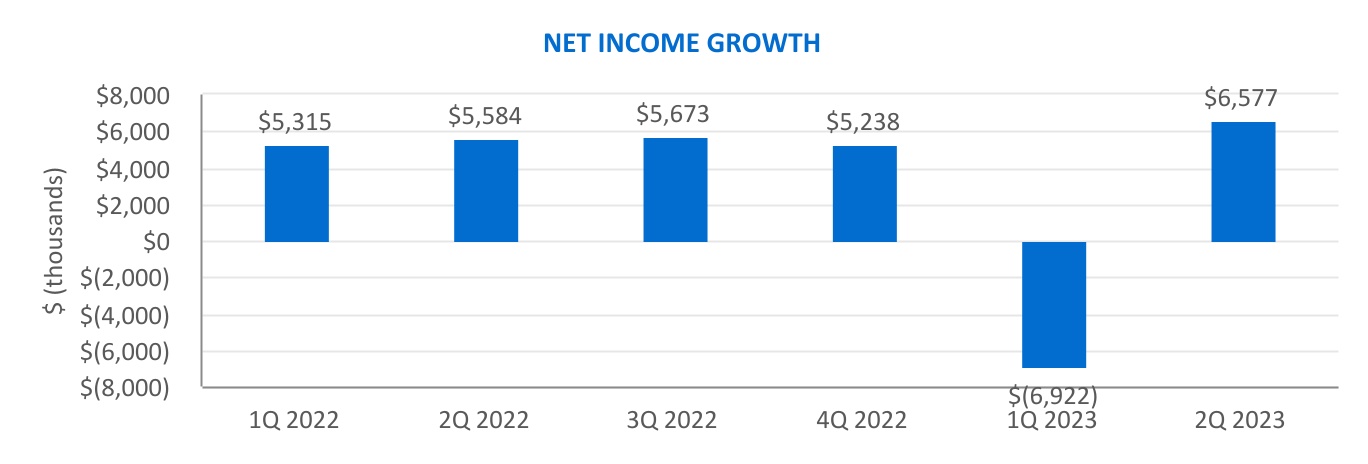
| Net income (loss) (1) | $ | 6,577 | | $ | (6,922) | | $ | 5,238 | | $ | 5,673 | | $ | 5,584 | |
| NOI | $ | 23,024 | | $ | 22,303 | | $ | 21,186 | | $ | 20,480 | | $ | 19,987 | |
| EBITDAre | $ | 19,986 | | $ | 6,123 | | $ | 17,040 | | $ | 16,725 | | $ | 16,432 | |
| Adjusted EBITDAre | $ | 20,972 | | $ | 20,469 | | $ | 19,685 | | $ | 19,189 | | $ | 18,616 | |
| FFO (2) | $ | 15,870 | | $ | 2,166 | | $ | 13,620 | | $ | 13,751 | | $ | 13,725 | |
| AFFO | $ | 16,037 | | $ | 15,595 | | $ | 15,411 | | $ | 15,362 | | $ | 14,992 | |
| | | | | | |
| Per Diluted Share: | | | | | |
| Net income (loss) attributable to common shareholders | $ | 0.24 | | $ | (0.32) | | $ | 0.19 | | $ | 0.21 | | $ | 0.21 | |
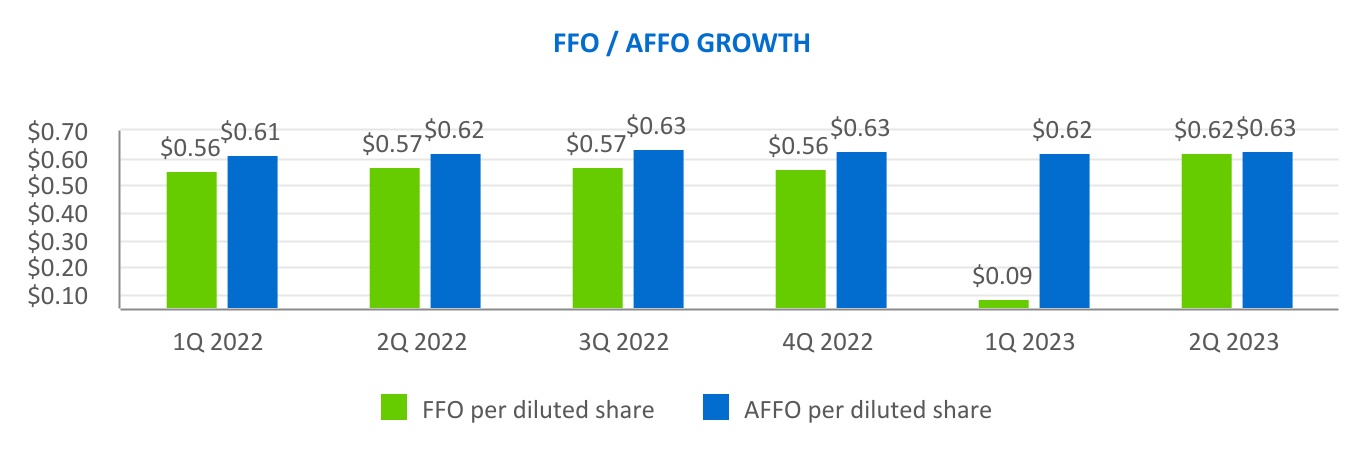
| FFO (2) | $ | 0.62 | | $ | 0.09 | | $ | 0.56 | | $ | 0.57 | | $ | 0.57 | |
| AFFO | $ | 0.63 | | $ | 0.62 | | $ | 0.63 | | $ | 0.63 | | $ | 0.62 | |
| ___________ | | | | | |
| (1) Net loss for the first quarter of 2023 included accelerated amortization of $11.8 million recognized upon passing of our former CEO and President. |
| (2) FFO includes a $0.7 million net casualty gain from insurance proceeds received related to one property that was vandalized. The net gain increased FFO by $0.03 per diluted share for the three months ended June 30, 2023. |
| | | | | | | | |
| Community Healthcare Trust | Page | 5 | 2Q 2023 | Supplemental Information |
FINANCIAL HIGHLIGHTS (Continued)
| | | | | | | | | | | | | | | | | | | | |
| | As of |
| | 2Q 2023 | 1Q 2023 | 4Q 2022 | 3Q 2022 | 2Q 2022 |
| | (Unaudited and dollars in thousands) |
| BALANCE SHEET ITEMS | | | | | |
| ASSETS | | | | | |
| Total real estate properties | $ | 986,948 | | $ | 971,026 | | $ | 943,167 | | $ | 886,958 | | $ | 866,481 | |
| Total assets | $ | 900,466 | | $ | 886,294 | | $ | 876,425 | | $ | 811,929 | | $ | 786,034 | |
| | | | | | |
| CAPITALIZATION | | | | | |
| Net debt | $ | 368,127 | | $ | 365,061 | | $ | 352,997 | | $ | 310,781 | | $ | 291,726 | |
| Total capitalization | $ | 1,055,221 | | $ | 1,033,922 | | $ | 1,015,152 | | $ | 946,307 | | $ | 913,737 | |
| Net debt/total capitalization | 34.9 | % | 35.3 | % | 34.8 | % | 32.8 | % | 31.9 | % |
| Market valuation | $ | 876,392 | | $ | 961,617 | | $ | 927,129 | | $ | 828,547 | | $ | 908,844 | |
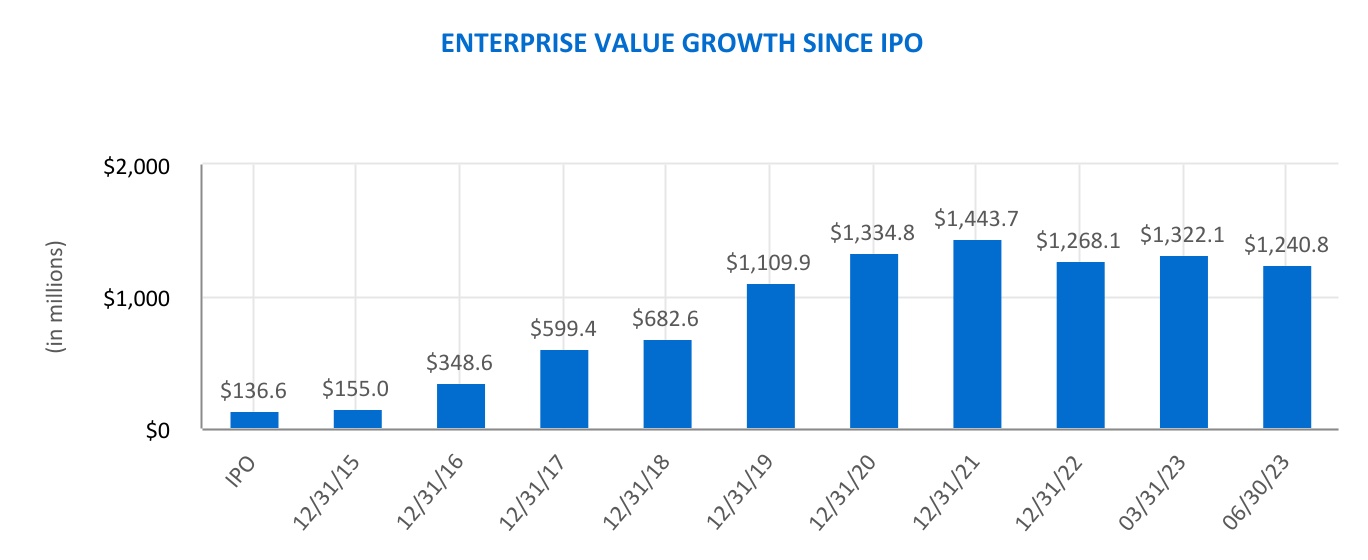
| Enterprise value | $ | 1,240,843 | | $ | 1,322,053 | | $ | 1,268,058 | | $ | 1,135,990 | | $ | 1,198,212 | |
| | | | | | | | |
| Community Healthcare Trust | Page | 6 | 2Q 2023 | Supplemental Information |
CONSOLIDATED BALANCE SHEETS
| | | | | | | | | | | | | | | | | |
| As of |
| 2Q 2023 | 1Q 2023 | 4Q 2022 | 3Q 2022 | 2Q 2022 |
| ASSETS | (Unaudited; Dollars and shares in thousands, except per share data) |
| Real estate properties | | | | | |
| Land and land improvements | $ | 127,433 | | $ | 122,702 | | $ | 117,657 | | $ | 103,413 | | $ | 101,909 | |
| Buildings, improvements, and lease intangibles | 859,231 | | 848,060 | | 825,257 | | 783,308 | | 764,338 | |
| Personal property | 284 | | 264 | | 253 | | 237 | | 234 | |
| Total real estate properties | 986,948 | | 971,026 | | 943,167 | | 886,958 | | 866,481 | |
| Less accumulated depreciation | (181,769) | | (174,346) | | (165,341) | | (157,040) | | (149,049) | |
| Total real estate properties, net | 805,179 | | 796,680 | | 777,826 | | 729,918 | | 717,432 | |
| Cash and cash equivalents | 2,627 | | 3,666 | | 11,233 | | 2,656 | | 1,699 | |
| Restricted cash | 1,049 | | 959 | | 835 | | 682 | | 659 | |
| | | | | |
| Other assets, net | 91,611 | | 84,989 | | 86,531 | | 78,673 | | 66,244 | |
| Total assets | $ | 900,466 | | $ | 886,294 | | $ | 876,425 | | $ | 811,929 | | $ | 786,034 | |
| | | | | |
| LIABILITIES AND STOCKHOLDERS' EQUITY | | | | | |
| Liabilities | | | | | |
| Debt, net | $ | 368,127 | | $ | 365,061 | | $ | 352,997 | | $ | 310,781 | | $ | 291,726 | |
| Accounts payable and accrued liabilities | 10,605 | | 10,478 | | 11,377 | | 8,143 | | 7,219 | |
| Other liabilities, net | 16,409 | | 16,240 | | 15,237 | | 14,519 | | 14,127 | |
| Total liabilities | 395,141 | | 391,779 | | 379,611 | | 333,443 | | 313,072 | |
| | | | | |
| Commitments and contingencies | | | | | |
| | | | | |
| Stockholders' Equity | | | | | |
| Preferred stock, $0.01 par value; 50,000 shares authorized | — | | — | | — | | — | | — | |
| Common stock, $0.01 par value; 450,000 shares authorized | 265 | | 263 | | 259 | | 253 | | 251 | |
| Additional paid-in capital | 657,057 | | 648,384 | | 625,136 | | 601,968 | | 599,631 | |
| Cumulative net income | 80,797 | | 74,220 | | 81,142 | | 75,904 | | 70,231 | |
| Accumulated other comprehensive gain | 23,085 | | 15,684 | | 22,667 | | 21,468 | | 12,761 | |
| Cumulative dividends | (255,879) | | (244,036) | | (232,390) | | (221,107) | | (209,912) | |
| Total stockholders’ equity | 505,325 | | 494,515 | | 496,814 | | 478,486 | | 472,962 | |
| Total liabilities and stockholders' equity | $ | 900,466 | | $ | 886,294 | | $ | 876,425 | | $ | 811,929 | | $ | 786,034 | |
| | | | | | | | |
| Community Healthcare Trust | Page | 7 | 2Q 2023 | Supplemental Information |
CONSOLIDATED STATEMENTS OF INCOME
| | | | | | | | | | | | | | | | | |
| Three Months Ended |
| 2Q 2023 | 1Q 2023 | 4Q 2022 | 3Q 2022 | 2Q 2022 |
| (Unaudited; Dollars and shares in thousands, except per share data) |
| REVENUES | | | | | |
| Rental income | $ | 26,764 | | $ | 26,128 | | $ | 24,383 | | $ | 23,919 | | $ | 23,197 | |
| | | | | |
| | | | | |
| Other operating interest | 1,046 | | 1,048 | | 959 | | 888 | | 852 | |
| 27,810 | | 27,176 | | 25,342 | | 24,807 | | 24,049 | |
| | | | | |
| EXPENSES | | | | | |
| Property operating | 4,786 | | 4,873 | | 4,156 | | 4,327 | | 4,062 | |
General and administrative (1) (2) | 3,787 | | 16,205 | | 4,149 | | 3,762 | | 3,610 | |
| Depreciation and amortization | 9,219 | | 9,018 | | 8,317 | | 8,003 | | 8,077 | |
| | | | | |
| 17,792 | | 30,096 | | 16,622 | | 16,092 | | 15,749 | |
| | | | | |
| INCOME BEFORE INCOME TAXES AND OTHER ITEMS | 10,018 | | (2,920) | | 8,720 | | 8,715 | | 8,300 | |
| | | | | |
| Interest expense | (4,140) | | (3,992) | | (3,464) | | (3,028) | | (2,755) | |
| | | | | |
| Deferred income tax expense | (50) | | (35) | | (21) | | (21) | | (16) | |
| Interest and other income | 749 | | 25 | | 3 | | 7 | | 55 | |
| NET INCOME (LOSS) | $ | 6,577 | | $ | (6,922) | | $ | 5,238 | | $ | 5,673 | | $ | 5,584 | |
| | | | | |
| NET INCOME (LOSS) PER COMMON SHARE | | | | | |
| | | | | |
| NET INCOME (LOSS) PER DILUTED COMMON SHARE | $ | 0.24 | | $ | (0.32) | | $ | 0.19 | | $ | 0.21 | | $ | 0.21 | |
| WEIGHTED AVERAGE COMMON SHARES OUTSTANDING | 25,065 | | 24,227 | | 23,787 | | 23,587 | | 23,578 | |
| DIVIDENDS DECLARED, PER COMMON SHARE, IN THE PERIOD | $ | 0.4500 | | $ | 0.4475 | | $ | 0.4450 | | $ | 0.4425 | | $ | 0.4400 | |
| | | | | | |
|
(1) GENERAL AND ADMINISTRATIVE EXPENSES: | | | | |
| Non-cash vs. Cash: | | | | | |
| Non-cash (stock-based compensation) | 44.7 | % | 57.8 | % | 63.8 | % | 65.5 | % | 60.5 | % |
| Cash | 55.3 | % | 42.2 | % | 36.2 | % | 34.5 | % | 39.5 | % |
| As a % of Revenue: | | | | | |
| Non-cash (stock-based compensation) | 5.9 | % | 9.3 | % | 10.4 | % | 9.9 | % | 9.1 | % |
| Cash | 7.3 | % | 6.8 | % | 5.9 | % | 5.2 | % | 5.9 | % |
| | | | | |
(2) General and administrative expenses for the three months ended March 31, 2023 includes the accelerated amortization of stock-based compensation totaling $11.8 million recognized upon the passing of our former CEO and President but the accelerated amortization is not included in the calculations above in footnote (1). |
| | | | | | | | |
| Community Healthcare Trust | Page | 8 | 2Q 2023 | Supplemental Information |
RECONCILIATION OF NON-GAAP MEASURES
FUNDS FROM OPERATIONS (FFO)
ADJUSTED FUNDS FROM OPERATIONS (AFFO)
| | | | | | | | | | | | | | | | | | | | |
| | Three Months Ended |
| | 2Q 2023 | 1Q 2023 | 4Q 2022 | 3Q 2022 | 2Q 2022 |
| | (Unaudited; Dollars and shares in thousands, except per share data) |
| NET INCOME (LOSS) | $ | 6,577 | | $ | (6,922) | | $ | 5,238 | | $ | 5,673 | | $ | 5,584 | |
| Real estate depreciation and amortization | 9,293 | | 9,088 | | 8,382 | | 8,078 | | 8,141 | |
| | | | | | |
| | | | | | |
| | | | | | |
| | | | | | |
| FFO (1) | 15,870 | | 2,166 | | 13,620 | | 13,751 | | 13,725 | |
| Straight-line rent | (819) | | (917) | | (854) | | (853) | | (917) | |
| Stock-based compensation | 1,692 | | 2,547 | | 2,645 | | 2,464 | | 2,184 | |
| Accelerated amortization of stock-based compensation | — | | 11,799 | | — | | — | | — | |
| Net gain from insurance recovery on casualty loss | (706) | | — | | — | | — | | — | |
| AFFO | $ | 16,037 | | $ | 15,595 | | $ | 15,411 | | $ | 15,362 | | $ | 14,992 | |
| FFO PER COMMON SHARE (1) | $ | 0.62 | | $ | 0.09 | | $ | 0.56 | | $ | 0.57 | | $ | 0.57 | |
| AFFO PER COMMON SHARE | $ | 0.63 | | $ | 0.62 | | $ | 0.63 | | $ | 0.63 | | $ | 0.62 | |
| WEIGHTED AVERAGE COMMON SHARES OUTSTANDING | 25,650 | | 25,298 | | 24,471 | | 24,312 | | 24,247 | |
| ________________ | | | | | |
| (1) FFO includes a $0.7 million net casualty gain from insurance proceeds received related to one property that was vandalized. The net gain increased FFO by $0.03 per diluted share for the three months ended June 30, 2023. |
| | | | | | |
| AFFO, ADJUSTED FOR ACQUISITIONS (1) | | | | | |
| | | | | |
| AFFO | $ | 16,037 | | $ | 15,595 | | $ | 15,411 | | $ | 15,362 | | $ | 14,992 | |
| Revenue on Properties Acquired in the period (2) | 308 | | 383 | | 1,116 | | 308 | | 302 | |
| Property operating expense adjustment (2) | (71) | | (104) | | (308) | | (4) | | (31) | |
| Interest expense adjustment (3) | (68) | | (65) | | (232) | | (58) | | (32) | |
| AFFO, ADJUSTED FOR ACQUISITIONS | $ | 16,206 | | $ | 15,809 | | $ | 15,987 | | $ | 15,608 | | $ | 15,231 | |
| | | | | | |
| (1) AFFO is adjusted to reflect acquisitions as if they had occurred on the first day of the applicable period. |
| (2) Revenue and expense adjustments are calculated based on expected returns and leases in place at acquisition. |
| (3) Assumes that acquisitions were 40% funded with debt and the remainder funded with equity. The interest expense adjustment was calculated using the weighted average interest rate on the Company's revolving credit facility for the period. |
|
| AMORTIZATION OF STOCK-BASED COMPENSATION (1) | | | | | |
| Amortization Required by GAAP (2) | $ | 1,692 | | $ | 2,547 | | $ | 2,675 | | $ | 2,464 | | $ | 2,184 | |
| Amortization Based on Legal Vesting Periods | 1,430 | | 1,830 | | 1,845 | | 1,822 | | 1,701 | |
| Acceleration of Amortization | $ | 262 | | $ | 717 | | $ | 830 | | $ | 642 | | $ | 483 | |
| | | | | | |
| (1) Excludes the accelerated amortization totaling $11.8 million recognized in the first quarter of 2023 upon the passing of our former CEO and President. |
| (2) GAAP requires that deferred compensation be amortized over the earlier of the vesting or retirement eligibility date. |
| | | | | | | | |
| Community Healthcare Trust | Page | 9 | 2Q 2023 | Supplemental Information |
RECONCILIATION OF NON-GAAP MEASURES (CONTINUED)
NET OPERATING INCOME (NOI)
| | | | | | | | | | | | | | | | | | | | |
| | Three Months Ended |
| | 2Q 2023 | 1Q 2023 | 4Q 2022 | 3Q 2022 | 2Q 2022 |
| | (Unaudited; Dollars and shares in thousands, except per share data) |
| NET OPERATING INCOME | | | | | |
| Net income (loss) | $ | 6,577 | | $ | (6,922) | | $ | 5,238 | | $ | 5,673 | | $ | 5,584 | |
| General and administrative | 3,787 | | 4,406 | | 4,149 | | 3,762 | | 3,610 | |
| Accelerated amortization of stock-based compensation | — | | 11,799 | | — | | — | | — | |
| Depreciation and amortization | 9,219 | | 9,018 | | 8,317 | | 8,003 | | 8,077 | |
| | | | | | |
| Interest expense | 4,140 | | 3,992 | | 3,464 | | 3,028 | | 2,755 | |
| Deferred Income tax expense (benefit) | 50 | | 35 | | 21 | | 21 | | 16 | |
| Interest and other income, net | (749) | | (25) | | (3) | | (7) | | (55) | |
| NOI | $ | 23,024 | | $ | 22,303 | | $ | 21,186 | | $ | 20,480 | | $ | 19,987 | |
| | | | | | |
| | | | | | |
|
| | | | | | |
EBITDAre and ADJUSTED EBITDAre | | | | | |
| | | | | | |
EBITDAre | | | | | |
| Net income (loss) | $ | 6,577 | | $ | (6,922) | | $ | 5,238 | | $ | 5,673 | | $ | 5,584 | |
| Interest expense | 4,140 | | 3,992 | | 3,464 | | 3,028 | | 2,755 | |
| Depreciation and amortization | 9,219 | | 9,018 | | 8,317 | | 8,003 | | 8,077 | |
| Deferred Income tax expense | 50 | | 35 | | 21 | | 21 | | 16 | |
| | | | | | |
EBITDAre | $ | 19,986 | | $ | 6,123 | | $ | 17,040 | | $ | 16,725 | | $ | 16,432 | |
| Non-cash stock-based compensation expense | 1,692 | | 2,547 | | 2,645 | | 2,464 | | 2,184 | |
| Accelerated amortization of stock-based compensation | — | | 11,799 | | — | | — | | — | |
| Net gain from insurance recovery on casualty loss | (706) | | — | | — | | — | | — | |
ADJUSTED EBITDAre | $ | 20,972 | | $ | 20,469 | | $ | 19,685 | | $ | 19,189 | | $ | 18,616 | |
| | | | | | |
ADJUSTED EBITDAre ANNUALIZED (1) | $ | 83,888 | | | | | |
| | | | | |
| (1) | | Adjusted EBITDAre multiplied by 4. This annualized amount may differ significantly from the actual full year results. |
| | | | | | | | |
| Community Healthcare Trust | Page | 10 | 2Q 2023 | Supplemental Information |
WEIGHTED AVERAGE SHARES
| | | | | | | | | | | | | | | | | | | | |
| | Three Months Ended |
| | 2Q 2023 | 1Q 2023 | 4Q 2022 | 3Q 2022 | 2Q 2022 |
| | (Unaudited; Dollars and shares in thousands, except per share data) |
| WEIGHTED AVERAGE COMMON SHARES OUTSTANDING | | | | | |
| Weighted average common shares outstanding | 26,358 | | 26,043 | | 25,498 | | 25,221 | | 25,087 | |
| Unvested restricted shares | (1,293) | | (1,816) | | (1,711) | | (1,634) | | (1,509) | |
| Weighted average common shares outstanding - EPS | 25,065 | | 24,227 | | 23,787 | | 23,587 | | 23,578 | |
| | | | | | |
| Weighted average common shares outstanding - FFO Basic | 25,065 | | 24,227 | | 23,787 | | 23,587 | | 23,578 | |
| Dilutive potential common shares (from below) | 585 | | 1,071 | | 684 | | 725 | | 669 | |
| Weighted average common shares outstanding - FFO Diluted | 25,650 | | 25,298 | | 24,471 | | 24,312 | | 24,247 | |
| | | | | | |
| TREASURY SHARE CALCULATION | | | | | |
| Unrecognized deferred compensation-end of period | $ | 24,780 | | $ | 24,465 | | $ | 33,652 | | $ | 36,364 | | $ | 30,886 | |
| Unrecognized deferred compensation-beginning of period | $ | 24,465 | | $ | 33,652 | | $ | 36,364 | | $ | 30,886 | | $ | 32,087 | |
| Average unrecognized deferred compensation | $ | 24,623 | | $ | 29,059 | | $ | 35,008 | | $ | 33,625 | | $ | 31,487 | |
| Average share price per share | $ | 34.78 | | $ | 39.01 | | $ | 34.06 | | $ | 36.97 | | $ | 37.47 | |
| Treasury shares | 708 | | 745 | | 1,027 | | 909 | | 840 | |
| | | | | | |
| Unvested restricted shares | (1,293) | | (1,816) | | (1,711) | | (1,634) | | (1,509) | |
| Treasury shares | 708 | | 745 | | 1,027 | | 909 | | 840 | |
| Dilutive potential common shares | 585 | | 1,071 | | 684 | | 725 | | 669 | |
| | | | | | | | |
| Community Healthcare Trust | Page | 11 | 2Q 2023 | Supplemental Information |
EXECUTIVE COMPENSATION
| | | | | | | | | | | | | | | | | | | | | | | | | | | | | | | | | | | | | | |
| | | | | Performance Based Incentive Compensation |
| Name and Position | Year | Total
Compensation | Salary
Taken In
Stock (1) | Other (2) | Bonus
Stock (1) | Alignment
of Interest
Stock (3) | 1-Year Total
Shareholder
Return
Stock | 3-Year Total
Shareholder
Return
Stock | 5-Year Total Shareholder Return
Stock | Total
Performance
Based
Incentive
Compensation | Percent
of Total |
| | | | | | | | | | | |
| Timothy G. Wallace (4) | 2022 | $ | 4,540,328 | | $ | 794,200 | | $ | 12,425 | | $ | 913,330 | | $ | 1,710,257 | | $ | — | | $ | 222,023 | | $ | 888,093 | | $ | 3,733,703 | | 82.2 | % |
| Former Chief Executive Officer and President | 2021 | $ | 4,788,861 | | $ | 750,000 | | $ | 11,650 | | $ | 862,500 | | $ | 1,621,703 | | $ | — | | $ | 771,504 | | $ | 771,504 | | $ | 4,027,211 | | 84.1 | % |
| 2020 | $ | 3,737,563 | | $ | 645,000 | | $ | 13,382 | | $ | 548,250 | | $ | 1,402,181 | | $ | 483,750 | | $ | 645,000 | | $ | — | | $ | 3,079,181 | | 82.4 | % |
| | | | | | | | | | | | |
| David H. Dupuy (5) | 2022 | $ | 2,785,183 | | $ | 487,200 | | $ | 7,487 | | $ | 560,280 | | $ | 1,049,216 | | $ | — | | $ | 136,192 | | $ | 544,808 | | $ | 2,290,496 | | 82.2 | % |
| Chief Executive Officer, President and
Former Chief Financial Officer | 2021 | $ | 3,183,341 | | $ | 460,000 | | $ | 253,262 | | $ | 529,000 | | $ | 994,675 | | $ | — | | $ | 473,202 | | $ | 473,202 | | $ | 2,470,079 | | 77.6 | % |
| 2020 | $ | 2,451,981 | | $ | 392,000 | | $ | 188,572 | | $ | 333,200 | | $ | 852,209 | | $ | 294,000 | | $ | 392,000 | | $ | — | | $ | 1,871,409 | | 76.3 | % |
| | | | | | | | | | | | |
| Leigh Ann Stach | 2022 | $ | 2,342,141 | | $ | 410,500 | | $ | 1,750 | | $ | 472,075 | | $ | 883,998 | | $ | — | | $ | 114,764 | | $ | 459,054 | | $ | 1,929,891 | | 82.4 | % |
| Executive Vice President and
Chief Accounting Officer | 2021 | $ | 2,472,513 | | $ | 387,600 | | $ | 3,648 | | $ | 445,740 | | $ | 838,123 | | $ | — | | $ | 398,701 | | $ | 398,701 | | $ | 2,081,265 | | 84.2 | % |
| 2020 | $ | 1,895,617 | | $ | 326,800 | | $ | 8,734 | | $ | 277,780 | | $ | 710,403 | | $ | 245,100 | | $ | 326,800 | | $ | — | | $ | 1,560,083 | | 82.3 | % |
| | | | | | | | | | | | |
| Timothy L. Meyer (6) | 2022 | $ | 1,785,445 | | $ | 312,400 | | $ | 4,311 | | $ | 359,260 | | $ | 672,777 | | $ | — | | $ | 87,339 | | $ | 349,358 | | $ | 1,468,734 | | 82.3 | % |
| Executive Vice President -
Asset Management | 2021 | $ | 917,202 | | $ | 280,000 | | $ | 14,789 | | $ | 165,000 | | $ | 457,413 | | $ | — | | $ | — | | $ | — | | $ | 622,413 | | 67.9 | % |
| | | | | | | | | | | |
| (1) Each Executive Officer has elected to take 100% of their salary and cash bonus in deferred stock with an 8-year cliff vesting. |
| (2) Other includes employer contributions to the executive officer's health savings account (HSA) and 401(k); the value of the grant of 5,000 shares of restricted stock to Mr. Dupuy in each of the years 2020 and 2021, and the value of the grant of 260 shares of restricted stock to Mr. Meyer in 2021. |
| (3) Alignment of interest stock grants per the Alignment Interest Program which is part of the Company's Incentive Plan. |
| (4) Mr. Wallace, our former CEO and President, passed away on March 3, 2023. |
| (5) Mr. Dupuy was appointed as CEO effective March 6, 2023 and continued on as CFO until his successor was named on June 1, 2023. |
| (6) Mr. Meyer joined the Company on July 1, 2019 and was promoted to Executive Vice President on October 1, 2021. |
| | | | | | | | | | | | | | | | | |
| CEO Pay Ratios | |
| Former CEO and
President | Median
Employee | Average
Employee (1) | Lowest Paid
Employee (1) | |
| Cash | $ | — | | $ | 123,900 | | $ | 114,349 | | $ | 63,500 | | |
| Compensation Taken in Stock | 4,527,903 | | 68,500 | | 295,291 | | — | | |
| Other Compensation | 12,425 | | 3,047 | | 4,638 | | 1,348 | | |
| Total Compensation | $ | 4,540,328 | | $ | 195,447 | | $ | 414,278 | | $ | 64,848 | | |
| CEO to Employee Ratio | | 23:1 | 11:1 | 70:1 | |
| ___________ | | | | | |
| (1) Excludes part-time employees who worked less than 20 hours per week. | | | |
| | | | | | | | |
| Community Healthcare Trust | Page | 12 | 2Q 2023 | Supplemental Information |
DEBT SUMMARY
| | | | | | | | | | | |
| As of June 30, 2023 |
| Principal
Balance | Stated
Rate | Hedged
Rate |
| (in thousands) | | |
| | | |
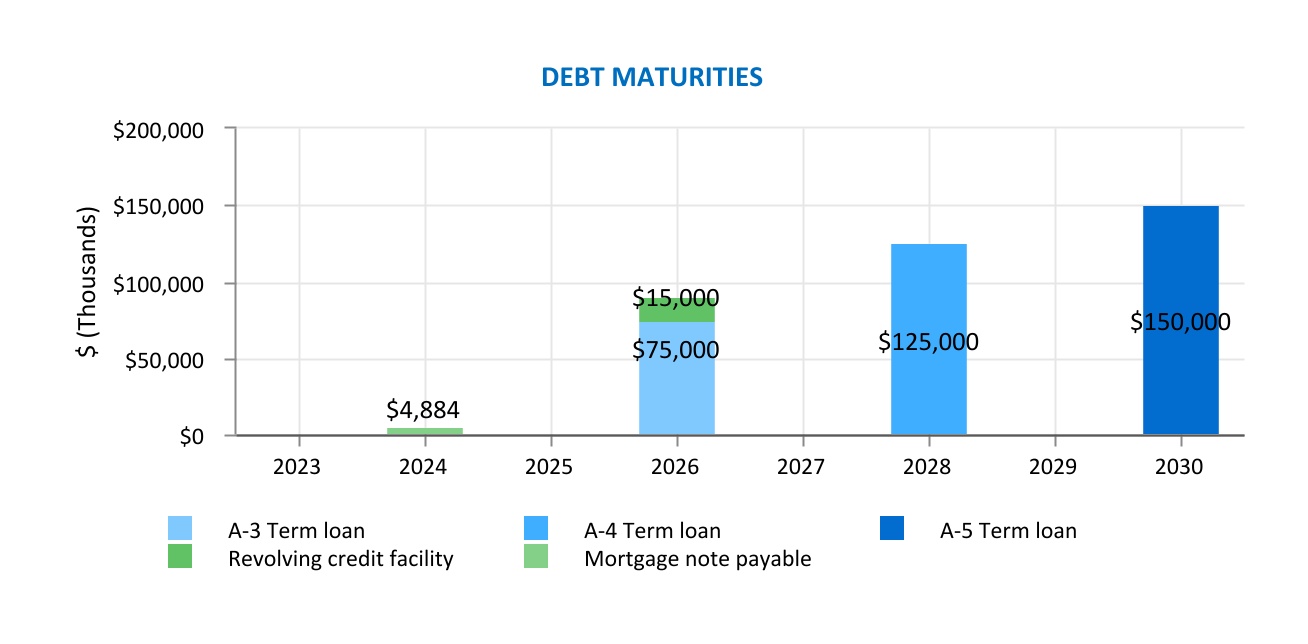
| Revolving credit facility | $ | 15,000 | | 6.80 | % | — | |
| Term loan A-3 | 75,000 | | | 4.29 | % |
| Term loan A-4 | 125,000 | | | 3.35 | % |
| Term loan A-5 | 150,000 | | | 5.11 | % |
| Total Credit Facility | 365,000 | | | |
| | | |
| Secured mortgage loan | 4,884 | | 4.98 | % | — | |
| | | |
| Debt | 369,884 | | | |
| Deferred Financing Costs, net | (1,757) | | | |
| Debt, net | $ | 368,127 | | | |
| | | |
| | | | | | | | |
| Select Covenants | Required | 2Q 2023 |
| Leverage ratio | ≤ 60.0% | 36.0 | % |
| Fixed charge coverage ratio | ≥ 1.50x | 5.0 |
| Tangible net worth (in thousands) | ≥ $478,389 | $656,413 |
| Secured indebtedness | ≤ 30.0% | 0.5 | % |
| Minimum debt service coverage ratio | ≥ 2.0 | 5.7 |
| | | | | | | | |
| Community Healthcare Trust | Page | 13 | 2Q 2023 | Supplemental Information |
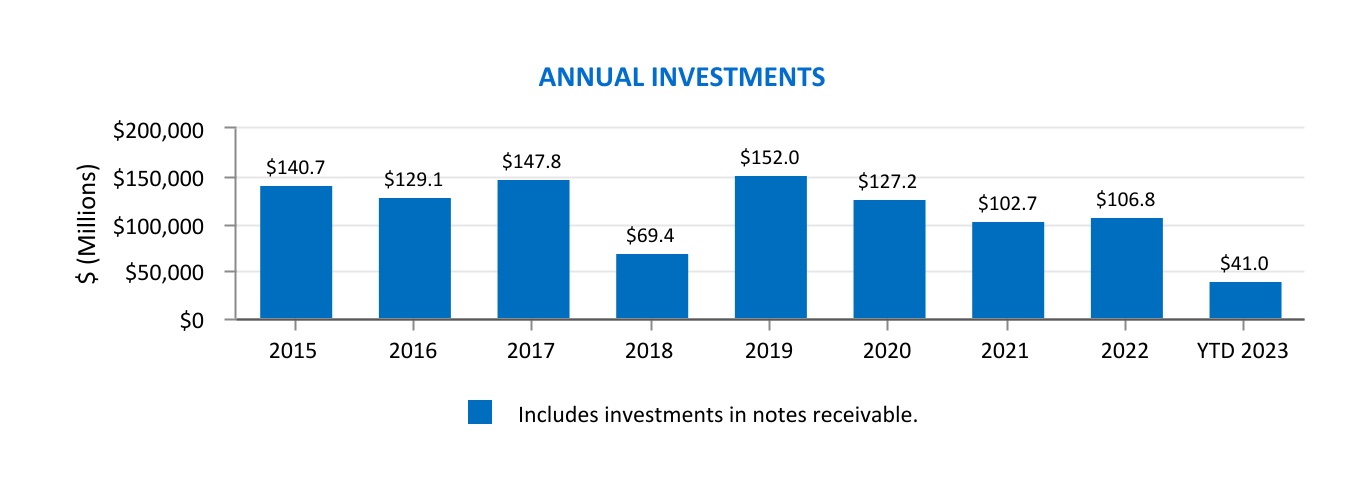
2023 PROPERTY ACQUISITIONS
| | | | | | | | | | | | | | | | | | | | |
| Property | Market | Property
Type | Date
Acquired | % Leased at Acquisition | Purchase Price (in thousands) | Square Feet |
| Emory Healthcare | LaGrange, GA | MOB | 01/18/23 | 100.0 | % | $ | 8,007 | | 55,310 | |
| Emory Healthcare | West Point, GA | MOB | 01/18/23 | 100.0 | % | 811 | | 5,600 | |
| Hills & Dales Professional Center | Canton, OH | MOB | 01/30/23 | 100.0 | % | 3,669 | | 27,920 | |
| Northeastern Eye Institute | Scranton, PA | MOB | 02/23/23 | 100.0 | % | 1,957 | | 22,743 | |
| Northeastern Eye Institute | Scranton, PA | MOB | 02/23/23 | 100.0 | % | 2,207 | | 15,768 | |
| Emory Southern Orthopedics | LaGrange, GA | MOB | 03/06/23 | 100.0 | % | 6,469 | | 31,473 | |
| Emory Southern Orthopedics | LaGrange, GA | MOB | 03/06/23 | 100.0 | % | 249 | | 2,972 | |
| Land | Lakeland, FL | n/a | 04/03/23 | n/a | 838 | | — | |
| UPMC Hermitage Road | Hermitage, PA | MOB | 05/04/23 | 100.0 | % | 4,218 | | 25,982 | |
| JDH Professional Building | San Antonio, TX | MOB | 05/22/23 | 100.0 | % | 2,773 | | 12,376 | |
| Clinton Towers MOB | Clinton, MD | MOB | 06/21/23 | 94.9 | % | 7,850 | | 37,344 | |
| | | | | | |
| | | | 99.5 | % | $ | 39,048 | | 237,488 | |
| | | | | | | | |
| Community Healthcare Trust | Page | 14 | 2Q 2023 | Supplemental Information |
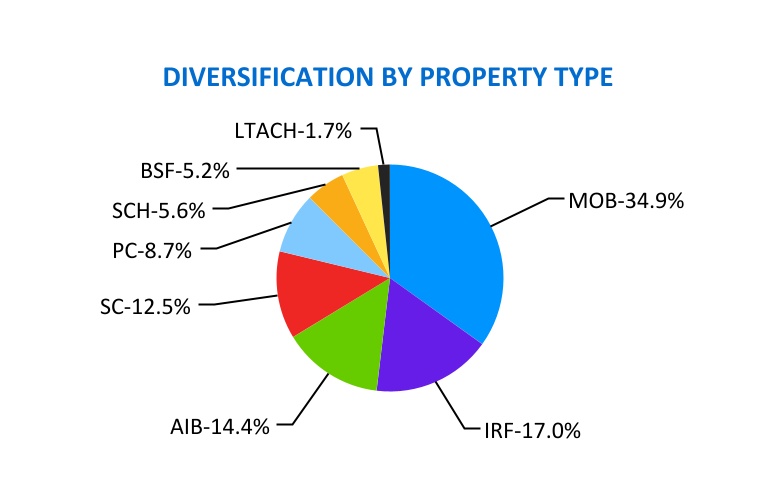
PORTFOLIO DIVERSIFICATION
| | | | | |
| Property Type | Annualized Rent (%) |
| Medical Office Building (MOB) | 34.9 | % |
| Inpatient Rehabilitation Facilities (IRF) | 17.0 | % |
| Acute Inpatient Behavioral (AIB) | 14.4 | % |
| Specialty Centers (SC) | 12.5 | % |
| Physician Clinics (PC) | 8.7 | % |
| Surgical Centers and Hospitals (SCH) | 5.6 | % |
| Behavioral Specialty Facilities (BSF) | 5.2 | % |
| Long-term Acute Care Hospitals (LTACH) | 1.7 | % |
| Total | 100.0 | % |
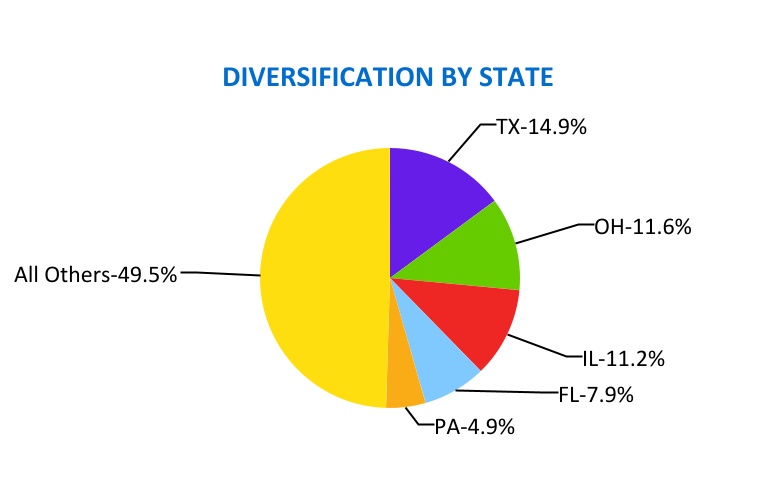
| | | | | |
| State | Annualized
Rent (%) |
| Texas (TX) | 14.9 | % |
| Ohio (OH) | 11.6 | % |
| Illinois (IL) | 11.2 | % |
| Florida (FL) | 7.9 | % |
| Pennsylvania (PA) | 4.9 | % |
| All Others | 49.5 | % |
| Total | 100.0 | % |
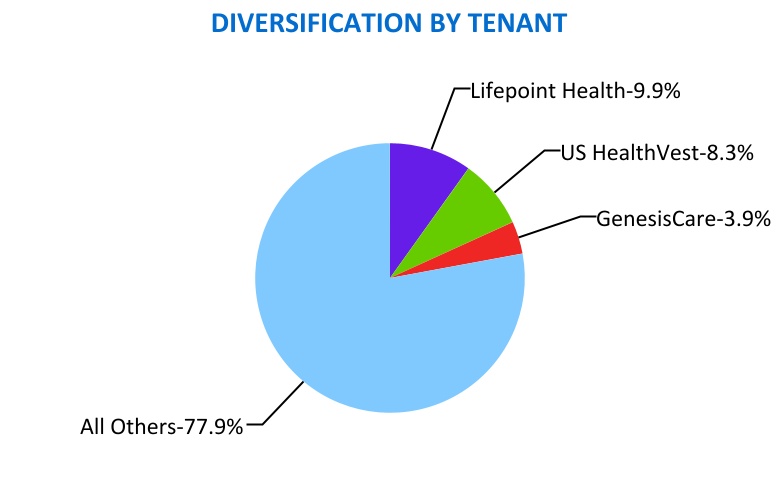
| | | | | |
| Tenant | Annualized
Rent (%) |
| Lifepoint Health | 9.9 | % |
| US HealthVest | 8.3 | % |
| GenesisCare (1) | 3.9 | % |
| All Others | 77.9 | % |
| Total | 100.0 | % |
| __________ | |
| (1) On June 1, 2023, GenesisCare and certain of its affiliates ("GenesisCare") filed voluntary petitions for reorganization under Chapter 11 of the U.S. Bankruptcy Code. On June 27, 2023, the U.S. Bankruptcy Court for the Southern District of Texas approved GenesisCare’s request to reject certain unexpired real property leases including one lease with CHCT North Carolina, LLC, a subsidiary of the Company. See Note 2 in the Company's Form 10-Q for the period ending June 30, 2023 for more details. |
| | | | | | | | |
| Community Healthcare Trust | Page | 15 | 2Q 2023 | Supplemental Information |
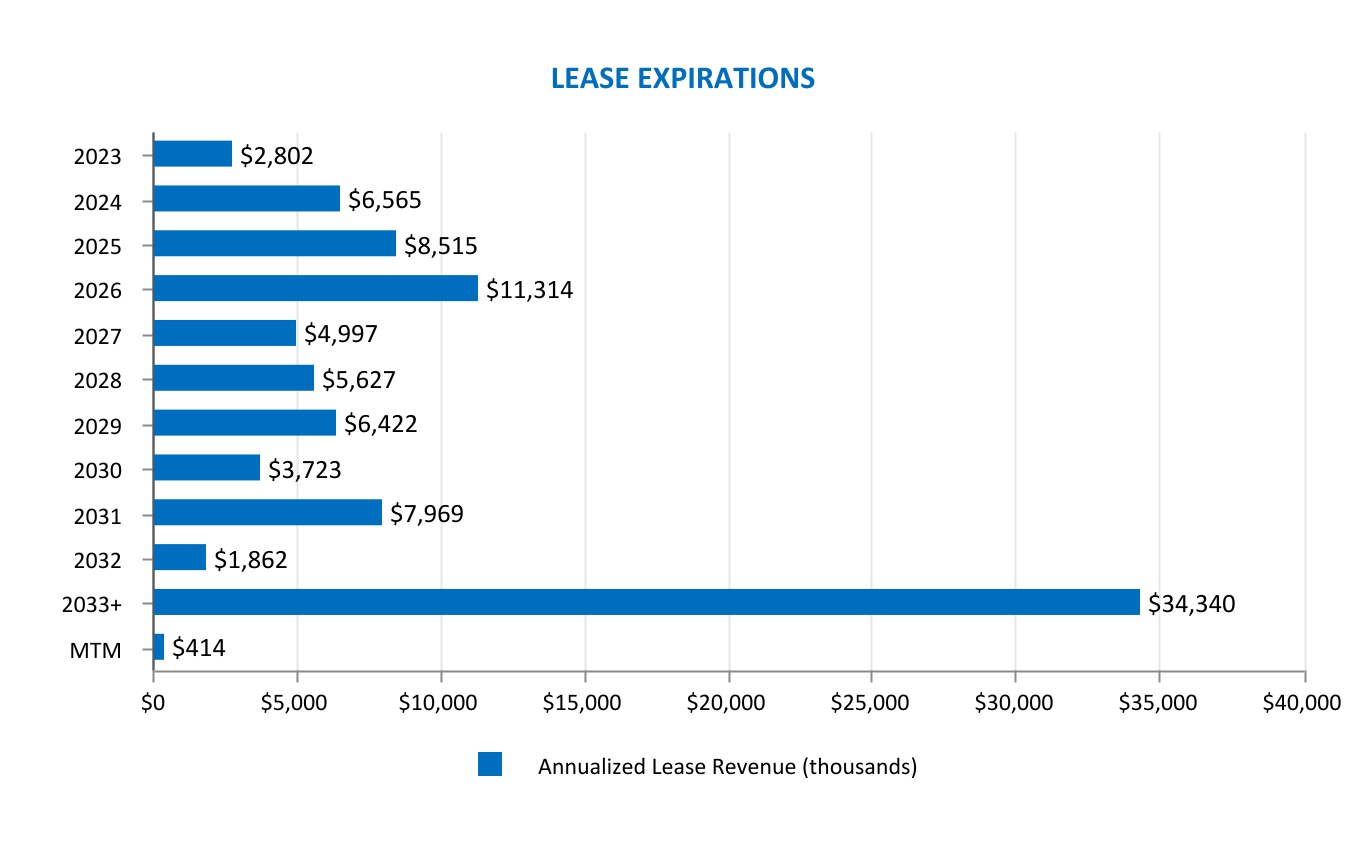
LEASE EXPIRATIONS
| | | | | | | | | | | | | | | | | | | | |
| | Total Leased Sq. Ft. | | Annualized Rent |
| Year | Number of
Leases Expiring | Amount (thousands) | Percent (%) | | Amount ($) (thousands) | Percent (%) |
| 2023 | 25 | | 143 | | 3.9 | % | | $ | 2,802 | | 3.0 | % |
| 2024 | 59 | | 317 | | 8.6 | % | | 6,565 | | 6.9 | % |
| 2025 | 45 | | 316 | | 8.6 | % | | 8,515 | | 9.0 | % |
| 2026 | 60 | | 528 | | 14.3 | % | | 11,314 | | 12.0 | % |
| 2027 | 40 | | 238 | | 6.4 | % | | 4,997 | | 5.3 | % |
| 2028 | 46 | | 294 | | 8.0 | % | | 5,627 | | 6.0 | % |
| 2029 | 19 | | 246 | | 6.7 | % | | 6,422 | | 6.8 | % |
| 2030 | 15 | | 129 | | 3.5 | % | | 3,723 | | 3.9 | % |
| 2031 | 16 | | 286 | | 7.7 | % | | 7,969 | | 8.4 | % |
| 2032 | 11 | | 133 | | 3.6 | % | | 1,862 | | 2.0 | % |
| Thereafter | 45 | | 1,040 | | 28.1 | % | | 34,340 | | 36.3 | % |
| Month-to-Month | 11 | | 23 | | 0.6 | % | | 414 | | 0.4 | % |
| Totals | 392 | | 3,693 | | 100.0 | % | | $ | 94,550 | | 100.0 | % |
Total portfolio was approximately 91.7% leased in the aggregate at June 30, 2023 with lease expirations ranging from 2023 through 2039.
| | | | | | | | |
| Community Healthcare Trust | Page | 16 | 2Q 2023 | Supplemental Information |
PROPERTY LOCATIONS
Approximately 49% of our property revenues are in MSAs with populations over 1,000,000 and approximately 91% are in MSAs with populations over 100,000. | | | | | | | | | | | | | | | | | | | | | | | | | | |
| Property Name | Property
Type | Area | % of
Square
Feet | Annualized
Rent ($000's) | % of Annualized
Rent | Population | MSA/MISA | Rank |
| Lancaster MOB | MOB | 10,646 | | 0.26% | $ | 210.8 | | 0.22% | 12,872,322 | Los Angeles-Long Beach-Anaheim, CA | 2 |
| Future Diagnostics Group | SC | 8,876 | | 0.22% | $ | 390.9 | | 0.41% | 9,618,502 | Chicago-Naperville-Elgin, IL-IN-WI | 3 |
| Gurnee Medical Office Building | MOB | 22,943 | | 0.57% | $ | 134.9 | | 0.14% | 9,618,502 | Chicago-Naperville-Elgin, IL-IN-WI | 3 |
| Joliet Oncology-Hematology Associates | PC | 7,905 | | 0.20% | $ | 375.6 | | 0.40% | 9,618,502 | Chicago-Naperville-Elgin, IL-IN-WI | 3 |
| Morris Cancer Center | MOB | 18,470 | | 0.46% | $ | 608.7 | | 0.64% | 9,618,502 | Chicago-Naperville-Elgin, IL-IN-WI | 3 |
| Center for Reconstructive Surgery - Oak Lawn | MOB | 33,356 | | 0.83% | $ | 403.3 | | 0.43% | 9,618,502 | Chicago-Naperville-Elgin, IL-IN-WI | 3 |
| Presence | PC | 14,863 | | 0.37% | $ | 304.7 | | 0.32% | 9,618,502 | Chicago-Naperville-Elgin, IL-IN-WI | 3 |
| Presence Regional Cancer Center | SC | 44,888 | | 1.11% | $ | 1,431.6 | | 1.52% | 9,618,502 | Chicago-Naperville-Elgin, IL-IN-WI | 3 |
| Skin MD | PC | 13,565 | | 0.34% | $ | 500.5 | | 0.53% | 9,618,502 | Chicago-Naperville-Elgin, IL-IN-WI | 3 |
| Chicago Behavioral Hospital | AIB | 85,000 | | 2.11% | $ | 2,182.5 | | 2.31% | 9,618,502 | Chicago-Naperville-Elgin, IL-IN-WI | 3 |
| US HealthVest - Lake | AIB | 83,658 | | 2.08% | $ | 2,920.7 | | 3.09% | 9,618,502 | Chicago-Naperville-Elgin, IL-IN-WI | 3 |
| Texas Rehabilitation Hospital of Fort Worth, LLC | IRF | 39,761 | | 0.99% | $ | 1,988.2 | | 2.11% | 7,637,387 | Dallas-Fort Worth-Arlington, TX | 4 |
| Bayside Medical Center | MOB | 50,593 | | 1.26% | $ | 1,258.3 | | 1.33% | 7,122,240 | Houston-The Woodlands-Sugar Land, TX | 5 |
| Gessner Road MOB | MOB | 14,360 | | 0.36% | $ | 301.8 | | 0.32% | 7,122,240 | Houston-The Woodlands-Sugar Land, TX | 5 |
| Clear Lake Institute for Rehabilitation | IRF | 55,646 | | 1.38% | $ | 2,913.2 | | 3.08% | 7,122,240 | Houston-The Woodlands-Sugar Land, TX | 5 |
| Northwest Surgery Center | SCH | 11,200 | | 0.28% | $ | — | | —% | 7,122,240 | Houston-The Woodlands-Sugar Land, TX | 5 |
| Clinton Towers MOB | MOB | 37,344 | | 0.93% | $ | 932.8 | | 0.99% | 6,385,162 | Washington-Arlington-Alexandria, DC-VA-MD-WV | 6 |
| 2301 Research Boulevard | MOB | 93,079 | | 2.31% | $ | 1,995.5 | | 2.11% | 6,385,162 | Washington-Arlington-Alexandria, DC-VA-MD-WV | 6 |
| Haddon Hill Professional Center | MOB | 25,118 | | 0.62% | $ | 146.8 | | 0.16% | 6,245,051 | Philadelphia-Camden-Wilmington, PA-NJ-DE-MD | 7 |
| Hopebridge - Westlake | BSF | 15,057 | | 0.37% | $ | 229.6 | | 0.24% | 6,245,051 | Philadelphia-Camden-Wilmington, PA-NJ-DE-MD | 7 |
| Continuum Wellness Center | MOB | 8,227 | | 0.20% | $ | 159.9 | | 0.17% | 4,845,832 | Phoenix-Mesa-Chandler, AZ | 11 |
| Desert Endoscopy Center | SCH | 11,722 | | 0.29% | $ | 583.3 | | 0.62% | 4,845,832 | Phoenix-Mesa-Chandler, AZ | 11 |
| Mountain View Surgery Center | SCH | 14,046 | | 0.35% | $ | 519.7 | | 0.55% | 4,845,832 | Phoenix-Mesa-Chandler, AZ | 11 |
| Associated Surgical Center of Dearborn | SCH | 12,400 | | 0.31% | $ | 353.4 | | 0.37% | 4,392,041 | Detroit-Warren-Dearborn, MI | 14 |
| Berry Surgical Center | SCH | 27,217 | | 0.68% | $ | 615.4 | | 0.65% | 4,392,041 | Detroit-Warren-Dearborn, MI | 14 |
| Smokey Point Behavioral Hospital | AIB | 70,100 | | 1.74% | $ | 2,731.8 | | 2.89% | 4,018,762 | Seattle-Tacoma-Bellevue, WA | 15 |
| Sanderling Dialysis | SC | 11,300 | | 0.28% | $ | 414.6 | | 0.44% | 3,298,634 | San Diego-Chula Vista-Carlsbad, CA | 17 |
| | | | | | | | |
| Community Healthcare Trust | Page | 17 | 2Q 2023 | Supplemental Information |
| | | | | | | | | | | | | | | | | | | | | | | | | | |
| Property Name | Property
Type | Area | % of
Square
Feet | Annualized
Rent ($000's) | % of Annualized
Rent | Population | MSA/MISA | Rank |
| Bay Area Physicians Surgery Center | MOB | 18,009 | | 0.45% | $ | 48.4 | | 0.05% | 3,175,275 | Tampa-St. Petersburg-Clearwater, FL | 18 |
| Liberty Dialysis | SC | 8,450 | | 0.21% | $ | 275.9 | | 0.29% | 2,963,821 | Denver-Aurora-Lakewood, CO | 19 |
| Waters Edge Medical | MOB | 23,388 | | 0.58% | $ | 411.1 | | 0.44% | 2,844,510 | Baltimore-Columbia-Towson, MD | 20 |
| Righttime Medical Care | SC | 6,236 | | 0.15% | $ | 330.9 | | 0.35% | 2,844,510 | Baltimore-Columbia-Towson, MD | 20 |
| Eyecare Partners | PC | 6,487 | | 0.16% | $ | 139.0 | | 0.15% | 2,820,253 | St. Louis, MO-IL | 21 |
| Eyecare Partners | PC | 5,560 | | 0.14% | $ | 45.3 | | 0.05% | 2,820,253 | St. Louis, MO-IL | 21 |
| Eyecare Partners | SCH | 16,608 | | 0.41% | $ | 310.6 | | 0.33% | 2,820,253 | St. Louis, MO-IL | 21 |
| Eyecare Partners | PC | 6,311 | | 0.16% | $ | 49.5 | | 0.05% | 2,820,253 | St. Louis, MO-IL | 21 |
| Bassin Center For Plastic-Surgery-Villages | PC | 2,894 | | 0.07% | $ | 170.2 | | 0.18% | 2,673,376 | Orlando-Kissimmee-Sanford, FL | 22 |
| Bassin Center For Plastic Surgery-Orlando | PC | 2,420 | | 0.06% | $ | 142.3 | | 0.15% | 2,673,376 | Orlando-Kissimmee-Sanford, FL | 22 |
| Kissimmee Physicians Clinic | PC | 4,902 | | 0.12% | $ | 110.3 | | 0.12% | 2,673,376 | Orlando-Kissimmee-Sanford, FL | 22 |
| Orthopaedic Associates of Osceola | PC | 15,167 | | 0.38% | $ | 347.2 | | 0.37% | 2,673,376 | Orlando-Kissimmee-Sanford, FL | 22 |
| Medical Village at Wintergarden | MOB | 21,532 | | 0.53% | $ | 588.9 | | 0.62% | 2,673,376 | Orlando-Kissimmee-Sanford, FL | 22 |
| Baptist Health | PC | 13,500 | | 0.34% | $ | 391.4 | | 0.41% | 2,558,143 | San Antonio-New Braunfels, TX | 24 |
| San Antonio Head & Neck Surgical Associates | PC | 6,500 | | 0.16% | $ | 187.9 | | 0.20% | 2,558,143 | San Antonio-New Braunfels, TX | 24 |
| JDH Professional Building | MOB | 12,376 | | 0.31% | $ | 261.9 | | 0.28% | 2,558,143 | San Antonio-New Braunfels, TX | 24 |
| Butler Medical Center | MOB | 10,116 | | 0.25% | $ | 273.3 | | 0.29% | 2,370,930 | Pittsburgh, PA | 27 |
| Forefront Dermatology Building | MOB | 15,650 | | 0.39% | $ | 342.0 | | 0.36% | 2,370,930 | Pittsburgh, PA | 27 |
| Greentree Primary Care | MOB | 34,077 | | 0.85% | $ | 888.0 | | 0.94% | 2,370,930 | Pittsburgh, PA | 27 |
| Vascular Access Centers of Southern Nevada | SC | 4,800 | | 0.12% | $ | 95.0 | | 0.10% | 2,265,461 | Las Vegas-Henderson-Paradise, NV | 29 |
| Assurance Health System | BSF | 14,381 | | 0.36% | $ | 555.4 | | 0.59% | 2,256,884 | Cincinnati, OH-KY-IN | 30 |
| Cavalier Medical & Dialysis Center | MOB | 17,614 | | 0.44% | $ | 218.2 | | 0.23% | 2,256,884 | Cincinnati, OH-KY-IN | 30 |
| 51 Cavalier Blvd | MOB | 18,016 | | 0.45% | $ | 179.6 | | 0.19% | 2,256,884 | Cincinnati, OH-KY-IN | 30 |
| Anderson Ferry Plaza | MOB | 43,599 | | 1.08% | $ | 482.4 | | 0.51% | 2,256,884 | Cincinnati, OH-KY-IN | 30 |
| Everest Rehabilitation Hospital | IRF | 37,720 | | 0.94% | $ | 2,444.9 | | 2.59% | 2,256,884 | Cincinnati, OH-KY-IN | 30 |
| Davita Commercial Way | SC | 4,980 | | 0.12% | $ | — | | —% | 2,256,884 | Cincinnati, OH-KY-IN | 30 |
| Fresenius Florence Dialysis Center | MOB | 17,845 | | 0.44% | $ | 305.4 | | 0.32% | 2,256,884 | Cincinnati, OH-KY-IN | 30 |
| Prairie Star Medical Facility I | MOB | 24,724 | | 0.61% | $ | 921.0 | | 0.98% | 2,192,035 | Kansas City, MO-KS | 31 |
| Prairie Star Medical Facility II | MOB | 24,840 | | 0.62% | $ | 152.8 | | 0.16% | 2,192,035 | Kansas City, MO-KS | 31 |
| | | | | | | | |
| Community Healthcare Trust | Page | 18 | 2Q 2023 | Supplemental Information |
| | | | | | | | | | | | | | | | | | | | | | | | | | |
| Property Name | Property
Type | Area | % of
Square
Feet | Annualized
Rent ($000's) | % of Annualized
Rent | Population | MSA/MISA | Rank |
| Ravines Edge | MOB | 16,751 | | 0.42% | $ | 262.1 | | 0.28% | 2,138,926 | Columbus, OH | 32 |
| Court Street Surgery Center | SCH | 7,787 | | 0.19% | $ | 77.9 | | 0.08% | 2,138,926 | Columbus, OH | 32 |
| Hopebridge - Columbus | BSF | 13,969 | | 0.35% | $ | 170.9 | | 0.18% | 2,138,926 | Columbus, OH | 32 |
| Sedalia Medical Center | MOB | 20,043 | | 0.50% | $ | 354.1 | | 0.37% | 2,138,926 | Columbus, OH | 32 |
| Assurance Health, LLC | BSF | 10,200 | | 0.25% | $ | 362.1 | | 0.38% | 2,111,040 | Indianapolis-Carmel-Anderson, IN | 33 |
| Assurance Health System | BSF | 13,722 | | 0.34% | $ | 495.8 | | 0.52% | 2,111,040 | Indianapolis-Carmel-Anderson, IN | 33 |
| Kindred Hospital Indianapolis North | LTACH | 37,270 | | 0.93% | $ | 1,566.9 | | 1.66% | 2,111,040 | Indianapolis-Carmel-Anderson, IN | 33 |
| Brook Park Medical Building | MOB | 18,444 | | 0.46% | $ | 392.6 | | 0.42% | 2,088,251 | Cleveland-Elyria, OH | 34 |
| Northern Ohio Regional Cancer Center | MOB | 16,802 | | 0.42% | $ | 310.3 | | 0.33% | 2,088,251 | Cleveland-Elyria, OH | 34 |
| Assurance - Hudson | BSF | 13,290 | | 0.33% | $ | 554.2 | | 0.59% | 2,088,251 | Cleveland-Elyria, OH | 34 |
| Rockside Medical Center | MOB | 55,316 | | 1.37% | $ | 1,011.1 | | 1.07% | 2,088,251 | Cleveland-Elyria, OH | 34 |
| Virginia Orthopaedic & Spine Specialists | PC | 8,445 | | 0.21% | $ | 153.1 | | 0.16% | 1,799,674 | Virginia Beach-Norfolk-Newport News, VA-NC | 37 |
| Genesis Care - Warwick | SC | 10,236 | | 0.25% | $ | 380.8 | | 0.40% | 1,676,579 | Providence-Warwick, RI-MA | 38 |
| South County Hospital | PC | 13,268 | | 0.33% | $ | 311.3 | | 0.33% | 1,676,579 | Providence-Warwick, RI-MA | 38 |
| Ortho Rhode Island - Warwick | PC | 7,340 | | 0.18% | $ | 212.8 | | 0.23% | 1,676,579 | Providence-Warwick, RI-MA | 38 |
| Mercy Rehabilitation Hospital | IRF | 39,637 | | 0.98% | $ | 1,988.2 | | 2.11% | 1,425,695 | Oklahoma City, OK | 41 |
| Memphis Center | MOB | 11,669 | | 0.29% | $ | 232.3 | | 0.25% | 1,337,779 | Memphis, TN-MS-AR | 43 |
| Sanderling Dialysis | SC | 10,133 | | 0.25% | $ | 552.4 | | 0.58% | 1,337,779 | Memphis, TN-MS-AR | 43 |
| Glastonbury | MOB | 49,593 | | 1.23% | $ | 573.5 | | 0.61% | 1,213,531 | Hartford-East Hartford-Middletown, CT | 48 |
| Sterling Medical Center | MOB | 28,685 | | 0.71% | $ | 424.4 | | 0.45% | 1,166,902 | Buffalo-Cheektowaga, NY | 49 |
| Gardendale MOB | MOB | 12,956 | | 0.32% | $ | 317.4 | | 0.34% | 1,115,289 | Birmingham-Hoover, AL | 50 |
| Genesis Care - Southbridge | SC | 20,046 | | 0.50% | $ | 851.5 | | 0.90% | 978,529 | Worcester, MA-CT | 57 |
| Worcester Behavioral | AIB | 81,972 | | 2.04% | $ | 2,690.9 | | 2.85% | 978,529 | Worcester, MA-CT | 57 |
| Los Alamos Professional Plaza | MOB | 43,654 | | 1.08% | $ | 706.7 | | 0.75% | 870,781 | McAllen-Edinburg-Mission, TX | 65 |
| Cardiology Associates of Greater Waterbury | PC | 16,793 | | 0.42% | $ | 323.3 | | 0.34% | 864,835 | New Haven-Milford, CT | 68 |
| Columbia Gastroenterology Surgery Center | MOB | 17,016 | | 0.42% | $ | 344.1 | | 0.36% | 829,470 | Columbia, SC | 72 |
| Davita Turner Road | SC | 18,125 | | 0.45% | $ | 351.2 | | 0.37% | 814,049 | Dayton-Kettering, OH | 73 |
| Davita Springboro Pike | SC | 10,510 | | 0.26% | $ | 182.0 | | 0.19% | 814,049 | Dayton-Kettering, OH | 73 |
| Davita Business Center Court | SC | 12,988 | | 0.32% | $ | 228.4 | | 0.24% | 814,049 | Dayton-Kettering, OH | 73 |
| Genesis Care - Bonita Springs | SC | 4,445 | | 0.11% | $ | 279.7 | | 0.30% | 760,822 | Cape Coral-Fort Myers, FL | 78 |
| Cape Coral Suite 3 | SC | 12,130 | | 0.30% | $ | 437.3 | | 0.46% | 760,822 | Cape Coral-Fort Myers, FL | 78 |
| | | | | | | | |
| Community Healthcare Trust | Page | 19 | 2Q 2023 | Supplemental Information |
| | | | | | | | | | | | | | | | | | | | | | | | | | |
| Property Name | Property
Type | Area | % of
Square
Feet | Annualized
Rent ($000's) | % of Annualized
Rent | Population | MSA/MISA | Rank |
| Cape Coral Suite 3A | MOB | 2,023 | | 0.05% | $ | 37.9 | | 0.04% | 760,822 | Cape Coral-Fort Myers, FL | 78 |
| Cape Coral Suite 5 & 6 | MOB | 6,379 | | 0.16% | $ | 98.1 | | 0.10% | 760,822 | Cape Coral-Fort Myers, FL | 78 |
| Genesis Care - Fort Myers | SC | 46,356 | | 1.15% | $ | 804.7 | | 0.85% | 760,822 | Cape Coral-Fort Myers, FL | 78 |
| Corporate Office 3660 | MOB | 22,104 | | 0.55% | $ | 602.3 | | 0.64% | 760,822 | Cape Coral-Fort Myers, FL | 78 |
| Corporate Annex Building | MOB | 16,000 | | 0.40% | $ | 301.1 | | 0.32% | 760,822 | Cape Coral-Fort Myers, FL | 78 |
| Wildwood Hammock RPET Facility | SC | 10,832 | | 0.27% | $ | 416.6 | | 0.44% | 760,822 | Cape Coral-Fort Myers, FL | 78 |
| Wildwood Hammock - Diagnostic Imaging | SC | 9,376 | | 0.23% | $ | 393.8 | | 0.42% | 760,822 | Cape Coral-Fort Myers, FL | 78 |
| Wildwood Hammock - Northland | MOB | 1,201 | | 0.03% | $ | 12.6 | | 0.01% | 760,822 | Cape Coral-Fort Myers, FL | 78 |
| Parkway Professional Plaza | MOB | 40,918 | | 1.02% | $ | 744.1 | | 0.79% | 725,046 | Lakeland-Winter Haven, FL | 81 |
| Mercy One Physicians Clinic | PC | 17,318 | | 0.43% | $ | 390.4 | | 0.41% | 709,466 | Des Moines-West Des Moines, IA | 82 |
| Novus Clinic | SCH | 14,315 | | 0.36% | $ | 296.3 | | 0.31% | 702,219 | Akron, Oh | 83 |
| UH Walden Health Center | PC | 11,000 | | 0.27% | $ | 320.5 | | 0.34% | 702,219 | Akron, Oh | 83 |
| UW Health Clinic- Portage | PC | 14,000 | | 0.35% | $ | 325.1 | | 0.34% | 680,796 | Madison, WI | 87 |
| Daytona Medical Office | MOB | 20,193 | | 0.50% | $ | 369.9 | | 0.39% | 668,921 | Deltona-Daytona Beach-Ormond Beach, FL | 90 |
| Debary Professional Plaza | MOB | 22,222 | | 0.55% | $ | 188.5 | | 0.20% | 668,921 | Deltona-Daytona Beach-Ormond Beach, FL | 90 |
| Cypress Medical Center | MOB | 39,746 | | 0.99% | $ | 371.7 | | 0.39% | 647,610 | Wichita, KS | 93 |
| Family Medicine East | PC | 16,581 | | 0.41% | $ | 331.6 | | 0.35% | 647,610 | Wichita, KS | 93 |
| Grene Vision Center | PC | 18,681 | | 0.46% | $ | 314.8 | | 0.33% | 647,610 | Wichita, KS | 93 |
| Perrysburg Medical Arts Building | MOB | 25,930 | | 0.64% | $ | 438.4 | | 0.46% | 646,604 | Toledo, OH | 94 |
| St. Vincent Mercy Medical Center, Inc. | PC | 23,368 | | 0.58% | $ | 319.9 | | 0.34% | 646,604 | Toledo, OH | 94 |
| Assurance - Toledo | BSF | 13,290 | | 0.33% | $ | 520.8 | | 0.55% | 646,604 | Toledo, OH | 94 |
| Granite Circle | MOB | 17,164 | | 0.43% | $ | 236.0 | | 0.25% | 646,604 | Toledo, OH | 94 |
| Bassin Center For Plastic Surgery-Melbourne | PC | 5,228 | | 0.13% | $ | 307.4 | | 0.33% | 606,612 | Palm Bay-Melbourne-Titusville, FL | 96 |
| Penn State Health - Camp Hill | SC | 8,400 | | 0.21% | $ | 173.0 | | 0.18% | 591,712 | Harrisburg-Carlisle, PA | 98 |
| Penn State Health - Harrisburg | SC | 10,000 | | 0.25% | $ | 206.0 | | 0.22% | 591,712 | Harrisburg-Carlisle, PA | 98 |
| Eynon Surgery Center | SCH | 6,500 | | 0.16% | $ | 190.5 | | 0.20% | 567,998 | Scranton--Wilkes-Barre, PA | 100 |
| Riverview Medical Center | MOB | 26,199 | | 0.65% | $ | 444.2 | | 0.47% | 567,998 | Scranton--Wilkes-Barre, PA | 100 |
| NEI | MOB | 22,743 | | 0.56% | $ | 409.4 | | 0.43% | 567,559 | Scranton--Wilkes-Barre, PA | 100 |
| NEI | MOB | 15,768 | | 0.39% | $ | 304.9 | | 0.32% | 567,559 | Scranton--Wilkes-Barre, PA | 100 |
| Grandview Plaza | MOB | 20,000 | | 0.50% | $ | 306.3 | | 0.32% | 552,984 | Lancaster, PA | 102 |
| Pinnacle Health | PC | 10,753 | | 0.27% | $ | 246.0 | | 0.26% | 552,984 | Lancaster, PA | 102 |
| | | | | | | | |
| Community Healthcare Trust | Page | 20 | 2Q 2023 | Supplemental Information |
| | | | | | | | | | | | | | | | | | | | | | | | | | |
| Property Name | Property
Type | Area | % of
Square
Feet | Annualized
Rent ($000's) | % of Annualized
Rent | Population | MSA/MISA | Rank |
| Manteca Medical Group Building | PC | 10,564 | | 0.26% | $ | 304.3 | | 0.32% | 552,878 | Modesto, CA | 103 |
| Everest Rehabilitation Hospital | IRF | 38,817 | | 0.96% | $ | 2,228.7 | | 2.36% | 546,725 | Fayetteville-Springdale-Rogers, AR | 105 |
| UPMC Specialty Care | MOB | 25,982 | | 0.65% | $ | 453.4 | | 0.48% | 541,243 | Youngstown-Warren-Boardman, OH-PA | 107 |
| Treasure Coast Medical Pavilion | MOB | 55,844 | | 1.39% | $ | 864.6 | | 0.92% | 487,657 | Port St. Lucie, FL | 115 |
| AMG Specialty Hospital - Lafayette | MOB | 29,062 | | 0.72% | $ | — | | —% | 478,384 | Lafayette, LA | 116 |
| Everest Rehabilitation Hospital | IRF | 38,817 | | 0.96% | $ | 2,246.6 | | 2.38% | 475,367 | Killeen-Temple, TX | 118 |
| Genesis Care - Asheville | SC | 10,850 | | 0.27% | $ | 223.2 | | 0.24% | 469,015 | Asheville, NC | 120 |
| Genesis Care - Weaverville | SC | 10,696 | | 0.27% | $ | 443.2 | | 0.47% | 469,015 | Asheville, NC | 120 |
| Martin Foot & Ankle Clinic | PC | 27,100 | | 0.67% | $ | 414.9 | | 0.44% | 456,438 | York-Hanover, PA | 121 |
| Affinity Health Center | MOB | 47,366 | | 1.18% | $ | 506.7 | | 0.54% | 401,574 | Canton-Massillon, OH | 137 |
| Hills & Dales Professional Center | MOB | 27,920 | | 0.69% | $ | 352.8 | | 0.37% | 401,574 | Canton-Massillon, OH | 137 |
| Prattville Town Center Medical Office Bldg | MOB | 13,319 | | 0.33% | $ | 379.7 | | 0.40% | 386,047 | Montgomery, AL | 142 |
| Wellmont Bristol Urgent Care | SC | 4,548 | | 0.11% | $ | 76.2 | | 0.08% | 307,614 | Kingsport-Bristol, TN-VA | 165 |
| Bristol Pediatric Associates | MOB | 10,804 | | 0.27% | $ | 180.2 | | 0.19% | 307,614 | Kingsport-Bristol, TN-VA | 165 |
| Bluewater Orthopedics Center | MOB | 10,255 | | 0.25% | $ | 218.2 | | 0.23% | 286,973 | Crestview-Fort Walton Beach-Destin, FL | 171 |
| Everest Rehabilitation Hospital | IRF | 38,817 | | 0.96% | $ | 2,246.6 | | 2.38% | 286,184 | Longview, TX | 172 |
| Londonderry Centre | MOB | 21,115 | | 0.52% | $ | 338.8 | | 0.36% | 277,547 | Waco, TX | 176 |
| Meridian Behavioral Health Systems | AIB | 132,430 | | 3.29% | $ | 3,075.3 | | 3.26% | 258,859 | Charleston, WV | 190 |
| Gulf Coast Cancer Centers-Foley | SC | 6,146 | | 0.15% | $ | 169.6 | | 0.18% | 231,767 | Daphne-Fairhope-Foley, AL | 200 |
| Gulf Coast Cancer Centers- Gulf Shores | SC | 6,398 | | 0.16% | $ | 131.8 | | 0.14% | 231,767 | Daphne-Fairhope-Foley, AL | 200 |
| Monroe Surgical Hospital | SCH | 58,121 | | 1.44% | $ | 2,354.5 | | 2.49% | 207,104 | Monroe, LA | 219 |
| Fresenius Ft. Valley | SC | 4,920 | | 0.12% | $ | 83.6 | | 0.09% | 191,614 | Warner Robins, GA | 228 |
| Tuscola Professional Building | MOB | 25,500 | | 0.63% | $ | 610.2 | | 0.65% | 190,124 | Saginaw, MI | 229 |
| Genesis Care - Redding | SC | 12,206 | | 0.30% | $ | 587.5 | | 0.62% | 182,155 | Redding, CA | 233 |
| Kedplasma | SC | 12,870 | | 0.32% | $ | 272.1 | | 0.29% | 171,415 | Burlington, NC | 251 |
| Decatur Morgan Hospital Medical Office Building | MOB | 35,933 | | 0.89% | $ | 579.0 | | 0.61% | 156,494 | Decatur, AL | 268 |
| Provena Medical Center | MOB | 54,894 | | 1.36% | $ | 663.5 | | 0.70% | 107,502 | Kankakee, IL | 346 |
| Cub Lake Square | MOB | 49,059 | | 1.22% | $ | 1,111.5 | | 1.18% | 108,650 | Show Low, AZ | N/A |
| Cub Lake Square - Building B | MOB | — | | 0.00% | $ | — | | —% | 108,650 | Show Low, AZ | N/A |
| Cub Lake Square - Building C | MOB | — | | 0.00% | $ | — | | —% | 108,650 | Show Low, AZ | N/A |
| Emory Healthcare | MOB | 61,301 | | 1.52% | $ | 846.6 | | 0.90% | 104,279 | LaGrange, GA-AL | N/A |
| | | | | | | | |
| Community Healthcare Trust | Page | 21 | 2Q 2023 | Supplemental Information |
| | | | | | | | | | | | | | | | | | | | | | | | | | |
| Property Name | Property
Type | Area | % of
Square
Feet | Annualized
Rent ($000's) | % of Annualized
Rent | Population | MSA/MISA | Rank |
| Emory Southern Orthopedics | MOB | 31,473 | | 0.78% | $ | 688.7 | | 0.73% | 104,279 | LaGrange, GA-AL | N/A |
| Emory Southern Orthopedics | MOB | 2,972 | | 0.07% | $ | 59.1 | | 0.06% | 104,279 | LaGrange, GA-AL | N/A |
| Emory Healthcare | MOB | 5,600 | | 0.14% | $ | 77.3 | | 0.08% | 104,279 | LaGrange, GA-AL | N/A |
| Parkside Family & Davita Clinics | MOB | 15,637 | | 0.39% | $ | 215.5 | | 0.23% | 98,331 | Victoria, TX | 361 |
| Marion Medical Plaza | MOB | 27,246 | | 0.68% | $ | 346.1 | | 0.37% | 64,642 | Marion, OH | N/A |
| Fresenius Gallipolis Dialysis Center | SC | 15,110 | | 0.38% | $ | 157.9 | | 0.17% | 54,068 | Point Pleasant, WV-OH | N/A |
| Davita Etowah Dialysis Center | SC | 4,720 | | 0.12% | $ | 67.4 | | 0.07% | 54,719 | Athens, TN | N/A |
| Fresenius Dialysis Center | MOB | 17,746 | | 0.44% | $ | 351.9 | | 0.37% | 54,636 | Corsicana, TX | N/A |
| Davita Dialysis | MOB | 12,545 | | 0.31% | $ | 454.6 | | 0.48% | 54,738 | Pahrump, NV | N/A |
| Arkansas Valley Surgery Center | MOB | 10,853 | | 0.27% | $ | 257.3 | | 0.27% | 49,621 | Cañon City, CO | N/A |
| Sanford West Behavioral Facility | BSF | 96,886 | | 2.41% | $ | 1,287.0 | | 1.36% | 45,205 | Grand Rapids, MN | N/A |
| Wellmont Norton Urgent Care | SC | 4,843 | | 0.12% | $ | 56.8 | | 0.06% | 39,030 | Big Stone Gap, VA | N/A |
| Wellmont Associates Complex | MOB | 32,757 | | 0.81% | $ | 359.1 | | 0.38% | 39,030 | Big Stone Gap, VA | N/A |
| Eyecare Partners | PC | 8,421 | | 0.21% | $ | 134.3 | | 0.14% | 36,914 | Centralia, IL | N/A |
| Fremont Medical Office Building & Surgery Ctr | MOB | 13,050 | | 0.32% | $ | 324.3 | | 0.34% | 36,997 | Fremont, NE | N/A |
| Gulf Coast Cancer Centers-Brewton | SC | 3,971 | | 0.10% | $ | 109.6 | | 0.12% | 36,666 | Atmore, AL | N/A |
| Baylor Scott & White Clinic | PC | 37,354 | | 0.93% | $ | 485.8 | | 0.51% | 36,159 | Brenham, TX | N/A |
| Ottumwa Medical Clinic | MOB | 68,895 | | 1.71% | $ | 726.5 | | 0.77% | 35,043 | Ottumwa, IA | N/A |
| Ottumwa Medical Clinic | MOB | 6,850 | | 0.17% | $ | 111.2 | | 0.12% | 35,043 | Ottumwa, IA | N/A |
| Sanderling Dialysis Center | SC | 4,186 | | 0.10% | $ | 295.1 | | 0.31% | 27,082 | Crescent City, CA | N/A |
| Russellville Medical Plaza | MOB | 29,129 | | 0.72% | $ | 158.9 | | 0.17% | City: 9,737; County: 31,362 | Rural - No CBSA | N/A |
| Genesis Care - Andalusia | SC | 10,373 | | 0.26% | $ | 394.2 | | 0.42% | City: 8,680; County: 37,049 | Rural - No CBSA | N/A |
| Lexington Carilion Clinic | PC | 15,820 | | 0.39% | $ | 376.7 | | 0.40% | City: 7,446; County: 22,573 | Rural - No CBSA | N/A |
| Dahlonega Medical Mall | MOB | 22,804 | | 0.57% | $ | 280.8 | | 0.30% | City: 7,294; County: 33,610 | Rural - No CBSA | N/A |
| Batesville Regional Medical Center | MOB | 9,263 | | 0.23% | $ | 49.5 | | 0.05% | City: 7,218; County: 34,192 | Rural - No CBSA | N/A |
| Tri Lakes Behavioral | BSF | 58,400 | | 1.45% | $ | 696.0 | | 0.74% | City: 7,218; County: 34,192 | Rural - No CBSA | N/A |
| North Mississippi Health Services | MOB | 17,629 | | 0.44% | $ | 94.3 | | 0.10% | City: 6,794; County: 35,252 | Rural - No CBSA | N/A |
| North Mississippi Health Services | MOB | 27,743 | | 0.69% | $ | 148.4 | | 0.16% | City: 6,794; County: 35,252 | Rural - No CBSA | N/A |
| North Mississippi Health Services | MOB | 18,074 | | 0.45% | $ | 96.7 | | 0.10% | City: 6,794; County: 35,252 | Rural - No CBSA | N/A |
| North Mississippi Health Services | MOB | 9,890 | | 0.25% | $ | 52.9 | | 0.06% | City: 6,794; County: 35,252 | Rural - No CBSA | N/A |
| Genesis Care - Princeton | SC | 7,236 | | 0.18% | $ | 198.5 | | 0.21% | City: 5,675; County: 58,758 | Rural - No CBSA | N/A |
| Sanderling Dialysis Center | SC | 5,217 | | 0.13% | $ | 270.7 | | 0.29% | City: 5,501; County: 13,279 | Rural - No CBSA | N/A |
| North Mississippi Health Services | MOB | 3,378 | | 0.08% | $ | 18.1 | | 0.02% | City: 5,205; County: 35,252 | Rural - No CBSA | N/A |
| | | | | | | | |
| Community Healthcare Trust | Page | 22 | 2Q 2023 | Supplemental Information |
| | | | | | | | | | | | | | | | | | | | | | | | | | |
| Property Name | Property
Type | Area | % of
Square
Feet | Annualized
Rent ($000's) | % of Annualized
Rent | Population | MSA/MISA | Rank |
| Rettig Family Healthcare | PC | 12,000 | | 0.30% | $ | 180.0 | | 0.19% | City: 4,328; County: 23,437 | Rural - No CBSA | N/A |
| Wellmont Lebanon Urgent Care | SC | 8,369 | | 0.21% | $ | 104.6 | | 0.11% | City: 3,424; County: 26,586 | Rural - No CBSA | N/A |
| | | | | | | | |
| Community Healthcare Trust | Page | 23 | 2Q 2023 | Supplemental Information |
REPORTING DEFINITIONS
Acute Inpatient Behavioral Facilities (AIB)
Behavioral inpatient acute care facilities are healthcare facilities that provide a range of clinical services for mental health and/or substance abuse diagnoses on an inpatient basis. Behavioral health services provided may include assessment, treatment, individual medical evaluation and management (including medication management), individual and group therapy, behavioral health counseling, family therapy and psychological testing for recipients of all ages.
AFFO, Adjusted for Acquisitions
AFFO, Adjusted for Acquisitions, adjusts AFFO to show the impact of the real estate properties acquired in the period as if they had been acquired on the first day of the reporting period, using the expected returns and in-place leases at the time of the acquisition. The Company believes that AFFO, Adjusted for Acquisitions, is useful because it allows investors, analysts and Company management visibility into the impact on the Company's results of operations in future reporting periods resulting from its current period acquisitions.
Annualized Rent
Base rent for the current month multiplied by 12.
Behavioral Specialty Facilities (BSF)
Behavioral specialty facilities are healthcare facilities that provide a range of clinical services for mental health and/or substance abuse diagnoses. Behavioral health services provided may include assessment, treatment, individual medical evaluation and management (including medication management), individual and group therapy, behavioral health counseling, family therapy and psychological testing for recipients of all ages.
EBITDAre and Adjusted EBITDAre
The Company uses the National Association of Real Estate Investment Trusts, Inc. ("NAREIT") definition of EBITDAre which is net income plus interest expense, income tax expense, and depreciation and amortization, plus losses or minus gains on the disposition of depreciable property, including losses/gains on change of control, plus impairment write-downs of depreciable property and of investments in unconsolidated affiliates caused by a decrease in value of depreciable property in the affiliate, plus or minus adjustments to reflect the entity's share of EBITDAre of unconsolidated affiliates and consolidated affiliates with non-controlling interest. The Company also presents Adjusted EBITDAre which is EBITDAre before non-cash stock-based compensation amortization.
We consider EBITDAre and Adjusted EBITDAre important measures because they provide additional information to allow management, investors, and our current and potential creditors to evaluate and compare our core operating results and our ability to service debt.
Funds from Operations (FFO) and Adjusted Funds from Operations (AFFO)
Historical cost accounting for real estate assets implicitly assumes that the value of real estate assets diminishes predictably over time. However, since real estate values have historically risen or fallen with market conditions, many industry investors deem presentations of operating results for real estate companies that use historical cost accounting to be insufficient by themselves. For that reason, the Company considers funds from operations ("FFO") and adjusted funds from operations ("AFFO") to be appropriate measures of operating performance of an equity real estate investment trust ("REIT"). In particular, the Company believes that AFFO is useful because it allows investors, analysts and Company management to compare the Company's operating performance to the operating performance of other real estate companies and between periods on a consistent basis without having to account for differences caused by unanticipated items and other events.
| | | | | | | | |
| Community Healthcare Trust | Page | 24 | 2Q 2023 | Supplemental Information |
REPORTING DEFINITIONS (continued)
The Company uses the NAREIT definition of FFO. FFO is an operating performance measure adopted by NAREIT. NAREIT defines FFO as the most commonly accepted and reported measure of a REIT’s operating performance equal to net income (calculated in accordance with GAAP), excluding gains or losses from the sale of certain real estate assets, gains and losses from change in control, impairment write-downs of certain real estate assets and investments in entities when the impairment is directly attributable to decreases in the value of depreciable real estate held by the entity, plus depreciation and amortization related to real estate properties, and after adjustments for unconsolidated partnerships and joint ventures. NAREIT also provides REITs with an option to exclude gains, losses and impairments of assets that are incidental to the main business of the REIT from the calculation of FFO. The Company has included AFFO which it has defined as FFO, excluding certain expenses related to closing costs of properties acquired accounted for as business combinations and mortgages funded, excluding straight-line rent and the amortization of stock-based compensation, and including or excluding other non-cash items from time to time. AFFO presented herein may not be comparable to similar measures presented by other real estate companies due to the fact that not all real estate companies use the same definition.
FFO and AFFO should not be considered as alternatives to net income (determined in accordance with GAAP) as indicators of the Company's financial performance or as alternatives to cash flow from operating activities
(determined in accordance with GAAP) as measures of the Company’s liquidity, nor are they necessarily indicative of sufficient cash flow to fund all of the Company’s needs. The Company believes that in order to facilitate a clear understanding of the consolidated historical operating results of the Company, FFO and AFFO should be examined in conjunction with net income as presented elsewhere herein.
Inpatient Rehabilitation Facilities (IRF)
Inpatient rehabilitation facilities are free standing rehabilitation hospitals, or may be units within an acute care hospital, that provide intensive rehabilitation programs to patients.
Long-Term Acute Care Hospitals (LTACH)
Long-term acute care hospitals provide inpatient services for patients with complex medical conditions who require more sensitive care, monitoring or emergency support than that available in most skilled nursing facilities.
Medical Office Building (MOB)
Medical office buildings are buildings occupied by healthcare providers and may be located near hospitals or other facilities where healthcare services are rendered or in close proximity to a population base. Medical office buildings can be leased to physicians, physician practice groups, hospitals, healthcare systems or other healthcare providers.
Metropolitan Statistical Area (MSA or MISA)
MSAs or MISAs are geographical regions with relatively higher population densities at their core and have close economic ties throughout their area. MSAs and MISAs are defined by the Office of Management and Budget.
Net Operating Income (NOI)
NOI is a non-GAAP financial measure that is defined as net income or loss, computed in accordance with GAAP, generated from our total portfolio of properties and other investments before general and administrative expenses, depreciation and amortization expense, gains or loss on the sale of real estate properties or other investments, interest expense, and income tax expense. We believe that NOI provides an accurate measure of operating performance of our operating assets because NOI excludes certain items that are not associated with management of the properties. CHCT's use of the term NOI may not be comparable to that of other real estate companies as they may have different methodologies for computing NOI.
| | | | | | | | |
| Community Healthcare Trust | Page | 25 | 2Q 2023 | Supplemental Information |
REPORTING DEFINITIONS (continued)
Physician Clinics (PC)
Physician clinics are freestanding healthcare facilities that are primarily devoted to the care of ambulatory patients, can be privately operated or publicly managed and funded, and typically provide primary healthcare needs of populations in local communities utilizing physicians and other healthcare providers.
Specialty Centers (SC)
Specialty centers include various types of centers which may, among others, include oncology centers, dialysis centers, urgent care centers, and blood plasma centers.
Surgical Centers and Hospitals (SCH)
Surgical centers and hospitals may include outpatient surgery centers where surgical procedures not requiring an overnight hospital stay are performed; as well as specialty hospitals that focus on providing care for certain conditions and performing certain procedures, such as cardiovascular and orthopedic surgery.
Total Capitalization
Debt plus stockholders' equity plus accumulated depreciation.
| | | | | | | | |
| Community Healthcare Trust | Page | 26 | 2Q 2023 | Supplemental Information |
DISCLAIMERS
FORWARD-LOOKING STATEMENTS
Certain statements made in this supplemental information package constitute forward-looking statements within the meaning of the Private Securities Litigation Reform Act of 1995 (set forth in Section 27A of the Securities Act of 1933, as amended, and Section 21E of the Securities Exchange Act of 1934, as amended (the “Exchange Act”)). In particular, statements pertaining to our capital resources, portfolio performance and results of operations contain forward-looking statements. Likewise, our statements regarding anticipated market conditions are forward-looking statements. You can identify forward-looking statements by the use of forward-looking terminology such as "believes,” “expects,” “may,” “will,” “should,” “seeks,” “approximately,” “intends,” “plans,” "outlook," "continue," "projects," “estimates” or “anticipates” or the negative of these words and phrases or similar words or phrases which are predictions of or indicate future events or trends and which do not relate solely to historical matters. You can also identify forward-looking statements by discussions of strategy, plans, expectations, or intentions.
Forward-looking statements reflect the views of our management regarding current expectations and projections about future events and are based on currently available information. These forward-looking statements are not guarantees of future performance and involve numerous risks and uncertainties and you should not rely on them as predictions of future events. Forward-looking statements depend on assumptions, data, or methods which may be incorrect or imprecise and we may not be able to realize them.
While forward-looking statements reflect our good faith beliefs, they are not guarantees of future performance. We disclaim any obligation to publicly update or revise any forward-looking statement to reflect changes in underlying assumptions or factors, of new information, data or methods, future events or other changes after the date of this supplemental information package, except as required by applicable law. You should not place undue reliance on any forward-looking statements that are based on information currently available to us or the third parties making the forward-looking statements. For a discussion of factors that could impact our future results, performance or transactions, see Part I, Item 1A (Risk Factors) of our Annual Report on Form 10-K for the fiscal year ended December 31, 2022 and the Company’s other filings with the Securities and Exchange Commission from time to time.
NON-GAAP FINANCIAL MEASURES
This presentation includes EBITDAre, Adjusted EBITDAre, Adjusted EBITDAre Annualized, Net Operating Income (or NOI), Funds From Operations (or FFO), Adjusted Funds From Operations (or AFFO), and AFFO, Adjusted for Acquisitions, which are non-GAAP financial measures. For purposes of the Securities and Exchange Commission’s (“SEC”) Regulation G, a non-GAAP financial measure is a numerical measure of a company’s historical or future financial performance, financial position or cash flows that excludes amounts, or is subject to adjustments that have the effect of excluding amounts, that are included in the most directly comparable financial measure calculated and presented in accordance with GAAP in the statements of operations, balance sheets or statements of cash flows (or equivalent statements) of the company, or includes amounts, or is subject to adjustments that have the effect of including amounts, that are excluded from the most directly comparable financial measure so calculated and presented. As used in this presentation, GAAP refers to generally accepted accounting principles in the United States of America. Our use of the non-GAAP financial measure terms herein may not be comparable to that of other real estate investment trusts. Pursuant to the requirements of Regulation G, we have provided reconciliations of the non-GAAP financial measures to the most directly comparable GAAP financial measures.
| | | | | | | | |
| Community Healthcare Trust | Page | 27 | 2Q 2023 | Supplemental Information |