KKR Real Estate Finance Trust Inc. 4th Quarter 2019 Supplemental Information February 19, 2020

Legal Disclosures This presentation has been prepared for KKR Real Estate Finance Trust Inc. (NYSE: KREF) for the benefit of its stockholders. This presentation is solely for informational purposes in connection with evaluating the business, operations and financial results of KKR Real Estate Finance Trust Inc. and its subsidiaries (collectively, "KREF“ or the “Company”). This presentation is not and shall not be construed as an offer to purchase or sell, or the solicitation of an offer to purchase or sell, any securities, any investment advice or any other service by KREF. Nothing in this presentation constitutes the provision of any tax, accounting, financial, investment, regulatory, legal or other advice by KREF or its advisors. This presentation may not be referenced, quoted or linked by website by any third party, in whole or in part, except as agreed to in writing by KREF. This presentation contains certain forward-looking statements within the meaning of Section 27A of the Securities Act of 1933, as amended, and Section 21E of the Securities Exchange Act of 1934, as amended, which reflect the Company’s current views with respect to, among other things, its future operations and financial performance. You can identify these forward looking statements by the use of words such as “outlook,” “believe,” “expect,” “potential,” “continue,” “may,” “should,” “seek,” “approximately,” “predict,” “intend,” “will,” “plan,” “estimate,” “anticipate,” the negative version of these words, other comparable words or other statements that do not relate strictly to historical or factual matters. The forward-looking statements are based on the Company’s beliefs, assumptions and expectations, taking into account all information currently available to it. These beliefs, assumptions and expectations can change as a result of many possible events or factors, not all of which are known to the Company or are within its control. Such forward-looking statements are subject to various risks and uncertainties, including, among other things: the general political, economic and competitive conditions in the United States and in any foreign jurisdictions in which the Company invests; the level and volatility of prevailing interest rates and credit spreads; adverse changes in the real estate and real estate capital markets; general volatility of the securities markets in which the Company participates; changes in the Company’s business, investment strategies or target assets; difficulty in obtaining financing or raising capital; adverse legislative or regulatory developments; reductions in the yield on the Company’s investments and increases in the cost of the Company’s financing; acts of God such as hurricanes, earthquakes and other natural disasters, acts of war and/or terrorism and other events that may cause unanticipated and uninsured performance declines and/ or losses to the Company or the owners and operators of the real estate securing the Company’s investments; deterioration in the performance of properties securing the Company’s investments that may cause deterioration in the performance of the Company’s investments and, potentially, principal losses to the Company; defaults by borrowers in paying debt service on outstanding indebtedness; the adequacy of collateral securing the Company’s investments and declines in the fair value of the Company’s investments; adverse developments in the availability of desirable investment opportunities whether they are due to competition, regulation or otherwise; difficulty in successfully managing the Company’s growth, including integrating new assets into the Company’s existing systems; the cost of operating the Company’s platform, including, but not limited to, the cost of operating a real estate investment platform and the cost of operating as a publicly traded company; the availability of qualified personnel and the Company’s relationship with our Manager; KKR controls the Company and its interests may conflict with those of the Company’s stockholders in the future; the Company’s qualification as a REIT for U.S. federal income tax purposes and the Company’s exclusion from registration under the Investment Company Act of 1940; authoritative GAAP or policy changes from such standard-setting bodies such as the Financial Accounting Standards Board, the Securities and Exchange Commission (the “SEC”), the Internal Revenue Service, the New York Stock Exchange and other authorities that the Company is subject to, as well as their counterparts in any foreign jurisdictions where the Company might do business; and other risks and uncertainties, including those described under Part I—Item 1A. “Risk Factors” of the Company’s Annual Report on Form 10-K for the fiscal year ended December 31, 2019, as such factors may be updated from time to time in the Company’s periodic filings with the SEC, which are accessible on the SEC’s website at www.sec.gov. Accordingly, there are or will be important factors that could cause actual outcomes or results to differ materially from those indicated in this presentation. These factors should not be construed as exhaustive and should be read in conjunction with the other cautionary statements and information included in this presentation and in the Company’s filings with the SEC. All forward looking statements in this presentation speak only as of February 19, 2020. KREF undertakes no obligation to publicly update or review any forward- looking statements, whether as a result of new information, future developments or otherwise, except as required by law. All financial information in this presentation is as of December 31, 2019 unless otherwise indicated. This presentation also includes non-GAAP financial measures, including Core Earnings, Core Earnings per Diluted Share, Net Core Earnings and Net Core Earnings per Diluted Share. Such non-GAAP financial measures should be considered only as supplemental to, and not as superior to, financial measures prepared in accordance with U.S. GAAP. Please refer to the Appendix of this presentation for a reconciliation of the non-GAAP financial measures included in this presentation to the most directly comparable financial measures prepared in accordance with U.S. GAAP. 2

4Q’19 Key Highlights • Net Income(1) of $24.8 million or $0.43 per diluted share • Net Core Earnings(2) of $25.5 million or $0.44 per diluted share Financials • Book value(3) of $1,122.0 million or $19.52 per share • Paid 4Q dividend of $0.43 per share, equating to an 8.0% annualized dividend yield(4) • Originated $764.1 million of floating-rate senior loans Originations • 2019 record originations of $3.1 billion, up 14% from 2018 • Subsequent to year end, originated two floating-rate senior loans totaling $332.5 million and a $20.0 million floating-rate mezzanine loan • Outstanding total portfolio of $5.1 billion, up 23% from 4Q’18 Total Portfolio • Senior loans weighted average LTV of 66%(5) • Weighted average risk rating of 2.9 (Average Risk) Capitalization • $1.6 billion of undrawn financing capacity • 72% of outstanding portfolio financing is non-mark-to-market Interest Rate • 99.9% of the loan portfolio is floating-rate • Approximately half of the loan portfolio has a LIBOR floor of at least 2.00% Sensitivity • Portfolio benefits from decreasing rates given in place LIBOR floors Note: Net income attributable to common stockholders per share and Net Core Earnings per share are based on diluted weighted average shares outstanding as of December 31, 2019; book value per share is based on shares outstanding at December 31, 2019. (1) Represents Net Income attributable to common stockholders. (2) See Appendix for definition and reconciliation to financial results prepared in accordance with GAAP. (3) Book value per share includes the year to date (“YTD”) impact of a $1.2 million, or $0.02 per common share, non-cash redemption value adjustment to our redeemable Special Non-Voting Preferred Stock (‘SNVPS’), resulting in a cumulative (since issuance of the SNVPS) decrease of $1.7 million to our book value as of December 31, 2019. (4) Based on KREF common stock closing price of $21.42 as of February 18, 2020. (5) LTV is generally based on the initial loan amount divided by the as-is appraised value as of the date the loan was originated or by the current principal amount as of the date of the most recent as-is appraised value. 3

Successfully Executing on Business Strategy with Strong Growth Total Portfolio(1) Total Loan Originations ($ in Millions) ($ in Millions) CAGR CAGR +56% +45% $5,075 $3,112 $4,134 $2,729 Total Loan Originations $173 $1,483 $2,083 Average Loan Size $144 $124 2017 2018 2019 2017 2018 2019 Net Core Earnings / Diluted Share Total Financing Capacity | % Non MTM(2) ($ in Millions) Realized Gain on CMBS Sale CAGR CAGR +17% +71% $5,548 $1.81 $1.67 $4,321 $0.37 72% Total Financing 60% Capacity $1.22 $1.44 $1,888 % Non MTM 13% 2017 2018 2019 2017 2018 2019 (1) Includes non-consolidated senior interests and excludes pari passu and vertical loan syndications, as applicable. (2) As percentage of outstanding face amount of secured financing and excludes convertible notes and the corporate revolving credit facility. 4
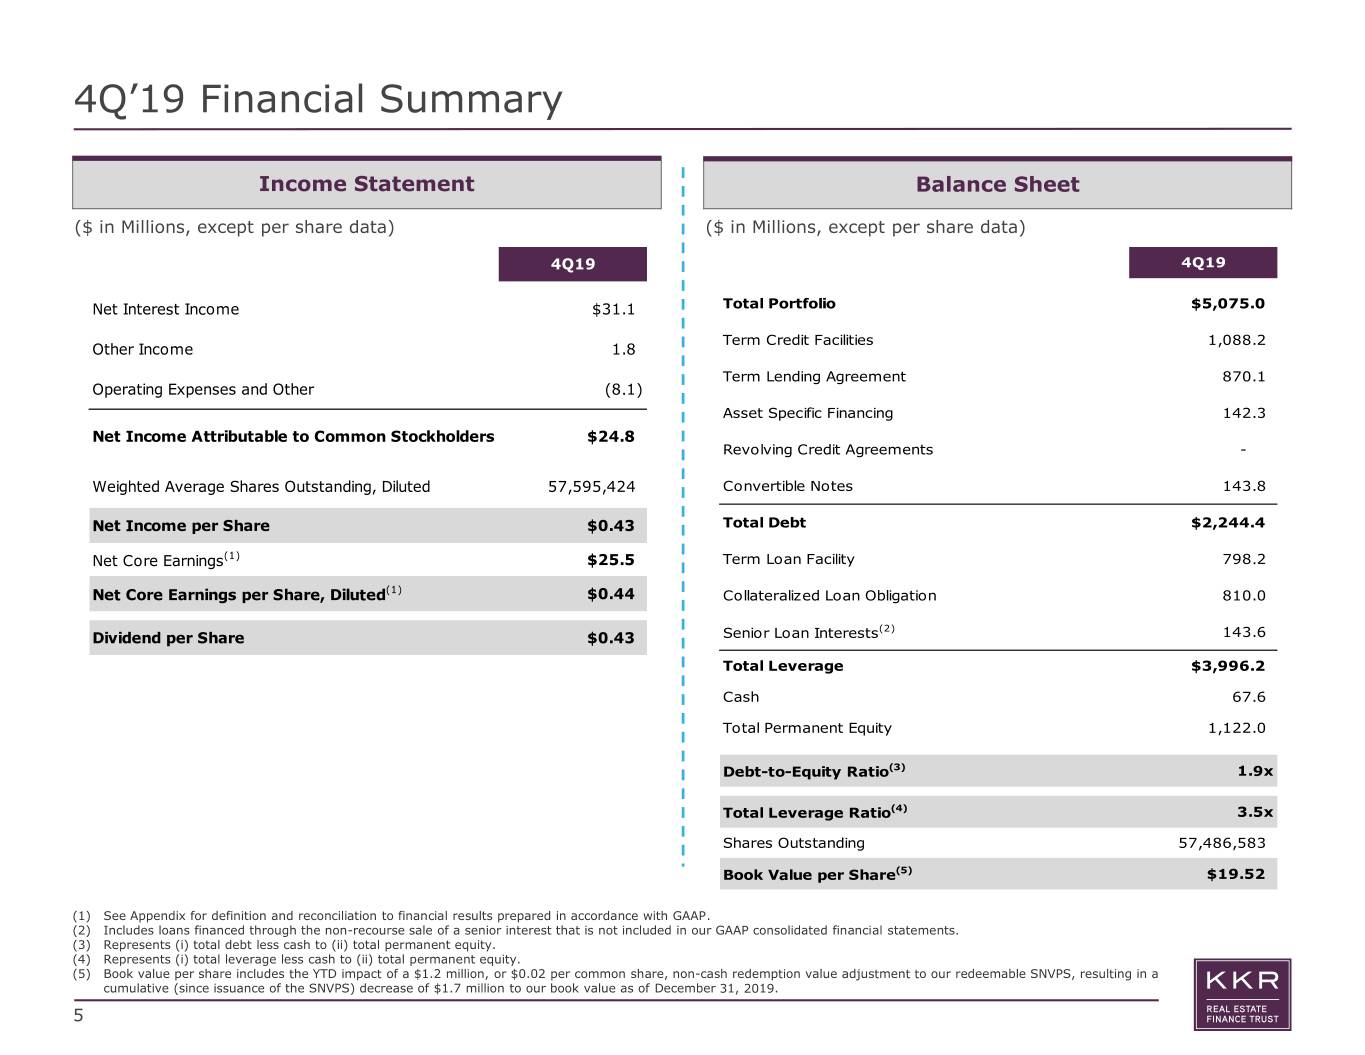
4Q’19 Financial Summary Income Statement Balance Sheet ($ in Millions, except per share data) ($ in Millions, except per share data) 4Q19 4Q19 Net Interest Income $31.1 Total Portfolio $5,075.0 Term Credit Facilities 1,088.2 Other Income 1.8 Term Lending Agreement 870.1 Operating Expenses and Other (8.1) Asset Specific Financing 142.3 Net Income Attributable to Common Stockholders $24.8 Revolving Credit Agreements - Weighted Average Shares Outstanding, Diluted 57,595,424 Convertible Notes 143.8 Net Income per Share $0.43 Total Debt $2,244.4 Net Core Earnings(1) $25.5 Term Loan Facility 798.2 Net Core Earnings per Share, Diluted(1) $0.44 Collateralized Loan Obligation 810.0 (2) Dividend per Share $0.43 Senior Loan Interests 143.6 Total Leverage $3,996.2 Cash 67.6 Total Permanent Equity 1,122.0 Debt-to-Equity Ratio(3) 1.9x Total Leverage Ratio(4) 3.5x Shares Outstanding 57,486,583 Book Value per Share(5) $19.52 (1) See Appendix for definition and reconciliation to financial results prepared in accordance with GAAP. (2) Includes loans financed through the non-recourse sale of a senior interest that is not included in our GAAP consolidated financial statements. (3) Represents (i) total debt less cash to (ii) total permanent equity. (4) Represents (i) total leverage less cash to (ii) total permanent equity. (5) Book value per share includes the YTD impact of a $1.2 million, or $0.02 per common share, non-cash redemption value adjustment to our redeemable SNVPS, resulting in a cumulative (since issuance of the SNVPS) decrease of $1.7 million to our book value as of December 31, 2019. 5
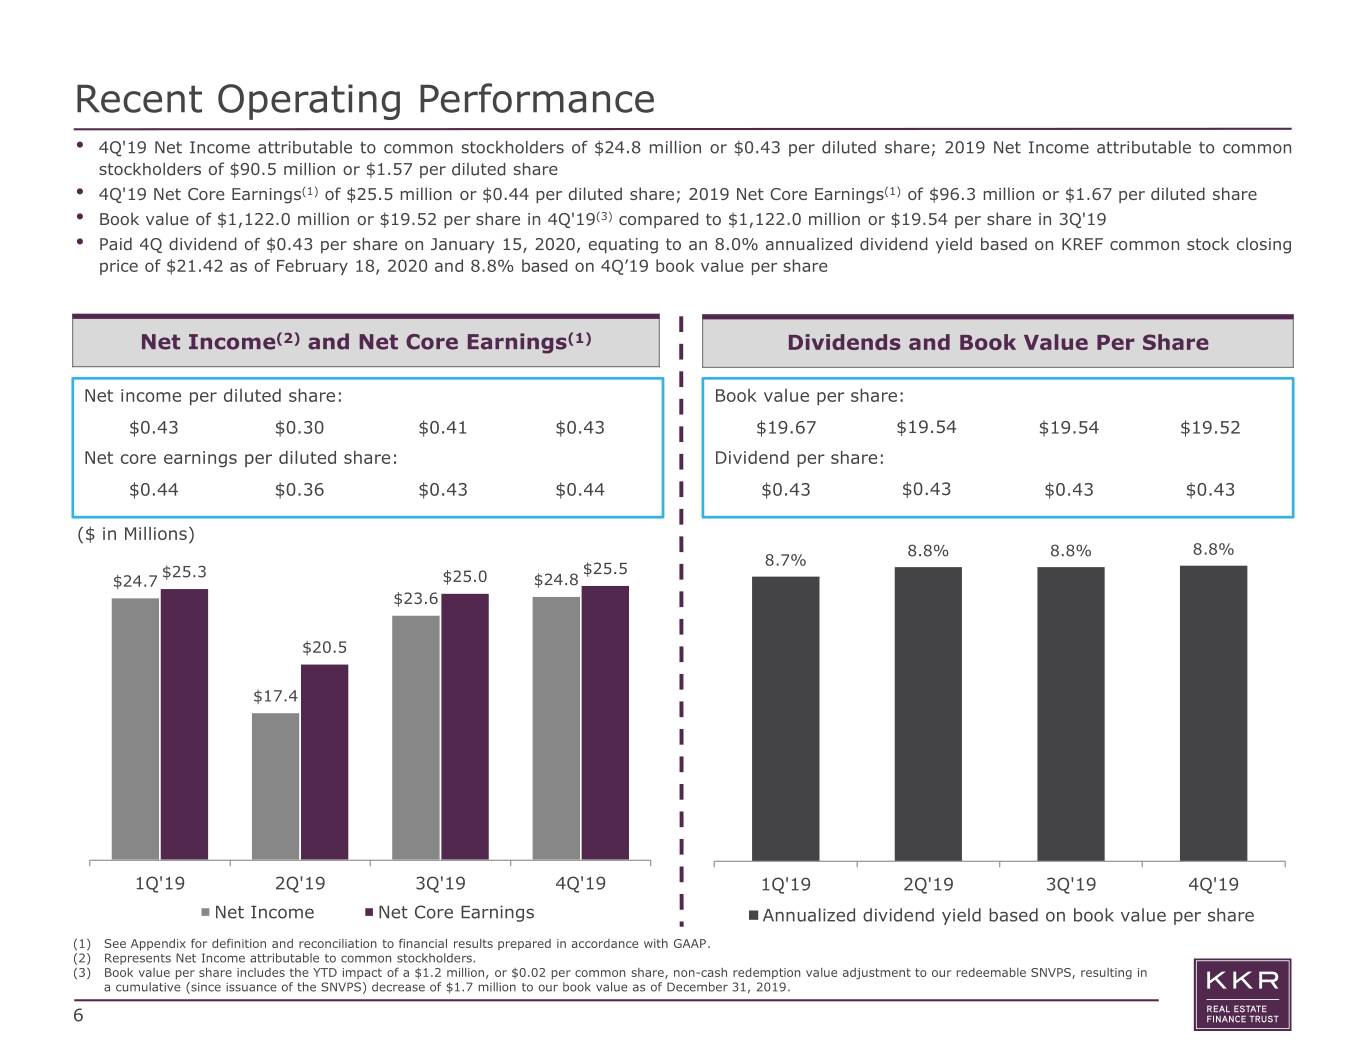
Recent Operating Performance • 4Q'19 Net Income attributable to common stockholders of $24.8 million or $0.43 per diluted share; 2019 Net Income attributable to common stockholders of $90.5 million or $1.57 per diluted share • 4Q'19 Net Core Earnings(1) of $25.5 million or $0.44 per diluted share; 2019 Net Core Earnings(1) of $96.3 million or $1.67 per diluted share • Book value of $1,122.0 million or $19.52 per share in 4Q'19(3) compared to $1,122.0 million or $19.54 per share in 3Q'19 • Paid 4Q dividend of $0.43 per share on January 15, 2020, equating to an 8.0% annualized dividend yield based on KREF common stock closing price of $21.42 as of February 18, 2020 and 8.8% based on 4Q’19 book value per share Net Income(2) and Net Core Earnings(1) Dividends and Book Value Per Share Net income per diluted share: Book value per share: $0.43 $0.30 $0.41 $0.43 $19.67 $19.54 $19.54 $19.52 Net core earnings per diluted share: Dividend per share: $0.44 $0.36 $0.43 $0.44 $0.43 $0.43 $0.43 $0.43 ($ in Millions) 8.8% 8.8% 8.8% 8.7% $25.3 $25.5 $24.7 $25.0 $24.8 $23.6 $20.5 $17.4 1Q'19 2Q'19 3Q'19 4Q'19 1Q'19 2Q'19 3Q'19 4Q'19 Net Income Net Core Earnings Annualized dividend yield based on book value per share (1) See Appendix for definition and reconciliation to financial results prepared in accordance with GAAP. (2) Represents Net Income attributable to common stockholders. (3) Book value per share includes the YTD impact of a $1.2 million, or $0.02 per common share, non-cash redemption value adjustment to our redeemable SNVPS, resulting in a cumulative (since issuance of the SNVPS) decrease of $1.7 million to our book value as of December 31, 2019. 6
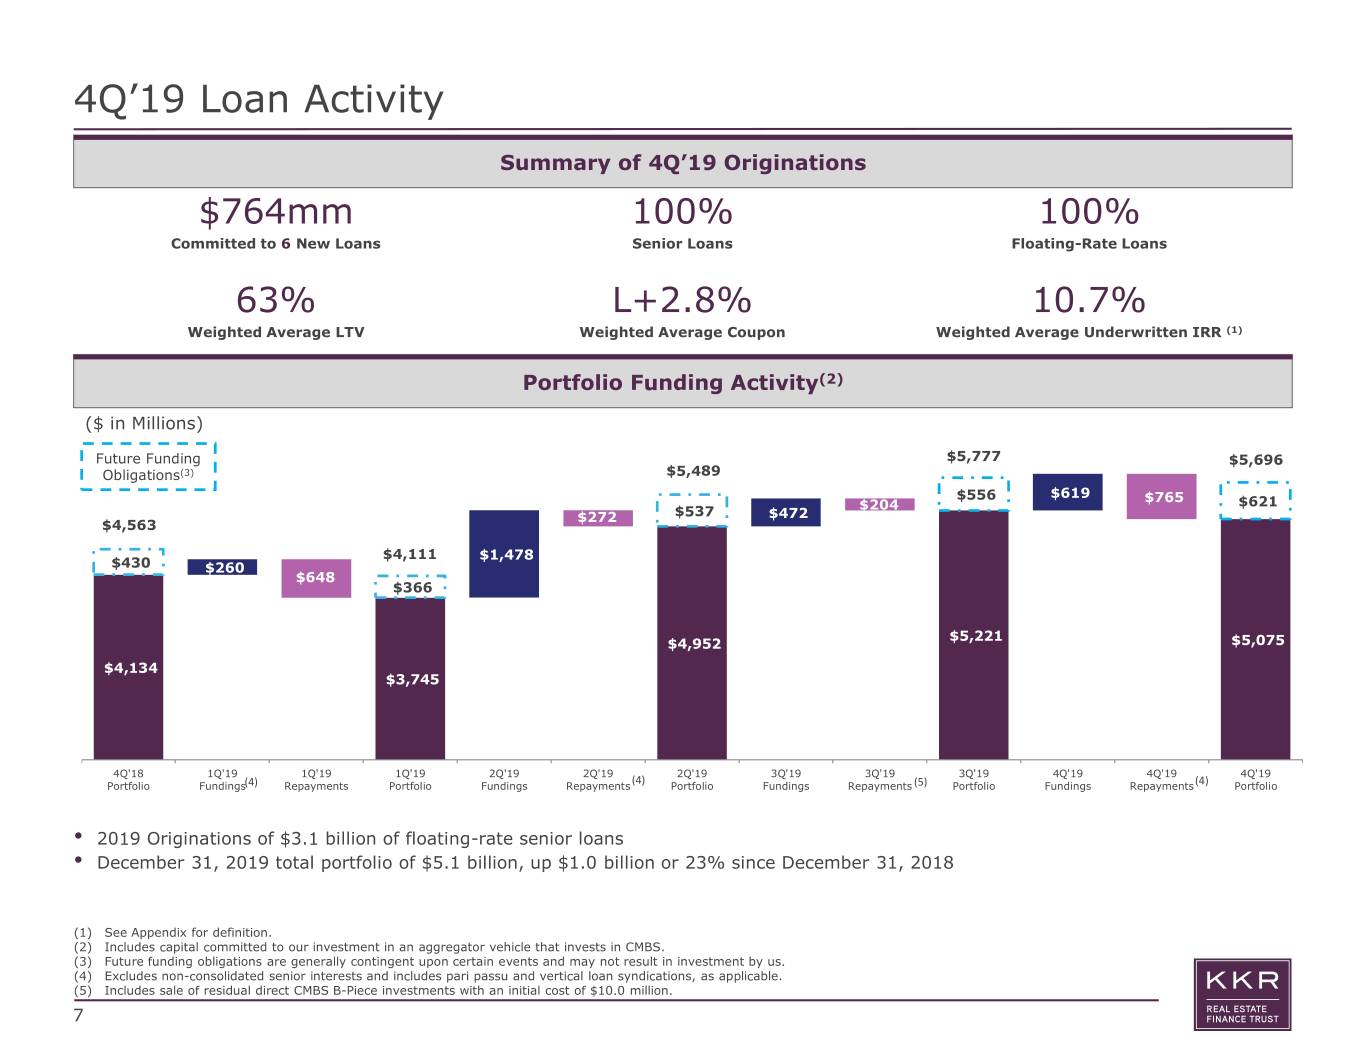
4Q’19 Loan Activity Summary of 4Q’19 Originations $764mm 100% 100% Committed to 6 New Loans Senior Loans Floating-Rate Loans 63% L+2.8% 10.7% Weighted Average LTV Weighted Average Coupon Weighted Average Underwritten IRR (1) Portfolio Funding Activity(2) ($ in Millions) Future Funding $5,777 $5,696 Obligations(3) $5,489 $556 $619 $765 $204 $621 $272 $537 $472 $4,563 $4,111 $1,478 $430 $260 $648 $366 $5,221 $5,221 $4,952 $5,075 $4,134 $3,745 4Q'18 1Q'19 1Q'19 1Q'19 2Q'19 2Q'19 2Q'19 3Q'19 3Q'19 3Q'19 4Q'19 4Q'19 4Q'19 Portfolio Fundings(4) Repayments Portfolio Fundings Repayments (4) Portfolio Fundings Repayments (5) Portfolio Fundings Repayments(4) Portfolio • 2019 Originations of $3.1 billion of floating-rate senior loans • December 31, 2019 total portfolio of $5.1 billion, up $1.0 billion or 23% since December 31, 2018 (1) See Appendix for definition. (2) Includes capital committed to our investment in an aggregator vehicle that invests in CMBS. (3) Future funding obligations are generally contingent upon certain events and may not result in investment by us. (4) Excludes non-consolidated senior interests and includes pari passu and vertical loan syndications, as applicable. (5) Includes sale of residual direct CMBS B-Piece investments with an initial cost of $10.0 million. 7
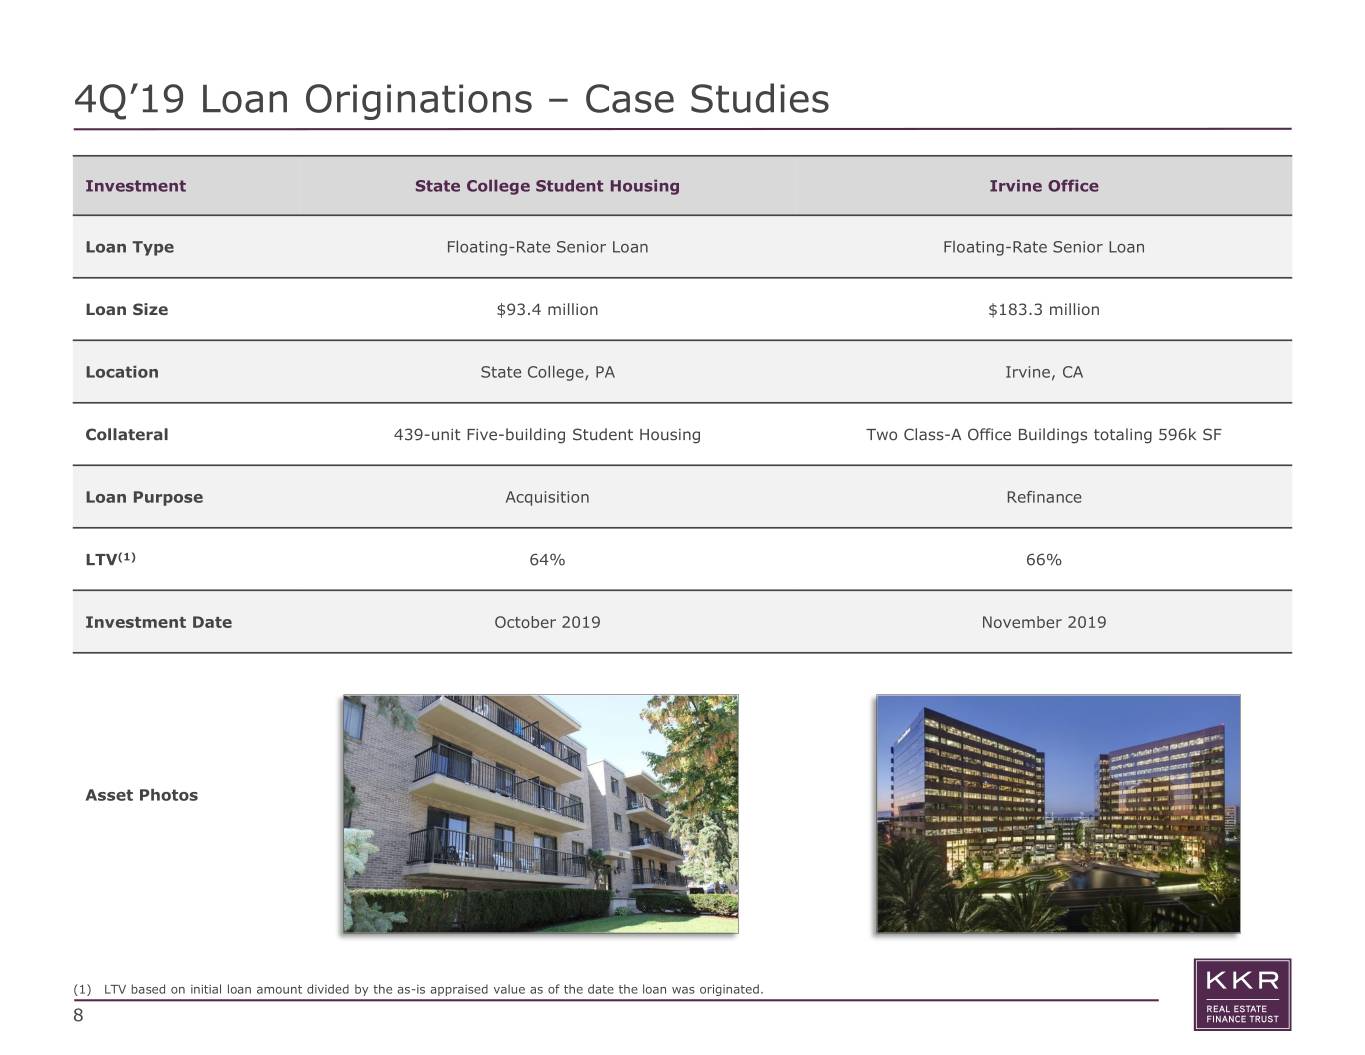
4Q’19 Loan Originations – Case Studies Investment State College Student Housing Irvine Office Loan Type Floating-Rate Senior Loan Floating-Rate Senior Loan Loan Size $93.4 million $183.3 million Location State College, PA Irvine, CA Collateral 439-unit Five-building Student Housing Two Class-A Office Buildings totaling 596k SF Loan Purpose Acquisition Refinance LTV(1) 64% 66% Investment Date October 2019 November 2019 Asset Photos (1) LTV based on initial loan amount divided by the as-is appraised value as of the date the loan was originated. 8
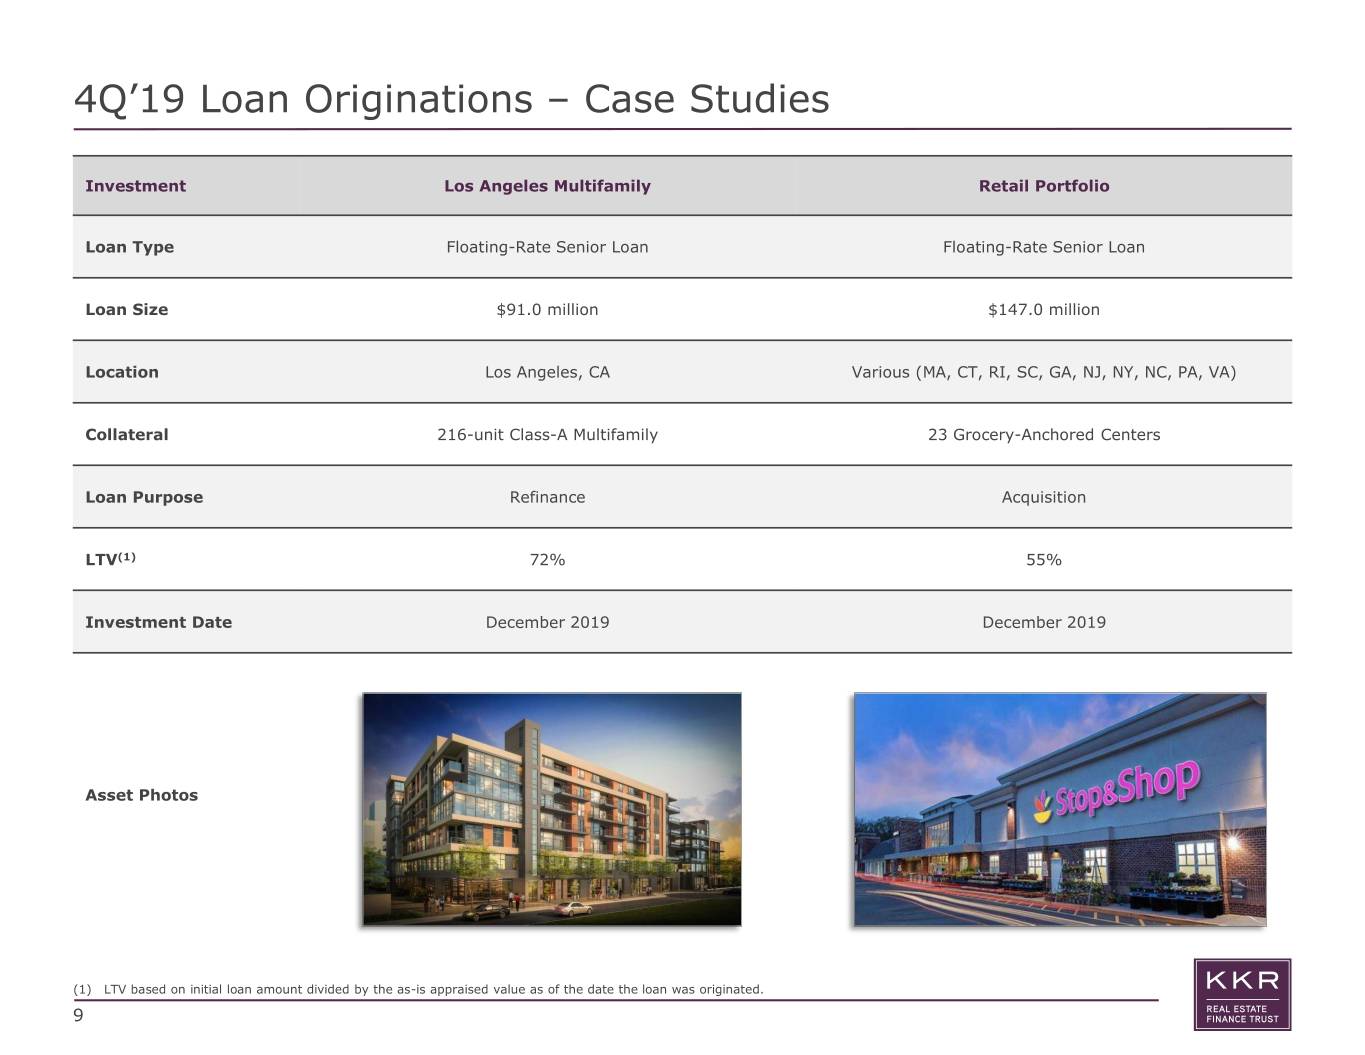
4Q’19 Loan Originations – Case Studies Investment Los Angeles Multifamily Retail Portfolio Loan Type Floating-Rate Senior Loan Floating-Rate Senior Loan Loan Size $91.0 million $147.0 million Location Los Angeles, CA Various (MA, CT, RI, SC, GA, NJ, NY, NC, PA, VA) Collateral 216-unit Class-A Multifamily 23 Grocery-Anchored Centers Loan Purpose Refinance Acquisition LTV(1) 72% 55% Investment Date December 2019 December 2019 Asset Photos (1) LTV based on initial loan amount divided by the as-is appraised value as of the date the loan was originated. 9
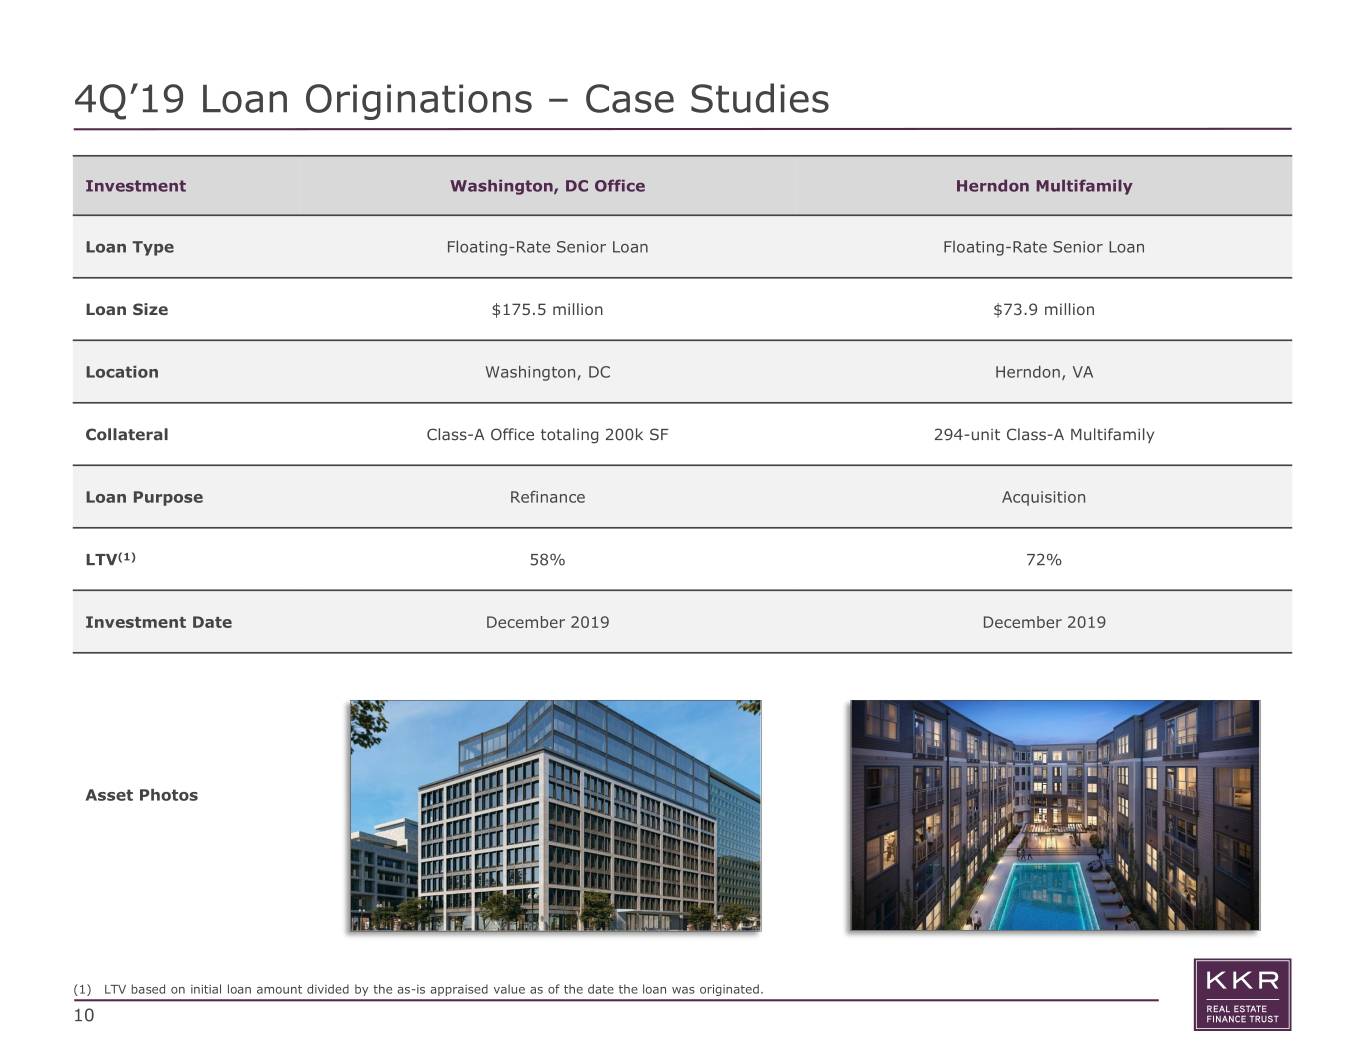
4Q’19 Loan Originations – Case Studies Investment Washington, DC Office Herndon Multifamily Loan Type Floating-Rate Senior Loan Floating-Rate Senior Loan Loan Size $175.5 million $73.9 million Location Washington, DC Herndon, VA Collateral Class-A Office totaling 200k SF 294-unit Class-A Multifamily Loan Purpose Refinance Acquisition LTV(1) 58% 72% Investment Date December 2019 December 2019 Asset Photos (1) LTV based on initial loan amount divided by the as-is appraised value as of the date the loan was originated. 10

KREF Portfolio by the Numbers • Outstanding total portfolio of $5.1 billion as of December 31, 2019 • 23% increase in portfolio size YoY. Increased 301% since June 30, 2017 (first quarter-end post IPO) • Multifamily and office loans comprise 84% of the portfolio Total Portfolio Growth Property Type(2) ($ in Millions) ($ in Millions) Current Portfolio: $5.3 billion(1) • Multifamily YoY increase of 73% • Office YoY decrease of 30% Including net funding and repayment activity subsequent to year end $2,972 4Q'18 4Q'19 $5,221 $5,075 $4,952 +301% $4,134 $3,745 $1,719 $1,794 $3,383 $2,960 $2,474 $1,263 $2,083 $1,812 $1,265 $233 $216 $171 $148 $148 $132 $138 $131 $69 $- 2Q'17 3Q'17 4Q'17 1Q'18 2Q'18 3Q'18 4Q'18 1Q'19 2Q'19 3Q'19 4Q'19 Multifamily Office Retail Hospitality Condo Industrial Student (Resi) Housing (1) As of February 18, 2020. (2) Chart based on total assets. Total assets reflect the principal amount outstanding of our senior and mezzanine loans. 11
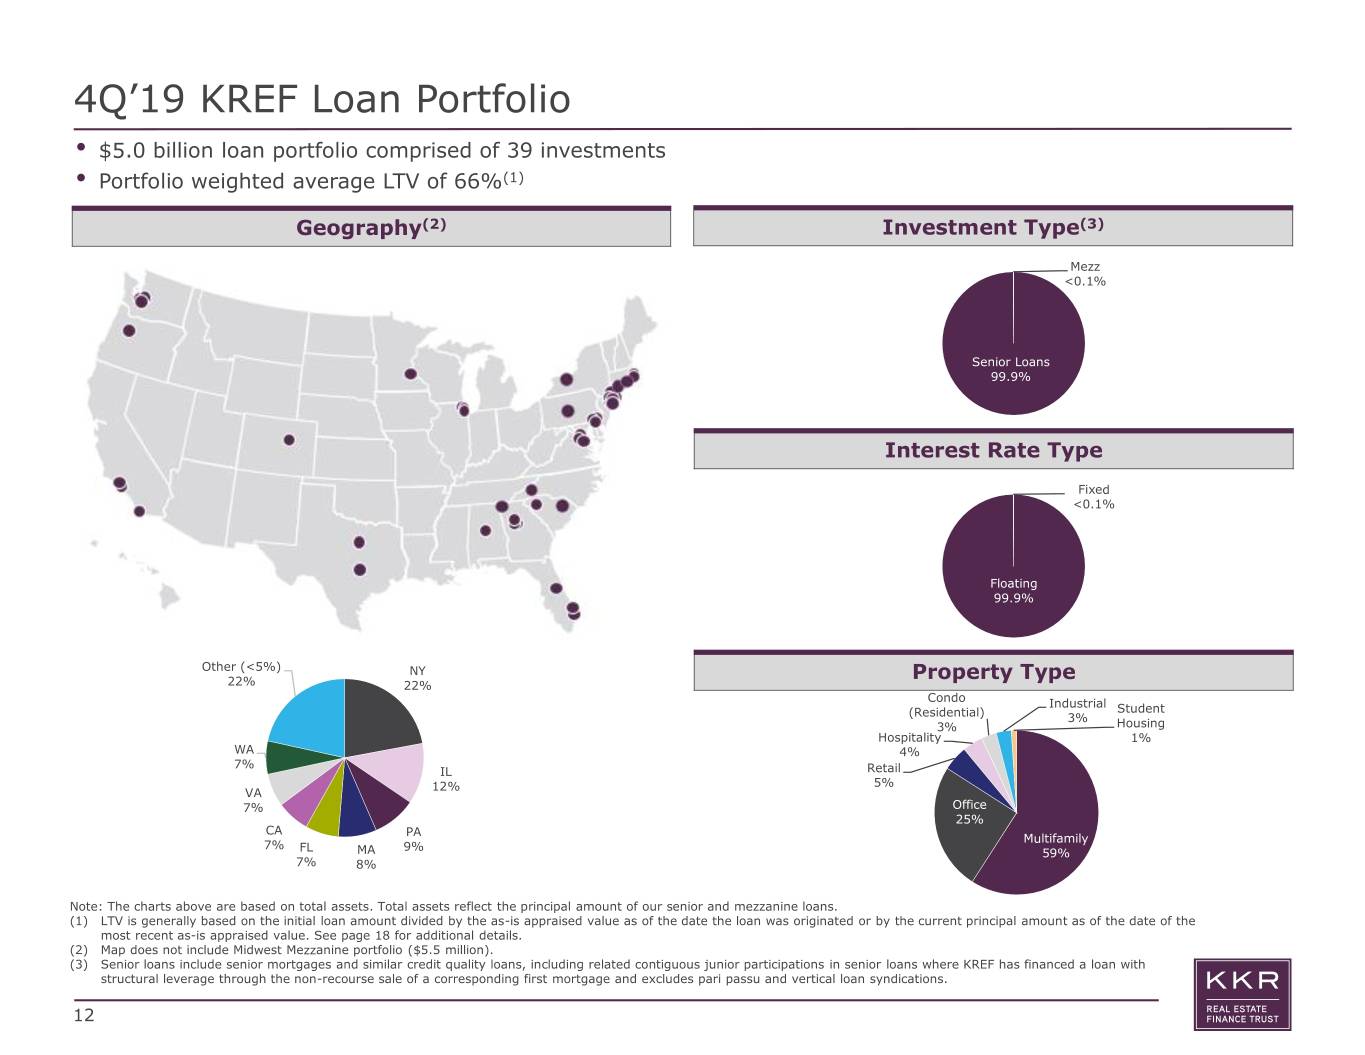
4Q’19 KREF Loan Portfolio • $5.0 billion loan portfolio comprised of 39 investments • Portfolio weighted average LTV of 66%(1) Geography(2) Investment Type(3) Mezz <0.1% Senior Loans 99.9% Interest Rate Type Fixed <0.1% Floating 99.9% Other (<5%) NY Property Type 22% 22% Condo Industrial Student (Residential) 3% 3% Housing Hospitality 1% WA 4% 7% IL Retail 12% 5% VA 7% Office 25% CA PA Multifamily 7% 9% FL MA 59% 7% 8% Note: The charts above are based on total assets. Total assets reflect the principal amount of our senior and mezzanine loans. (1) LTV is generally based on the initial loan amount divided by the as-is appraised value as of the date the loan was originated or by the current principal amount as of the date of the most recent as-is appraised value. See page 18 for additional details. (2) Map does not include Midwest Mezzanine portfolio ($5.5 million). (3) Senior loans include senior mortgages and similar credit quality loans, including related contiguous junior participations in senior loans where KREF has financed a loan with structural leverage through the non-recourse sale of a corresponding first mortgage and excludes pari passu and vertical loan syndications. 12
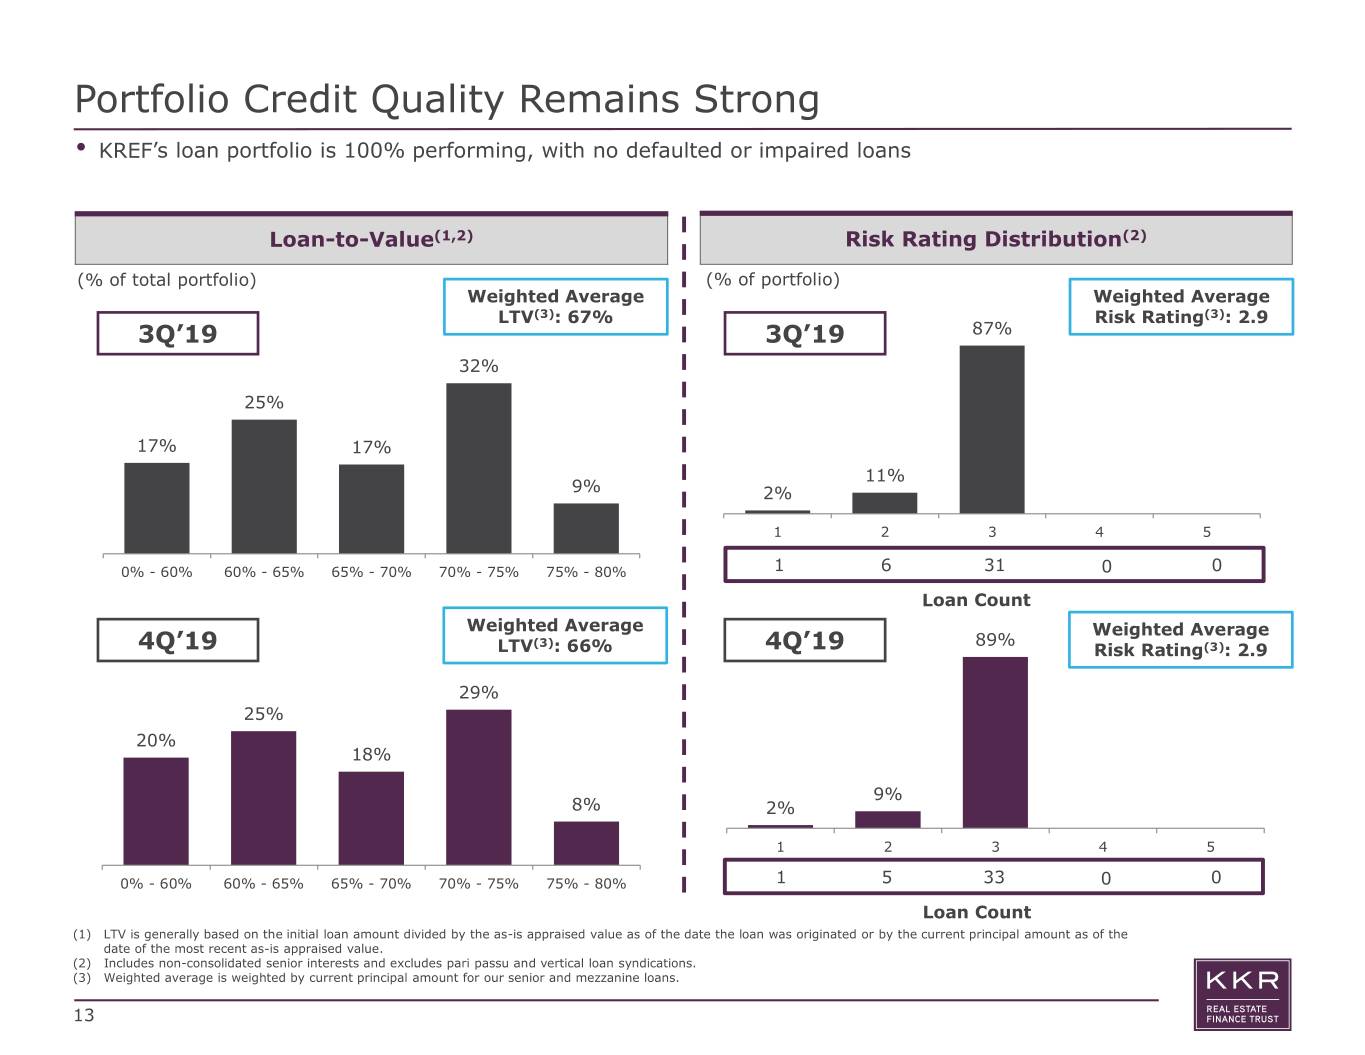
Portfolio Credit Quality Remains Strong • KREF’s loan portfolio is 100% performing, with no defaulted or impaired loans Loan-to-Value(1,2) Risk Rating Distribution(2) (% of total portfolio) (% of portfolio) Weighted Average Weighted Average LTV(3): 67% Risk Rating(3): 2.9 3Q’19 3Q’19 87% 32% 25% 17% 17% 11% 9% 2% 1 2 3 4 5 0% - 60% 60% - 65% 65% - 70% 70% - 75% 75% - 80% 1 6 31 0 0 Loan Count Weighted Average Weighted Average (3) 89% 4Q’19 LTV : 66% 4Q’19 Risk Rating(3): 2.9 29% 25% 20% 18% 9% 8% 2% 1 2 3 4 5 0% - 60% 60% - 65% 65% - 70% 70% - 75% 75% - 80% 1 5 33 0 0 Loan Count (1) LTV is generally based on the initial loan amount divided by the as-is appraised value as of the date the loan was originated or by the current principal amount as of the date of the most recent as-is appraised value. (2) Includes non-consolidated senior interests and excludes pari passu and vertical loan syndications. (3) Weighted average is weighted by current principal amount for our senior and mezzanine loans. 13
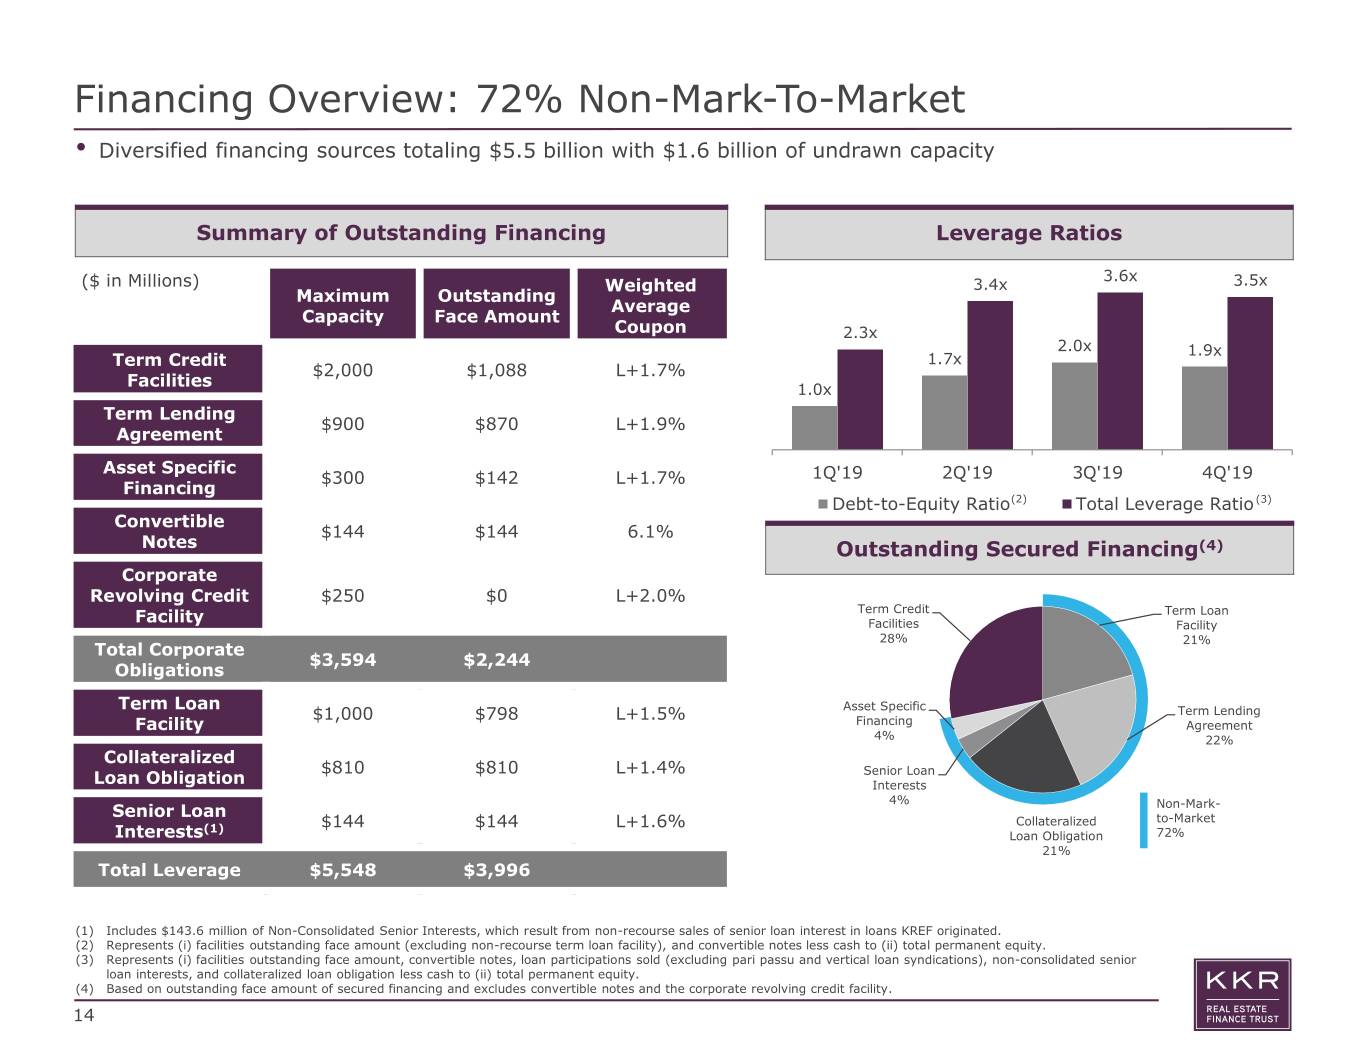
Financing Overview: 72% Non-Mark-To-Market • Diversified financing sources totaling $5.5 billion with $1.6 billion of undrawn capacity Summary of Outstanding Financing Leverage Ratios 3.6x ($ in Millions) Weighted 3.4x 3.5x Maximum Outstanding Average Capacity Face Amount Coupon 2.3x 2.0x 1.9x Term Credit 1.7x $2,000 $1,088 L+1.7% Facilities 1.0x Term Lending $900 $870 L+1.9% Agreement Asset Specific $300 $142 L+1.7% 1Q'19 2Q'19 3Q'19 4Q'19 Financing Debt-to-Equity Ratio(2) Total Leverage Ratio (3) Convertible $144 $144 6.1% Notes Outstanding Secured Financing(4) Corporate Revolving Credit $250 $0 L+2.0% Term Credit Term Loan Facility Facilities Facility 28% 21% Total Corporate $3,594 $2,244 Obligations Term Loan Asset Specific $1,000 $798 L+1.5% Term Lending Facility Financing Agreement 4% 22% Collateralized $810 $810 L+1.4% Senior Loan Loan Obligation Interests 4% Senior Loan Non-Mark- Collateralized to-Market (1) $144 $144 L+1.6% Interests Loan Obligation 72% 21% Total Leverage $5,548 $3,996 (1) Includes $143.6 million of Non-Consolidated Senior Interests, which result from non-recourse sales of senior loan interest in loans KREF originated. (2) Represents (i) facilities outstanding face amount (excluding non-recourse term loan facility), and convertible notes less cash to (ii) total permanent equity. (3) Represents (i) facilities outstanding face amount, convertible notes, loan participations sold (excluding pari passu and vertical loan syndications), non-consolidated senior loan interests, and collateralized loan obligation less cash to (ii) total permanent equity. (4) Based on outstanding face amount of secured financing and excludes convertible notes and the corporate revolving credit facility. 14
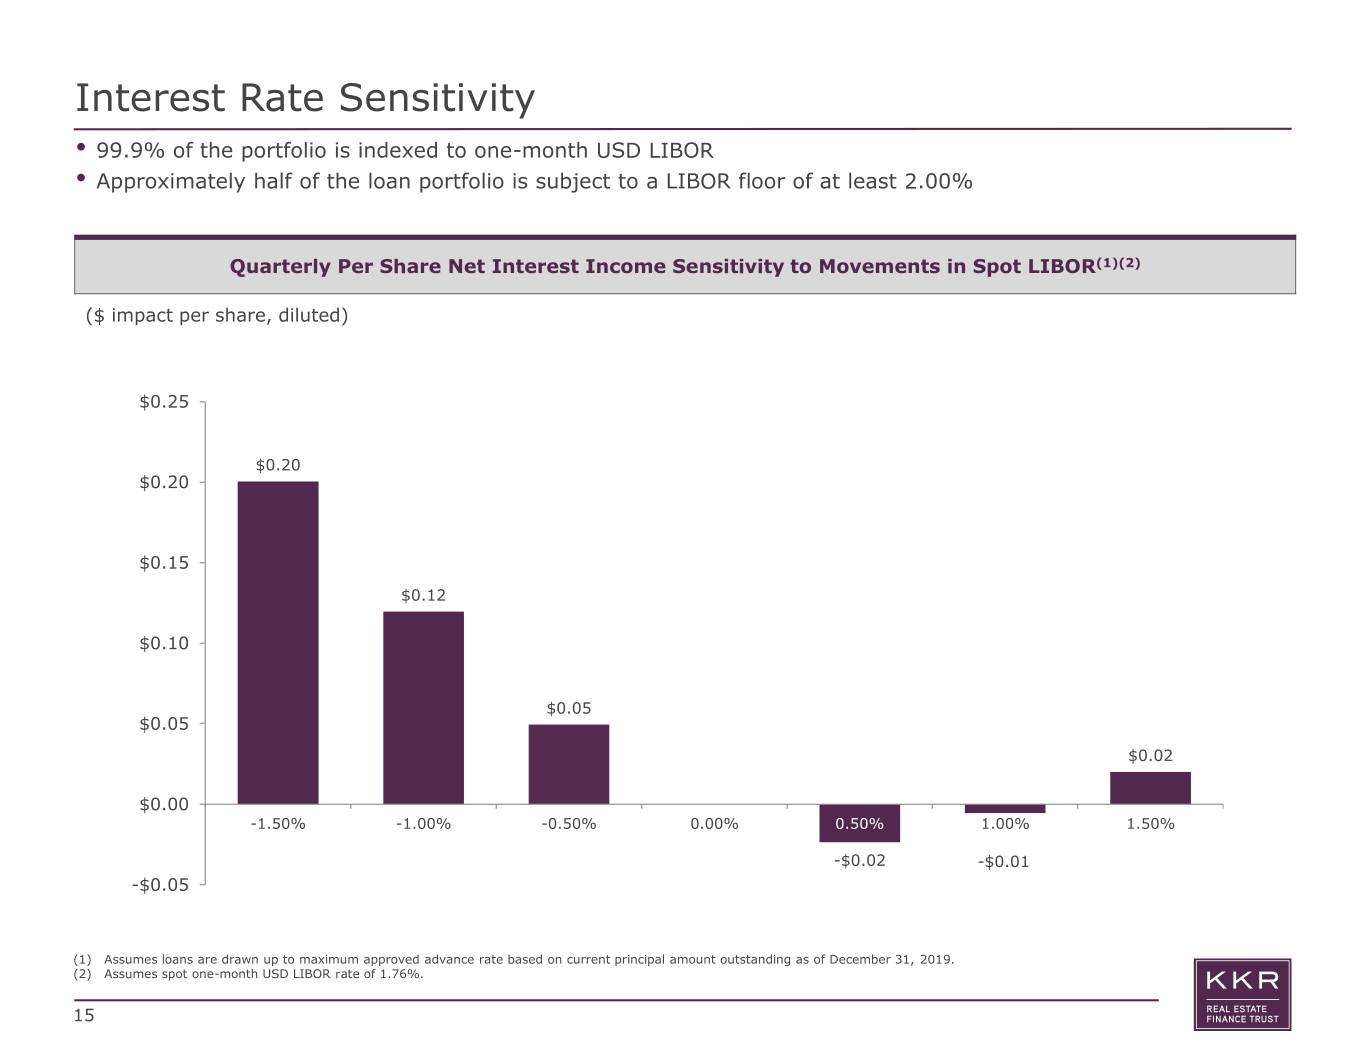
Interest Rate Sensitivity • 99.9% of the portfolio is indexed to one-month USD LIBOR • Approximately half of the loan portfolio is subject to a LIBOR floor of at least 2.00% Quarterly Per Share Net Interest Income Sensitivity to Movements in Spot LIBOR(1)(2) ($ impact per share, diluted) $0.25 $0.20 $0.20 $0.15 $0.12 $0.10 $0.05 $0.05 $0.02 $0.00 -1.50% -1.00% -0.50% 0.00% 0.50% 1.00% 1.50% -$0.02 -$0.01 -$0.05 (1) Assumes loans are drawn up to maximum approved advance rate based on current principal amount outstanding as of December 31, 2019. (2) Assumes spot one-month USD LIBOR rate of 1.76%. 15
Appendix 16
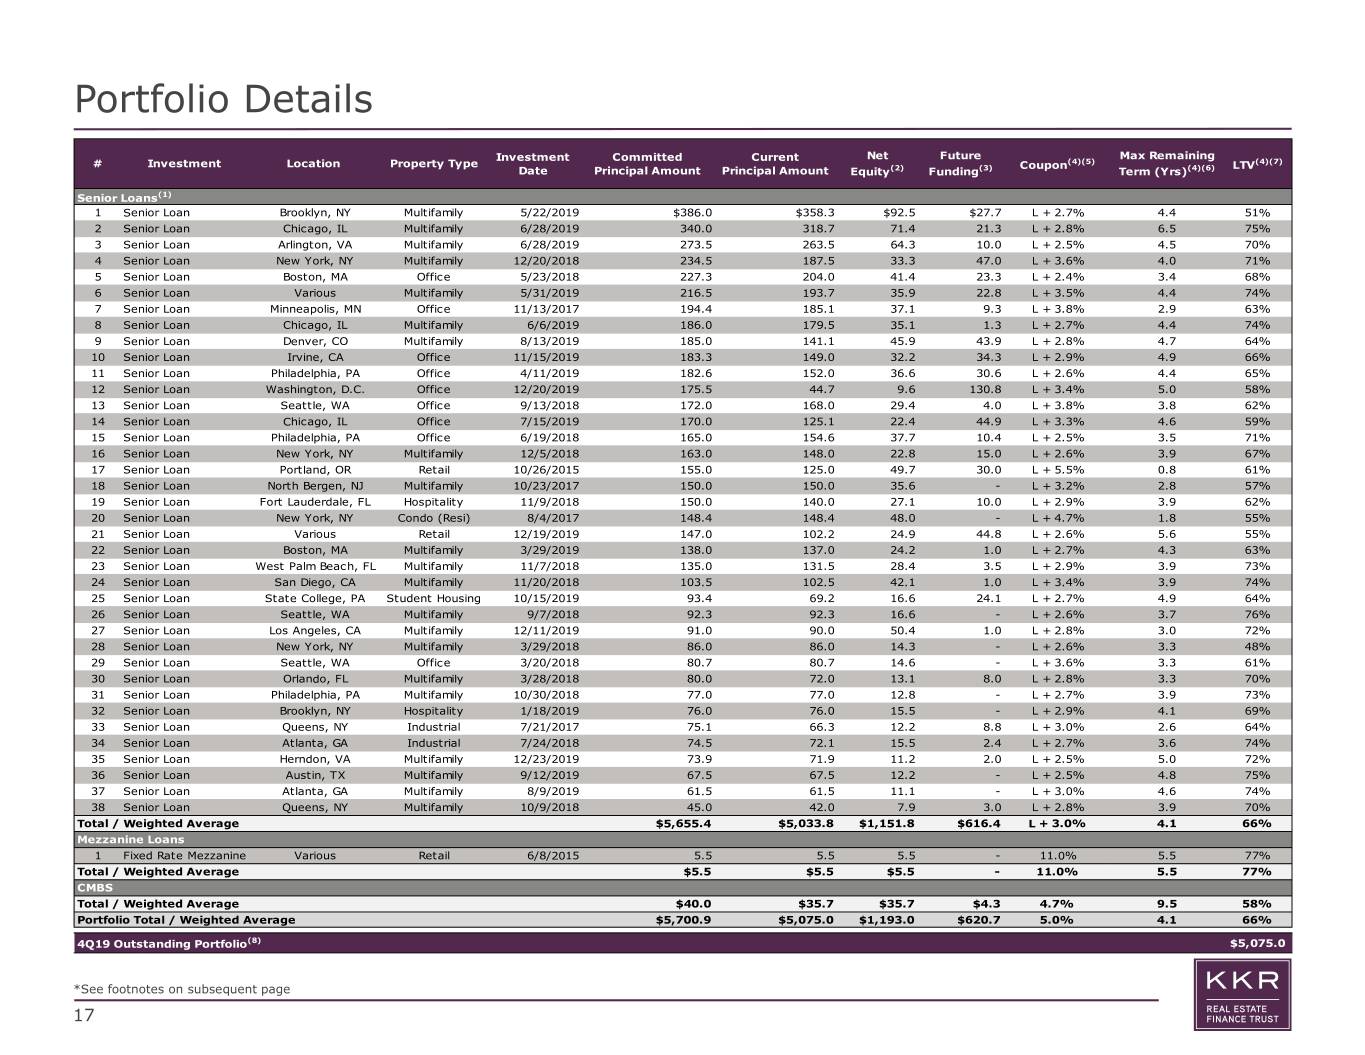
Portfolio Details ($ in millions) Investment Committed Current Net Future Max Remaining # Investment Location Property Type Coupon(4)(5) LTV(4)(7) Date Principal Amount Principal Amount Equity(2) Funding(3) Term (Yrs)(4)(6) Senior Loans(1) 1 Senior Loan Brooklyn, NY Multifamily 5/22/2019 $386.0 $358.3 $92.5 $27.7 L + 2.7% 4.4 51% 2 Senior Loan Chicago, IL Multifamily 6/28/2019 340.0 318.7 71.4 21.3 L + 2.8% 6.5 75% 3 Senior Loan Arlington, VA Multifamily 6/28/2019 273.5 263.5 64.3 10.0 L + 2.5% 4.5 70% 4 Senior Loan New York, NY Multifamily 12/20/2018 234.5 187.5 33.3 47.0 L + 3.6% 4.0 71% 5 Senior Loan Boston, MA Office 5/23/2018 227.3 204.0 41.4 23.3 L + 2.4% 3.4 68% 6 Senior Loan Various Multifamily 5/31/2019 216.5 193.7 35.9 22.8 L + 3.5% 4.4 74% 7 Senior Loan Minneapolis, MN Office 11/13/2017 194.4 185.1 37.1 9.3 L + 3.8% 2.9 63% 8 Senior Loan Chicago, IL Multifamily 6/6/2019 186.0 179.5 35.1 1.3 L + 2.7% 4.4 74% 9 Senior Loan Denver, CO Multifamily 8/13/2019 185.0 141.1 45.9 43.9 L + 2.8% 4.7 64% 10 Senior Loan Irvine, CA Office 11/15/2019 183.3 149.0 32.2 34.3 L + 2.9% 4.9 66% 11 Senior Loan Philadelphia, PA Office 4/11/2019 182.6 152.0 36.6 30.6 L + 2.6% 4.4 65% 12 Senior Loan Washington, D.C. Office 12/20/2019 175.5 44.7 9.6 130.8 L + 3.4% 5.0 58% 13 Senior Loan Seattle, WA Office 9/13/2018 172.0 168.0 29.4 4.0 L + 3.8% 3.8 62% 14 Senior Loan Chicago, IL Office 7/15/2019 170.0 125.1 22.4 44.9 L + 3.3% 4.6 59% 15 Senior Loan Philadelphia, PA Office 6/19/2018 165.0 154.6 37.7 10.4 L + 2.5% 3.5 71% 16 Senior Loan New York, NY Multifamily 12/5/2018 163.0 148.0 22.8 15.0 L + 2.6% 3.9 67% 17 Senior Loan Portland, OR Retail 10/26/2015 155.0 125.0 49.7 30.0 L + 5.5% 0.8 61% 18 Senior Loan North Bergen, NJ Multifamily 10/23/2017 150.0 150.0 35.6 - L + 3.2% 2.8 57% 19 Senior Loan Fort Lauderdale, FL Hospitality 11/9/2018 150.0 140.0 27.1 10.0 L + 2.9% 3.9 62% 20 Senior Loan New York, NY Condo (Resi) 8/4/2017 148.4 148.4 48.0 - L + 4.7% 1.8 55% 21 Senior Loan Various Retail 12/19/2019 147.0 102.2 24.9 44.8 L + 2.6% 5.6 55% 22 Senior Loan Boston, MA Multifamily 3/29/2019 138.0 137.0 24.2 1.0 L + 2.7% 4.3 63% 23 Senior Loan West Palm Beach, FL Multifamily 11/7/2018 135.0 131.5 28.4 3.5 L + 2.9% 3.9 73% 24 Senior Loan San Diego, CA Multifamily 11/20/2018 103.5 102.5 42.1 1.0 L + 3.4% 3.9 74% 25 Senior Loan State College, PA Student Housing 10/15/2019 93.4 69.2 16.6 24.1 L + 2.7% 4.9 64% 26 Senior Loan Seattle, WA Multifamily 9/7/2018 92.3 92.3 16.6 - L + 2.6% 3.7 76% 27 Senior Loan Los Angeles, CA Multifamily 12/11/2019 91.0 90.0 50.4 1.0 L + 2.8% 3.0 72% 28 Senior Loan New York, NY Multifamily 3/29/2018 86.0 86.0 14.3 - L + 2.6% 3.3 48% 29 Senior Loan Seattle, WA Office 3/20/2018 80.7 80.7 14.6 - L + 3.6% 3.3 61% 30 Senior Loan Orlando, FL Multifamily 3/28/2018 80.0 72.0 13.1 8.0 L + 2.8% 3.3 70% 31 Senior Loan Philadelphia, PA Multifamily 10/30/2018 77.0 77.0 12.8 - L + 2.7% 3.9 73% 32 Senior Loan Brooklyn, NY Hospitality 1/18/2019 76.0 76.0 15.5 - L + 2.9% 4.1 69% 33 Senior Loan Queens, NY Industrial 7/21/2017 75.1 66.3 12.2 8.8 L + 3.0% 2.6 64% 34 Senior Loan Atlanta, GA Industrial 7/24/2018 74.5 72.1 15.5 2.4 L + 2.7% 3.6 74% 35 Senior Loan Herndon, VA Multifamily 12/23/2019 73.9 71.9 11.2 2.0 L + 2.5% 5.0 72% 36 Senior Loan Austin, TX Multifamily 9/12/2019 67.5 67.5 12.2 - L + 2.5% 4.8 75% 37 Senior Loan Atlanta, GA Multifamily 8/9/2019 61.5 61.5 11.1 - L + 3.0% 4.6 74% 38 Senior Loan Queens, NY Multifamily 10/9/2018 45.0 42.0 7.9 3.0 L + 2.8% 3.9 70% Total / Weighted Average $5,655.4 $5,033.8 $1,151.8 $616.4 L + 3.0% 4.1 66% Mezzanine Loans 1 Fixed Rate Mezzanine Various Retail 6/8/2015 5.5 5.5 5.5 - 11.0% 5.5 77% Total / Weighted Average $5.5 $5.5 $5.5 - 11.0% 5.5 77% CMBS Total / Weighted Average $40.0 $35.7 $35.7 $4.3 4.7% 9.5 58% Portfolio Total / Weighted Average $5,700.9 $5,075.0 $1,193.0 $620.7 5.0% 4.1 66% 4Q19 Outstanding Portfolio(8) $5,075.0 *See footnotes on subsequent page 17
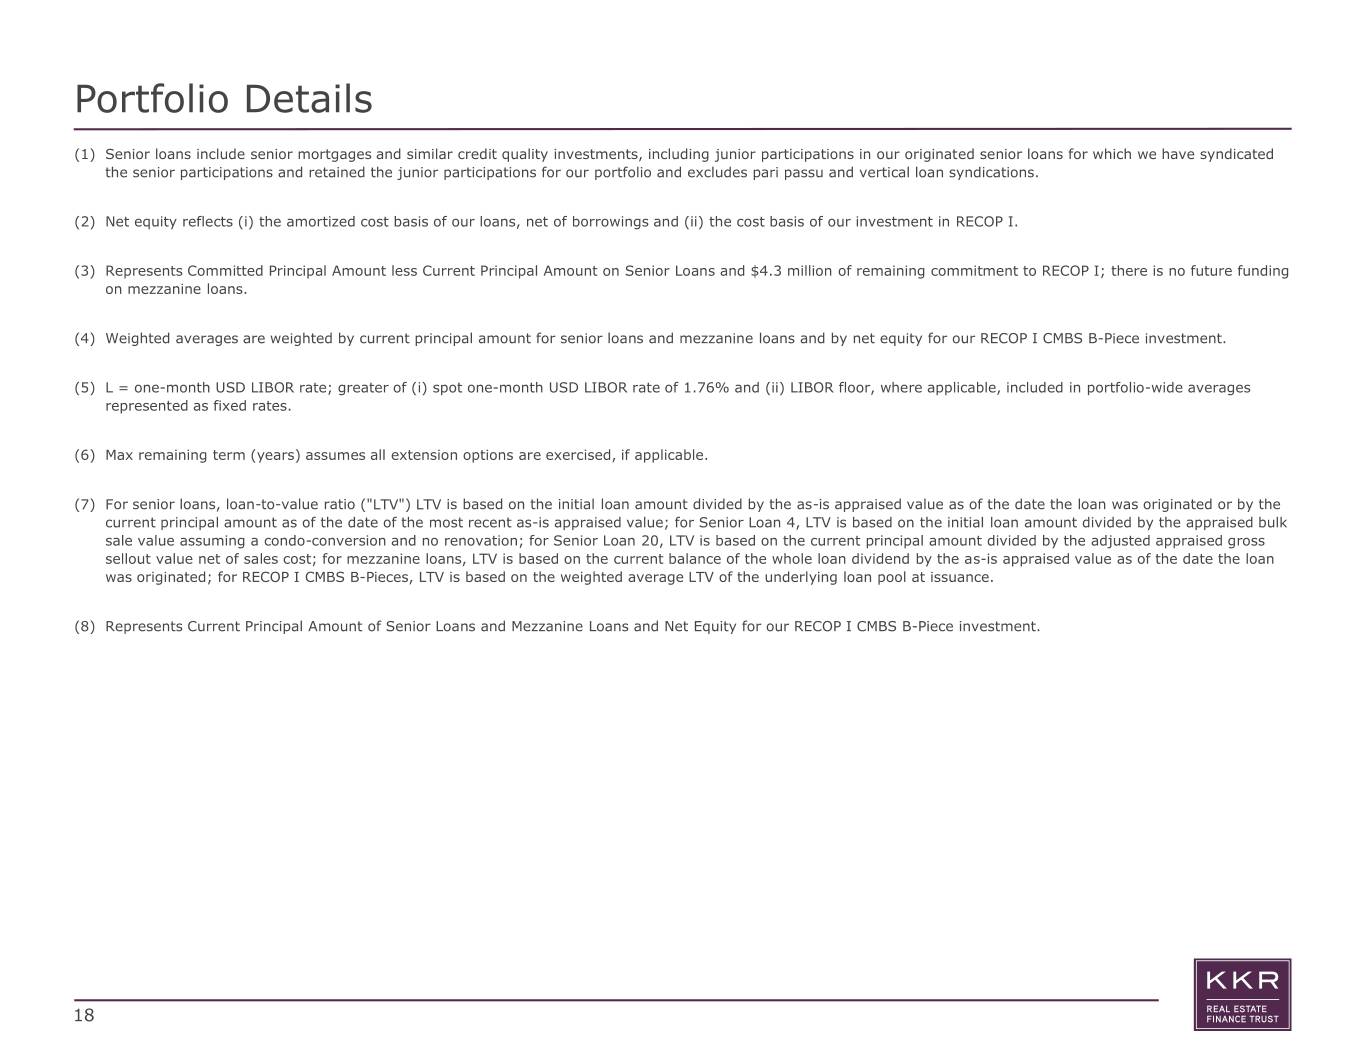
Portfolio Details (1) Senior loans include senior mortgages and similar credit quality investments, including junior participations in our originated senior loans for which we have syndicated the senior participations and retained the junior participations for our portfolio and excludes pari passu and vertical loan syndications. (2) Net equity reflects (i) the amortized cost basis of our loans, net of borrowings and (ii) the cost basis of our investment in RECOP I. (3) Represents Committed Principal Amount less Current Principal Amount on Senior Loans and $4.3 million of remaining commitment to RECOP I; there is no future funding on mezzanine loans. (4) Weighted averages are weighted by current principal amount for senior loans and mezzanine loans and by net equity for our RECOP I CMBS B-Piece investment. (5) L = one-month USD LIBOR rate; greater of (i) spot one-month USD LIBOR rate of 1.76% and (ii) LIBOR floor, where applicable, included in portfolio-wide averages represented as fixed rates. (6) Max remaining term (years) assumes all extension options are exercised, if applicable. (7) For senior loans, loan-to-value ratio ("LTV") LTV is based on the initial loan amount divided by the as-is appraised value as of the date the loan was originated or by the current principal amount as of the date of the most recent as-is appraised value; for Senior Loan 4, LTV is based on the initial loan amount divided by the appraised bulk sale value assuming a condo-conversion and no renovation; for Senior Loan 20, LTV is based on the current principal amount divided by the adjusted appraised gross sellout value net of sales cost; for mezzanine loans, LTV is based on the current balance of the whole loan dividend by the as-is appraised value as of the date the loan was originated; for RECOP I CMBS B-Pieces, LTV is based on the weighted average LTV of the underlying loan pool at issuance. (8) Represents Current Principal Amount of Senior Loans and Mezzanine Loans and Net Equity for our RECOP I CMBS B-Piece investment. 18

Fully Extended Loan Maturities • Fully extended weighted average loan maturity of 4.1 years(1) Fully Extended Loan Maturities(1) ($ in Millions) $2,500 $2,160.9 $2,000 $1,660.6 $1,500 $1,000 $500 $401.3 $318.7 $224.3 $125.0 $148.4 $0 2020 2021 2022 2023 2024 2025 2026 Fully extended maturity (1) Excludes RECOP I CMBS B-Piece investment. 19

Consolidated Balance Sheets (in thousands - except share and per share data) December 31, 2019 December 31, 2018 Assets Cash and cash equivalents $ 67,619 $ 86,531 Commercial mortgage loans, held-for-investment, net 4,931,042 4,001,820 Equity method investments 37,469 30,734 Accrued interest receivable 16,305 16,178 Other assets 4,583 3,596 Commercial mortgage loans held in variable interest entities, at fair value - 1,092,986 Total Assets $ 5,057,018 $ 5,231,845 Liabilities and Equity Liabilities Secured financing agreements, net $ 2,884,887 $ 1,951,049 Collateralized loan obligation, net 803,376 800,346 Convertible notes, net 139,075 137,688 Loan participations sold, net 64,966 85,465 Accounts payable, accrued expenses and other liabilities 3,363 4,529 Dividends payable 25,036 25,097 Accrued interest payable 6,686 7,516 Due to affiliates 5,917 4,712 Variable interest entity liabilities, at fair value - 1,080,255 Total Liabilities 3,933,306 4,096,657 Commitments and Contingencies Temporary Equity Redeemable preferred stock 1,694 2,846 Permanent Equity Preferred stock, 50,000,000 authorized (1 share with par value of $0.01 issued and outstanding as of - - December 31, 2019 and 2018, respectively) Common stock, 300,000,000 authorized (57,486,583 and 57,596,217 shares with par value of $0.01 issued and 575 576 outstanding as of December 31, 2019 and 2018, respectively) Additional paid-in capital 1,165,995 1,163,845 Accumulated deficit (8,594) (225) Repurchased stock, 1,862,689 and 1,649,880 shares repurchased as of December 31, 2019 and 2018, (35,958) (31,854) respectively Total KKR Real Estate Finance Trust Inc. stockholders’ equity 1,122,018 1,132,342 Total Permanent Equity 1,122,018 1,132,342 Total Liabilities and Equity $ 5,057,018 $ 5,231,845 20
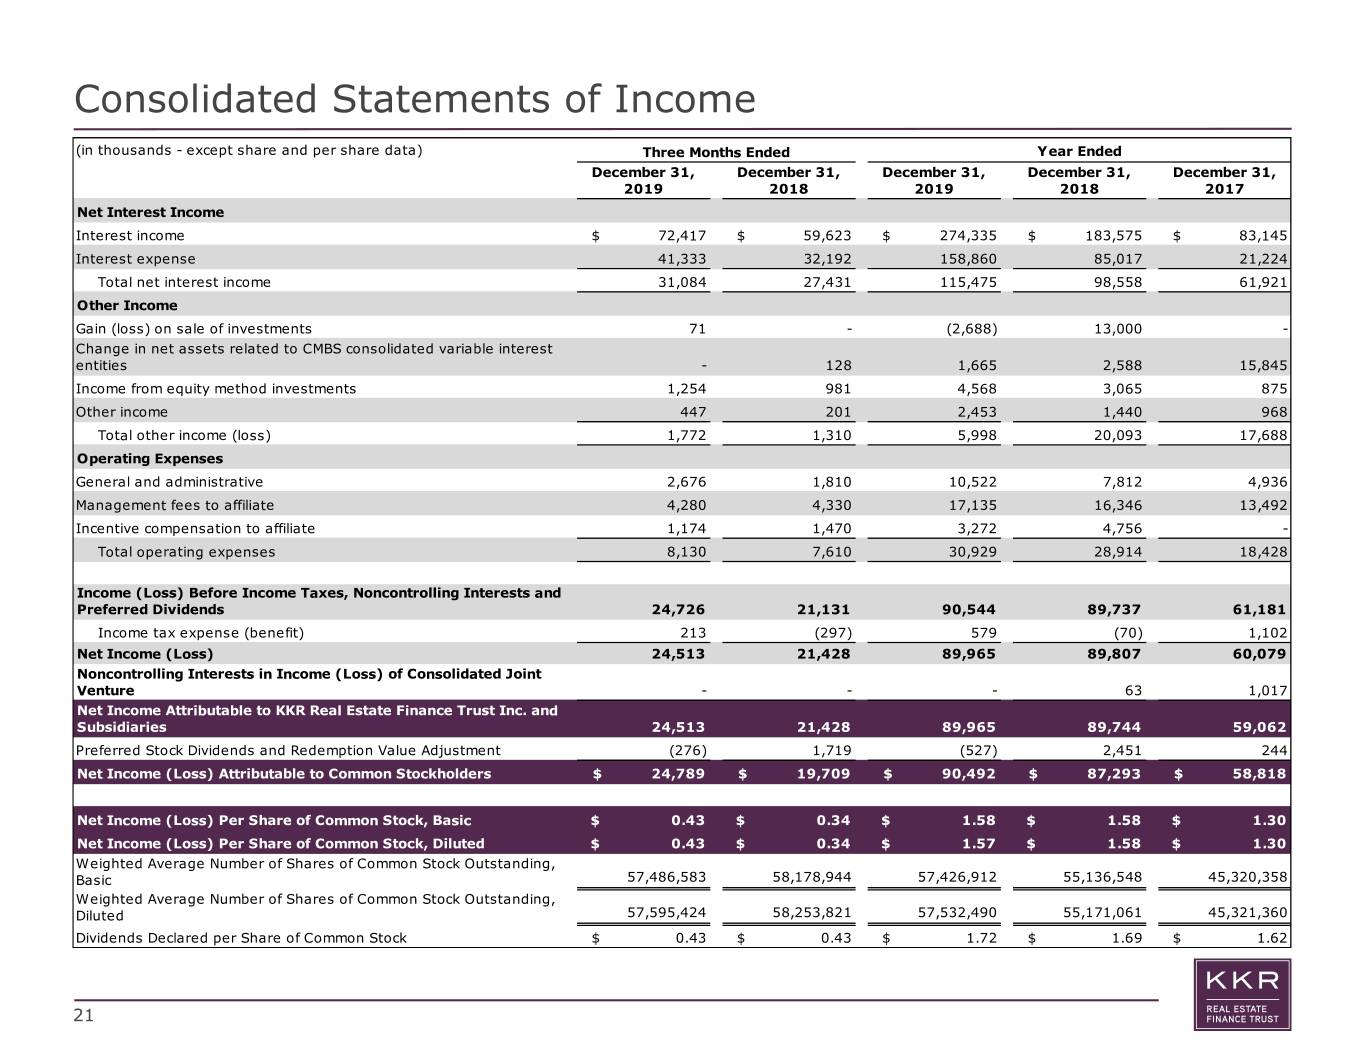
Consolidated Statements of Income (in thousands - except share and per share data) Three Months Ended Year Ended December 31, December 31, December 31, December 31, December 31, 2019 2018 2019 2018 2017 Net Interest Income Interest income $ 72,417 $ 59,623 $ 274,335 $ 183,575 $ 83,145 Interest expense 41,333 32,192 158,860 85,017 21,224 Total net interest income 31,084 27,431 115,475 98,558 61,921 Other Income Gain (loss) on sale of investments 71 - (2,688) 13,000 - Change in net assets related to CMBS consolidated variable interest entities - 128 1,665 2,588 15,845 Income from equity method investments 1,254 981 4,568 3,065 875 Other income 447 201 2,453 1,440 968 Total other income (loss) 1,772 1,310 5,998 20,093 17,688 Operating Expenses General and administrative 2,676 1,810 10,522 7,812 4,936 Management fees to affiliate 4,280 4,330 17,135 16,346 13,492 Incentive compensation to affiliate 1,174 1,470 3,272 4,756 - Total operating expenses 8,130 7,610 30,929 28,914 18,428 Income (Loss) Before Income Taxes, Noncontrolling Interests and Preferred Dividends 24,726 21,131 90,544 89,737 61,181 Income tax expense (benefit) 213 (297) 579 (70) 1,102 Net Income (Loss) 24,513 21,428 89,965 89,807 60,079 Noncontrolling Interests in Income (Loss) of Consolidated Joint Venture - - - 63 1,017 Net Income Attributable to KKR Real Estate Finance Trust Inc. and Subsidiaries 24,513 21,428 89,965 89,744 59,062 Preferred Stock Dividends and Redemption Value Adjustment (276) 1,719 (527) 2,451 244 Net Income (Loss) Attributable to Common Stockholders $ 24,789 $ 19,709 $ 90,492 $ 87,293 $ 58,818 Net Income (Loss) Per Share of Common Stock, Basic $ 0.43 $ 0.34 $ 1.58 $ 1.58 $ 1.30 Net Income (Loss) Per Share of Common Stock, Diluted $ 0.43 $ 0.34 $ 1.57 $ 1.58 $ 1.30 Weighted Average Number of Shares of Common Stock Outstanding, Basic 57,486,583 58,178,944 57,426,912 55,136,548 45,320,358 Weighted Average Number of Shares of Common Stock Outstanding, Diluted 57,595,424 58,253,821 57,532,490 55,171,061 45,321,360 Dividends Declared per Share of Common Stock $ 0.43 $ 0.43 $ 1.72 $ 1.69 $ 1.62 21

Reconciliation of GAAP Net Income to Core Earnings and Net Core Earnings 2019 4Q19 3Q19 2Q19 1Q19 ($ in thousands, except share and per share data) Net Income Attributable to Common Stockholders $ 90,492 $ 24,789 $ 23,617 $ 17,381 $ 24,705 Adjustments Non-cash equity compensation expense 4,091 1,017 1,040 1,043 991 Incentive compensation to affiliate 3,272 1,174 - 1,145 953 Unrealized (gains) or losses(1) 1,179 (407) 71 1,979 (464) Non-cash convertible notes discount amortization 360 91 91 90 89 Reversal of previously unrealized gain now realized 191 - 191 - - Core Earnings(2) $ 99,585 $ 26,664 $ 25,010 $ 21,638 $ 26,274 Weighted Average Shares Outstanding Basic 57,426,912 57,486,583 57,420,140 57,412,522 57,387,386 Diluted 57,532,490 57,595,424 57,549,066 57,507,219 57,477,234 Core Earnings per Weighted Average Share, Basic (2) $ 1.73 $ 0.46 $ 0.44 $ 0.38 $ 0.46 Core Earnings per Weighted Average Share, Diluted (2) $ 1.73 $ 0.46 $ 0.43 $ 0.38 $ 0.46 Core Earnings(2) $ 99,585 $ 26,664 $ 25,010 $ 21,638 $ 26,274 Less: Incentive compensation to affiliate 3,272 1,174 - 1,145 953 Net Core Earnings(2) $ 96,313 $ 25,490 $ 25,010 $ 20,493 $ 25,321 Net Core Earnings per Weighted Average Share, Basic (2) $ 1.68 $ 0.44 $ 0.44 $ 0.36 $ 0.44 Net Core Earnings per Weighted Average Share, Diluted (2) $ 1.67 $ 0.44 $ 0.43 $ 0.36 $ 0.44 (1) Includes $(0.4) million, $0.1 million, $(0.2) million and $(0.6) million non-cash redemption value adjustment of our SNVPS during 4Q19, 3Q19, 2Q19 and 1Q19, respectively. Includes $0.0 million, $0.0 million, $2.2 million and $0.2 million of unrealized loss on CMBS B-Pieces during 4Q19, 3Q19, 2Q19 and 1Q19, respectively. (2) See Appendix page 24 for definitions. 22
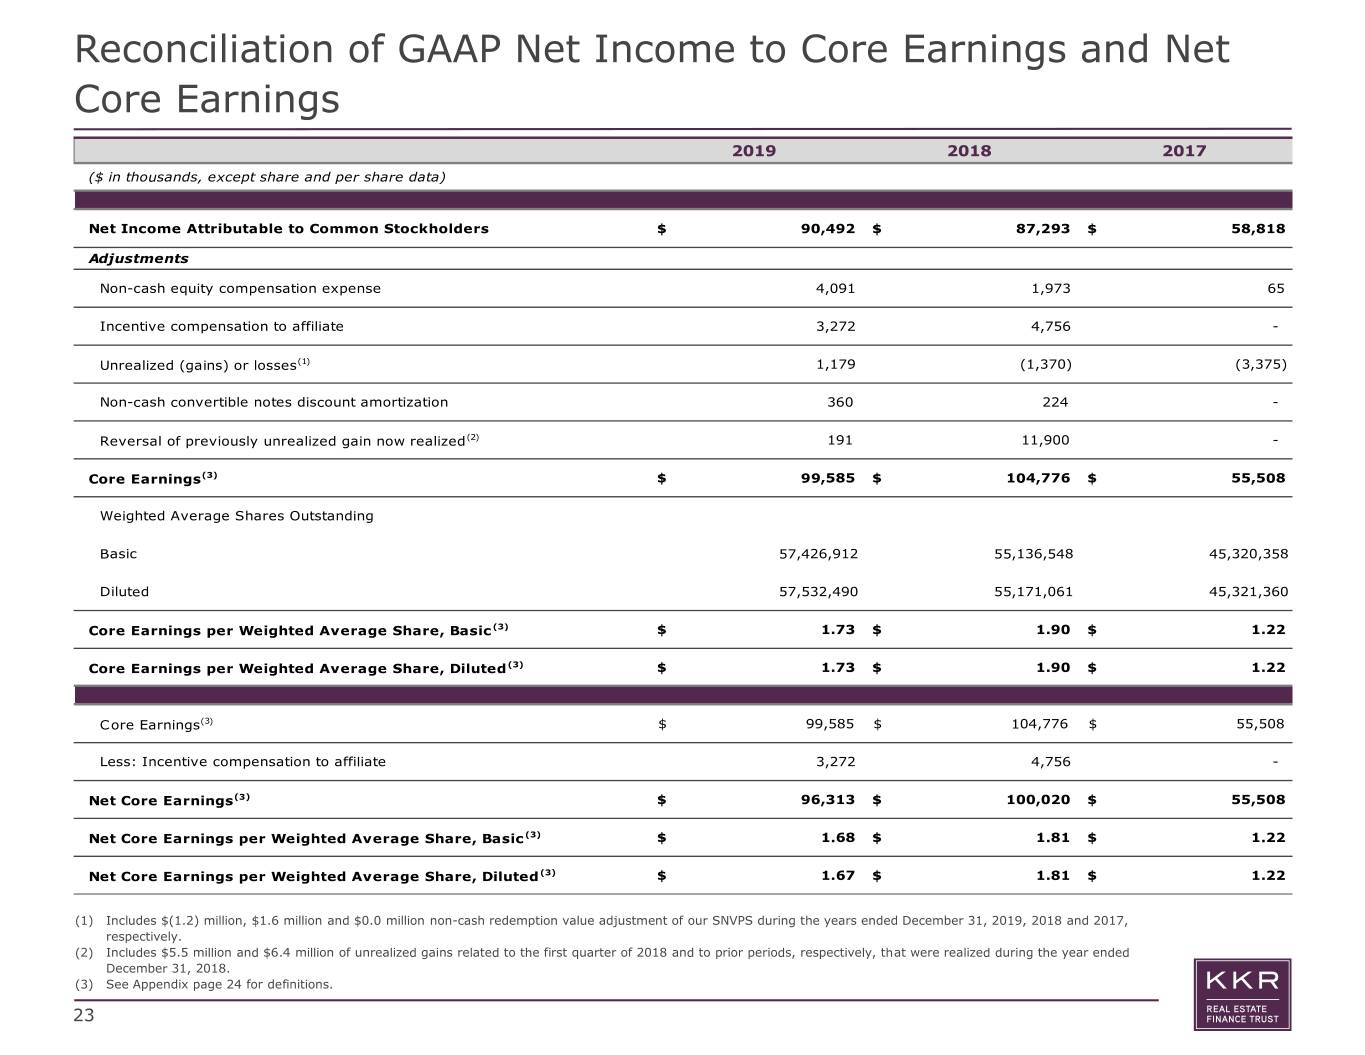
Reconciliation of GAAP Net Income to Core Earnings and Net Core Earnings 2019 2018 2017 ($ in thousands, except share and per share data) Net Income Attributable to Common Stockholders $ 90,492 $ 87,293 $ 58,818 Adjustments Non-cash equity compensation expense 4,091 1,973 65 Incentive compensation to affiliate 3,272 4,756 - Unrealized (gains) or losses(1) 1,179 (1,370) (3,375) Non-cash convertible notes discount amortization 360 224 - Reversal of previously unrealized gain now realized(2) 191 11,900 - Core Earnings(3) $ 99,585 $ 104,776 $ 55,508 Weighted Average Shares Outstanding Basic 57,426,912 55,136,548 45,320,358 Diluted 57,532,490 55,171,061 45,321,360 Core Earnings per Weighted Average Share, Basic (3) $ 1.73 $ 1.90 $ 1.22 Core Earnings per Weighted Average Share, Diluted (3) $ 1.73 $ 1.90 $ 1.22 Core Earnings(3) $ 99,585 $ 104,776 $ 55,508 Less: Incentive compensation to affiliate 3,272 4,756 - Net Core Earnings(3) $ 96,313 $ 100,020 $ 55,508 Net Core Earnings per Weighted Average Share, Basic (3) $ 1.68 $ 1.81 $ 1.22 Net Core Earnings per Weighted Average Share, Diluted (3) $ 1.67 $ 1.81 $ 1.22 (1) Includes $(1.2) million, $1.6 million and $0.0 million non-cash redemption value adjustment of our SNVPS during the years ended December 31, 2019, 2018 and 2017, respectively. (2) Includes $5.5 million and $6.4 million of unrealized gains related to the first quarter of 2018 and to prior periods, respectively, that were realized during the year ended December 31, 2018. (3) See Appendix page 24 for definitions. 23
Key Definitions • "Core Earnings" and “Net Core Earnings”: Used by the Company to evaluate the Company's performance excluding the effects of certain transactions and GAAP adjustments the Company believes are not necessarily indicative of the current loan activity and operations. The Company also uses Core Earnings to determine the management and incentive fees it pays to its Manager. Core Earnings and Net Core Earnings are measures that are not prepared in accordance with GAAP. The Company defines Core Earnings as net income (loss) attributable to stockholders or, without duplication, owners of the Company's subsidiaries, computed in accordance with GAAP, including realized losses not otherwise included in GAAP net income (loss) and excluding (i) non-cash equity compensation expense, (ii) the incentive compensation payable to the Company's Manager, (iii) depreciation and amortization, (iv) any unrealized gains or losses or other similar non-cash items that are included in net income for the applicable reporting period, regardless of whether such items are included in other comprehensive income or loss, or in net income, and (v) one-time events pursuant to changes in GAAP and certain material non-cash income or expense items after discussions between the Company's Manager and board of directors (and after approval by a majority of the independent directors). The exclusion of depreciation and amortization from the calculation of Core Earnings only applies to debt investments related to real estate to the extent the Company forecloses upon the property or properties underlying such debt investments. Net Core Earnings is Core Earnings less incentive compensation payable to the Company’s Manager. The Company believes providing Core Earnings and Net Core Earnings on a supplemental basis to net income as determined in accordance with GAAP is helpful to stockholders in assessing the overall performance of the Company's business. Core Earnings and Net Core Earnings should not be considered as substitutes for GAAP net income. The Company's methodology for calculating Core Earnings and Net Core Earnings may differ from the methodologies employed by other REITs to calculate the same or similar supplemental performance measures, and as a result, the Company's Core Earnings and Net Core Earnings may not be comparable to similar measures presented by other REITs. • “IRR”: IRR is the annualized effective compounded return rate that accounts for the time-value of money and represents the rate of return on an investment over a holding period expressed as a percentage of the investment. It is the discount rate that makes the net present value of all cash outflows (the costs of investment) equal to the net present value of cash inflows (returns on investment). It is derived from the negative and positive cash flows resulting from or produced by each transaction (or for a transaction involving more than one investment, cash flows resulting from or produced by each of the investments), whether positive, such as investment returns, or negative, such as transaction expenses or other costs of investment, taking into account the dates on which such cash flows occurred or are expected to occur, and compounding interest accordingly. The weighted average underwritten IRR for the investments shown reflects the returns underwritten by KKR Real Estate Finance Manager LLC, the Company’s external manager, taking into account certain assumptions around leverage up to no more than the maximum approved advance rate, and calculated on a weighted average basis assuming no dispositions, early prepayments or defaults but assuming that extension options are exercised and that the cost of borrowings remains constant over the remaining term. With respect to certain loans included in the weighted average underwritten IRR shown, the calculation assumes certain estimates with respect to the timing and magnitude of the initial and future fundings for the total loan commitment and associated loan repayments, and assumes no defaults. With respect to certain loans included in the weighted average underwritten IRR shown, the calculation assumes the one-month spot USD LIBOR as of the date the loan was originated. There can be no assurance that the actual weighted average IRRs will equal the weighted average underwritten IRRs shown. 24


