
Fourth Quarter & Full Year 2024 Supplemental Information FEBRUARY 3, 2025
2 Legal Disclosures This presentation has been prepared for KKR Real Estate Finance Trust Inc. (NYSE: KREF) for the benefit of its stockholders. This presentation is solely for informational purposes in connection with evaluating the business, operations and financial results of KKR Real Estate Finance Trust Inc. and its subsidiaries (collectively, "KREF“ or the “Company”). This presentation is not and shall not be construed as an offer to purchase or sell, or the solicitation of an offer to purchase or sell, any securities, any investment advice or any other service by KREF. Nothing in this presentation constitutes the provision of any tax, accounting, financial, investment, regulatory, legal or other advice by KREF or its advisors. This presentation may not be referenced, quoted or linked by website by any third party, in whole or in part, except as agreed to in writing by KREF. This presentation contains forward-looking statements within the meaning of Section 27A of the Securities Act of 1933, as amended, and Section 21E of the Securities Exchange Act of 1934, as amended, which reflect the Company’s current views with respect to, among other things, its future operations and financial performance. You can identify these forward looking statements by the use of words such as “outlook,” “believe,” “expect,” “potential,” “continue,” “may,” “should,” “seek,” “approximately,” “predict,” “intend,” “will,” “plan,” “estimate,” “anticipate,” the negative version of these words, other comparable words or other statements that do not relate strictly to historical or factual matters. By their nature, forward-looking statements speak only as of the date they are made, are not statements of historical fact or guarantees of future performance and are subject to risks, uncertainties, assumptions or changes in circumstances that are difficult to predict or quantify. The forward-looking statements are based on the Company’s beliefs, assumptions and expectations, taking into account all information currently available to it. These beliefs, assumptions and expectations can change as a result of many possible events or factors, not all of which are known to the Company or are within its control. Such forward-looking statements are subject to various risks and uncertainties, including, among other things: the general political, economic, competitive, and other conditions in the United States and in any foreign jurisdictions in which we invest; global economic trends and conditions, including heightened inflation, slower growth or recession, changes to fiscal and monetary policy, fluctuations in interest rates and credit spreads, labor shortages, currency fluctuations and challenges in global supply chains; deterioration in the performance of the properties securing our investments; difficulty accessing financing or raising capital; and the risks, uncertainties and factors set forth under Part I-Item 1A. “Risk Factors” of the Company’s Annual Report on Form 10-K for the fiscal year ended December 31, 2024, as such factors may be updated from time to time in the Company’s periodic filings with the SEC, which are accessible on the SEC’s website at www.sec.gov. Accordingly, there are or will be important factors that could cause actual outcomes or results to differ materially from those indicated in this release. These factors should not be construed as exhaustive and should be read in conjunction with the other cautionary statements and information included in this release and in the Company’s filings with the SEC. All forward-looking statements in this release speak only as of the date of this release. The Company undertakes no obligation to publicly update or review any forward-looking statements, whether as a result of new information, future developments or otherwise, except as required by law. All forward looking statements in this presentation speak only as of February 3, 2025. KREF undertakes no obligation to publicly update or review any forward-looking statements, whether as a result of new information, future developments or otherwise, except as required by law. All financial information in this presentation is as of December 31, 2024 unless otherwise indicated. This presentation also includes non-GAAP financial measures, including Distributable Earnings and Distributable Earnings per Diluted Share. Such non-GAAP financial measures should be considered only as supplemental to, and not as superior to, financial measures prepared in accordance with U.S. GAAP. Please refer to the Appendix of this presentation for a reconciliation of the non-GAAP financial measures included in this presentation to the most directly comparable financial measures prepared in accordance with U.S. GAAP.

3 KKR Real Estate Finance Trust Inc. Overview Best In Class Portfolio Conservative Balance Sheet KREF’s Manager Fully Integrated with KKR $5.9 B Loan Portfolio 100% Senior Loans 60% Multifamily & Industrial $125 M Average Loan Size(1) 100% QTD Interest Collected Senior loans secured primarily by transitional, institutional multifamily and industrial properties owned by high quality sponsors $8.0 B Financing Capacity 79% Fully Non-Mark-to-Market(2) Conservative liability management focused on diversified non-mark-to-market financing 15% KKR Ownership in KREF $685 M Current Liquidity(3) $624 B Global AUM(4) $80 B Real Estate AUM(4)(5) ~140 Real Estate Professionals(4) One firm culture that rewards investment discipline, creativity and determination and emphasizes the sharing of information, resources, expertise and best practices (1) Average loan size is inclusive of the unfunded commitment (2) Based on outstanding principal amount of secured financing. The remaining is subject to credit marks only (3) Includes $105 million of cash, $530 million of undrawn corporate revolver capacity and $50 million of available borrowings based on existing collateral (4) As of September 30, 2024 (5) Figures represent AUM across all KKR real estate transactions
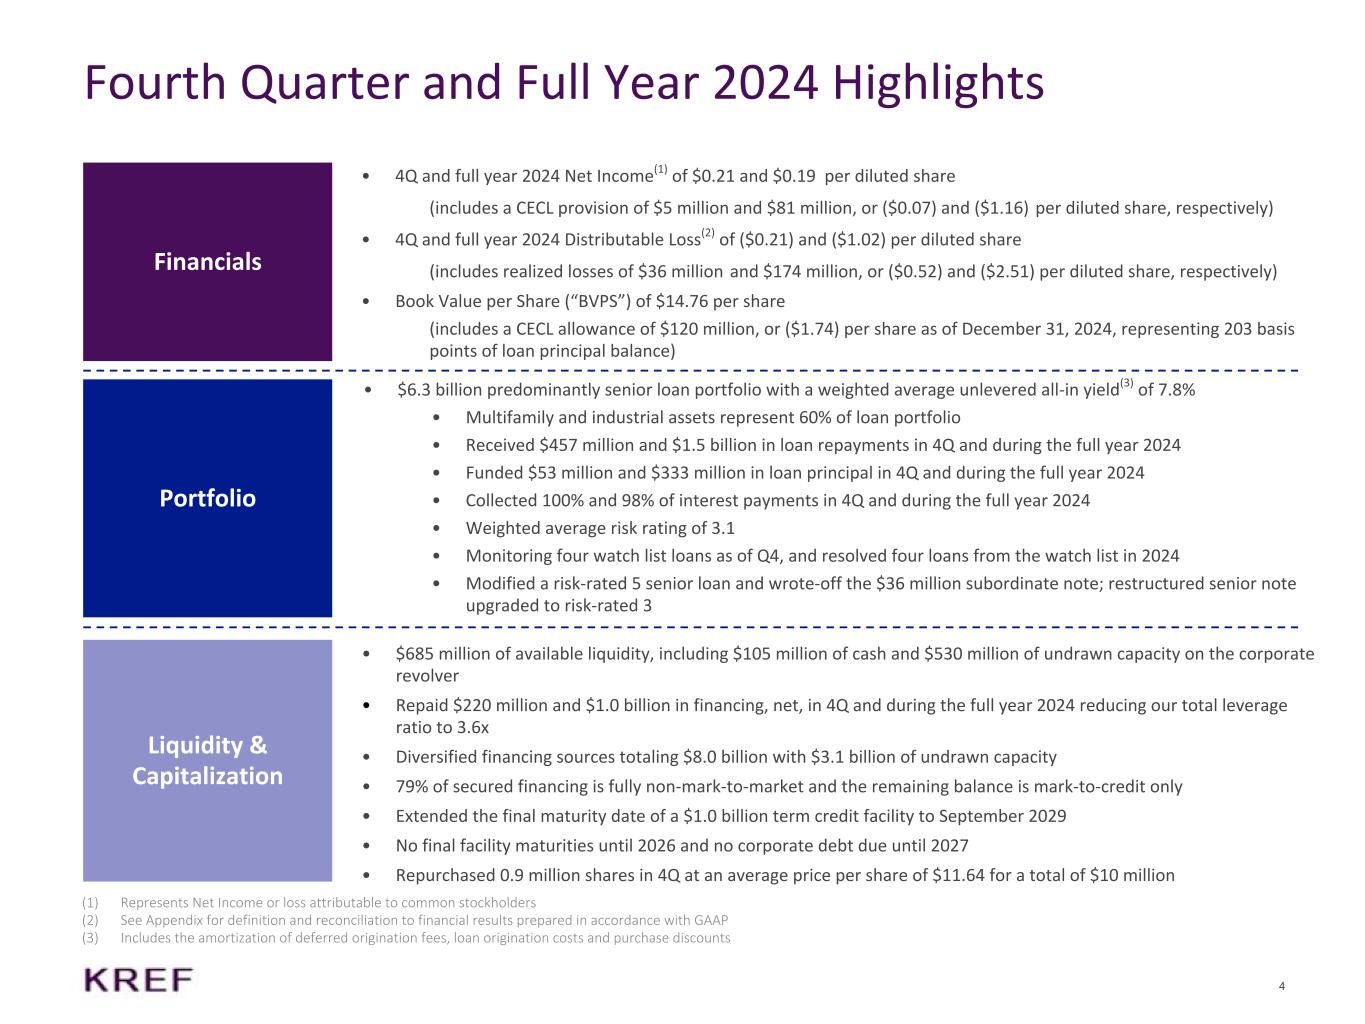
4 • 4Q and full year 2024 Net Income(1) of $0.21 and $0.19 per diluted share (includes a CECL provision of $5 million and $81 million, or ($0.07) and ($1.16) per diluted share, respectively) • 4Q and full year 2024 Distributable Loss(2) of ($0.21) and ($1.02) per diluted share (includes realized losses of $36 million and $174 million, or ($0.52) and ($2.51) per diluted share, respectively) • Book Value per Share (“BVPS”) of $14.76 per share (includes a CECL allowance of $120 million, or ($1.74) per share as of December 31, 2024, representing 203 basis points of loan principal balance) Fourth Quarter and Full Year 2024 Highlights (1) Represents Net Income or loss attributable to common stockholders (2) See Appendix for definition and reconciliation to financial results prepared in accordance with GAAP (3) Includes the amortization of deferred origination fees, loan origination costs and purchase discounts • $6.3 billion predominantly senior loan portfolio with a weighted average unlevered all-in yield(3) of 7.8% • Multifamily and industrial assets represent 60% of loan portfolio • Received $457 million and $1.5 billion in loan repayments in 4Q and during the full year 2024 • Funded $53 million and $333 million in loan principal in 4Q and during the full year 2024 • Collected 100% and 98% of interest payments in 4Q and during the full year 2024 • Weighted average risk rating of 3.1 • Monitoring four watch list loans as of Q4, and resolved four loans from the watch list in 2024 • Modified a risk-rated 5 senior loan and wrote-off the $36 million subordinate note; restructured senior note upgraded to risk-rated 3 Financials Portfolio Liquidity & Capitalization • $685 million of available liquidity, including $105 million of cash and $530 million of undrawn capacity on the corporate revolver • Repaid $220 million and $1.0 billion in financing, net, in 4Q and during the full year 2024 reducing our total leverage ratio to 3.6x • Diversified financing sources totaling $8.0 billion with $3.1 billion of undrawn capacity • 79% of secured financing is fully non-mark-to-market and the remaining balance is mark-to-credit only • Extended the final maturity date of a $1.0 billion term credit facility to September 2029 • No final facility maturities until 2026 and no corporate debt due until 2027 • Repurchased 0.9 million shares in 4Q at an average price per share of $11.64 for a total of $10 million

5 4Q'24 Financial Summary (1) See Appendix for definition and reconciliation to financial results prepared in accordance with GAAP (2) Includes real estate owned and an equity method investment (3) Book value per share includes CECL allowance of $120 million or ($1.74) per share and accumulated depreciation of $1 million or ($0.02) per share Income Statement ($ in Millions) 4Q'24 Net interest income $35.1 Other income 4.7 Provision for credit losses (4.6) Operating expenses (15.6) Preferred stock dividends (5.3) Other 0.3 Net Income Attributable to Common Stockholders $14.6 Net Income per Share, Diluted $0.21 Distributable Loss(1) ($14.7) Distributable Loss per Share, Diluted(1) ($0.21) Dividend per Share $0.25 Diluted Weighted Average Shares Outstanding 69,342,983 Balance Sheet ($ in Millions) 4Q'24 Commercial real estate loans, net $5,771.5 Real estate assets(2) 400.7 Cash 104.9 Other 73.2 Total Assets $6,350.4 Secured financing agreements, net $2,798.7 Collateralized loan obligations, net 1,766.1 Secured term loan, net 333.9 Other 52.9 Total Liabilities $4,951.5 Total Equity $1,398.9 Common Shareholders' Equity $1,017.3 Book Value per Share(3) $14.76 Common Shares Outstanding 68,713,596
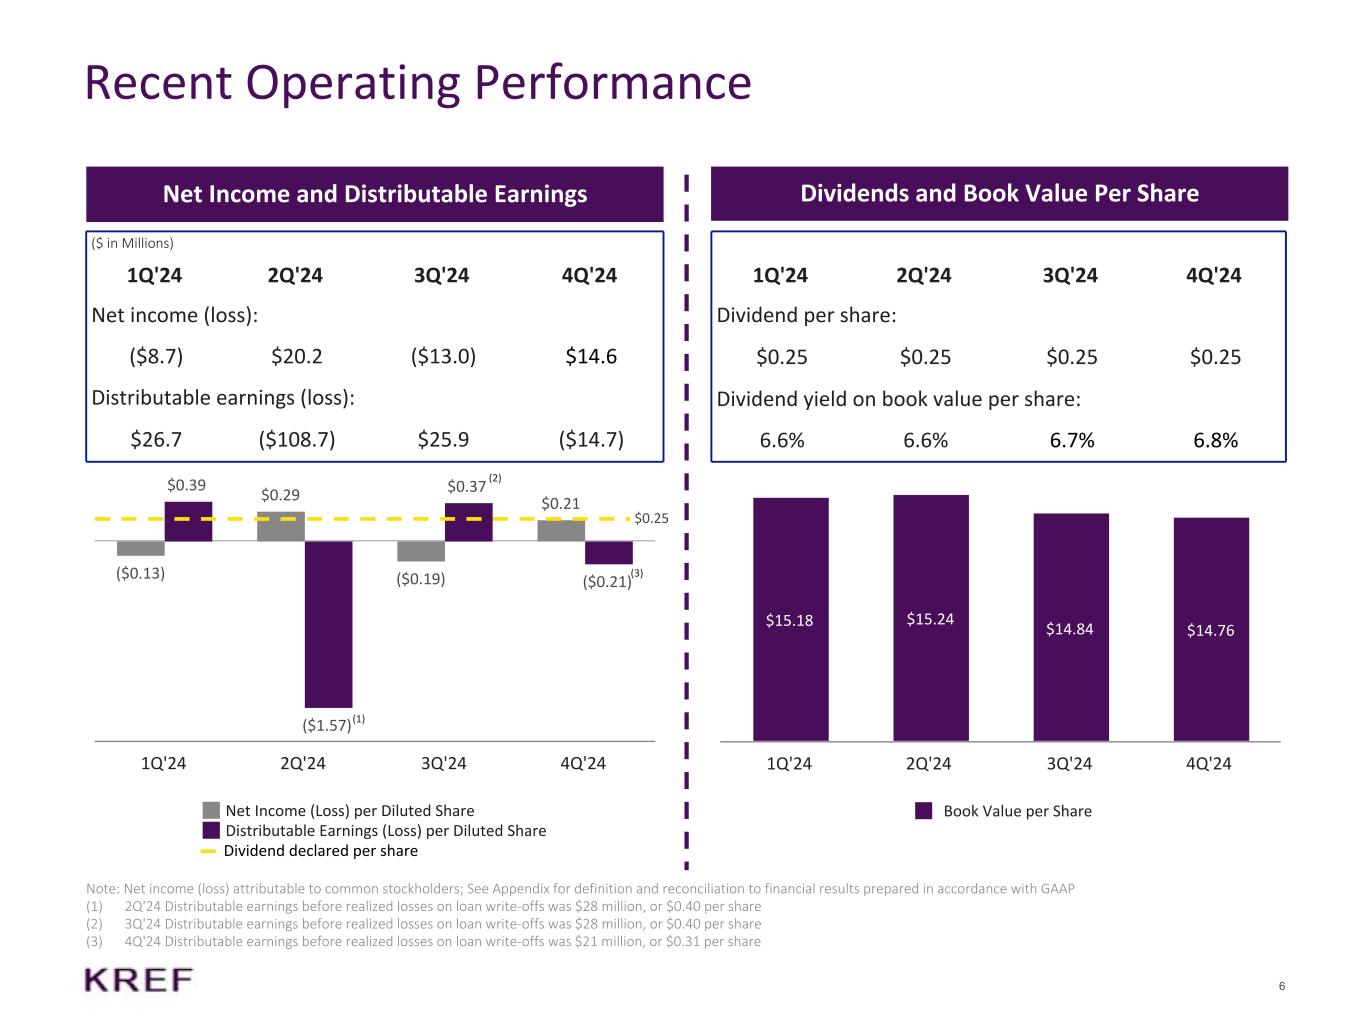
6 ($0.13) $0.29 ($0.19) $0.21 $0.39 ($1.57) $0.37 ($0.21) Net Income (Loss) per Diluted Share Distributable Earnings (Loss) per Diluted Share 1Q'24 2Q'24 3Q'24 4Q'24 Recent Operating Performance Note: Net income (loss) attributable to common stockholders; See Appendix for definition and reconciliation to financial results prepared in accordance with GAAP (1) 2Q'24 Distributable earnings before realized losses on loan write-offs was $28 million, or $0.40 per share (2) 3Q'24 Distributable earnings before realized losses on loan write-offs was $28 million, or $0.40 per share (3) 4Q'24 Distributable earnings before realized losses on loan write-offs was $21 million, or $0.31 per share Net Income and Distributable Earnings Dividends and Book Value Per Share ($ in Millions) 1Q'24 2Q'24 3Q'24 4Q'24 Net income (loss): ($8.7) $20.2 ($13.0) $14.6 Distributable earnings (loss): $26.7 ($108.7) $25.9 ($14.7) 1Q'24 2Q'24 3Q'24 4Q'24 Dividend per share: $0.25 $0.25 $0.25 $0.25 Dividend yield on book value per share: 6.6% 6.6% 6.7% 6.8% $15.18 $15.24 $14.84 $14.76 Book Value per Share 1Q'24 2Q'24 3Q'24 4Q'24 (2) Dividend declared per share (3) (1) $0.25

7 Class-A 72% Class-B 28% KREF Loan Portfolio by the Numbers (1) Includes loans, real estate owned and equity method investments (2) KREF classifies a loan as life science if more than 50% of the gross leasable area is leased to, or will be converted to, life science-related space (3) “Other” property types include: 2% Self-Storage, 2% Student Housing and 1% Mixed Use (4) Office property certification % is based on current principal loan balance; see description for LEED certification in the Appendix Geography Investment Type Property Type Interest Rate TypeTotal Portfolio(1) 4% 9% 9% 15% 17% 13% Other <4%: 14% ($ in Millions) 100% Office(4)5% Washington, D.C. $4,998 $6,792 $7,916 $7,752 $6,272 4Q'20 4Q'21 4Q'22 4Q'23 4Q'24 Senior Loans 100% Floating 99% Fixed 1% Multifamily Class-A 90% Class-B 10% Multifamily 47% Office 19% Industrial 13% Life Science 12% Hospitality 4% Other 5% (2) (3) 5% 4% 5%
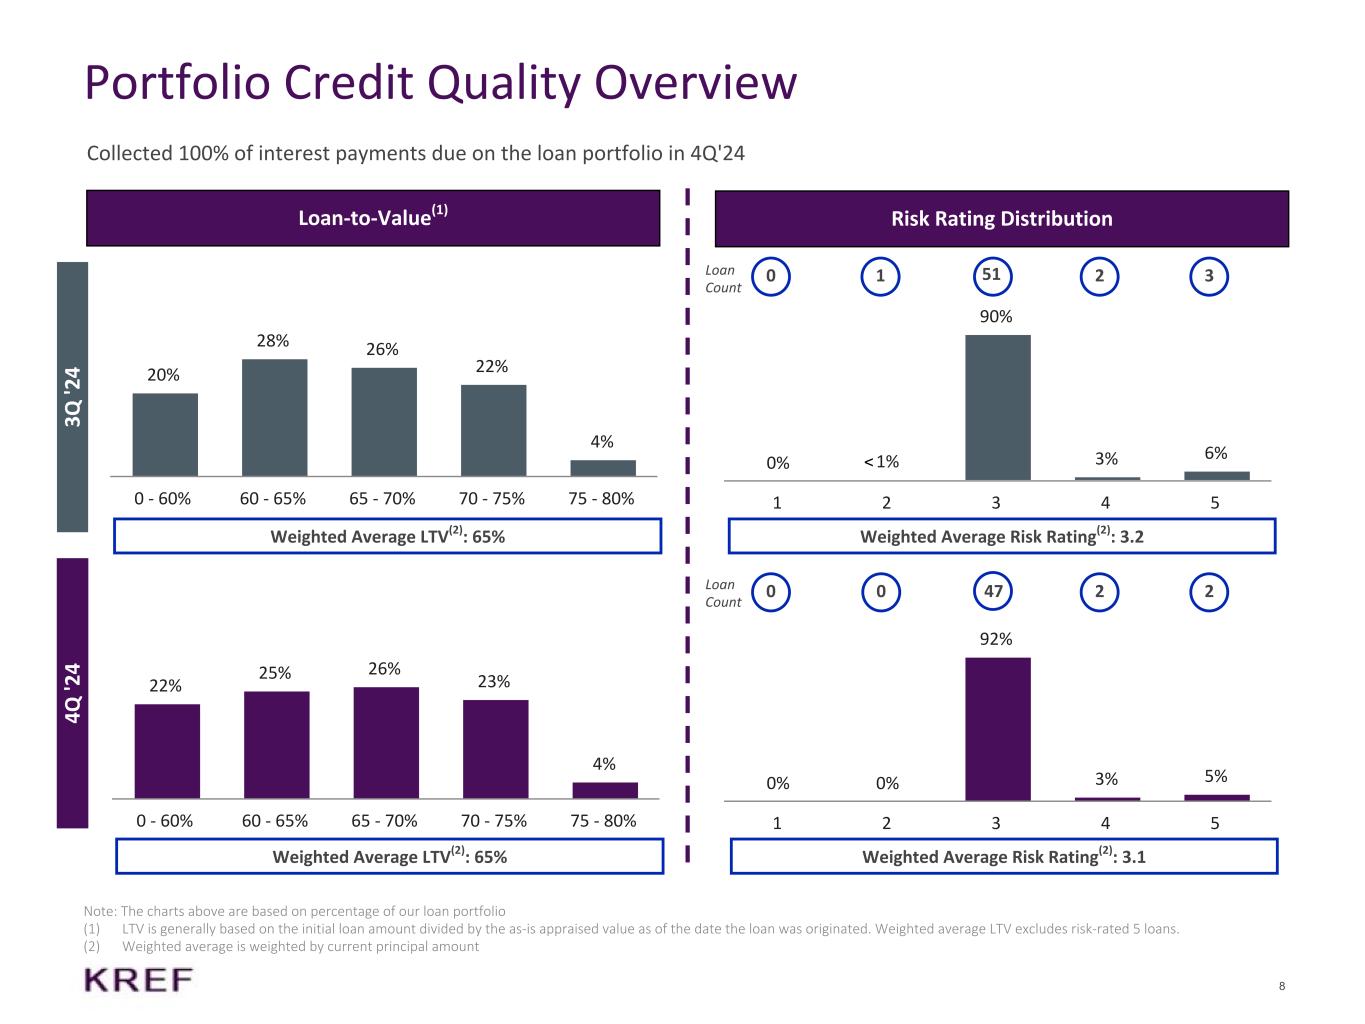
8 0% 1% 90% 3% 6% 1 2 3 4 5 Weighted Average Risk Rating(2): 3.1 Portfolio Credit Quality Overview Note: The charts above are based on percentage of our loan portfolio (1) LTV is generally based on the initial loan amount divided by the as-is appraised value as of the date the loan was originated. Weighted average LTV excludes risk-rated 5 loans. (2) Weighted average is weighted by current principal amount Collected 100% of interest payments due on the loan portfolio in 4Q'24 Loan-to-Value(1) Risk Rating Distribution Weighted Average LTV(2): 65% Loan Count 4Q '2 4 Weighted Average LTV(2): 65% Weighted Average Risk Rating(2): 3.2 3Q '2 4 20% 28% 26% 22% 4% 0 - 60% 60 - 65% 65 - 70% 70 - 75% 75 - 80% 22% 25% 26% 23% 4% 0 - 60% 60 - 65% 65 - 70% 70 - 75% 75 - 80% 0 1 2 351 0 0 2 247Loan Count 0% 0% 92% 3% 5% 1 2 3 4 5 <
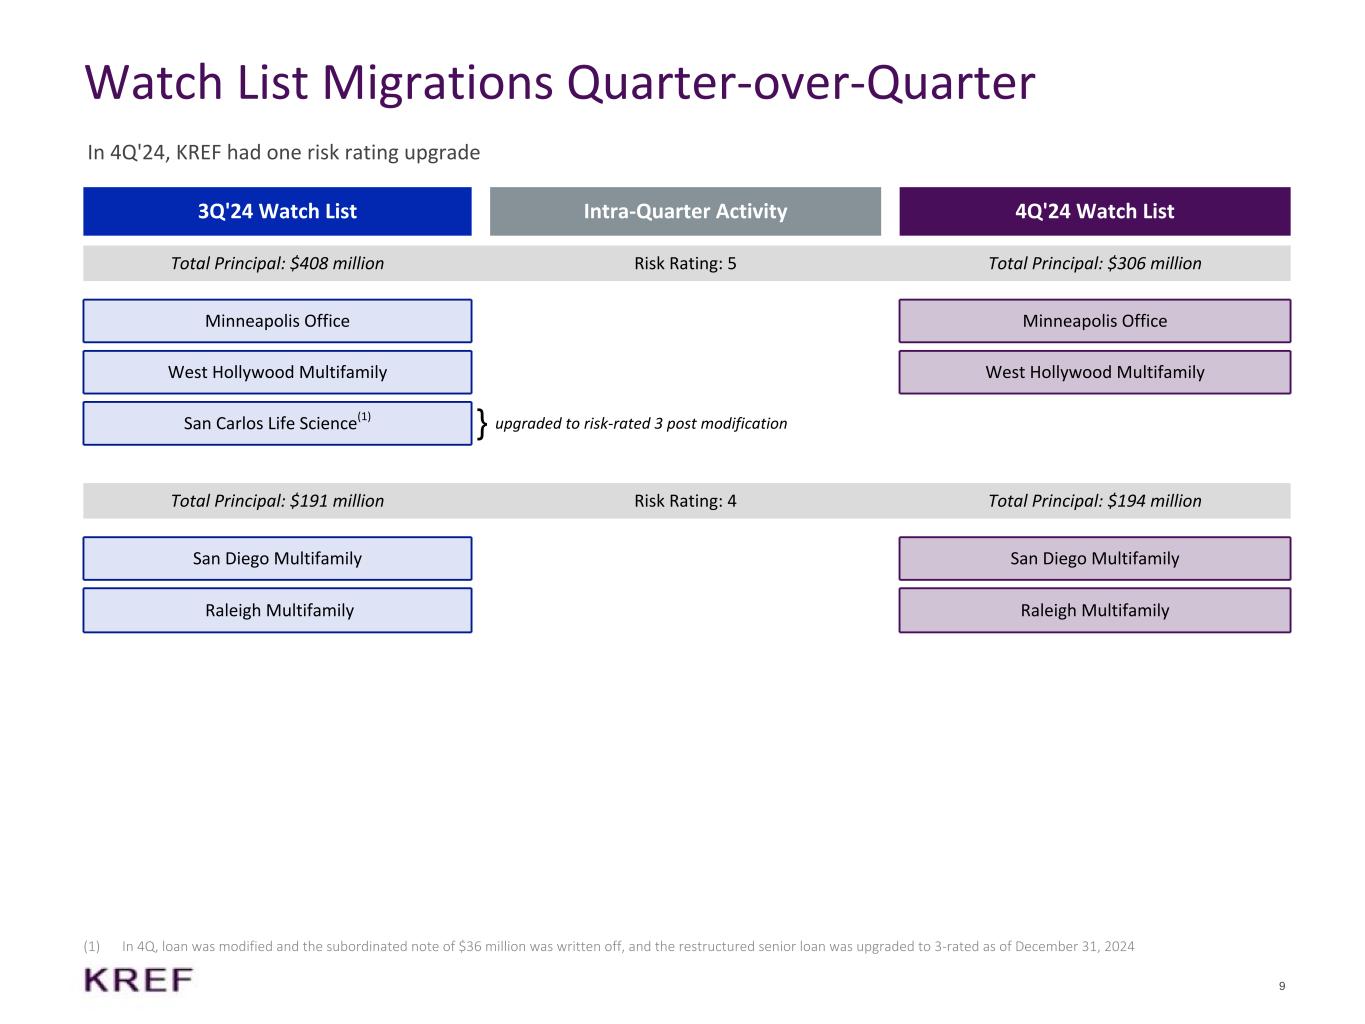
9 Watch List Migrations Quarter-over-Quarter In 4Q'24, KREF had one risk rating upgrade 3Q'24 Watch List Intra-Quarter Activity 4Q'24 Watch List Total Principal: $408 million Risk Rating: 5 Total Principal: $306 million Minneapolis Office Minneapolis Office West Hollywood Multifamily West Hollywood Multifamily San Carlos Life Science(1) } upgraded to risk-rated 3 post modification Total Principal: $191 million Risk Rating: 4 Total Principal: $194 million San Diego Multifamily San Diego Multifamily Raleigh Multifamily Raleigh Multifamily (1) In 4Q, loan was modified and the subordinated note of $36 million was written off, and the restructured senior loan was upgraded to 3-rated as of December 31, 2024

10 Case Studies: Watch List Loans Investment Minneapolis Office West Hollywood Multifamily San Diego Multifamily Raleigh Multifamily Loan Type Floating-Rate Senior Loan(1) Floating-Rate Senior Loan Floating-Rate Senior Loan Floating-Rate Senior Loan Investment Date November 2017 January 2022 October 2021 April 2022 Collateral Two Class-A Office Buildings totaling 1.1mm SF 37-unit Class-A Multifamily 231-unit Class-A Multifamily 320-unit Class-B Multifamily Loan Purpose Refinance Refinance Refinance Acquisition Location Minneapolis, MN West Hollywood, CA San Diego, CA Raleigh, NC Committed Amount $199 million(1) $112 million $114 million $92 million Current Principal Amount $194 million(1) $111 million $109 million $84 million Loan Basis(2) $182 / SF $3,009,145 / unit $472,996 / unit $263,594 / unit Coupon + 2.3%(1) + 3.1% + 3.4% + 3.2% Max Remaining Term (Yrs.) 0.5 2.1 1.9 2.3 Loan Risk Rating 5 5 4 4 (1) The total whole loan was $199 million, including (i) a fully funded senior mortgage loan of $120 million, at an interest rate of S+2.3% and (ii) a mezzanine note with a commitment of $79 million, of which $74 million was funded as of December 31, 2024, at a fixed PIK interest rate of 4.5% (2) Loan basis reflects outstanding current principal amount before any CECL adjustments
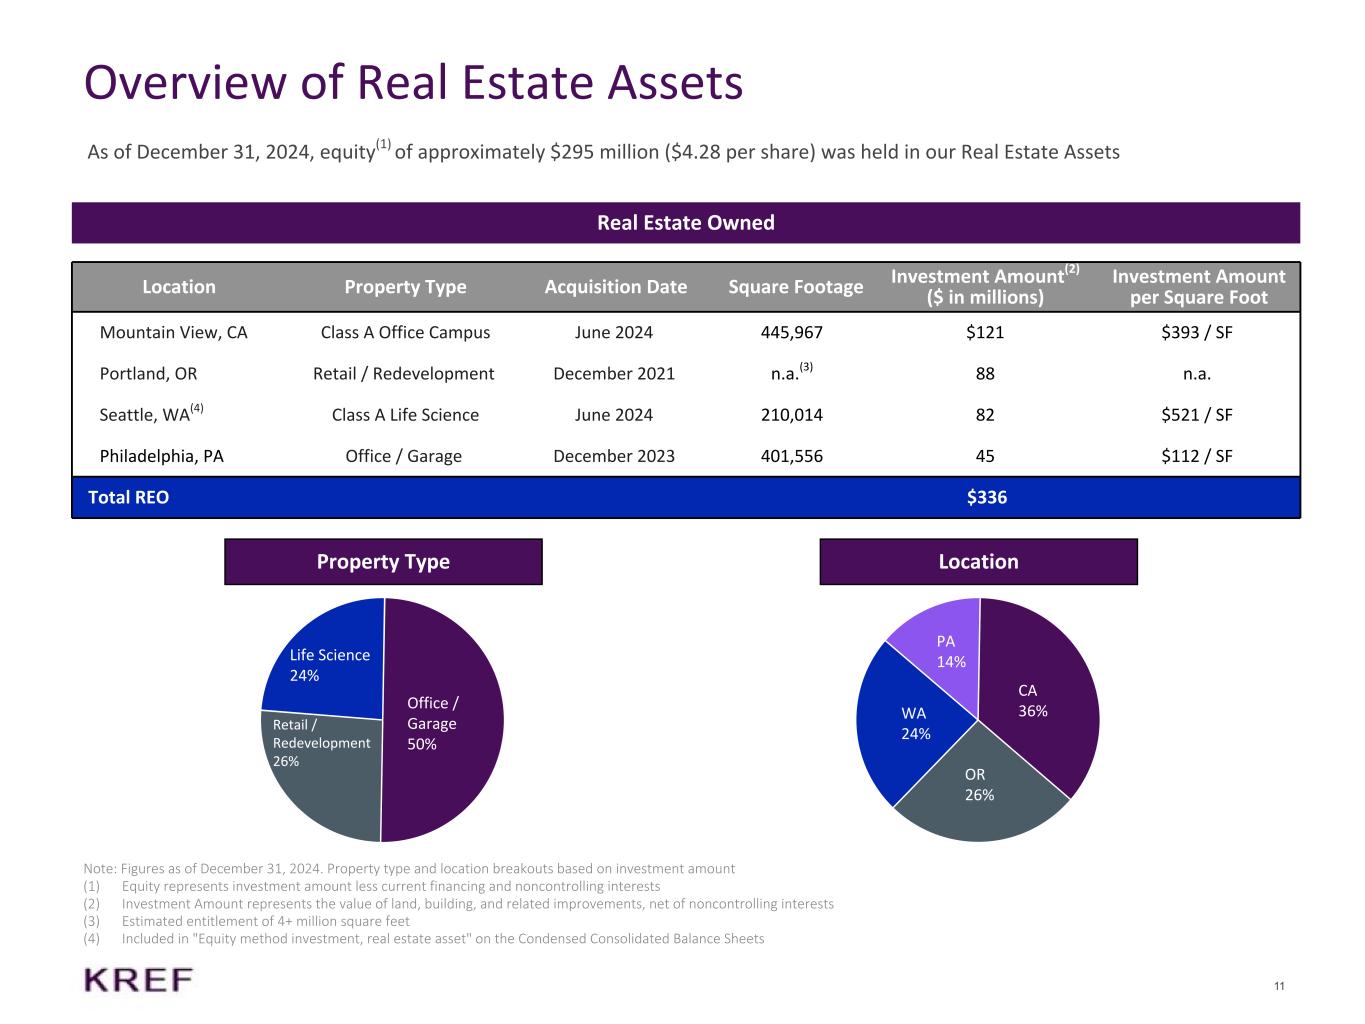
11 Overview of Real Estate Assets Real Estate Owned Location Property Type Acquisition Date Square Footage Investment Amount(2) ($ in millions) Investment Amount per Square Foot Mountain View, CA Class A Office Campus June 2024 445,967 $121 $393 / SF Portland, OR Retail / Redevelopment December 2021 n.a.(3) 88 n.a. Seattle, WA(4) Class A Life Science June 2024 210,014 82 $521 / SF Philadelphia, PA Office / Garage December 2023 401,556 45 $112 / SF Total REO $336 Note: Figures as of December 31, 2024. Property type and location breakouts based on investment amount (1) Equity represents investment amount less current financing and noncontrolling interests (2) Investment Amount represents the value of land, building, and related improvements, net of noncontrolling interests (3) Estimated entitlement of 4+ million square feet (4) Included in "Equity method investment, real estate asset" on the Condensed Consolidated Balance Sheets As of December 31, 2024, equity(1) of approximately $295 million ($4.28 per share) was held in our Real Estate Assets Office / Garage 50% Retail / Redevelopment 26% Life Science 24% CA 36% OR 26% WA 24% PA 14% Property Type Location

12 Collateralized Loan Obligations 36% Term Lending Agreements 16% Term Loan Facility 11% Secured Term Loan 7% Asset Specific 7% Revolver 2% Term Credit Facilities 21% Financing Overview: 79% Non-Mark-To-Market Diversified financing sources totaling $8.0 billion with $3.1 billion of undrawn capacity Summary of Outstanding Financing Leverage Ratios (3) Outstanding Financing(5) ($ in Millions) Maximum Capacity Outstanding Principal Amount Weighted Avg. Coupon(1) Advance Rate Non- MTM Term Credit Facilities $2,000 $1,038 +1.8% 66.6% (2) Term Lending Agreements $1,288 $790 +1.8% 68.4% ü Warehouse Facility $500 $0 n/a n/a ü Secured Term Loan $340 $340 +3.8% — ü Corporate Revolving Credit Facility $610 $80 +2.0% — ü Total Debt $4,738 $2,248 Collateralized Loan Obligations $1,766 $1,766 +1.6% 83.2% ü Term Loan Facility $1,000 $554 +2.0% 77.6% ü Asset Specific Financing $491 $343 +2.9% 82.8% ü Total Leverage $7,995 $4,911 1.6 3.6 Debt-To-Equity Ratio Total Leverage Ratio(4) x (1) Weighted average coupon expressed as spread over Term SOFR (2) Term credit facilities are marked to credit only and not subject to capital markets mark-to-market provisions (3) Represents (i) total outstanding debt agreements (excluding non-recourse facilities), and secured term loan, less cash to (ii) KREF stockholders' equity, in each case, at period end (4) Represents (i) total outstanding debt agreements, secured term loan, and collateralized loan obligations, less cash to (ii) KREF stockholder's equity, in each case, at period end (5) Based on outstanding principal amount of secured financing Non-Mark- to-Market 79% x

13 Financing Overview: Term Credit Facilities Counterparty Total or Weighted Average Drawn $652 $277 $109 $1,038 Capacity $1,000 $600 $400 $2,000 Collateral: Loans / Principal Balance 9 Loans / $943 7 Loans / $405 4 Loans / $210 20 Loans / $1,558 Final Stated Maturity(1) September 2029 March 2026 December 2027 - Weighted Average Pricing(2) +1.6% +2.1% +2.4% +1.8% Weighted Average Advance 69.1% 68.4% 51.9% 66.6% Mark-to-market Credit Only Credit Only Credit Only - ($ in Millions) (1) Based on extended maturity date (2) Weighted average pricing expressed as spread over Term SOFR (3) Based on principal balance of financing Property Type(3): Multifamily 45% Office 27% Life Science 20% Industrial 7% Mixed Use 2%
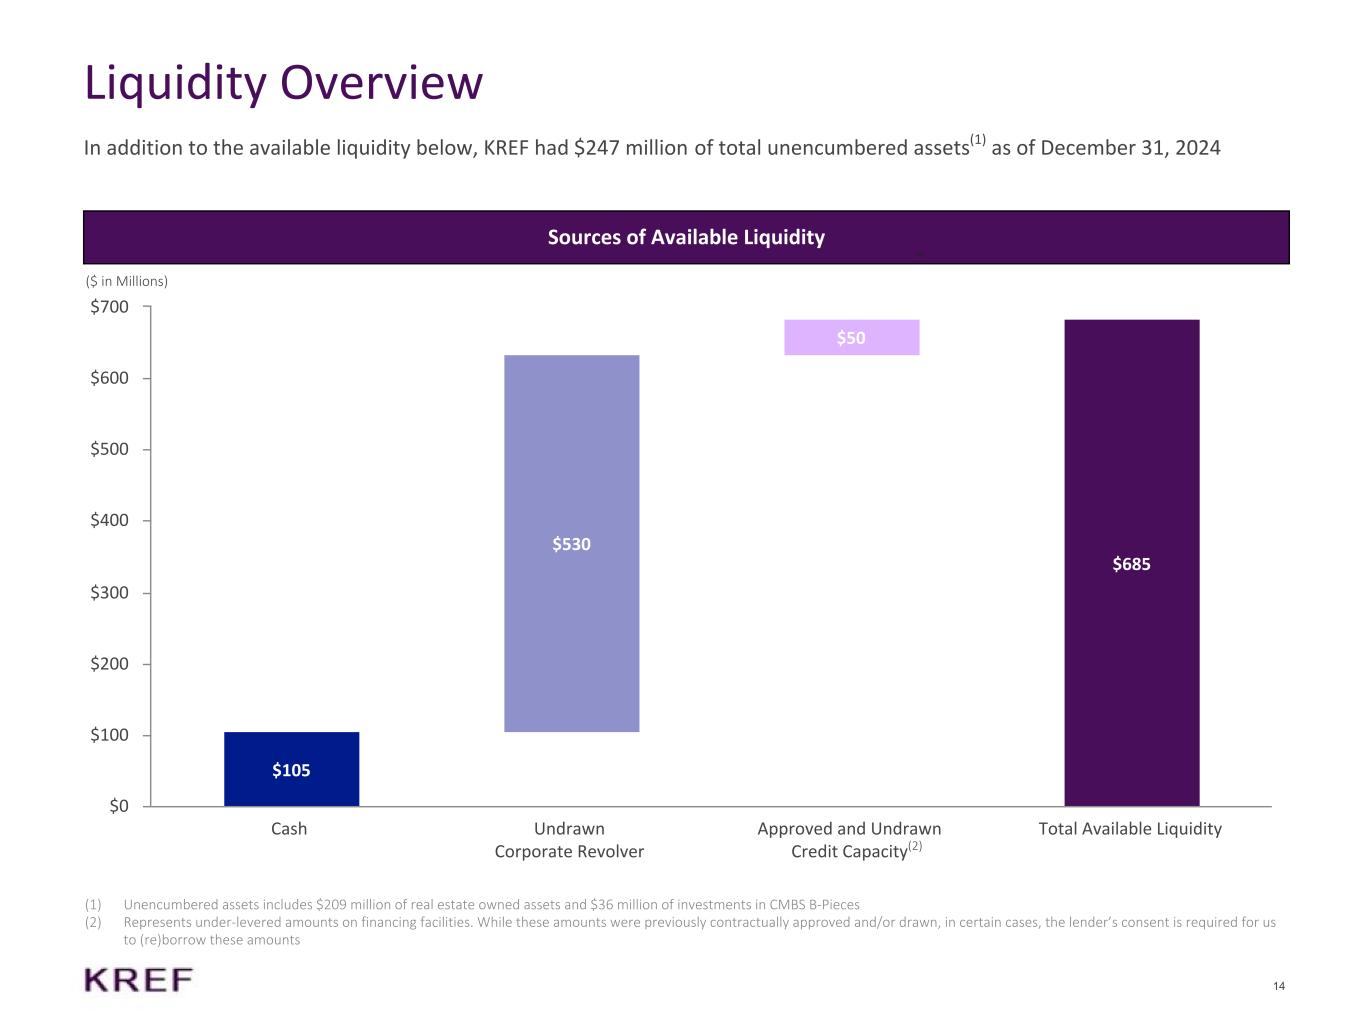
14 $105 $635 $105 $530 $50 $685 Cash Undrawn Corporate Revolver Approved and Undrawn Credit Capacity Total Available Liquidity $0 $100 $200 $300 $400 $500 $600 $700 Liquidity Overview (1) Unencumbered assets includes $209 million of real estate owned assets and $36 million of investments in CMBS B-Pieces (2) Represents under-levered amounts on financing facilities. While these amounts were previously contractually approved and/or drawn, in certain cases, the lender’s consent is required for us to (re)borrow these amounts ($ in Millions) Sources of Available Liquidity In addition to the available liquidity below, KREF had $247 million of total unencumbered assets(1) as of December 31, 2024 (4) (2)
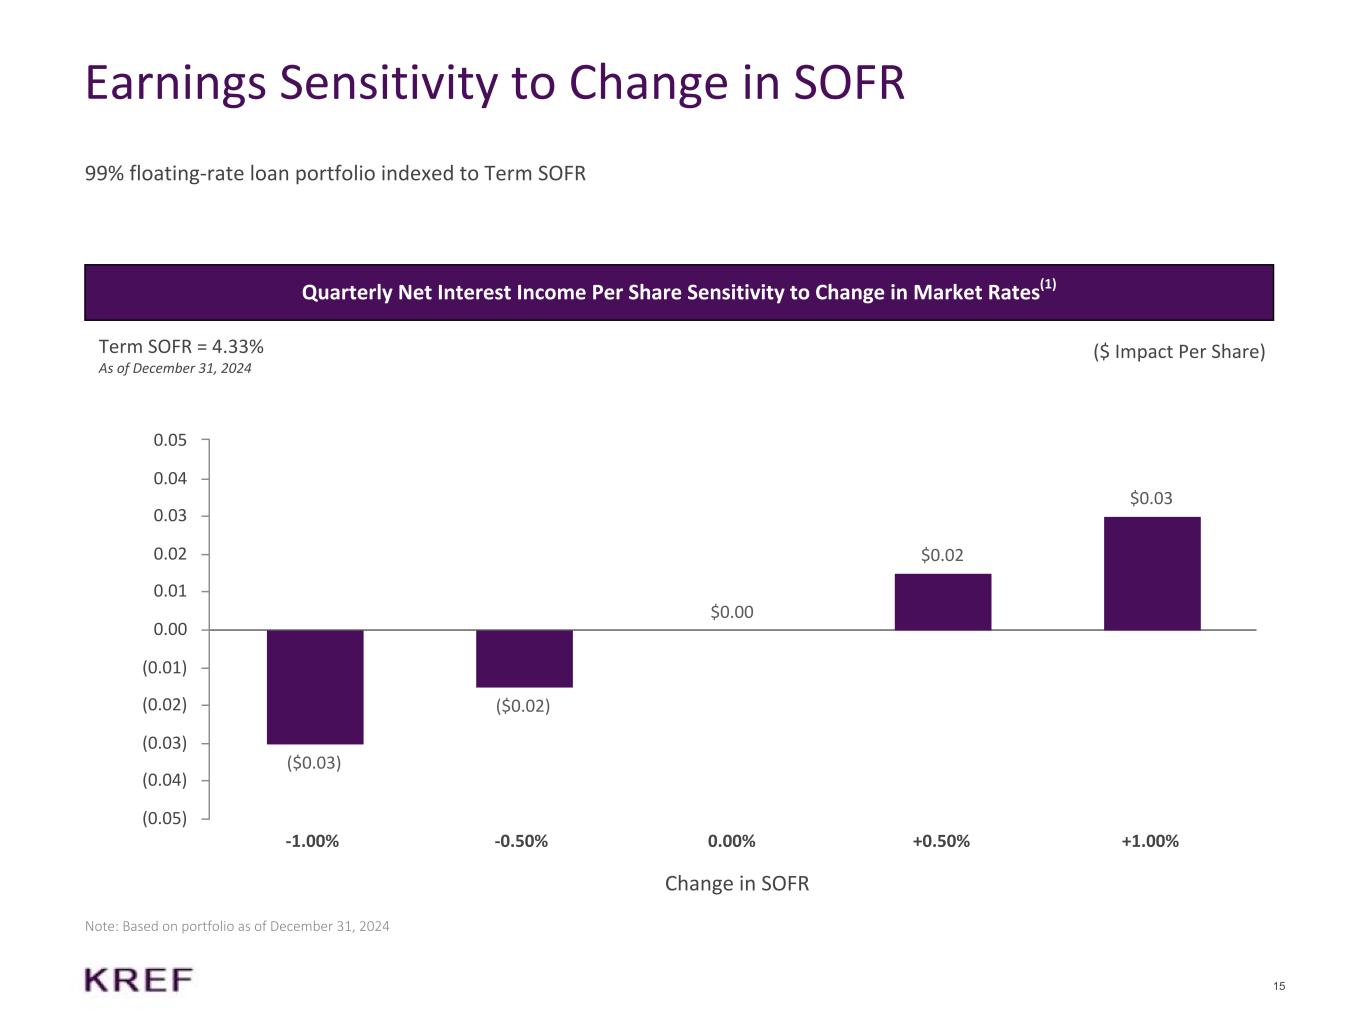
15 Earnings Sensitivity to Change in SOFR 99% floating-rate loan portfolio indexed to Term SOFR Quarterly Net Interest Income Per Share Sensitivity to Change in Market Rates(1) Term SOFR = 4.33% As of December 31, 2024 ($ Impact Per Share) Note: Based on portfolio as of December 31, 2024 Change in SOFR ($0.03) ($0.02) $0.00 $0.02 $0.03 -1.00% -0.50% 0.00% +0.50% +1.00% (0.05) (0.04) (0.03) (0.02) (0.01) 0.00 0.01 0.02 0.03 0.04 0.05
16 Appendix
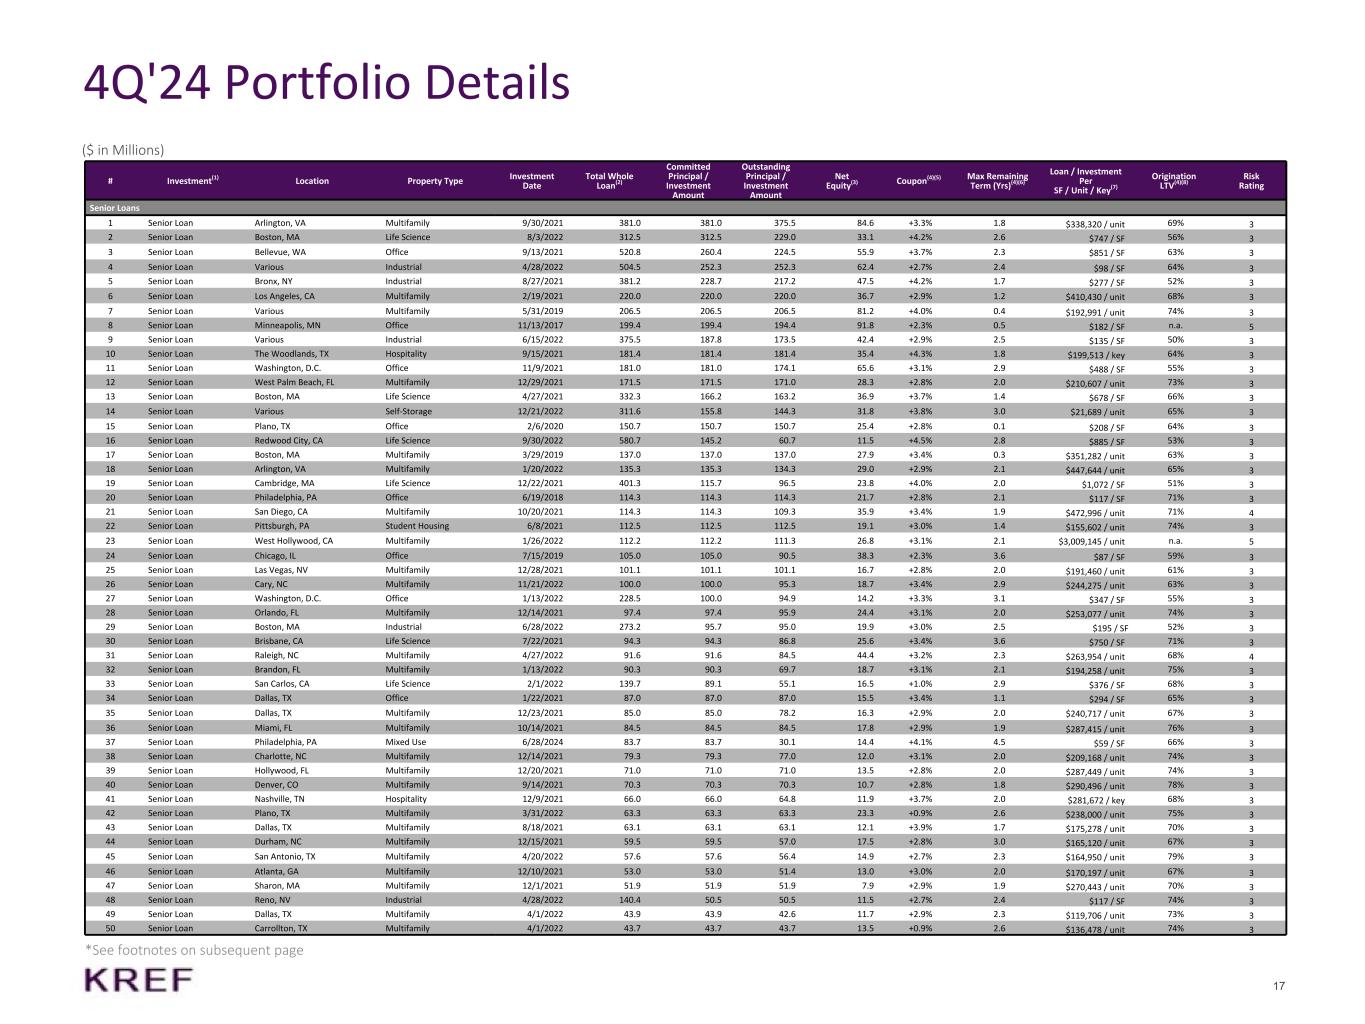
17 4Q'24 Portfolio Details ($ in Millions) # Investment(1) Location Property Type Investment Date Total Whole Loan(2) Committed Principal / Investment Amount Outstanding Principal / Investment Amount Net Equity(3) Coupon(4)(5) Max Remaining Term (Yrs)(4)(6) Loan / Investment Per SF / Unit / Key(7) Origination LTV(4)(8) Risk Rating Senior Loans 1 Senior Loan Arlington, VA Multifamily 9/30/2021 381.0 381.0 375.5 84.6 +3.3% 1.8 $338,320 / unit 69% 3 2 Senior Loan Boston, MA Life Science 8/3/2022 312.5 312.5 229.0 33.1 +4.2% 2.6 $747 / SF 56% 3 3 Senior Loan Bellevue, WA Office 9/13/2021 520.8 260.4 224.5 55.9 +3.7% 2.3 $851 / SF 63% 3 4 Senior Loan Various Industrial 4/28/2022 504.5 252.3 252.3 62.4 +2.7% 2.4 $98 / SF 64% 3 5 Senior Loan Bronx, NY Industrial 8/27/2021 381.2 228.7 217.2 47.5 +4.2% 1.7 $277 / SF 52% 3 6 Senior Loan Los Angeles, CA Multifamily 2/19/2021 220.0 220.0 220.0 36.7 +2.9% 1.2 $410,430 / unit 68% 3 7 Senior Loan Various Multifamily 5/31/2019 206.5 206.5 206.5 81.2 +4.0% 0.4 $192,991 / unit 74% 3 8 Senior Loan Minneapolis, MN Office 11/13/2017 199.4 199.4 194.4 91.8 +2.3% 0.5 $182 / SF n.a. 5 9 Senior Loan Various Industrial 6/15/2022 375.5 187.8 173.5 42.4 +2.9% 2.5 $135 / SF 50% 3 10 Senior Loan The Woodlands, TX Hospitality 9/15/2021 181.4 181.4 181.4 35.4 +4.3% 1.8 $199,513 / key 64% 3 11 Senior Loan Washington, D.C. Office 11/9/2021 181.0 181.0 174.1 65.6 +3.1% 2.9 $488 / SF 55% 3 12 Senior Loan West Palm Beach, FL Multifamily 12/29/2021 171.5 171.5 171.0 28.3 +2.8% 2.0 $210,607 / unit 73% 3 13 Senior Loan Boston, MA Life Science 4/27/2021 332.3 166.2 163.2 36.9 +3.7% 1.4 $678 / SF 66% 3 14 Senior Loan Various Self-Storage 12/21/2022 311.6 155.8 144.3 31.8 +3.8% 3.0 $21,689 / unit 65% 3 15 Senior Loan Plano, TX Office 2/6/2020 150.7 150.7 150.7 25.4 +2.8% 0.1 $208 / SF 64% 3 16 Senior Loan Redwood City, CA Life Science 9/30/2022 580.7 145.2 60.7 11.5 +4.5% 2.8 $885 / SF 53% 3 17 Senior Loan Boston, MA Multifamily 3/29/2019 137.0 137.0 137.0 27.9 +3.4% 0.3 $351,282 / unit 63% 3 18 Senior Loan Arlington, VA Multifamily 1/20/2022 135.3 135.3 134.3 29.0 +2.9% 2.1 $447,644 / unit 65% 3 19 Senior Loan Cambridge, MA Life Science 12/22/2021 401.3 115.7 96.5 23.8 +4.0% 2.0 $1,072 / SF 51% 3 20 Senior Loan Philadelphia, PA Office 6/19/2018 114.3 114.3 114.3 21.7 +2.8% 2.1 $117 / SF 71% 3 21 Senior Loan San Diego, CA Multifamily 10/20/2021 114.3 114.3 109.3 35.9 +3.4% 1.9 $472,996 / unit 71% 4 22 Senior Loan Pittsburgh, PA Student Housing 6/8/2021 112.5 112.5 112.5 19.1 +3.0% 1.4 $155,602 / unit 74% 3 23 Senior Loan West Hollywood, CA Multifamily 1/26/2022 112.2 112.2 111.3 26.8 +3.1% 2.1 $3,009,145 / unit n.a. 5 24 Senior Loan Chicago, IL Office 7/15/2019 105.0 105.0 90.5 38.3 +2.3% 3.6 $87 / SF 59% 3 25 Senior Loan Las Vegas, NV Multifamily 12/28/2021 101.1 101.1 101.1 16.7 +2.8% 2.0 $191,460 / unit 61% 3 26 Senior Loan Cary, NC Multifamily 11/21/2022 100.0 100.0 95.3 18.7 +3.4% 2.9 $244,275 / unit 63% 3 27 Senior Loan Washington, D.C. Office 1/13/2022 228.5 100.0 94.9 14.2 +3.3% 3.1 $347 / SF 55% 3 28 Senior Loan Orlando, FL Multifamily 12/14/2021 97.4 97.4 95.9 24.4 +3.1% 2.0 $253,077 / unit 74% 3 29 Senior Loan Boston, MA Industrial 6/28/2022 273.2 95.7 95.0 19.9 +3.0% 2.5 $195 / SF 52% 3 30 Senior Loan Brisbane, CA Life Science 7/22/2021 94.3 94.3 86.8 25.6 +3.4% 3.6 $750 / SF 71% 3 31 Senior Loan Raleigh, NC Multifamily 4/27/2022 91.6 91.6 84.5 44.4 +3.2% 2.3 $263,954 / unit 68% 4 32 Senior Loan Brandon, FL Multifamily 1/13/2022 90.3 90.3 69.7 18.7 +3.1% 2.1 $194,258 / unit 75% 3 33 Senior Loan San Carlos, CA Life Science 2/1/2022 139.7 89.1 55.1 16.5 +1.0% 2.9 $376 / SF 68% 3 34 Senior Loan Dallas, TX Office 1/22/2021 87.0 87.0 87.0 15.5 +3.4% 1.1 $294 / SF 65% 3 35 Senior Loan Dallas, TX Multifamily 12/23/2021 85.0 85.0 78.2 16.3 +2.9% 2.0 $240,717 / unit 67% 3 36 Senior Loan Miami, FL Multifamily 10/14/2021 84.5 84.5 84.5 17.8 +2.9% 1.9 $287,415 / unit 76% 3 37 Senior Loan Philadelphia, PA Mixed Use 6/28/2024 83.7 83.7 30.1 14.4 +4.1% 4.5 $59 / SF 66% 3 38 Senior Loan Charlotte, NC Multifamily 12/14/2021 79.3 79.3 77.0 12.0 +3.1% 2.0 $209,168 / unit 74% 3 39 Senior Loan Hollywood, FL Multifamily 12/20/2021 71.0 71.0 71.0 13.5 +2.8% 2.0 $287,449 / unit 74% 3 40 Senior Loan Denver, CO Multifamily 9/14/2021 70.3 70.3 70.3 10.7 +2.8% 1.8 $290,496 / unit 78% 3 41 Senior Loan Nashville, TN Hospitality 12/9/2021 66.0 66.0 64.8 11.9 +3.7% 2.0 $281,672 / key 68% 3 42 Senior Loan Plano, TX Multifamily 3/31/2022 63.3 63.3 63.3 23.3 +0.9% 2.6 $238,000 / unit 75% 3 43 Senior Loan Dallas, TX Multifamily 8/18/2021 63.1 63.1 63.1 12.1 +3.9% 1.7 $175,278 / unit 70% 3 44 Senior Loan Durham, NC Multifamily 12/15/2021 59.5 59.5 57.0 17.5 +2.8% 3.0 $165,120 / unit 67% 3 45 Senior Loan San Antonio, TX Multifamily 4/20/2022 57.6 57.6 56.4 14.9 +2.7% 2.3 $164,950 / unit 79% 3 46 Senior Loan Atlanta, GA Multifamily 12/10/2021 53.0 53.0 51.4 13.0 +3.0% 2.0 $170,197 / unit 67% 3 47 Senior Loan Sharon, MA Multifamily 12/1/2021 51.9 51.9 51.9 7.9 +2.9% 1.9 $270,443 / unit 70% 3 48 Senior Loan Reno, NV Industrial 4/28/2022 140.4 50.5 50.5 11.5 +2.7% 2.4 $117 / SF 74% 3 49 Senior Loan Dallas, TX Multifamily 4/1/2022 43.9 43.9 42.6 11.7 +2.9% 2.3 $119,706 / unit 73% 3 50 Senior Loan Carrollton, TX Multifamily 4/1/2022 43.7 43.7 43.7 13.5 +0.9% 2.6 $136,478 / unit 74% 3 *See footnotes on subsequent page

18 4Q'24 Portfolio Details *See footnotes on subsequent page ($ in Millions) # Investment(1) Location Property Type Investment Date Total Whole Loan(2) Committed Principal / Investment Amount Outstanding Principal / Investment Amount Net Equity(3) Coupon(4)(5) Max Remaining Term (Yrs)(4)(6) Loan / Investment Per SF / Unit / Key(7) Origination LTV(4)(8) Risk Rating Senior Loans 51 Senior Loan Georgetown, TX Multifamily 12/16/2021 35.2 35.2 35.2 8.8 +3.4% 2.0 $167,381 / unit 68% 3 Total / Weighted Average $8,696.9 $6,354.4 $5,900.2 $1,438.5 +3.2% 2.0 65% 3.1 Real Estate Assets 1 Real Estate Owned Mountain View, CA Office 6/28/2024 n.a. $120.8 $120.8 $120.8 n.a. n.a. $393 / SF n.a. n.a. 2 Real Estate Owned Portland, OR Retail / Redevelopment 12/16/2021 n.a. 88.2 88.2 88.2 n.a. n.a. n.a. n.a. n.a. 3 Equity Method Investment(9) Seattle, WA Life Science 6/28/2024 n.a. 81.7 81.7 40.7 n.a. n.a. $521 / SF n.a. n.a. 4 Real Estate Owned Philadelphia, PA Office / Garage 12/22/2023 n.a. 45.1 45.1 45.1 n.a. n.a. $112 / SF n.a. n.a. Total / Weighted Average $335.8 $335.8 $294.8 Other Investments 1 CMBS B-Pieces(10) Various Various 2/13/2017 n.a. 40.0 35.6 35.6 4.7% 4.5 n.a. 58% n.a. Total / Weighted Average $40.0 $35.6 $35.6 4.7% 4.5 58% Portfolio Total / Weighted Average $6,730.2 $6,271.6 $1,768.9 7.5% 2.0 65% 3.1
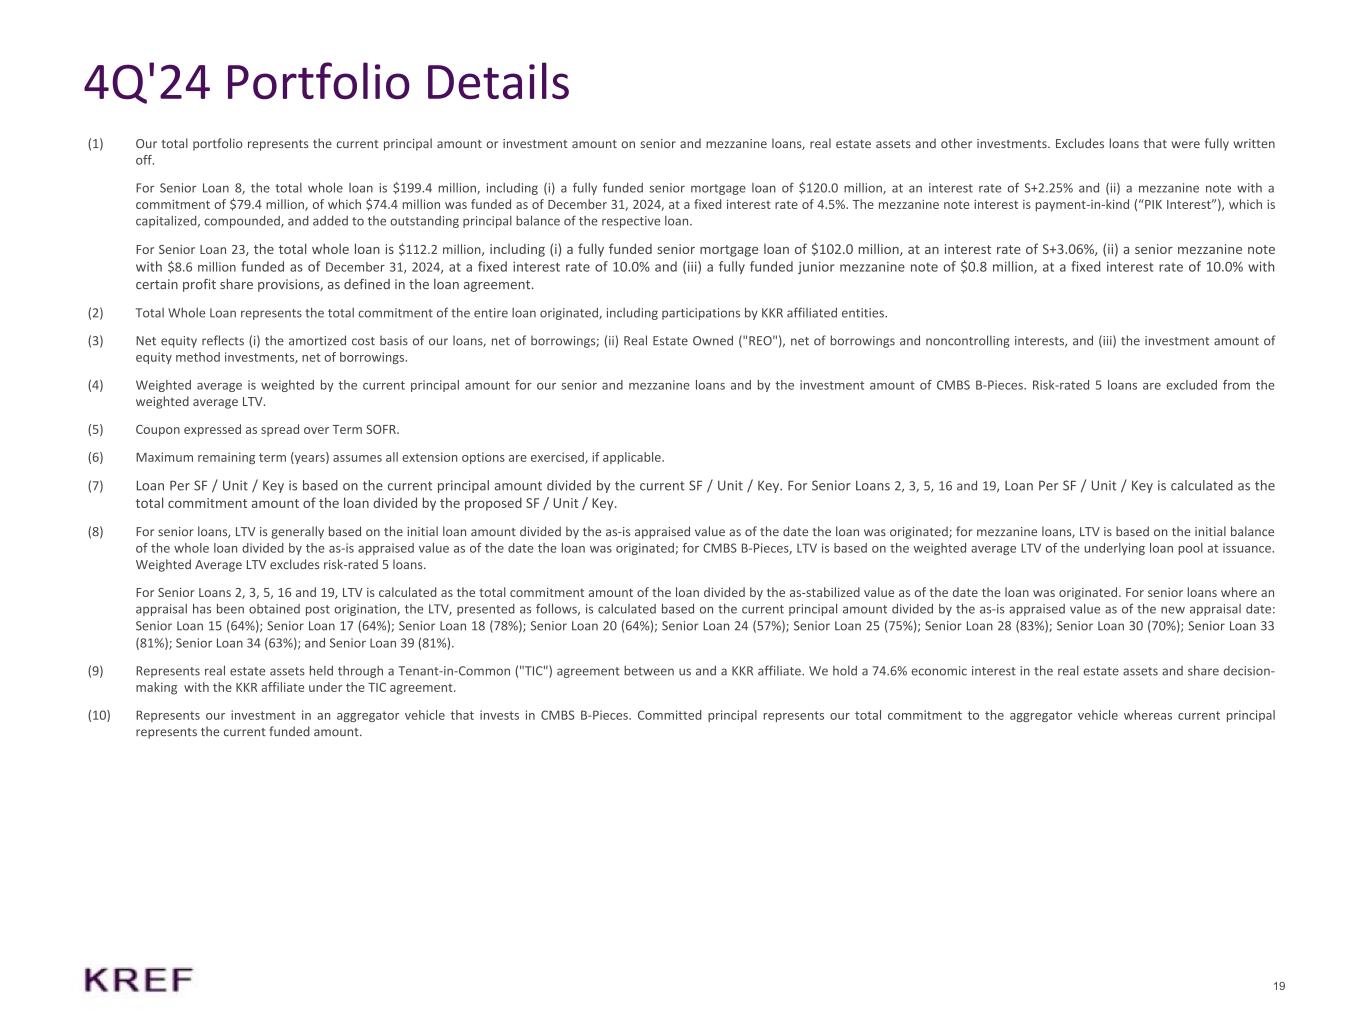
19 4Q'24 Portfolio Details (1) Our total portfolio represents the current principal amount or investment amount on senior and mezzanine loans, real estate assets and other investments. Excludes loans that were fully written off. For Senior Loan 8, the total whole loan is $199.4 million, including (i) a fully funded senior mortgage loan of $120.0 million, at an interest rate of S+2.25% and (ii) a mezzanine note with a commitment of $79.4 million, of which $74.4 million was funded as of December 31, 2024, at a fixed interest rate of 4.5%. The mezzanine note interest is payment-in-kind (“PIK Interest”), which is capitalized, compounded, and added to the outstanding principal balance of the respective loan. For Senior Loan 23, the total whole loan is $112.2 million, including (i) a fully funded senior mortgage loan of $102.0 million, at an interest rate of S+3.06%, (ii) a senior mezzanine note with $8.6 million funded as of December 31, 2024, at a fixed interest rate of 10.0% and (iii) a fully funded junior mezzanine note of $0.8 million, at a fixed interest rate of 10.0% with certain profit share provisions, as defined in the loan agreement. (2) Total Whole Loan represents the total commitment of the entire loan originated, including participations by KKR affiliated entities. (3) Net equity reflects (i) the amortized cost basis of our loans, net of borrowings; (ii) Real Estate Owned ("REO"), net of borrowings and noncontrolling interests, and (iii) the investment amount of equity method investments, net of borrowings. (4) Weighted average is weighted by the current principal amount for our senior and mezzanine loans and by the investment amount of CMBS B-Pieces. Risk-rated 5 loans are excluded from the weighted average LTV. (5) Coupon expressed as spread over Term SOFR. (6) Maximum remaining term (years) assumes all extension options are exercised, if applicable. (7) Loan Per SF / Unit / Key is based on the current principal amount divided by the current SF / Unit / Key. For Senior Loans 2, 3, 5, 16 and 19, Loan Per SF / Unit / Key is calculated as the total commitment amount of the loan divided by the proposed SF / Unit / Key. (8) For senior loans, LTV is generally based on the initial loan amount divided by the as-is appraised value as of the date the loan was originated; for mezzanine loans, LTV is based on the initial balance of the whole loan divided by the as-is appraised value as of the date the loan was originated; for CMBS B-Pieces, LTV is based on the weighted average LTV of the underlying loan pool at issuance. Weighted Average LTV excludes risk-rated 5 loans. For Senior Loans 2, 3, 5, 16 and 19, LTV is calculated as the total commitment amount of the loan divided by the as-stabilized value as of the date the loan was originated. For senior loans where an appraisal has been obtained post origination, the LTV, presented as follows, is calculated based on the current principal amount divided by the as-is appraised value as of the new appraisal date: Senior Loan 15 (64%); Senior Loan 17 (64%); Senior Loan 18 (78%); Senior Loan 20 (64%); Senior Loan 24 (57%); Senior Loan 25 (75%); Senior Loan 28 (83%); Senior Loan 30 (70%); Senior Loan 33 (81%); Senior Loan 34 (63%); and Senior Loan 39 (81%). (9) Represents real estate assets held through a Tenant-in-Common ("TIC") agreement between us and a KKR affiliate. We hold a 74.6% economic interest in the real estate assets and share decision- making with the KKR affiliate under the TIC agreement. (10) Represents our investment in an aggregator vehicle that invests in CMBS B-Pieces. Committed principal represents our total commitment to the aggregator vehicle whereas current principal represents the current funded amount.
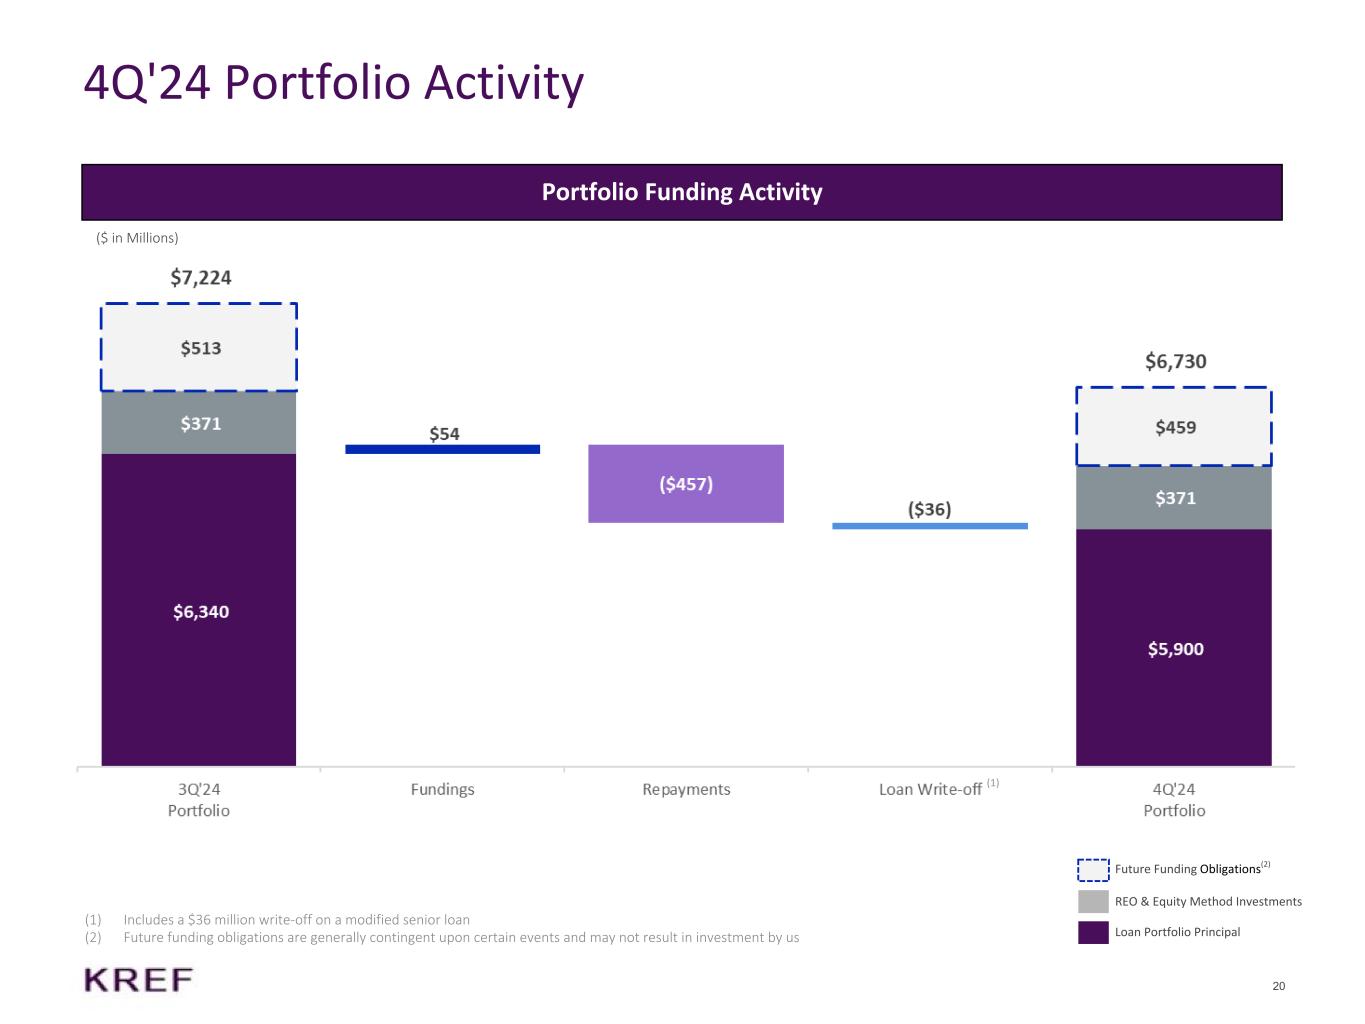
20 4Q'24 Portfolio Activity (1) Includes a $36 million write-off on a modified senior loan (2) Future funding obligations are generally contingent upon certain events and may not result in investment by us Portfolio Funding Activity Future Funding Obligations(2) ($ in Millions) REO & Equity Method Investments Loan Portfolio Principal (1)
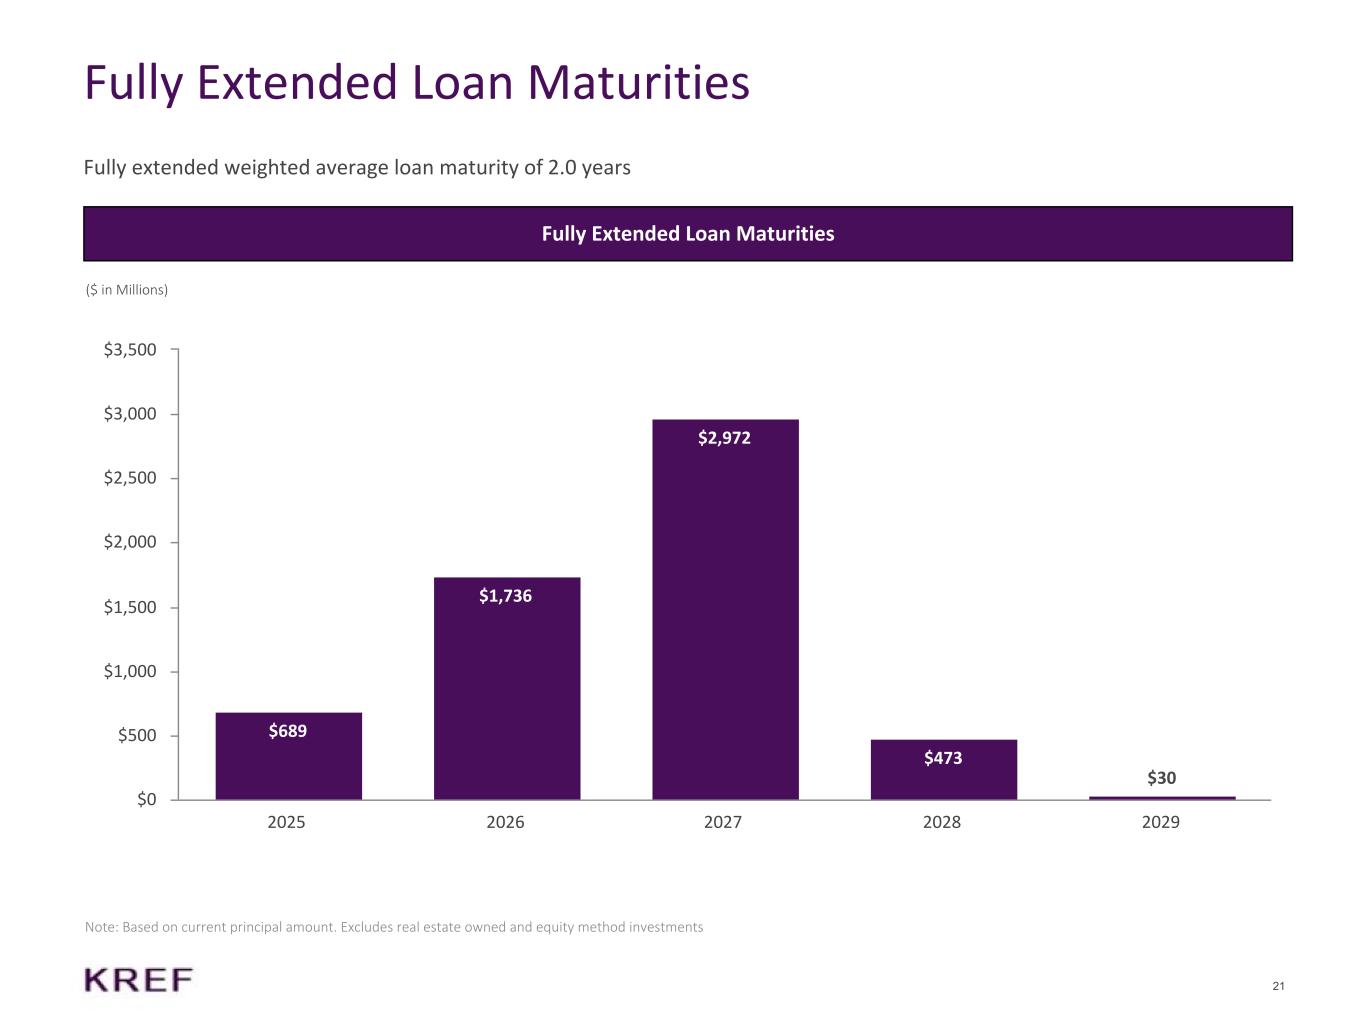
21 Fully Extended Loan Maturities Note: Based on current principal amount. Excludes real estate owned and equity method investments Fully Extended Loan Maturities ($ in Millions) $689 $1,736 $2,972 $473 $30 2025 2026 2027 2028 2029 $0 $500 $1,000 $1,500 $2,000 $2,500 $3,000 $3,500 Fully extended weighted average loan maturity of 2.0 years
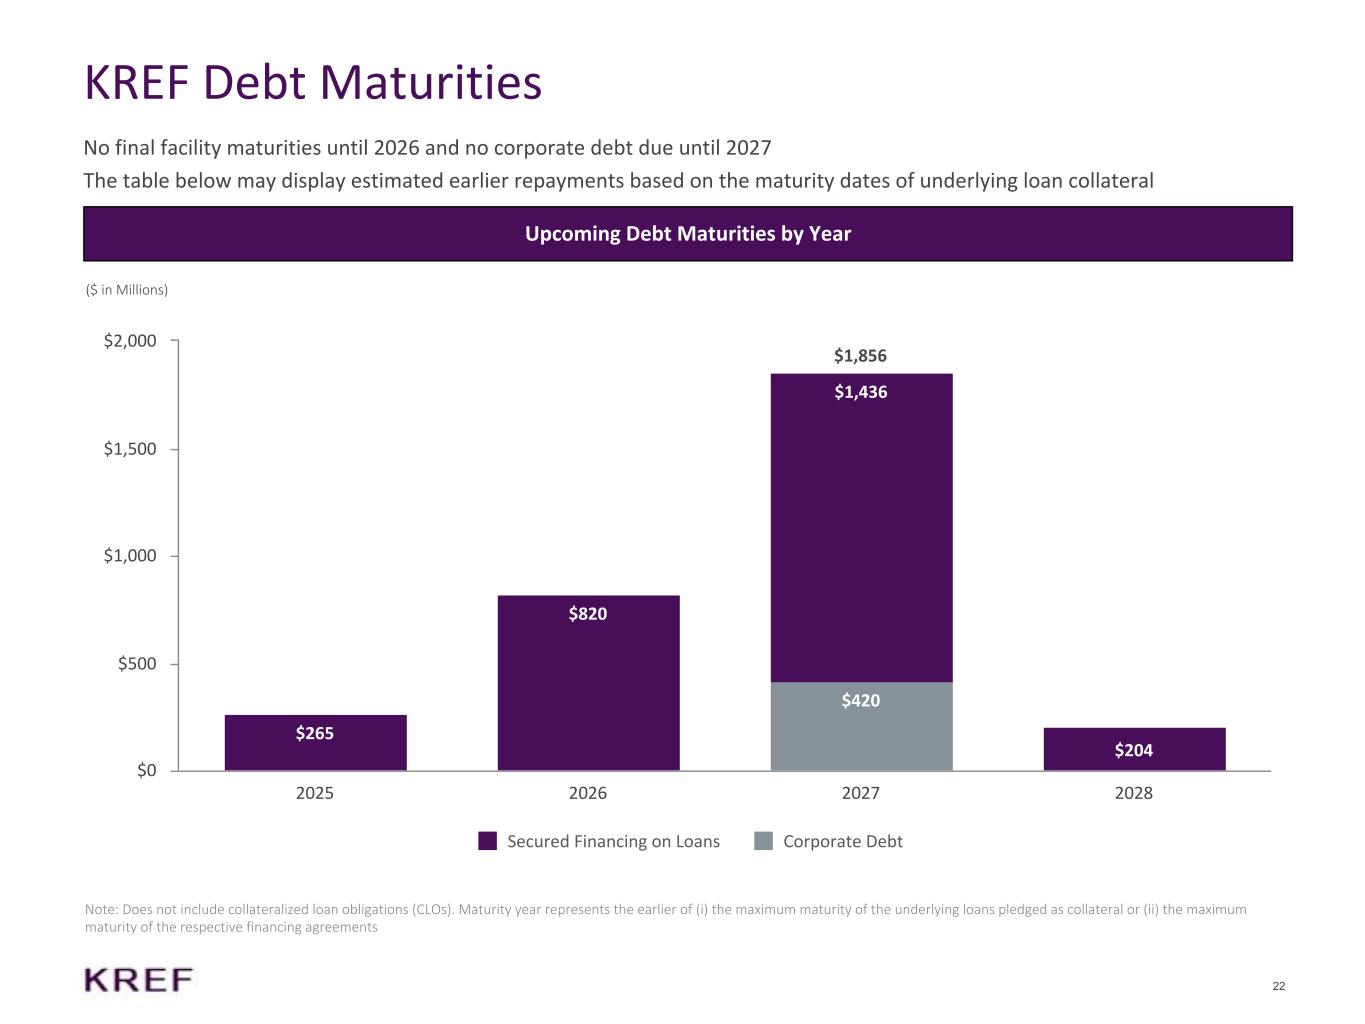
22 KREF Debt Maturities Note: Does not include collateralized loan obligations (CLOs). Maturity year represents the earlier of (i) the maximum maturity of the underlying loans pledged as collateral or (ii) the maximum maturity of the respective financing agreements Upcoming Debt Maturities by Year ($ in Millions) $420 $0 $265 $820 $1,436 $204 Secured Financing on Loans Corporate Debt 2025 2026 2027 2028 $0 $500 $1,000 $1,500 $2,000 No final facility maturities until 2026 and no corporate debt due until 2027 The table below may display estimated earlier repayments based on the maturity dates of underlying loan collateral $1,856
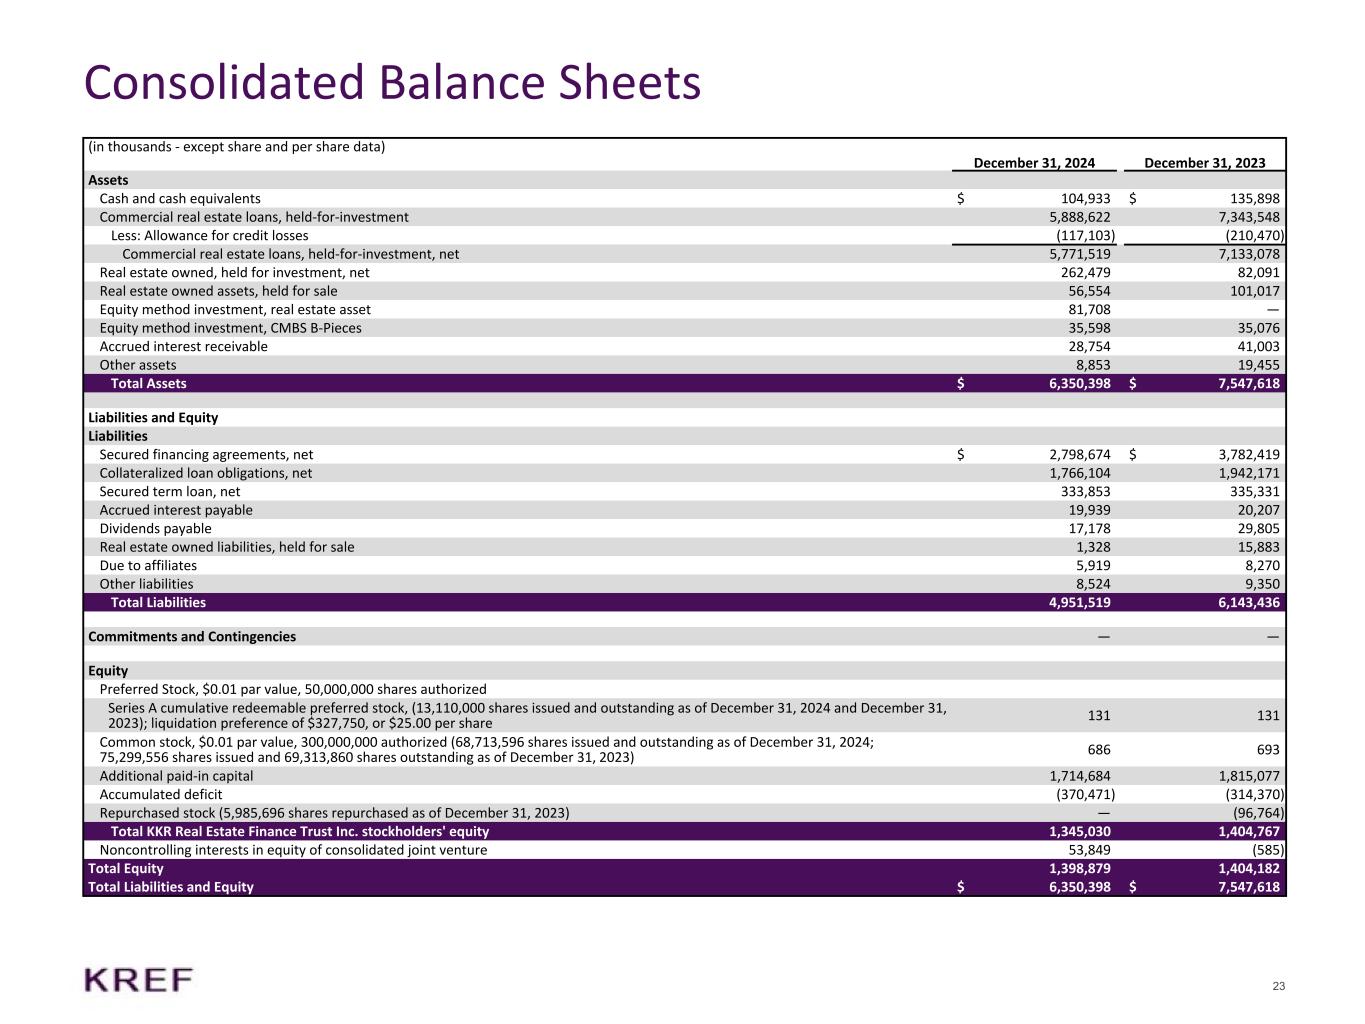
23 Consolidated Balance Sheets (in thousands - except share and per share data) December 31, 2024 December 31, 2023 Assets Cash and cash equivalents $ 104,933 $ 135,898 Commercial real estate loans, held-for-investment 5,888,622 7,343,548 Less: Allowance for credit losses (117,103) (210,470) Commercial real estate loans, held-for-investment, net 5,771,519 7,133,078 Real estate owned, held for investment, net 262,479 82,091 Real estate owned assets, held for sale 56,554 101,017 Equity method investment, real estate asset 81,708 — Equity method investment, CMBS B-Pieces 35,598 35,076 Accrued interest receivable 28,754 41,003 Other assets 8,853 19,455 Total Assets $ 6,350,398 $ 7,547,618 Liabilities and Equity Liabilities Secured financing agreements, net $ 2,798,674 $ 3,782,419 Collateralized loan obligations, net 1,766,104 1,942,171 Secured term loan, net 333,853 335,331 Accrued interest payable 19,939 20,207 Dividends payable 17,178 29,805 Real estate owned liabilities, held for sale 1,328 15,883 Due to affiliates 5,919 8,270 Other liabilities 8,524 9,350 Total Liabilities 4,951,519 6,143,436 Commitments and Contingencies — — Equity Preferred Stock, $0.01 par value, 50,000,000 shares authorized Series A cumulative redeemable preferred stock, (13,110,000 shares issued and outstanding as of December 31, 2024 and December 31, 2023); liquidation preference of $327,750, or $25.00 per share 131 131 Common stock, $0.01 par value, 300,000,000 authorized (68,713,596 shares issued and outstanding as of December 31, 2024; 75,299,556 shares issued and 69,313,860 shares outstanding as of December 31, 2023) 686 693 Additional paid-in capital 1,714,684 1,815,077 Accumulated deficit (370,471) (314,370) Repurchased stock (5,985,696 shares repurchased as of December 31, 2023) — (96,764) Total KKR Real Estate Finance Trust Inc. stockholders' equity 1,345,030 1,404,767 Noncontrolling interests in equity of consolidated joint venture 53,849 (585) Total Equity 1,398,879 1,404,182 Total Liabilities and Equity $ 6,350,398 $ 7,547,618
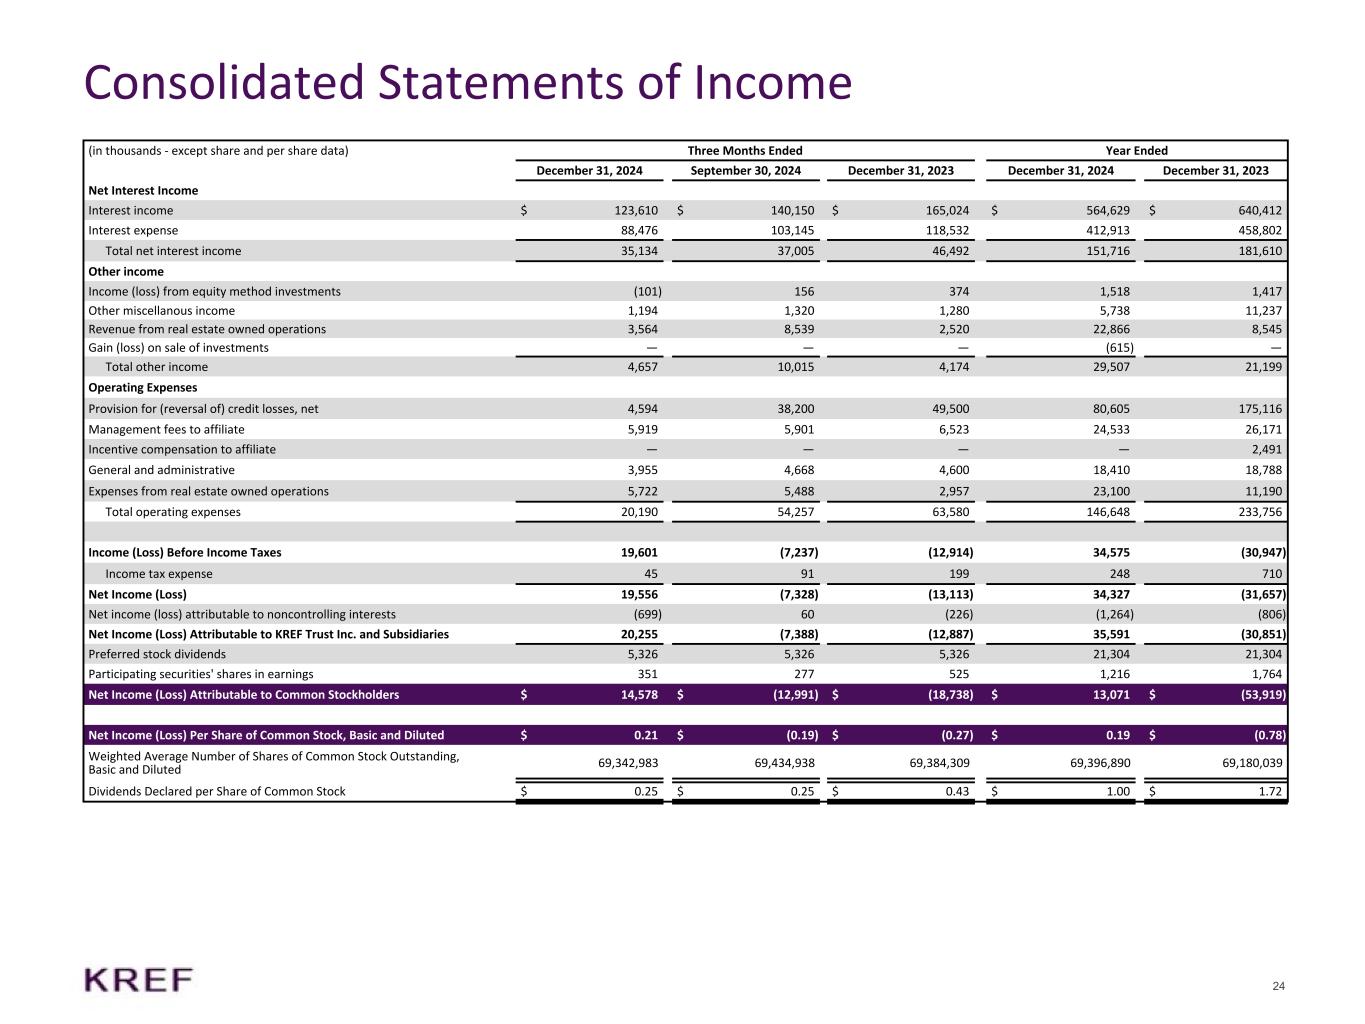
24 Consolidated Statements of Income (in thousands - except share and per share data) Three Months Ended Year Ended December 31, 2024 September 30, 2024 December 31, 2023 December 31, 2024 December 31, 2023 Net Interest Income Interest income $ 123,610 $ 140,150 $ 165,024 $ 564,629 $ 640,412 Interest expense 88,476 103,145 118,532 412,913 458,802 Total net interest income 35,134 37,005 46,492 151,716 181,610 Other income Income (loss) from equity method investments (101) 156 374 1,518 1,417 Other miscellanous income 1,194 1,320 1,280 5,738 11,237 Revenue from real estate owned operations 3,564 8,539 2,520 22,866 8,545 Gain (loss) on sale of investments — — — (615) — Total other income 4,657 10,015 4,174 29,507 21,199 Operating Expenses Provision for (reversal of) credit losses, net 4,594 38,200 49,500 80,605 175,116 Management fees to affiliate 5,919 5,901 6,523 24,533 26,171 Incentive compensation to affiliate — — — — 2,491 General and administrative 3,955 4,668 4,600 18,410 18,788 Expenses from real estate owned operations 5,722 5,488 2,957 23,100 11,190 Total operating expenses 20,190 54,257 63,580 146,648 233,756 Income (Loss) Before Income Taxes 19,601 (7,237) (12,914) 34,575 (30,947) Income tax expense 45 91 199 248 710 Net Income (Loss) 19,556 (7,328) (13,113) 34,327 (31,657) Net income (loss) attributable to noncontrolling interests (699) 60 (226) (1,264) (806) Net Income (Loss) Attributable to KREF Trust Inc. and Subsidiaries 20,255 (7,388) (12,887) 35,591 (30,851) Preferred stock dividends 5,326 5,326 5,326 21,304 21,304 Participating securities' shares in earnings 351 277 525 1,216 1,764 Net Income (Loss) Attributable to Common Stockholders $ 14,578 $ (12,991) $ (18,738) $ 13,071 $ (53,919) Net Income (Loss) Per Share of Common Stock, Basic and Diluted $ 0.21 $ (0.19) $ (0.27) $ 0.19 $ (0.78) Weighted Average Number of Shares of Common Stock Outstanding, Basic and Diluted 69,342,983 69,434,938 69,384,309 69,396,890 69,180,039 Dividends Declared per Share of Common Stock $ 0.25 $ 0.25 $ 0.43 $ 1.00 $ 1.72
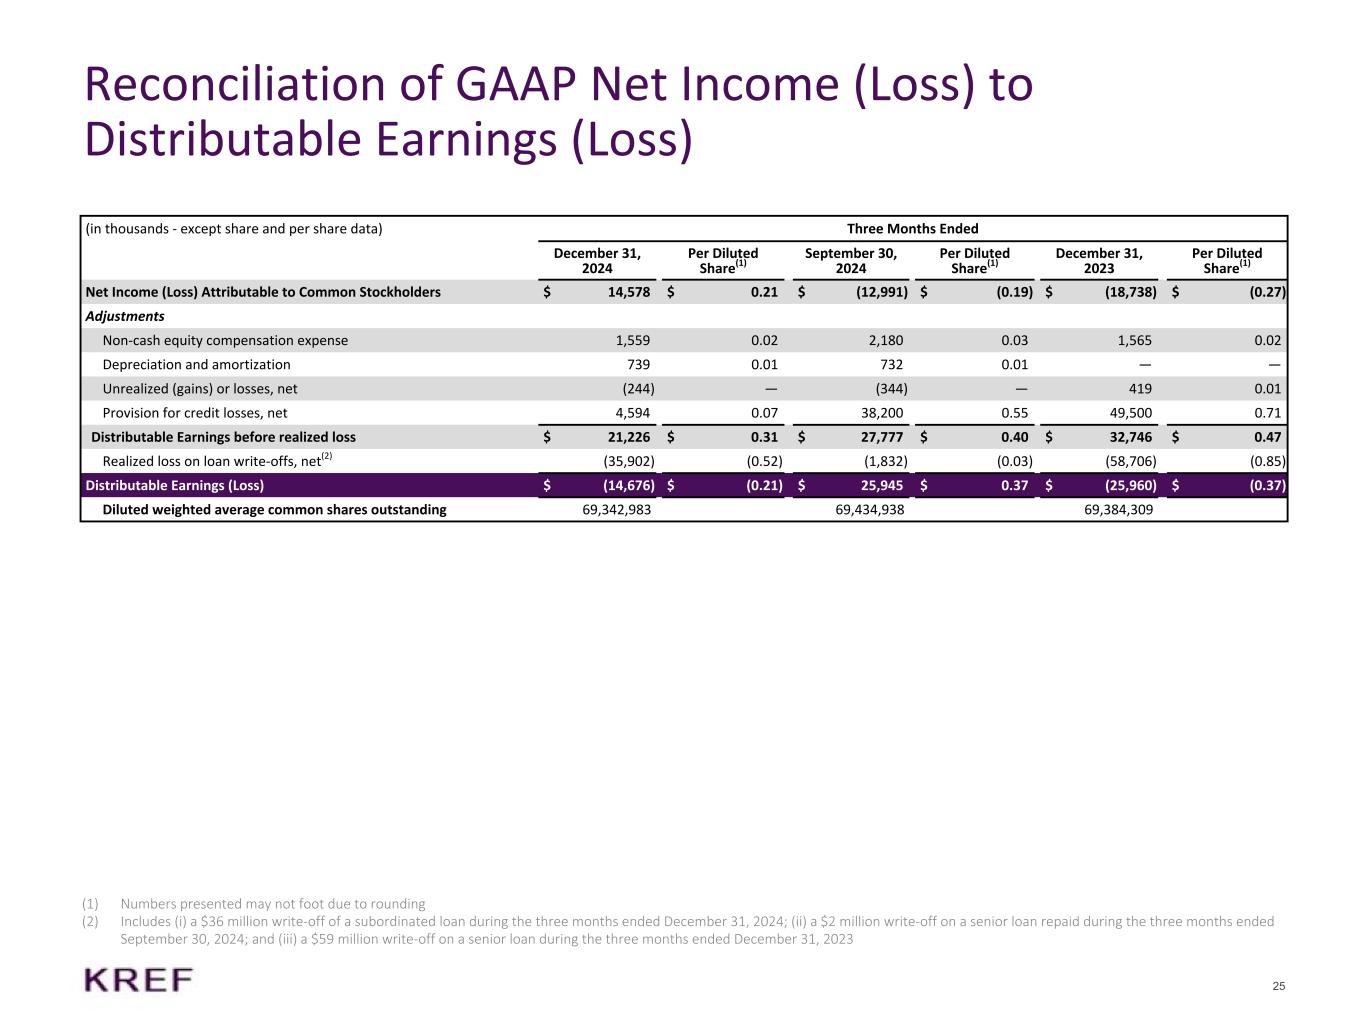
25 Reconciliation of GAAP Net Income (Loss) to Distributable Earnings (Loss) (1) Numbers presented may not foot due to rounding (2) Includes (i) a $36 million write-off of a subordinated loan during the three months ended December 31, 2024; (ii) a $2 million write-off on a senior loan repaid during the three months ended September 30, 2024; and (iii) a $59 million write-off on a senior loan during the three months ended December 31, 2023 (in thousands - except share and per share data) Three Months Ended December 31, 2024 Per Diluted Share(1) September 30, 2024 Per Diluted Share(1) December 31, 2023 Per Diluted Share(1) Net Income (Loss) Attributable to Common Stockholders $ 14,578 $ 0.21 $ (12,991) $ (0.19) $ (18,738) $ (0.27) Adjustments Non-cash equity compensation expense 1,559 0.02 2,180 0.03 1,565 0.02 Depreciation and amortization 739 0.01 732 0.01 — — Unrealized (gains) or losses, net (244) — (344) — 419 0.01 Provision for credit losses, net 4,594 0.07 38,200 0.55 49,500 0.71 Distributable Earnings before realized loss $ 21,226 $ 0.31 $ 27,777 $ 0.40 $ 32,746 $ 0.47 Realized loss on loan write-offs, net(2) (35,902) (0.52) (1,832) (0.03) (58,706) (0.85) Distributable Earnings (Loss) $ (14,676) $ (0.21) $ 25,945 $ 0.37 $ (25,960) $ (0.37) Diluted weighted average common shares outstanding 69,342,983 69,434,938 69,384,309
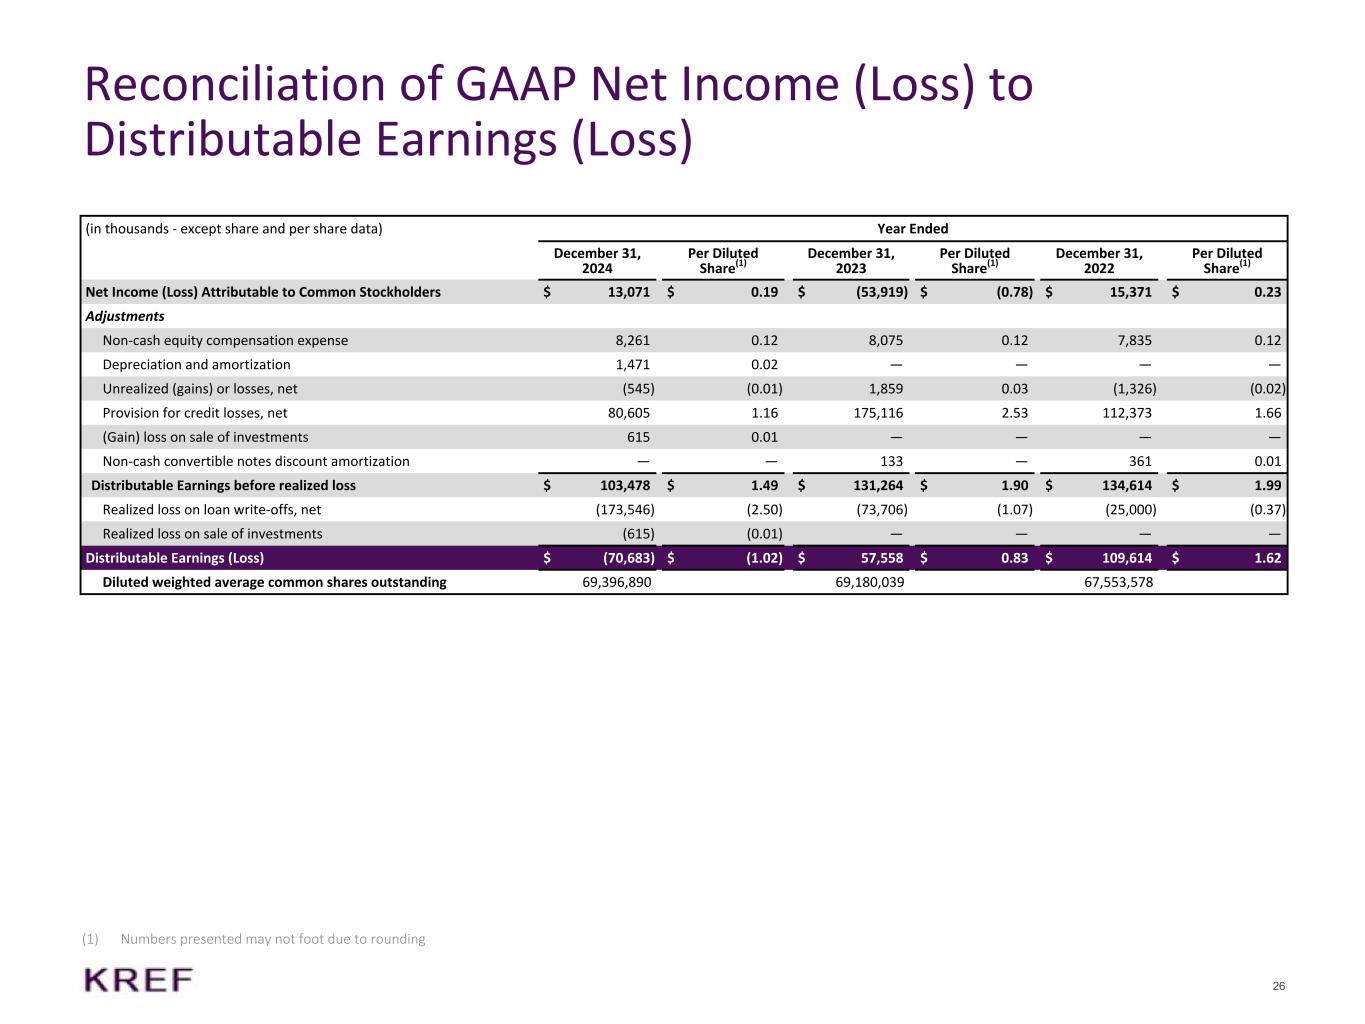
26 Reconciliation of GAAP Net Income (Loss) to Distributable Earnings (Loss) (1) Numbers presented may not foot due to rounding (in thousands - except share and per share data) Year Ended December 31, 2024 Per Diluted Share(1) December 31, 2023 Per Diluted Share(1) December 31, 2022 Per Diluted Share(1) Net Income (Loss) Attributable to Common Stockholders $ 13,071 $ 0.19 $ (53,919) $ (0.78) $ 15,371 $ 0.23 Adjustments Non-cash equity compensation expense 8,261 0.12 8,075 0.12 7,835 0.12 Depreciation and amortization 1,471 0.02 — — — — Unrealized (gains) or losses, net (545) (0.01) 1,859 0.03 (1,326) (0.02) Provision for credit losses, net 80,605 1.16 175,116 2.53 112,373 1.66 (Gain) loss on sale of investments 615 0.01 — — — — Non-cash convertible notes discount amortization — — 133 — 361 0.01 Distributable Earnings before realized loss $ 103,478 $ 1.49 $ 131,264 $ 1.90 $ 134,614 $ 1.99 Realized loss on loan write-offs, net (173,546) (2.50) (73,706) (1.07) (25,000) (0.37) Realized loss on sale of investments (615) (0.01) — — — — Distributable Earnings (Loss) $ (70,683) $ (1.02) $ 57,558 $ 0.83 $ 109,614 $ 1.62 Diluted weighted average common shares outstanding 69,396,890 69,180,039 67,553,578
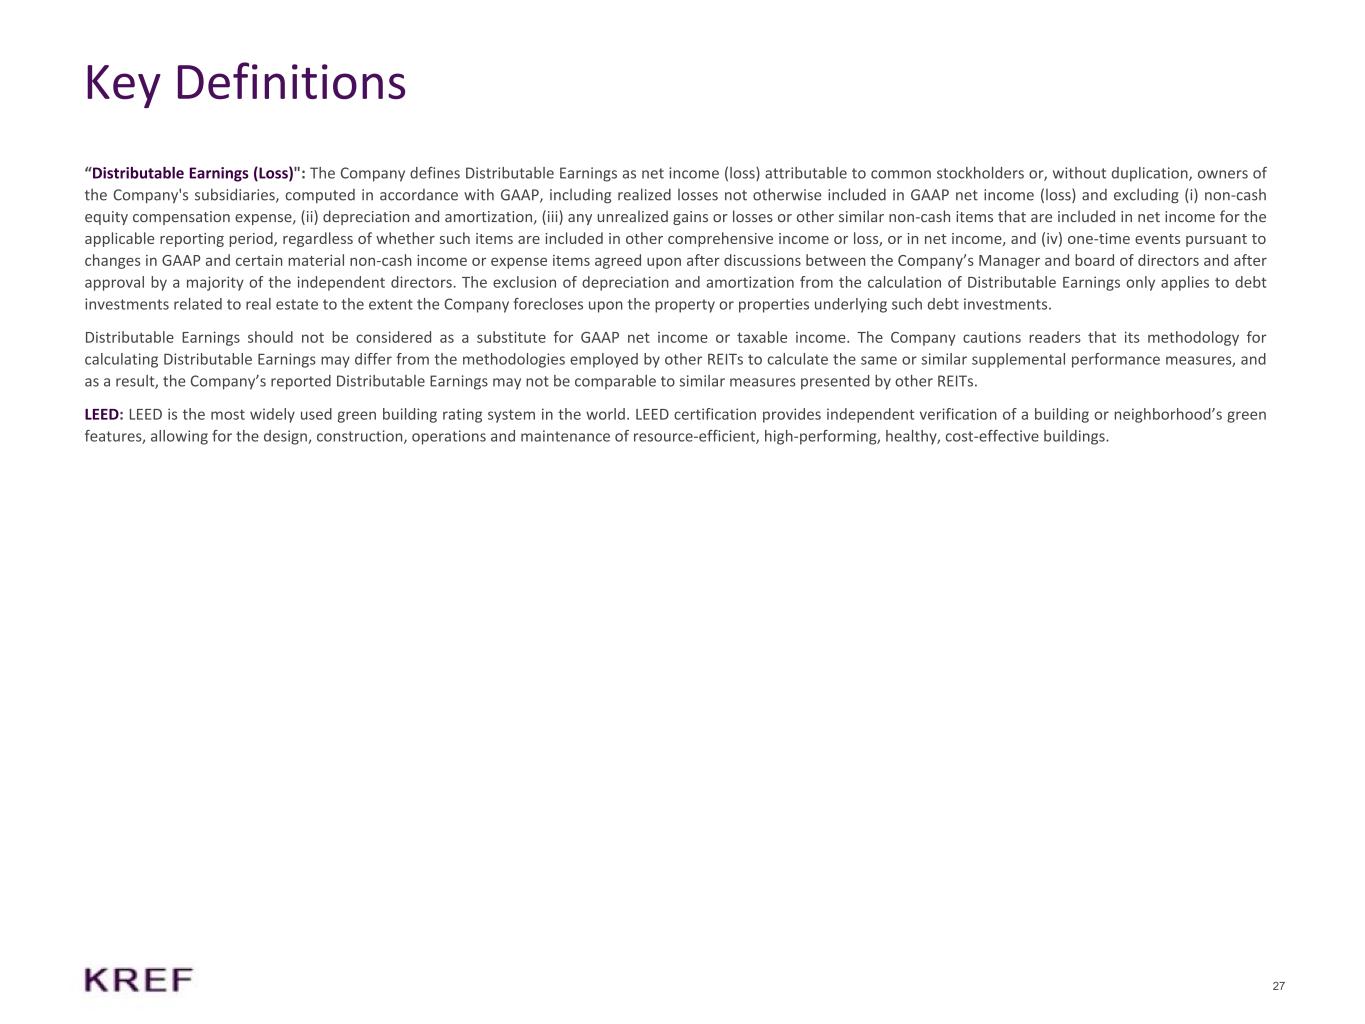
27 Key Definitions “Distributable Earnings (Loss)": The Company defines Distributable Earnings as net income (loss) attributable to common stockholders or, without duplication, owners of the Company's subsidiaries, computed in accordance with GAAP, including realized losses not otherwise included in GAAP net income (loss) and excluding (i) non-cash equity compensation expense, (ii) depreciation and amortization, (iii) any unrealized gains or losses or other similar non-cash items that are included in net income for the applicable reporting period, regardless of whether such items are included in other comprehensive income or loss, or in net income, and (iv) one-time events pursuant to changes in GAAP and certain material non-cash income or expense items agreed upon after discussions between the Company’s Manager and board of directors and after approval by a majority of the independent directors. The exclusion of depreciation and amortization from the calculation of Distributable Earnings only applies to debt investments related to real estate to the extent the Company forecloses upon the property or properties underlying such debt investments. Distributable Earnings should not be considered as a substitute for GAAP net income or taxable income. The Company cautions readers that its methodology for calculating Distributable Earnings may differ from the methodologies employed by other REITs to calculate the same or similar supplemental performance measures, and as a result, the Company’s reported Distributable Earnings may not be comparable to similar measures presented by other REITs. LEED: LEED is the most widely used green building rating system in the world. LEED certification provides independent verification of a building or neighborhood’s green features, allowing for the design, construction, operations and maintenance of resource-efficient, high-performing, healthy, cost-effective buildings.


