Exhibit (C)(4)

C O N F I D E N T I A L 2 8 A U G U S T 2 0 2 0 P R E S E N TAT I O N T O T H E B O A R D O F D I R E C T O R S Project Tropics
C O N F I D E N T I A L P R O J E C T T R O P I C S Disclaimer The information herein has been prepared by Lazard based upon information supplied by the Company or publicly available information, and portions of the information herein may be based upon certain statements, estimates and forecasts provided by the Company with respect to the anticipated future performance of the Company. We have relied upon the accuracy and completeness of the foregoing information, and have not assumed any responsibility for any independent verification of such information or any independent valuation or appraisal of any of the assets or liabilities (contingent or otherwise) of the Company, or concerning solvency or fair value of the Company. With respect to financial forecasts, we have assumed that they have been reasonably prepared on bases reflecting the best currently available estimates and judgments of management of the Company as to the future financial performance of the Company. We have relied on the assessments of the Company as to the validity of, and risks associated with, the products and product candidates of the Company (including, without limitation, the timing and probability of successful development, testing and marketing of such products and product candidates and approval thereof by appropriate governmental authorities). We assume no responsibility for and express no view as to such forecasts or the assumptions on which they are based, including with respect to the potential effects of the COVID-19 pandemic on such forecasts or assumptions. The information set forth herein is based upon economic, monetary, market and other conditions as in effect on, and the information made available to us as of, the date hereof, unless indicated otherwise. The current volatility and disruption in the credit and financial markets relating to, among others, the COVID-19 pandemic, may or may not have an effect on the Company and we are not expressing an opinion as to the effects of such volatility or such disruption on the Company. These materials and the information contained herein are confidential and may not be disclosed publicly or made available to third parties without the prior written consent of Lazard; provided, however, that you may disclose to any and all persons the U.S. federal income tax treatment and tax structure of the transaction described herein and the portions of these materials that relate to such tax treatment or structure. Lazard is acting as investment banker to the Company, and will not be responsible for and will not provide any tax, accounting, actuarial, legal or other specialist advice.
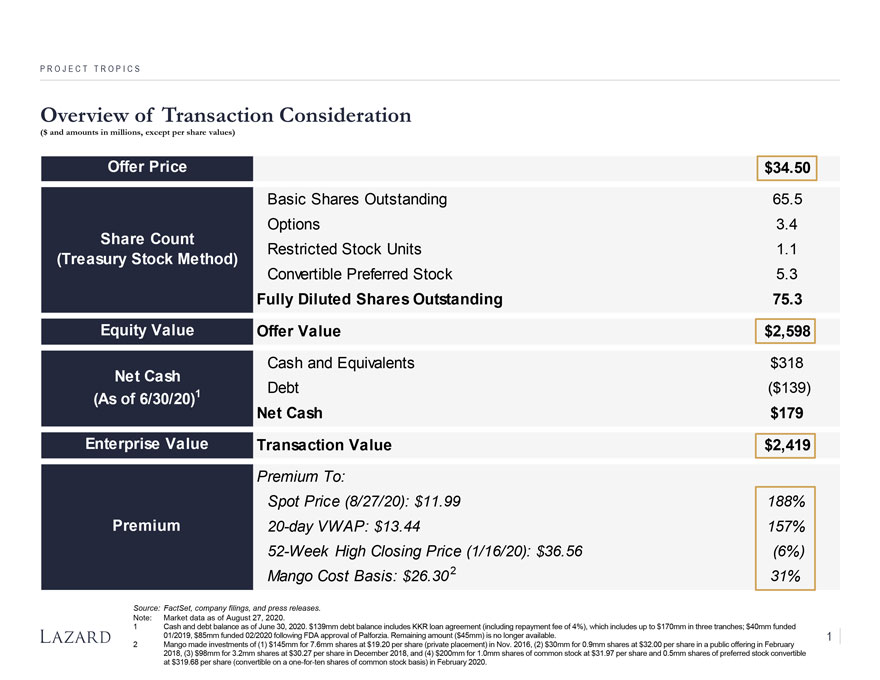
P R O J E C T T R O P I C S Overview of Transaction Consideration ($ and amounts in millions, except per share values) Offer Price $34.50 Basic Shares Outstanding 65.5 Options 3.4 Share Count Restricted Stock Units 1.1 (Treasury Stock Method) Convertible Preferred Stock 5.3 Fully Diluted Shares Outstanding 75.3 Equity Value Offer Value $2,598 Net Cash Cash and Equivalents $318 1 Debt ($139) (As of 6/30/20) Net Cash $179 Enterprise Value Transaction Value $2,419 Premium To: Spot Price (8/27/20): $11.99 188% Premium 20-day VWAP: $13.44 157% 52-Week High Closing Price (1/16/20): $36.56 (6%) Mango Cost Basis: $26.302 31% Source: FactSet, company filings, and press releases. Note: Market data as of August 27, 2020. 1 Cash and debt balance as of June 30, 2020. $139mm debt balance includes KKR loan agreement (including repayment fee of 4%), which includes up to $170mm in three tranches; $40mm funded 01/2019, $85mm funded 02/2020 following FDA approval of Palforzia. Remaining amount ($45mm) is no longer available. 1 2 Mango made investments of (1) $145mm for 7.6mm shares at $19.20 per share (private placement) in Nov. 2016, (2) $30mm for 0.9mm shares at $32.00 per share in a public offering in February 2018, (3) $98mm for 3.2mm shares at $30.27 per share in December 2018, and (4) $200mm for 1.0mm shares of common stock at $31.97 per share and 0.5mm shares of preferred stock convertible at $319.68 per share (convertible on a one-for-ten shares of common stock basis) in February 2020.
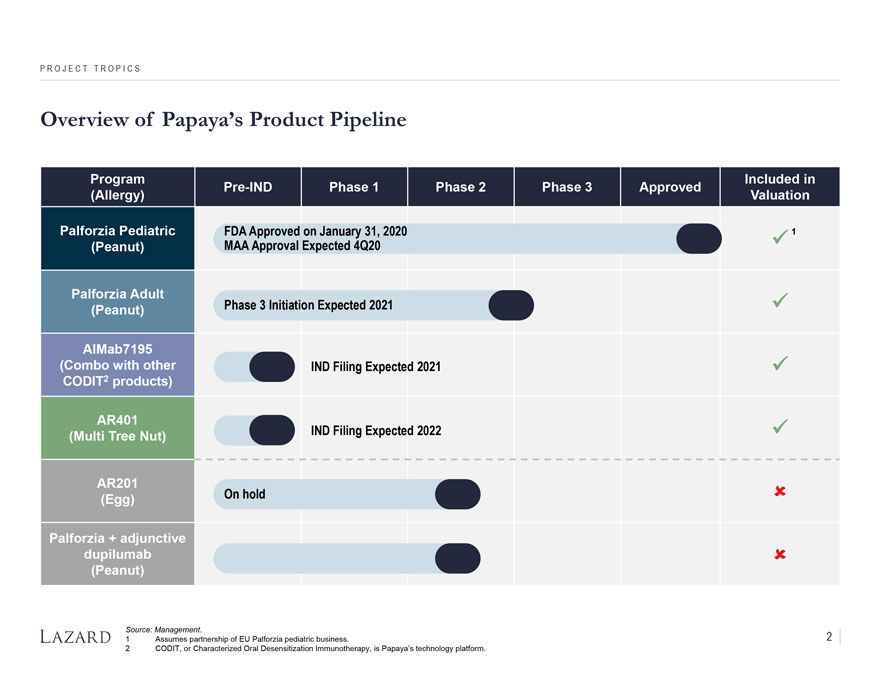
P R O J E C T T R O P I C S Overview of Papaya’s Product Pipeline Program Included in Pre-IND Phase 1 Phase 2 Phase 3 Approved (Allergy) Valuation Palforzia Pediatric FDA Approved on January 31, 2020 1 (Peanut) MAA Approval Expected 4Q20 Palforzia Adult (Peanut) Phase 3 Initiation Expected 2021 AIMab7195 (Combo with other IND Filing Expected 2021 CODIT2 products) AR401 (Multi Tree Nut) IND Filing Expected 2022 AR201 (Egg) On hold Palforzia + adjunctive dupilumab (Peanut) Source: Management. 1 Assumes partnership of EU Palforzia pediatric business. 2 2 CODIT, or Characterized Oral Desensitization Immunotherapy, is Papaya’s technology platform.
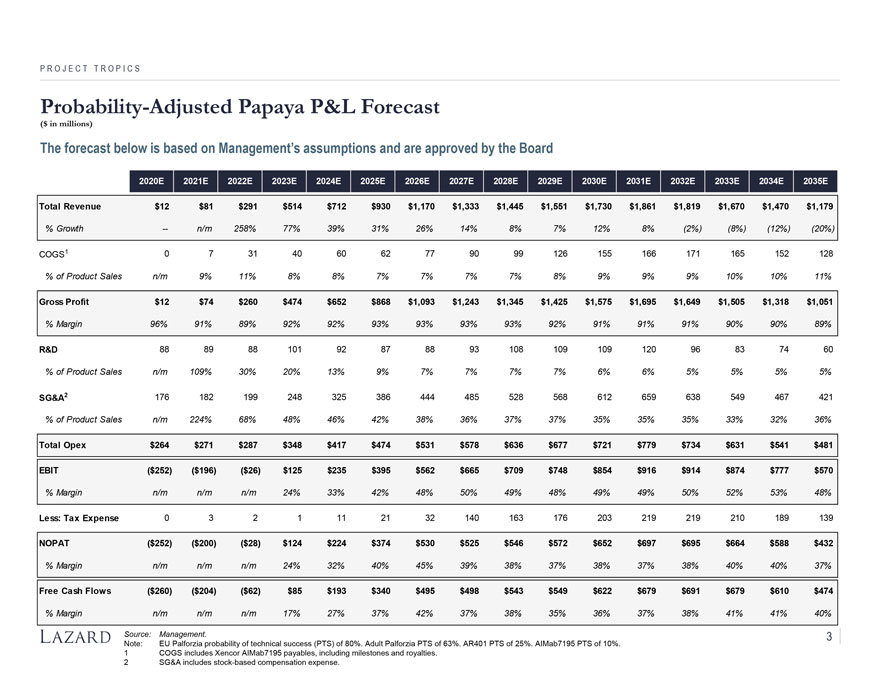
P R O J E C T T R O P I C S Probability-Adjusted Papaya P&L Forecast ($ in millions) The forecast below is based on Management’s assumptions and are approved by the Board 2020E 2021E 2022E 2023E 2024E 2025E 2026E 2027E 2028E 2029E 2030E 2031E 2032E 2033E 2034E 2035E Total Revenue $12 $81 $291 $514 $712 $930 $1,170 $1,333 $1,445 $1,551 $1,730 $1,861 $1,819 $1,670 $1,470 $1,179 % Growth — n/m 258% 77% 39% 31% 26% 14% 8% 7% 12% 8% (2%) (8%) (12%) (20%) COGS1 0 7 31 40 60 62 77 90 99 126 155 166 171 165 152 128 % of Product Sales n/m 9% 11% 8% 8% 7% 7% 7% 7% 8% 9% 9% 9% 10% 10% 11% Gross Profit $12 $74 $260 $474 $652 $868 $1,093 $1,243 $1,345 $1,425 $1,575 $1,695 $1,649 $1,505 $1,318 $1,051 % Margin 96% 91% 89% 92% 92% 93% 93% 93% 93% 92% 91% 91% 91% 90% 90% 89% R&D 88 89 88 101 92 87 88 93 108 109 109 120 96 83 74 60 % of Product Sales n/m 109% 30% 20% 13% 9% 7% 7% 7% 7% 6% 6% 5% 5% 5% 5% SG&A2 176 182 199 248 325 386 444 485 528 568 612 659 638 549 467 421 % of Product Sales n/m 224% 68% 48% 46% 42% 38% 36% 37% 37% 35% 35% 35% 33% 32% 36% Total Opex $264 $271 $287 $348 $417 $474 $531 $578 $636 $677 $721 $779 $734 $631 $541 $481 EBIT ($252) ($196) ($26) $125 $235 $395 $562 $665 $709 $748 $854 $916 $914 $874 $777 $570 % Margin n/m n/m n/m 24% 33% 42% 48% 50% 49% 48% 49% 49% 50% 52% 53% 48% Less: Tax Expense 0321 11 21 32 140 163 176 203 219 219 210 189 139 NOPAT ($252) ($200) ($28) $124 $224 $374 $530 $525 $546 $572 $652 $697 $695 $664 $588 $432 % Margin n/m n/m n/m 24% 32% 40% 45% 39% 38% 37% 38% 37% 38% 40% 40% 37% Free Cash Flows ($260) ($204) ($62) $85 $193 $340 $495 $498 $543 $549 $622 $679 $691 $679 $610 $474 % Margin n/m n/m n/m 17% 27% 37% 42% 37% 38% 35% 36% 37% 38% 41% 41% 40% Source: Management. 3 Note: EU Palforzia probability of technical success (PTS) of 80%. Adult Palforzia PTS of 63%. AR401 PTS of 25%. AIMab7195 PTS of 10%. 1 COGS includes Xencor AIMab7195 payables, including milestones and royalties. 2 SG&A includes stock-based compensation expense.

P R O J E C T T R O P I C S Papaya Valuation Summary ($ in billions, except per share values) Method Equity Value Per Share Implied TEV Comments Current Price: Offer Price: $11.99 $34.50 15.25-year probability-adjusted sum-of-Discounted the-parts DCF from 4Q20 to 2035 $29.55 $36.90 $2.0 – $2.6 Cash Flow WACC range of 10% – 12% Terminal growth rate of (40%) – (20%)1 1.9x – 4.0x Papaya’s unadjusted FY+3 Public $16.00 $30.10 $1.0 – $2.1 revenue of ~$515mm, based on 25th to Comparables 75th percentile of selected comparable companies 3.3x – 4.4x Papaya’s unadjusted FY+3 Precedent $25.55 $32.70 $1.7 – $2.3 revenue of ~$515mm, based on 25th to Transactions 75th percentile of selected precedent transactions DCF analysis including an illustrative DCF with 2021 $27.30 $34.25 $2.1 – $2.7 $125mm equity offering2 Only Equity Raise 70% – 110% 1-day premium to unaffected, based on 25th to 75th pctl. Premia Paid $20.40 $25.20 $1.5 – $1.9 of selected biotech transactions since Purposes 2017 with TV of $1-$10bn Analyst price target range of 11 Analyst Price research analysts $15.00 $66.00 $0.9 – $5.0 Reference Target Range Median price target of $35 per share For 52-week trading range of $11.48 per 52-Week share (Mar. 16, 2020) to $36.56 per $11.50 $36.55 $0.7 – $2.6 Trading Range share (Jan. 16, 2020) $0 $10 $20 $30 $40 $50 $60 $70 Source: Management, equity research, and FactSet. 4 Note: Market data as of August 27, 2020. Per share values rounded to the nearest $0.05 per share. 1 Midpoint of the range is $32.70 per share assuming 11% WACC and TGR of -30%. Terminal value represents ~6% to ~13% of total enterprise value. 2 Papaya raises $125mm assuming a 10% discount to assumed share price of $13.50 per share, resulting in ~10.3mm shares issued. Net proceeds of $115mm assuming an 8% transaction fee.
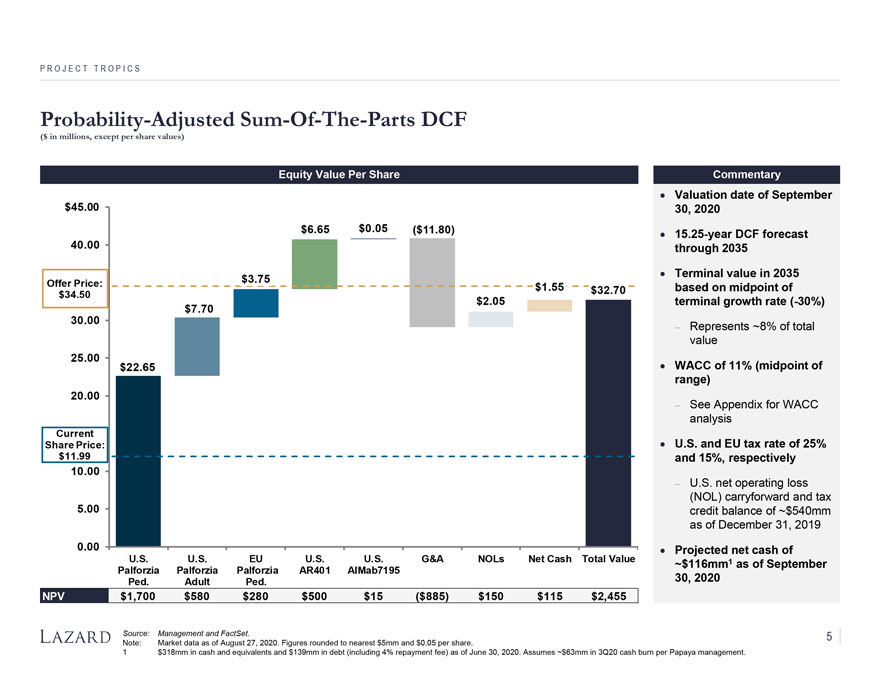
P R O J E C T T R O P I C S Probability-Adjusted Sum-Of-The-Parts DCF ($ in millions, except per share values) Equity Value Per Share Commentary Valuation date of September $45.00 30, 2020 $6.65 $0.05 ($11.80) 40.00 15.25-year DCF forecast through 2035 Terminal value in 2035 Offer Price: $3.75 $1.55 $32.70 based on midpoint of $34.50 $2.05 terminal growth rate (-30%) $7.70 30.00 Represents ~8% of total value 25.00 $22.65 WACC of 11% (midpoint of range) 20.00 See Appendix for WACC analysis Current U.S. and EU tax rate of Share Price: 25% $11.99 and 15%, respectively 10.00 U.S. net operating loss (NOL) carryforward and tax 5.00 credit balance of ~$540mm as of December 31, 2019 0.00 Projected net cash of U.S. U.S. EU U.S. U.S. G&A NOLs Net Cash Total Value ~$116mm1 as of September Palforzia Palforzia Palforzia AR401 AIMab7195 Ped. Adult Ped. 30, 2020 NPV $1,700 $580 $280 $500 $15 ($885) $150 $115 $2,455 Source: Management and FactSet. 5 Note: Market data as of August 27, 2020. Figures rounded to nearest $5mm and $0.05 per share. 1 $318mm in cash and equivalents and $139mm in debt (including 4% repayment fee) as of June 30, 2020. Assumes ~$63mm in 3Q20 cash burn per Papaya management.
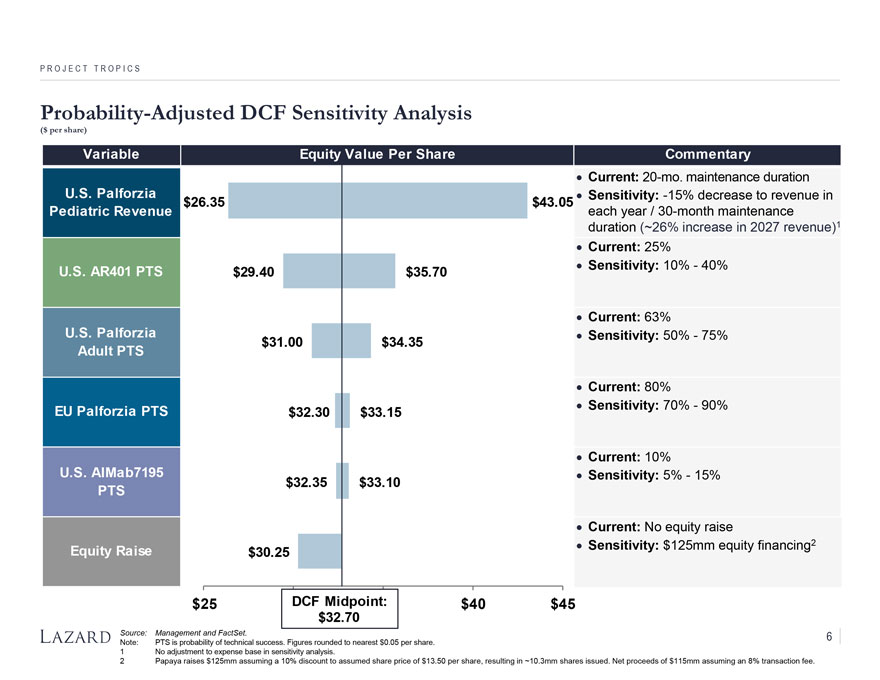
P R O J E C T T R O P I C S Probability-Adjusted DCF Sensitivity Analysis ($ per share) Variable Equity Value Per Share Commentary Current: 20-mo. maintenance duration U.S. Palforzia Sensitivity: -15% decrease to revenue in $26.35 $43.05 Pediatric Revenue each year / 30-month maintenance duration (~26% increase in 2027 revenue)1 Current: 25% Sensitivity: 10%—40% U.S. AR401 PTS $29.40 $35.70 Current: 63% U.S. Palforzia Sensitivity: 50%—75% $31.00 $34.35 Adult PTS Current: 80% EU Palforzia PTS Sensitivity: 70%—90% $32.30 $33.15 Current: 10% U.S. AIMab7195 Sensitivity: 5%—15% $32.35 $33.10 PTS Current: No equity raise Sensitivity: $125mm equity financing2 Equity Raise $30.25 $25 DCF Midpoint: $40 $45 $32.70 Source: Management and FactSet. 6 Note: PTS is probability of technical success. Figures rounded to nearest $0.05 per share. 1 No adjustment to expense base in sensitivity analysis. 2 Papaya raises $125mm assuming a 10% discount to assumed share price of $13.50 per share, resulting in ~10.3mm shares issued. Net proceeds of $115mm assuming an 8% transaction fee.
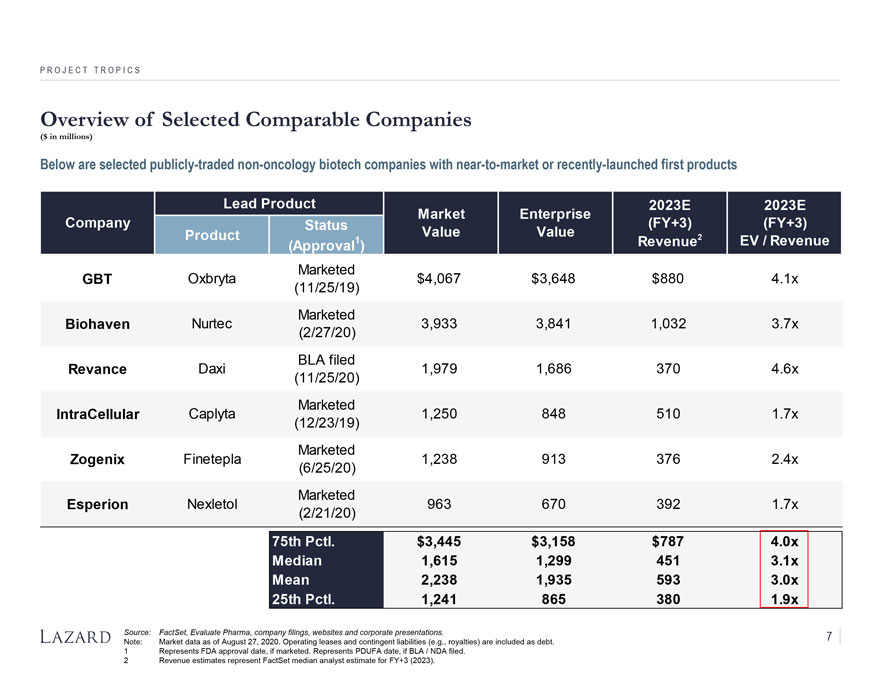
P R O J E C T T R O P I C S Overview of Selected Comparable Companies ($ in millions) Below are selected publicly-traded non-oncology biotech companies with near-to-market or recently-launched first products Lead Product 2023E 2023E Market Enterprise Company Status (FY+3) (FY+3) Product Value Value 2 (Approval1) Revenue EV / Revenue Marketed GBT Oxbryta $4,067 $3,648 $880 4.1x (11/25/19) Marketed Biohaven Nurtec 3,933 3,841 1,032 3.7x (2/27/20) BLA filed Revance Daxi 1,979 1,686 370 4.6x (11/25/20) Marketed IntraCellular Caplyta 1,250 848 510 1.7x (12/23/19) Marketed Zogenix Finetepla 1,238 913 376 2.4x (6/25/20) Marketed Esperion Nexletol 963 670 392 1.7x (2/21/20) 75th Pctl. $3,445 $3,158 $787 4.0x Median 1,615 1,299 451 3.1x Mean 2,238 1,935 593 3.0x 25th Pctl. 1,241 865 380 1.9x Source: FactSet, Evaluate Pharma, company filings, websites and corporate presentations. 7 Note: Market data as of August 27, 2020. Operating leases and contingent liabilities (e.g., royalties) are included as debt. 1 Represents FDA approval date, if marketed. Represents PDUFA date, if BLA / NDA filed. 2 Revenue estimates represent FactSet median analyst estimate for FY+3 (2023).
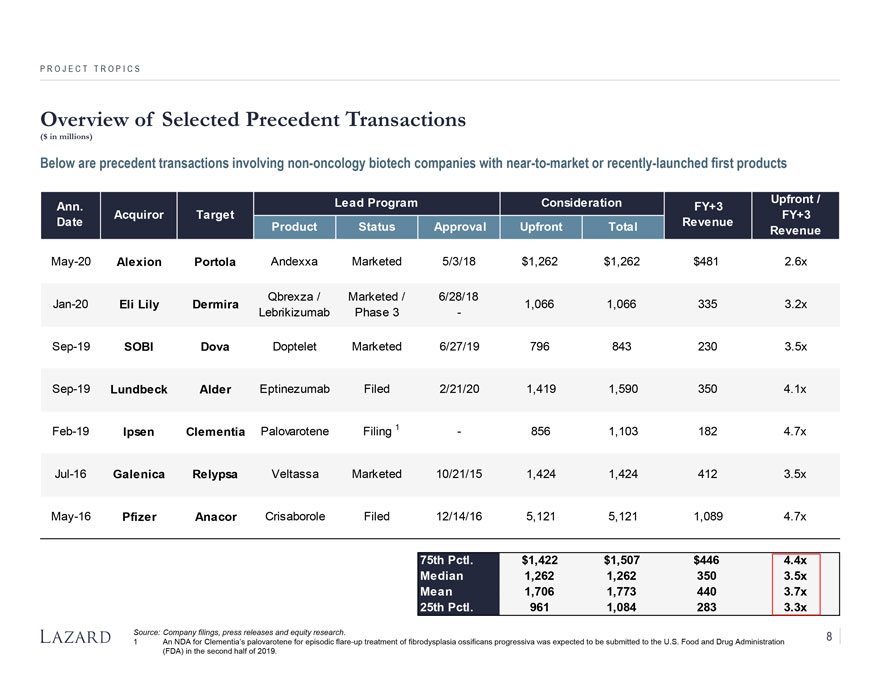
P R O J E C T T R O P I C S Overview of Selected Precedent Transactions ($ in millions) Below are precedent transactions involving non-oncology biotech companies with near-to-market or recently-launched first products Lead Program Consideration Upfront / Ann. FY+3 Acquiror Target FY+3 Date Product Status Approval Upfront Total Revenue Revenue May-20 Alexion Portola Andexxa Marketed 5/3/18 $1,262 $1,262 $481 2.6x Qbrexza / Marketed / 6/28/18 Jan-20 Eli Lily Dermira 1,066 1,066 335 3.2x Lebrikizumab Phase 3—Sep-19 SOBI Dova Doptelet Marketed 6/27/19 796 843 230 3.5x Sep-19 Lundbeck Alder Eptinezumab Filed 2/21/20 1,419 1,590 350 4.1x Feb-19 Ipsen Clementia Palovarotene Filing 1—856 1,103 182 4.7x Jul-16 Galenica Relypsa Veltassa Marketed 10/21/15 1,424 1,424 412 3.5x May-16 Pfizer Anacor Crisaborole Filed 12/14/16 5,121 5,121 1,089 4.7x 75th Pctl. $1,422 $1,507 $446 4.4x Median 1,262 1,262 350 3.5x Mean 1,706 1,773 440 3.7x 25th Pctl. 961 1,084 283 3.3x Source: Company filings, press releases and equity research. 8 1 An NDA for Clementia’s palovarotene for episodic flare-up treatment of fibrodysplasia ossificans progressiva was expected to be submitted to the U.S. Food and Drug Administration (FDA) in the second half of 2019.
C O N F I D E N T I A L P R O J E C T T R O P I C S Appendix
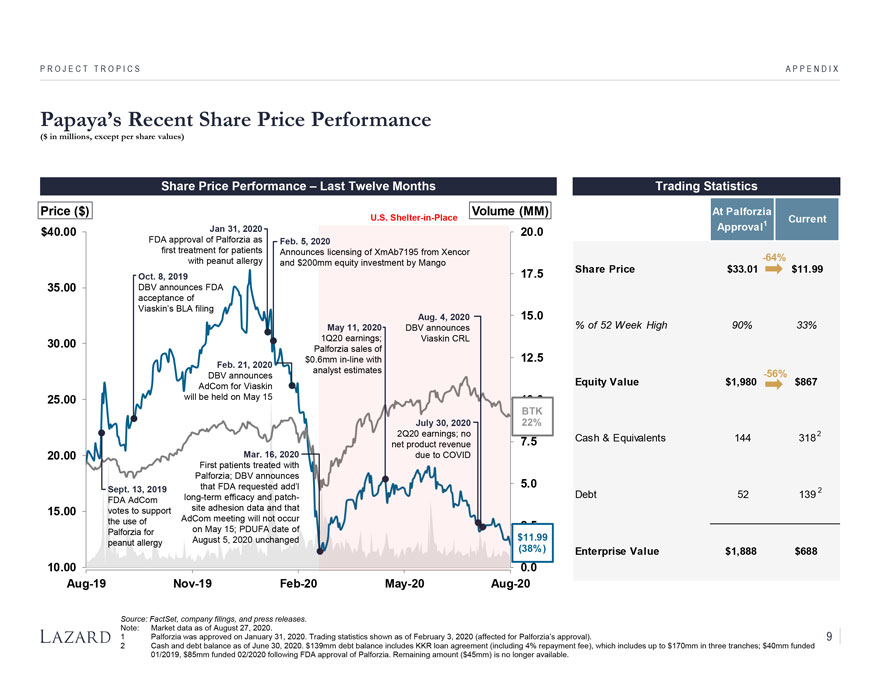
P R O J E C T T R O P I C S APPENDIX Papaya’s Recent Share Price Performance ($ in millions, except per share values) Share Price Performance – Last Twelve Months Trading Statistics Price ($) Volume (MM) At Palforzia U.S. Shelter-in-Place Current Approval1 $40.00 Jan 31, 2020 20.0 FDA approval of Palforzia as Feb. 5, 2020 first treatment for patients Announces licensing of XmAb7195 from Xencor with peanut allergy -64% and $200mm equity investment by Mango 17.5 Share Price $33.01 $11.99 Oct. 8, 2019 35.00 DBV announces FDA acceptance of Viaskin’s BLA filing Aug. 4, 2020 15.0 May 11, 2020 DBV announces % of 52 Week High 90% 33% 30.00 1Q20 earnings; Viaskin CRL Palforzia sales of $0.6mm in-line with 12.5 Feb. 21, 2020 analyst estimates -56% DBV announces AdCom for Viaskin Equity Value $1,980 $867 25.00 will be held on May 15 BTK July 30, 2020 22% 2Q20 earnings; no Cash & Equivalents 144 3182 net product revenue 7.5 20.00 Mar. 16, 2020 due to COVID First patients treated with Palforzia; DBV announces that FDA requested add’l 5.0 Sept. 13, 2019 2 long-term efficacy and patch- Debt 52 139 FDA AdCom site adhesion data and that 15.00 votes to support AdCom meeting will not occur the use of on May 15; PDUFA date of Palforzia for August 5, 2020 unchanged $11.99 peanut allergy (38%) Enterprise Value $1,888 $688 10.00 0.0 Aug-19 Nov-19 Feb-20 May-20 Aug-20 Source: FactSet, company filings, and press releases. Note: Market data as of August 27, 2020. 1 Palforzia was approved on January 31, 2020. Trading statistics shown as of February 3, 2020 (affected for Palforzia’s approval). 9 2 Cash and debt balance as of June 30, 2020. $139mm debt balance includes KKR loan agreement (including 4% repayment fee), which includes up to $170mm in three tranches; $40mm funded 01/2019, $85mm funded 02/2020 following FDA approval of Palforzia. Remaining amount ($45mm) is no longer available.
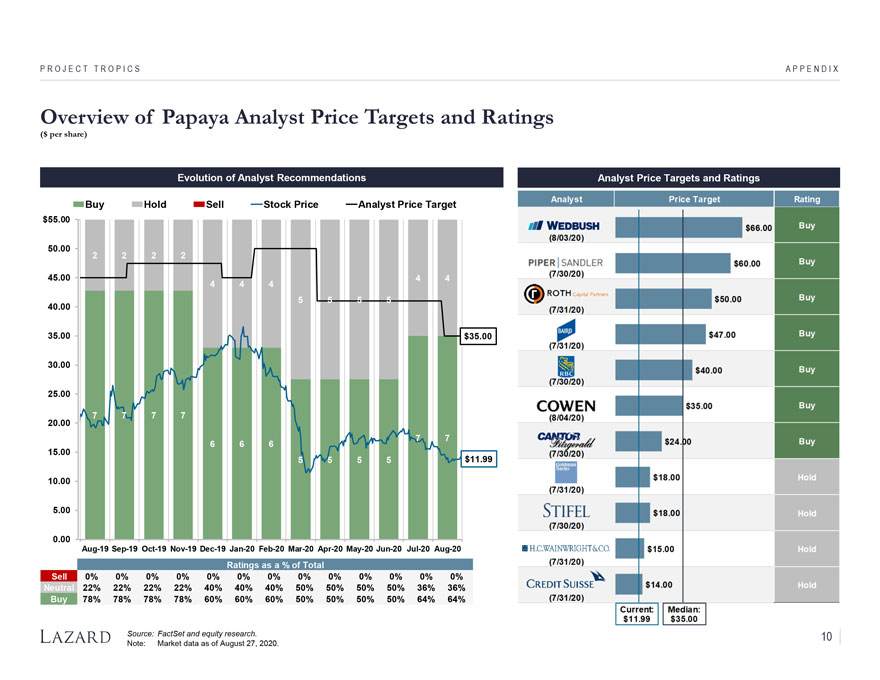
P R O J E C T T R O P I C S APPENDIX Overview of Papaya Analyst Price Targets and Ratings ($ per share) Evolution of Analyst Recommendations Analyst Price Targets and Ratings Buy Hold Sell Stock Price Analyst Price Target $55.00 50.00 2 2 2 2 45.00 4 4 4 4 4 5 5 5 5 40.00 35.00 $35.00 30.00 25.00 20.00 7 7 7 7 7 7 15.00 6 6 6 5 5 5 5 $11.99 10.00 5.00 0.00 Aug-19 Sep-19 Oct-19 Nov-19 Dec-19 Jan-20 Feb-20 Mar-20 Apr-20 May-20 Jun-20 Jul-20 Aug-20 Ratings as a % of Total Sell 0% 0% 0% 0% 0% 0% 0% 0% 0% 0% 0% 0% 0% Neutral 22% 22% 22% 22% 40% 40% 40% 50% 50% 50% 50% 36% 36% Buy 78% 78% 78% 78% 60% 60% 60% 50% 50% 50% 50% 64% 64% Source: FactSet and equity research. 10 Note: Market data as of August 27, 2020.
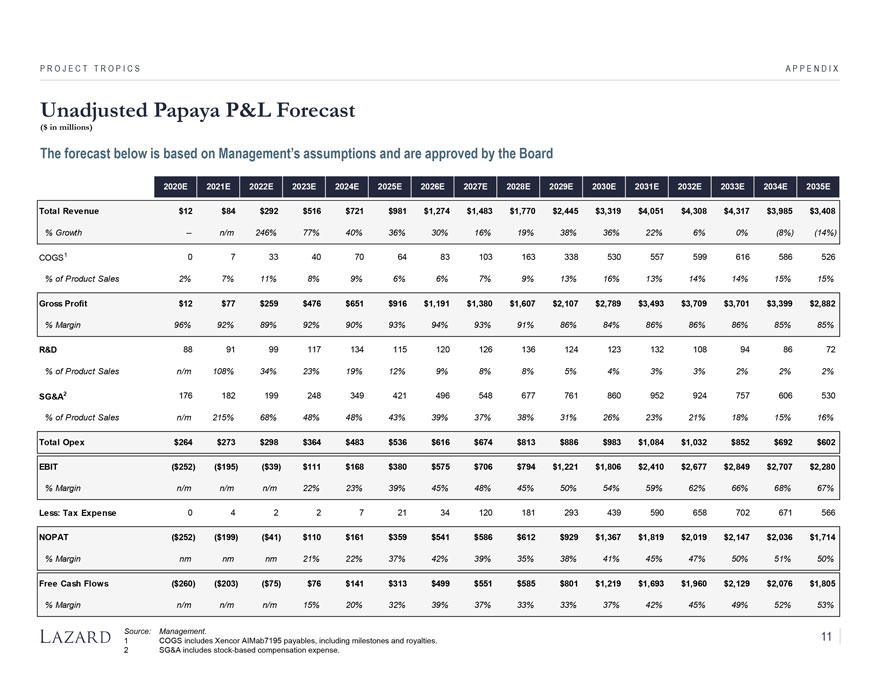
P R O J E C T T R O P I C S A P P E N D I X Unadjusted Papaya P&L Forecast ($ in millions) The forecast below is based on Management’s assumptions and are approved by the Board 2020E 2021E 2022E 2023E 2024E 2025E 2026E 2027E 2028E 2029E 2030E 2031E 2032E 2033E 2034E 2035E Total Revenue $12 $84 $292 $516 $721 $981 $1,274 $1,483 $1,770 $2,445 $3,319 $4,051 $4,308 $4,317 $3,985 $3,408 % Growth — n/m 246% 77% 40% 36% 30% 16% 19% 38% 36% 22% 6% 0% (8%) (14%) COGS1 0 7 33 40 70 64 83 103 163 338 530 557 599 616 586 526 % of Product Sales 2% 7% 11% 8% 9% 6% 6% 7% 9% 13% 16% 13% 14% 14% 15% 15% Gross Profit $12 $77 $259 $476 $651 $916 $1,191 $1,380 $1,607 $2,107 $2,789 $3,493 $3,709 $3,701 $3,399 $2,882 % Margin 96% 92% 89% 92% 90% 93% 94% 93% 91% 86% 84% 86% 86% 86% 85% 85% R&D 88 91 99 117 134 115 120 126 136 124 123 132 108 94 86 72 % of Product Sales n/m 108% 34% 23% 19% 12% 9% 8% 8% 5% 4% 3% 3% 2% 2% 2% SG&A2 176 182 199 248 349 421 496 548 677 761 860 952 924 757 606 530 % of Product Sales n/m 215% 68% 48% 48% 43% 39% 37% 38% 31% 26% 23% 21% 18% 15% 16% Total Opex $264 $273 $298 $364 $483 $536 $616 $674 $813 $886 $983 $1,084 $1,032 $852 $692 $602 EBIT ($252) ($195) ($39) $111 $168 $380 $575 $706 $794 $1,221 $1,806 $2,410 $2,677 $2,849 $2,707 $2,280 % Margin n/m n/m n/m 22% 23% 39% 45% 48% 45% 50% 54% 59% 62% 66% 68% 67% Less: Tax Expense 0 4 2 2 7 21 34 120 181 293 439 590 658 702 671 566 NOPAT ($252) ($199) ($41) $110 $161 $359 $541 $586 $612 $929 $1,367 $1,819 $2,019 $2,147 $2,036 $1,714 % Margin nm nm nm 21% 22% 37% 42% 39% 35% 38% 41% 45% 47% 50% 51% 50% Free Cash Flows ($260) ($203) ($75) $76 $141 $313 $499 $551 $585 $801 $1,219 $1,693 $1,960 $2,129 $2,076 $1,805 % Margin n/m n/m n/m 15% 20% 32% 39% 37% 33% 33% 37% 42% 45% 49% 52% 53% Source: Management. 11 1 COGS includes Xencor AIMab7195 payables, including milestones and royalties. 2 SG&A includes stock-based compensation expense.
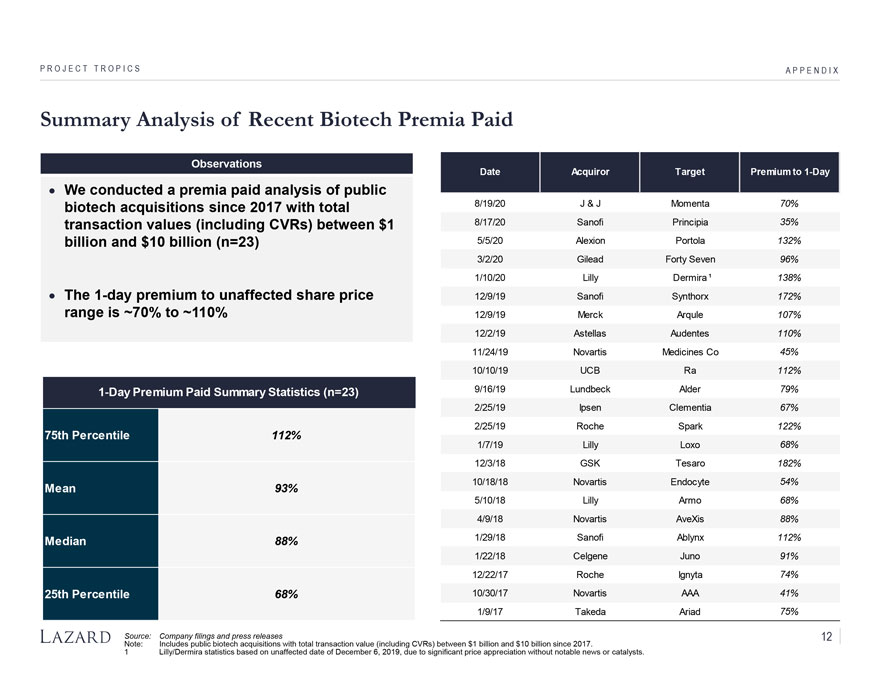
P R O J E C T T R O P I C S APPENDIX Summary Analysis of Recent Biotech Premia Paid Observations Date Acquiror Target Premium to 1-Day We conducted a premia paid analysis of public biotech acquisitions since 2017 with total 8/19/20 J & J Momenta 70% transaction values (including CVRs) between $1 8/17/20 Sanofi Principia 35% billion and $10 billion (n 23) 5/5/20 Alexion Portola 132% 3/2/20 Gilead Forty Seven 96% 1/10/20 Lilly Dermira 1 138% The 1-day premium to unaffected share price 12/9/19 Sanofi Synthorx 172% range is ~70% to ~110% 12/9/19 Merck Arqule 107% 12/2/19 Astellas Audentes 110% 11/24/19 Novartis Medicines Co 45% 10/10/19 UCB Ra 112% 1-Day Premium Paid Summary Statistics (n 23) 9/16/19 Lundbeck Alder 79% 2/25/19 Ipsen Clementia 67% 2/25/19 Roche Spark 122% 75th Percentile 112% 1/7/19 Lilly Loxo 68% 12/3/18 GSK Tesaro 182% 10/18/18 Novartis Endocyte 54% Mean 93% 5/10/18 Lilly Armo 68% 4/9/18 Novartis AveXis 88% Median 88% 1/29/18 Sanofi Ablynx 112% 1/22/18 Celgene Juno 91% 12/22/17 Roche Ignyta 74% 25th Percentile 68% 10/30/17 Novartis AAA 41% 1/9/17 Takeda Ariad 75% Source: Company filings and press releases 12 Note: Includes public biotech acquisitions with total transaction value (including CVRs) between $1 billion and $10 billion since 2017. 1 Lilly/Dermira statistics based on unaffected date of December 6, 2019, due to significant price appreciation without notable news or catalysts.
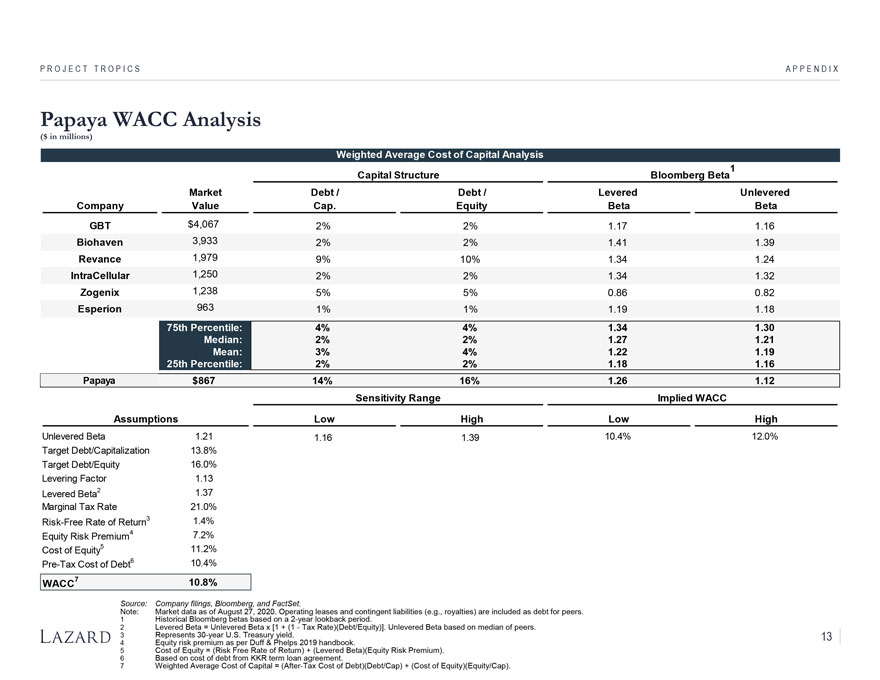
P R O J E C T T R O P I C S APPENDIX Papaya WACC Analysis ($ in millions) Weighted Average Cost of Capital Analysis 1 Capital Structure Bloomberg Beta Market Debt / Debt / Levered Unlevered Company Value Cap. Equity Beta Beta GBT $4,067 2% 2% 1.17 1.16 Biohaven 3,933 2% 2% 1.41 1.39 Revance 1,979 9% 10% 1.34 1.24 IntraCellular 1,250 2% 2% 1.34 1.32 Zogenix 1,238 5% 5% 0.86 0.82 Esperion 963 1% 1% 1.19 1.18 75th Percentile: 4% 4% 1.34 1.30 Median: 2% 2% 1.27 1.21 Mean: 3% 4% 1.22 1.19 25th Percentile: 2% 2% 1.18 1.16 Aimmune Papaya $867 14% 16% 1.26 1.12 Sensitivity Range Implied WACC Assumptions Low High Low High Unlevered Beta 1.21 1.16 1.39 10.4% 12.0% Target Debt/Capitalization 13.8% Target Debt/Equity 16.0% Levering Factor 1.13 Levered Beta2 1.37 Marginal Tax Rate 21.0% Risk-Free Rate of Return3 1.4% Equity Risk Premium4 7.2% Cost of Equity5 11.2% Pre-Tax Cost of Debt6 10.4% WACC7 10.8% Source: Company filings, Bloomberg, and FactSet. Note: Market data as of August 27, 2020. Operating leases and contingent liabilities (e.g., royalties) are included as debt for peers. 1 Historical Bloomberg betas based on a 2-year lookback period. 2 Levered Beta Unlevered Beta x [1 + (1—Tax Rate)(Debt/Equity)]. Unlevered Beta based on median of peers. 3 Represents 30-year U.S. Treasury yield. 13 4 Equity risk premium as per Duff & Phelps 2019 handbook. 5 Cost of Equity (Risk Free Rate of Return) + (Levered Beta)(Equity Risk Premium). 6 Based on cost of debt from KKR term loan agreement. 7 Weighted Average Cost of Capital (After-Tax Cost of Debt)(Debt/Cap) + (Cost of Equity)(Equity/Cap).