UNITED STATES
SECURITIES AND EXCHANGE COMMISSION
Washington, D.C. 20549
FORM N-CSR
CERTIFIED SHAREHOLDER REPORT OF REGISTERED
MANAGEMENT INVESTMENT COMPANIES
Investment Company Act file number811-23027
John Hancock Collateral Trust
(Exact name of registrant as specified in charter)
200 Berkeley Street, Boston, Massachusetts 02116
(Address of principal executive offices) (Zip code)
Salvatore Schiavone
Treasurer
200 Berkeley Street
Boston, Massachusetts 02116
(Name and address of agent for service)
Registrant's telephone number, including area code:617-663-4497
| Date of fiscal year end: | December 31 |
| Date of reporting period: | December 31, 2019 |
ITEM 1. REPORTS TO STOCKHOLDERS.
John Hancock
Collateral Trust
Annual report 12/31/19
Beginning on January 1, 2021, as permitted by regulations adopted by the Securities and Exchange Commission, paper copies of the fund's shareholder reports like this one will no longer be sent by mail, unless you specifically request paper copies of the reports from the fund or from your financial intermediary. Instead, the reports will be made available on a website, and you will be notified by mail each time a report is posted and provided with a website link to access the report.
If you already elected to receive shareholder reports electronically, you will not be affected by this change, and you do not need to take any action. You may elect to receive shareholder reports and other communications electronically by calling John Hancock Investment Management or by contacting your financial intermediary.
You may elect to receive all reports in paper, free of charge, at any time. You can inform John Hancock Investment Management or your financial intermediary that you wish to continue receiving paper copies of your shareholder reports by following the instructions listed above. Your election to receive reports in paper will apply to all funds held with John Hancock Investment Management or your financial intermediary.

John Hancock
Collateral Trust
Table of contents
| 2 | Your fund at a glance | |
| 4 | Manager's discussion of fund performance | |
| 6 | A look at performance | |
| 7 | Your expenses | |
| 9 | Fund's investments | |
| 14 | Financial statements | |
| 17 | Financial highlights | |
| 18 | Notes to financial statements | |
| 23 | Report of independent registered public accounting firm | |
| 24 | Trustees and Officers | |
| 28 | More information |
INVESTMENT OBJECTIVE
The fund seeks current income, while maintaining adequate liquidity, safeguarding the return of principal and minimizing risk of default.
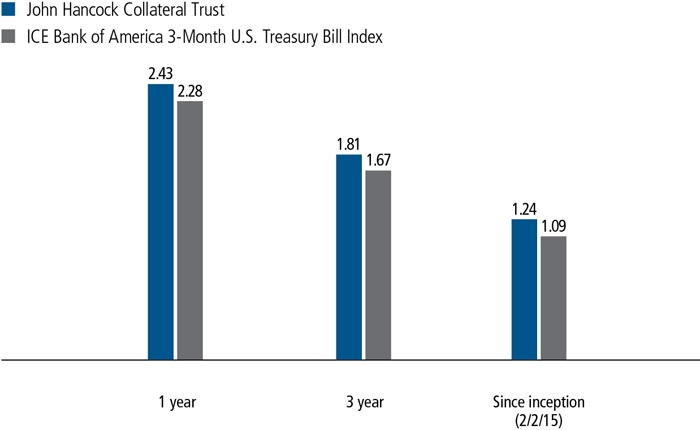
TOTAL RETURNS AS OF 12/31/19 (%)
The ICE Bank of America 3-Month U.S. Treasury Bill Index is comprised of a single issue purchased at the beginning of the month and held for a full month. Each month the index is rebalanced and the issue selected is the outstanding U.S. Treasury Bill that matures closest to, but not beyond, three months from the rebalancing date.
It is not possible to invest directly in an index. Index figures do not reflect sales charges or direct expenses, which would result in lower returns.
The past performance shown here reflects reinvested distributions and the beneficial effect of any expense reductions, and does not guarantee future results. Shares will fluctuate in value and, when redeemed, may be worth more or less than their original cost. Current month-end performance may be lower or higher than the performance cited, and can be found at jhinvestments.com or by calling 800-225-5291. For further information on the fund's objectives, risks, and strategy, see the fund's prospectus.
PERFORMANCE HIGHLIGHTS OVER THE LAST TWELVE MONTHS
Markets rallied over U.S. Federal Reserve (Fed) interest-rate cuts
The Fed's dramatic pivot from rate raising to rate cutting helped spur the financial markets forward.
Fund's weighted average maturity grew
The fund's average maturity climbed from 39.40 at the beginning of the period to 44.05 at the end as the Fed cut interest rates three times during the second half of the period.
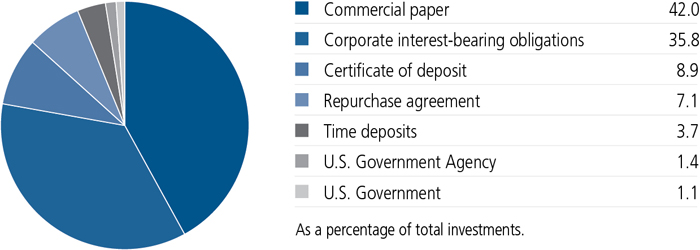
PORTFOLIO COMPOSITION AS OF 12/31/19 (%)
A note about risks
The trust is subject to various risks as described in the trust's prospectus. For more information, please refer to the "Principal risks" section of the prospectus.
The beginning of 2019 was marked by the U.S. Federal Reserve's (Fed's) dramatic pivot from an interest-rate-hiking cycle to a rate-cutting cycle. Over the course of the year the Fed cut rates three times, at its July, September, and October meetings to end with a target range of 1.50 to 1.75.
Gross domestic product (GDP) growth was moderate through the first three quarters of 2019. GDP growth was 3.1% in the first quarter—rebounding from a slow fourth quarter of 2018—followed by more modest growth of 2.0% in the second quarter, and 2.1% in the third quarter. Job growth averaged 180,000 per month through the first 11 months of 2019, compared with an average monthly gain of 223,000 in 2018.
Given the uncertain backdrop to the market over the past year, along with a flat to inverted rate curve, cash has been pouring into money market funds throughout the year—assets have increased by $530 billion and that growth is expected to continue into 2020.
The one-month London Interbank Offered Rate (LIBOR)—which is a benchmark for the interest rate that banks lend to one another—began the year at 250 basis
TOP 10 ISSUERS AS OF 12/31/19 (%)
| Credit Suisse AG, 1.794% to 2.137%, 2-14-20 to 11-9-20 | 5.3 |
| Wells Fargo Bank NA, 1.844% to 2.038%, 1-3-20 to 8-10-20 | 5.2 |
| Sumitomo Mitsui Banking Corp., 1.749% to 1.957%, 2-6-20 to 4-14-20 | 4.8 |
| Cargill Global Funding PLC, 1.562%, 1-3-20 | 4.4 |
| Old Line Funding LLC, 1.898% to 2.059%, 1-7-20 to 5-8-20 | 4.2 |
| JP Morgan Securities LLC, 1.724% to 2.015%, 1-3-20 to 9-3-20 | 4.1 |
| PSP Capital, Inc., 1.832% to 1.858%, 3-17-20 to 12-16-20 | 3.5 |
| Toyota Motor Corp., 1.998% to 2.427%, 5-7-20 to 6-17-20 | 3.4 |
| Yale University, 1.725% to 1.927%, 1-6-20 to 1-16-20 | 3.1 |
| Manhattan Asset Funding Company LLC, 1.806% to 2.109%, 1-2-20 to 2-3-20 | 2.8 |
| TOTAL | 40.8 |
| As a percentage of total investments. | |
points (bps) and ended at 176 bps, while the three-month LIBOR began at 281 bps and ended at 191 bps. (A basis point is one-hundredth of a percent.)
How did the fund perform?
The fund maintained a competitive yield over the course of the year, maintaining a spread above the overnight bank funding rate, while also maintaining adequate liquidity. We've continued to keep the fund's weighted average maturity on the longer end of the spectrum as the Fed still seems more likely to cut rates than it is to raise them.
Where have you found good opportunities?
Fixed-rate securities at the end of 2018 and early in 2019 offered tremendous value as short-term interest rates experienced the largest rally we have seen over the past 10 years. We took advantage of this as much as possible while still maintaining sufficient liquidity in the fund.
Later in the year we found value in floating-rate securities with higher effective yields after the Fed's last rate cut in October. If the Fed ends up pausing for an extended period these will outperform fixed-rate securities.
We also found value in taxable municipal commercial paper this year; many of these higher-quality programs offer a yield pickup over lower-rated, but larger, corporate commercial paper programs.
MANAGED BY
 | Jeffrey N. Given, CFA On the fund since 2015 Investing since 1993 |
![]()
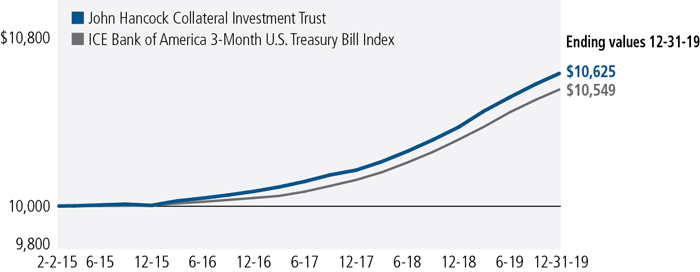
This chart and table show what happened to a hypothetical $10,000 investment in John Hancock Collateral Trust for the periods indicated, assuming all distributions were reinvested. For comparison, we've shown the same investment in the ICE Bank of America 3-Month U.S. Treasury Bill Index.
TOTAL RETURNS FOR THE PERIOD ENDED DECEMBER 31, 2019
| Average annual total returns (%) | Cumulative total returns (%) | |||||
| 1-year | Since inception1 | Since inception1 | ||||
| John Hancock Collateral Trust | 2.43 | 1.24 | 6.25 | |||
| Index† | 2.28 | 1.09 | 5.49 | |||
Performance figures assume all distributions are reinvested.
The expense ratios of the fund, both net (including any fee waivers and/or expense limitations) and gross (excluding any fee waivers and/or expense limitations), are set forth according to the Financial highlights of the fund's annual report dated December 31, 2019. Net expenses reflect contractual expense limitations in effect until April 30, 2020 and are subject to change.Had the contractual fee waivers and expense limitations not been in place, gross expenses would apply. The net expenses and gross expense annualized ratios are 0.08% and 0.53%, respectively.
The returns reflect past results and should not be considered indicative of future performance. The return and principal value of an investment will fluctuate so that shares, when redeemed, may be worth more or less than their original cost. Due to market volatility and other factors, the fund's current performance may be higher or lower than the performance shown.
The performance table above and the chart on the next page do not reflect the deduction of taxes that a shareholder would pay on the redemption of fund shares. The fund's performance results reflect any applicable fee waivers or expense reductions, without which the expenses would increase and results would have been less favorable.
| † | Index is the ICE Bank of America 3-Month U.S. Treasury Bill Index. |
The ICE Bank of America 3-Month U.S. Treasury Bill Index is comprised of a single issue purchased at the beginning of the month and held for a full month. Each month the index is rebalanced and the issue selected is the outstanding U.S. Treasury Bill that matures closest to, but not beyond, three months from the rebalancing date.
It is not possible to invest directly in an index. Index figures do not reflect sales charges or direct expenses, which would result in lower returns.
| 1 | From 2-2-15. |
| Your expenses |
| 7 | JOHN HANCOCK COLLATERAL TRUST | ANNUAL REPORT |
| Account value on 7-1-2019 | Ending value on 12-31-2019 | Expenses paid during 12-31-20191 | Annualized expense ratio | ||
| Actual expenses/actual returns | $1,000.00 | $1,010.60 | $0.41 | 0.08% | |
| Hypothetical example | 1,000.00 | 1,024.80 | 0.41 | 0.08% |
| 1 | Expenses are equal to the annualized expense ratio, multiplied by the average account value over the period, multiplied by 184/365 (to reflect the one-half year period). |
| ANNUAL REPORT | JOHN HANCOCK COLLATERAL TRUST | 8 |
| Fund’s investments |
| Maturity date | Yield (%) | Par value^ | Value | ||
| Commercial paper 42.3% | $959,880,176 | ||||
| (Cost $960,073,154) | |||||
| 3M Company | 01-07-20 | 1.602 | 50,000,000 | 49,985,028 | |
| Archer Daniels Midland Company | 01-09-20 | 1.592 | 25,000,000 | 24,990,238 | |
| Cargill Global Funding PLC | 01-03-20 | 1.562 | 100,000,000 | 99,987,417 | |
| Chariot Funding LLC | 01-06-20 to 01-10-20 | 1.876 to 2.090 | 44,200,000 | 44,184,010 | |
| Chevron Corp. | 01-07-20 | 1.623 | 7,500,000 | 7,497,769 | |
| Cummins, Inc. | 02-04-20 | 1.808 | 5,000,000 | 4,991,688 | |
| Gotham Funding Corp. | 01-15-20 to 02-13-20 | 1.778 to 2.029 | 49,355,000 | 49,268,340 | |
| Henkel of America, Inc. | 02-03-20 to 03-10-20 | 1.750 to 1.777 | 46,050,000 | 45,932,229 | |
| JP Morgan Securities LLC | 01-03-20 | 1.724 | 2,500,000 | 2,499,680 | |
| Jupiter Securitization Company LLC | 01-10-20 to 01-15-20 | 1.989 to 2.049 | 21,050,000 | 21,036,105 | |
| Kaiser Foundation Hospitals | 01-08-20 | 2.130 | 5,000,000 | 4,998,027 | |
| Koch Industries, Inc. | 01-03-20 to 01-08-20 | 1.683 to 1.724 | 55,000,000 | 54,987,254 | |
| Lime Funding LLC | 01-16-20 | 1.877 | 16,091,000 | 16,078,235 | |
| Macquarie Bank, Ltd. | 03-03-20 | 1.933 | 15,000,000 | 14,952,356 | |
| Manhattan Asset Funding Company LLC | 01-02-20 to 02-03-20 | 1.806 to 2.109 | 63,464,000 | 63,420,590 | |
| MUFG Bank, Ltd. | 01-21-20 to 02-05-20 | 1.899 to 1.928 | 34,680,000 | 34,625,047 | |
| National Rural Utilities Cooperative Finance Corp. | 01-06-20 | 1.724 | 30,000,000 | 29,992,180 | |
| Old Line Funding LLC | 01-07-20 to 05-04-20 | 1.898 to 2.059 | 59,494,000 | 59,333,029 | |
| ONE Gas, Inc. | 01-02-20 to 01-17-20 | 1.674 to 1.876 | 52,640,000 | 52,628,431 | |
| PSP Capital, Inc. | 03-17-20 to 12-16-20 | 1.832 to 1.858 | 81,000,000 | 79,995,190 | |
| Salt River Project Agricultural Improvement & Power District | 01-06-20 to 01-15-20 | 1.987 to 2.113 | 27,600,000 | 27,437,962 | |
| Shell International Finance BV | 06-18-20 | 1.984 | 25,000,000 | 24,787,500 | |
| The Boeing Company | 02-19-20 to 03-09-20 | 2.055 to 2.188 | 37,225,000 | 37,100,596 | |
| The Walt Disney Company | 03-27-20 | 1.884 | 3,760,000 | 3,743,499 | |
| Total Capital Canada, Ltd. | 01-30-20 | 1.868 | 24,120,000 | 24,086,232 | |
| University of California | 01-06-20 | 1.977 | 10,025,000 | 9,976,379 | |
| Yale University | 01-06-20 to 01-16-20 | 1.725 to 1.927 | 71,400,000 | 71,365,165 | |
| Corporate interest-bearing obligations 36.0% | $816,738,541 | ||||
| (Cost $816,644,847) | |||||
| American Honda Finance Corp. (A) | 09-21-20 | 2.086 | 1,850,000 | 1,875,769 | |
| American Honda Finance Corp. | 02-14-20 to 09-24-20 | 1.948 to 1.996 | 3,911,000 | 3,924,192 | |
| Apple, Inc. (3 month LIBOR + 0.250%) (B) | 02-07-20 | 1.899 | 10,000,000 | 10,003,110 | |
| Australia & New Zealand Banking Group, Ltd. | 08-19-20 | 1.914 | 3,445,000 | 3,451,275 | |
| Bank of Montreal | 06-15-20 | 1.965 | 3,705,000 | 3,709,325 | |
| 9 | JOHN HANCOCK COLLATERAL TRUST | ANNUAL REPORT | SEE NOTES TO FINANCIAL STATEMENTS |
| Maturity date | Yield (%) | Par value^ | Value | ||
| BMW US Capital LLC (A) | 04-06-20 to 08-14-20 | 2.059 to 2.091 | 6,921,000 | $6,941,736 | |
| Children's Hospital Medical Center | 01-07-20 to 01-15-20 | 1.673 to 1.724 | 52,000,000 | 52,000,000 | |
| Cisco Systems, Inc. | 01-15-20 | 1.754 | 3,018,000 | 3,020,595 | |
| Commonwealth Bank of Australia (A) | 09-18-20 | 1.937 | 10,000,000 | 10,007,441 | |
| Credit Suisse AG | 08-05-20 | 2.137 | 450,000 | 456,342 | |
| John Deere Capital Corp. (3 month LIBOR + 0.300%) (B) | 03-13-20 | 1.927 | 4,000,000 | 4,001,774 | |
| John Deere Capital Corp. (3 month LIBOR + 0.420%) (B) | 07-10-20 | 2.159 | 9,820,000 | 9,837,752 | |
| John Deere Capital Corp. | 01-15-20 to 01-08-21 | 1.767 to 2.731 | 17,600,000 | 17,610,804 | |
| JP Morgan Securities LLC (1 month LIBOR + 0.170%) (A)(B) | 05-05-20 | 1.900 | 40,000,000 | 40,000,000 | |
| JP Morgan Securities LLC (1 month LIBOR + 0.290%) (A)(B) | 09-03-20 | 2.015 | 50,000,000 | 50,000,000 | |
| Macquarie Bank, Ltd. (3 month LIBOR + 1.120%) (A)(B) | 07-29-20 | 2.079 | 1,150,000 | 1,156,608 | |
| Macquarie Bank, Ltd. (A) | 01-21-20 | 2.559 | 11,733,000 | 11,734,348 | |
| Merck & Company, Inc. (3 month LIBOR + 0.375%) (B) | 02-10-20 | 1.929 | 44,267,000 | 44,291,001 | |
| National Bank of Canada | 06-12-20 | 1.950 | 10,000,000 | 10,009,973 | |
| National Rural Utilities Cooperative Finance Corp. | 06-15-20 | 2.078 | 153,000 | 153,227 | |
| New York Life Global Funding (3 month LIBOR + 0.100%) (A)(B) | 01-21-20 | 1.847 | 27,000,000 | 27,002,582 | |
| Novartis Capital Corp. | 04-24-20 | 2.650 | 2,334,000 | 2,351,924 | |
| Old Line Funding LLC (U.S. Federal Funds Effective Rate + 0.340%) (A)(B) | 05-08-20 | 1.916 | 30,000,000 | 30,000,000 | |
| Old Line Funding LLC (A) | 02-10-20 | 2.052 | 6,450,000 | 6,436,998 | |
| Philip Morris International, Inc. | 02-21-20 | 1.988 | 2,080,000 | 2,079,709 | |
| PNC Bank NA (3 month LIBOR + 0.360%) (B) | 05-19-20 | 1.975 | 15,205,000 | 15,220,872 | |
| PNC Bank NA | 06-01-20 to 01-22-21 | 1.868 to 2.286 | 35,352,000 | 35,480,382 | |
| Princeton University | 02-07-20 | 1.622 to 1.683 | 25,000,000 | 24,999,359 | |
| Royal Bank of Canada | 10-30-20 | 1.825 | 15,000,000 | 15,057,074 | |
| Royal Bank of Canada (U.S. Federal Funds Effective Rate + 0.280%) (A)(B) | 06-12-20 | 1.855 | 25,000,000 | 25,001,046 | |
| State Street Corp. | 08-18-20 | 1.879 | 6,791,000 | 6,818,064 | |
| State Street Corp. (3 month LIBOR + 0.900%) (B) | 08-18-20 | 1.968 | 38,573,000 | 38,774,053 | |
| The Bank of New York Mellon Corp. | 01-15-20 to 08-17-20 | 1.967 to 2.727 | 32,706,000 | 32,735,643 | |
| The Bank of Nova Scotia | 10-21-20 | 1.842 | 1,500,000 | 1,505,314 | |
| SEE NOTES TO FINANCIAL STATEMENTS | ANNUAL REPORT | JOHN HANCOCK COLLATERAL TRUST | 10 |
| Maturity date | Yield (%) | Par value^ | Value | ||
| The Estee Lauder Companies, Inc. | 02-07-20 | 2.701 | 32,747,000 | $32,749,172 | |
| The Home Depot, Inc. | 06-05-20 | 2.036 | 11,538,000 | 11,531,810 | |
| The University of Chicago | 01-06-20 | 1.643 | 16,000,000 | 15,995,547 | |
| Thunder Bay Funding LLC (U.S. Federal Funds Effective Rate + 0.330%) (A)(B) | 06-16-20 | 1.906 | 25,000,000 | 25,000,000 | |
| Total Capital SA | 06-24-20 | 2.023 | 11,140,000 | 11,271,255 | |
| Toyota Credit Canada, Inc. (1 month LIBOR + 0.270%) (B) | 05-29-20 | 2.013 | 50,000,000 | 50,000,000 | |
| Toyota Motor Credit Corp. | 06-17-20 | 2.427 | 1,845,000 | 1,866,641 | |
| Toyota Motor Finance Netherlands BV (1 month LIBOR + 0.230%) (B) | 05-07-20 | 1.998 | 25,000,000 | 25,002,698 | |
| UBS AG | 08-04-20 | 1.989 | 7,132,000 | 7,253,249 | |
| UBS AG (A) | 06-08-20 | 2.609 | 8,619,000 | 8,623,567 | |
| Walmart, Inc. | 06-23-20 | 1.754 | 3,000,000 | 3,015,179 | |
| Walmart, Inc. (3 month LIBOR + 0.040%) (B) | 06-23-20 | 1.963 | 1,619,000 | 1,618,922 | |
| Wells Fargo Bank NA (SOFR + 0.480%) (B) | 03-25-20 | 1.844 | 61,333,000 | 61,343,820 | |
| Westpac Banking Corp. | 05-26-20 | 2.054 | 13,800,000 | 13,818,389 | |
| Certificate of deposit 8.9% | $202,739,229 | ||||
| (Cost $202,749,957) | |||||
| Credit Suisse AG (SOFR + 0.230%) (B) | 02-14-20 | 1.794 | 30,000,000 | 30,003,353 | |
| Credit Suisse AG (SOFR + 0.280%) (B) | 07-07-20 | 1.846 | 50,000,000 | 49,979,043 | |
| Credit Suisse AG (SOFR + 0.480%) (B) | 11-09-20 | 2.048 | 40,000,000 | 40,000,000 | |
| Sumitomo Mitsui Trust Bank, Ltd. (SOFR + 0.210%) (B) | 03-05-20 | 1.774 | 25,000,000 | 25,006,750 | |
| Wells Fargo Bank NA (U.S. Federal Funds Effective Rate + 0.310%) (B) | 08-10-20 | 1.886 | 50,000,000 | 49,999,988 | |
| Wells Fargo Bank NA (U.S. Federal Funds Effective Rate + 0.300%) (B) | 03-20-20 | 1.927 | 750,000 | 750,095 | |
| Wells Fargo Bank NA (3 month LIBOR + 0.230%) (3 month LIBOR + 0.230%) | 01-03-20 | 2.038 | 7,000,000 | 7,000,000 | |
| 11 | JOHN HANCOCK COLLATERAL TRUST | ANNUAL REPORT | SEE NOTES TO FINANCIAL STATEMENTS |
| Maturity date | Yield (%) | Par value^ | Value | ||
| Time deposits 3.7% | $85,000,000 | ||||
| (Cost $85,000,000) | |||||
| Sumitomo Mitsui Banking Corp. | 02-06-20 to 04-14-20 | 1.749 to 1.957 | 85,000,000 | 85,000,000 | |
| U.S. Government Agency 1.4% | $30,982,614 | ||||
| (Cost $30,999,605) | |||||
| Federal Agricultural Mortgage Corp. (SOFR + 0.100%) (B) | 04-01-21 to 08-23-21 | 1.663 | 11,000,000 | 10,997,173 | |
| Federal Farm Credit Bank (U.S. Federal Funds Effective Rate + 0.085%) (B) | 03-10-21 | 1.659 | 15,000,000 | 14,989,313 | |
| Federal Farm Credit Bank (3 month LIBOR - 0.135%) (B) | 10-29-20 | 1.829 | 5,000,000 | 4,996,128 | |
| U.S. Government 1.1% | $24,986,283 | ||||
| (Cost $25,003,763) | |||||
| U.S. Treasury Floating Rate Note (3 month USBMMY + 0.139%) (B) | 04-30-21 | 1.678 | 25,000,000 | 24,986,283 | |
| Par value^ | Value | ||||
| Repurchase agreement 7.2% | $162,710,000 | ||||
| (Cost $162,710,000) | |||||
| Barclays Tri-Party Repurchase Agreement dated 12-31-19 at 1.500% to be repurchased at $45,003,750 on 1-2-20, collateralized by $45,664,043 U.S. Treasury Inflation Indexed Notes, 0.125% due 10-15-24 (valued at $45,903,869) | 45,000,000 | 45,000,000 | |||
| Repurchase Agreement with State Street Corp. dated 12-31-19 at 0.550% to be repurchased at $17,710,541 on 1-2-20, collateralized by $16,460,000 U.S. Treasury Inflation Indexed Notes, 0.125% due 4-15-20 (valued at $18,069,327) | 17,710,000 | 17,710,000 | |||
| Repurchase Agreement with State Street Corp. dated 12-31-19 at 1.540% to be repurchased at $100,008,556 on 1-2-20, collateralized by $101,030,000 U.S. Treasury Bonds, 2.375% due 11-15-49 (valued at $102,000,090) | 100,000,000 | 100,000,000 | |||
| Total investments (Cost $2,283,181,326) 100.6% | $2,283,036,843 | ||||
| Other assets and liabilities, net (0.6)% | (13,446,203) | ||||
| Total net assets 100.0% | $2,269,590,640 | ||||
| The percentage shown for each investment category is the total value of the category as a percentage of the net assets of the fund. | |
| ^All par values are denominated in U.S. dollars unless otherwise indicated. | |
| Security Abbreviations and Legend | |
| LIBOR | London Interbank Offered Rate |
| SOFR | Secured Overnight Financing Rate |
| USBMMY | U.S. Treasury Bill Money Market Yield |
| SEE NOTES TO FINANCIAL STATEMENTS | ANNUAL REPORT | JOHN HANCOCK COLLATERAL TRUST | 12 |
| (A) | These securities are exempt from registration under Rule 144A of the Securities Act of 1933. Such securities may be resold, normally to qualified institutional buyers, in transactions exempt from registration. Rule 144A securities amounted to $243,780,095 or 10.7% of the fund's net assets as of 12-31-19. |
| (B) | Variable rate obligation. |
| 13 | JOHN HANCOCK COLLATERAL TRUST | ANNUAL REPORT | SEE NOTES TO FINANCIAL STATEMENTS |
| Financial statements |
| Assets | |
| Unaffiliated investments, at value (Cost $2,283,181,326) | $2,283,036,843 |
| Cash | 946 |
| Interest receivable | 3,290,594 |
| Other assets | 27,176 |
| Total assets | 2,286,355,559 |
| Liabilities | |
| Distributions payable | 3,288,337 |
| Payable for investments purchased | 13,233,865 |
| Payable to affiliates | |
| Administrative services fees | 142,941 |
| Transfer agent fees | 5,000 |
| Trustees' fees | 2,518 |
| Other liabilities and accrued expenses | 92,258 |
| Total liabilities | 16,764,919 |
| Net assets | $2,269,590,640 |
| Net assets consist of | |
| Paid-in capital | $2,269,709,765 |
| Total distributable earnings (loss) | (119,125) |
| Net assets | $2,269,590,640 |
| Net asset value per share | |
| Based on 226,829,801 shares of beneficial interest outstanding - unlimited number of shares authorized with no par value | $10.01 |
| SEE NOTES TO FINANCIAL STATEMENTS | ANNUAL REPORT | JOHN HANCOCK Collateral Trust | 14 |
| Investment income | |
| Interest | $50,646,727 |
| Expenses | |
| Investment management fees | 10,593,766 |
| Administrative services fees | 466,864 |
| Transfer agent fees | 60,000 |
| Trustees' fees | 52,196 |
| Custodian fees | 136,750 |
| Printing and postage | 18,579 |
| Professional fees | 100,652 |
| Other | 43,461 |
| Total expenses | 11,472,268 |
| Less expense reductions | (9,652,496) |
| Net expenses | 1,819,772 |
| Net investment income | 48,826,955 |
| Realized and unrealized gain (loss) | |
| Net realized gain (loss) on | |
| Unaffiliated investments | 23,595 |
| 23,595 | |
| Change in net unrealized appreciation (depreciation) of | |
| Unaffiliated investments | 503,400 |
| 503,400 | |
| Net realized and unrealized gain | 526,995 |
| Increase in net assets from operations | $49,353,950 |
| 15 | JOHN HANCOCK Collateral Trust | ANNUAL REPORT | SEE NOTES TO FINANCIAL STATEMENTS |
| Year ended 12-31-19 | Year ended 12-31-18 | |
| Increase (decrease) in net assets | ||
| From operations | ||
| Net investment income | $48,826,955 | $51,419,369 |
| Net realized gain | 23,595 | 6,733 |
| Change in net unrealized appreciation (depreciation) | 503,400 | (256,643) |
| Increase in net assets resulting from operations | 49,353,950 | 51,169,459 |
| Distributions to shareholders | ||
| From earnings | (48,826,955) | (51,419,369) |
| Total distributions | (48,826,955) | (51,419,369) |
| Fund share transactions | ||
| Shares issued | 36,054,903,046 | 35,971,734,188 |
| Distributions reinvested | 78,216 | — |
| Repurchased | (36,051,305,638) | (35,373,587,834) |
| Total from fund share transactions | 3,675,624 | 598,146,354 |
| Total increase | 4,202,619 | 597,896,444 |
| Net assets | ||
| Beginning of year | 2,265,388,021 | 1,667,491,577 |
| End of year | $2,269,590,640 | $2,265,388,021 |
| Share activity | ||
| Shares outstanding | ||
| Beginning of year | 226,466,429 | 166,686,636 |
| Shares issued | 3,603,023,896 | 3,595,679,745 |
| Distributions reinvested | 7,816 | — |
| Shares repurchased | (3,602,668,340) | (3,535,899,952) |
| End of year | 226,829,801 | 226,466,429 |
| SEE NOTES TO FINANCIAL STATEMENTS | ANNUAL REPORT | JOHN HANCOCK Collateral Trust | 16 |
| Financial highlights |
| Period ended | 12-31-19 | 12-31-18 | 12-31-17 | 12-31-16 | 12-31-151 |
| Per share operating performance | |||||
| Net asset value, beginning of period | $10.00 | $10.00 | $10.01 | $10.00 | $10.01 |
| Net investment income2 | 0.23 | 0.20 | 0.11 | 0.05 | 0.01 |
| Net realized and unrealized gain (loss) on investments | 0.01 | —3 | (0.01) | 0.02 | (0.01) |
| Total from investment operations | 0.24 | 0.20 | 0.10 | 0.07 | 0.00 |
| Less distributions | |||||
| From net investment income | (0.23) | (0.20) | (0.11) | (0.06) | (0.01) |
| Net asset value, end of period | $10.01 | $10.00 | $10.00 | $10.01 | $10.00 |
| Total return (%)4 | 2.43 | 2.00 | 1.00 | 0.66 | 0.035 |
| Ratios and supplemental data | |||||
| Net assets, end of period (in millions) | $2,270 | $2,265 | $1,667 | $1,441 | $1,608 |
| Ratios (as a percentage of average net assets): | |||||
| Expenses before reductions | 0.53 | 0.53 | 0.54 | 0.54 | 0.546 |
| Expenses including reductions | 0.08 | 0.08 | 0.09 | 0.09 | 0.096 |
| Net investment income | 2.28 | 1.99 | 1.07 | 0.55 | 0.146 |
| Portfolio turnover (%)7 | 106 | 708 | 1328 | 97 | 09 |
| 1 | Period from 2-2-15 (commencement of operations) to 12-31-15. |
| 2 | Based on average daily shares outstanding. |
| 3 | Less than $0.005 per share. |
| 4 | Total returns would have been lower had certain expenses not been reduced during the applicable periods. |
| 5 | Not annualized. |
| 6 | Annualized. |
| 7 | The calculation of portfolio turnover excludes amounts from all securities whose maturities or expiration dates at the time of acquisition were one year or less, which represents a significant amount of the investments held by the fund. |
| 8 | The portfolio turnover rate for the years ended December 31, 2017 and December 31, 2018 have been revised to exclude the effect of certain short-term investments. The previously reported amounts in the December 31, 2018 and December 31, 2017 financial statements were 19% and 44%, respectively. |
| 9 | During the period ended December 31, 2015, securities purchased and/or sold by the fund utilized in the calculation of the portfolio turnover were acquired with less than one year until maturity. As a result, the portfolio turnover is 0%. |
| 17 | JOHN HANCOCK Collateral Trust | ANNUAL REPORT | SEE NOTES TO FINANCIAL STATEMENTS |
| ANNUAL REPORT | JOHN HANCOCK Collateral Trust | 18 |
| 19 | JOHN HANCOCK Collateral Trust | ANNUAL REPORT |
| December 31, 2019 | December 31, 2018 | |
| Ordinary income | $48,826,955 | $51,419,369 |
| ANNUAL REPORT | JOHN HANCOCK Collateral Trust | 20 |
| 21 | JOHN HANCOCK Collateral Trust | ANNUAL REPORT |
| ANNUAL REPORT | JOHN HANCOCK Collateral Trust | 22 |
| 23 | JOHN HANCOCK COLLATERAL TRUST | ANNUAL REPORT |
This chart provides information about the Trustees and Officers who oversee your John Hancock fund. Officers elected by the Trustees manage the day-to-day operations of the fund and execute policies formulated by the Trustees.
Independent Trustees
| Name, year of birth Position(s) held with Trust Principal occupation(s) and other directorships during past 5 years | Trustee of the Trust since1 | Number of John Hancock funds overseen by Trustee |
| Hassell H. McClellan, Born: 1945 | 2015 | 205 |
| Trustee and Chairperson of the Board Director/Trustee, Virtus Funds (since 2008); Director, The Barnes Group (since 2010); Associate Professor, The Wallace E. Carroll School of Management, Boston College (retired 2013). Trustee (since 2005) and Chairperson of the Board (since 2017) of various trusts within the John Hancock Fund Complex. | ||
| Charles L. Bardelis,2 Born: 1941 | 2015 | 205 |
| Trustee Director, Island Commuter Corp. (marine transport). Trustee of various trusts within the John Hancock Fund Complex (since 1988). | ||
| James R. Boyle,Born: 1959 | 2015 | 205 |
| Trustee Chief Executive Officer, Foresters Financial (since 2018); Chairman and Chief Executive Officer, Zillion Group, Inc. (formerly HealthFleet, Inc.) (healthcare) (2014-2018); Executive Vice President and Chief Executive Officer, U.S. Life Insurance Division of Genworth Financial, Inc. (insurance) (January 2014-July 2014); Senior Executive Vice President, Manulife Financial, President and Chief Executive Officer, John Hancock (1999-2012); Chairman and Director, John Hancock Investment Management LLC, John Hancock Investment Management Distributors LLC, and John Hancock Variable Trust Advisers LLC (2005-2010). Trustee of various trusts within the John Hancock Fund Complex (2005-2014 and since 2015). | ||
| Peter S. Burgess,2 Born: 1942 | 2015 | 205 |
| Trustee Consultant (financial, accounting, and auditing matters) (since 1999); Certified Public Accountant; Partner, Arthur Andersen (independent public accounting firm) (prior to 1999); Director, Lincoln Educational Services Corporation (since 2004); Director, Symetra Financial Corporation (2010-2016); Director, PMA Capital Corporation (2004-2010). Trustee of various trusts within the John Hancock Fund Complex (since 2005). | ||
| William H. Cunningham, Born: 1944 | 2015 | 205 |
| Trustee Professor, University of Texas, Austin, Texas (since 1971); former Chancellor, University of Texas System and former President of the University of Texas, Austin, Texas; Chairman (since 2009) and Director (since 2006), Lincoln National Corporation (insurance); Director, Southwest Airlines (since 2000); former Director, LIN Television (2009-2014). Trustee of various trusts within the John Hancock Fund Complex (since 1986). | ||
| Grace K. Fey, Born: 1946 | 2015 | 205 |
| Trustee Chief Executive Officer, Grace Fey Advisors (since 2007); Director and Executive Vice President, Frontier Capital Management Company (1988-2007); Director, Fiduciary Trust (since 2009). Trustee of various trusts within the John Hancock Fund Complex (since 2008). | ||
IndependentTrustees (continued)
| Name, year of birth Position(s) held with Trust Principal occupation(s) and other directorships during past 5 years | Trustee of the Trust since1 | Number of John Hancock funds overseen by Trustee |
| Deborah C. Jackson, Born: 1952 | 2015 | 205 |
| Trustee President, Cambridge College, Cambridge, Massachusetts (since 2011); Board of Directors, Massachusetts Women's Forum (since 2018); Board of Directors, National Association of Corporate Directors/New England (since 2015); Board of Directors, Association of Independent Colleges and Universities of Massachusetts (2014-2017); Chief Executive Officer, American Red Cross of Massachusetts Bay (2002-2011); Board of Directors of Eastern Bank Corporation (since 2001); Board of Directors of Eastern Bank Charitable Foundation (since 2001); Board of Directors of American Student Assistance Corporation (1996-2009); Board of Directors of Boston Stock Exchange (2002-2008); Board of Directors of Harvard Pilgrim Healthcare (health benefits company) (2007-2011). Trustee of various trusts within the John Hancock Fund Complex (since 2008). | ||
| James M. Oates,2Born: 1946 | 2015 | 205 |
| Trustee Managing Director, Wydown Group (financial consulting firm) (since 1994); Chairman and Director, Emerson Investment Management, Inc. (2000-2015); Independent Chairman, Hudson Castle Group, Inc. (formerly IBEX Capital Markets, Inc.) (financial services company) (1997-2011); Director, Stifel Financial (since 1996); Director, Investor Financial Services Corporation (1995-2007); Director, Connecticut River Bancorp (1998-2014); Director/Trustee, Virtus Funds (since 1988). Trustee (since 2004) and Chairperson of the Board (2005-2016) of various trusts within the John Hancock Fund Complex. | ||
| Steven R. Pruchansky, Born: 1944 | 2015 | 205 |
| Trustee and Vice Chairperson of the Board Managing Director, Pru Realty (since 2017); Chairman and Chief Executive Officer, Greenscapes of Southwest Florida, Inc. (since 2014); Director and President, Greenscapes of Southwest Florida, Inc. (until 2000); Member, Board of Advisors, First American Bank (until 2010); Managing Director, Jon James, LLC (real estate) (since 2000); Partner, Right Funding, LLC (2014-2017); Director, First Signature Bank & Trust Company (until 1991); Director, Mast Realty Trust (until 1994); President, Maxwell Building Corp. (until 1991). Trustee (since 1992), Chairperson of the Board (2011-2012), and Vice Chairperson of the Board (since 2012) of various trusts within the John Hancock Fund Complex. | ||
| Gregory A. Russo, Born: 1949 | 2015 | 205 |
| Trustee Director and Audit Committee Chairman (since 2012), and Member, Audit Committee and Finance Committee (since 2011), NCH Healthcare System, Inc. (holding company for multi-entity healthcare system); Director and Member (2012-2018) and Finance Committee Chairman (2014-2018), The Moorings, Inc. (nonprofit continuing care community); Vice Chairman, Risk & Regulatory Matters, KPMG LLP (KPMG) (2002-2006); Vice Chairman, Industrial Markets, KPMG (1998-2002); Chairman and Treasurer, Westchester County, New York, Chamber of Commerce (1986-1992); Director, Treasurer, and Chairman of Audit and Finance Committees, Putnam Hospital Center (1989-1995); Director and Chairman of Fundraising Campaign, United Way of Westchester and Putnam Counties, New York (1990-1995). Trustee of various trusts within the John Hancock Fund Complex (since 2008). | ||
Non-Independent Trustees3
| Name, year of birth Position(s) held with Trust Principal occupation(s) and other directorships during past 5 years | Trustee of the Trust since1 | Number of John Hancock funds overseen by Trustee |
| Andrew G. Arnott, Born: 1971 | 2017 | 205 |
| President and Non-Independent Trustee Head of Wealth and Asset Management, United States and Europe, for John Hancock and Manulife (since 2018); Executive Vice President, John Hancock Financial Services (since 2009, including prior positions); Director and Executive Vice President, John Hancock Investment Management LLC (since 2005, including prior positions); Director and Executive Vice President, John Hancock Variable Trust Advisers LLC (since 2006, including prior positions); President, John Hancock Investment Management Distributors LLC (since 2004, including prior positions); President of various trusts within the John Hancock Fund Complex (since 2007, including prior positions). Trustee of various trusts within the John Hancock Fund Complex (since 2017). | ||
| Marianne Harrison, Born: 1963 | 2018 | 205 |
| Non-Independent Trustee President and CEO, John Hancock (since 2017); President and CEO, Manulife Canadian Division (2013-2017); Member, Board of Directors, CAE Inc. (since 2019); Member, Board of Directors, MA Competitive Partnership Board (since 2018); Member, Board of Directors, American Council of Life Insurers (ACLI) (since 2018); Member, Board of Directors, Communitech, an industry-led innovation center that fosters technology companies in Canada (2017-2019); Member, Board of Directors, Manulife Assurance Canada (2015-2017); Board Member, St. Mary's General Hospital Foundation (2014-2017); Member, Board of Directors, Manulife Bank of Canada (2013-2017); Member, Standing Committee of the Canadian Life & Health Assurance Association (2013-2017); Member, Board of Directors, John Hancock USA, John Hancock Life & Health, John Hancock New York (2012-2013). Trustee of various trusts within the John Hancock Fund Complex (since 2018). | ||
Principal officers who are not Trustees
| Name, year of birth Position(s) held with Trust Principal occupation(s) during past 5 years | Officer of the Trust since |
| Francis V. Knox, Jr.,Born: 1947 | 2015 |
| Chief Compliance Officer Vice President, John Hancock Financial Services (since 2005); Chief Compliance Officer, various trusts within the John Hancock Fund Complex, John Hancock Investment Management LLC, and John Hancock Variable Trust Advisers LLC (since 2005). | |
| Charles A. Rizzo, Born: 1957 | 2015 |
| Chief Financial Officer Vice President, John Hancock Financial Services (since 2008); Senior Vice President, John Hancock Investment Management LLC and John Hancock Variable Trust Advisers LLC (since 2008); Chief Financial Officer of various trusts within the John Hancock Fund Complex (since 2007). | |
| Salvatore Schiavone, Born: 1965 | 2015 |
| Treasurer Assistant Vice President, John Hancock Financial Services (since 2007); Vice President, John Hancock Investment Management LLC and John Hancock Variable Trust Advisers LLC (since 2007); Treasurer of various trusts within the John Hancock Fund Complex (since 2007, including prior positions). | |
Principal officers who are notTrustees (continued)
| Name, year of birth Position(s) held with Trust Principal occupation(s) during past 5 years | Officer of the Trust since |
| Christopher (Kit) Sechler,Born: 1973 | 2018 |
| Chief Legal Officer and Secretary Vice President and Deputy Chief Counsel, John Hancock Investments (since 2015); Assistant Vice President and Senior Counsel (2009-2015), John Hancock Investment Management; Chief Legal Officer and Secretary of various trusts within the John Hancock Fund Complex (since 2018); Assistant Secretary of John Hancock Investment Management LLC and John Hancock Variable Trust Advisers LLC (since 2009). | |
The business address for all Trustees and Officers is 200 Berkeley Street, Boston, Massachusetts 02116-5023.
The Statement of Additional Information of the fund includes additional information about members of the Board of Trustees of the Trust and is available without charge, upon request, by calling 800-225-5291.
| 1 | Each Trustee holds office until his or her successor is elected and qualified, or until the Trustee's death, retirement, resignation, or removal. |
| 2 | Member of the Audit Committee. |
| 3 | The Trustee is a Non-Independent Trustee due to current or former positions with the Advisor and certain affiliates. |
Trustees Hassell H. McClellan,Chairperson Officers Andrew G. Arnott Francis V. Knox, Jr. Charles A. Rizzo Salvatore Schiavone Christopher (Kit) Sechler | Investment advisor John Hancock Investment Management LLC Subadvisor Manulife Investment Management (US) LLC Portfolio Managers Bridget Bruce Placement Agent John Hancock Investment Management Distributors LLC Custodian State Street Bank and Trust Company Transfer agent John Hancock Signature Services, Inc. Legal counsel K&L Gates LLP Independent registered public accounting firm PricewaterhouseCoopers LLP |
* Member of the Audit Committee
† Non-Independent Trustee
The fund's proxy voting policies and procedures, as well as the fund proxy voting record for the most recent twelve-month period ended June 30, are available free of charge on the Securities and Exchange Commission (SEC) website at sec.gov or on our website.
All of the fund's holdings as of the end of the third month of every fiscal quarter are filed with the SEC on Form N-PORT within 60 days of the end of the fiscal quarter. The fund's Form N-PORT filings are available on our website and the SEC's website, sec.gov.
We make this information on your fund, as well asmonthly portfolio holdings, and other fund details available on our website at jhinvestments.com or by calling 800-225-5291.
| You can also contact us: | |||
| 800-225-5291 jhinvestments.com | Regular mail: John Hancock Signature Services, Inc. | Express mail: John Hancock Signature Services, Inc. | |
John Hancock family of funds
DOMESTIC EQUITY FUNDS Blue Chip Growth Classic Value Disciplined Value Disciplined Value Mid Cap Equity Income Financial Industries Fundamental All Cap Core Fundamental Large Cap Core New Opportunities Regional Bank Small Cap Core Small Cap Growth Small Cap Value U.S. Global Leaders Growth U.S. Quality Growth GLOBAL AND INTERNATIONAL EQUITY FUNDS Disciplined Value International Emerging Markets Emerging Markets Equity Fundamental Global Franchise Global Equity Global Shareholder Yield Global Thematic Opportunities International Dynamic Growth International Growth International Small Company | INCOME FUNDS Bond California Tax-Free Income Emerging Markets Debt Floating Rate Income Government Income High Yield High Yield Municipal Bond Income Investment Grade Bond Money Market Short Duration Bond Short Duration Credit Opportunities Strategic Income Opportunities Tax-Free Bond ALTERNATIVE AND SPECIALTY FUNDS Absolute Return Currency Alternative Asset Allocation Alternative Risk Premia Diversified Macro Infrastructure Multi-Asset Absolute Return Seaport Long/Short |
A fund's investment objectives, risks, charges, and expenses should be considered carefully before investing. The prospectus contains this and other important information about the fund. To obtain a prospectus, contact your financial professional, call John Hancock Investment Management at 800-225-5291, or visit our website at jhinvestments.com. Please read the prospectus carefully before investing or sending money.
ASSET ALLOCATION Balanced Income Allocation Multi-Index Lifetime Portfolios Multi-Index Preservation Portfolios Multimanager Lifestyle Portfolios Multimanager Lifetime Portfolios Retirement Income 2040 EXCHANGE-TRADED FUNDS John Hancock Multifactor Consumer Discretionary ETF John Hancock Multifactor Consumer Staples ETF John Hancock Multifactor Developed International ETF John Hancock Multifactor Emerging Markets ETF John Hancock Multifactor Energy ETF John Hancock Multifactor Financials ETF John Hancock Multifactor Healthcare ETF John Hancock Multifactor Industrials ETF John Hancock Multifactor Large Cap ETF John Hancock Multifactor Materials ETF John Hancock Multifactor Media and John Hancock Multifactor Mid Cap ETF John Hancock Multifactor Small Cap ETF John Hancock Multifactor Technology ETF John Hancock Multifactor Utilities ETF | ENVIRONMENTAL, SOCIAL, AND ESG All Cap Core ESG Core Bond ESG International Equity ESG Large Cap Core CLOSED-END FUNDS Financial Opportunities Hedged Equity & Income Income Securities Trust Investors Trust Preferred Income Preferred Income II Preferred Income III Premium Dividend Tax-Advantaged Dividend Income Tax-Advantaged Global Shareholder Yield |
John Hancock Multifactor ETF shares are bought and sold at market price (not NAV), and are not individually redeemed
from the fund. Brokerage commissions will reduce returns.
John Hancock ETFs are distributed by Foreside Fund Services, LLC, and are subadvised by Dimensional Fund Advisors LP.
Foreside is not affiliated with John Hancock Investment Management Distributors LLC or Dimensional Fund Advisors LP.
Dimensional Fund Advisors LP receives compensation from John Hancock in connection with licensing rights to the
John Hancock Dimensional indexes. Dimensional Fund Advisors LP does not sponsor, endorse, or sell, and makes no
representation as to the advisability of investing in, John Hancock Multifactor ETFs.
John Hancock Investment Management
A trusted brand
John Hancock Investment Management is a premier asset manager
representing one of America's most trusted brands, with a heritage of
financial stewardship dating back to 1862. Helping our shareholders
pursue their financial goals is at the core of everything we do. It's why
we support the role of professional financial advice and operate with
the highest standards of conduct and integrity.
A better way to invest
We serve investors globally through a unique multimanager approach:
We search the world to find proven portfolio teams with specialized
expertise for every strategy we offer, then we apply robust investment
oversight to ensure they continue to meet our uncompromising
standards and serve the best interests of our shareholders.
Results for investors
Our unique approach to asset management enables us to provide
a diverse set of investments backed by some of the world's best
managers, along with strong risk-adjusted returns across asset classes.
![]()
John Hancock Investment Management Distributors LLC n Member FINRA, SIPC
200 Berkeley Street n Boston, MA 02116-5010 n 800-225-5291 n jhinvestments.com
This report is for the information of the shareholders of John Hancock Collateral Trust. It is not authorized for distribution to prospective investors unless preceded or accompanied by a prospectus.

| 315A 12/19 2/2020 |
ITEM 2. CODE OF ETHICS.
As of the end of the year, December 31, 2019, the registrant has adopted a code of ethics, as defined in Item 2 of Form N-CSR, that applies to its Chief Executive Officer, Chief Financial Officer and Treasurer (respectively, the principal executive officer, the principal financial officer and the principal accounting officer, the “Senior Financial Officers”). A copy of the code of ethics is filed as an exhibit to this Form N-CSR.
ITEM 3. AUDIT COMMITTEE FINANCIAL EXPERT.
Peter S. Burgess is the audit committee financial expert and is “independent”, pursuant to general instructions on Form N-CSR Item 3.
ITEM 4. PRINCIPAL ACCOUNTANT FEES AND SERVICES.
(a) Audit Fees
The aggregate fees billed for professional services rendered by the principal accountant(s) for the audit of the registrant’s annual financial statements or services that are normally provided by the accountant(s) in connection with statutory and regulatory filings or engagements amounted to $36,515 for the fiscal year ended December 31, 2019 and $34,940 for the fiscal year ended December 31, 2018 for the John Hancock Collateral Investment Trust. These fees were billed to the registrant and were approved by the registrant’s audit committee.
(b) Audit-Related Services
Audit-related service fees amounted to $616 for the fiscal year ended December 31, 2019 and $571 for the fiscal year ended December 31, 2018 for the John Hancock Collateral Investment Trust billed to the registrant or to the registrant's investment adviser (not including any sub-adviser whose role is primarily portfolio management and is subcontracted with or overseen by another investment adviser), and any entity controlling, controlled by, or under common control with the adviser that provides ongoing services to the registrant ("control affiliates"). In addition, amounts billed to control affiliates for service provider internal controls reviews were $116,467 for the fiscal year ended December 31, 2019 and $113,000 for the fiscal year ended December 31, 2018.
(c) Tax Fees
The aggregate fees billed for professional services rendered by the principal accountant(s) for the tax compliance, tax advice and tax planning (“tax fees”) amounted to $2,858 for the fiscal year ended December 31, 2019 and $2,775 for the fiscal year ended December 31, 2018 for the John Hancock Collateral Investment Trust. The nature of the services comprising the tax fees was the review of the registrant’s tax returns and tax distribution requirements. These fees were billed to the registrant and were approved by the registrant’s audit committee.
(d) All Other Fees
Other fees amounted to $84 for the fiscal year ended December 31, 2019 and $239 for the fiscal year ended December 31, 2018 for John Hancock Collateral Investment Trust billed to the registrant or to the control affiliates.
(e)(1) Audit Committee Pre-Approval Policies and Procedures:
The trust’s Audit Committee must pre-approve all audit and non-audit services provided by the independent registered public accounting firm (the “Auditor”) relating to the operations or financial reporting of the funds. Prior to the commencement of any audit or non-audit services to a fund, the Audit Committee reviews the services to determine whether they are appropriate and permissible under applicable law.
The trust’s Audit Committee has adopted policies and procedures to, among other purposes, provide a framework for the Committee’s consideration of audit-related and non-audit services by the Auditor. The policies and procedures require that any audit-related and non-audit service provided by the Auditor and any non-audit service provided by the Auditor to a fund service provider that relates directly to the operations and financial reporting of a fund are subject to approval by the Audit Committee before such service is provided. Audit-related services provided by the Auditor that are expected to exceed $10,000 per instance/per fund are subject to specific pre-approval by the Audit Committee. Tax services provided by the Auditor that are expected to exceed $10,000 per instance/per fund are subject to specific pre-approval by the Audit Committee.
All audit services, as well as the audit-related and non-audit services that are expected to exceed the amounts stated above, must be approved in advance of provision of the service by formal resolution of the Audit Committee. At the regularly scheduled Audit Committee meetings, the Committee reviews a report summarizing the services, including fees, provided by the Auditor.
(e)(2) Services approved pursuant to paragraph (c)(7)(i)(C) of Rule 2-01 of Regulation S-X:
Audit-Related Fees, Tax Fees and All Other Fees:
There were no amounts that were approved by the Audit Committee pursuant to the de minimis exception under Rule 2-01 of Regulation S-X.
(f) According to the registrant’s principal accountant, for the fiscal year ended December 31, 2019, the percentage of hours spent on the audit of the registrant's financial statements for the most recent fiscal year that were attributed to work performed by persons who were not full-time, permanent employees of principal accountant was less than 50%.
(g) The aggregate non-audit fees billed by the registrant's accountant(s) for services rendered to the registrant and rendered to the registrant's control affiliates of the registrant was $937,102 for the fiscal year ended December 31, 2019 and $940,044 for the fiscal year ended December 31, 2018.
(h) The audit committee of the registrant has considered the non-audit services provided by the registrant’s principal accountant(s) to the control affiliates and has determined that the services that were not pre-approved are compatible with maintaining the principal accountant(s)' independence.
ITEM 5. AUDIT COMMITTEE OF LISTED REGISTRANTS.
The registrant has a separately-designated standing audit committee comprised of independent trustees. The members of the audit committee are as follows:
Peter S. Burgess - Chairman
Charles L. Bardelis
Theron S. Hoffman
ITEM 6. SCHEDULE OF INVESTMENTS.
(a) Not applicable.
(b) Not applicable.
ITEM 7. DISCLOSURE OF PROXY VOTING POLICIES AND PROCEDURES FOR CLOSED-END MANAGEMENT INVESTMENT COMPANIES.
Not applicable.
ITEM 8. PORTFOLIO MANAGERS OF CLOSED-END MANAGEMENT INVESTMENTCOMPANIES.
Not applicable.
ITEM 9. PURCHASES OF EQUITY SECURITIES BY CLOSED-END MANAGEMENT INVESTMENT COMPANY AND AFFILIATED PURCHASERS.
Not applicable.
ITEM 10. SUBMISSION OF MATTERS TO A VOTE OF SECURITY HOLDERS.
There were no material changes to previously disclosed John Hancock Funds – Nominating and Governance Committee Charter.
ITEM 11. CONTROLS AND PROCEDURES.
(a) Based upon their evaluation of the registrant's disclosure controls and procedures as conducted within 90 days of the filing date of this Form N-CSR, the registrant's principal executive officer and principal financial officer have concluded that those disclosure controls and procedures provide reasonable assurance that the material information required to be disclosed by the registrant on this report is recorded, processed, summarized and reported within the time periods specified in the Securities and Exchange Commission's rules and forms.
(b) There were no changes in the registrant's internal control over financial reporting that occurred during the period covered by this report that have materially affected, or are reasonably likely to materially affect, the registrant's internal control over financial reporting.
ITEM 12. DISCLOSURE OF SECURITIES LENDING ACTIVITIES FOR CLOSED-END MANAGEMENT INVESTMENT COMPANIES.
Not applicable.
ITEM 13. EXHIBITS.
(a)(1) See attached Code of Ethics.
(a)(2) Separate certifications for the registrant's principal executive officer and principal financial officer, as required by Section 302 of the Sarbanes-Oxley Act of 2002 and Rule 30a-2(a) under the Investment Company Act of 1940, are attached.
(b) Separate certifications for the registrant's principal executive officer and principal financial officer, as required by 18 U.S.C. Section 1350, as adopted pursuant to Section 906 of the Sarbanes-Oxley Act of 2002, and Rule 30a-2(b) under the Investment Company Act of 1940, are attached. The certifications furnished pursuant to this paragraph are not deemed to be "filed" for purposes of Section 18 of the Securities Exchange Act of 1934, or otherwise subject to the liability of that section. Such certifications are not deemed to be incorporated by reference into any filing under the Securities Act of 1933 or the Securities Exchange Act of 1934, except to the extent that the Registrant specifically incorporates them by reference.
(c)(1) Submission of Matters to a Vote of Security Holders is attached. See attached “John Hancock Funds – Governance Committee Charter”.
SIGNATURES
Pursuant to the requirements of the Securities Exchange Act of 1934 and the Investment Company Act of 1940, the registrant has duly caused this report to be signed on its behalf by the undersigned, thereunto duly authorized.
John Hancock Collateral Trust
| By: | /s/ Andrew Arnott |
| Andrew Arnott | |
| President | |
| Date: | February 24, 2020 |
Pursuant to the requirements of the Securities Exchange Act of 1934 and the Investment Company Act of 1940, this report has been signed below by the following persons on behalf of the registrant and in the capacities and on the dates indicated.
| By: | /s/ Andrew Arnott |
| Andrew Arnott | |
| President | |
| Date: | February 24, 2020 |
| By: | /s/ Charles A. Rizzo |
| Charles A. Rizzo | |
| Chief Financial Officer | |
| Date: | February 24, 2020 |