Exhibit 99.1
EQUITY INVESTOR PRESENTATION June 2015
Disclaimer 2 This presentation has been prepared by Cable One, Inc. (Cable ONE). The information contained in this presentation is for informational purposes only. The information contained in this presentation is not investment or financial product advice and is not intended to be used as the basis for making an investment decision. This presentation has been prepared without taking into account the investment objectives, financial situation or particular needs of any particular person.No representation or warranty, expressed or implied, is made as to the fairness, accuracy, completeness or correctness of the information, opinions or conclusions contained in this presentation. To the maximum extent permitted by law, none of Cable ONE, its directors, employees or agents, nor any other person, accepts any liability, including, without limitation, any liability arising out of fault or negligence for any loss arising from the use of the information contained in this presentation.Certain historical information in this presentation includes financial information that is not presented in accordance with generally accepted accounting principles (GAAP). Non-GAAP financial measures may be considered in addition to GAAP financial information, but should not be used as substitutes for the corresponding GAAP measures. Non-GAAP measures in this presentation may be calculated in a way that is not comparable to similarly-titled measures reported by other companies.This presentation includes “forward-looking statements” that reflect Cable ONE’s current views and information currently available. This information is, where applicable, based on assumptions and analysis that Cable ONE believes, as of the date hereof, provide a reasonable basis for the data and other information contained herein. These statements can be identified by the fact that they do not relate strictly to historical or current facts, but rather are based on current expectations, estimates, assumptions and projections about the cable industry and our business and financial results. Forward-looking statements often include words such as “anticipates,” “estimates,” “expects,” “projects,” “intends,” “plans,” “believes” and words and terms of similar substance in connection with discussions of future operating or financial performance. These forward-looking statements involve known and unknown risks, uncertainties and other factors, many of which are outside the control of Cable ONE and its officers, employees, agents or associates. Actual results, performance or achievements may vary materially from any projections and forward-looking statements and the assumptions on which those forward-looking statements are based. Readers are cautioned not to place undue reliance on forward-looking statements as a predictor of future performance. Some of the factors that we believe could affect our results include the risks discussed in the “Risk factors” section in Cable ONE’s, Preliminary Information Statement, filed as exhibit 99.1 to Cable ONE’s Form 10 filed on February 27, 2015 with the Securities and Exchange Commission and amended on April 17, 2015, May 15, 2015, May 28, 2015 and June 4, 2015.We caution you that in light of the risks and uncertainties described in the “Risk factors” section, the matters referred to in the forward-looking statements contained in this presentation may not in fact occur. There can be no assurance that the data and other information contained herein is reflective of future performance to any degree. Except as otherwise expressly provided, all information herein speaks only as of (1) the date hereof, in the case of information about Cable ONE, or (2) the date of such information, in the case of information from persons other than Cable ONE. Cable ONE undertakes no duty to update or revise the information contained herein, publicly or otherwise. Estimates regarding Cable ONE’s industry and end markets are based on sources we believe to be reliable, however there can be no assurance these forecasts and estimates will prove accurate in whole or in part.The financial data in this presentation has been derived from audited financial statements for each of the three years in the period ended December 31, 2014, and as of December 31, 2014, and December 31, 2013, included in the Company's Form 10-12B filed with the U.S. Securities and Exchange Commission. The financial data from and as of prior and subsequent periods was derived from unaudited financial statements.
Presenters Thomas O. MightCEO – Cable ONE Kevin CoyleCFO – Cable ONE 3
Agenda► Transaction overview► Investment highlights► Financial overview► Appendix 4
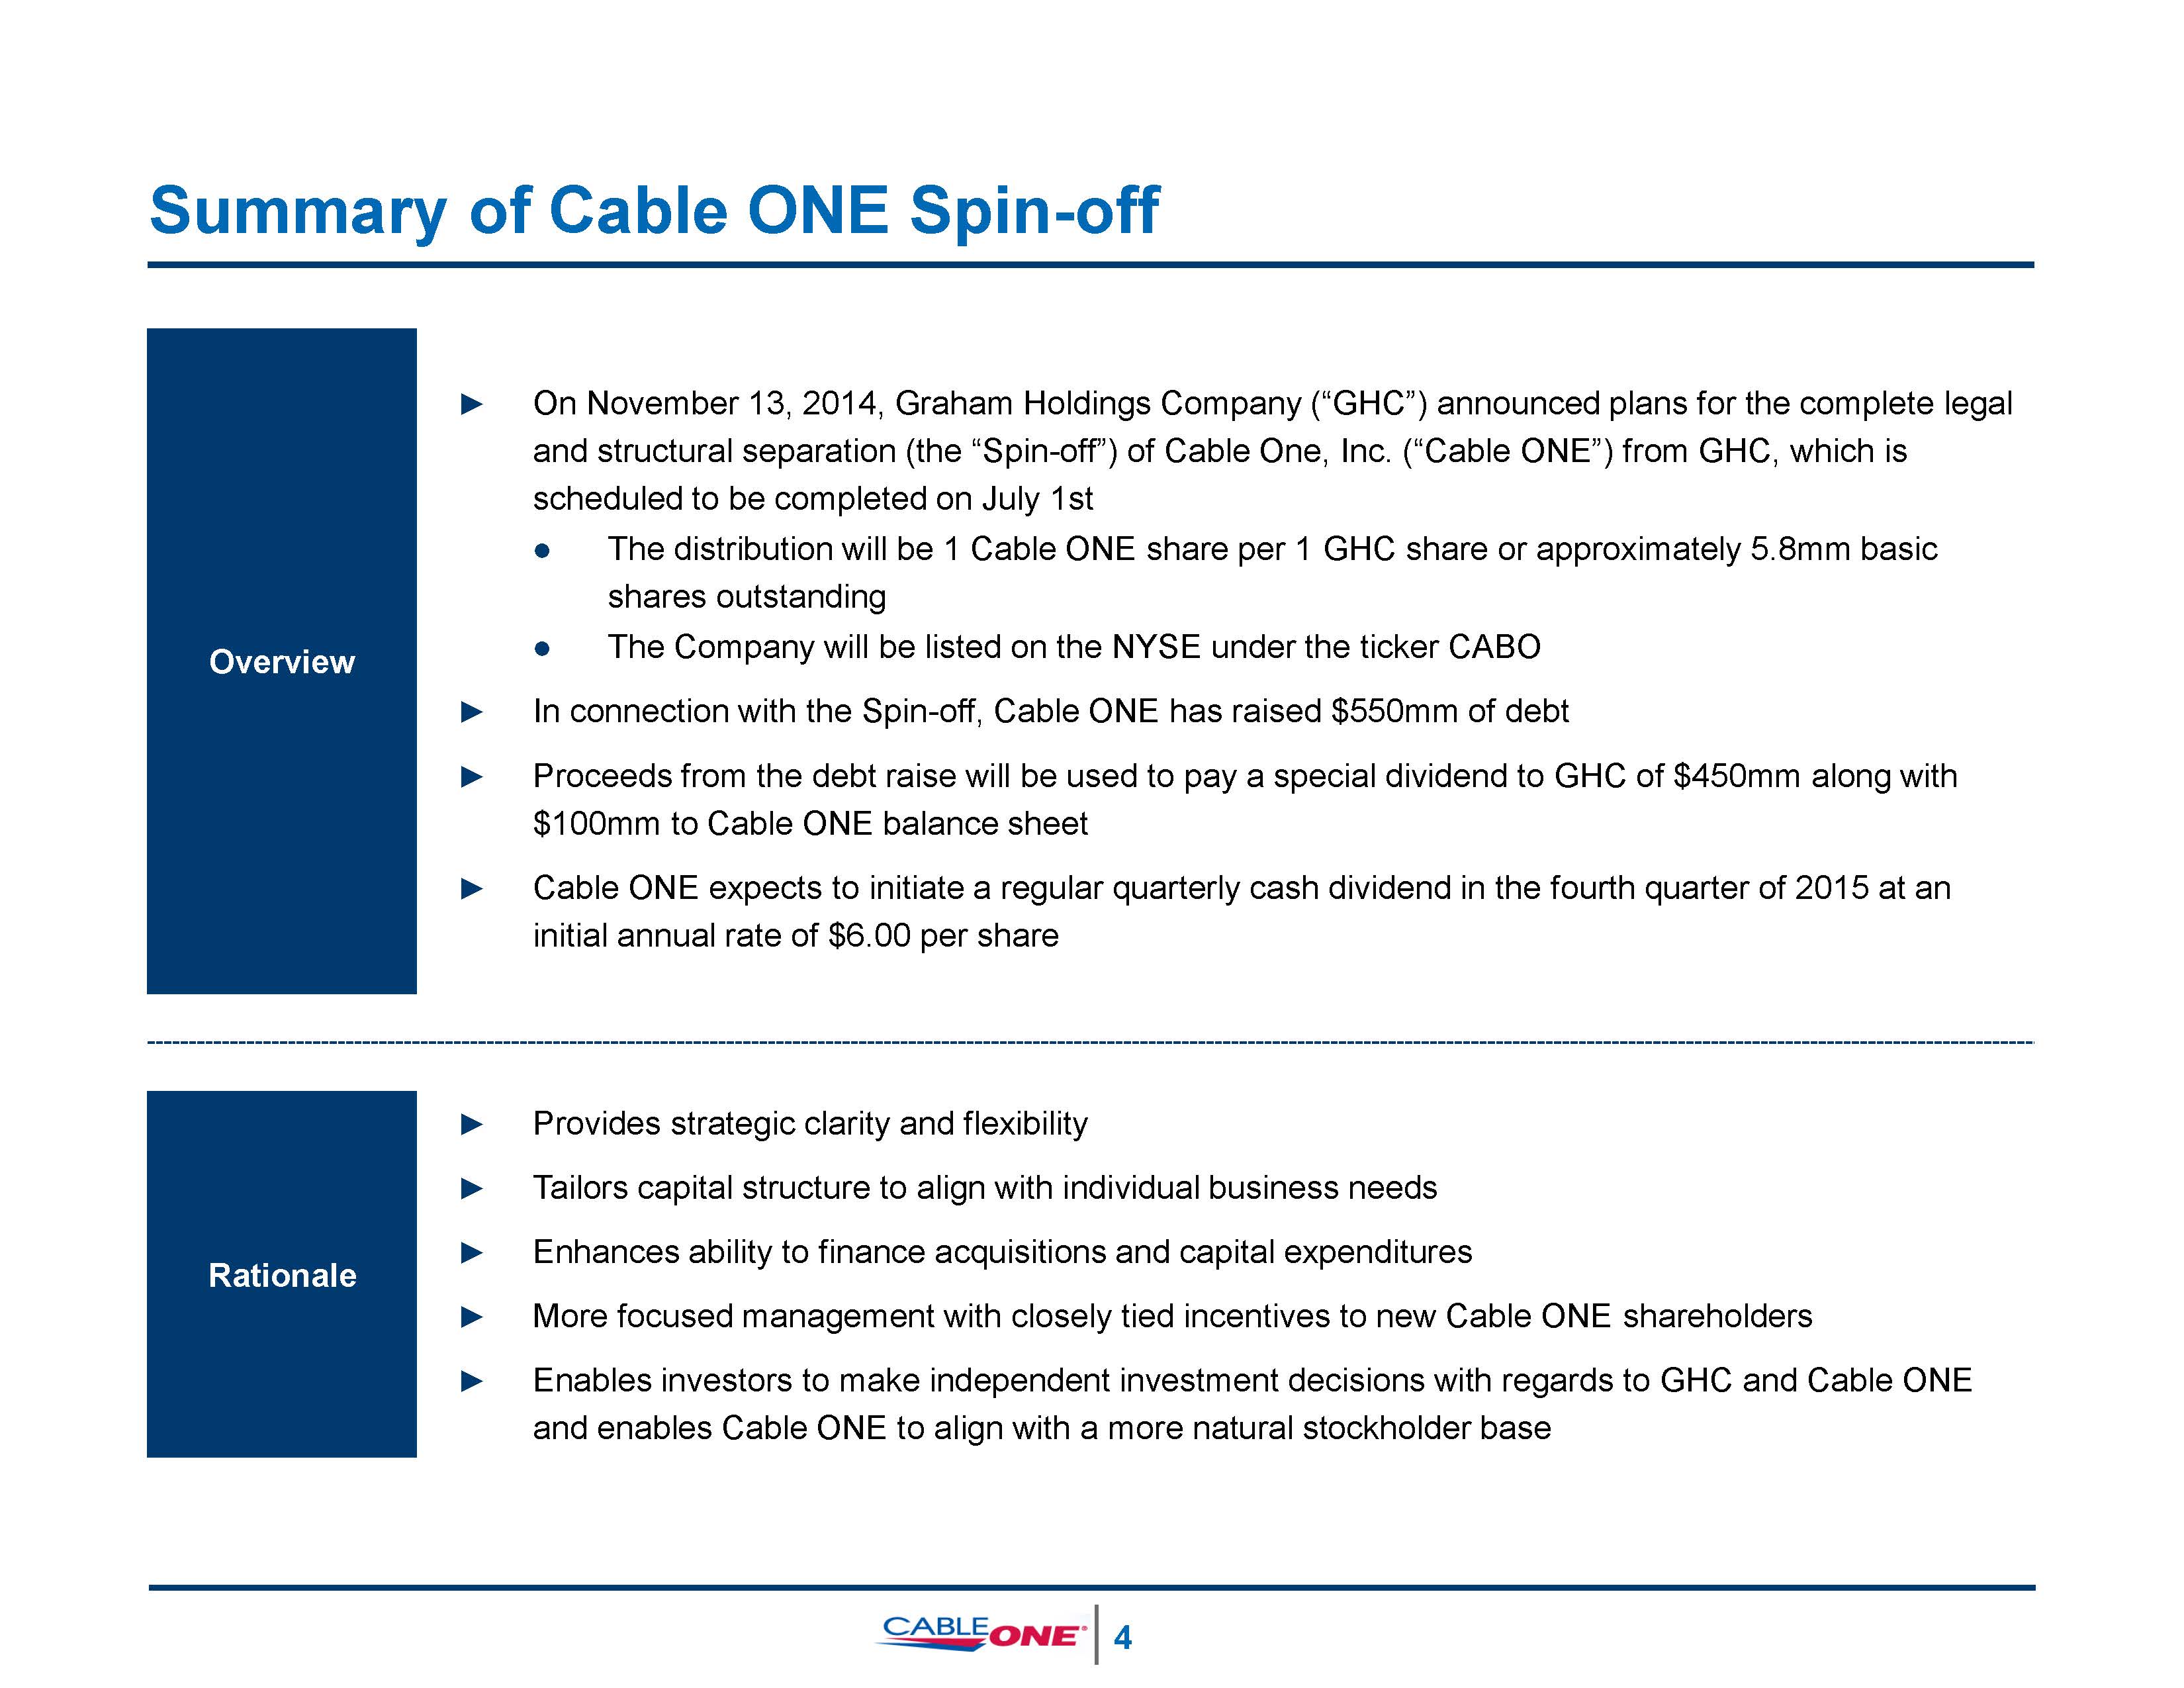
Summary of Cable ONE Spin-off Overview ► On November 13, 2014, Graham Holdings Company (“GHC”) announced plans for the complete legal and structural separation (the “Spin-off”) of Cable One, Inc. (“Cable ONE”) from GHC, which is scheduled to be completed on July 1st The distribution will be 1 Cable ONE share per 1 GHC share or approximately 5.8mm basic shares outstandingThe Company will be listed on the NYSE under the ticker CABO ► In connection with the Spin-off, Cable ONE has raised $550mm of debt► Proceeds from the debt raise will be used to pay a special dividend to GHC of $450mm along with$100mm to Cable ONE balance sheet► Cable ONE expects to initiate a regular quarterly cash dividend in the fourth quarter of 2015 at an initial annual rate of $6.00 per share Rationale ► Provides strategic clarity and flexibility► Tailors capital structure to align with individual business needs► Enhances ability to finance acquisitions and capital expenditures► More focused management with closely tied incentives to new Cable ONE shareholders► Enables investors to make independent investment decisions with regards to GHC and Cable ONE and enables Cable ONE to align with a more natural stockholder base 5
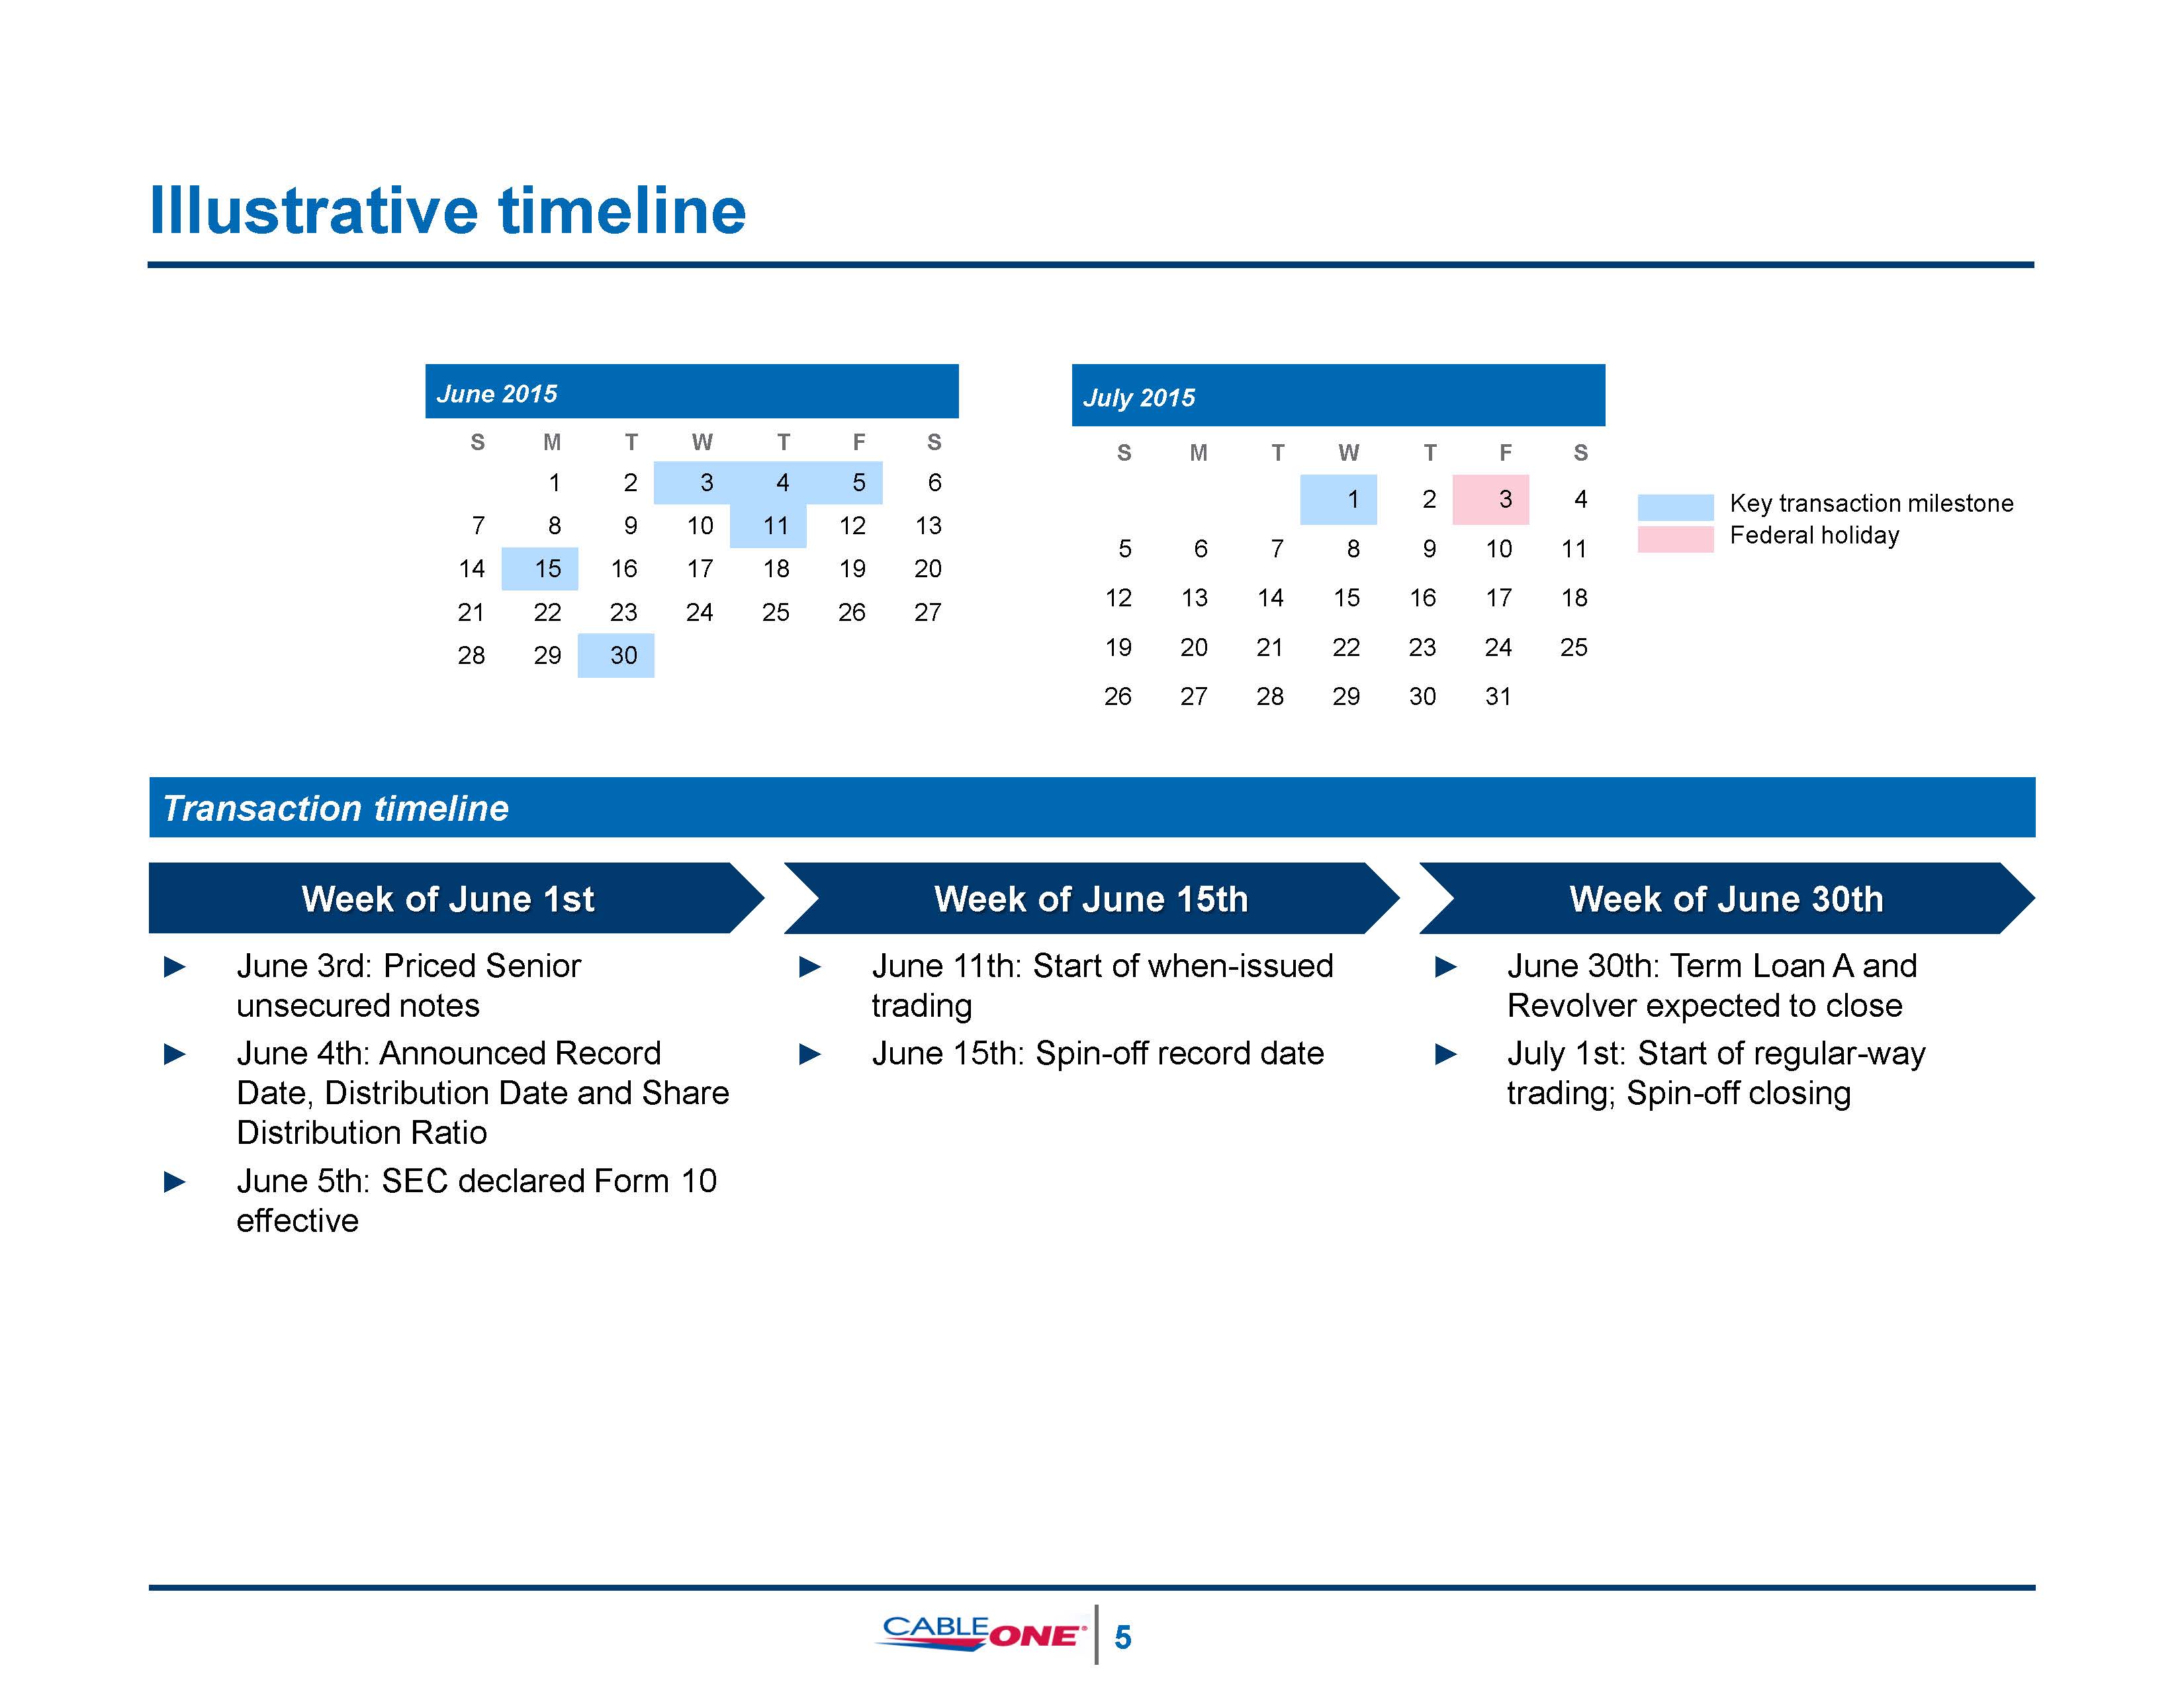
Illustrative timeline Key transaction milestoneFederal holiday 6 Transaction timeline Week of June 1st Week of June 15th Week of June 30th June 2015 S M T W T F S 1 2 3 4 5 6 7 8 9 10 11 12 13 14 15 16 17 18 19 20 21 22 23 24 25 26 27 28 29 30 July 2015 S M T W T F S 1 2 3 4 5 6 7 8 9 10 11 12 13 14 15 16 17 18 19 20 21 22 23 24 25 26 27 28 29 30 31 ► June 3rd: Priced Senior unsecured notes ► June 11th: Start of when-issued trading ► June 30th: Term Loan A and Revolver expected to close ► June 4th: Announced Record Date, Distribution Date and Share Distribution Ratio ► June 15th: Spin-off record date ► July 1st: Start of regular-way trading; Spin-off closing ► June 5th: SEC declared Form 10 effective
Agenda► Transaction overview► Investment highlights► Financial overview► Appendix 7
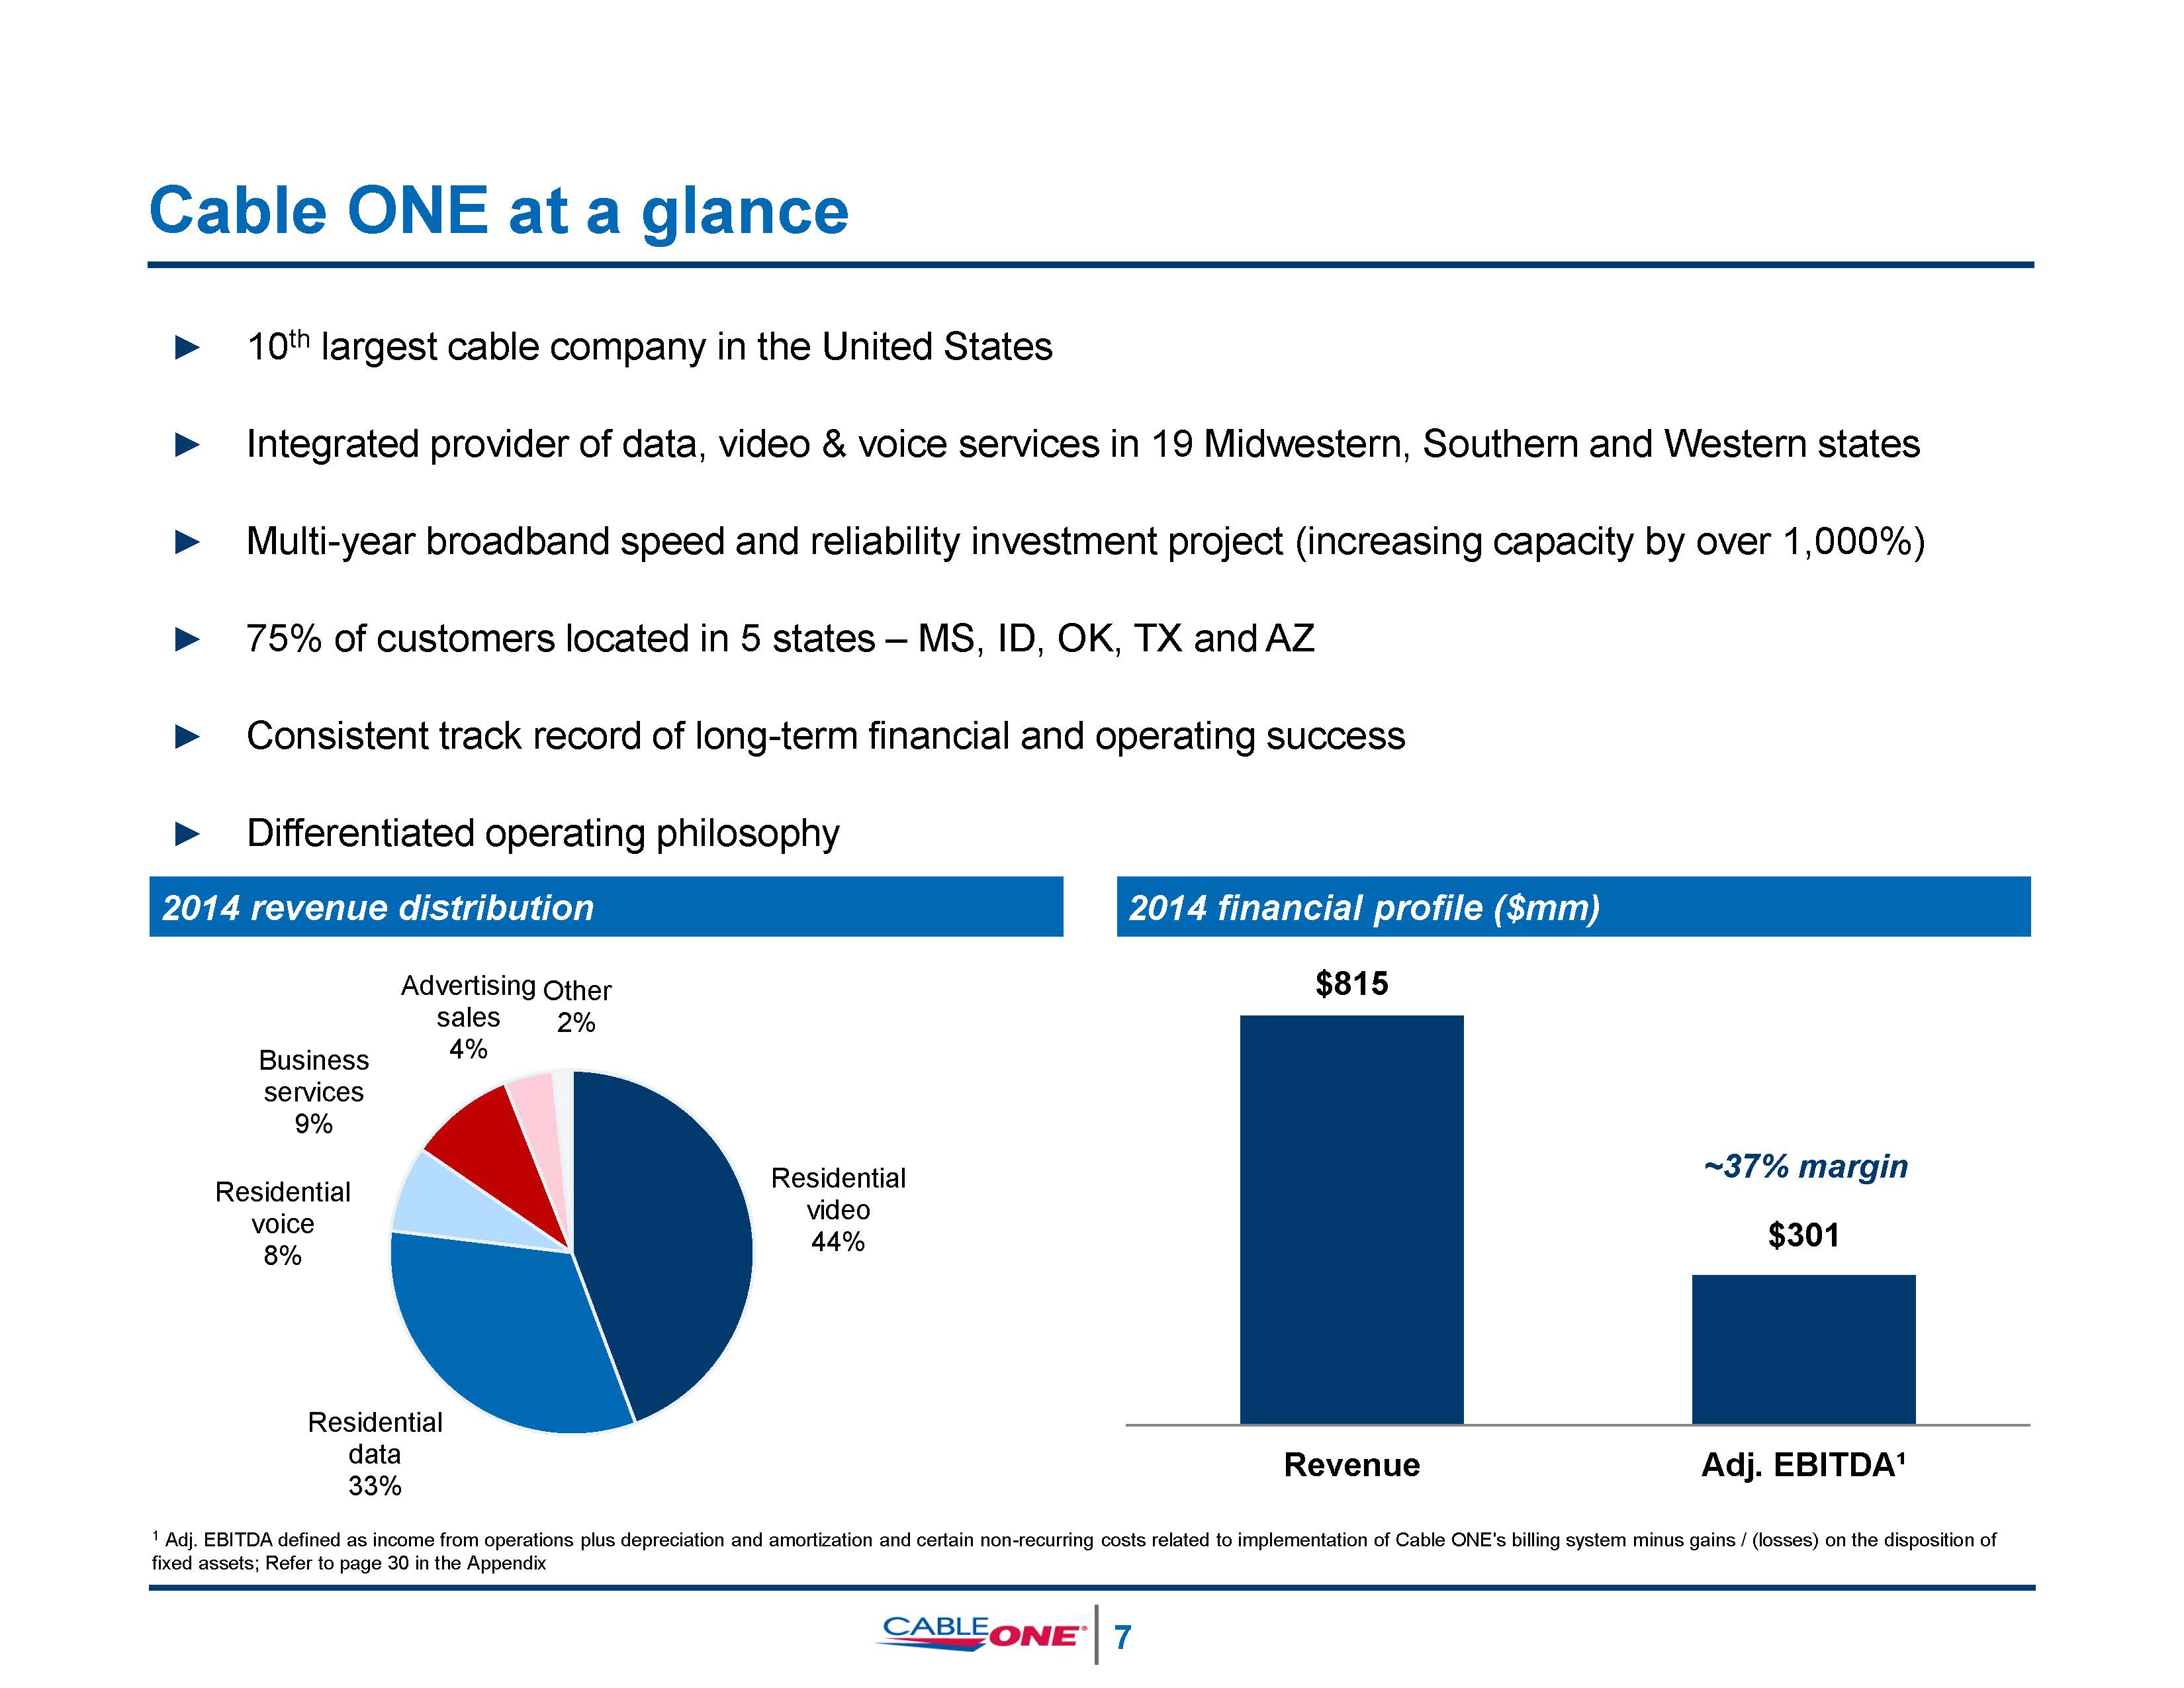
Cable ONE at a glance ► 10th largest cable company in the United States► Integrated provider of data, video & voice services in 19 Midwestern, Southern and Western states► Multi-year broadband speed and reliability investment project (increasing capacity by over 1,000%)► 75% of customers located in 5 states – MS, ID, OK, TX and AZ► Consistent track record of long-term financial and operating success► Differentiated operating philosophy 2014 revenue distribution 2014 financial profile ($mm) Residential video 44% Residential data 33% Residential voice 8% Business services 9% Advertising Other sales4% 2% ~37% margin 1 Adj. EBITDA defined as income from operations plus depreciation and amortization and certain non-recurring costs related to implementation of Cable ONE's billing system minus gains / (losses) on the disposition of fixed assets; Refer to page 30 in the Appendix $815 8 $301 Revenue Adj. EBITDA¹
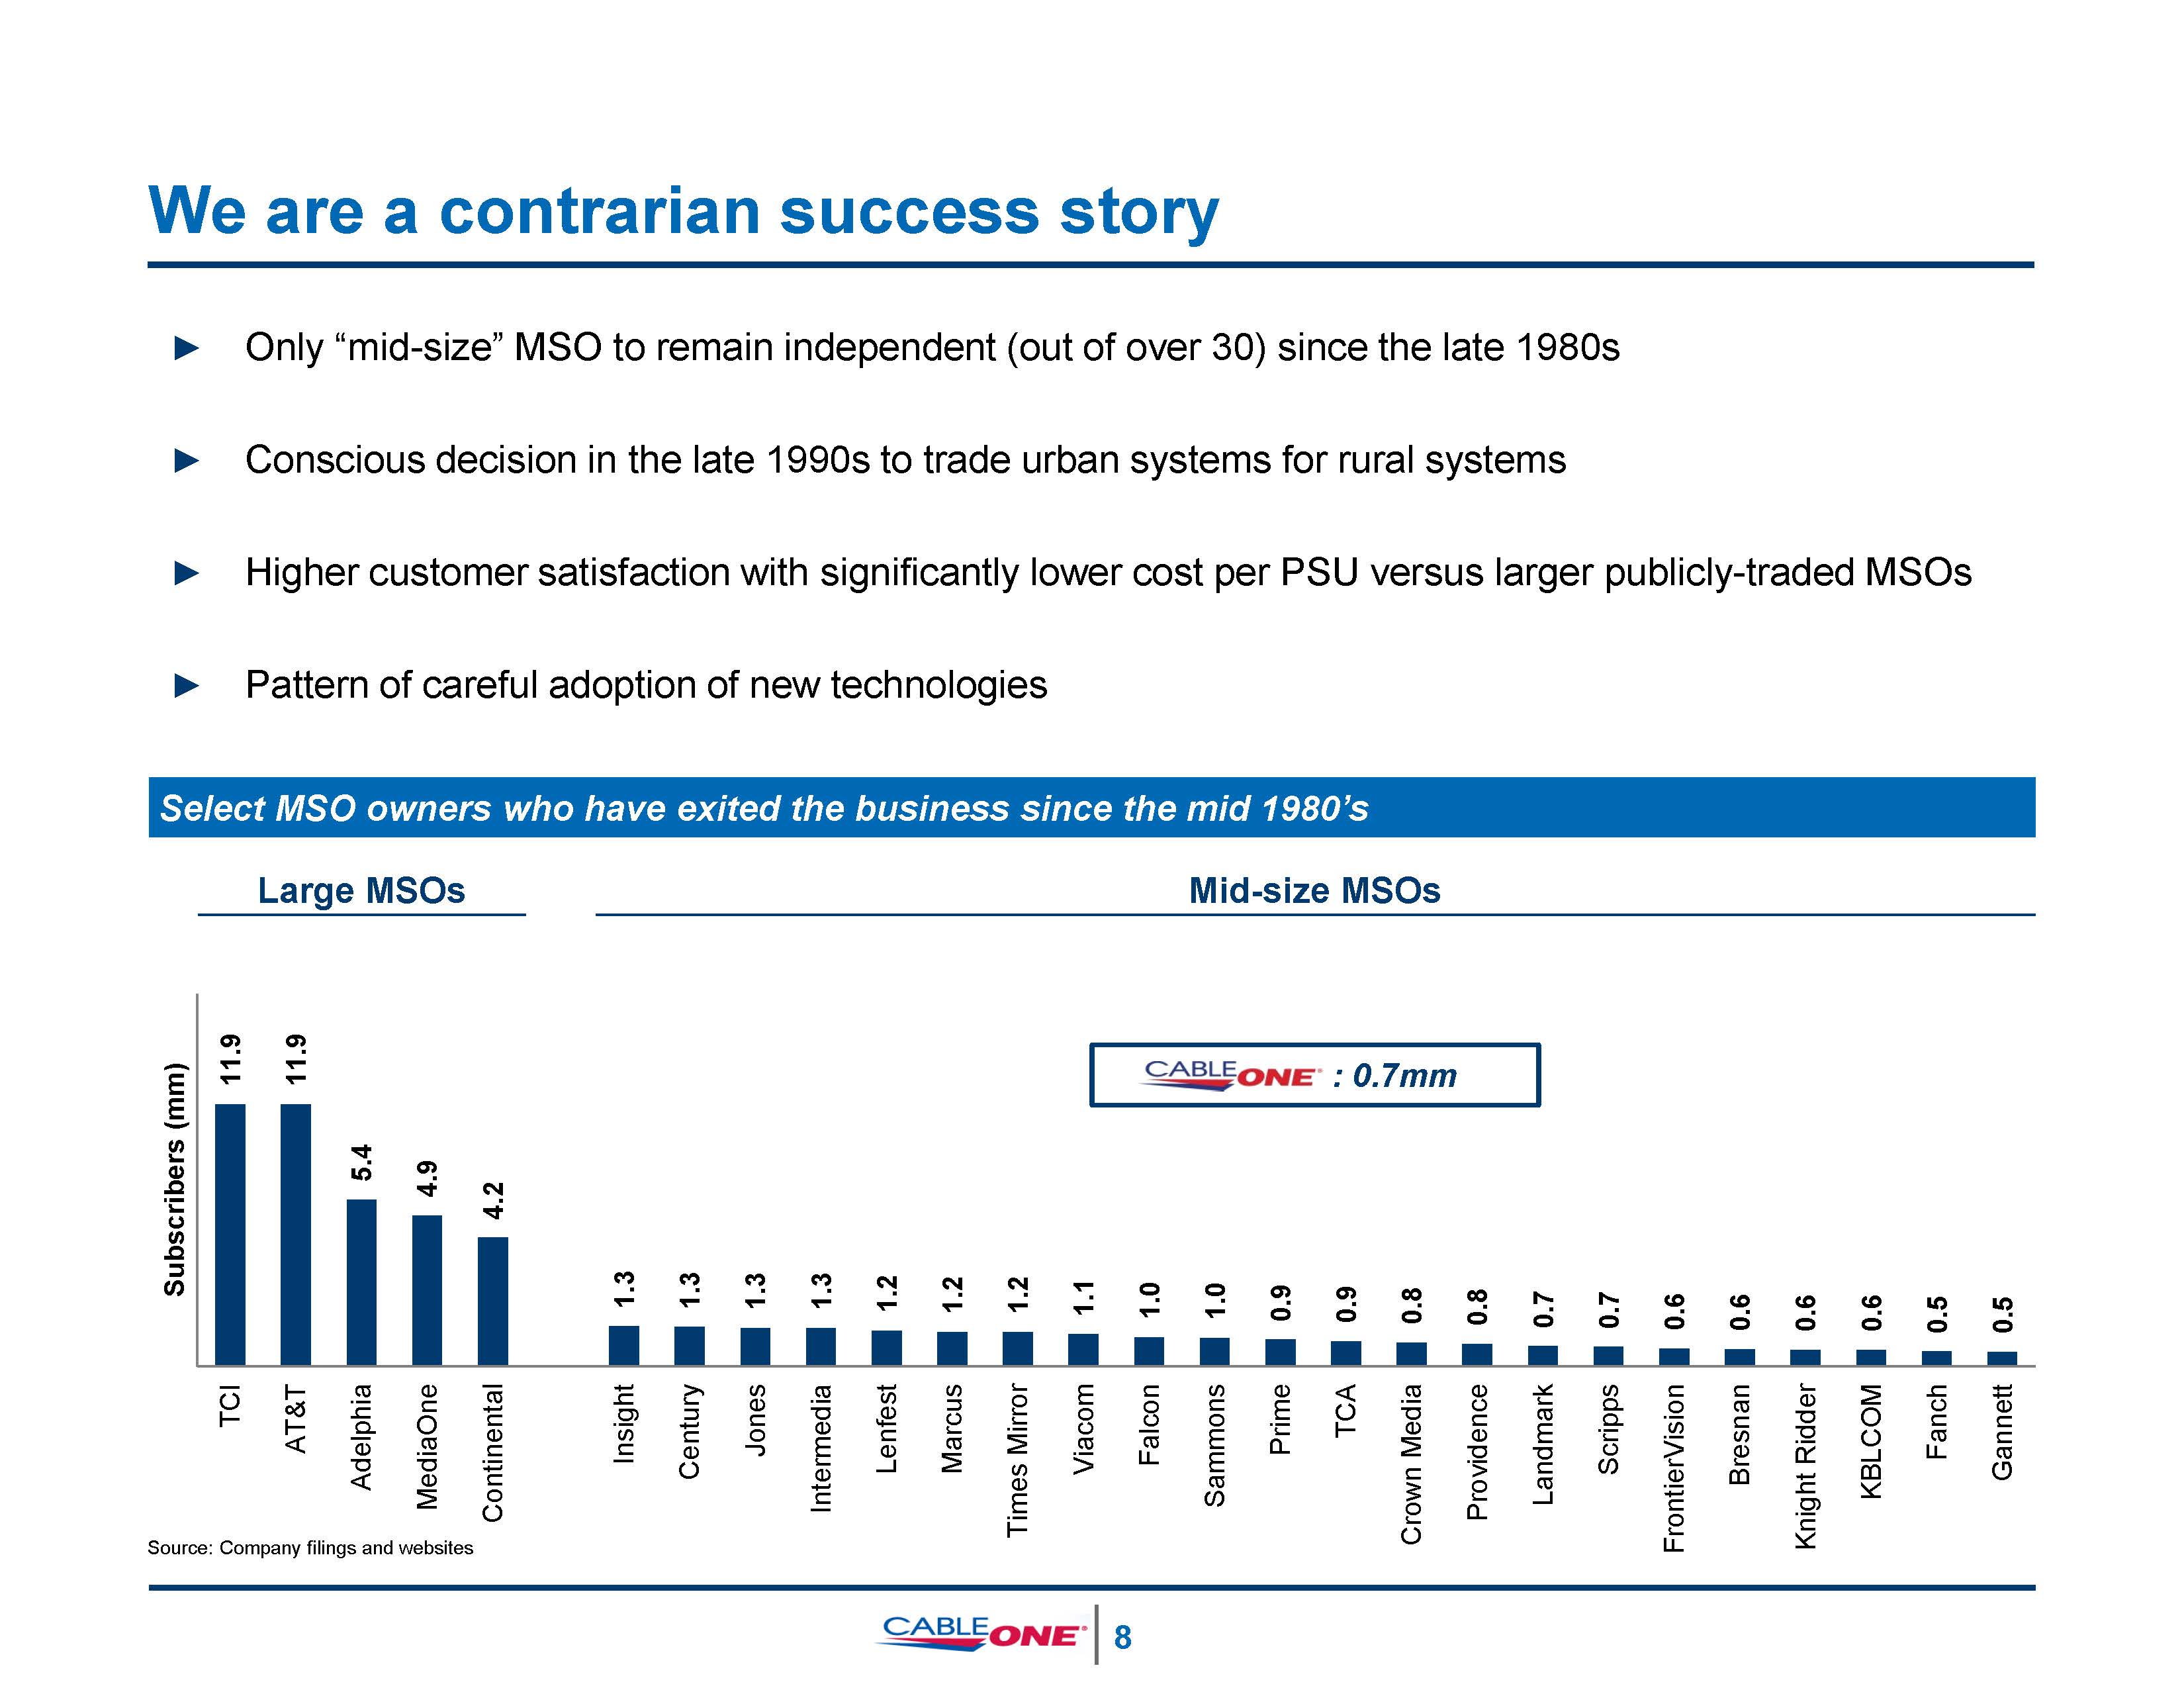
We are a contrarian success story ► Only “mid-size” MSO to remain independent (out of over 30) since the late 1980s► Conscious decision in the late 1990s to trade urban systems for rural systems► Higher customer satisfaction with significantly lower cost per PSU versus larger publicly-traded MSOs► Pattern of careful adoption of new technologies Subscribers (mm)11.9 11.9 5.4 4.9 4.2 1.3 1.3 1.3 1.3 1.2 1.2 1.2 1.1 1.0 1.0 0.9 0.9 0.8 0.8 0.7 0.7 0.6 0.6 0.6 0.6 0.5 0.5 TCI AT&T Adelphia MediaOne Continental Insight Century Jones Intermedia Lenfest Marcus Times Mirror Viacom Falcon Sammons Prime TCA Crown Media Providence Landmark Scripps FrontierVision Bresnan Knight Ridder KBLCOM Fanch Gannett Select MSO owners who have exited the business since the mid 1980’s Source: Company filings and websites : 0.7mm Large MSOs Mid-size MSOs 9
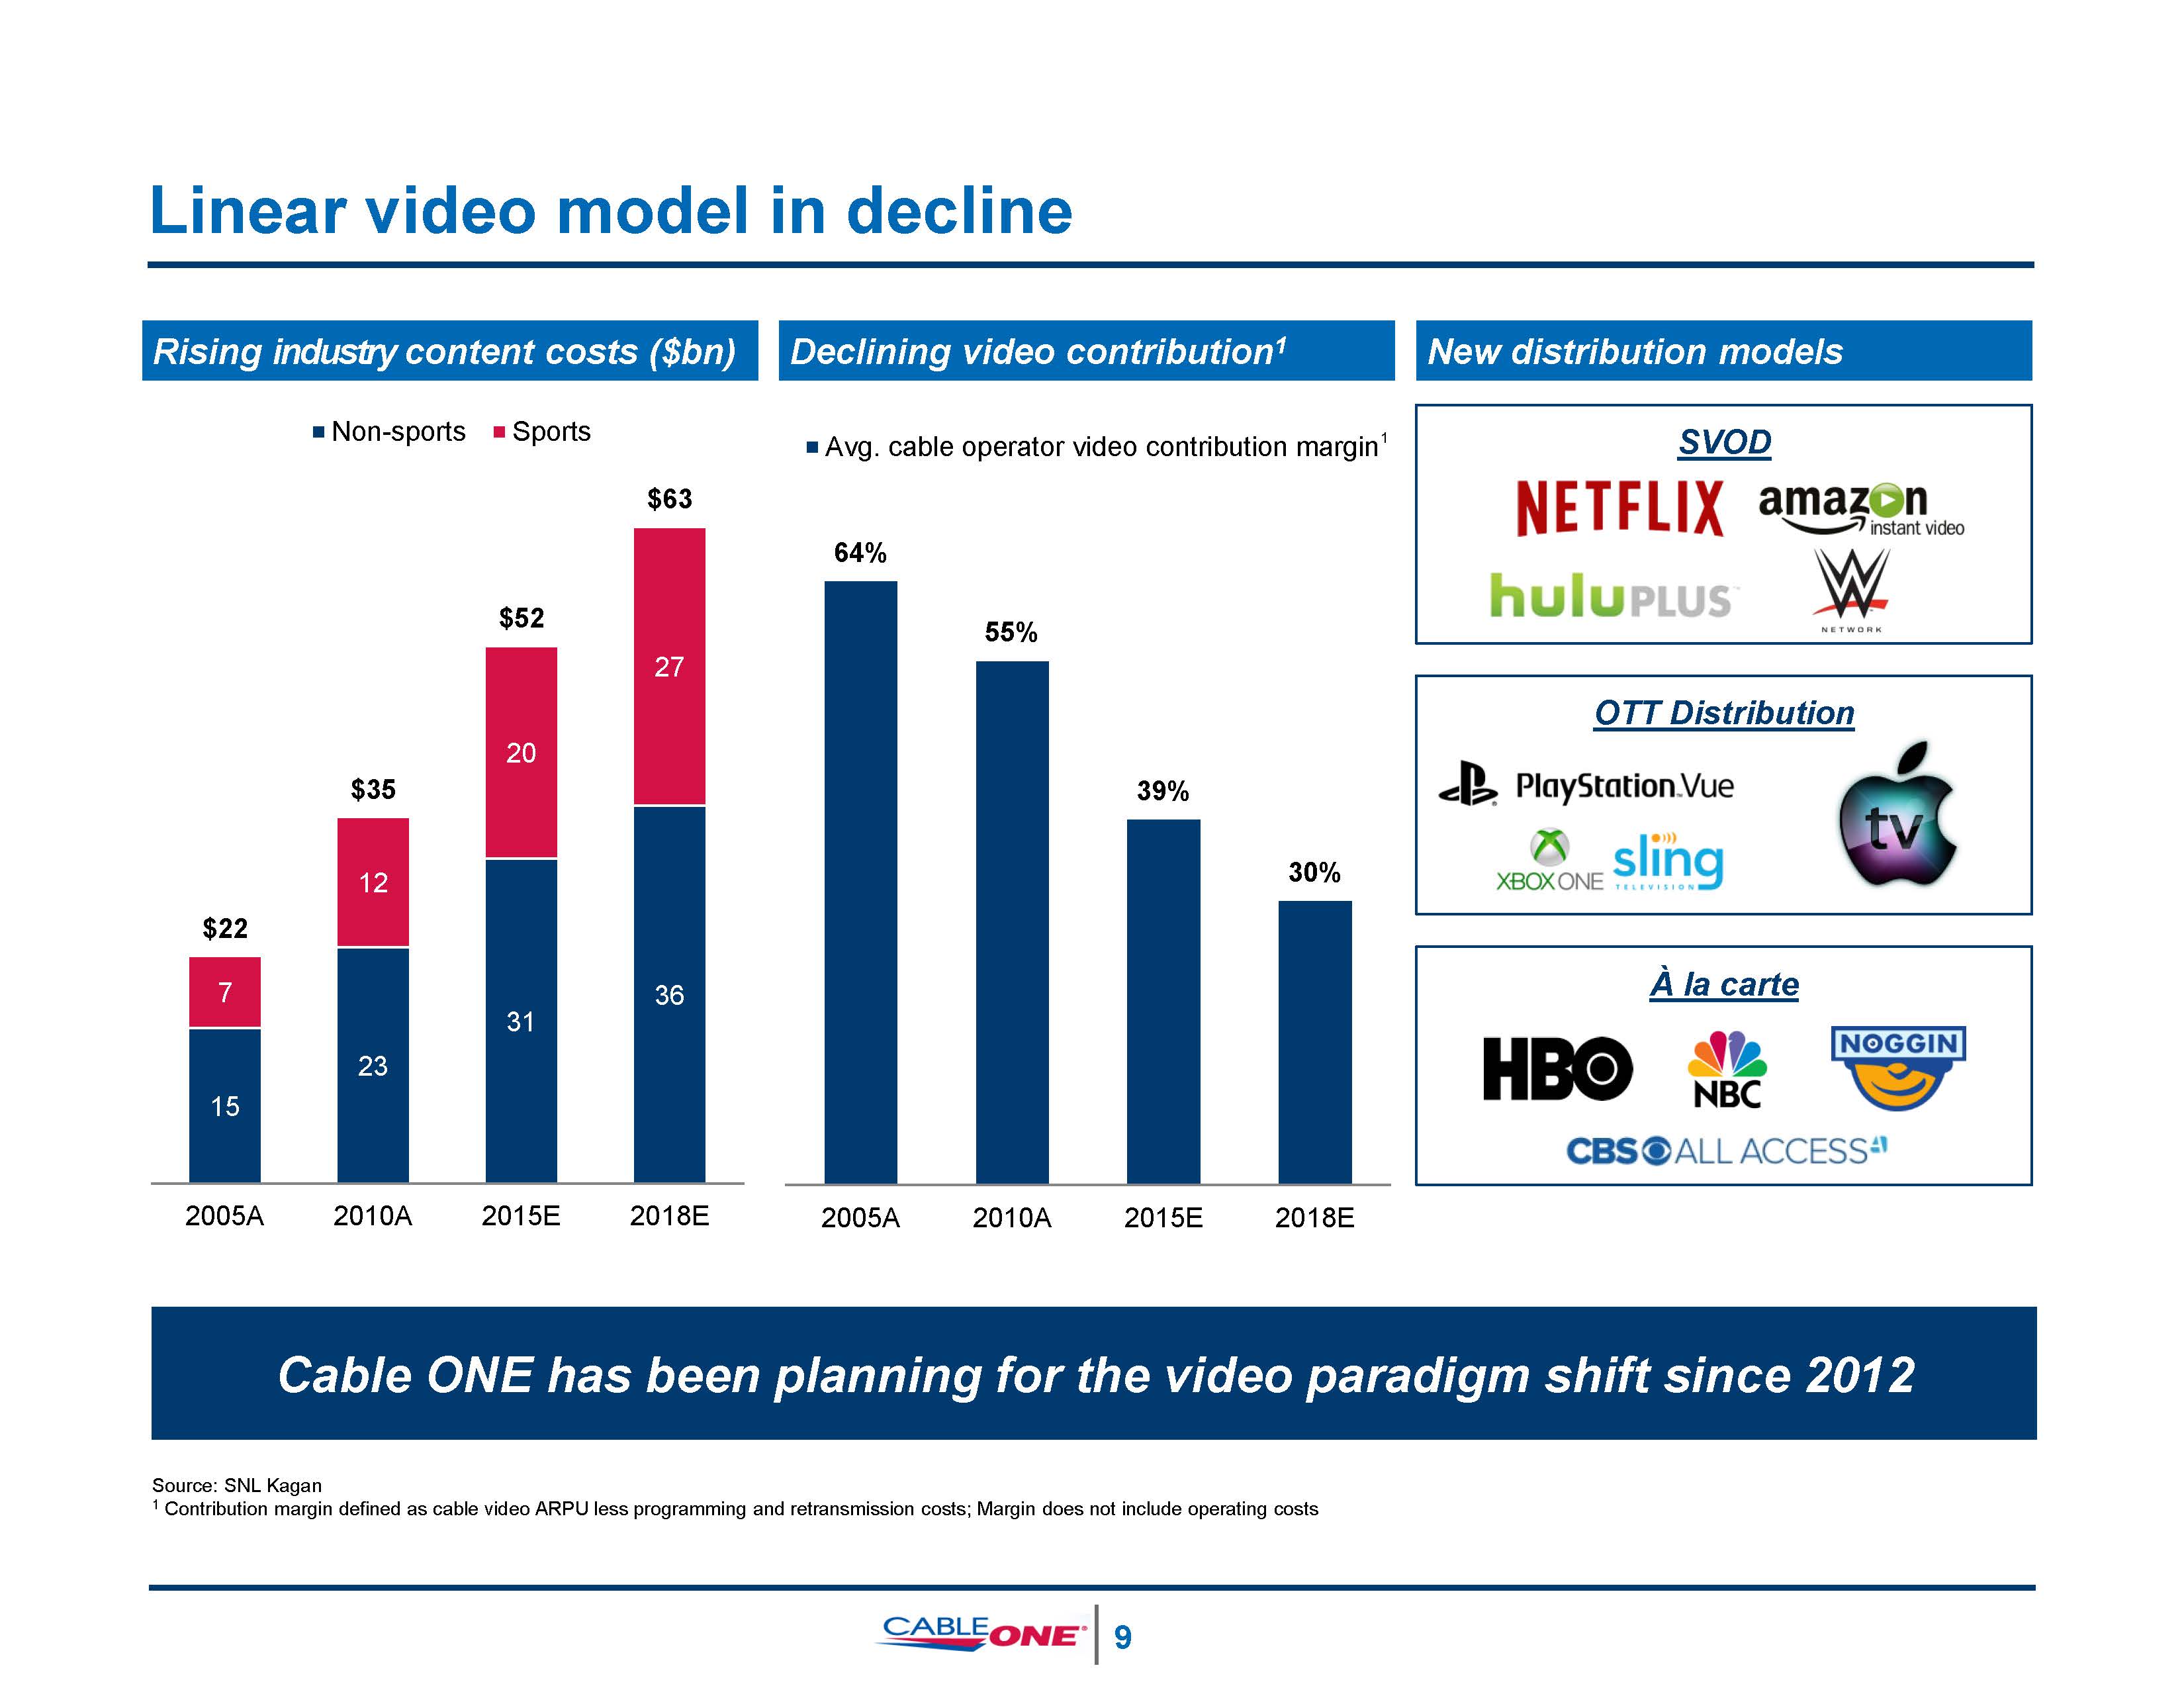
64% 55% 39% 30% 2005A 2010A 2015E 2018E 2018E Source: SNL Kagan1 Contribution margin defined as cable video ARPU less programming and retransmission costs; Margin does not include operating costs Avg. cable operator video contribution margin1 15 23 31 36 7 12 20 27 $22 $35 $52 $63 2005A 2010A 2015E Non-sports Sports Linear video model in decline Rising industry content costs ($bn) Declining video contribution1 New distribution models Cable ONE has been planning for the video paradigm shift since 2012 OTT Distribution SVOD À la carte 10
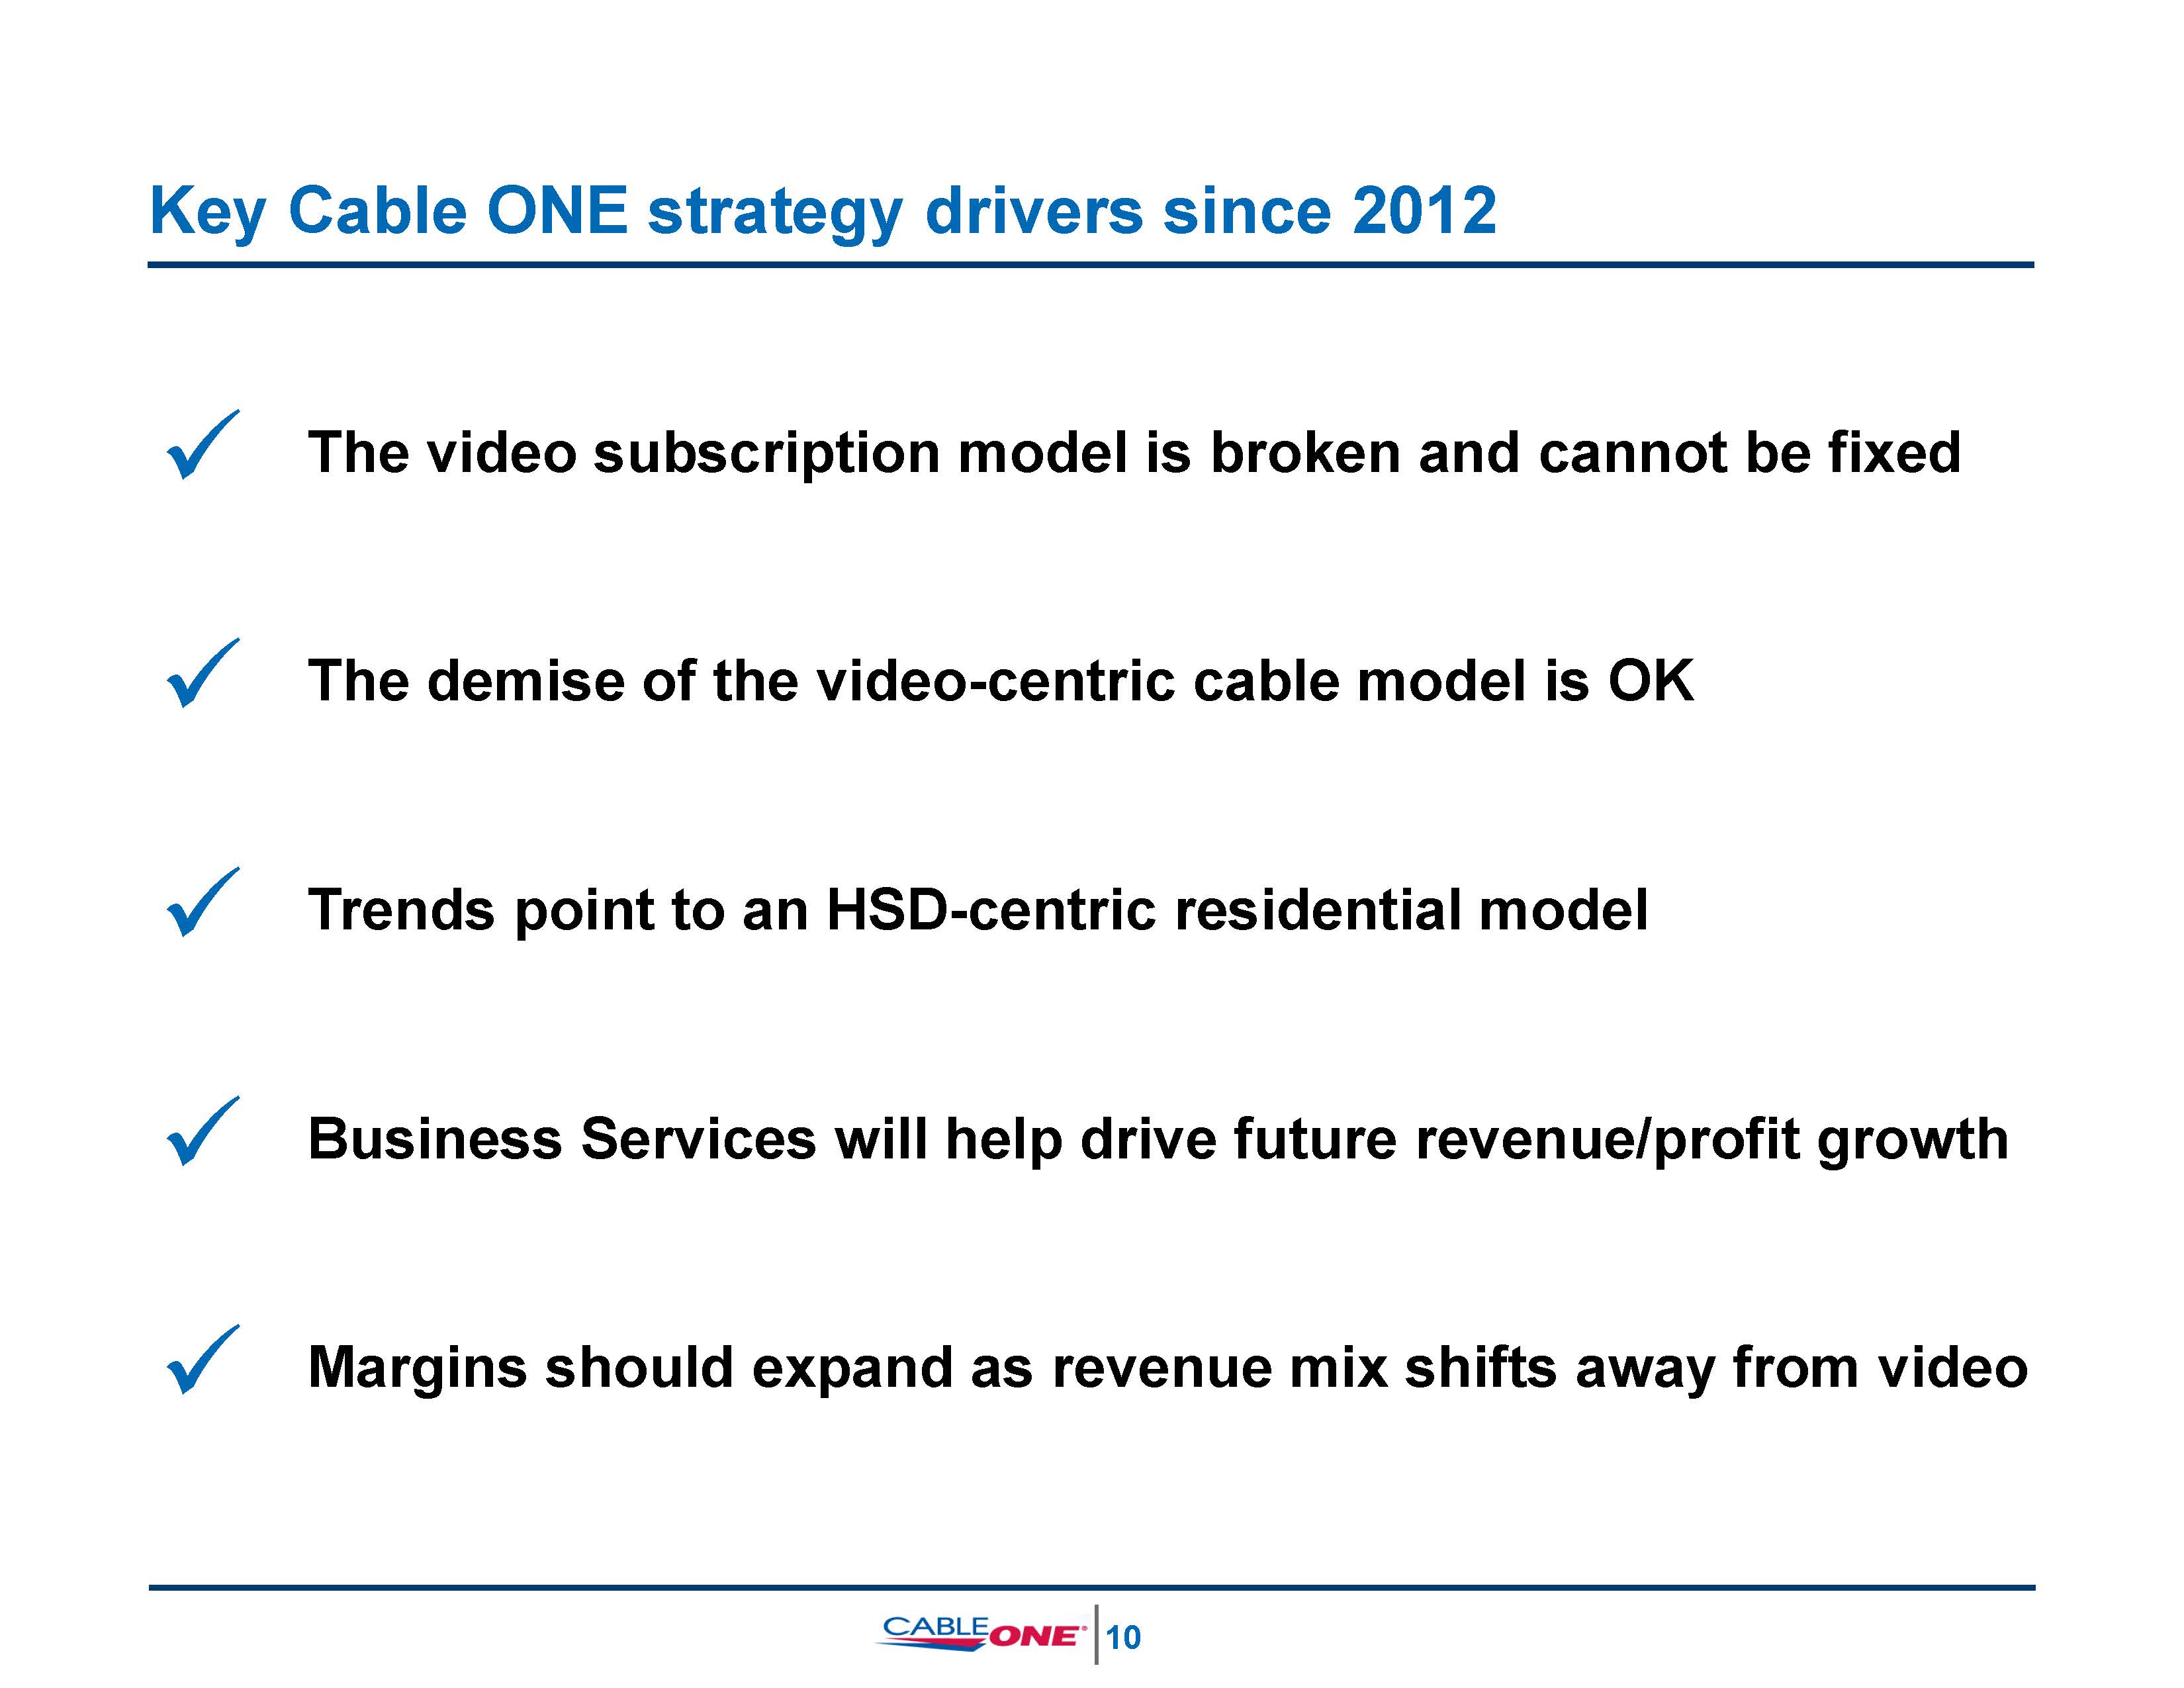
Key Cable ONE strategy drivers since 2012 11 The video subscription model is broken and cannot be fixed Trends point to an HSD-centric residential model The demise of the video-centric cable model is OK Business Services will help drive future revenue/profit growth Margins should expand as revenue mix shifts away from video
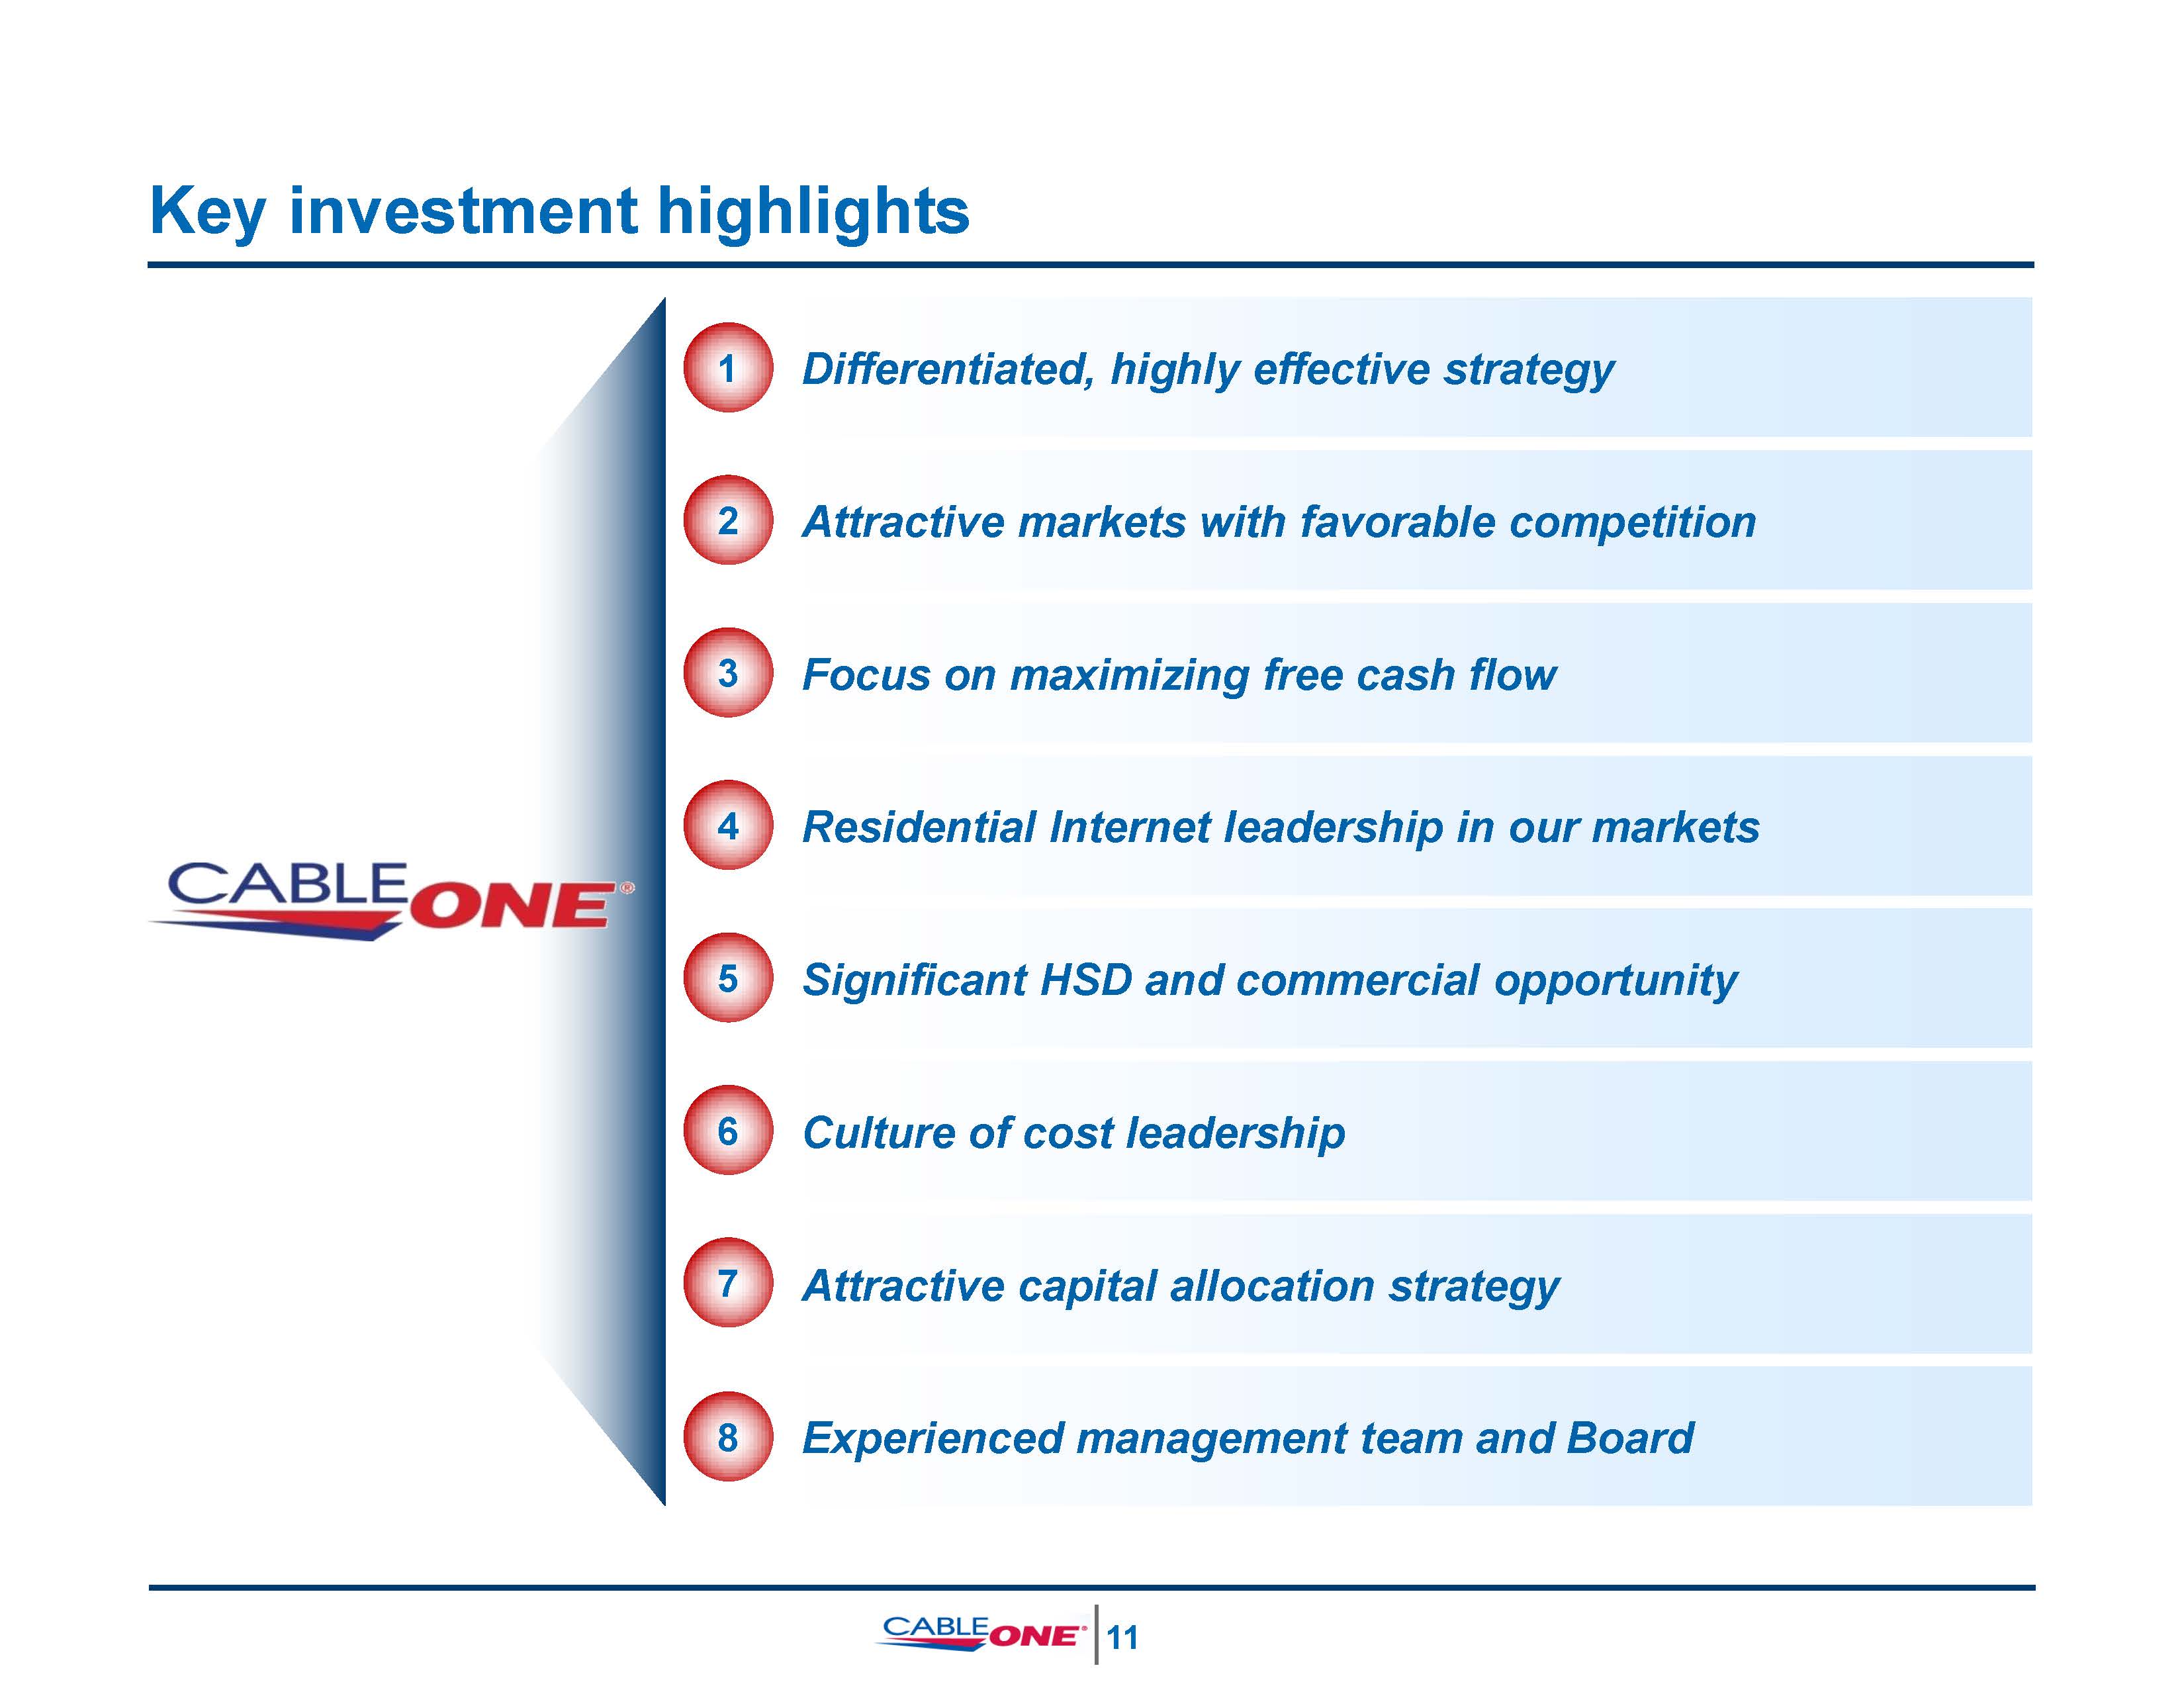
Key investment highlights Differentiated, highly effective strategy Attractive markets with favorable competition Focus on maximizing free cash flow Residential Internet leadership in our markets Significant HSD and commercial opportunity Culture of cost leadership Attractive capital allocation strategy 1 2 3 4 5 6 7 8 Experienced management team and Board 12
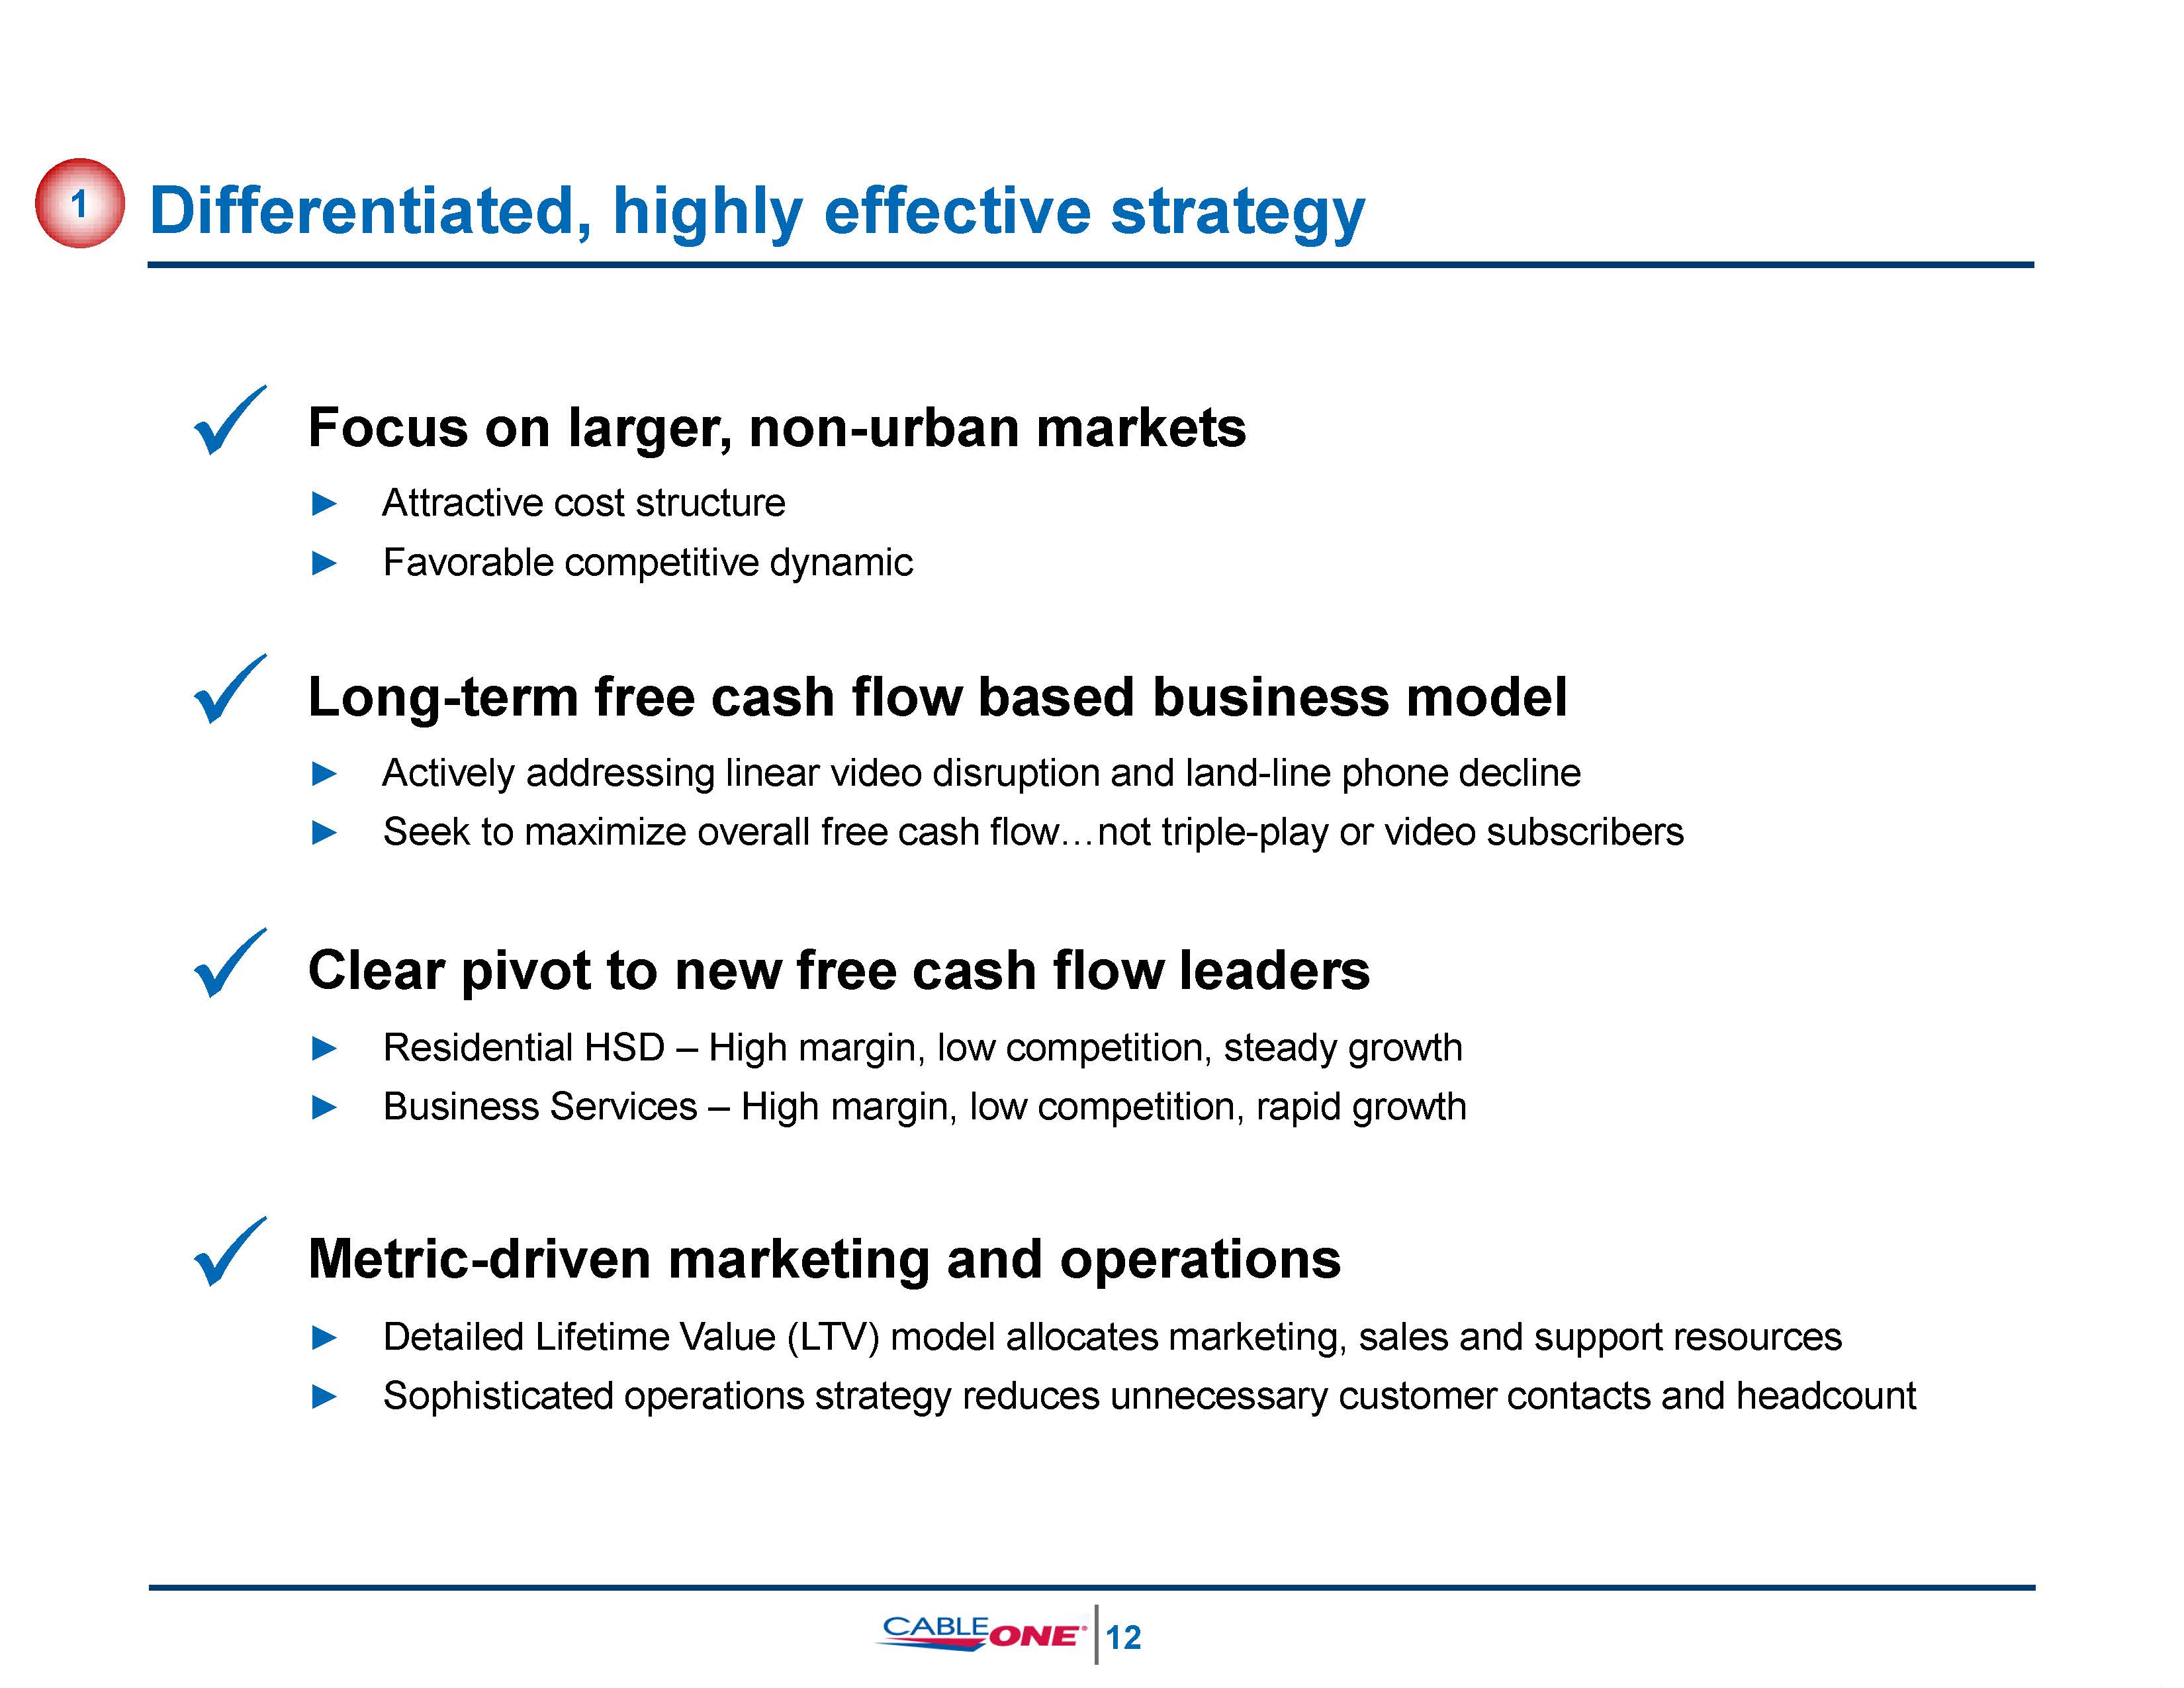
Differentiated, highly effective strategy 1 13 Focus on larger, non-urban markets► Attractive cost structure► Favorable competitive dynamic Long-term free cash flow based business model ► Actively addressing linear video disruption and land-line phone decline► Seek to maximize overall free cash flow…not triple-play or video subscribers Clear pivot to new free cash flow leaders ► Residential HSD – High margin, low competition, steady growth► Business Services – High margin, low competition, rapid growth Metric-driven marketing and operations► Detailed Lifetime Value (LTV) model allocates marketing, sales and support resources► Sophisticated operations strategy reduces unnecessary customer contacts and headcount
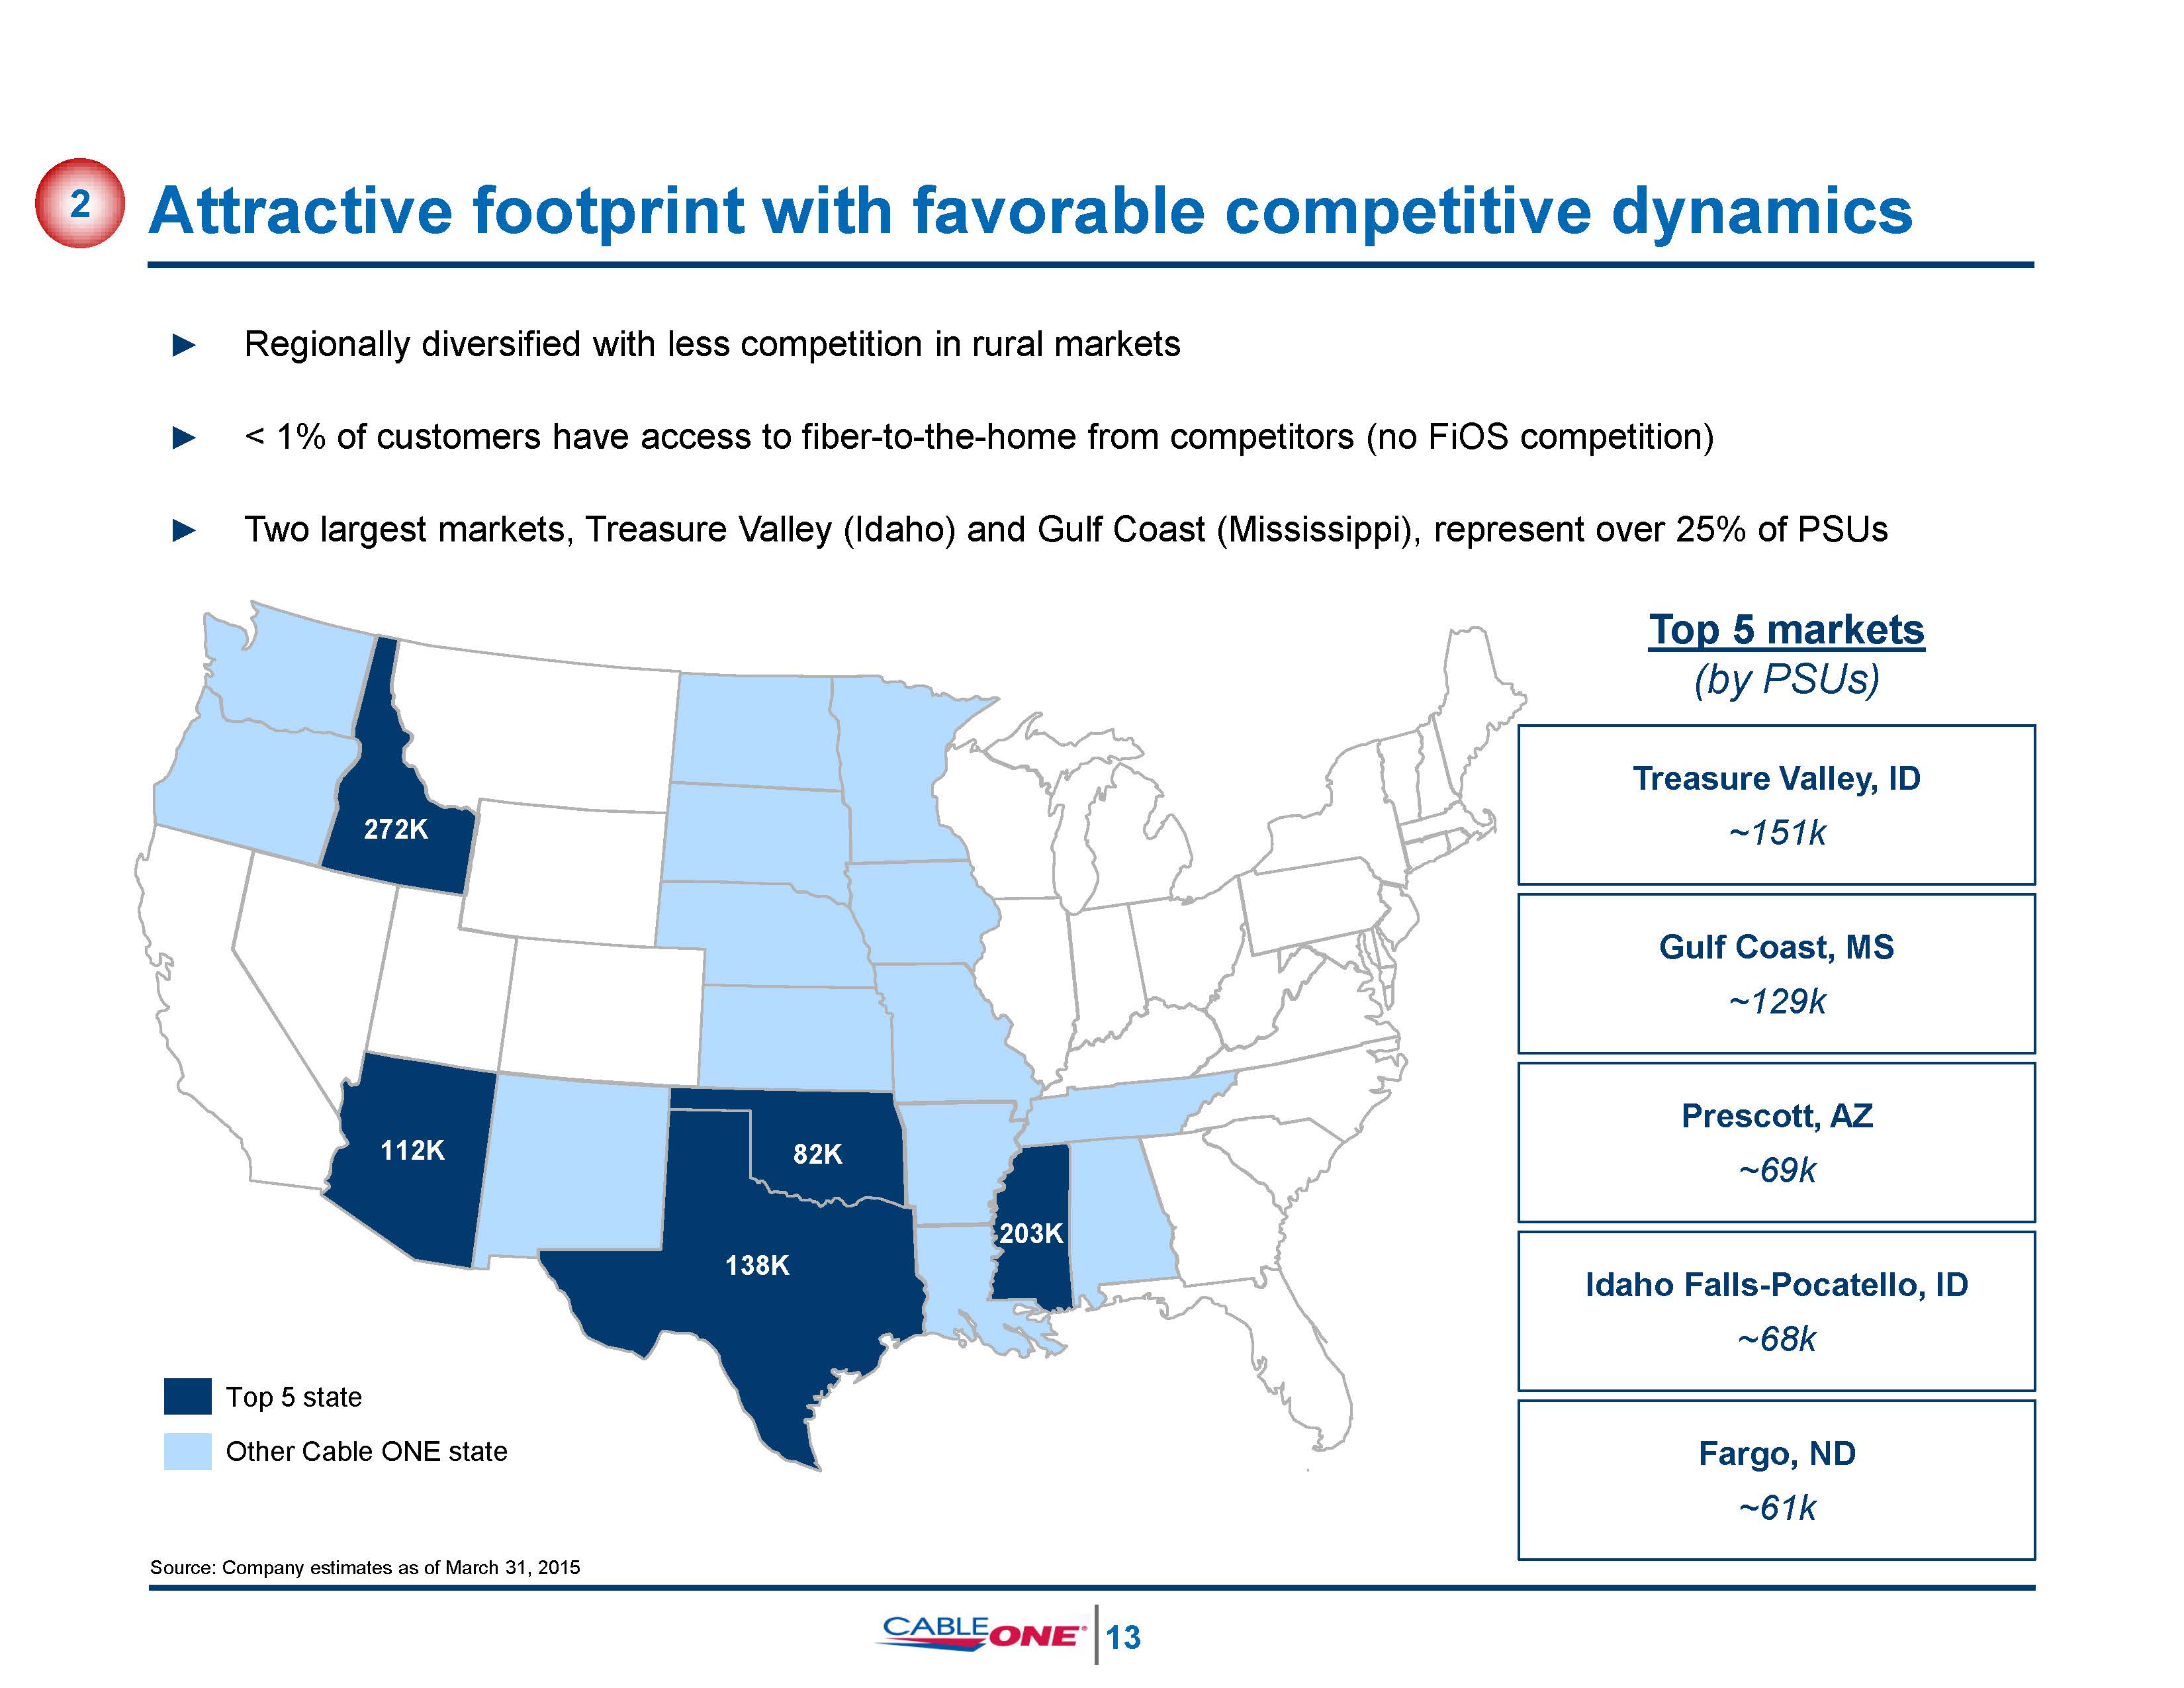
Attractive footprint with favorable competitive dynamics 2 ► Regionally diversified with less competition in rural markets► < 1% of customers have access to fiber-to-the-home from competitors (no FiOS competition)► Two largest markets, Treasure Valley (Idaho) and Gulf Coast (Mississippi), represent over 25% of PSUsTop 5 markets(by PSUs) 14 272K 112K 203K138K 82K Top 5 stateOther Cable ONE state Source: Company estimates as of March 31, 2015 Treasure Valley, ID~151k Gulf Coast, MS~129k Prescott, AZ~69k Idaho Falls-Pocatello, ID~68k Fargo, ND~61k
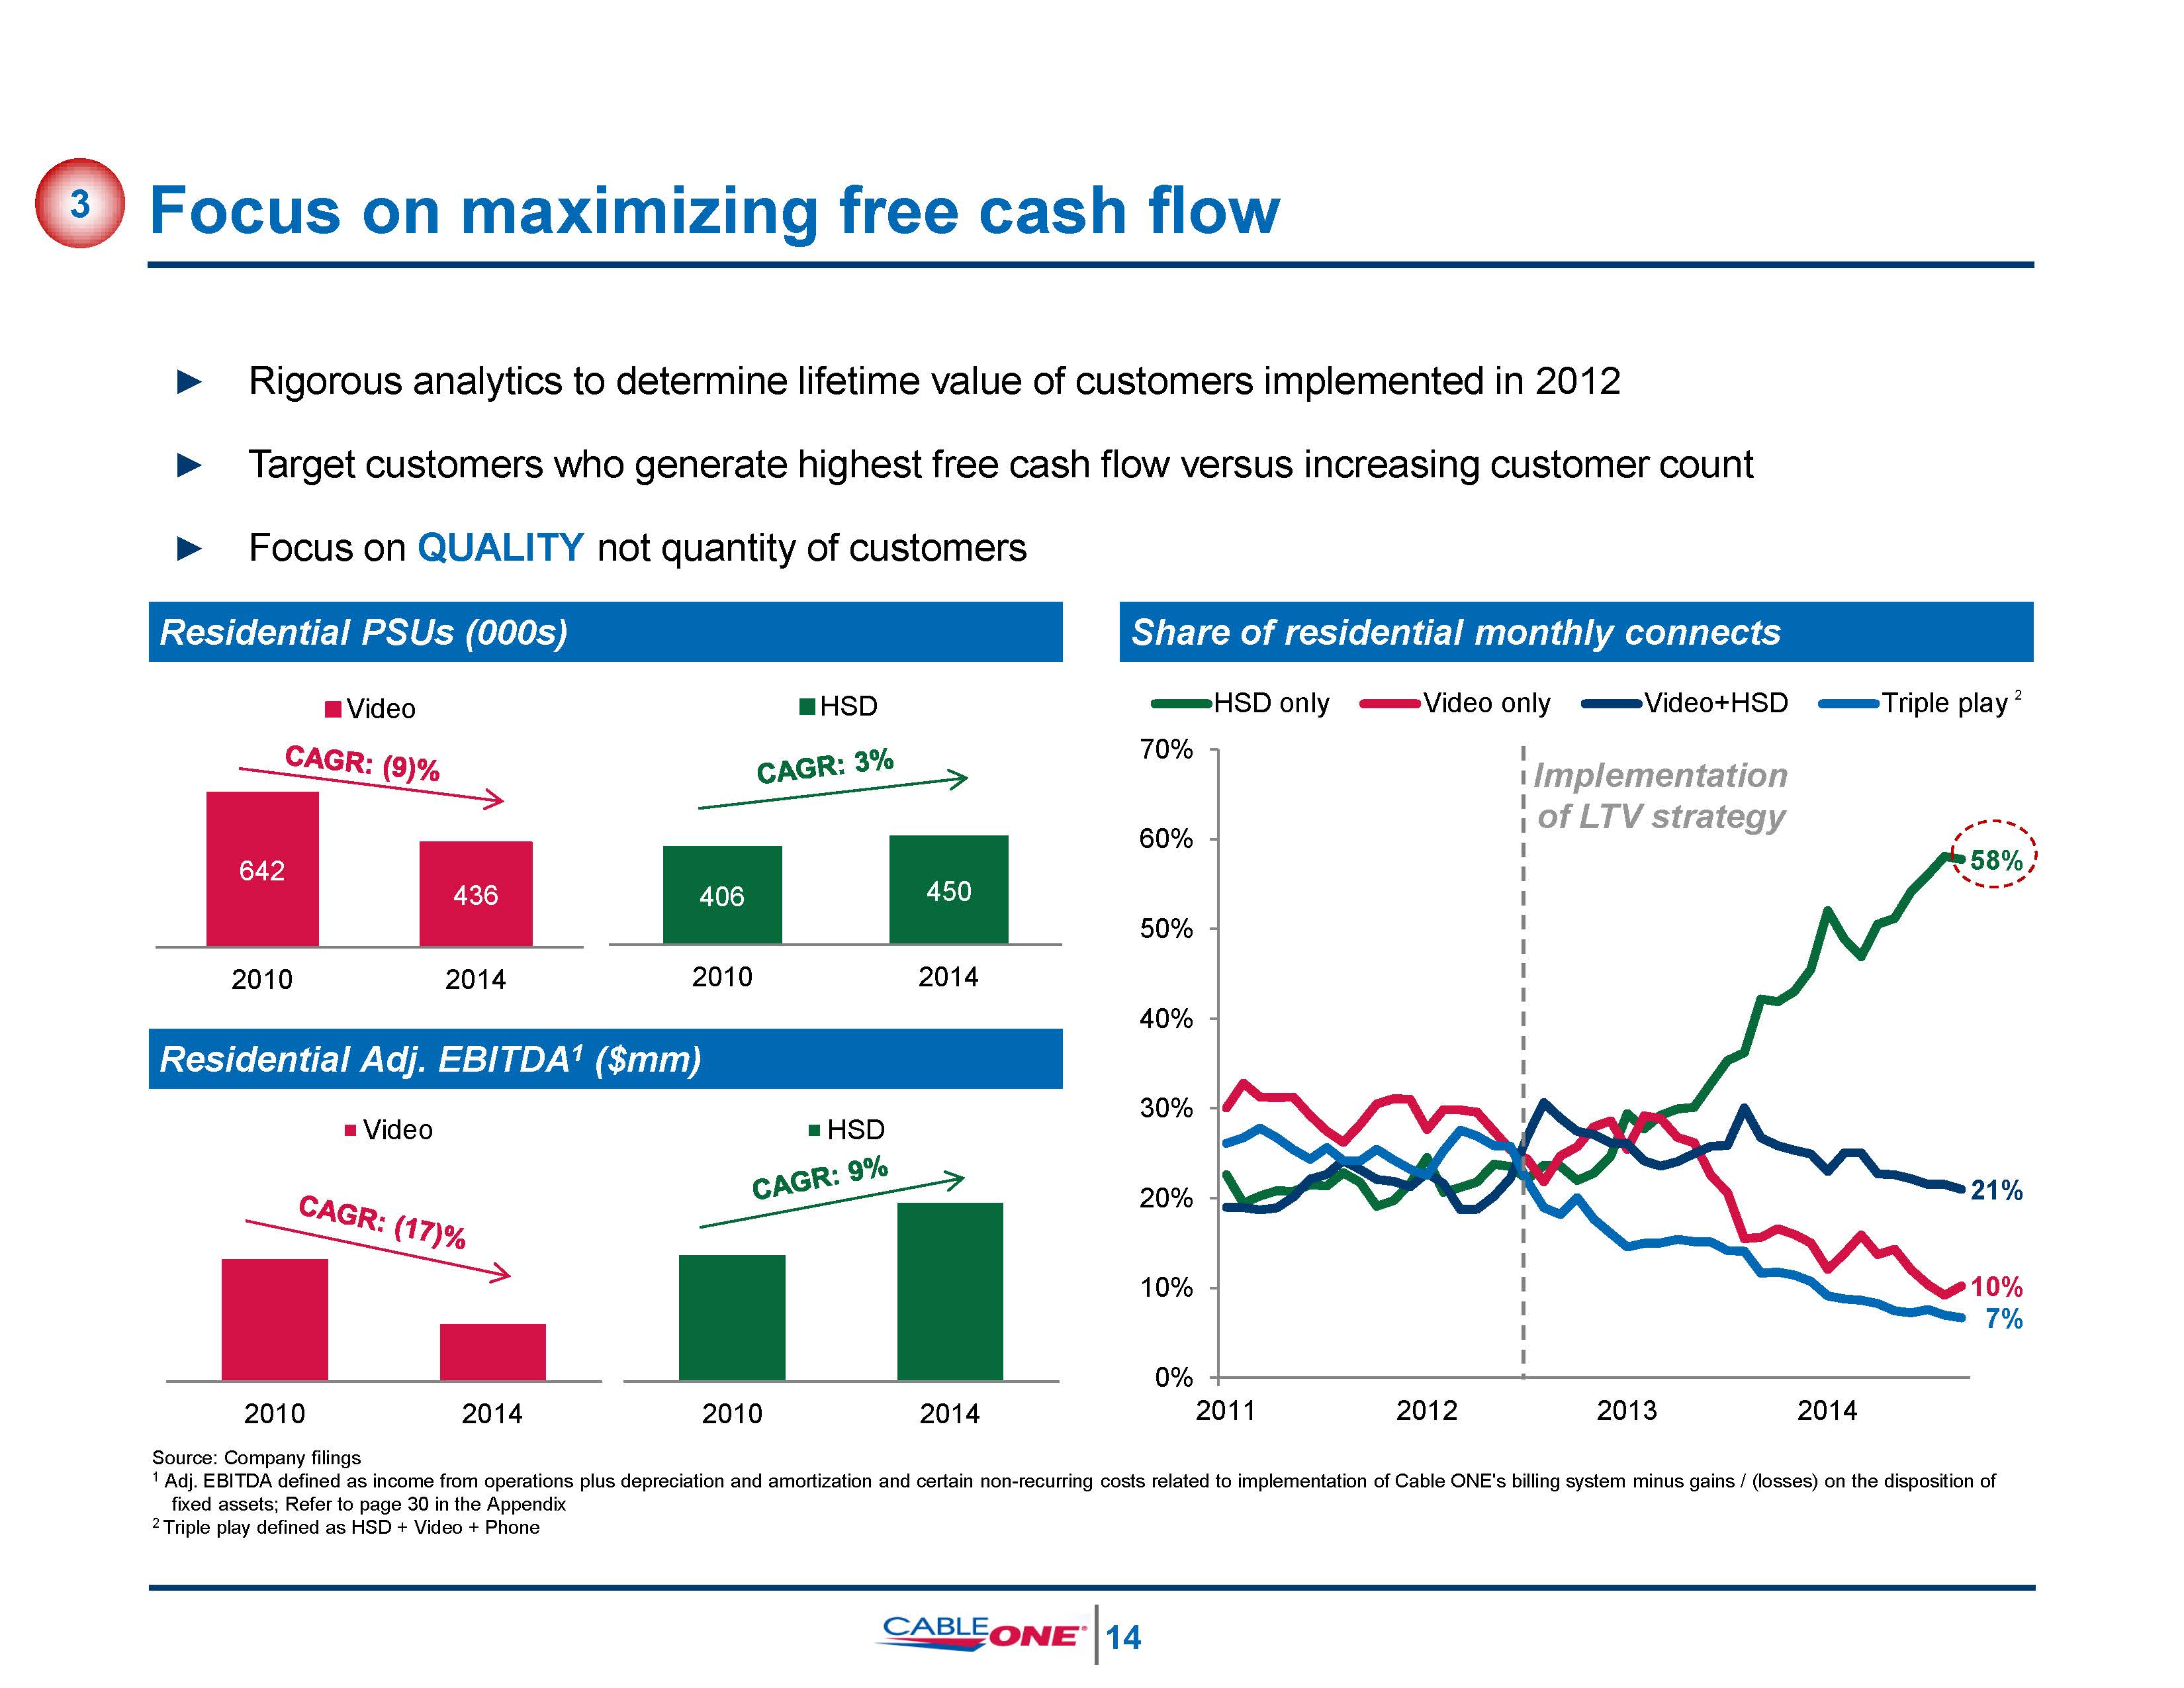
Focus on maximizing free cash flow 3 ► Rigorous analytics to determine lifetime value of customers implemented in 2012► Target customers who generate highest free cash flow versus increasing customer count► Focus on QUALITY not quantity of customers 2010 2014 2010 2014Source: Company filings Video HSD Residential Adj. EBITDA1 ($mm) 1 Adj. EBITDA defined as income from operations plus depreciation and amortization and certain non-recurring costs related to implementation of Cable ONE's billing system minus gains / (losses) on the disposition of fixed assets; Refer to page 30 in the Appendix2 Triple play defined as HSD + Video + Phone Residential PSUs (000s) 642 436 2010 2014 Video 2010 2014 HSD Share of residential monthly connects 58% 10%7% 21% 0%2011 2012 2013 2014 10% 20% 30% 40% 50% 70% HSD only Video only Video+HSDImplementation of LTV strategy 15 Triple play 2 450 406
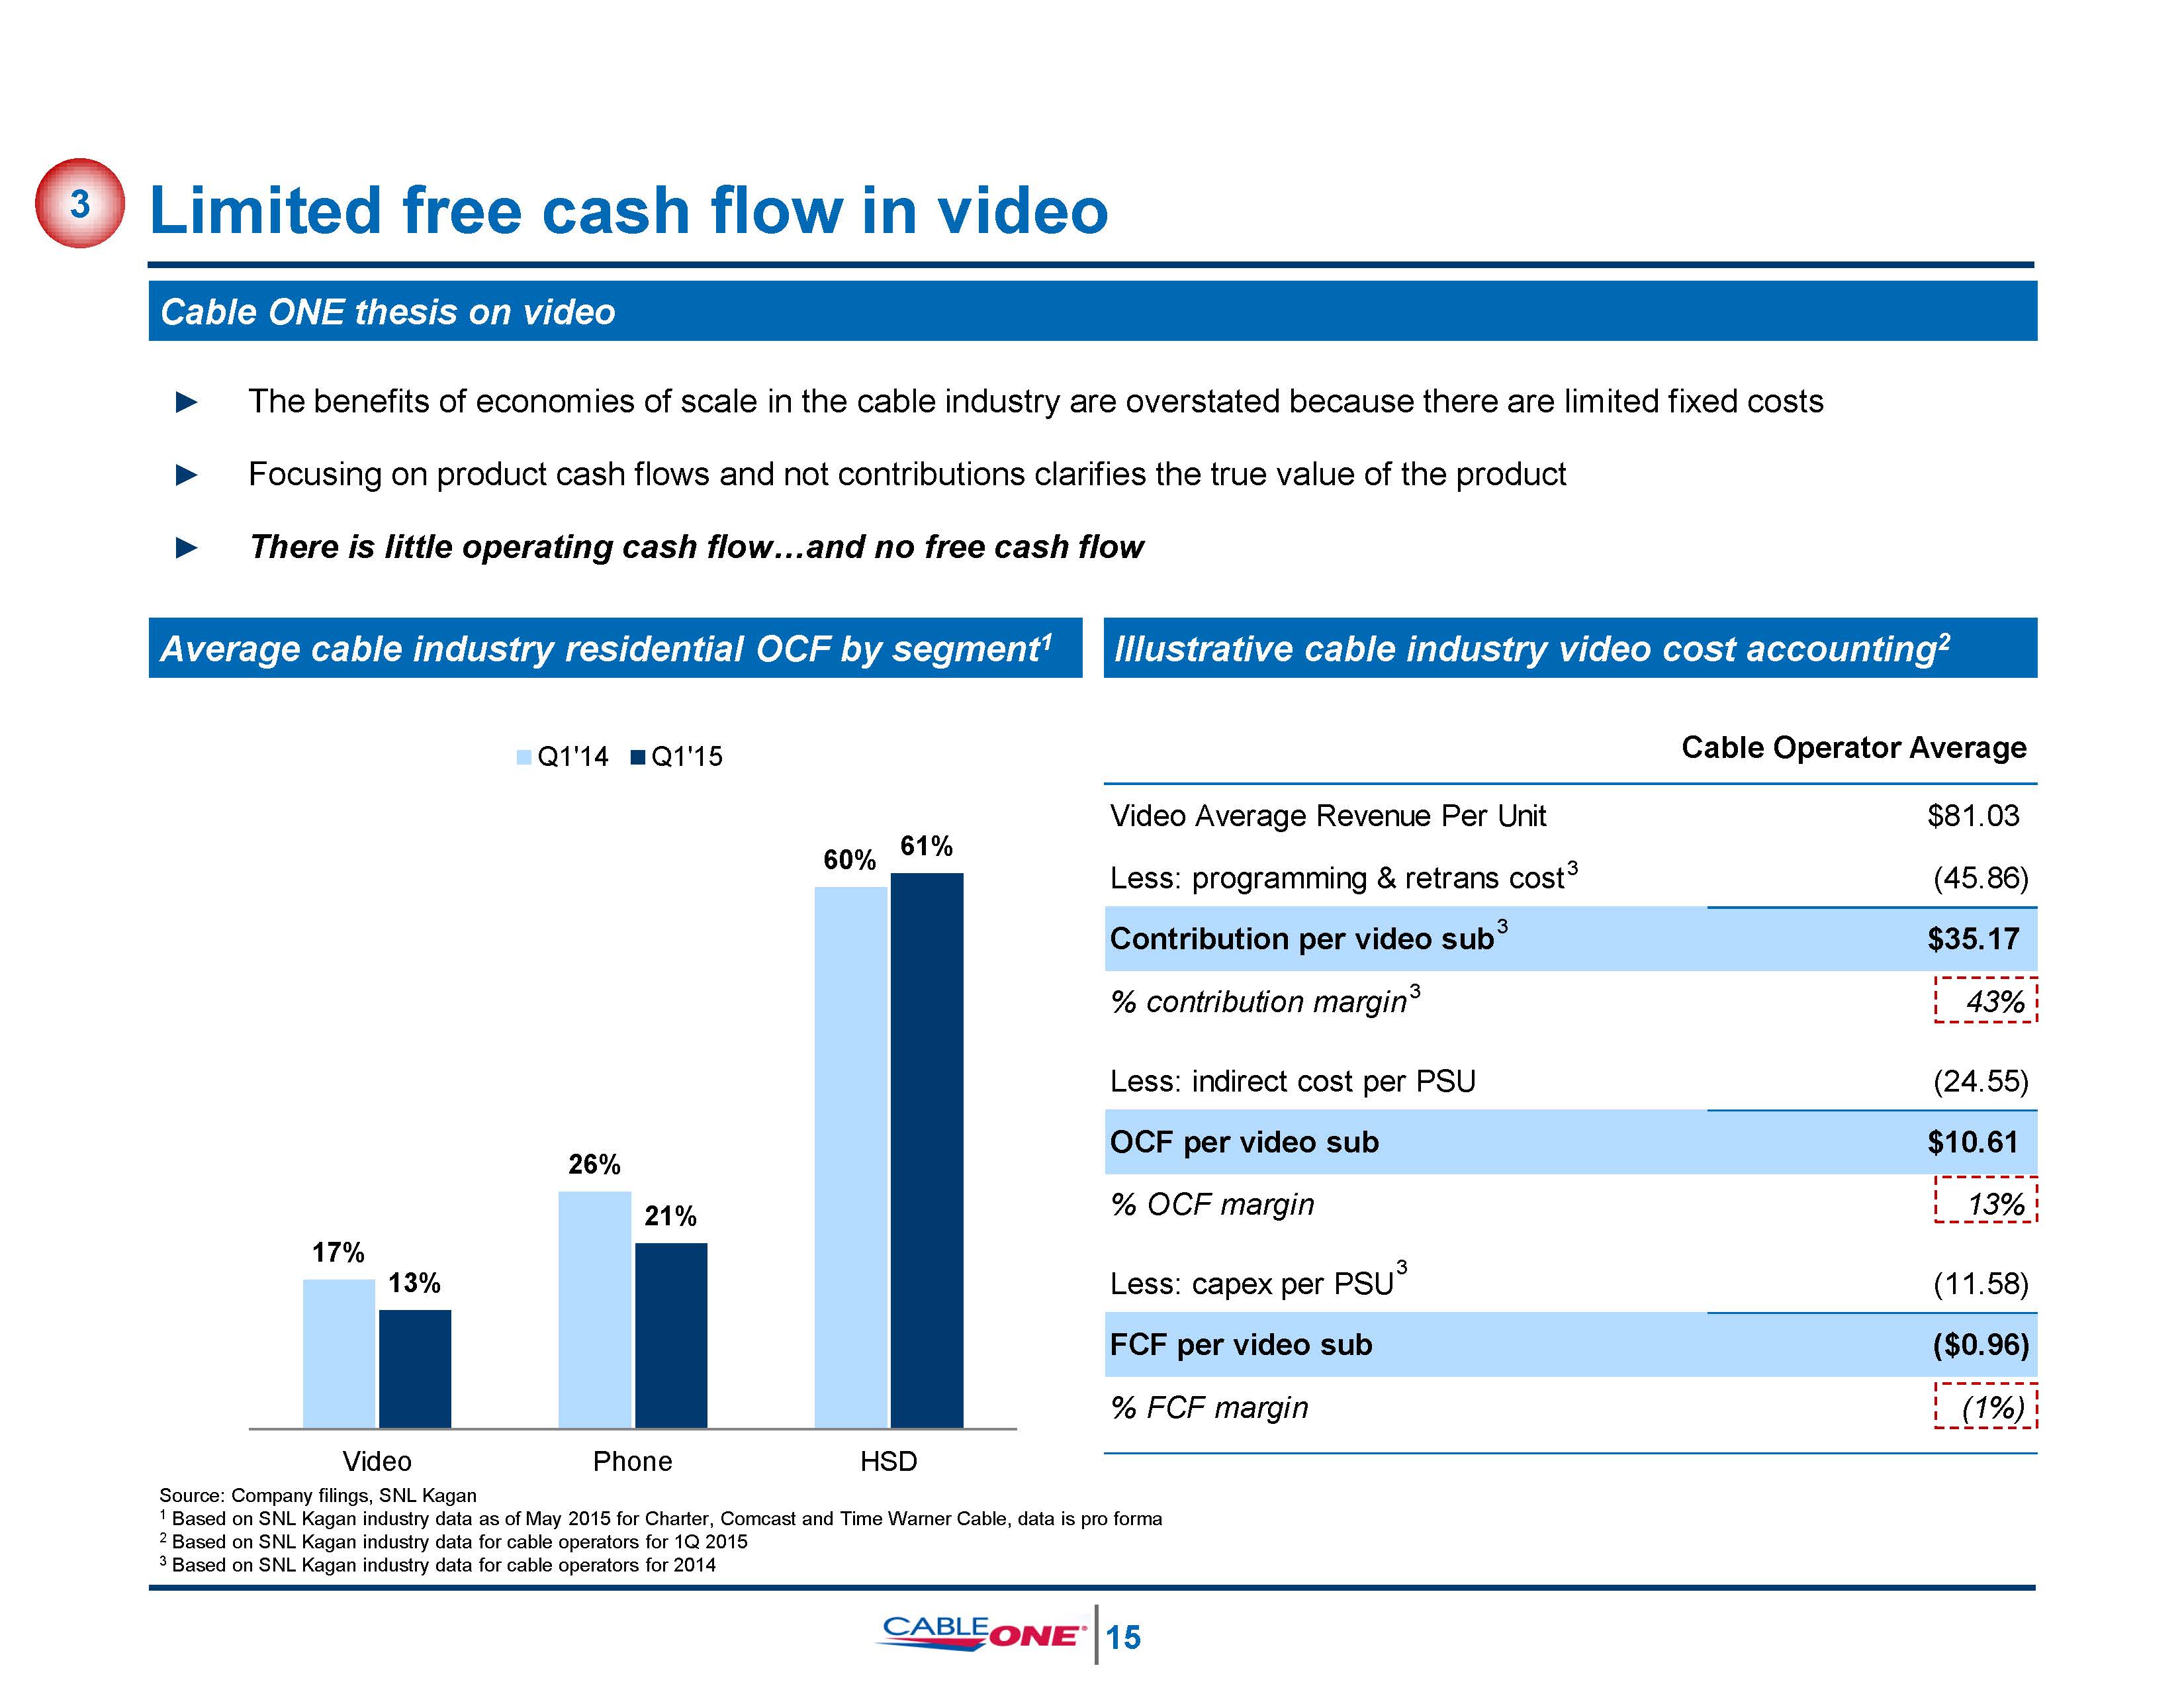
Video Average Revenue Per Unit Less: programming & retrans cost 3 $81.03 (45.86) Contribution per video sub3 $35.17 % contribution margin 3 43% Less: indirect cost per PSU (24.55) % OCF margin 13% Less: capex per PSU (11.58) FCF per video sub ($0.96) % FCF margin (1%)Video Phone HSDSource: Company filings, SNL Kagan1 Based on SNL Kagan industry data as of May 2015 for Charter, Comcast and Time Warner Cable, data is pro forma2 Based on SNL Kagan industry data for cable operators for 1Q 20153 Based on SNL Kagan industry data for cable operators for 2014 Limited free cash flow in video ► The benefits of economies of scale in the cable industry are overstated because there are limited fixed costs► Focusing on product cash flows and not contributions clarifies the true value of the product► There is little operating cash flow…and no free cash flow Cable ONE thesis on video 17% 26% 60% 13% 21% Average cable industry residential OCF by segment1 Illustrative cable industry video cost accounting2 Q1'14 Q1'15 3 Cable Operator Average 16
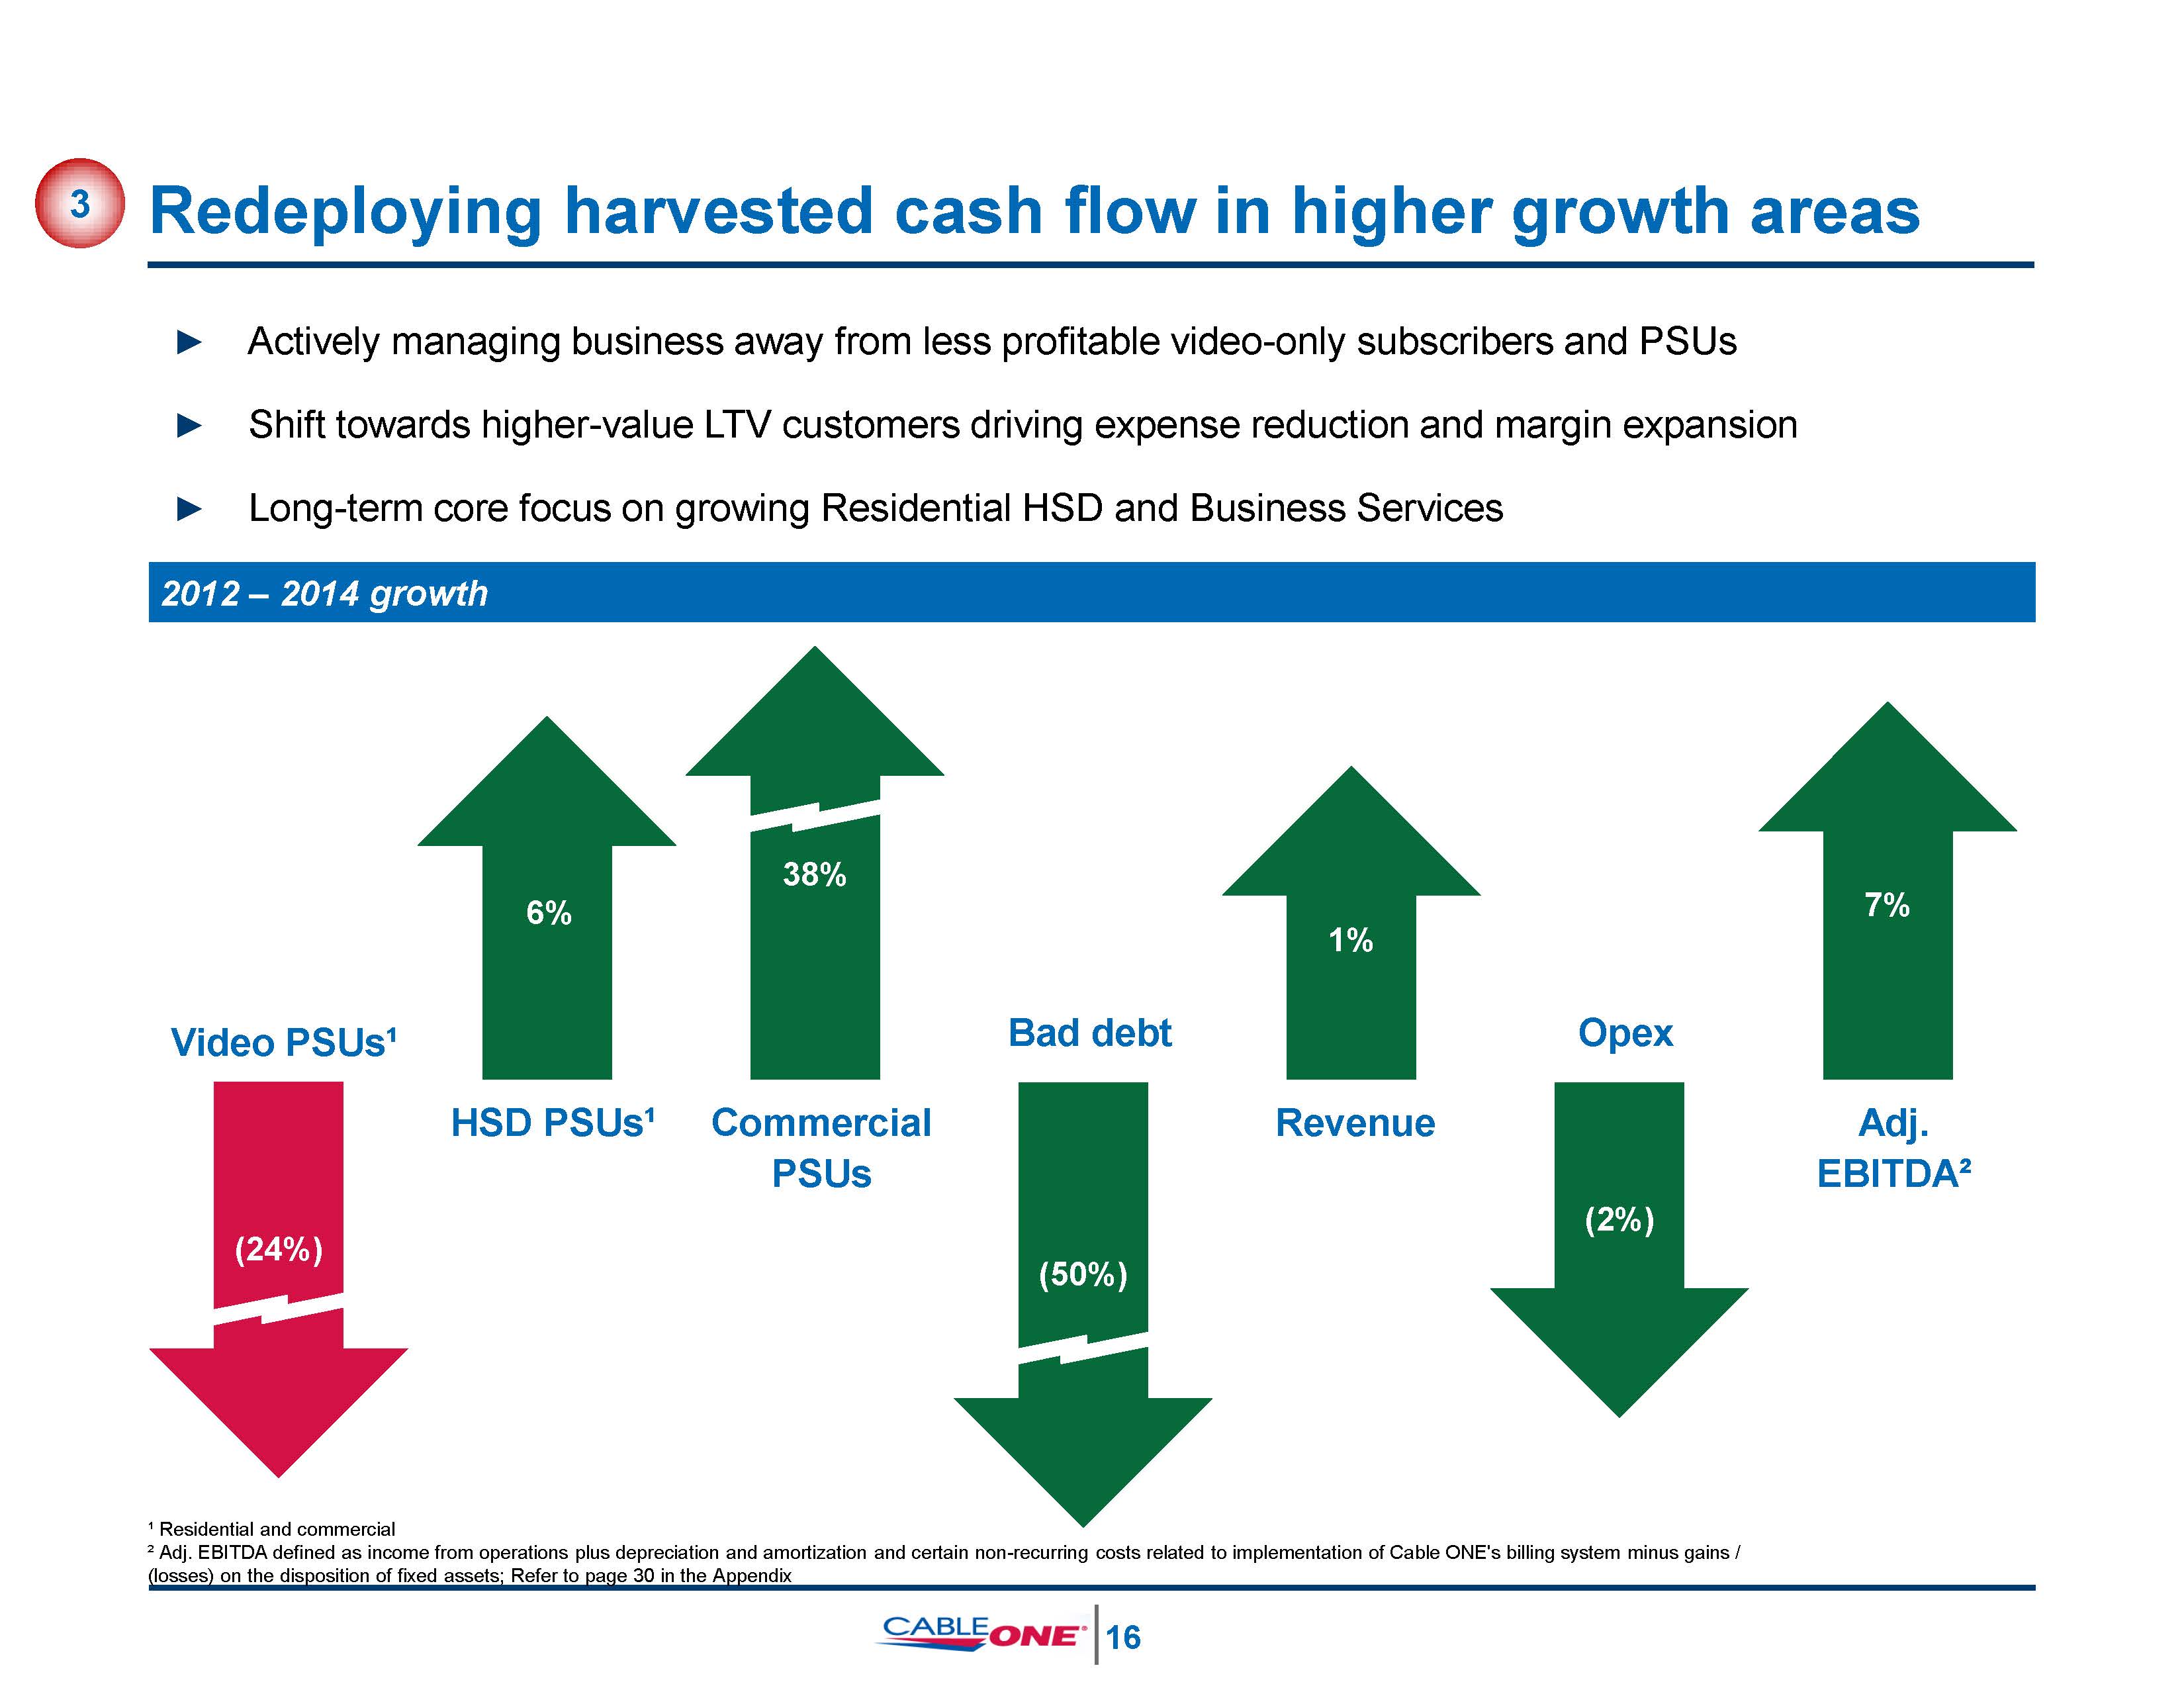
Redeploying harvested cash flow in higher growth areas 2012 – 2014 growth Revenue 1% 3 ► Actively managing business away from less profitable video-only subscribers and PSUs► Shift towards higher-value LTV customers driving expense reduction and margin expansion► Long-term core focus on growing Residential HSD and Business Services HSD PSUs¹ 6% Adj.EBITDA² 7% (24%) Video PSUs¹ (50%) Bad debt Commercial PSUs 38% ¹ Residential and commercial² Adj. EBITDA defined as income from operations plus depreciation and amortization and certain non-recurring costs related to implementation of Cable ONE's billing system minus gains / (2%) (losses) on the disposition of fixed assets; Refer to page 30 in the Appendix 17 Opex
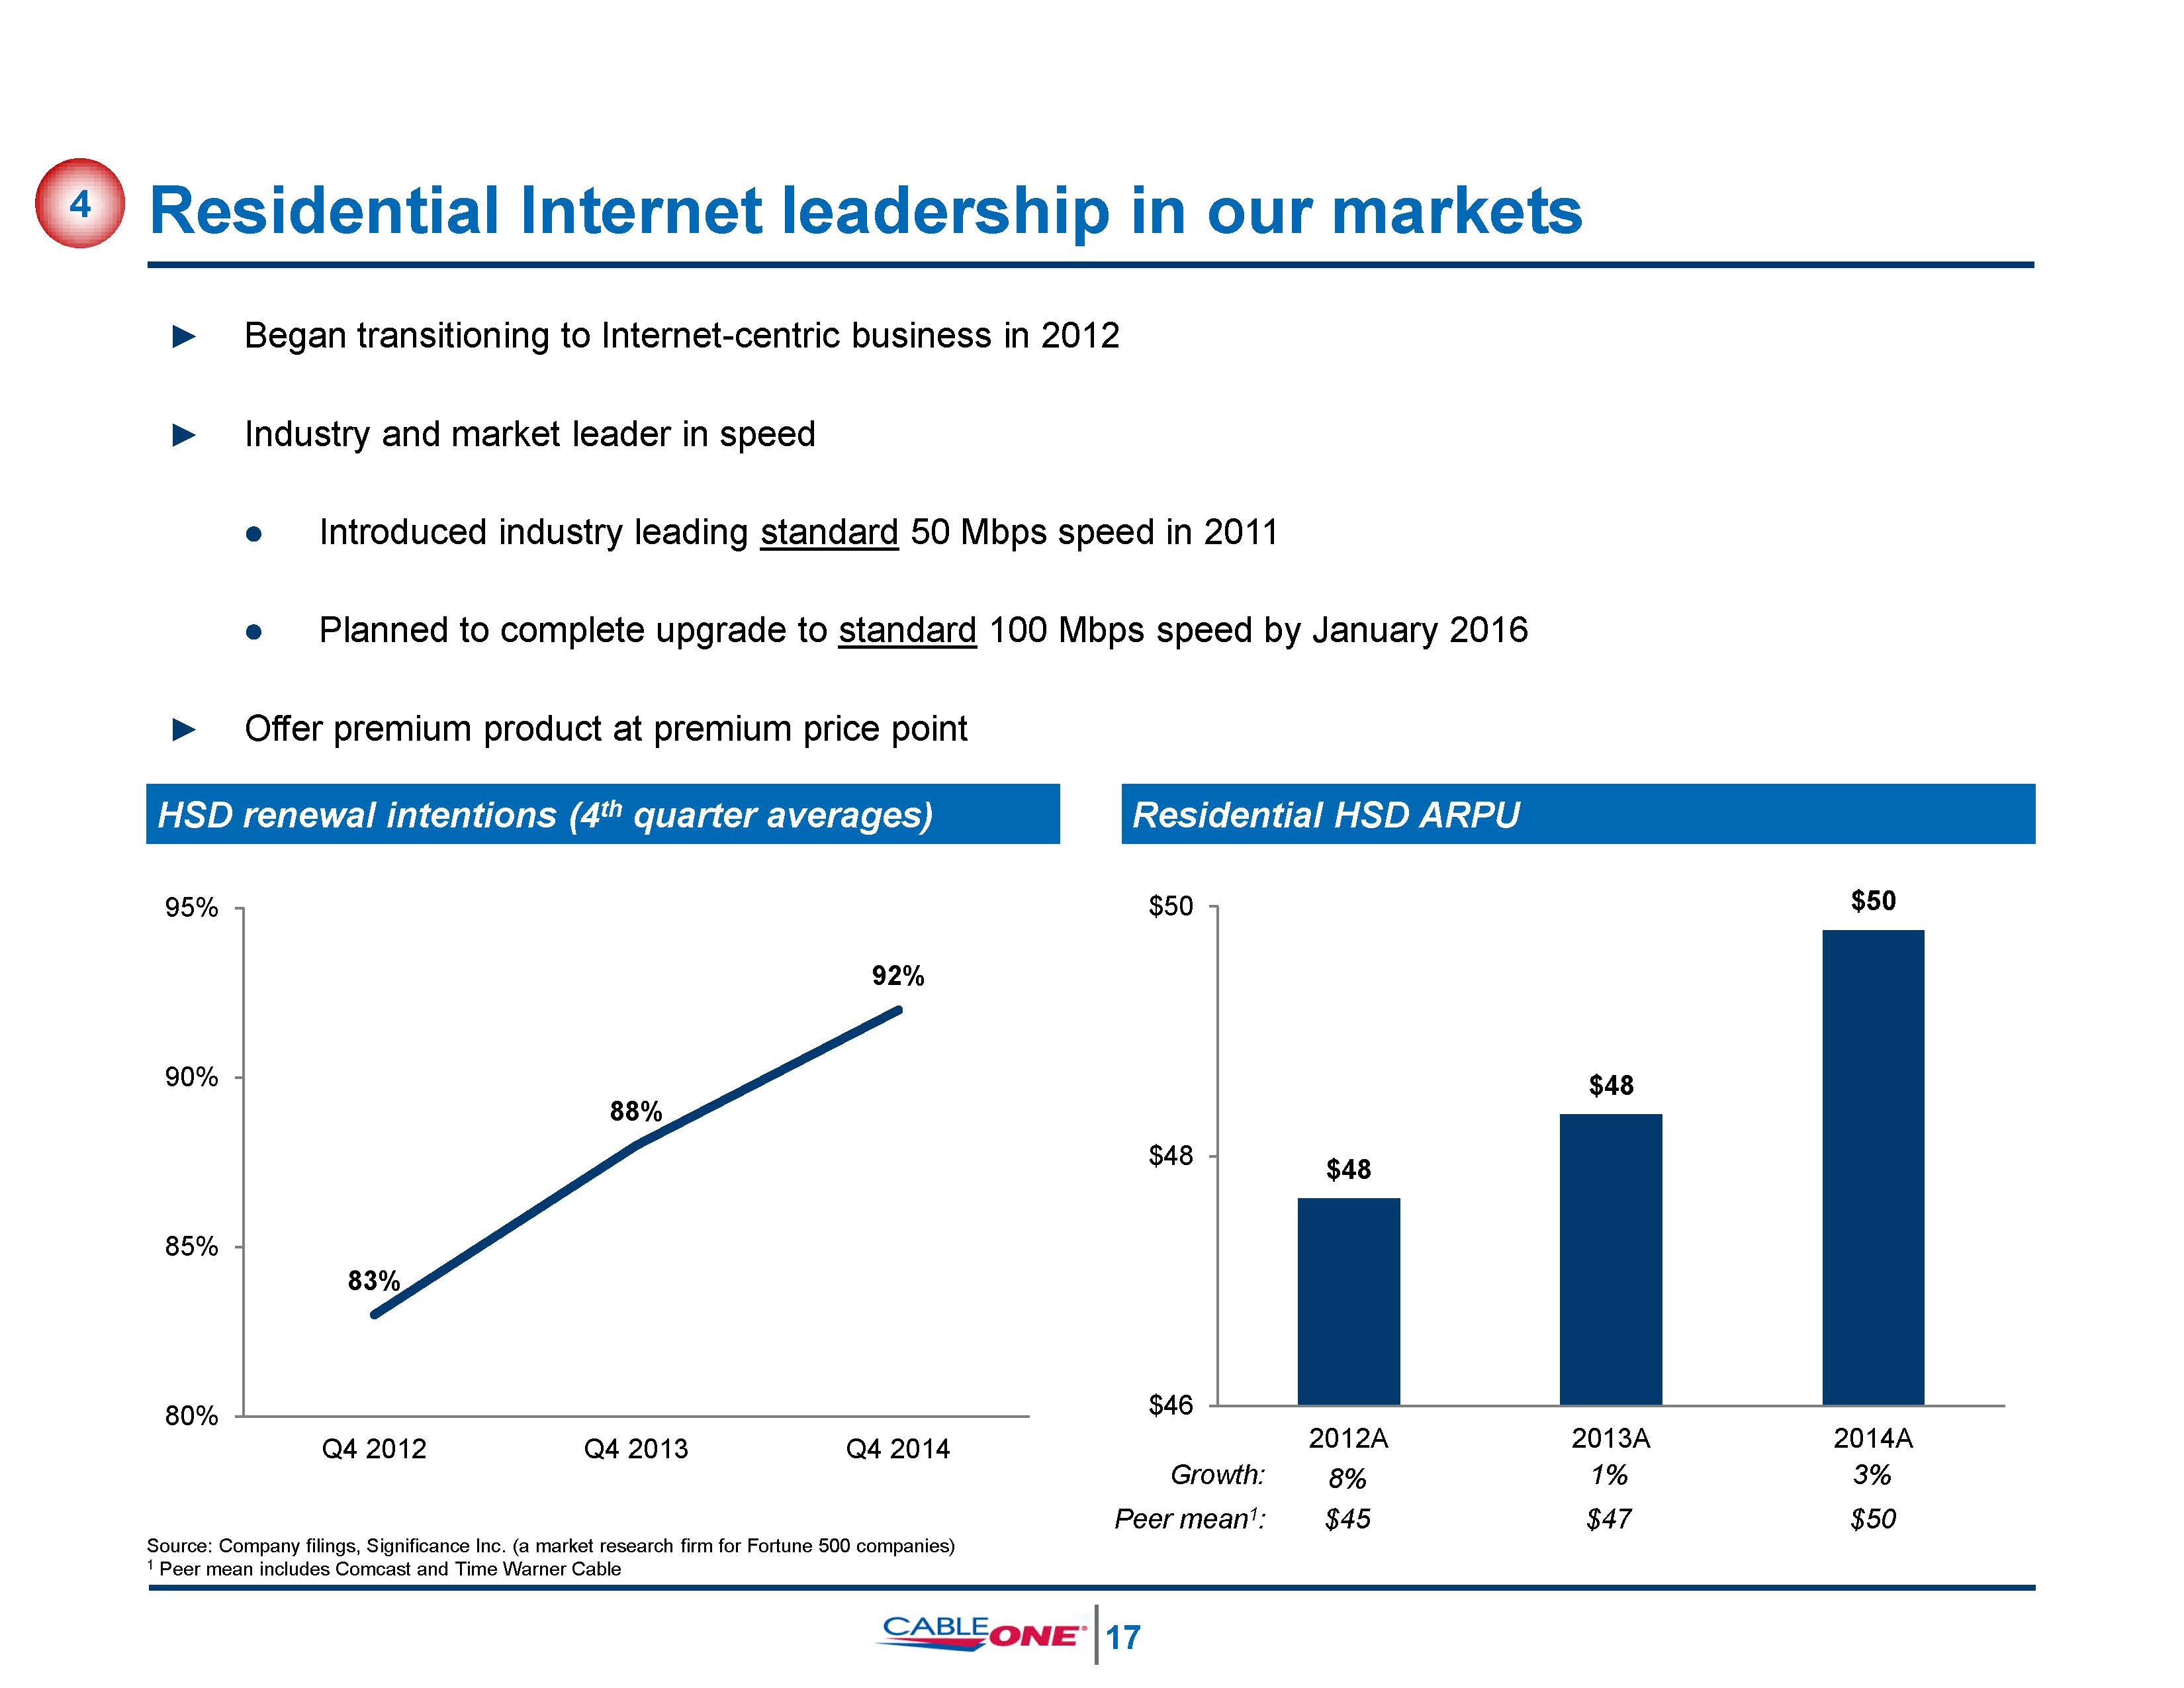
Residential Internet leadership in our markets ► Began transitioning to Internet-centric business in 2012► Industry and market leader in speedIntroduced industry leading standard 50 Mbps speed in 2011Planned to complete upgrade to standard 100 Mbps speed by January 2016► Offer premium product at premium price point HSD renewal intentions (4th quarter averages) Residential HSD ARPU 85%83% 88% 92% 80% 90% 95% Q4 2012 Q4 2013 Q4 2014 $48 $48 $50 $46 $48 $50 2012A8%$45 2013A1%$47 2014A3%$50 Growth:Peer mean1: 4 Source: Company filings, Significance Inc. (a market research firm for Fortune 500 companies)1 Peer mean includes Comcast and Time Warner Cable 18
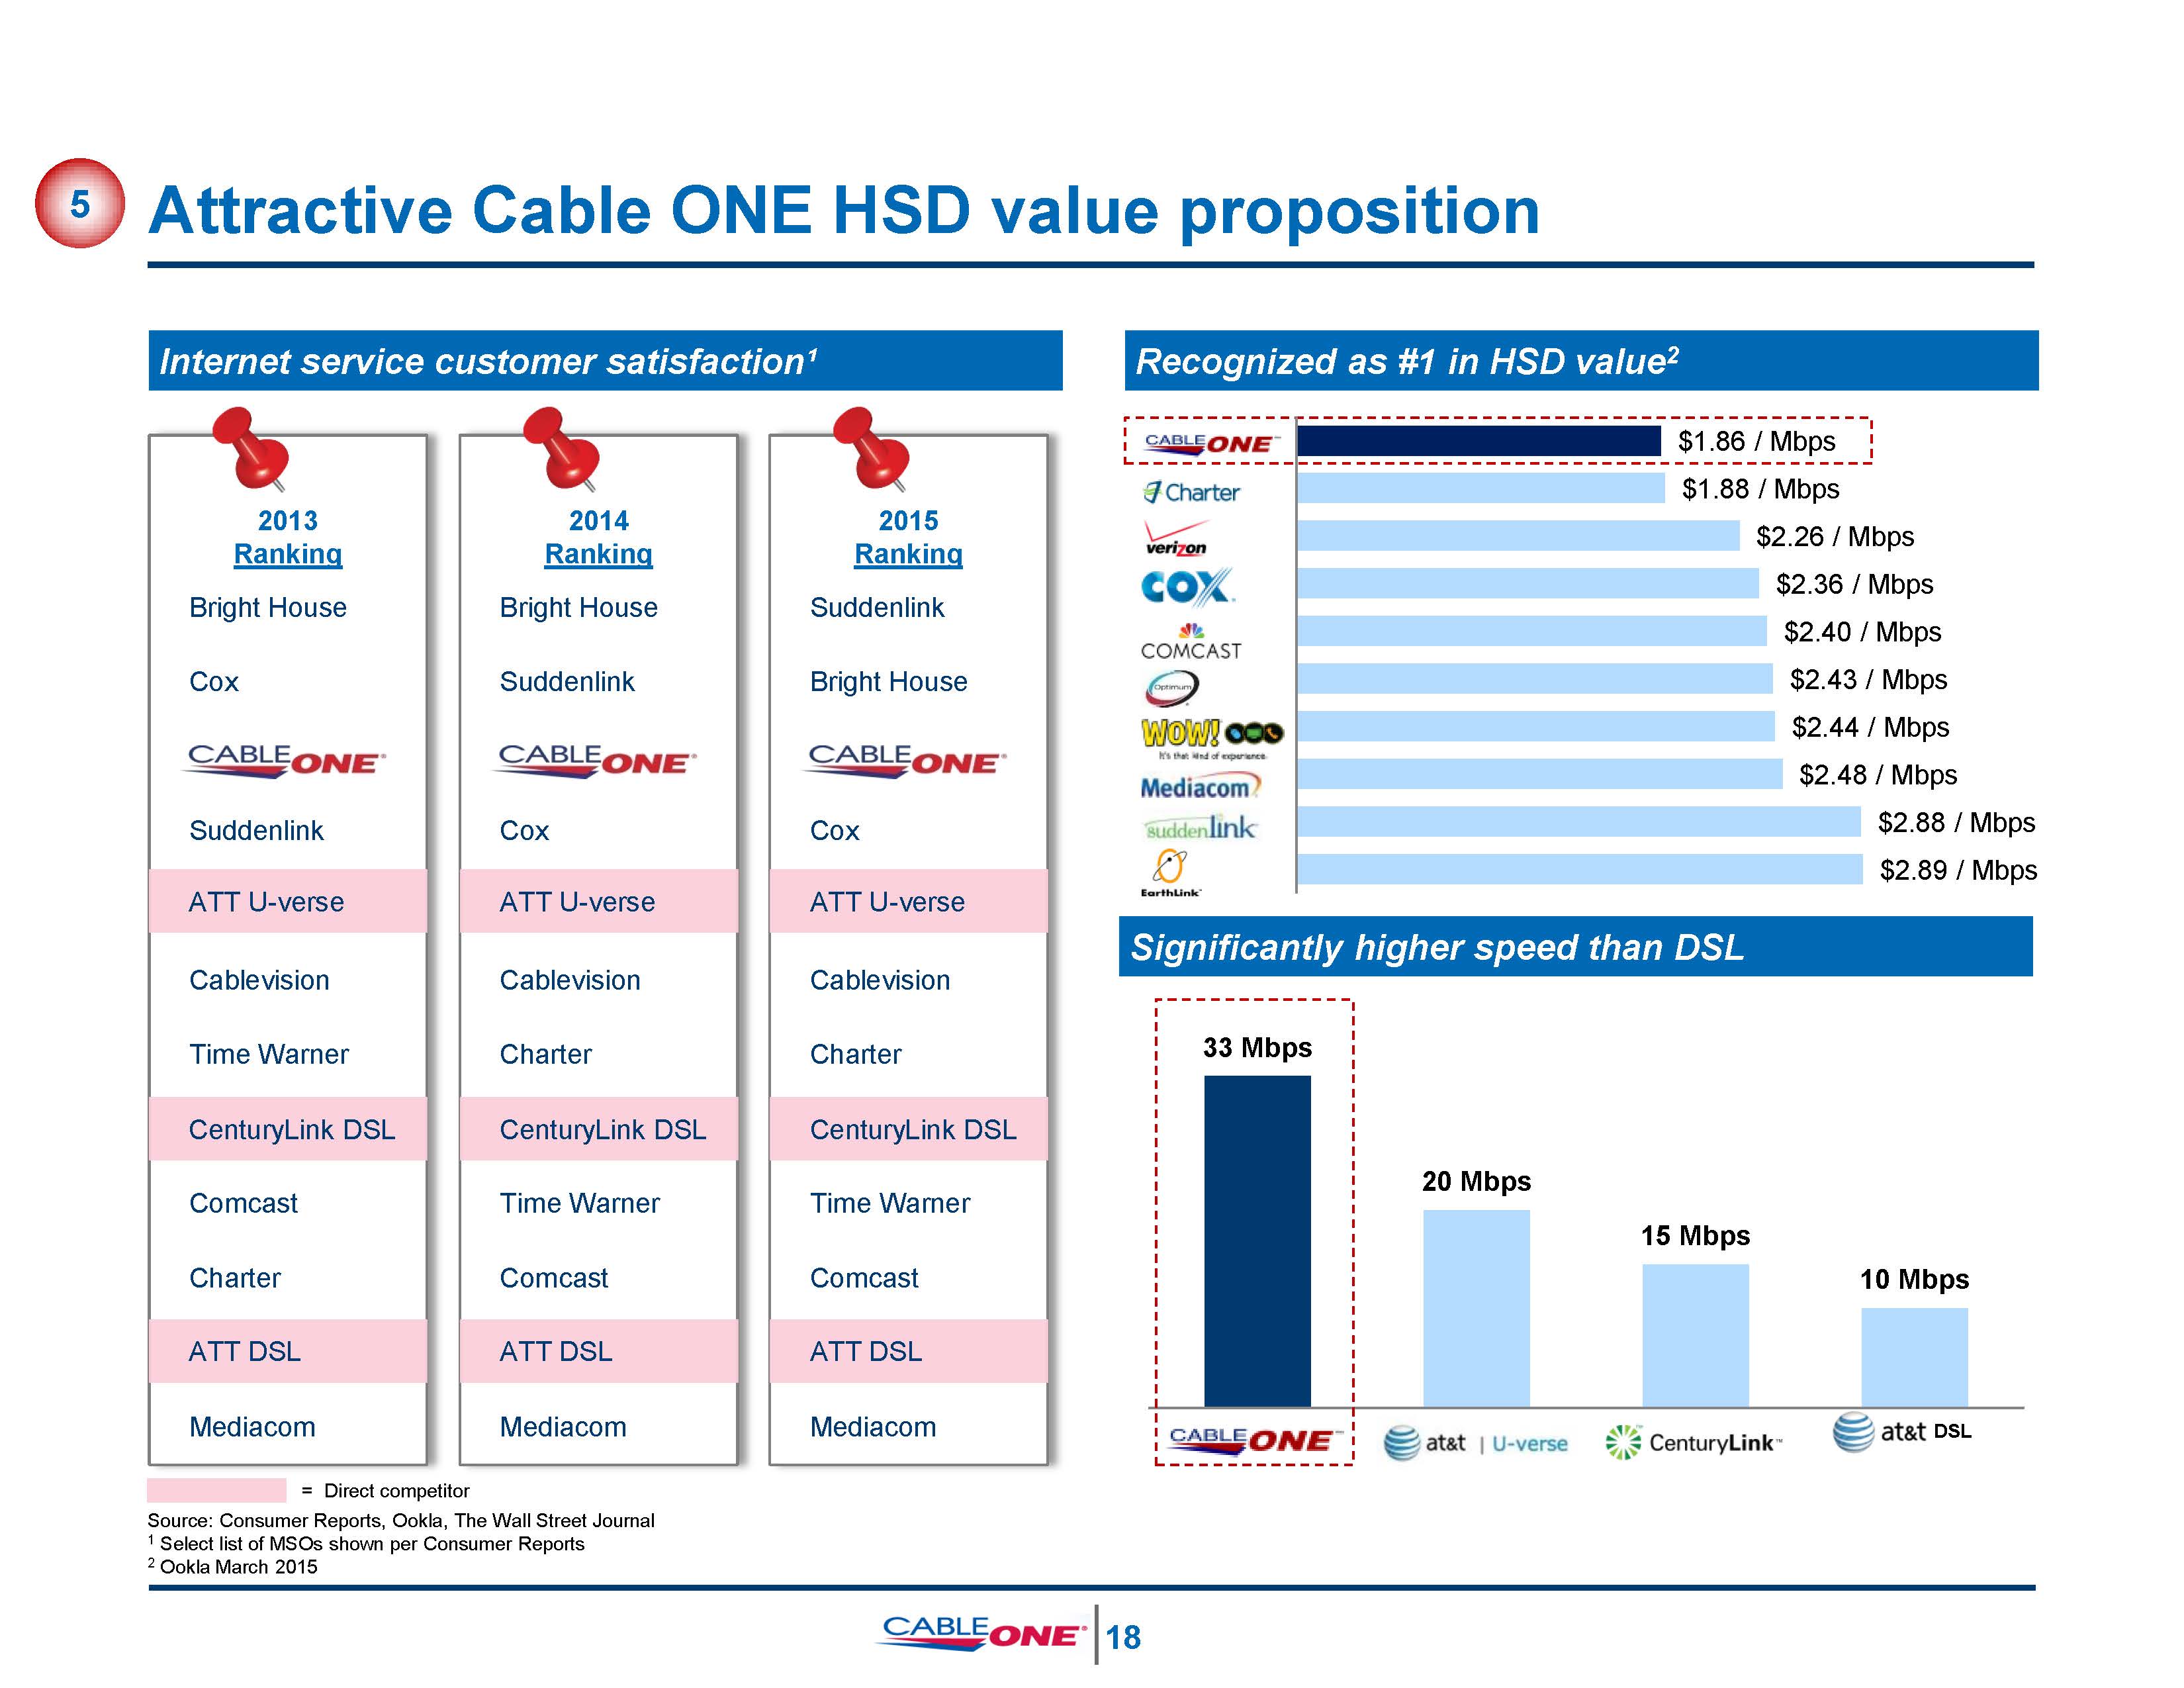
Attractive Cable ONE HSD value proposition = Direct competitorSource: Consumer Reports, Ookla, The Wall Street Journal Internet service customer satisfaction¹ Recognized as #1 in HSD value2 2013RankingBright House Cox Suddenlink Cablevision Time Warner Comcast Charter Mediacom 2014RankingBright House Suddenlink Cox Cablevision Charter Time Warner Comcast Mediacom 5 ATT U-verse ATT U-verse ATT DSL ATT DSL CenturyLink DSL CenturyLink DSL Bright House Cox Cablevision Charter Time Warner Comcast Mediacom ATT U-verse ATT DSL CenturyLink DSL 33 Mbps 20 Mbps 15 Mbps 10 Mbps DSL 1 Select list of MSOs shown per Consumer Reports2 Ookla March 2015 18 2015RankingSuddenlink Significantly higher speed than DSL bps Mbps Mbps Mbps Mbps/ Mbps$2.88 / Mbps$2.89 / Mbps $1.86 / Mbps $1.88 / Mbps $2.26 / M $2.36 / $2.40 / $2.43 / $2.44 / $2.48
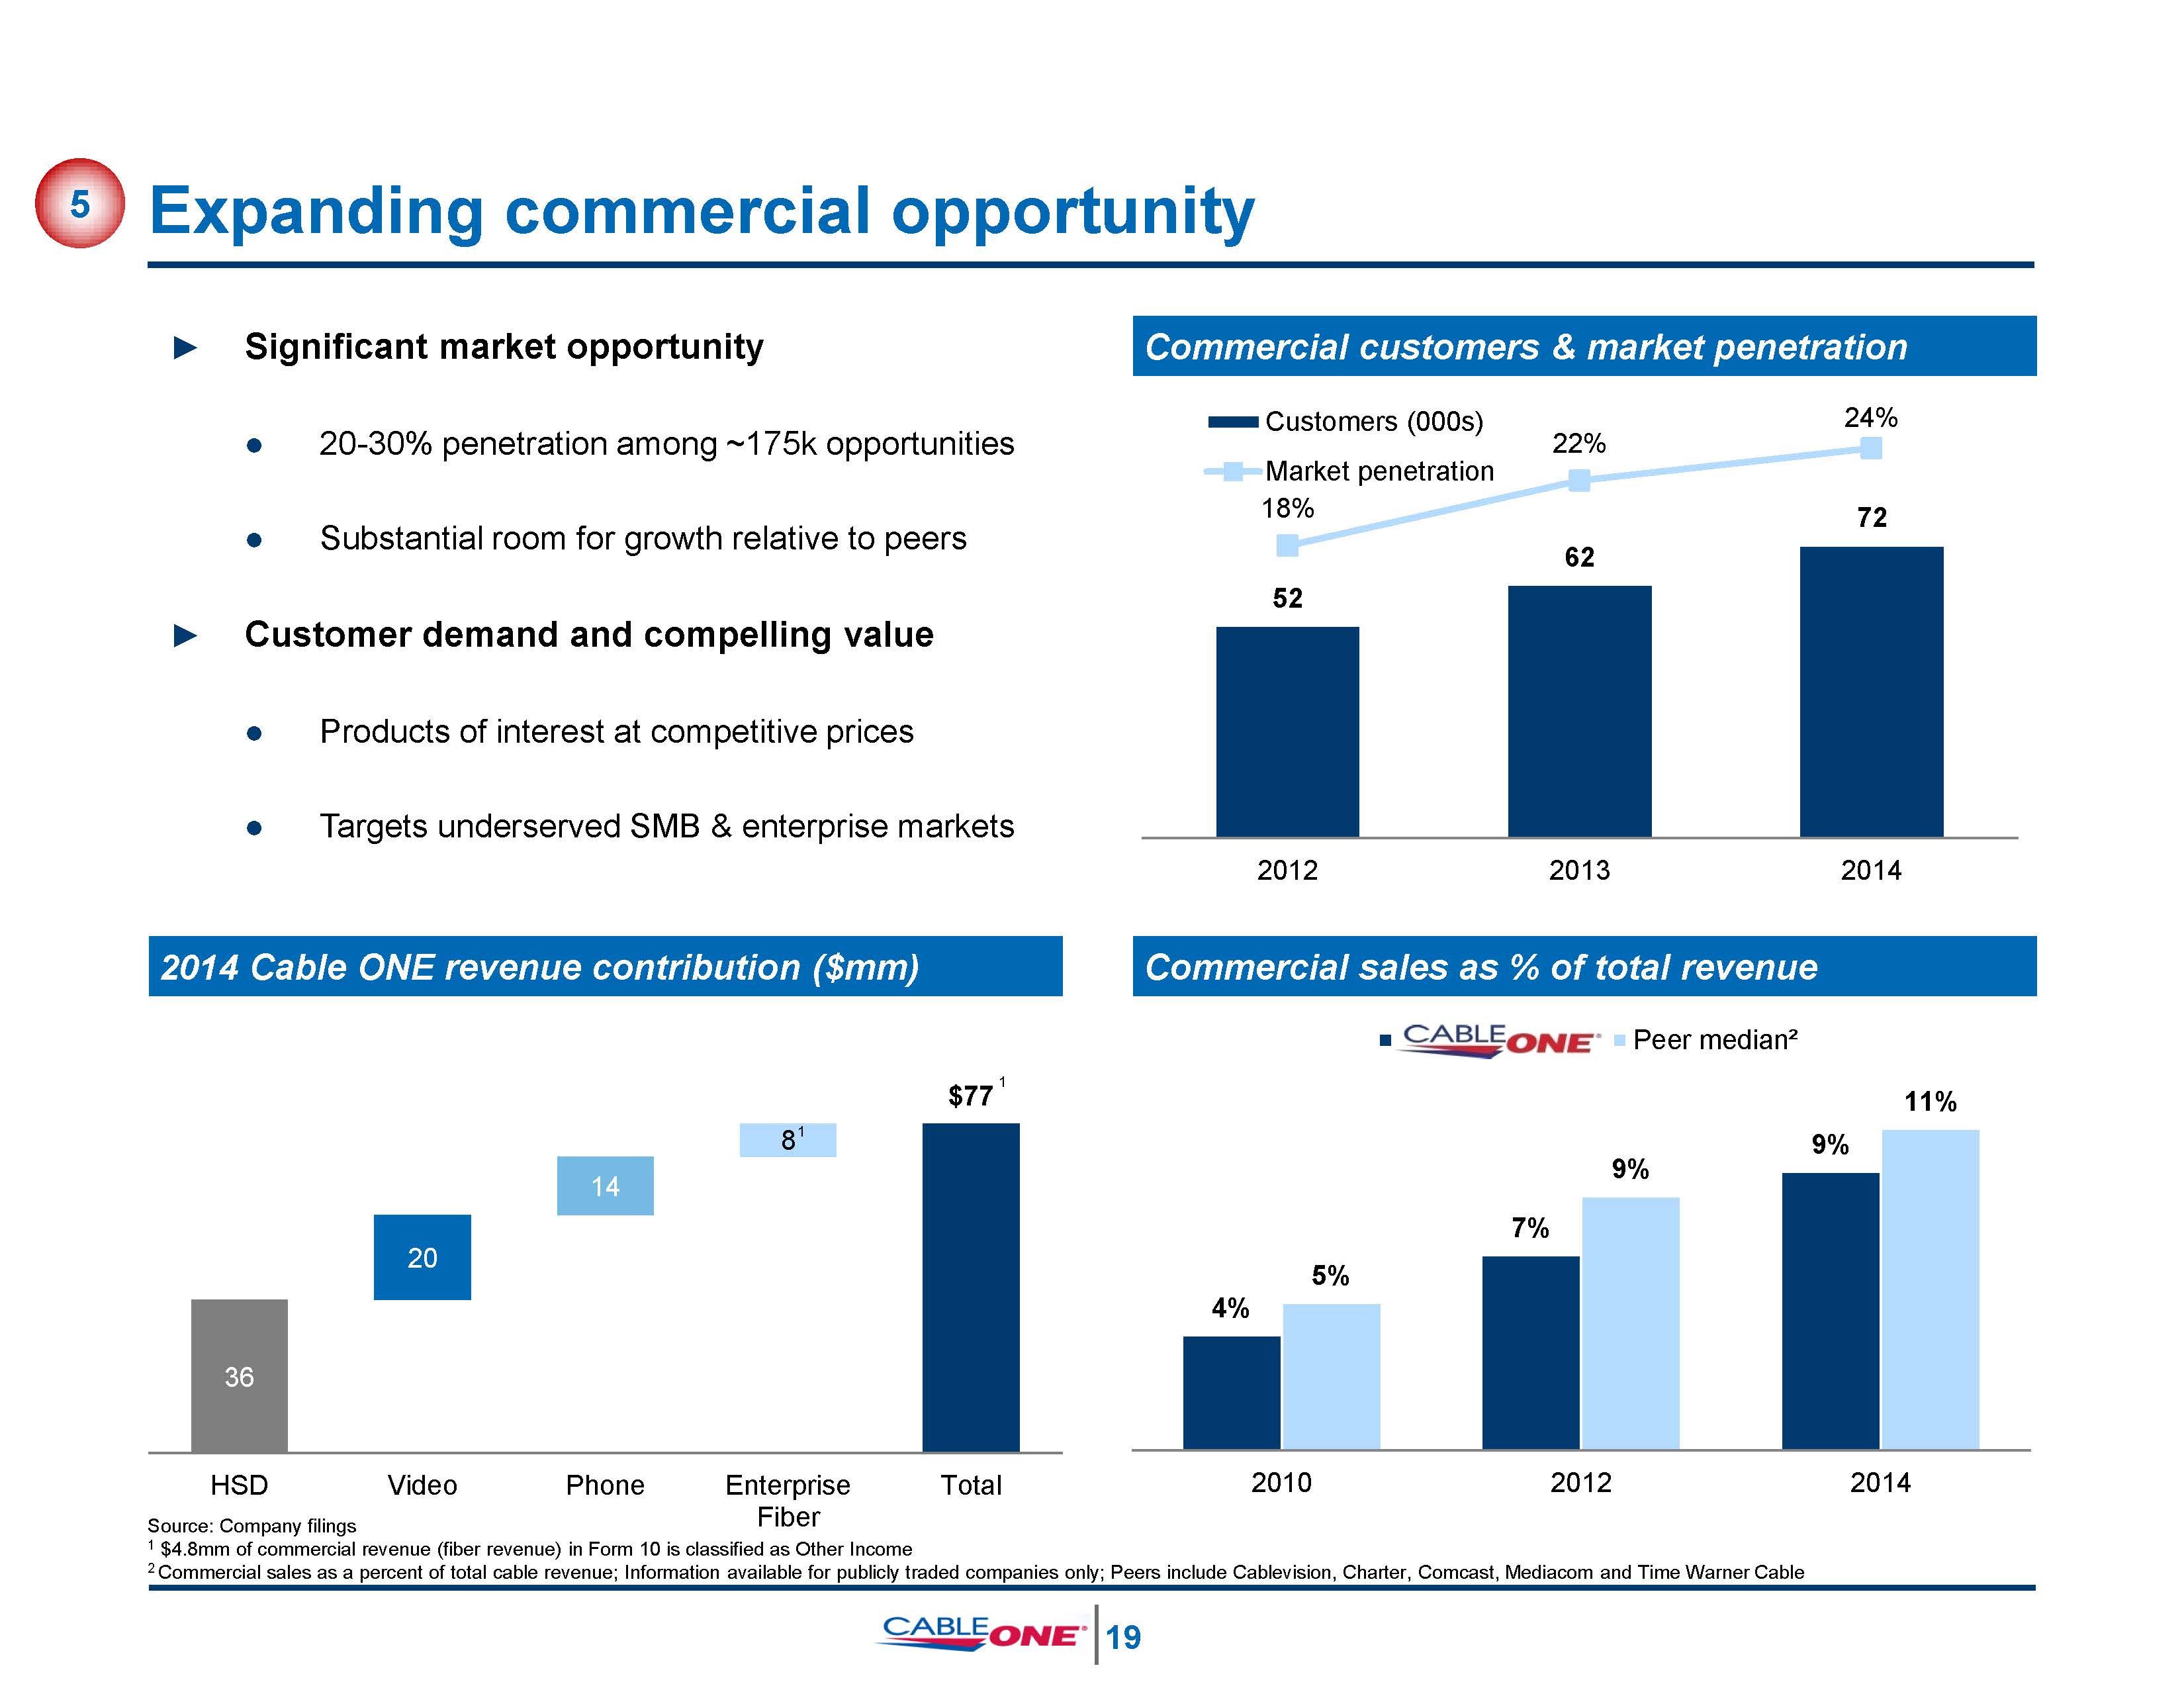
► Significant market opportunity20-30% penetration among ~175k opportunitiesSubstantial room for growth relative to peers► Customer demand and compelling valueProducts of interest at competitive pricesTargets underserved SMB & enterprise markets Expanding commercial opportunity 5 Commercial sales as % of total revenue 2014 Cable ONE revenue contribution ($mm) Commercial customers & market penetration 4% 7% 9% 5% 9% 2010 2012 2014 Peer median²11% 52 62 22% 24% 2012 2013 2014 Customers (000s) Market penetration 36 Fiber Source: Company filings 1 $4.8mm of commercial revenue (fiber revenue) in Form 10 is classified as Other Income2 Commercial sales as a percent of total cable revenue; Information available for publicly traded companies only; Peers include Cablevision, Charter, Comcast, Mediacom and Time Warner Cable 20 20 14 81 $77 HSD Video Phone Enterprise Total 1
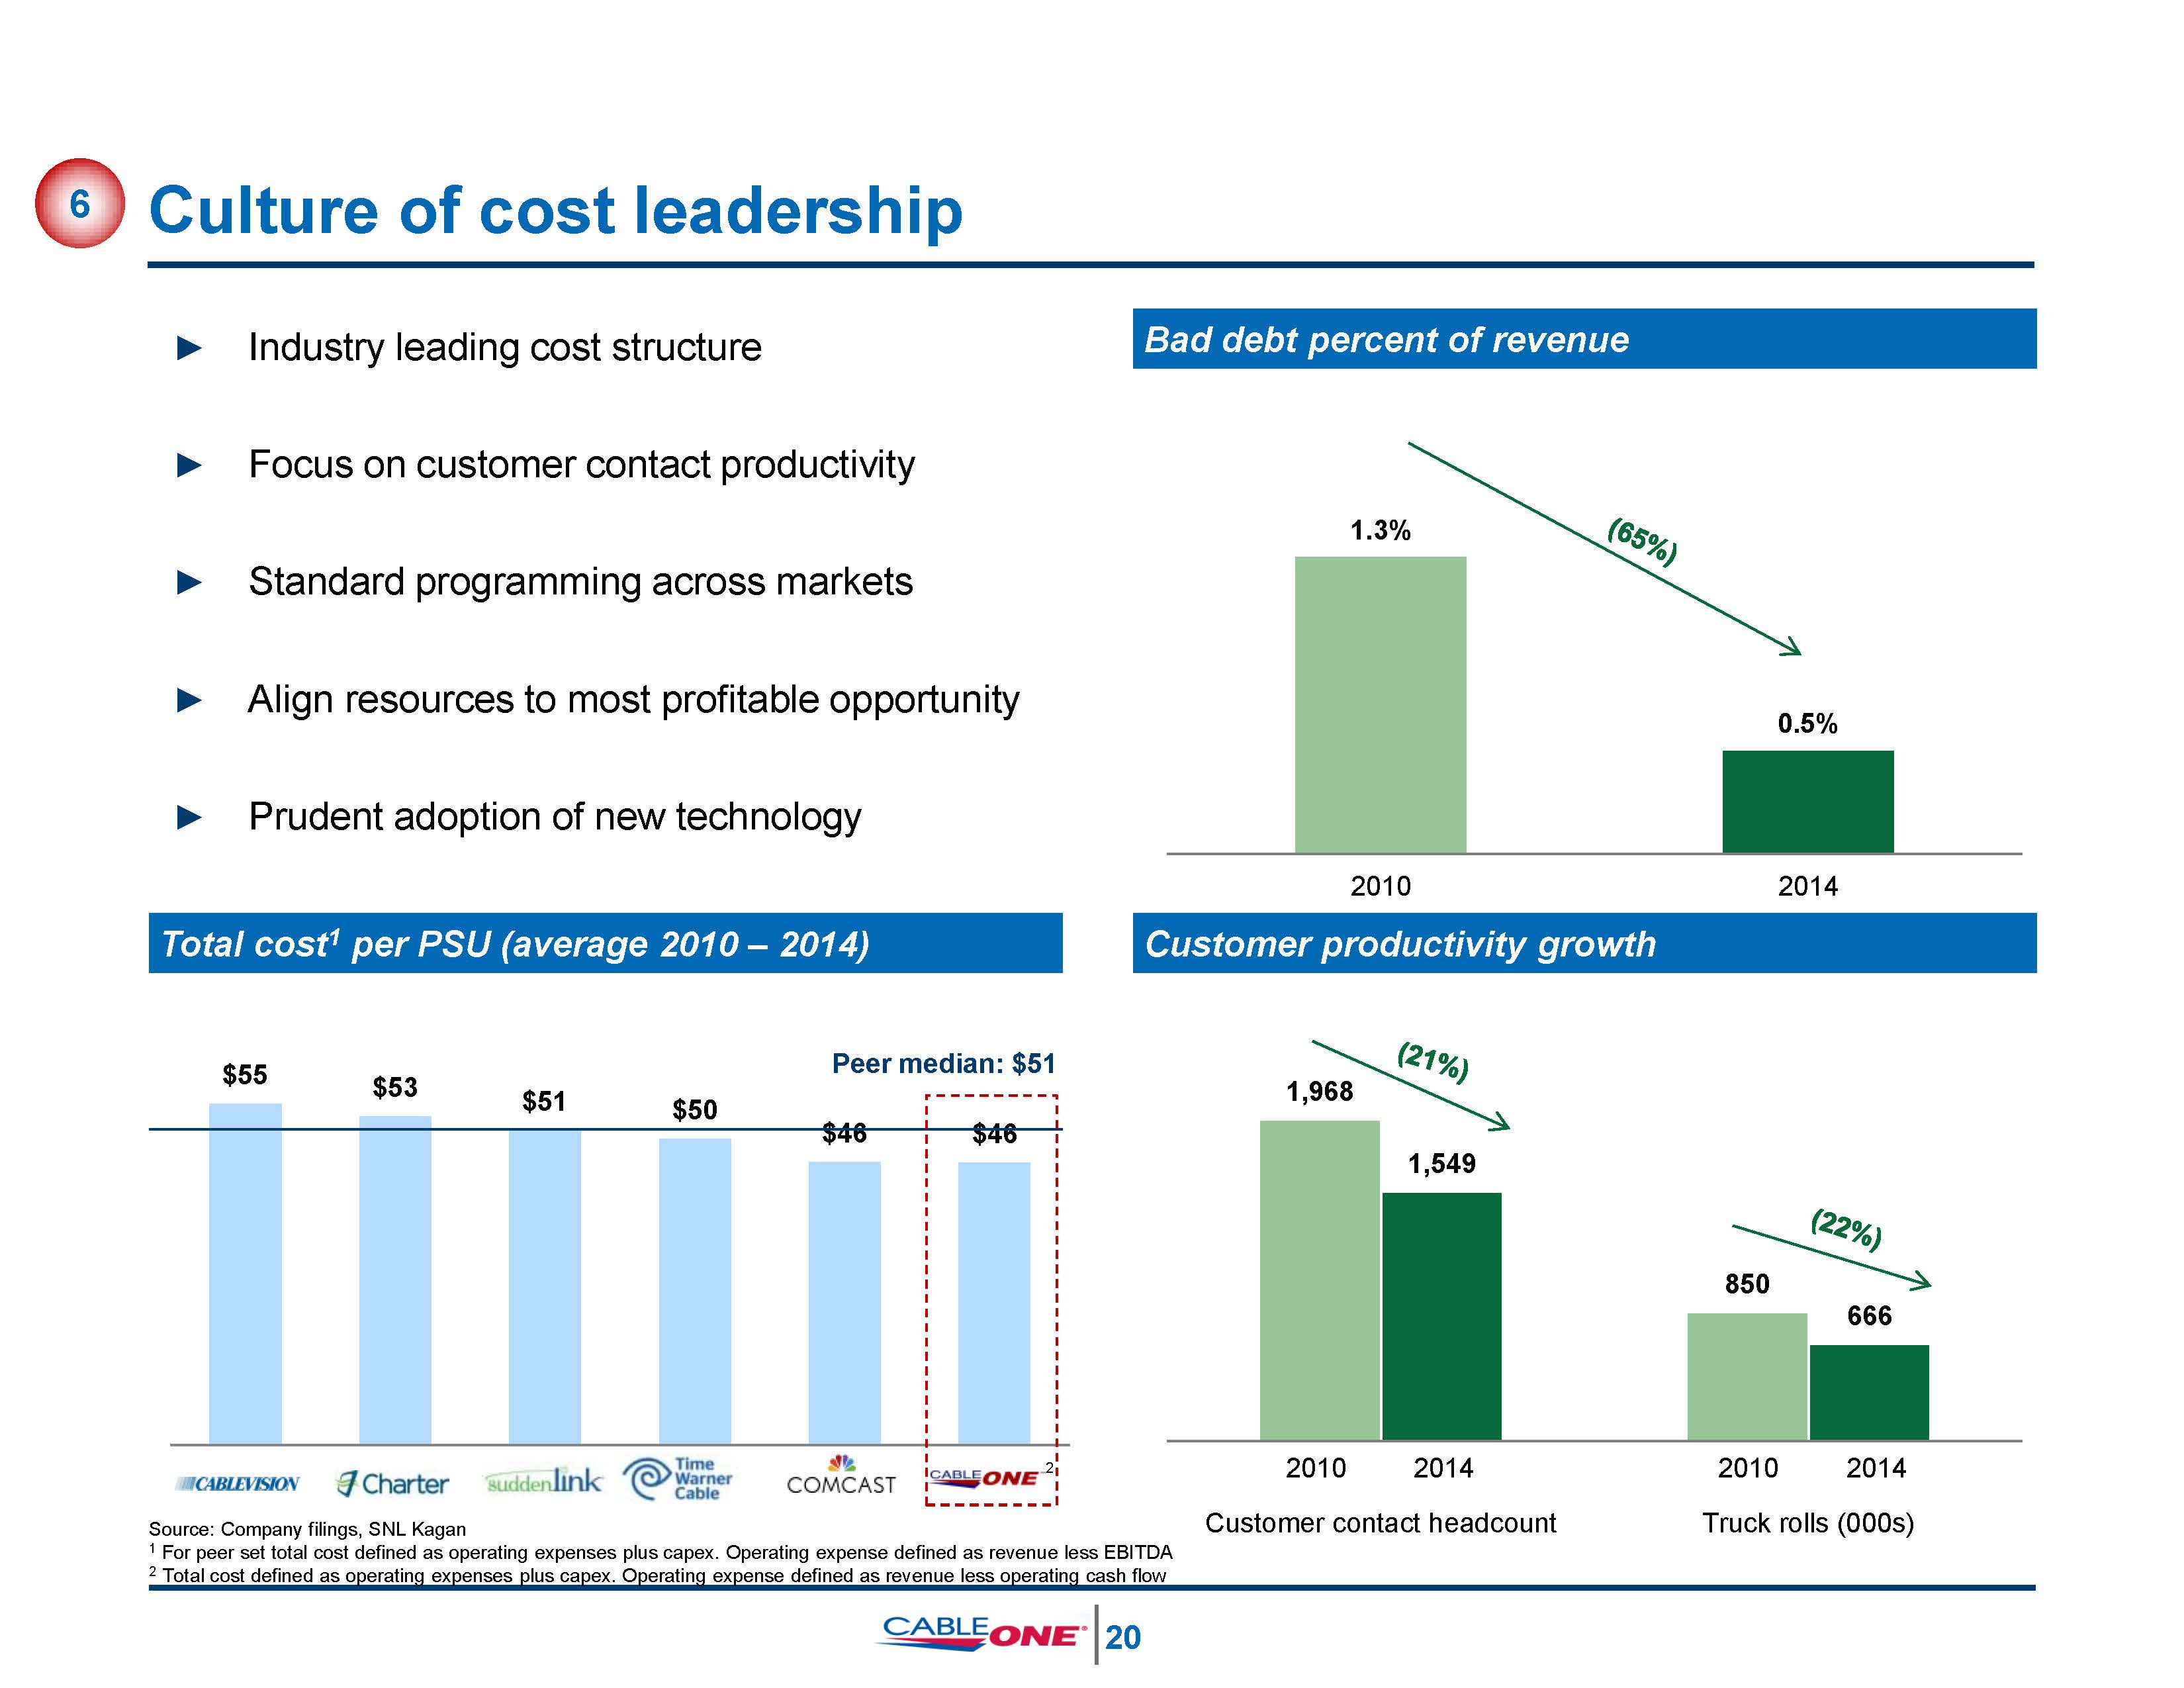
1,968 850 1,549 666 2010 2014Customer contact headcount 2010 2014Truck rolls (000s) Customer productivity growth Bad debt percent of revenue 1.3% 0.5% 2010 2014 Source: Company filings, SNL Kagan1 For peer set total cost defined as operating expenses plus capex. Operating expense defined as revenue less EBITDA2 Total cost defined as operating expenses plus capex. Operating expense defined as revenue less operating cash flow $55 $53 $51 $50 $46 $46 Culture of cost leadership 6 Total cost1 per PSU (average 2010 – 2014) ► Industry leading cost structure ► Focus on customer contact productivity ► Standard programming across markets ► Align resources to most profitable opportunity ► Prudent adoption of new technology 2 21
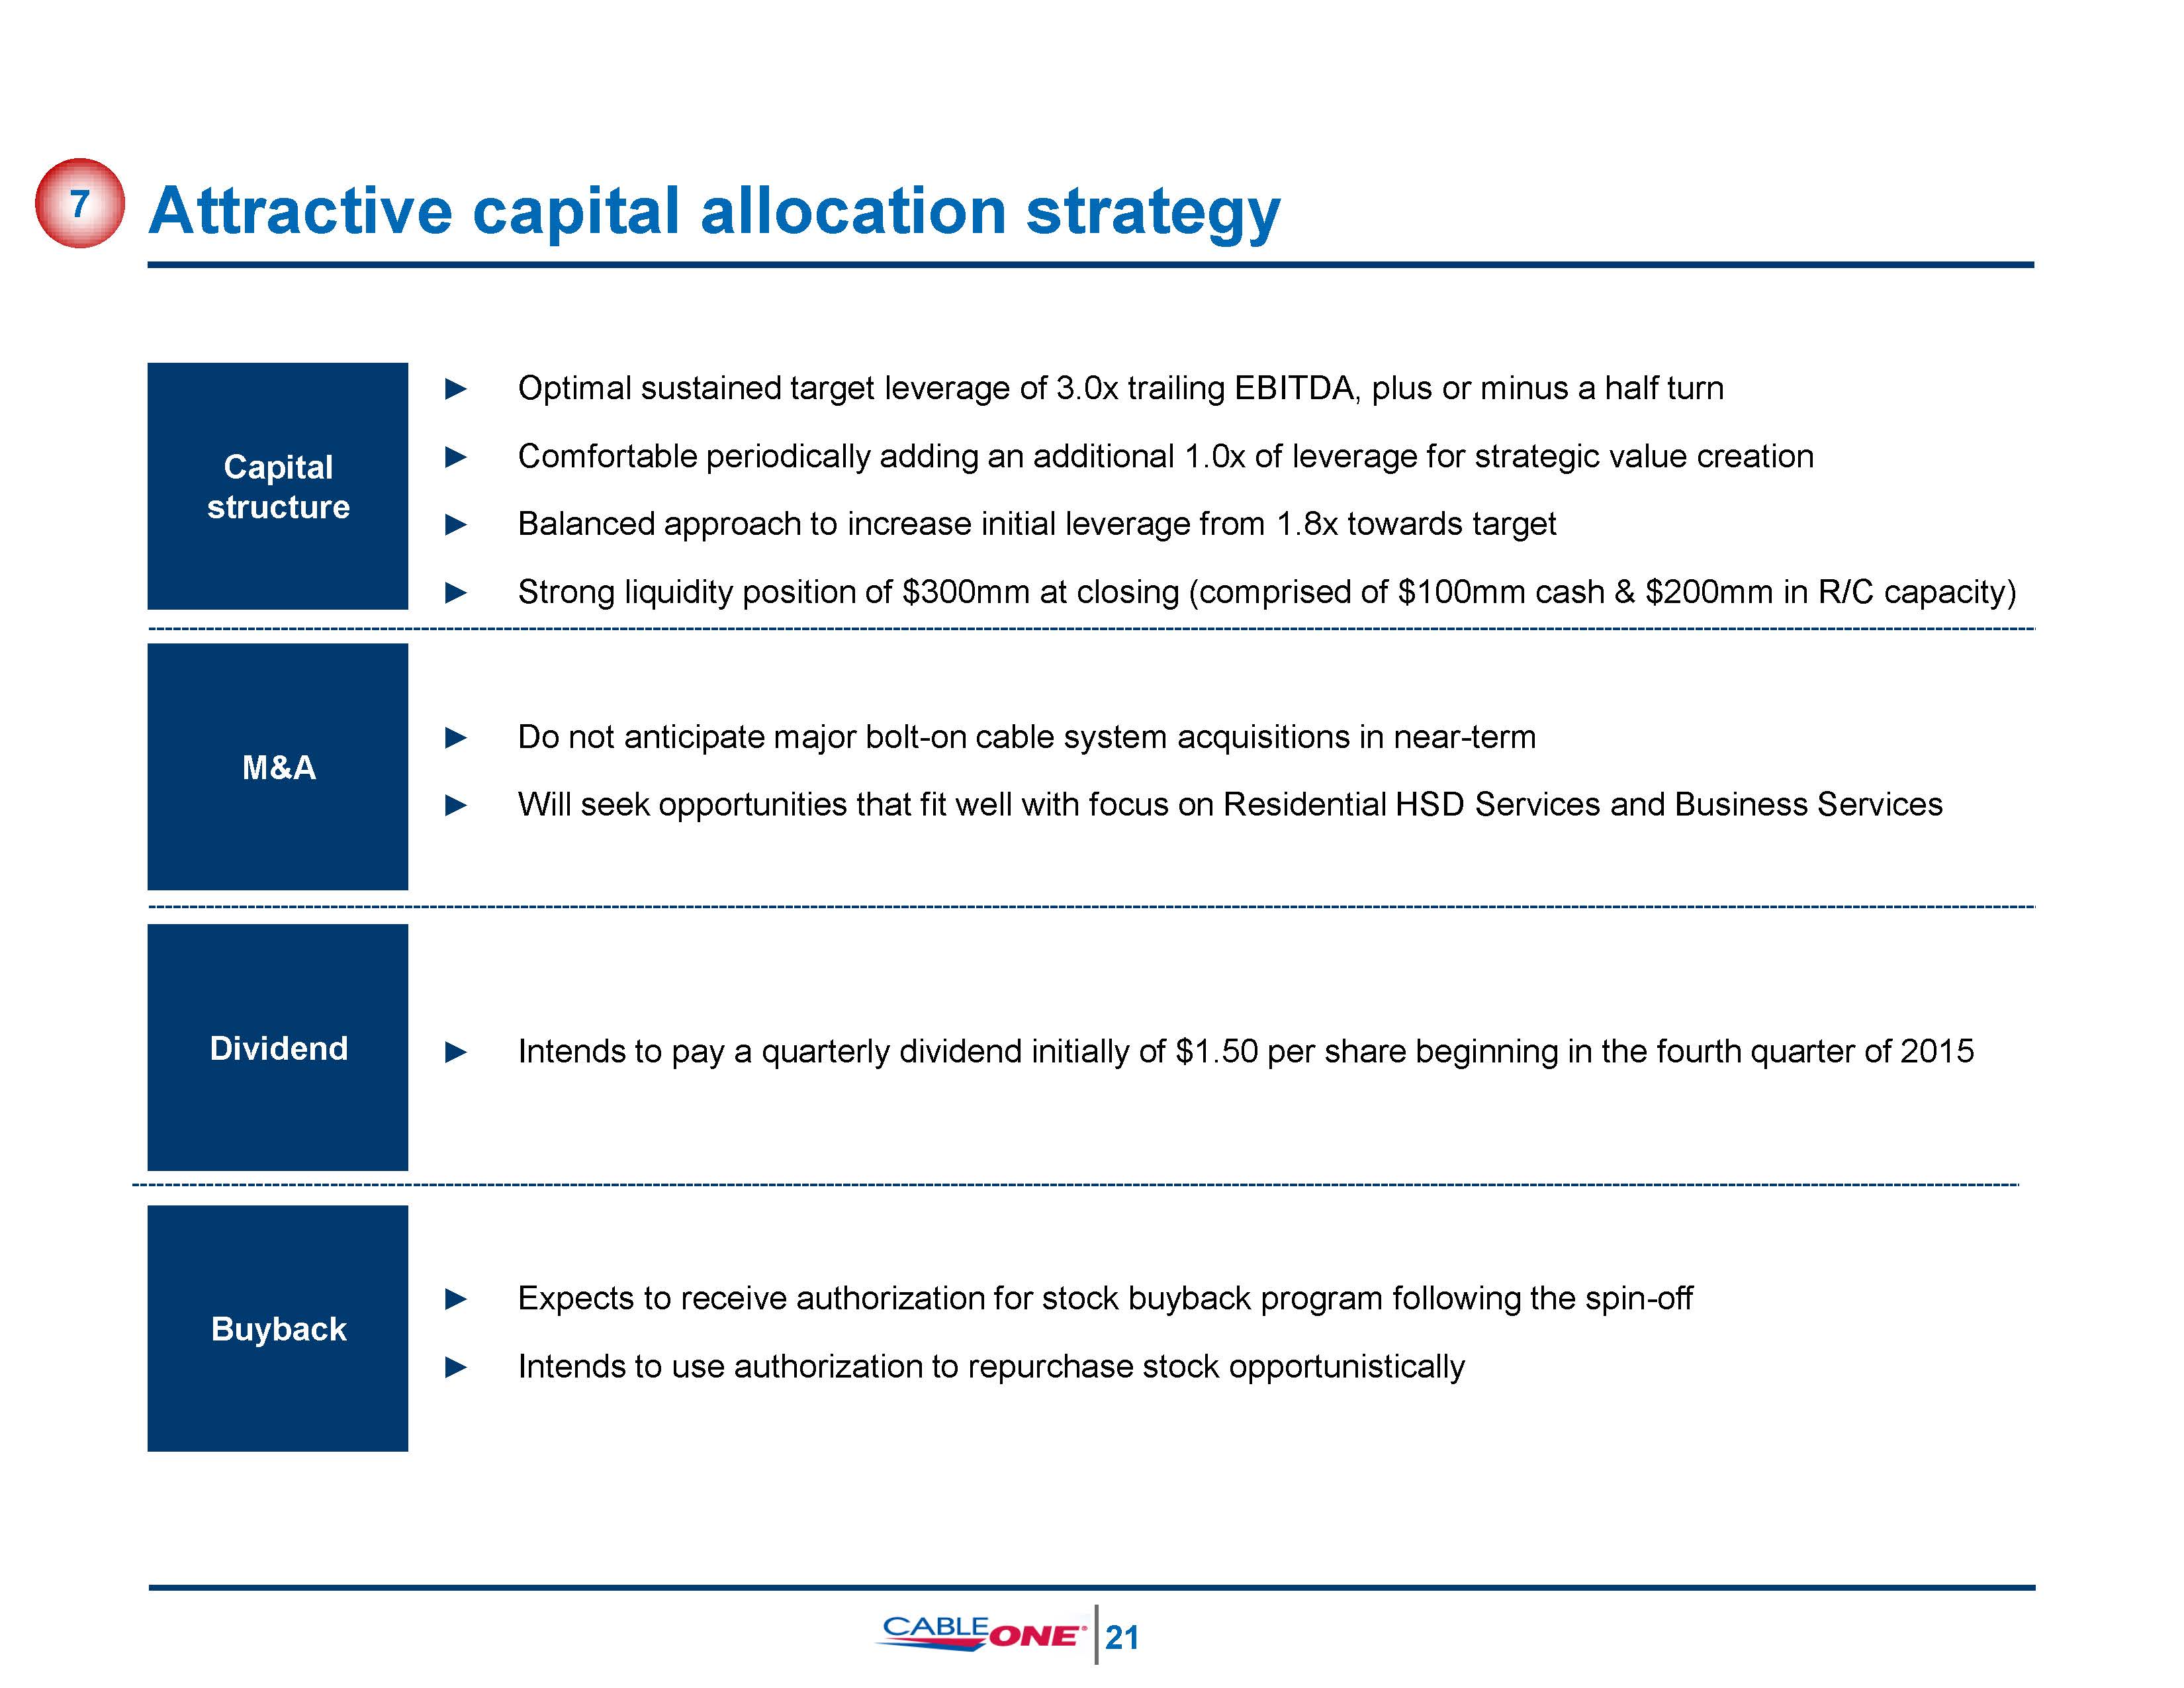
► Do not anticipate major bolt-on cable system acquisitions in near-term ► Will seek opportunities that fit well with focus on Residential HSD Services and Business Services Attractive capital allocation strategy Capital structure ► Optimal sustained target leverage of 3.0x trailing EBITDA, plus or minus a half turn ► Comfortable periodically adding an additional 1.0x of leverage for strategic value creation► Balanced approach to increase initial leverage from 1.8x towards target ► Strong liquidity position of $300mm at closing (comprised of $100mm cash & $200mm in R/C capacity) Dividend ► Expects to receive authorization for stock buyback program following the spin-off ► Intends to use authorization to repurchase stock opportunistically M&A ► Intends to pay a quarterly dividend initially of $1.50 per share beginning in the fourth quarter of 2015 Buyback 7 22

Experienced management team and Board Management team Board of directors Thomas O. MightChief Executive Officer and Director► CEO of Cable ONE since 1994► 22 years of broad cable industry experience Julie M. LaulisPresident and Chief Operating Officer► COO of Cable ONE since 2008; President since 2015► 32 years of broad cable industry experience Michael E. BowkerSVP, Chief Sales and Marketing Officer► SVP of Cable ONE since 2014► 16 years of cable sales and marketing leadership Kevin P. CoyleSVP, Chief Financial Officer► Recently hired as CFO to support public spin-off► 29 years of cable industry, M&A and start up experience Stephen A. FoxSVP, Chief Technology Officer► CTO since 2008► 27 years of cable technology experience 8 Naomi M. BergmanDirector► President of Bright House Networks since 2007► Serves on the FCC Technical Advisory Committee Brad D. BrianDirector► Trial lawyer at Munger, Tolles & Olson LLP► Represented numerous Fortune 500 corporations Thomas S. GaynerDirector► President & CIO of Markel Corporation since May 2010► Serves on Graham Holdings and Colfax Corp Boards Alan G. SpoonDirector► CEO of The Washington Post Company from 1993– 2000► Serves on Danaher Corp and IAC Boards Wallace R. WeitzDirector► Founded Weitz Investment Management, Inc. in 1983► Served as a Trustee of the Weitz Funds since 1986 Katharine B. WeymouthDirector► CEO of Washington Post Media from 2008 – 2014► Serves on Graham Holdings Board Alan H. SilvermanSVP, General Counsel, Director of Administration and Secretary► Executive with Cable ONE since 1986► Over 30 years of experience 23
Agenda► Transaction overview► Investment highlights► Financial overview► Appendix 24
Key financial highlights 25 Stable overall revenue with expanding margins Culture of cost leadership Lifetime value strategy drives profitable growth Strong and efficient balance sheet Balanced capital allocation
Financial and operating strategy 26 Prioritize product portfolio based on free cash flow potential► Confront the technological disruption, programmer overreach and generational change► Respond wisely and timely to these changes► Employ multiple strategic analytic frameworks, such as Porters Five Forces, to maximize profitability Transition from video-centric model to residential HSD & Business Services-centric model ► High margins and good prospects for continued growth► Non-video EBITDA share has expanded Continue to stabilize and harvest residential video EBITDA ► Use LTV to proactively trade off quality over quantity► Full programming cost pass through / raise video ARPU to avoid FCF cannibalization► Manage video costs by selectively culling programming

Steady, consistent financial performance 1 Adj. EBITDA defined as income from operations plus depreciation and amortization and certain non-recurring costs related to implementation of Cable ONE's billing system minus gains / (losses) on the disposition of fixed assets; Refer to page 30 in the Appendix2 Capex as a percentage of revenue3 Conversion rate defined as Adj. EBITDA less capex as a percentage of Adj. EBITDA $109 $131 $157 $142 $177 $168 14% 17% 19% 17% 22% 21% % of revenue 2 $779 $779 $805 $826 $815 $809 Capex cycle materially over by 2015 $283 $276 $281 $294 $301 $302 36% 35% 35% 36% 37% 37% $144 $124 $152 $124 $134 61% 52% 44% 52% 41% Revenue ($mm) Adj. EBITDA1 ($mm) Capex ($mm) Margin ~140 bps margin expansion from 2013 Average: 49%44% Conversion rate 3 Adj. EBITDA1 – capex ($mm) 27 2010 2011 2012 2013 2014 LTM 2010 2011 2012 2013 2014 LTM 3/31/15 3/31/15 2010 2011 2012 2013 2014 LTM 2010 2011 2012 2013 2014 LTM 3/31/15 3/31/15
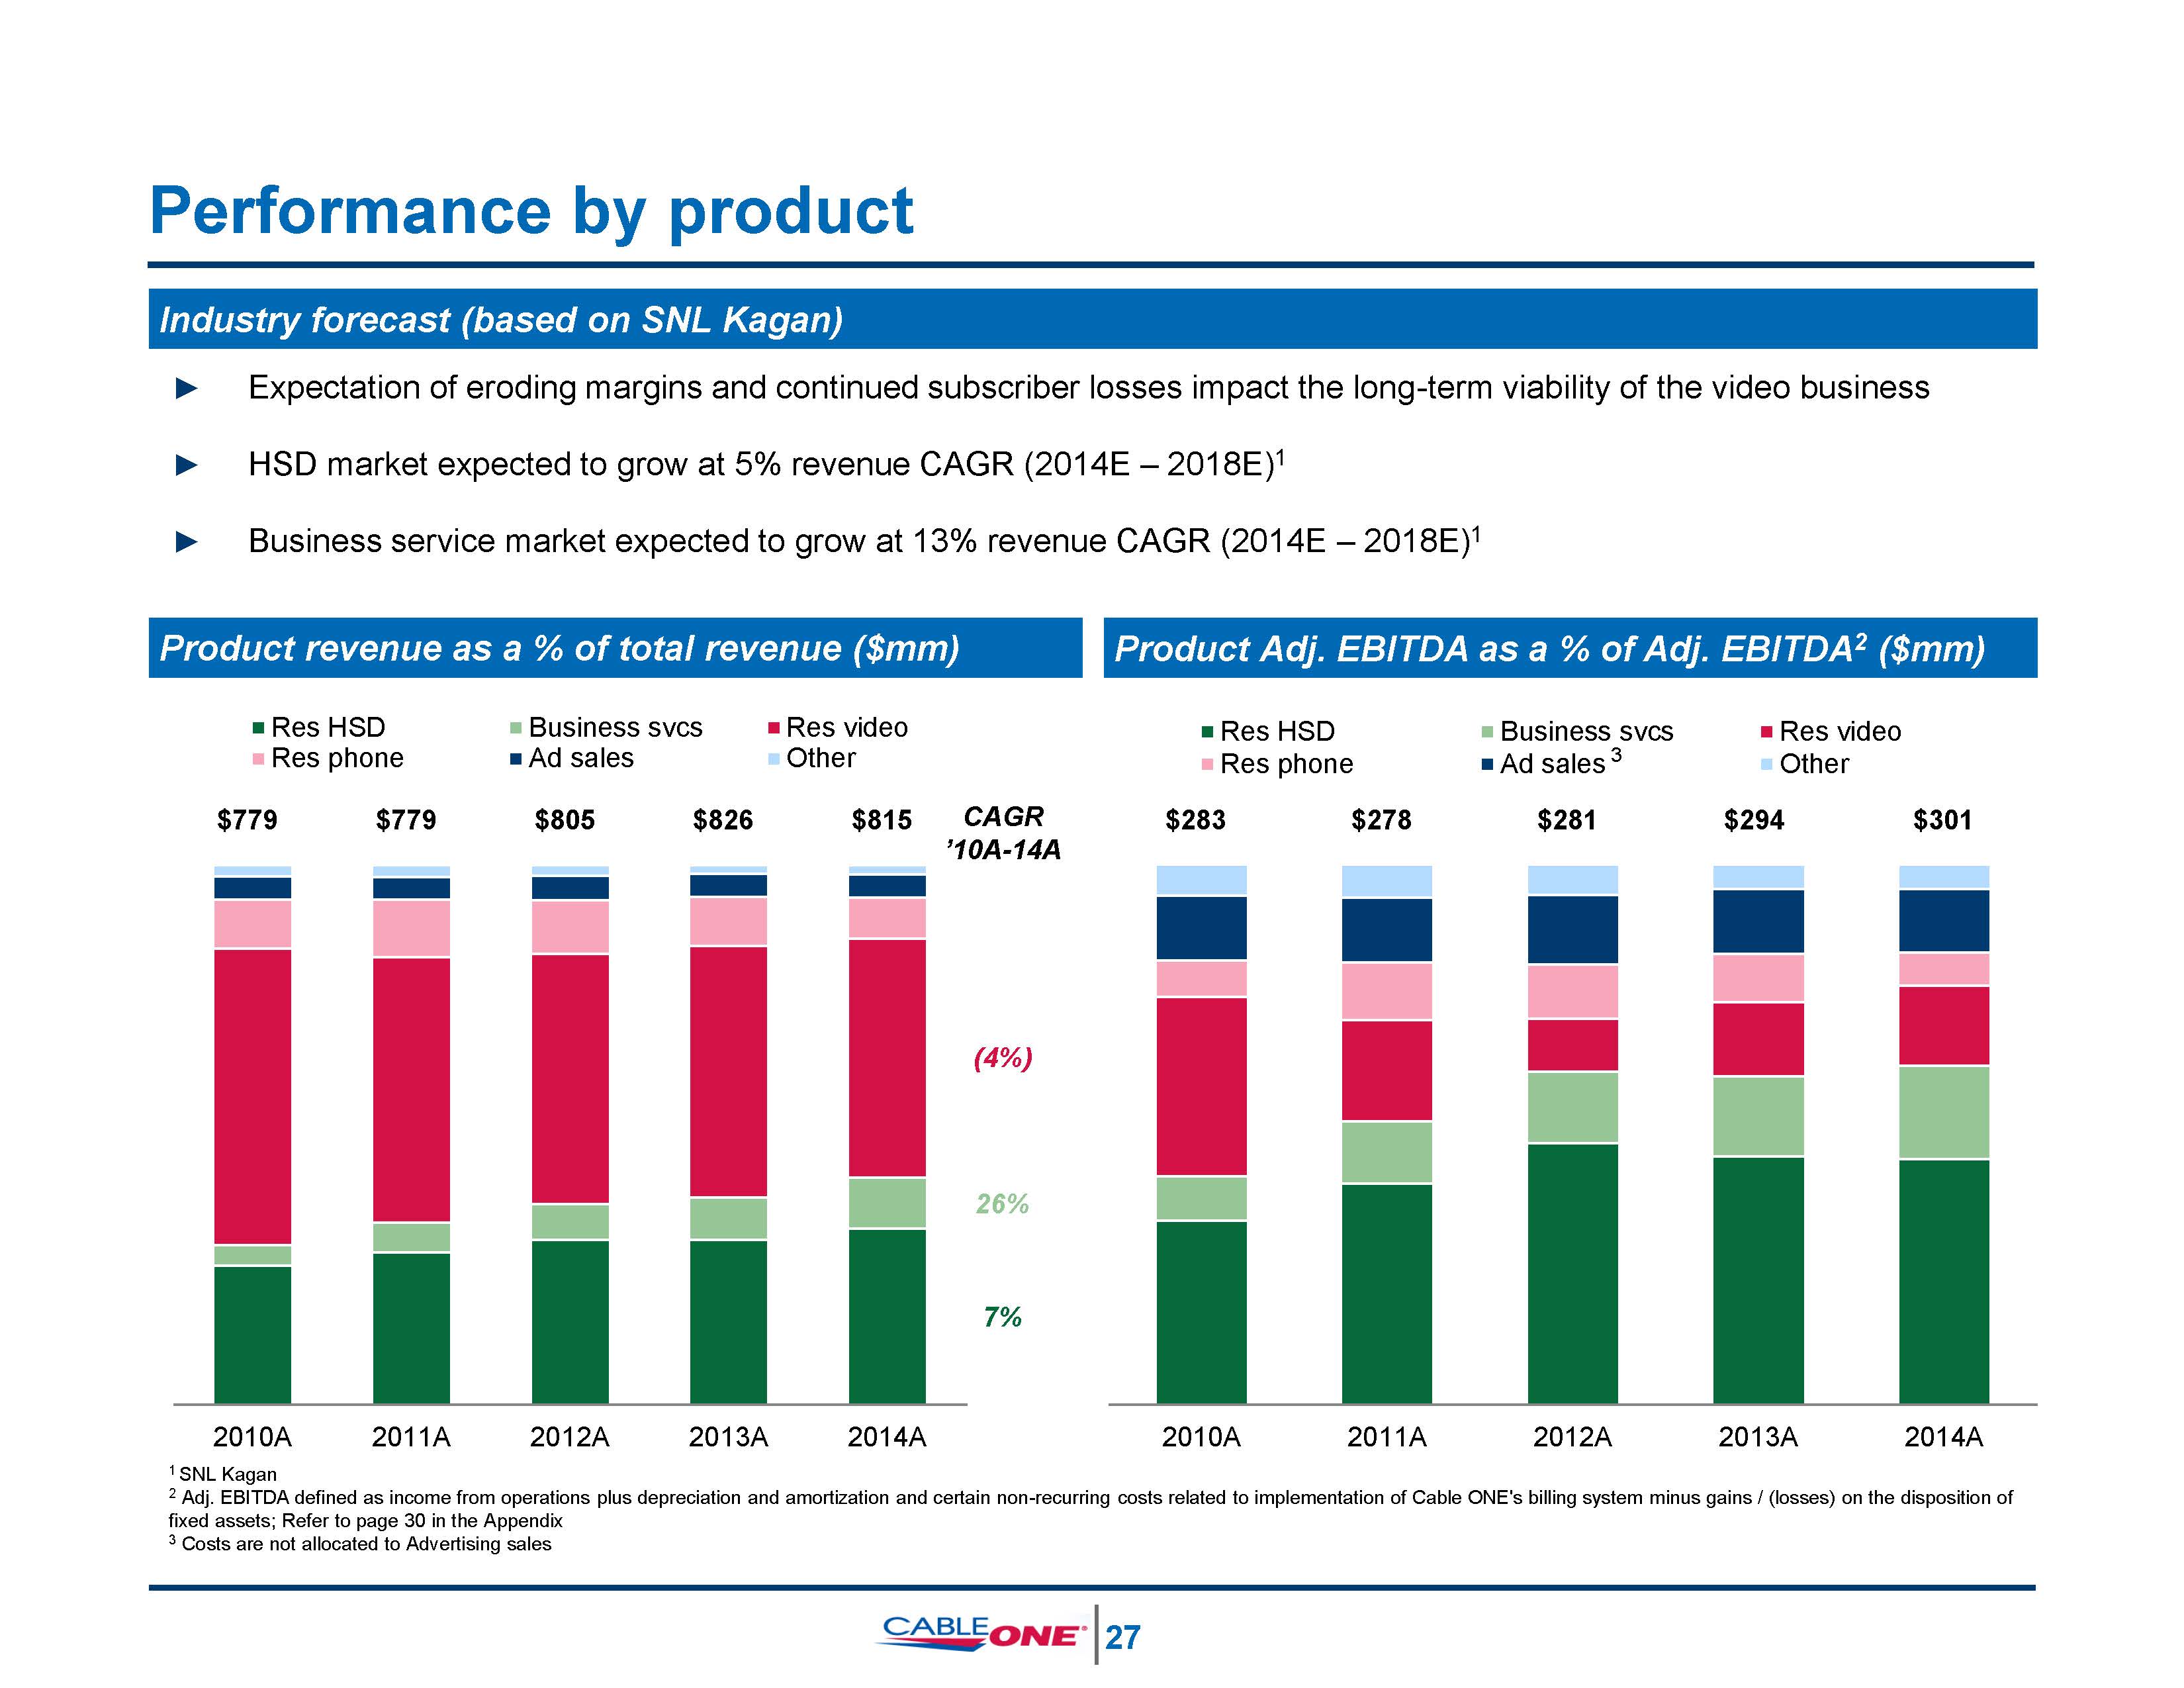 2010A 2011A 2012A 2013A 2014A 2010A 2011A 2012A 2013A 2014A1 SNL Kagan2 Adj. EBITDA defined as income from operations plus depreciation and amortization and certain non-recurring costs related to implementation of Cable ONE's billing system minus gains / (losses) on the disposition of fixed assets; Refer to page 30 in the Appendix3 Costs are not allocated to Advertising sales Performance by product ► Expectation of eroding margins and continued subscriber losses impact the long-term viability of the video business► HSD market expected to grow at 5% revenue CAGR (2014E – 2018E)1► Business service market expected to grow at 13% revenue CAGR (2014E – 2018E)1 Industry forecast (based on SNL Kagan) Product revenue as a % of total revenue ($mm) Product Adj. EBITDA as a % of Adj. EBITDA2 ($mm) 28 (4%) 26%7% CAGR ’10A-14A $779 $779 $805 $826 $815 $283 $278 $281 $294 $301 Res HSD Business svcs Res video Res HSD Business svcs Res video Res phone Ad sales Other Res phone Ad sales 3 Other
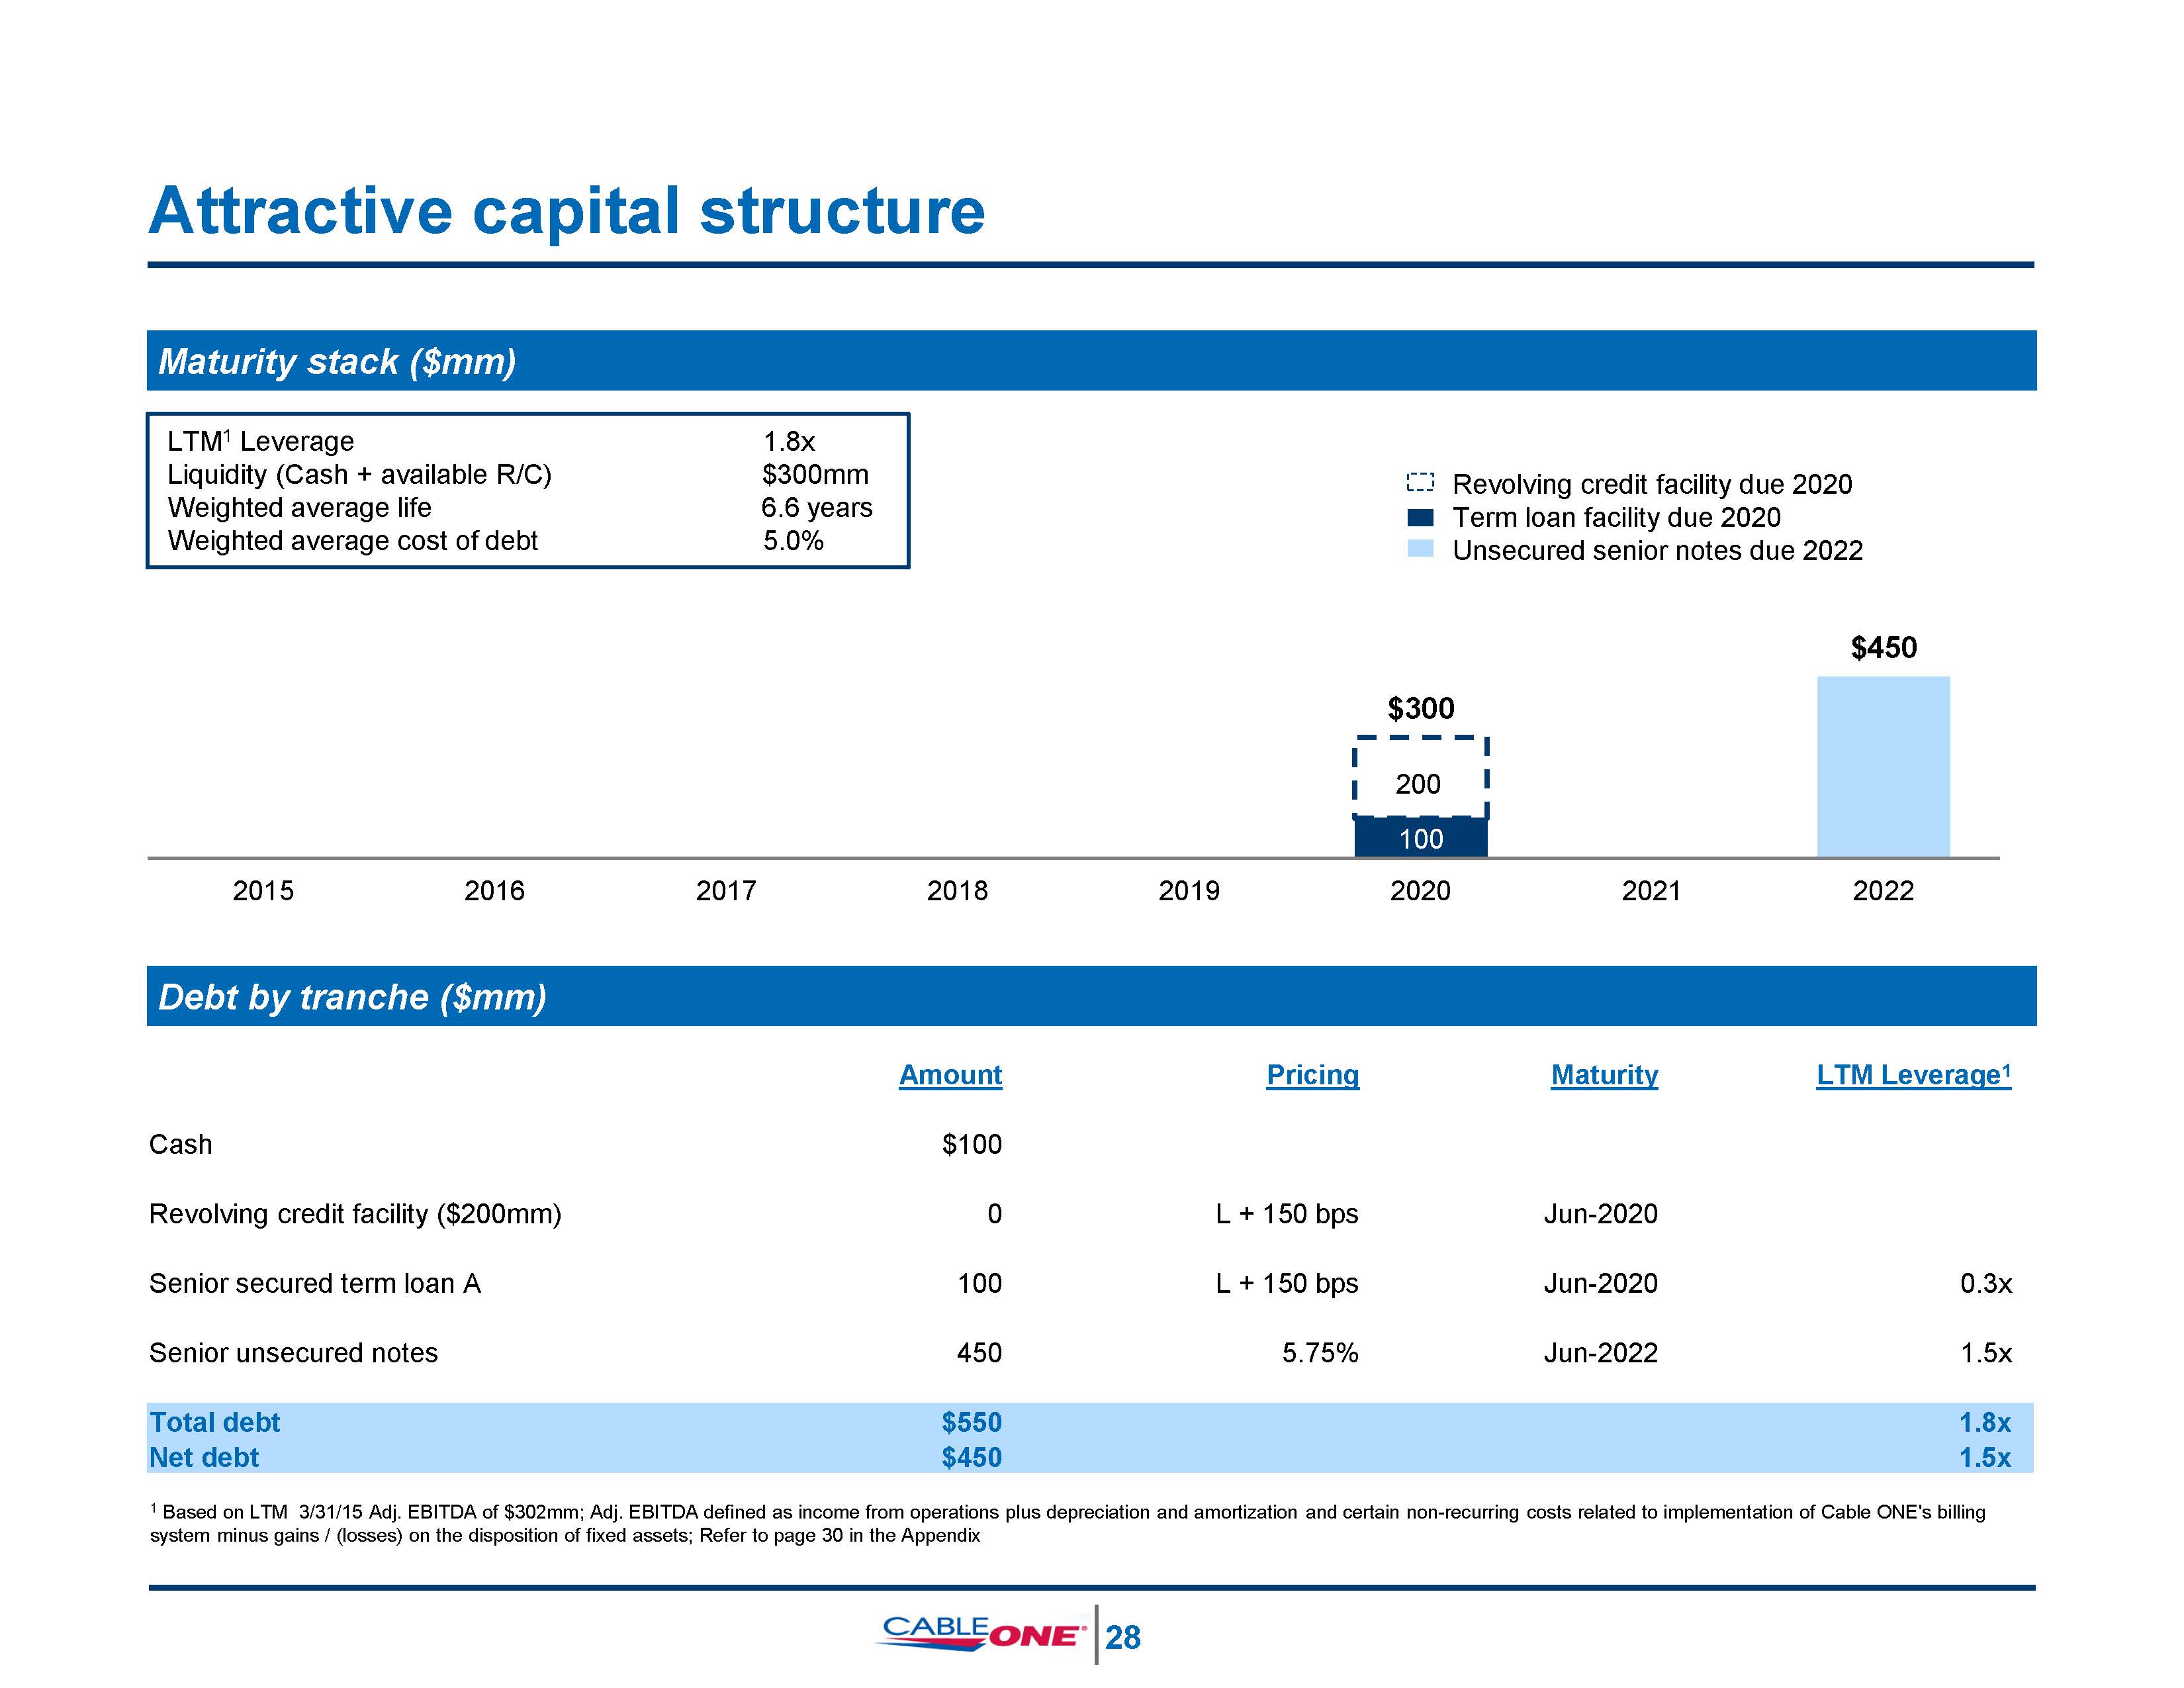
Attractive capital structure 1 Based on LTM 3/31/15 Adj. EBITDA of $302mm; Adj. EBITDA defined as income from operations plus depreciation and amortization and certain non-recurring costs related to implementation of Cable ONE's billing system minus gains / (losses) on the disposition of fixed assets; Refer to page 30 in the Appendix Debt by tranche ($mm) Maturity stack ($mm) $450$300 2015 2016 2017 2018 2019 2020 2021 2022 Revolving credit facility due 2020 Term loan facility due 2020 Unsecured senior notes due 2022 LTM1 LeverageLiquidity (Cash + available R/C) Weighted average life Weighted average cost of debt 29 1.8x$300mm6.6 years5.0% Amount Pricing Maturity LTM Leverage1 Cash $100 Revolving credit facility ($200mm) 0 L + 150 bps Jun-2020 Senior secured term loan A 100 L + 150 bps Jun-2020 0.3x Senior unsecured notes 450 5.75% Jun-2022 1.5x Total debt $550 1.8x Net debt $450 1.5x 200 100
Agenda► Transaction overview► Investment highlights► Financial overview► Appendix 30
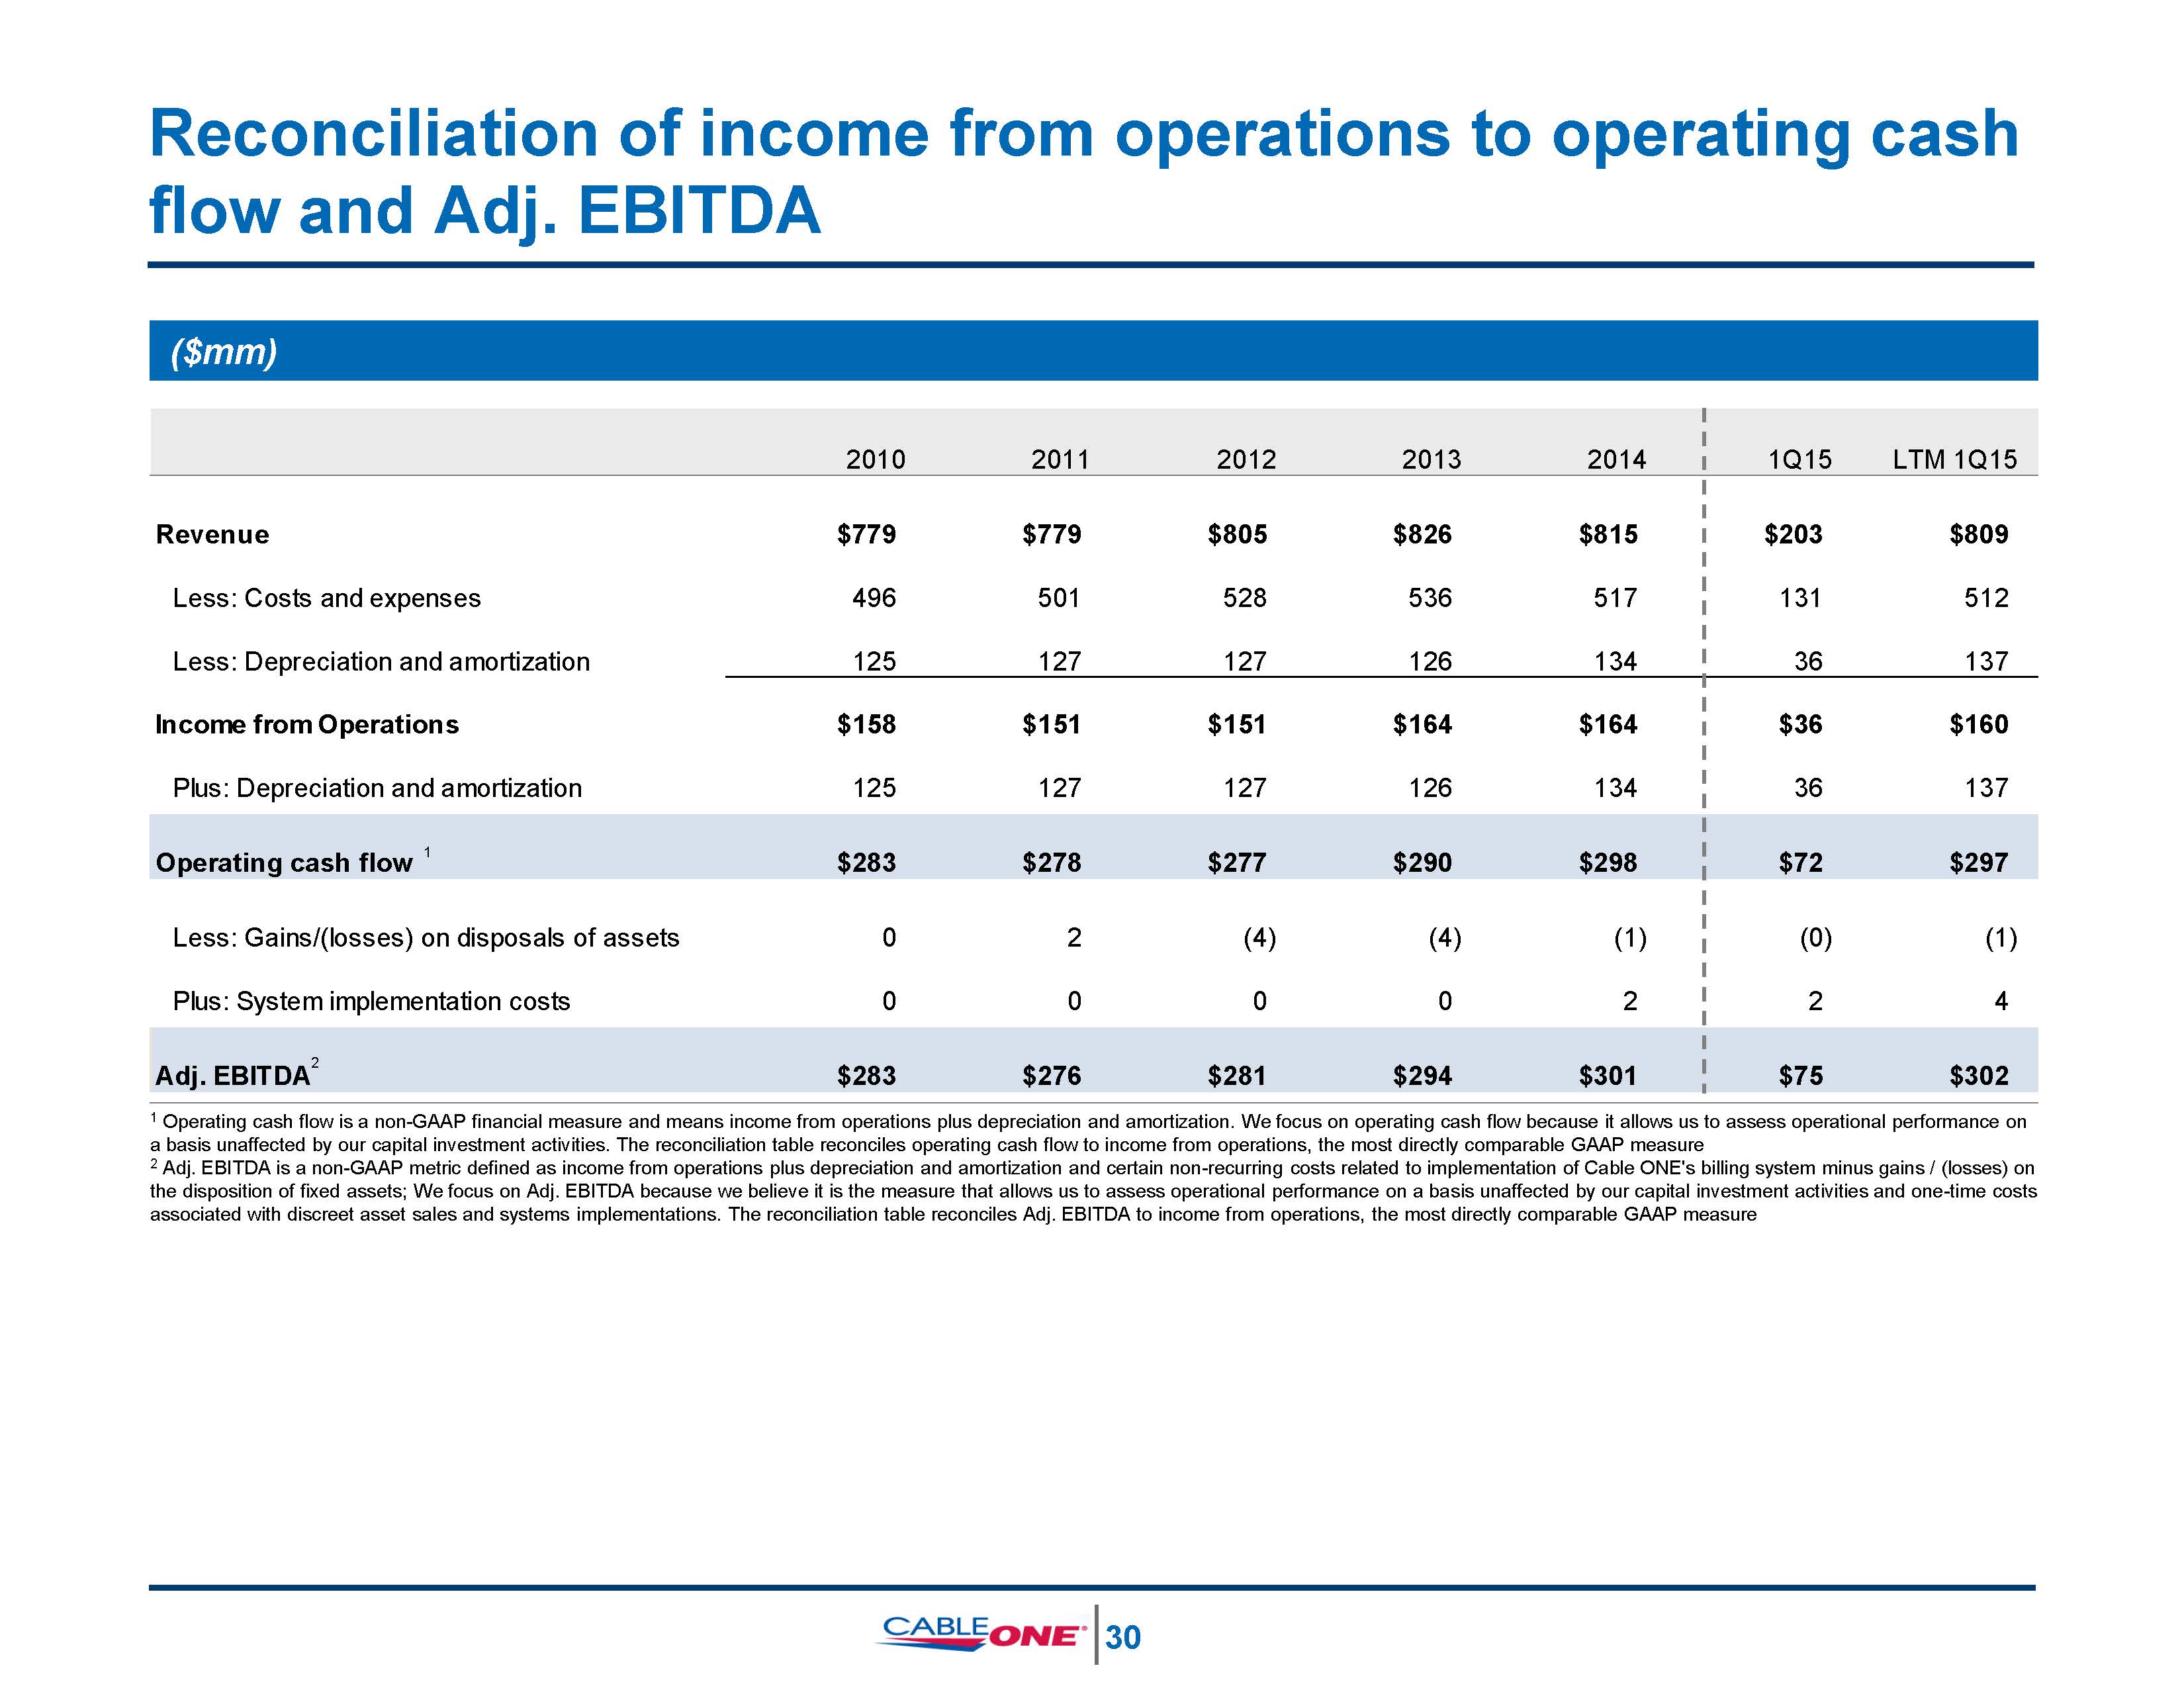
Reconciliation of income from operations to operating cash flow and Adj. EBITDA ($mm) 1 Operating cash flow is a non-GAAP financial measure and means income from operations plus depreciation and amortization. We focus on operating cash flow because it allows us to assess operational performance on a basis unaffected by our capital investment activities. The reconciliation table reconciles operating cash flow to income from operations, the most directly comparable GAAP measure2 Adj. EBITDA is a non-GAAP metric defined as income from operations plus depreciation and amortization and certain non-recurring costs related to implementation of Cable ONE's billing system minus gains / (losses) on the disposition of fixed assets; We focus on Adj. EBITDA because we believe it is the measure that allows us to assess operational performance on a basis unaffected by our capital investment activities and one-time costs associated with discreet asset sales and systems implementations. The reconciliation table reconciles Adj. EBITDA to income from operations, the most directly comparable GAAP measure 31 2010 2011 2012 2013 2014 1Q15 LTM 1Q15 Revenue $779 $779 $805 $826 $815 $203 $809 Less: Costs and expenses 496 501 528 536 517 131 512 Less: Depreciation and amortization 125 127 127 126 134 36 137 Income from Operations $158 $151 $151 $164 $164 $36 $160 Plus: Depreciation and amortization 125 127 127 126 134 36 137 Operating cash flow 1 $283 $278 $277 $290 $298 $72 $297 Less: Gains/(losses) on disposals of assets 0 2 (4) (4) (1) (0) (1) Plus: System implementation costs 0 0 0 0 2 2 4 2Adj. EBITDA $283 $276 $281 $294 $301 $75 $302