- ENR Dashboard
- Financials
- Filings
-
Holdings
- Transcripts
- ETFs
- Insider
- Institutional
- Shorts
-
8-K Filing
Energizer (ENR) 8-KChairman of the Board
Filed: 2 Jun 15, 12:00am
Exhibit 99.1
|
The New Energizer
PAT MULCAHY
Chairman of the Board
|
Presentation of Information; Forward-Looking Statements
Unless the context otherwise requires, references in this presentation to “Energizer,” “New Energizer,” “we,” “our,” and “the Company” refer to Energizer SpinCo, Inc., a Missouri corporation, and its subsidiaries. Unless the context otherwise requires, references in this presentation to “Parent” refer to Energizer Holdings, Inc., a Missouri corporation, and its consolidated subsidiaries, including the Household Products business prior to completion of the separation. Unless the context otherwise requires, references in this presentation to New Energizer’s historical assets, liabilities, products, businesses or activities generally refer to the historical assets, liabilities, products, businesses or activities of the Household Products business of Parent as the business was conducted as part of Parent prior to the completion of the separation.
The following presentation contains forward looking statements. Forward-looking statements are not based on historical facts but instead reflect our expectations concerning future results or events, including our expectations for the separation, new product launches and strategic initiatives, including restructurings, and our outlook for future financial, operational or other potential or expected results. These statements are not guarantees of performance and are inherently subject to known and unknown risks and assumptions that are difficult to predict and could cause our actual results, performance or achievements to differ materially from those expressed in or indicated by those statements.
In addition, other risks and uncertainties not presently known to us or that we consider immaterial could affect the accuracy of any such forward-looking statements. All forward-looking statements should be evaluated with the understanding of their inherent uncertainty. Additional risks and uncertainties include those detailed from time to time in our Registration Statement on Form 10 as well as Parent’s publicly filed documents, including its annual report on Form 10-K for the year ended September 30, 2014 and the Form 10-Q for the quarter ended March 31, 2015. The forward-looking statements included in this presentation are only made as of the date of this document and we disclaim any obligation to publicly update any forward-looking statement to reflect subsequent events or circumstances.
Market and Industry Data
Unless indicated otherwise, the information concerning our industry contained in this presentation is based on our general knowledge of and expectations concerning the industry. Our market position, market share and industry market size are based on estimates using our internal data and estimates, based on data from various industry analyses, our internal research and adjustments and assumptions that we believe to be reasonable. We have not independently verified data from industry analyses and cannot guarantee their accuracy or completeness. In addition, we believe that data regarding the industry, market size and our market position and market share within such industry provide general guidance but are inherently imprecise. Further, our estimates and assumptions involve risks and uncertainties and are subject to change based on various factors. These and other factors could cause results to differ materially from those expressed in the estimates and assumptions.
Non-GAAP Financial Measures
While the Company reports financial results in accordance with accounting principles generally accepted in the U.S. (“GAAP”), this presentation include non-GAAP measures. These non-GAAP measures, include EBITDA, adjusted EBITDA and ratios derived therefrom, free cash flow and ratios derived therefrom, as well as non-GAAP comparatives such as operating results, organic sales, gross margin and other comparison changes that exclude such items as the impact of changes in foreign currency rates on a period over period basis versus the U.S. dollar, separation related costs and costs associated with restructuring activities. We believe these non-GAAP measures provide a meaningful comparison to the corresponding historical or future period and assist investors in performing their analysis and provide investors with visibility into the underlying financial performance of the Company’s business. The Company believes that these non-GAAP measures are presented in such a way as to allow investors to more clearly understand the nature and amount of the adjustments to arrive at the non-GAAP measure. Investors should consider non-GAAP measures in addition to, not as a substitute for, or superior to, the comparable GAAP measures. Further, these non-GAAP measures may differ from similarly titled measures presented by other companies. A reconciliation of these non-GAAP measures to the nearest comparable GAAP measure is available at the end of this presentation.
2 |
|
|
Energizer Holdings, Inc. has a strong legacy of shareholder value creation
Since spin off from Ralston Purina in March 2000, Energizer Holdings, Inc. has:
Distributed $317 million to shareholders via quarterly dividends
Repurchased $2.8 billion in stock opportunistically
(57 million shares at an average price of $49/share)
Achieved a more than six-fold increase in stock price
ENR STOCK PRICE (per share)
$141.58
$21.25
April 3, 2000
April 15, 2015
3 |
|
|
We expect the separation to drive long-term value for our shareholders
Focus on Distinct Commercial Opportunities
Creation of Independent
Equity Currencies
Management Focus and Separate
Capital Structures
Allocation of Financial Resources
Targeted
Investment Opportunity
Unlocking Full Shareholder Value
4 |
|
|
We have a strong Board of Directors with the right blend of continuity, fresh perspective and independence
Six current Energizer Holdings, Inc. members
Pat Mulcahy
Chairman of the Board
Bill Armstrong
Jim Johnson
John Klein
Pat McGinnis
John Roberts
Three new independent members that bring fresh perspectives on global operations, consumer goods and Board oversight
Pat Moore Cynthia Brinkley Kevin Hunt
Management representative
Alan Hoskins, CEO
5 |
|
|
We have a seasoned executive team with a wealth of diverse experience to guide the new company
Alan Hoskins, CEO
33 years at Energizer
CEO of the battery business since 2011
Previously led North America and Asia-Pacific divisions
Global sales, marketing and operational experience
Mark LaVigne, COO
15 years as advisor to Energizer
Currently the General Counsel of Energizer Holdings
Leading separation effort
Will lead commercial & legal teams
Brian Hamm, CFO
7 |
| years at Energizer; 17 years in consumer products industry |
Currently the Controller and Chief Accounting Officer
Led the enterprise-wide restructuring effort and working capital improvement initiative
6 |
|
|
Our agenda for today
Alan Hoskins
New Energizer’s Value Proposition
Energizer’s Brands and Global Leadership Position
Enhancing Value Across Our Chosen Categories and Channels
Mark LaVigne
Driving Momentum Across Our Operations and Organization
Brian Hamm
Delivering Total Shareholder Return
7 |
|
|
The New Energizer
ALAN HOSKINS
Chief Executive Officer
8 |
|
|
Our agenda for today
Who We Are
New Energizer’s Value Proposition
Our Brands and Global Leadership Position
Why We’ll Win
Lead with Innovation
Operate with Excellence
Drive Productivity Gains
How We’ll Deliver Long-Term Value
Focused on Free Cash Flow
Committed to Returning Cash to Shareholders
Dedicated to Enhancing Value for the Long Term
9
|
We are an innovative, brand-driven Household Products company
Revenue ~ U.S. Value Share
2014 5,200
33% 15%
$1.8Billion customers served,
in a consolidated in a highly fragmented
reaching
balanced between U.S. and global markets battery industry lighting products industry
BILLIONS of Free Cash Flow
iconic, of the largest
consumers globally Latest Three Fiscal Years
battery
globally
Cost Savings manufacturers ~
recognized
2 |
| > 1in the world |
brands Through $750
$210 Million
March 2015
Million No. of
manufacturing We sell in Energizer facilities today, and # # strategically Eveready globally located in North 7 batteries 1or 2 America, Africa 140 are ranked
(in 32 out of 34 measured markets) & Asia global markets
Source: U.S. battery share from Nielsen Global Track 52-weeks ending March 2015. U.S. lighting share from Nielson xAOC, 52-weeks ending 4-18-15.
Combined value share rank data from Nielsen Global Track, 52-weeks ending March 2015 including all Energizer and Eveready branded batteries excluded private label. 10
See appendix for free cash flow reconciliation.
10
|
Talented and deep management team ready to execute
Alan Hoskins
CEO
Sue Drath
Chief Human Resource Officer
23 years in human resources
Brian Hamm
Chief Financial Officer
17 years in consumer products, previously Chief Accounting Officer
Mark LaVigne
Chief Operating Officer
15 years as a strategic advisor or legal counsel to ENR, will lead Commercial and Legal teams
Greg Kinder
Chief Supply Chain Officer
30 years in global procurement, supply chain and operations
Michelle Atkinson
Chief Consumer Officer
25 years in marketing, previously Chief Marketing Officer
Jennifer Beatty
Vice President, Investor Relations
15 years in investor relations
Kelly Boss
General Counsel
25 years of legal experience
Brandon Davis
Chief Business Officer, Americas
18 years in commercial operations for North
& Latin America and Australia
Patrick Hedouin
Chief Business Officer, International
25 years leading global commercial teams in Europe/Asia
*Blue indicates in attendance today
11
|
New Energizer has a compelling value proposition
Driving results for our shareholders, customers and consumers
Powerful dual brand portfolio Global scale and leadership position Deep Board and management team expertise Track record of cost savings and productivity gains Top-tier free cash flow performer among household peers Focused on maximizing cash flow & returning cash to shareholders
12
|
Our business is built on two iconic brands
Billions of consumers around the world prefer the Energizer and Eveready brands and purchase them to meet their power and lighting needs After 26 years, the Energizer Bunny keeps going and going, generating millions of impressions each year
Source: Nielsen through April 2015.
13
|
Consumers prefer branded products in our categories
Reinforces the need to invest behind our brands to drive category value
U.S. HOUSEHOLD BATTERY CATEGORY
(share in US $)
Premium Brands (incl. Performance) Price Brands Private Label
Batteries
account for about
3B
$
in US retail sales(1) annually, with premium brands driving the vast majority of those sales
Batteries
account for about
6B
$
(1) |
|
in global retail sales
70% 72%
30% 28% 12% 13%
18% 15%
2009 Today
Source: U.S.: Nielsen US xAOC HOUSEHOLD BATTERIES 52-weeks ending 4-18-15 ; Global, Nielsen Global Track, 52-weeks ending March 2015.
Premium Brands = Energizer and Duracell; Price Brands = Eveready, Panasonic, Rayovac.
(1) |
| Only accounts for 34 measured markets and not 100% retailer coverage in those markets. |
14
|
Our broad portfolio of products is uniquely positioned
ESTABLISHED BROAD PRODUCT PORTFOLIO
ENR SALES BY PRODUCT SEGMENT
(percent of net sales in 2014)
16%
17% 50%
Premium 17% Performance
Value/Price
Specialty & Lights
Brand & product portfolio competes across all consumer segments
Premium
• |
| Premium Alkaline |
• |
| Lithium |
Performance • Performance Alkaline
• |
| Rechargeable |
Value • Value Alkaline
• Carbon Zinc Specialty • Specialty Batteries Lights • Lighting Products
15
|
Energizer products provide an un-matched consumer experience across its battery and lighting portfolio
#2
in Portable Lights
#1
in Rechargeable
#1in Lithium
in the growing # segment of 1specialty batteries
World’s
st
1in Recycled
#2
in Premium
Source: Nielsen Global Track 52-weeks ending March 2015 and Nielson xAOC, 52-weeks ending 4-18-15.
16
|
Eveready provides a portfolio of quality products families can trust at an affordable price
#2
in Value Alkaline
Powerful second brand in portfolio that appeals to consumers across many segments
#1
in Carbon Zinc
Source: Nielsen Global Track, 52-weeks ending March 2015.
17
|
Energizer and Eveready brands are #1 or #2 globally
Dual brand portfolio strengthens our market position
VALUE SHARE IN SELECTED COUNTRIES
Our products are sold in more than
140
markets around the world
CAN USA MEX COL ARG
GB ITA FRA EGP GRE
SING KOR HK MAL
AUS NZ
Source: Combined value share data from Nielsen Global Track, 52-weeks ending March 2015 including all Energizer and Eveready branded batteries excluded private label.
18
|
Our revenues are balanced across markets
NORTH AMERICA vs. INTERNATIONAL
(percent of net sales in 2014)
51% 49%
North America International
DEVELOPED vs. DEVELOPING
(percent of net sales in 2014)
75%
25%
Developed Developing
TOP 10 vs. ALL MARKETS
(percent of net sales in 2014)
28% 72%
Top 10 All Other
Source: Form 10 and internal data.
19
|
Category volume trends have recently stabilized
As the number of devices and replacement frequency has flattened
VOLUME TRENDS ARE DRIVEN BY THESE EXTERNAL FACTORS
Demographics Devices Disasters
20
|
Category volumes and value trends are improving in latest 12 week data
GLOBAL HOUSEHOLD BATTERY
CATEGORY VOLUME
(percent change)
1.7% -1.4% Latest 52 weeks Latest 12 weeks
GLOBAL HOUSEHOLD BATTERY CATEGORY VALUE
(percent change)
1.5%
-1.8%
Latest 52 weeks Latest 12 weeks
Source: Nielsen Global Track through March 2015.
21
|
There are more than 1 billion devices in U.S. consumer homes
Large installed base that requires regular battery replenishment
Toys, Games 18% Remote Controls 13% Flashlights 7% Smoke Alarms, Clocks 5%
Digital Cameras 4%
Top 20 Devices
Wireless Mouse 3% Account for about
Health** 3% 55%
Radio 2% of battery consumption
U.S. households report using 5+ billion batteries per year
Average U.S. household owns ~3X more primary battery devices than battery-on-board devices
As device trends stabilize globally, so will the number of batteries used annually per household
*Source: 2014 TNS US Device Study, **Health = hearing aids and electronic toothbrushes.
*2Battery Consumption represents Total # Batteries Required per device divided by Total # Batteries Required by all devices Base: All household battery-powered devices.
22
|
New devices that use primary batteries are emerging
Further opportunities for our categories
EMERGING DEVICE CATEGORIES
23
|
Our agenda for today
Who We Are
Why We’ll Win
How We’ll Deliver
Long-Term Value
New Energizer’s Value Proposition
Our Brands and Global Leadership Position
Lead with Innovation Operate with Excellence Drive Productivity Gains
Focused on Free Cash Flow
Committed to Returning Cash to Shareholders Dedicated to Enhancing Value for the Long Term
24
|
We’re a global household products company with a unified direction …
Mission Strategic Priorities
Connect our
brands, our Lead Operate Drive
people and the with with Productivity
products we
offer to the world Innovation Excellence Gains
better than anyone else
Focus on maximizing cash flows, and Objective deliver long-term value to our shareholders, customers and consumers
25
|
… and financial objectives aligned with our business strategies
Topline
Grow ahead of the category
Margins
Maintain or Improve
SG&A
% of Sales
Maintain or Improve
EBITDA
Low single digit growth
Working Capital
11% to 13%
of sales
Free Cash Flow
10% to 12%
of sales
How we manage our business will tie
to our corporate strategy and financial objectives
26
|
Energizer has a clear strategy to drive value creation
WHERE WE’LL PLAY
Customers Markets
Categories
HOW WE’LL WIN
1 |
| Achieve leading distribution |
2 |
| Drive top-tier consumer preference and conversion |
3 |
| Relentlessly focus on cost savings and productivity gains |
4 |
| Operate with excellence |
5 |
| Build a team for long-term success |
27
|
We’re a global household products company with a unified direction
Mission
Connect our brands, our people and the products we offer to the world better than anyone else
Lead
with Innovation
Strategic Priorities
Operate Drive
with Productivity Excellence Gains
Objective
Focus on maximizing cash flows, and deliver long-term value to our shareholders, customers and consumers
28
|
Our mandate for winning in power and light
Giving consumers a better overall performance
BATTERIES
LIGHTS
Long
AND RESPONSIBILITY
Lasting
RELIABILITY
QUALITY
Bright AND LONG LASTING QUALITY
DURABLE
USER FRIENDLY
29
|
Through consumer insights, we identify needs and bring innovative solutions to our categories better than anyone
Max
Long Lasting AND In Device Leakage Protection
EcoAdvanced
Our Longest Lasting AND World’s 1st Battery Made With Recycled Batteries
Lithium
The world’s longest-lasting
AA and AAA batteries in high-tech devices AND
20-year shelf life
Light Fusion
Bringing bright AND Advanced optics technology to re-disperse light for vibrant, uniform experience
World’s 1st batteries made with: Our product portfolio is differentiated, delivering
Zero Mercury “long lasting” … “AND” … with more to come
30
|
We’ve extended our powerful brands through strategic licensing partnerships to broader categories
Lighting Batteries Connecting Charging
Solar Bulbs Automotive Automotive Cables Household Batteries Chargers/Inverters
Photo Accessories
& Batteries Gaming Chargers USB Chargers
Gas-Powered Generators
Powerbanks
31
|
Investing in innovation maximizes category value
Drives our topline performance and improves our brand equity
GLOBAL ADVERTISING & PROMOTION SPEND
(as percent of sales)
6.6% 6.3%
5.3%
2012 2013 2014
ENR GLOBAL VALUE SHARE
+1.2
+0.5
Last 52 weeks Last 12 weeks
ENR U.S.
VALUE SHARE
+1.6
+1.3
Last 52 weeks Last 12 weeks
Innovation and investments are improving our brand equity
Source: Form 10 data, Nielsen US xAOC TOTAL BATTERIES 52-weeks ending 5-9-15 ; Global, Nielsen Global Track, 52-weeks ending March 2015.
32
|
We’re a global household products company with a unified direction
Mission Strategic Priorities
Connect our
brands, our Lead Operate Drive
people and the with with Productivity
products we
offer to the world Innovation Excellence Gains
better than anyone else
Focus on maximizing cash flows, and Objective deliver long-term value to our shareholders, customers and consumers
33
|
We create value for our channel partners
PROFITABLE LARGE-SCALE
HIGH BASKET HOUSEHOLD BUILDER PENET RAT ION
Battery category is one of the largest and most profitable at retailers.
Batteries can be found in more than 80% of all U.S. households. Batteries provide healthy margins and are a basket builder for retailers.
Source: Nielsen xAOC Strategic Planner 52 weeks ending 5-16-15 and 12-31-14.
34
|
Source: Form 10 and internal data.
We have a large and diversified channel/customer base
Our products are delivered across retail trade channels
BROAD, DIVERSE DISTRIBUTION
Sporting DIY
Goods Military
Traditional Online Trade
Food/ Hobby/ Drug/
Craft Energizer Mass
Con- Club venience
Office Dollar Home Auto Center
ENR GLOBAL SALES BY CUSTOMER
(percent of net sales in 2014)
76%
24%
Top 5
All Other
No single customer accounts for >10% of sales
Top 5 customers are <25% of sales
No customers in the top 10 are exclusive
35
|
We will continue to invest and deliver best-in-class category execution
Our products are sold in multiple locations throughout the store
Best-in-class category execution
CUSTOMER ENGAGEMENT
EXECUTION
VISIBILITY
SHOPPER BASED CATEGORY SOLUTIONS FUNDAMENTALS
36
|
We’re a global household products company with a unified direction
Mission
Connect our brands, our people and the products we offer to the world better than anyone else
Lead
with Innovation
Strategic Priorities
Operate
with
Excellence
Drive
Productivity Gains
Focus on maximizing cash flows, and Objective deliver long-term value to our shareholders, customers and consumers
37
|
We’ve significantly reduced our working capital needs, improving cash flow
WORKING CAPITAL
(as percent of sales, average trailing four quarters)
2011 22.9%
2012 20.0%
Freed up
2013 15.8%
~ $ 185
2014 12.7%
million in cash flow from 2011-2014
Reduced working capital requirements by 10.2 percentage points since 2011 Led by significant improvements in DSO and DPO
Source: internal data.
38
|
Our efforts to date have led to significant cost savings
Household Products’ cumulative restructuring savings
~ $185 million >$210 million
through FY2014 through 3/31/15
Source: internal data.
39
|
These restructuring efforts have helped enhance our healthy margins
HOUSEHOLD PRODUCTS GROSS MARGIN
(as percent of sales)
+430 46.2%
basis points
41.9% + 200 bps
+ 90 bps
2011 2012 2013 2014
Adjusted manufacturing footprint to reduce duplication Streamlined global supply chain Created center-led purchasing function Rationalized and streamlined product portfolio and centralized marketing
Will continue to evaluate and implement opportunities to optimize our cost structure and enhance margins
Source: Form 10 data.
40
|
Global areas of focus to drive productivity gains
1 |
| Trade investment |
2 |
| Working capital management |
Global Areas
of Focus 3 SG&A optimization
4 |
| Procurement |
5 |
| Integrated supply chain |
41
|
Our agenda for today
• |
| New Energizer’s Value Proposition |
Who We Are
• |
| Our Brands and Global Leadership Position |
• |
| Lead with Innovation Why We’ll Win Operate with Excellence |
• |
| Drive Productivity Gains |
• |
| Focused on Free Cash Flow |
How We’ll Deliver
• |
| Committed to Returning Cash to Shareholders |
Long-Term Value
• |
| Dedicated to Enhancing Value for the Long Term |
42
|
Our efforts to date have made us a leading cash flow generator
HOUSEHOLD PRODUCTS FREE CASH FLOW
(as percent of sales, prior fiscal three-year average)
Peer 1 14.0
EHP* 12.6 Peer 2 10.4
Peer 3 9.8 Peer 4 7.4 Peer 5 7.2 Peer 6 6.3 Peer 7 6.2 Peer 8 5.2
Healthy gross margins
Successful reductions in working capital Low capital expenditure requirements Strong free cash flow
Source: ENR and peer SEC filings.
Note: Peers comprised of the follow ing household products companies (in alpha order): CHD, CLX, HELE, NWL, SMG, SPB, TUP, WD40.
43
|
We will be prudent stewards of capital
Disciplined approach to capital allocation
Deliver VALUE
Selective,
Reinvest in Return of
Disciplined our business capital
M&A
Maximize Free Cash Flow
Relentless focus on delivering value to shareholders, customers and consumers
Pillars to our success
Our foundation
44
|
Our key takeaways
Execute our game plan
Build for long-term success
Deliver long-term value to shareholders, customers and consumers
Lead with innovation Operate with excellence
Drive productivity gains
First fiscal year is a year of transition Remain focused on maximizing cash flow
Reinvest in the business Return cash to shareholders
Evaluate strategic opportunities for growth
45
|
Why we’re excited to be a part of the new Energizer
46
|
The New Energizer
MARK LAVIGNE
Chief Operating Officer
47
|
We’re building upon our rich legacy to craft the next chapter as a standalone company
Proactive in improving the way we operate and how we perform
Leverage the separation as a catalyst to better prepare our business to win
Provide clear focus and solid foundation to achieve our goals
48
|
We’re focused on profitable share growth by winning in key markets and with key customers
SEGMENT NET SALES
(% of FY14 net sales) 1.8
$
Billion
19%
49%
23%
9%
North America Latin America Europe, Middle East, Asia-Pacific (LATAM) Africa (EMEA)
Half of our sales are generated outside North America Focused on our core global markets, customers and categories to drive profitable share growth
Markets where we have scale
Customers that create win-win partnerships
Source: Form 10 data.
49
|
We’re also re-aligning the new organization to best serve our markets based on size and scale
FY14 SEGMENT PROFIT MARGIN
NORTH AMERICA 29%
ASIA-PACIFIC 28%
EMEA 15%
LATAM 16%
DRIVERS
• |
| Scale |
• |
| Premium brands |
• |
| Modern Trade |
• |
| Dual brands |
• |
| Significant share |
• |
| Private label penetration |
• |
| Complexity |
• |
| Carbon zinc |
• |
| High inflation |
Source: Form 10 data.
50
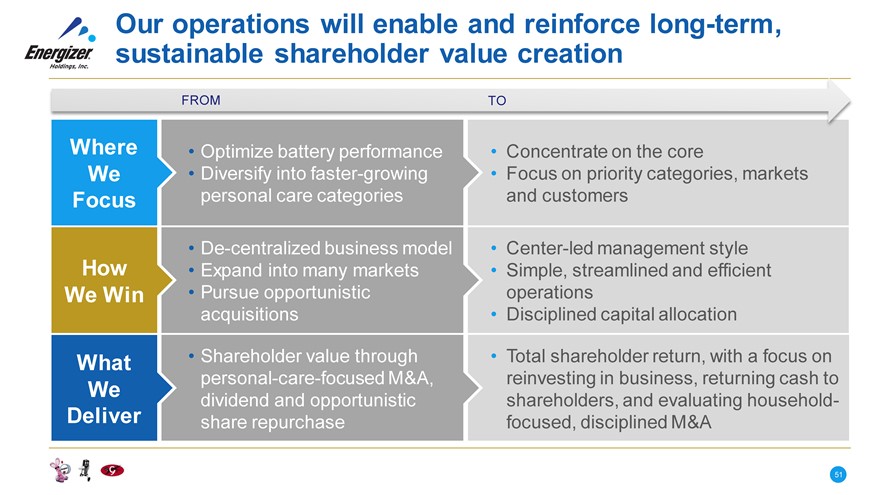
Our operations will enable and reinforce long-term, sustainable shareholder value creation
FROM TO
Where • Optimize battery performance • Concentrate on the core
We • Diversify into faster-growing • Focus on priority categories, markets
Focus personal care categories and customers
• De-centralized business model • Center-led management style
How • Expand into many markets • Simple, streamlined and efficient
We Win • Pursue opportunistic operations
acquisitions • Disciplined capital allocation
What • Shareholder value through • Total shareholder return, with a focus on
personal-care-focused M&A, reinvesting in business, returning cash to
We dividend and opportunistic shareholders, and evaluating household-
Deliver share repurchase focused, disciplined M&A
51
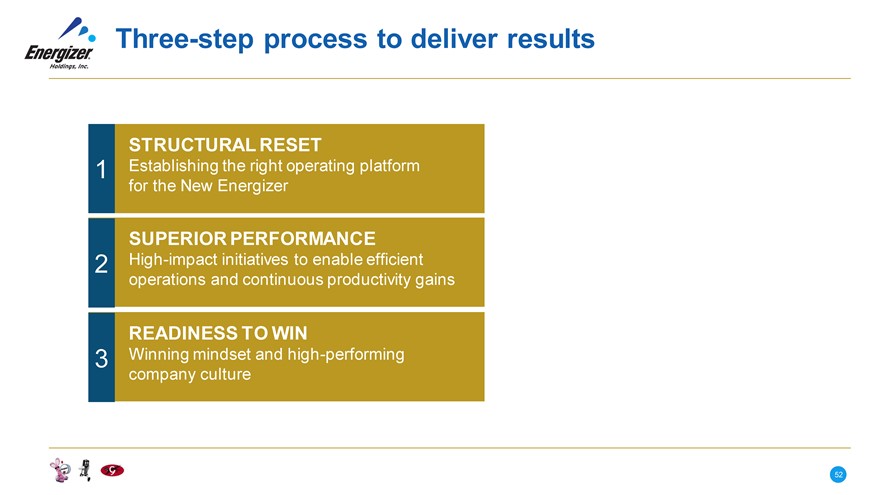
Three-step process to deliver results
STRUCTURAL RESET
1 Establishing the right operating platform for the New Energizer
SUPERIOR PERFORMANCE
2 High-impact initiatives to enable efficient operations and continuous productivity gains
READINESS TO WIN
3 Winning mindset and high-performing company culture
52
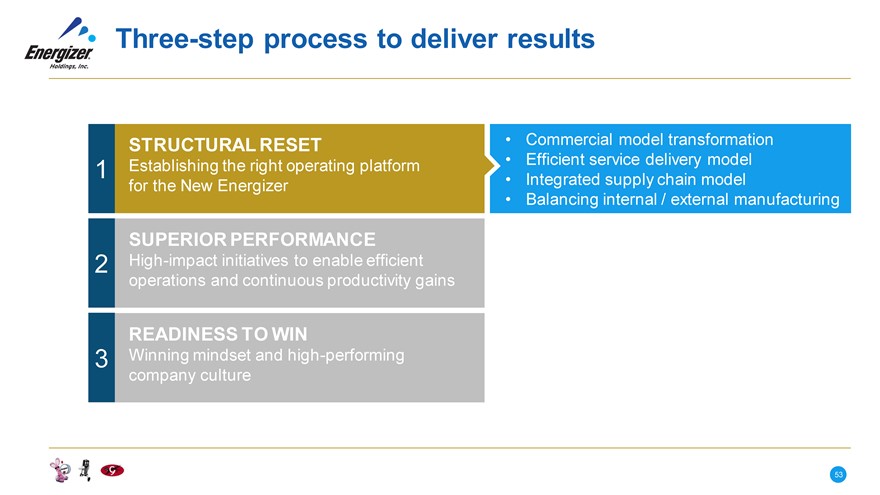
Three-step process to deliver results
STRUCTURAL RESET • Commercial model transformation
1 Establishing the right operating platform • Efficient service delivery model
for the New Energizer • Integrated supply chain model
• Balancing internal / external manufacturing
SUPERIOR PERFORMANCE
2 High-impact initiatives to enable efficient
operations and continuous productivity gains
READINESS TO WIN
3 Winning mindset and high -performing
company culture
53
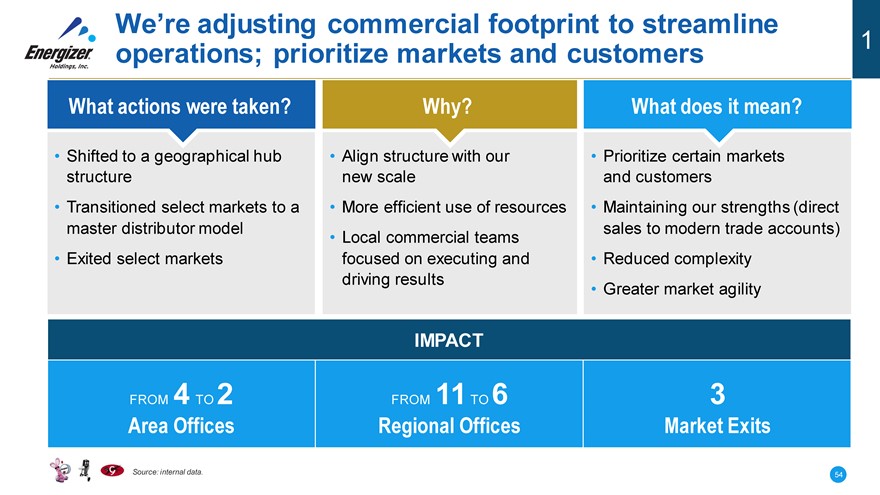
We’re adjusting commercial footprint to streamline operations; prioritize markets and customers
1
What actions were taken Why What does it mean
• Shifted to a geographical hub • Align structure with our • Prioritize certain markets
structure new scale and customers
• Transitioned select markets to a • More efficient use of resources • Maintaining our strengths (direct
master distributor model sales to modern trade accounts)
• Local commercial teams
• Exited select markets focused on executing and • Reduced complexity
driving results • Greater market agility
IMPACT
FROM 4 TO 2 FROM 11 TO 6 3
Area Offices Regional Offices Market Exits
Source: internal data.
54
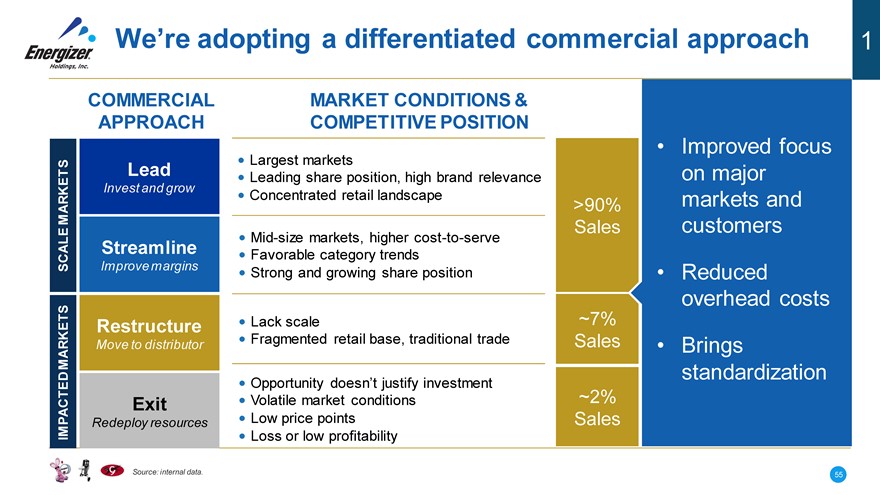
We’re adopting a differentiated commercial approach 1
COMMERCIAL MARKET CONDITIONS &
APPROACH COMPETITIVE POSITION
• Improved focus
• Largest markets
Lead • Leading share position, high brand relevance on major
Invest and grow • Concentrated retail landscape markets and
MARKETS >90%
• Mid-size markets, higher cost-to-serve Sales customers
Streamline • Favorable category trends
SCALE Improve margins • Strong and growing share position • Reduced
overhead costs
Restructure • Lack scale ~7%
MARKETS Move to distributor • Fragmented retail base, traditional trade Sales • Brings
• Opportunity doesn’t justify investment standardization
Exit • Volatile market conditions ~2%
IMPACTED Redeploy resources • Low price points Sales
• Loss or low profitability
Source: internal data.
55
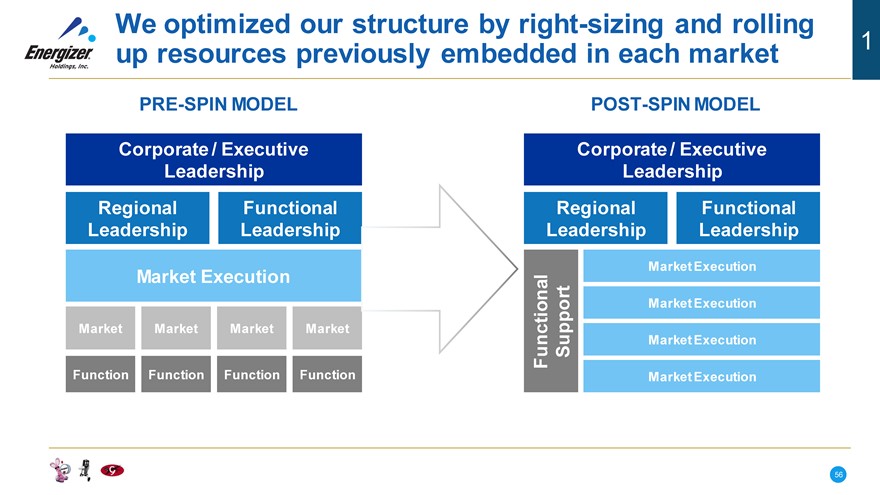
We optimized our structure by right-sizing and rolling
1
up resources previously embedded in each market
PRE-SPIN MODEL
Corporate / Executive
Leadership
Regional Functional
Leadership Leadership
Market Execution
Market Market Market Market
Function Function Function Function
POST-SPIN MODEL
Corporate / Executive
Leadership
Regional
Functional
Leadership
Leadership
Market Execution
Market Execution
Functional Support
Market Execution
Market Execution
56
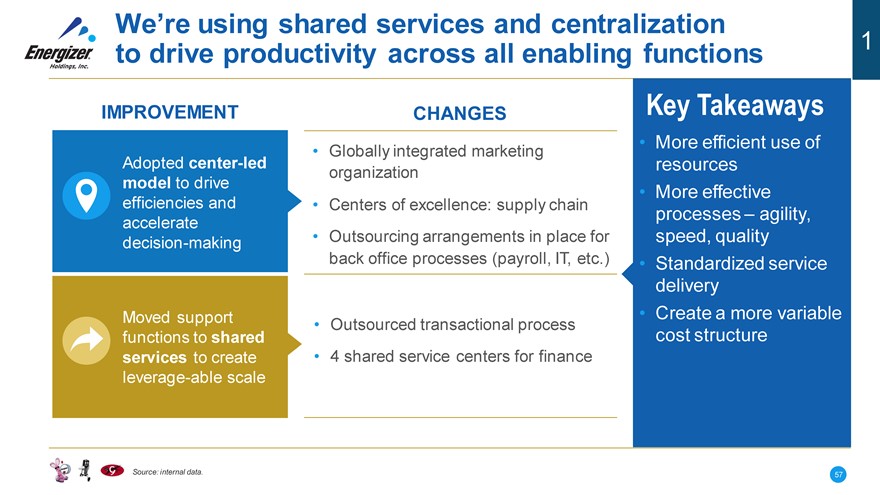
We’re using shared services and centralization
to drive productivity across all enabling functions 1
IMPROVEMENT
Adopted center-led model to drive efficiencies and accelerate decision-making
Moved support functions to shared services to create leverage-able scale
CHANGES
• Globally integrated marketing organization
• Centers of excellence: supply chain
• Outsourcing arrangements in place for back office processes (payroll, IT, etc.)
• Outsourced transactional process
• 4 shared service centers for finance
Key Takeaways
• More efficient use of
resources
• More effective
processes – agility,
speed, quality
• Standardized service
delivery
• Create a more variable
cost structure
Source: internal data.
57
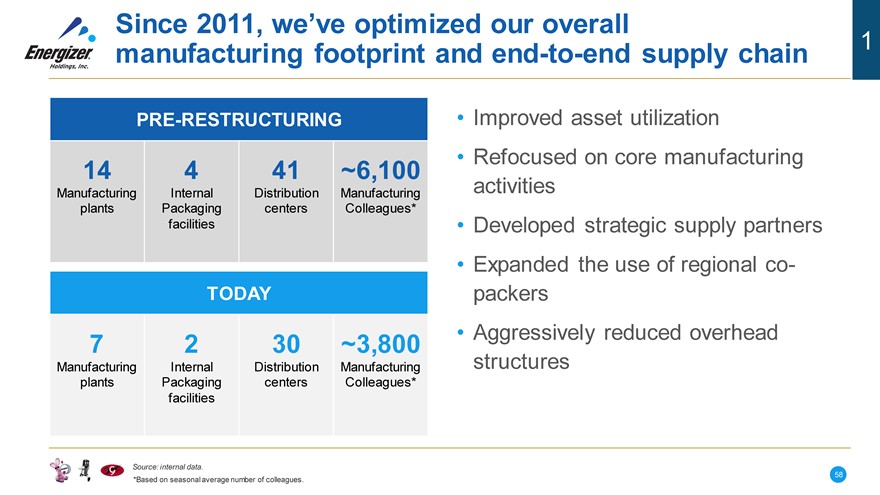
Since 2011, we’ve optimized our overall
1
manufacturing footprint and end-to-end supply chain
PRE-RESTRUCTURING
14 4 41 ~6,100
Manufacturing Internal Distribution Manufacturing plants Packaging centers Colleagues* facilities
TODAY
7 2 30 ~3,800
Manufacturing Internal Distribution Manufacturing plants Packaging centers Colleagues* facilities
Improved asset utilization
Refocused on core manufacturing activities
Developed strategic supply partners
Expanded the use of regional co- packers
Aggressively reduced overhead structures
Source: internal data.
*Based on seasonal average number of colleagues.
58
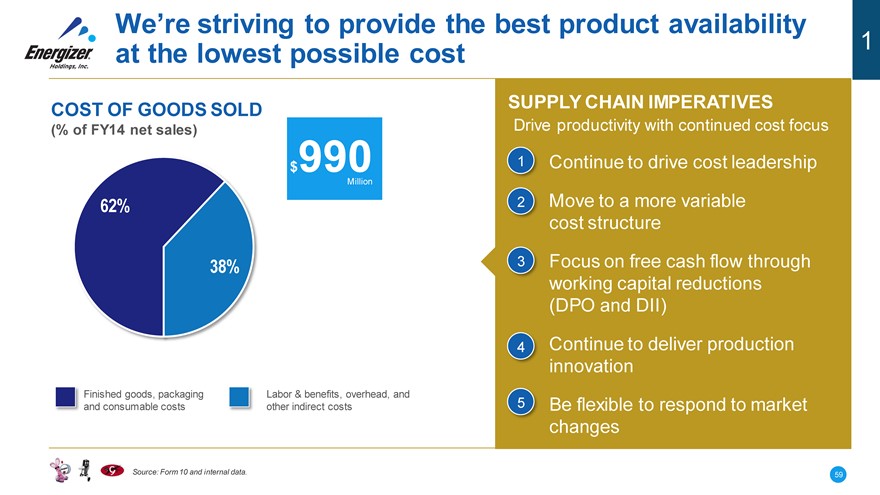
We’re striving to provide the best product availability
1
at the lowest possible cost
COST OF GOODS SOLD
(% of FY14 net sales)
$990
Million
62%
38%
Finished goods, packaging Labor & benefits, overhead, and
and consumable costs other indirect costs
SUPPLY CHAIN IMPERATIVES
Drive productivity with continued cost focus
1 Continue to drive cost leadership
2 Move to a more variable cost structure
3 Focus on free cash flow through working capital reductions (DPO and DII)
4 Continue to deliver production innovation
5 Be flexible to respond to market changes
Source: Form 10 and internal data.
59
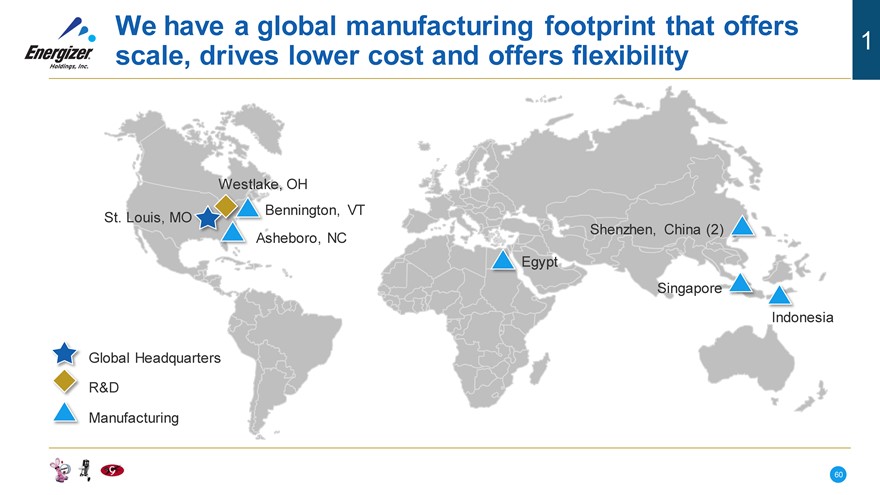
We have a global manufacturing footprint that offers
1
scale, drives lower cost and offers flexibility
Westlake, OH
Bennington, VT St. Louis, MO
Shenzhen, China (2) Asheboro, NC
Egypt
Singapore
Indonesia
Global Headquarters
R&D
Manufacturing
60
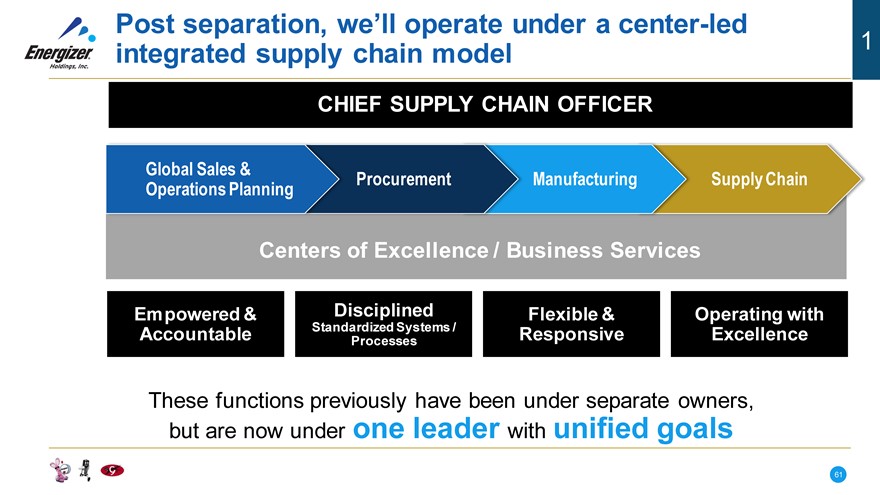
Post separation, we’ll operate under a center-led integrated supply chain model
1
CHIEF SUPPLY CHAIN OFFICER
Global Sales & Procurement Manufacturing Supply Chain
Operations Planning
Centers of Excellence / Business Services
Empowered & Disciplined Flexible & Operating with
Accountable Standardized Processes Systems / Responsive Excellence
These functions previously have been under separate owners,
but are now under one leader with unified goals
61
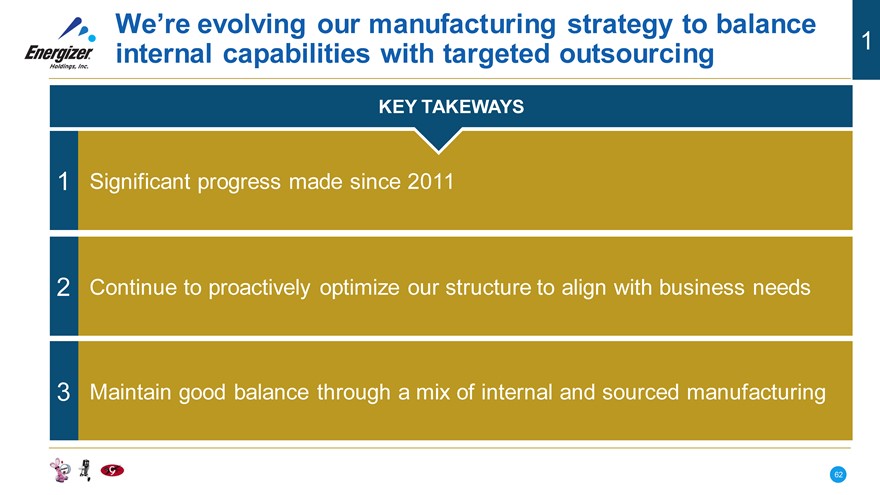
We’re evolving our manufacturing strategy to balance
1
internal capabilities with targeted outsourcing
KEY TAKEWAYS
1 Significant progress made since 2011
2 Continue to proactively optimize our structure to align with business needs
3 Maintain good balance through a mix of internal and sourced manufacturing
62
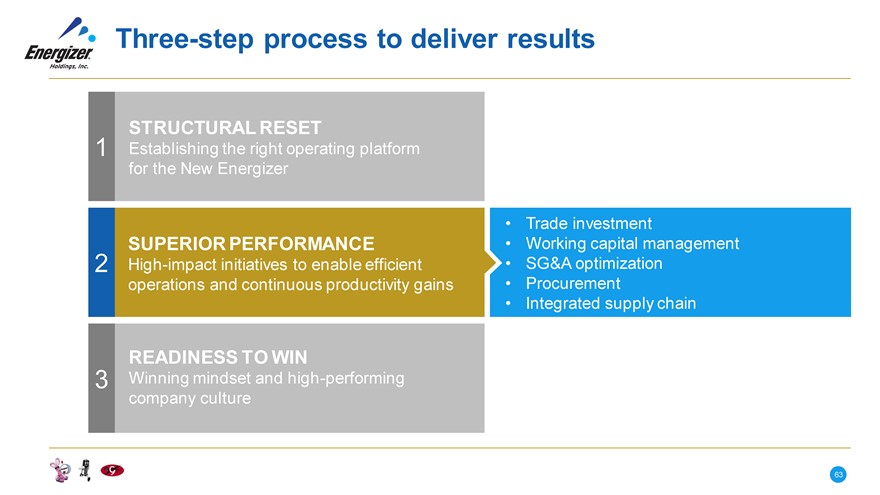
Three-step process to deliver results
STRUCTURAL RESET
1 Establishing the right operating platform for the New Energizer
• Trade investment
SUPERIOR PERFORMANCE • Working capital management
2 High-impact initiatives to enable efficient • SG&A optimization operations and continuous productivity gains • Procurement
• Integrated supply chain
READINESS TO WIN
3 Winning mindset and high-performing company culture
63
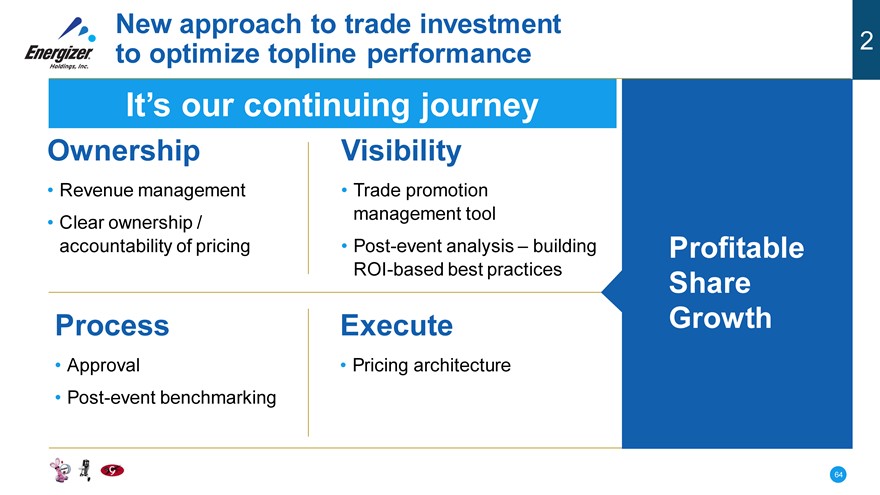
New approach to trade investment
2
to optimize topline performance
It’s our continuing journey
Ownership Visibility
• Revenue management • Trade promotion
• Clear ownership / management tool
accountability of pricing • Post-event analysis – building Profitable
ROI-based best practices Share
Process Execute Growth
• Approval • Pricing architecture
• Post-event benchmarking
64
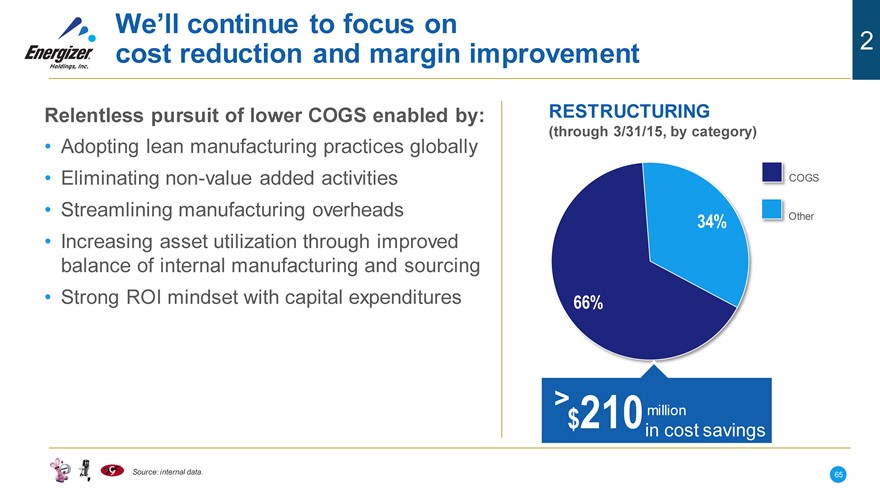
We’ll continue to focus on
2
cost reduction and margin improvement
Relentless pursuit of lower COGS enabled by:
• Adopting lean manufacturing practices globally
• Eliminating non-value added activities
• Streamlining manufacturing overheads
• Increasing asset utilization through improved balance of internal manufacturing and sourcing
• Strong ROI mindset with capital expenditures
RESTRUCTURING
(through 3/31/15, by category)
COGS
34% Other
66%
> $210 million
in cost savings
Source: internal data.
65
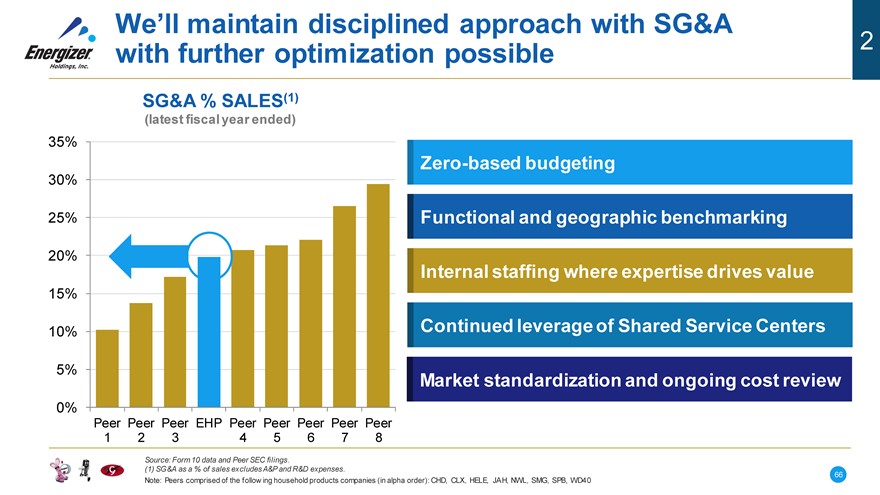
We’ll maintain disciplined approach with SG&A
2
with further optimization possible
SG&A % SALES(1)
(latest fiscal year ended)
35%
30%
25%
20%
15%
10%
5%
0%
Peer Peer Peer EHP Peer Peer Peer Peer Peer
1 2 3 4 5 6 7 8
Zero-based budgeting
Functional and geographic benchmarking Internal staffing where expertise drives value Continued leverage of Shared Service Centers Market standardization and ongoing cost review
Source: Form 10 data and Peer SEC filings.
(1) SG&A as a % of sales excludes A&P and R&D expenses.
Note: Peers comprised of the follow ing household products companies (in alpha order): CHD, CLX, HELE, JAH, NWL, SMG, SPB, WD40
66
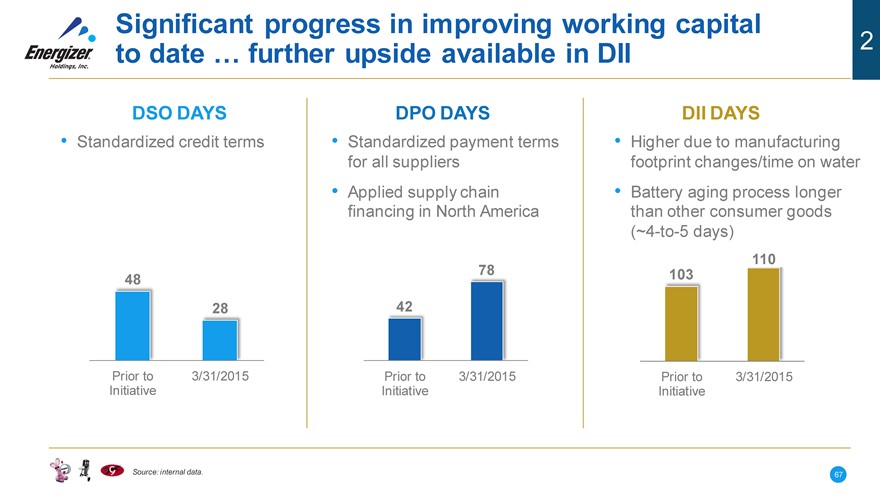
Significant progress in improving working capital
2
to date … further upside available in DII
DSO DAYS DPO DAYS DII DAYS
• Standardized credit terms • Standardized payment terms • Higher due to manufacturing
for all suppliers footprint changes/time on water
• Applied supply chain • Battery aging process longer
financing in North America than other consumer goods
(~4-to-5 days)
110
48 78 103
28 42
Prior to 3/31/2015 Prior to 3/31/2015 Prior to 3/31/2015
Initiative Initiative Initiative
Source: internal data.
67
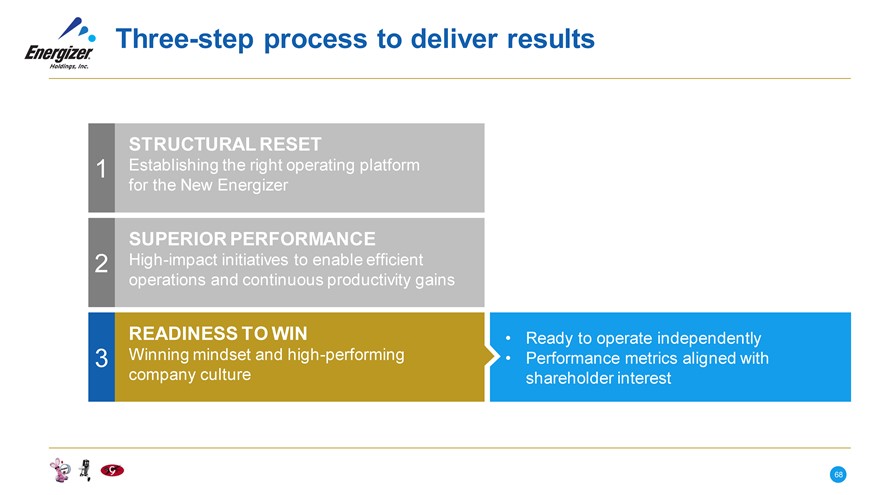
Three-step process to deliver results
STRUCTURAL RESET
1 Establishing the right operating platform
for the New Energizer
SUPERIOR PERFORMANCE
2 High-impact initiatives to enable efficient
operations and continuous productivity gains
READINESS TO WIN • Ready to operate independently
3 Winning mindset and high -performing • Performance metrics aligned with
company culture shareholder interest
68
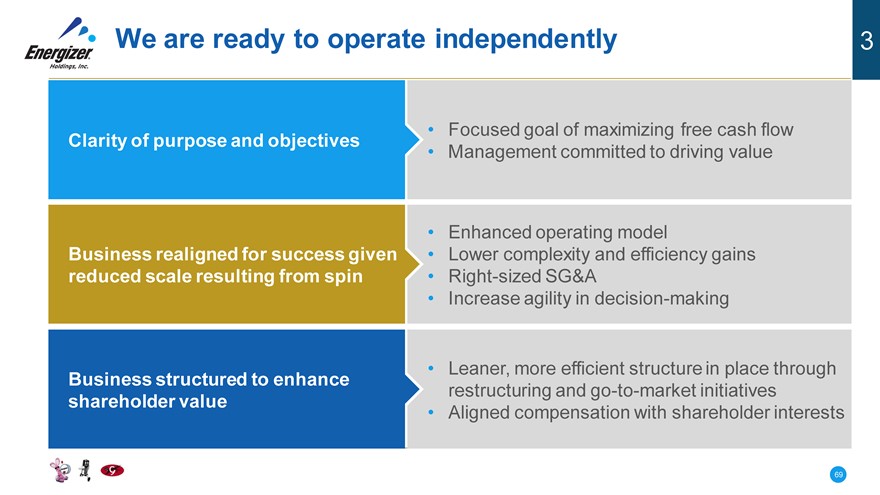
We are ready to operate independently 3
Clarity of purpose and objectives • Focused goal of maximizing free cash flow
• Management committed to driving value
• Enhanced operating model
Business realigned for success given • Lower complexity and efficiency gains
reduced scale resulting from spin • Right-sized SG&A
• Increase agility in decision-making
Business structured to enhance • Leaner, more efficient structure in place through
restructuring and go-to-market initiatives
shareholder value • Aligned compensation with shareholder interests
69
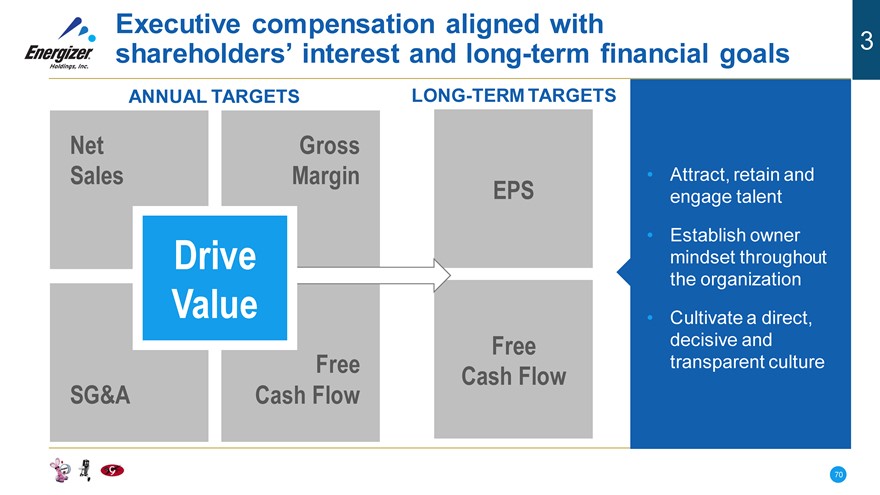
Executive compensation aligned with
3
shareholders’ interest and long-term financial goals
ANNUAL TARGETS LONG-TERM TARGETS
Net Gross
Sales Margin • Attract, retain and
EPS engage talent
• Establish owner
Drive mindset throughout
the organization
Value • Cultivate a direct,
Free decisive and
Free transparent culture
Cash Flow
SG&A Cash Flow
70
|
Key takeaways
Many accomplishments Leveraged the separation as a catalyst to in the past year better prepare our business to win
Have been and Constantly improving the way we operate
will continue to be proactive and our business performance
We will attain our goals Our focus is clear and the foundation is in place
71
|
The New Energizer
BRIAN HAMM
Chief Financial Officer
|
The creation of a new Energizer
Tax-free spin to shareholders; begin trading independently on July 1 1-for-1 ratio: receive 1 new ENR share for every 1 parent co share held Retain Energizer Holdings, Inc. name and ENR ticker symbol
“When-issued” trading expected to begin in mid-June
New Energizer to ring opening bell at NYSE on July 2
73
|
Our agenda for today
Track record of delivering cost savings Transition period as we separate Driving value as a standalone company Our capital structure and allocation strategies
74
|
Our agenda for today
Track record of delivering cost savings Transition period as we separate Driving value as a standalone company Our capital structure and allocation strategies
75
|
Our track record of delivering cost savings provides a strong foundation
RESTRUCTURING WORKING CAPITAL FREE CASH FLOW
(through 3/31/15, by category) (from FY11-FY14, by driver) (from FY12-FY14)
~ ~
> $210M of cost savings $185M cash flow improvement $750M cumulative free cash flow
16% 15.5%
48%
11.8%
18% 49% 10.4%
66%
COGS SG&A Other DPO DII DSO
FY12 FY13 FY14
Led to 430 basis points of Led to 10.2 percentage point ENR delivers top-tier free cash
gross margin improvement reduction in working capital flow among household peers
Source: Form 10 and internal data. See appendix for free cash flow reconciliation.
76
|
We’re aiming to offset our share of spin-related dis-synergies
Parent Co. dis-synergies of $65 - $85 million.
New Energizer expected to incur roughly one half of total.
Aiming to offset dis-synergies in 3-to-4 quarters post spin via these focus areas:
COMMERCIAL SHARED SERVICE CENTERS OUTSOURCING NON-CORE
ADMIN. ACTIVITIES
Goals ? Standardize ? Standardize
? Cost savings ? Create scale ? Standardize
? Cost savings ? Cost savings
? 50% reduction ? From 27 accounting teams ? Accounts payable
in area offices to 4 shared service centers ? T&E
Actions ? 45% reduction ? Payroll processing
in regional
offices ? IT help desk and application support
Source: internal data.
77
|
Additional cost saving opportunities will further enhance our cash flow
Trade Investment Integrated
? Revenue management team Supply Chain Our goal is to
SG&A
? Installing trade promotion ? Internal manufacturing deliver
management solution vs. sourcing Optimization
? Disciplined pricing ? Capacity utilization ? Process continuous
architecture ? Cost reduction standardization improvement in
? Go-to-market productivity,
changes reduce costs &
? Shared service
Center-Led Working Capital - centers maximize
Procurement Days in Inventory ? Outsourcing
? Create leverage-able scale Reduction ? Zero-based free cash
? Drive further cost ? SKU optimization budgeting
improvements ? Forecasting accuracy ? Benchmarking flow
? Optimize DPO ? Global supply
governance structure
78
|
Our agenda for today
Track record of delivering cost savings Transition period as we separate Driving value as a standalone company Our capital structure and allocation strategies
79
|
We’re committed to providing relevant data in the interim, and expect normalized reporting starting with Q4/FY15
August 2015 November 2015
FISCAL THIRD QUARTER FISCAL FOURTH QUARTER
2015 RESULTS / FULL YEAR 2015 RESULTS
• Earnings release focused on • Fourth quarter will include
net sales, segment profit, actual standalone results
brand investments and fourth - Additional costs expected
quarter outlook during “stabilization period”
• 10Q will contain carve-out • FY16 outlook to be provided
financials as part of our Q415 earnings
release and call
80
|
Topline adjustments anticipated
ADJUSTED ANNUALIZED NET SALES BASE
NORMAL VARIABILITY DUE TO
$1.8B
• Storms
• Timing of holiday shipments
• Distribution gains and losses
($95-$100M) ~$1.6B
($21M) • New product launches
($45-50M)
INCREMENTAL ADJUSTMENTS
FOR
• Currency
• Venezuela deconsolidation
• Go-to-market changes
LTM Net Sales Currency Venezuela Go-To-Market Adj. Base
3/31/15 Changes
Source: company estimates.
Market changes reflect decision to move to distributors in certain markets or exit altogether.
81
|
EBITDA base will also be reset
ADJUSTED ANNUALIZED EBITDA* BASE
$392M
+$0-$5M $310-$325M
($55-$60M)
($9M) ($10-$15M)
LTM EBITDA Currency Venezuela Corporate Go- To- Market Adj. Base
3/31/15 Costs Changes
Gross margin negatively impacted 300-400 basis points due to currency, Venezuela and go-to- market changes
Does not include additional temporary dis-synergy costs expected to be offset 3-4 quarters post-spin
Source: company estimates.
Market changes reflect decision to move to distributors in certain markets or exit altogether.
*Exclusive of unusual items, non-GAAP reconciliation in appendix.
82
|
Capital expenditures for standalone household products to remain relatively modest
DIVISIONAL CAPITAL SPENDING CAPITAL SPENDING OUTLOOK
($ in millions, excludes corporate and IT) (percent of total, includes corporate and IT)
$38 20% $35- $45
$32 Million
$28 65%
15%
$18
Maintenance Efficiency Product
FY’12 FY’13 FY’14 LTM (3/31/15) (including IT) Improvements Development
Source: Form 10 and company estimates.
83
|
Our agenda for today
Track record of delivering cost savings Transition period as we separate Driving value as a standalone company Our capital structure and allocation policies
84
|
We’re executing on our financial goals
EBITDA / Free Cash Flow
• Expand gross margins
• Proactively reduce SG&A costs
• Improve cash conversion cycle
Margin Expansion / reduce working capital
Revenue • Grow share profitably • Efficiently spend capital
• Leverage center-led
• Bring innovation procurement organization
• Optimize trade • Proactively reduce cost
investment spending to manufacture
• Enhance product mix and
trade-up strategies
• Grow share profitably
85
|
We’re confident in our ability to achieve long-term financial targets
METRIC LONG-TERM TARGET
Revenue Revenue growth rate at or above category
EBITDA Consistent low single digit growth
Tax Rate Corporate rate now in the range of 31% to 33%
Capital Expenditures In the range of $35 million to $45 million
Free Cash Flow Generate free cash flow between 10% to 12% of sales
(% of Sales)
Dividends Meaningful and competitive dividend, subject to
Board approval
86
|
Our agenda for today
Track record of delivering cost savings Transition period as we separate Driving value as a standalone company Our capital structure and allocation strategies
87
|
Our strong balance sheet supports growth and return of capital
Summary Capitalization
($M Pro-Forma)
Cash (minimum) $300
Total Debt $1,020 Availability under $230 $250M Revolver
$300 million (minimum) in offshore cash
Revolver capacity provides incremental financial flexibility
Annual cash flow generation should support anticipated future cash needs of the business
$1,000M in cash proceeds from ENR debt raise will fund payment to the parent prior to spin
88
|
Flexible capital structure ensures low borrowing costs with no near-term maturities
DEBT MATURITY LADDER
(notional amounts)
$600M
Unsecured Notes
$400M
Term Loan
B
$250M
Revolver
2020
2022
2025(1)
• Availability under revolver
to provide liquidity
• Covenant-lite Term Loan B
• Unsecured notes provide
attractive fixed rate
financing for 10 years
• Strong BB / Ba2
credit rating
• Weighted average
borrowing costs under 5%
(1) Bonds callable in 2020.
89
|
We will pursue a prudent capital allocation policy to drive long-term shareholder value
Reinvest in Dividend and
Selective / the Business Opportunistic Disciplined Share
(Including Productivity M&A Improvements) Repurchases
90
|
We’re taking the right steps to reinvest in the business to drive long-term shareholder value
Support Drive Further Invest in Systems/
Revenue Cost Savings Processes/People
? R&D and A&P spend to ? Reduce manufacturing ? Trade promotion
support innovation costs management tool
? Maintain and grow ? Simplify and create ? SAP in key markets
healthy margins shared service centers ? Training and
to drive efficiency
? Grow share profitably development
? Relentless pursuit of
cost savings to fund re-
investment opportunities
91
|
Meaningful return of capital to shareholders remains a top priority for new Energizer
DIVIDEND PAYOUT DIVIDEND SHARE REPURCHASE
~45% • $1/share annually
~75% • Intend to
• Represents a material opportunistically
increase from parent repurchase shares
51% ~27%
• Focus on maximizing Historically created
cash flow in order to shareholder value by
fund dividend (subject to opportunistically
Board approval, with the buying back stock
expectation to regularly
7.5 million share
review the dividend level authorization (subject
% U.S. % of Adj. with the Board) to Board approval)
Cash Flows Net Income
Parent ENR (FY14) New ENR Proj.
Source: Company estimates.
92
|
When evaluating M&A, we’ll be selective and disciplined in our approach
Prior Parent Criteria New ENR Criteria
• Fast moving consumable goods • Household products or adjacent
categories where we can compete and
• Household/personal care preferred generate superior returns
• Strong brands • Differentiated business models, due to
• #1 or #2 market share brand, technology or distribution
• Global or ability to go global • Complementary products to leverage our
existing global footprint
• Ability to maintain/build margins
• Strong cash flow characteristics … stable
margins, limited capital requirements
• Ability to derive synergies through scale,
operations or enhanced distribution
93
|
Key takeaways for New Energizer
Strong and • Cash and revolver provide adequate liquidity
Flexible
• Strong credit rating
Balance
Sheet • Long-dated maturity profile
Attractive • Track record of taking out costs
Cash Flow • Additional productivity improvement initiatives launched Generation • Top-tier free cash flow performer
Prudent • Reinvest in the business to drive long-term value
Capital • Meaningful and competitive dividend
Allocation • Opportunistic share repurchase program Policy • Selective, disciplined M&A
94
|
Q&A
ALAN HOSKINS MARK LAVIGNE BRIAN HAMM
|
Appendix
96
|
Company Contacts
BRIAN HAMM
Energizer’s Chief Financial Officer
Briank.Hamm@energizer.com
JENNIFER BEATTY, CFA
Energizer’s Vice President –
Investor Relations
Jennifer.Beatty@energizer.com (314) 985-1849
97
|
LTM 3/31/15 % Chg 2014 % Chg 2013 % Chg 2012
Net Sales North America
Net sales - prior year $934.8 $1,041.9 $1,103.4 $1,133.3
Organic ($59.3) -6.3% ($127.2) -12.2% ($61.0) -5.6% ($27.9)
Impact of currency ($5.9) -0.6% ($5.5) -0.5% ($0.5) 0.0% ($2.0)
Net sales - current year $869.6 -7.0% $909.2 -12.7% $1,041.9 -5.6% $1,103.4
Latin America
Net sales - prior year $171.5 $182.0 $183.1 $181.8
Organic $2.2 1.3% $1.0 0.6% $5.7 3.1% $4.7
Venezuela ($4.1) -2.4% ($2.6) -1.4% $1.7 0.9% $4.8
Impact of currency ($17.9) -10.4% ($18.3) -10.1% ($8.5) -4.6% ($8.2)
Net sales - current year $151.7 -11.5% $162.1 -10.9% $182.0 -0.6% $183.1
EMEA
Net sales - prior year $420.5 $423.3 $431.6 $472.9
Organic $5.0 1.2% ($5.6) -1.3% ($2.9) -0.6% ($21.2)
Impact of currency ($27.0) -6.4% $1.4 0.3% ($5.4) -1.3% ($20.1)
Net sales - current year $398.5 -5.2% $419.1 -1.0% $423.3 -1.9% $431.6
Asia Pacific
Net sales - prior year $345.9 $365.0 $369.6 $407.9
Organic $1.3 0.4% ($2.5) -0.7% ($3.0) -0.8% ($30.9)
Impact of currency ($10.4) -3.0% ($12.5) -3.4% ($1.6) -0.4% ($7.4)
Net sales - current year $336.8 -2.6% $350.0 -4.1% $365.0 -1.2% $369.6
Total Net Sales
Net sales - prior year $1,872.7 $2,012.2 $2,087.7 $2,195.9
Organic ($50.8) -2.7% ($134.3) -6.7% ($61.2) -2.9% ($75.3)
Venezuela ($4.1) -0.2% ($2.6) -0.1% $1.7 0.1% $4.8
Impact of currency ($61.2) -3.3% ($34.9) -1.7% ($16.0) -0.8% ($37.7)
Net sales - current year $1,756.6 -6.2% $1,840.4 -8.5% $2,012.2 -3.6% $2,087.7
98
|
2014 % Chg 2013 % Chg 2012
North America
Segment Profit Segment Profit - prior year $307.1 $302.9 $288.2
Operations ($39.2) -12.8% $4.5 1.5% $16.1
Impact of currency ($4.0) -1.3% ($0.3) -0.1% ($1.4)
Segment Profit - current year $263.9 -14.1% $307.1 1.4% $302.9
% of Sales 29.0% 29.5% 27.5%
Latin America
Segment Profit - prior year $32.9 $32.3 $27.6
Operations $4.9 14.9% $6.7 20.7% $6.7
Venezuela $0.1 0.3% ($0.5) -1.5% $2.4
Impact of currency ($11.5) -35.0% ($5.6) -17.3% ($4.4)
Segment Profit - current year $26.4 -19.8% $32.9 1.9% $32.3
% of Sales 16.3% 18.1% 17.6%
EMEA
Segment Profit - prior year $49.9 $50.4 $52.3
Operations $11.5 23.0% $3.7 7.3% $9.1
Impact of currency $0.0 0.0% ($4.2) -8.3% ($11.0)
Segment Profit - current year $61.4 23.0% $49.9 -1.0% $50.4
% of Sales 14.7% 11.8% 11.7%
Asia Pacific
Segment Profit - prior year $98.2 $85.9 $112.2
Operations $7.7 7.9% $13.9 16.2% ($20.7)
Impact of currency ($8.8) -9.0% ($1.6) -1.9% ($5.6)
Segment Profit - current year $97.1 -1.1% $98.2 14.3% $85.9
% of Sales 27.7% 26.9% 23.2%
Total Segment Profit
Segment Profit - prior year $488.1 $471.5 $480.3
Operations ($15.1) -3.1% $28.8 6.1% $11.2
Venezuela $0.1 0.0% ($0.5) -0.1% $2.4
Impact of currency ($24.3) -5.0% ($11.7) -2.5% ($22.4)
Segment Profit - current year $448.8 -8.1% $488.1 3.5% $471.5
% of Sales 24.4% 24.3% 22.6%
99
|
EBITDA and Adjusted EBITDA Reconciliation
LTM 3/31/15 2014 2013 2012
Net Income $75.3 $157.3 $114.9 $187.0
Income Taxes $51.1 $57.9 $47.1 $70.6
EARNINGS BEFORE TAXES $126.4 $215.2 $162.0 $257.6
Interest $50.4 $52.7 $68.1 $68.9
Depreciation & Amortization $46.6 $42.2 $55.9 $56.8
EBITDA (a) $223.4 $310.1 $286.0 $383.3
Adjustments:
Restructuring $1.1 $50.4 $132.6 ($0.3)
Spin costs $90.7 $21.3 $0.0 $0.0
Venezuela Deconsolidation $65.2 $0.0 $0.0 $0.0
Share-based payments $11.7 $13.2 $16.0 $20.7
ADJUSTED EBITDA (a) $392.1 $395.0 $434.6 $403.7
(a) EBITDA is defined as earnings before interest, taxes, depreciation and amortization. Adjusted EBITDA is defined as EBITDA, adjusted to exclude restructuring-related charges, spin-related charges, the Venezuela deconsolidation charge, extraordinary gains and share-based payment costs that we believe are not representative of our core business. These items are identified above in the reconciliation of EBITDA and Adjusted EBITDA to net loss, the most directly comparable GAAP measure. Our definition of EBITDA and Adjusted EBITDA may be different from the calculation used by other companies; therefore, they may not be comparable to other companies.
100
|
Free Cash Flow Reconciliation
3 Year 3 Year
2014 2013 2012 Total Average
Revenue $1,840.4 $2,012.2 $2,087.7 $1,980.1
Operating Cash Flow $219.9 $329.5 $285.3 $278.2
Capital Expenditures ($28.4) ($17.8) ($38.1) ($28.1)
Free Cash Flow (a) $191.5 $311.7 $247.2 $750.4 $250.1
% of Sales 10.4% 15.5% 11.8% 12.6%
(a) Free cash flow is defined as net cash provided by operating activities net of capital expeditures, i .e .
additions to property, plant and equipment.
101