Energizer Holdings Acquisition of HandStands Investor Presentation 1 May 24, 2016 Exhibit 99.2
Safe Harbor Statement 1 This presentation contains “forward looking statements,” including our expectations, estimates or projections concerning future results or events, including, without limitation, the future sales, gross margins, costs, earnings, cash flows and performance of HandStands and Energizer. Such statements are subject to risks and uncertainties that could cause our actual results or performance to differ materially from those expressed in or indicated by such statements. The forward-looking statements are only made as of the date of this presentation and we disclaim any obligation to update them to reflect subsequent events or circumstances. Numerous factors could cause our actual results or performance to differ materially from those expressed or implied by such statements, including: • the risk that a condition to closing of the acquisition may not be satisfied, such as obtaining regulatory approvals; • the ability to integrate the HandStands business successfully and to achieve anticipated cost savings and other synergies; • the possibility that other anticipated benefits of the proposed transaction will not be realized, including without limitation, anticipated revenues, expenses, margins, cash flows, earnings and other financial results, and growth and expansion of our operations; • market trends in the categories in which we compete; • the success of new products and the ability to continually develop and market new products; • our ability to attract, retain and improve distribution with key customers; • our ability to continue planned advertising and other promotional spending; • our ability to timely execute strategic initiatives, including restructurings, in a manner that will positively impact our financial condition and results of operations and does not disrupt our business operations; • the impact of strategic initiatives, including restructurings, on our relationships with employees, customers and vendors; • our ability to maintain and improve market share in the categories in which we operate despite heightened competitive pressure; • our ability to improve operations and realize cost savings; • compliance with debt covenants and maintenance of credit ratings as well as the impact of interest and principal repayment of our existing and any future debt; and • the impact of legislative or regulatory determinations or changes by federal, state and local, and foreign authorities, including taxing authorities. Additional risks and uncertainties include those detailed in our most recent Annual Report on Form 10-K and other SEC filings.

Non-GAAP Financial Measures 2 Energizer reports its financial results in accordance with accounting principles generally accepted in the U.S. ("GAAP"). This presentation includes selected financial information that has not been prepared in accordance with GAAP. Specifically, Energizer used non-GAAP accretion to earnings per share and free cash flow, which excludes transaction and integration related expenses, primarily because Energizer does not believe they are reflective of the company’s core operating results. Energizer believes that these non-GAAP financial measures, when considered in conjunction with the company’s financial information prepared in accordance with GAAP, are useful to investors to further aid in evaluating the ongoing financial performance of Energizer and to provide greater transparency as supplemental information to our GAAP results. Investors should consider non-GAAP measures in addition to, not as a substitute for, or superior to, the comparable GAAP measures. In addition, Energizer’s presentation of these non- GAAP financial measures may not be comparable to the presentation of such metrics by other companies. Finally, Energizer is unable to provide a reconciliation of forward-looking non-GAAP measures because Energizer cannot reliably forecast transaction and integration expenses related to the acquisition, which are difficult to predict and estimate. Please note that the unavailable reconciling items could significantly impact Energizer’s future financial results.
Transaction Summary 3 • Energizer to acquire HandStands from Trivest Partners for $340 million in cash, subject to certain adjustments • HandStands is a leading designer and marketer of innovative automotive fragrance and auto appearance products in the U.S. • Expected to be accretive to EBITDA margins, EPS and free cash flow in the first full fiscal year post-closing, excluding one-time transaction and integration costs • Transaction targeted to close in the fourth fiscal quarter of this year, subject to regulatory approvals and customary closing conditions
Strategic Rationale 4 • Leading brands in the growing automotive fragrance and appearance categories • Strong strategic, operational and cultural fit • Geographic, customer and channel overlap in core markets with the potential for further expansion • Ability to use Energizer’s scale and global supply chain to drive efficiencies • Provides additional earnings and free cash flow that enhance our ability to drive long-term shareholder value
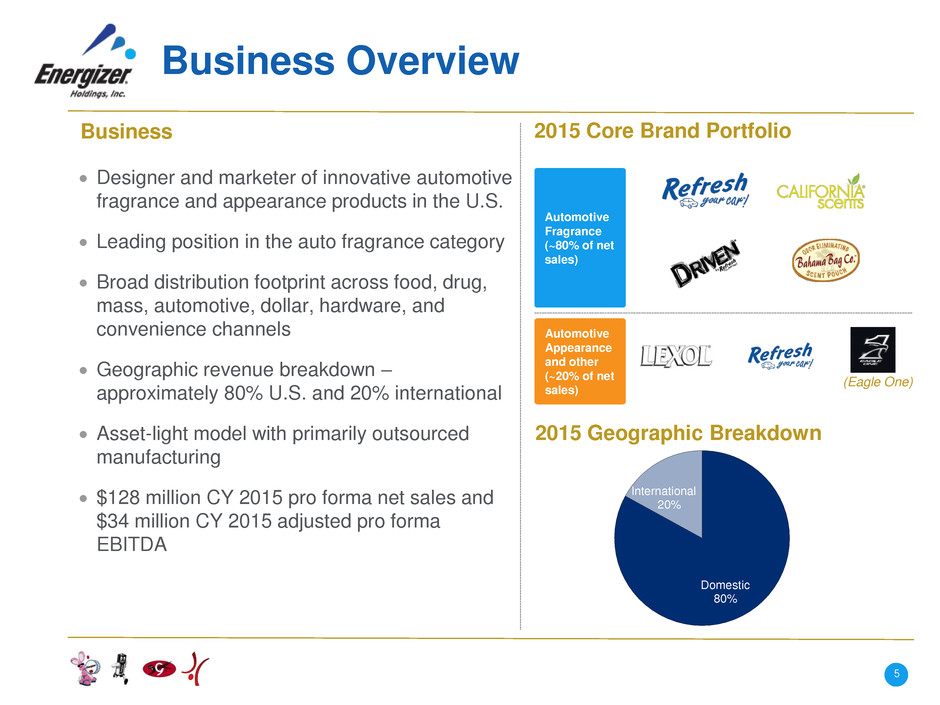
Business Overview Designer and marketer of innovative automotive fragrance and appearance products in the U.S. Leading position in the auto fragrance category Broad distribution footprint across food, drug, mass, automotive, dollar, hardware, and convenience channels Geographic revenue breakdown – approximately 80% U.S. and 20% international Asset-light model with primarily outsourced manufacturing $128 million CY 2015 pro forma net sales and $34 million CY 2015 adjusted pro forma EBITDA Business 2015 Core Brand Portfolio Automotive Fragrance (~80% of net sales) Automotive Appearance and other (~20% of net sales) 2015 Geographic Breakdown 5 (Eagle One) Domestic 80% International 20%
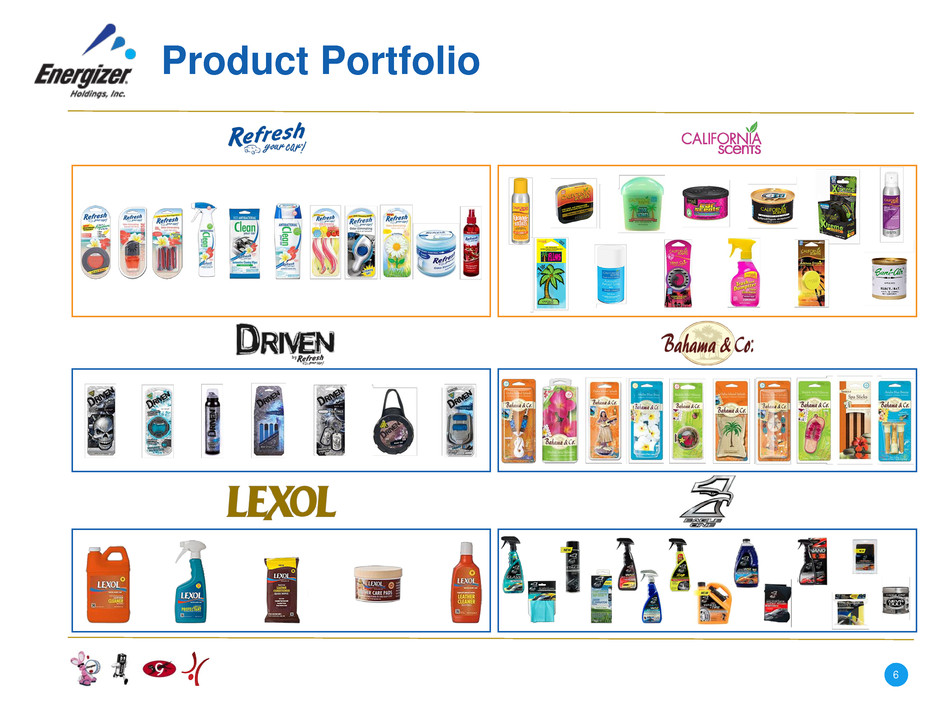
Product Portfolio 6
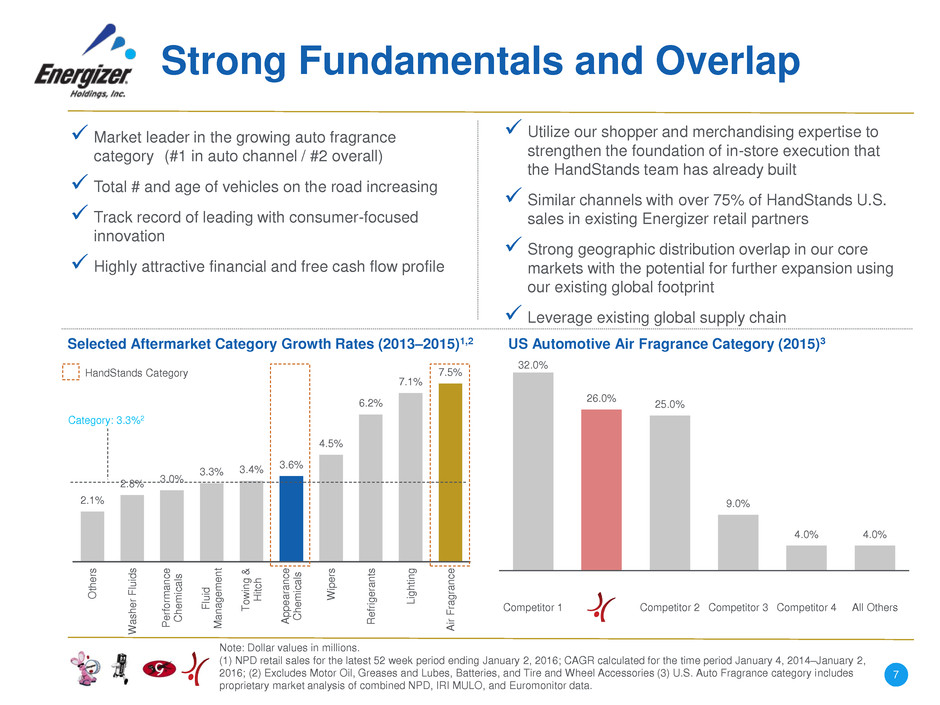
Strong Fundamentals and Overlap Market leader in the growing auto fragrance category (#1 in auto channel / #2 overall) Total # and age of vehicles on the road increasing Track record of leading with consumer-focused innovation Highly attractive financial and free cash flow profile Note: Dollar values in millions. (1) NPD retail sales for the latest 52 week period ending January 2, 2016; CAGR calculated for the time period January 4, 2014–January 2, 2016; (2) Excludes Motor Oil, Greases and Lubes, Batteries, and Tire and Wheel Accessories (3) U.S. Auto Fragrance category includes proprietary market analysis of combined NPD, IRI MULO, and Euromonitor data. 7 Utilize our shopper and merchandising expertise to strengthen the foundation of in-store execution that the HandStands team has already built Similar channels with over 75% of HandStands U.S. sales in existing Energizer retail partners Strong geographic distribution overlap in our core markets with the potential for further expansion using our existing global footprint Leverage existing global supply chain Selected Aftermarket Category Growth Rates (2013–2015)1,2 US Automotive Air Fragrance Category (2015)3 2.1% 2.8% 3.0% 3.3% 3.4% 3.6% 4.5% 6.2% 7.1% 7.5% O th er s Wa sh er F luid s Pe rfo rm an ce Ch em ica ls Flu id Ma na ge me nt To win g & Hi tc h Ap pe ar an ce Ch emi ca ls W ip er s Re frig er an ts Ligh tin g Air Fr ag ra nc e 32.0% 26.0% 25.0% 9.0% 4.0% 4.0% Competitor 1 Competitor 2 Competitor 3 Competitor 4 All Others HandStands Category Category: 3.3%2
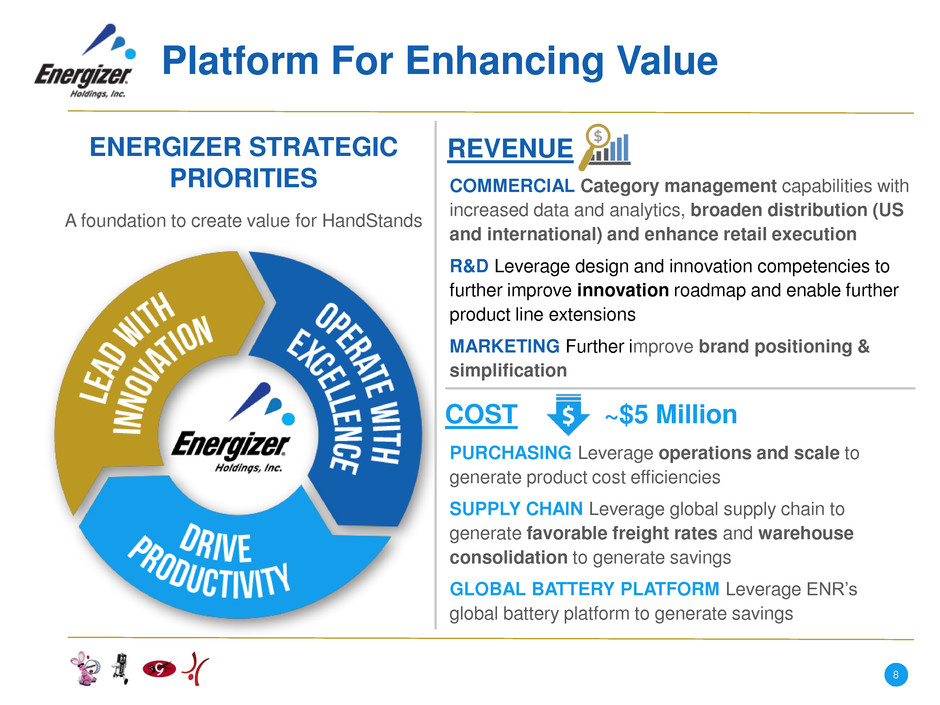
Platform For Enhancing Value REVENUE COMMERCIAL Category management capabilities with increased data and analytics, broaden distribution (US and international) and enhance retail execution R&D Leverage design and innovation competencies to further improve innovation roadmap and enable further product line extensions MARKETING Further improve brand positioning & simplification COST ~$5 Million PURCHASING Leverage operations and scale to generate product cost efficiencies SUPPLY CHAIN Leverage global supply chain to generate favorable freight rates and warehouse consolidation to generate savings GLOBAL BATTERY PLATFORM Leverage ENR’s global battery platform to generate savings ENERGIZER STRATEGIC PRIORITIES A foundation to create value for HandStands 8
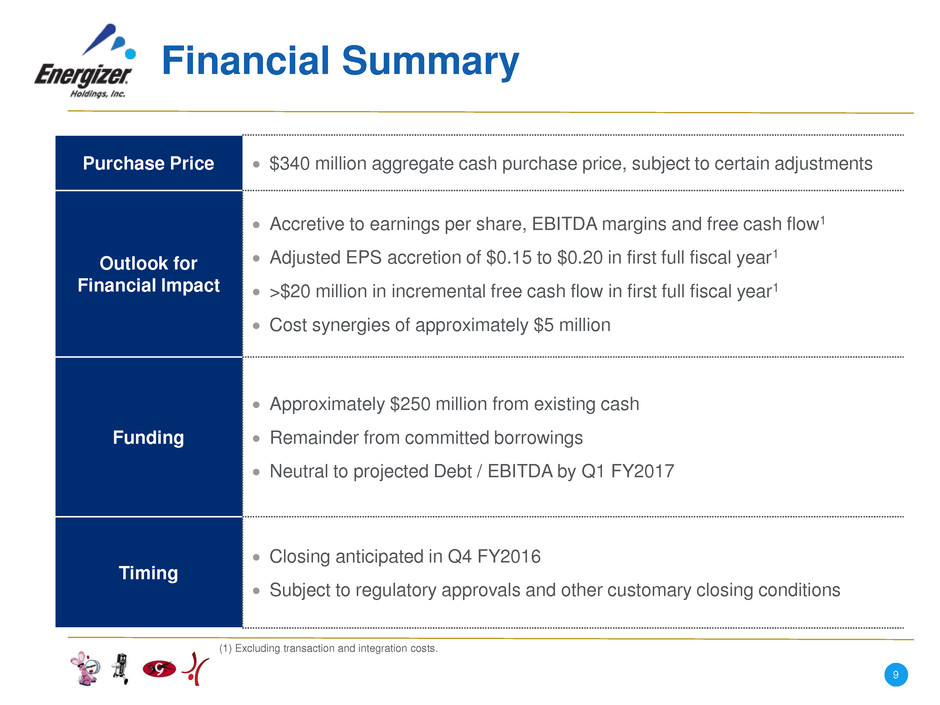
Financial Summary Purchase Price $340 million aggregate cash purchase price, subject to certain adjustments Outlook for Financial Impact Accretive to earnings per share, EBITDA margins and free cash flow1 Adjusted EPS accretion of $0.15 to $0.20 in first full fiscal year1 >$20 million in incremental free cash flow in first full fiscal year1 Cost synergies of approximately $5 million Funding Approximately $250 million from existing cash Remainder from committed borrowings Neutral to projected Debt / EBITDA by Q1 FY2017 Timing Closing anticipated in Q4 FY2016 Subject to regulatory approvals and other customary closing conditions 9 (1) Excluding transaction and integration costs.
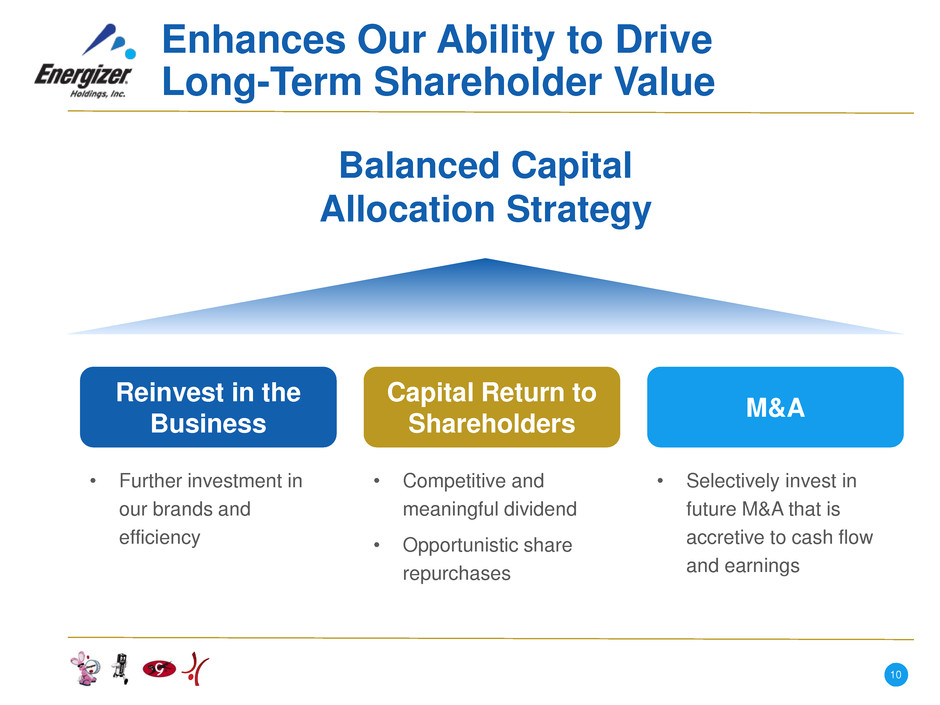
Enhances Our Ability to Drive Long-Term Shareholder Value • Further investment in our brands and efficiency Balanced Capital Allocation Strategy Reinvest in the Business M&A Capital Return to Shareholders • Selectively invest in future M&A that is accretive to cash flow and earnings • Competitive and meaningful dividend • Opportunistic share repurchases 10


