UNITED STATES
SECURITIES AND EXCHANGE COMMISSION
Washington, D.C. 20549
FORM N-CSR
CERTIFIED SHAREHOLDER REPORT OF REGISTERED
MANAGEMENT INVESTMENT COMPANIES
Investment Company Act file number 811-23108
Amplify ETF Trust
(Exact name of registrant as specified in charter)
310 South Hale Street
Wheaton, IL 60187
(Address of principal executive offices) (Zip code)
Christian Magoon
Amplify ETF Trust
310 South Hale Street
Wheaton, IL 60187
(Name and address of agent for service)
With copies to:
Morrison C. Warren, Esq.
Chapman and Cutler LLP
111 West Monroe Street
Chicago, IL 60603
(855)-267-3837
Registrant's telephone number, including area code
Date of fiscal year end: October 31
Date of reporting period: October 31, 2021
Item 1. Reports to Stockholders.
AMPLIFY ETF TRUST
Amplify High Income ETF YYY
Amplify Online Retail ETF IBUY
Amplify CWP Enhanced Dividend Income ETF DIVO
Amplify Transformational Data Sharing ETF BLOK
Amplify Lithium & Battery Technology ETF BATT
Amplify BlackSwan Growth & Treasury Core ETF SWAN
Amplify International Online Retail ETF XBUY
Amplify Seymour Cannabis ETF CNBS
Amplify Pure Junior Gold Miners ETF JGLD
Amplify BlackSwan ISWN ETF ISWN
Amplify Cleaner Living ETF DTOX
Amplify Thematic All-Stars ETF MVPS
Amplify Digital & Online Trading ETF BIDS
ANNUAL REPORT
October 31, 2021
Beginning on January 1, 2022, as permitted by regulations adopted by the U.S. Securities and Exchange Commission, paper copies of the Amplify Seymour Cannabis ETF shareholder reports will no longer be sent by mail, unless you specifically request paper copies of the Amplify Seymour Cannabis ETF’s reports from your financial intermediary, such as a broker-dealer or bank. Instead, the reports will be made available on a website, and you will be notified by mail each time a report is posted and provided with a website link to access the report.
If you already elected to receive shareholder reports electronically, you will not be affected by this change and you need not take any action. Please contact your financial intermediary to elect to receive shareholder reports and other Fund communications electronically.
You may elect to receive all future reports in paper free of charge. Please contact your financial intermediary to inform them that you wish to continue receiving paper copies of shareholder reports and for details about whether your election to receive reports in paper will apply to all funds held with your financial intermediary.
Amplify ETF Trust
Table of Contents
Amplify ETF Trust (the “Trust”) files its complete schedule of fund holdings with the Securities and Exchange Commission (the “Commission”) for the first and third quarters of each fiscal year on Part F of Form N-PORT within sixty days after the end of the period. The Trust’s Part F of Form N-PORT is available on the Commission’s website at www.sec.gov, and may be reviewed and copied at the Commission’s Public Reference Room in Washington, DC. Information on the operation of the Public Reference Room may be obtained by calling 1-800-SEC-0330.
A description of the policies and procedures that Amplify Investments LLC (the “Adviser”) uses to determine how to vote proxies relating to portfolio securities, as well as information relating to how a fund voted proxies relating to portfolio securities during the most recent 12-month period ended June 30, is available (i) without charge, upon request, by calling 1-855-267-3837 and (ii) on the Commission’s website at www.sec.gov.
1
Amplify ETF Trust
Market Performance (Unaudited)
October 31, 2021
Equity investors experienced healthy returns across the board through the end of October of 2021. Despite risks of new COVID outbreaks, the potential for increased US taxes and inflation rising, broad-based US stock indexes surged. The Dow Jones Industrial Average, the S&P 500 and the Nasdaq 100 had positive returns ranging between 18-24% through the end of October. In addition, market capitalization and style indexes including the S&P Mid Cap Growth, S&P Mid Cap Value, S&P Small Cap Growth and S&P Small Cap Value all returned double digit positive returns. Besides healthy returns, the behavior of equity markets in 2021 was also quite calm with virtually no material corrections in the year. The first ten months of 2021 were a refreshing break for investors after a volatile 2020.
The S&P 500 delivered 24% year-to-date as of the end of October, which placed it in the middle of the various sector returns making up this well-known index. Reviewing the eleven sectors that comprise the S&P 500 index shows a variety of significant performance differences. In fact, three of the eleven S&P 500 sectors gained more than 30% year-to-date as of October 31. Leading the pack with just over a 57% gain was the Energy sector. Energy stocks continued to see their products in increased demand as the economy worldwide ramped up from the COVID slowdown of 2020. The energy sector declined 33% in 2020 amidst the worldwide economic slowdown, so 2021’s performance is a welcome sign for energy stock investors. Coming in a distant second and third place were the Financials sector with a 38% gain and the Real Estate sector with a 33% move upward. Both sectors were on the rebound in 2021 after experiencing slightly negative returns in 2020. After the top three sector winners, there were a mix of sectors that hovered around the 20% gain mark. Communication Services gained 25% and Technology and Consumer Discretionary followed closely with a 24% and 22% gain respectively. Returning 46% in 2020, the Technology sector has been on quite a roll the last 22 months. Healthcare, Industrials and Materials sectors returned between 18-19%, just underperforming the S&P 500. Utilities and Consumer Staples took the two bottom sector return positions with just single digit returns of 9% and 8% respectively. It’s notable there were no negative sectors returns in 2021 after 2020 saw three of eleven sectors in the red.
Looking forward to 2022, US investors will be watching the Federal Reserve’s tone, pace of interest rate increases, inflation data and geopolitical tensions with nations including China, Iran, and Russia. US equity markets have been abnormally rosy since the 2020 COVID lows, and it would not be surprising to see equity market volatility increase in 2022.
Past performance does not guarantee future results.
Investing involves risk; Principal loss is possible.
Fund holdings are subject to change and should not be considered a recommendation to buy or sell any security. Please see the Schedule of Investments for a complete list of Fund holdings.
S&P 500 Index: The S&P 500 is a market value weighted index and one of the common benchmarks for the U.S. stock market. Investors cannot invest directly in an index.
2
Amplify ETF Trust
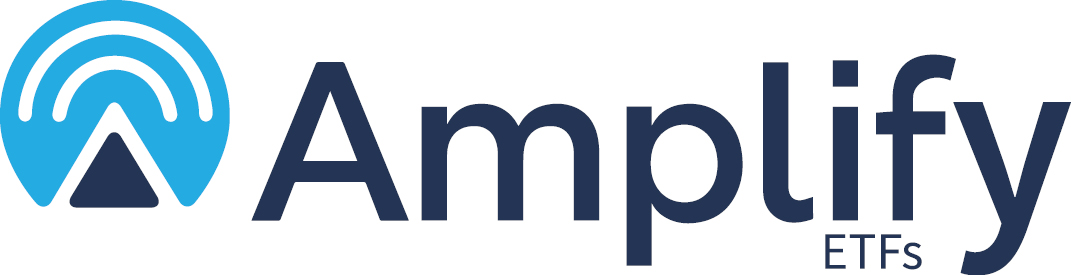
Amplify High Income ETF
Fund Performance
October 31, 2021 (Unaudited)
Growth of a $10,000 Investment
(at Net Asset Value)
| | ANNUALIZED RETURNS |
| | | One Year | | Three Year | | Five Year | | Inception to Date(a) |
| | | Net Asset
Value | | Market
Price | | Net Asset
Value | | Market
Price | | Net Asset
Value | | Market
Price | | Net Asset
Value | | Market
Price |
Amplify High Income ETF | | 30.71% | | 30.94% | | 9.96% | | 9.99% | | 7.63% | | 7.59% | | 7.32% | | 7.34% |
Hybrid SWM/ISE High Income Index(b) | | 31.70% | | 31.70% | | 10.64% | | 10.64% | | 8.23% | | 8.23% | | 7.56% | | 7.56% |
ISE High Income Index | | 31.70% | | 31.70% | | 10.64% | | 10.64% | | 8.23% | | 8.23% | | 6.81%(c) | | 6.81%(c) |
S&P 500 Index | | 42.91% | | 42.91% | | 21.48% | | 21.48% | | 18.93% | | 18.93% | | 16.64% | | 16.64% |
The Fund is the successor to the investment performance of the YieldShares High Income Fund (the “Predecessor High Income Fund”) as a result of the reorganization of the Predecessor High Income Fund into the Fund on October 7, 2019. Accordingly, the performance information shown in the chart and table above for periods prior to October 7, 2019 is that of the Predecessor High Income Fund’s Shares for the Fund. The Predecessor High Income Fund was managed by the same portfolio managers as the Fund and had substantially the same investment objectives, policies, and strategies as the Fund.
The performance data quoted herein represents past performance and the return and value of an investment in the Fund will fluctuate so that shares, when redeemed or sold in the market, may be worth more or less than their original cost. Prior to June 20, 2013, the Fund sought to provide investment results that, before fees and expenses, corresponded generally to the price and yield performance of the SWM Index. Past performance is no guarantee of future performance and should not be considered as a representation of the future results of the Fund. The Fund’s performance assumes the reinvestment of all dividends and all capital gains. Index returns assume reinvestment of dividends and, unlike a Fund’s returns, do not reflect any fees or expenses. If such fees and expenses were included in the index returns, the performance would have been lower. Please note that one cannot invest directly in an unmanaged index.
There are no assurances that the Fund will meet its stated objectives.
The Fund’s holdings and allocations are subject to change and should not be considered recommendations to buy individual securities.
Returns shown do not reflect the deduction of taxes that a shareholder would pay on Fund distributions or the redemption of Fund shares.
3
Amplify ETF Trust
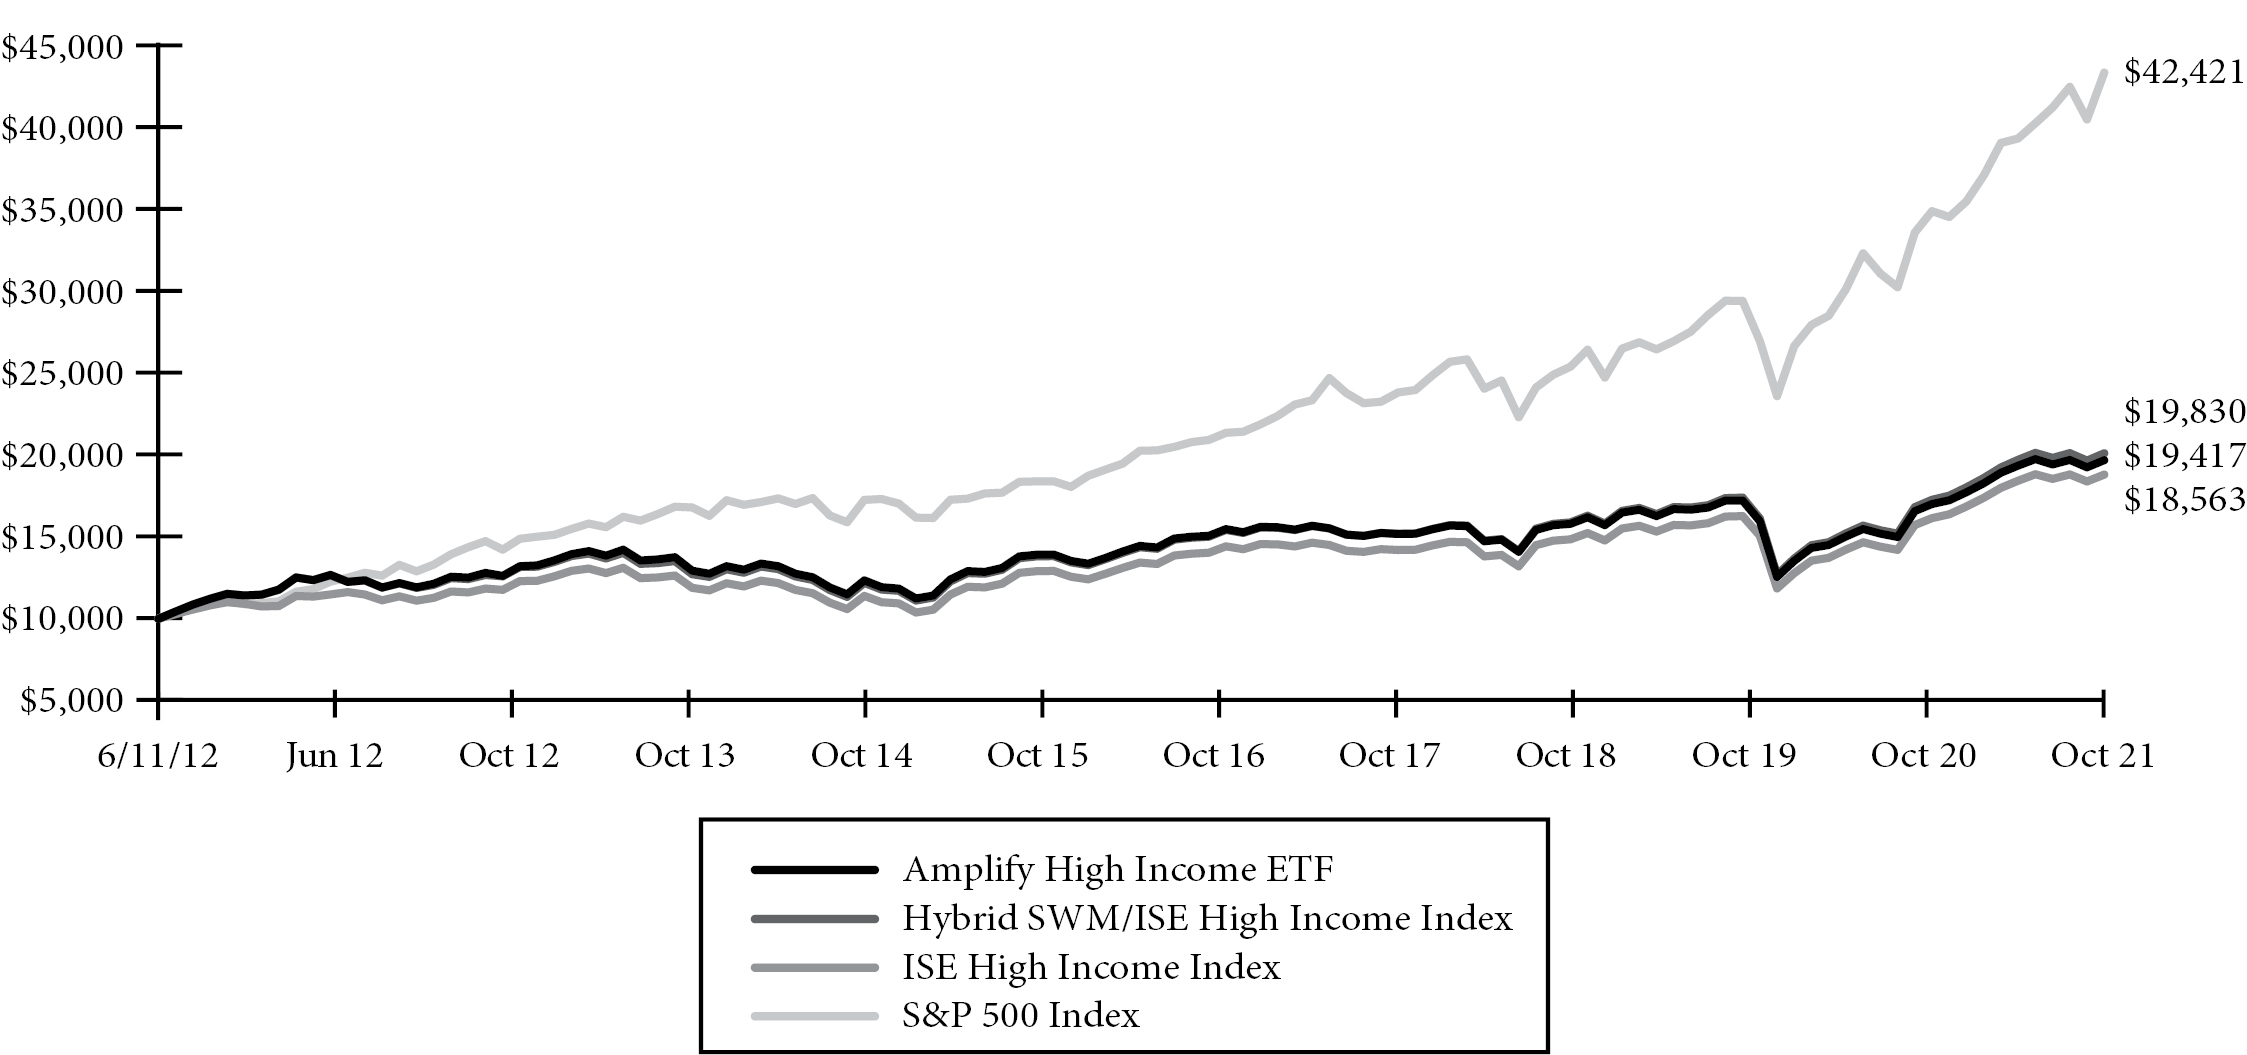
Amplify Online Retail ETF
Fund Performance
October 31, 2021 (Unaudited)
Growth of a $10,000 Investment
(at Net Asset Value)
| | ANNUALIZED RETURNS |
| | | One Year | | Three Year | | Five Year | | Inception to Date(a) |
| | | Net Asset
Value | | Market
Price | | Net Asset
Value | | Market
Price | | Net Asset
Value | | Market
Price | | Net Asset
Value | | Market
Price |
Amplify Online Retail ETF | | 25.49% | | 25.32% | | 36.53% | | 36.59% | | 32.65% | | 32.54% | | 31.04% | | 31.02% |
EQM Online Retail Index | | 26.34% | | 26.34% | | 36.97% | | 36.97% | | 33.11% | | 33.11% | | 31.53% | | 31.53% |
S&P 500 Index | | 42.91% | | 42.91% | | 21.48% | | 21.48% | | 18.93% | | 18.93% | | 17.44% | | 17.44% |
The performance data quoted herein represents past performance and the return and value of an investment in the Fund will fluctuate so that shares, when redeemed or sold in the market, may be worth more or less than their original cost. Past performance is no guarantee of future performance and should not be considered as a representation of the future results of the Fund. The Fund’s performance assumes the reinvestment of all dividends and all capital gains. Index returns assume reinvestment of dividends and, unlike a Fund’s returns, do not reflect any fees or expenses. If such fees and expenses were included in the index returns, the performance would have been lower. Please note that one cannot invest directly in an unmanaged index.
There are no assurances that the Fund will meet its stated objectives.
The Fund’s holdings and allocations are subject to change and should not be considered recommendations to buy individual securities.
Returns shown do not reflect the deduction of taxes that a shareholder would pay on Fund distributions or the redemption of Fund shares.
4
Amplify ETF Trust
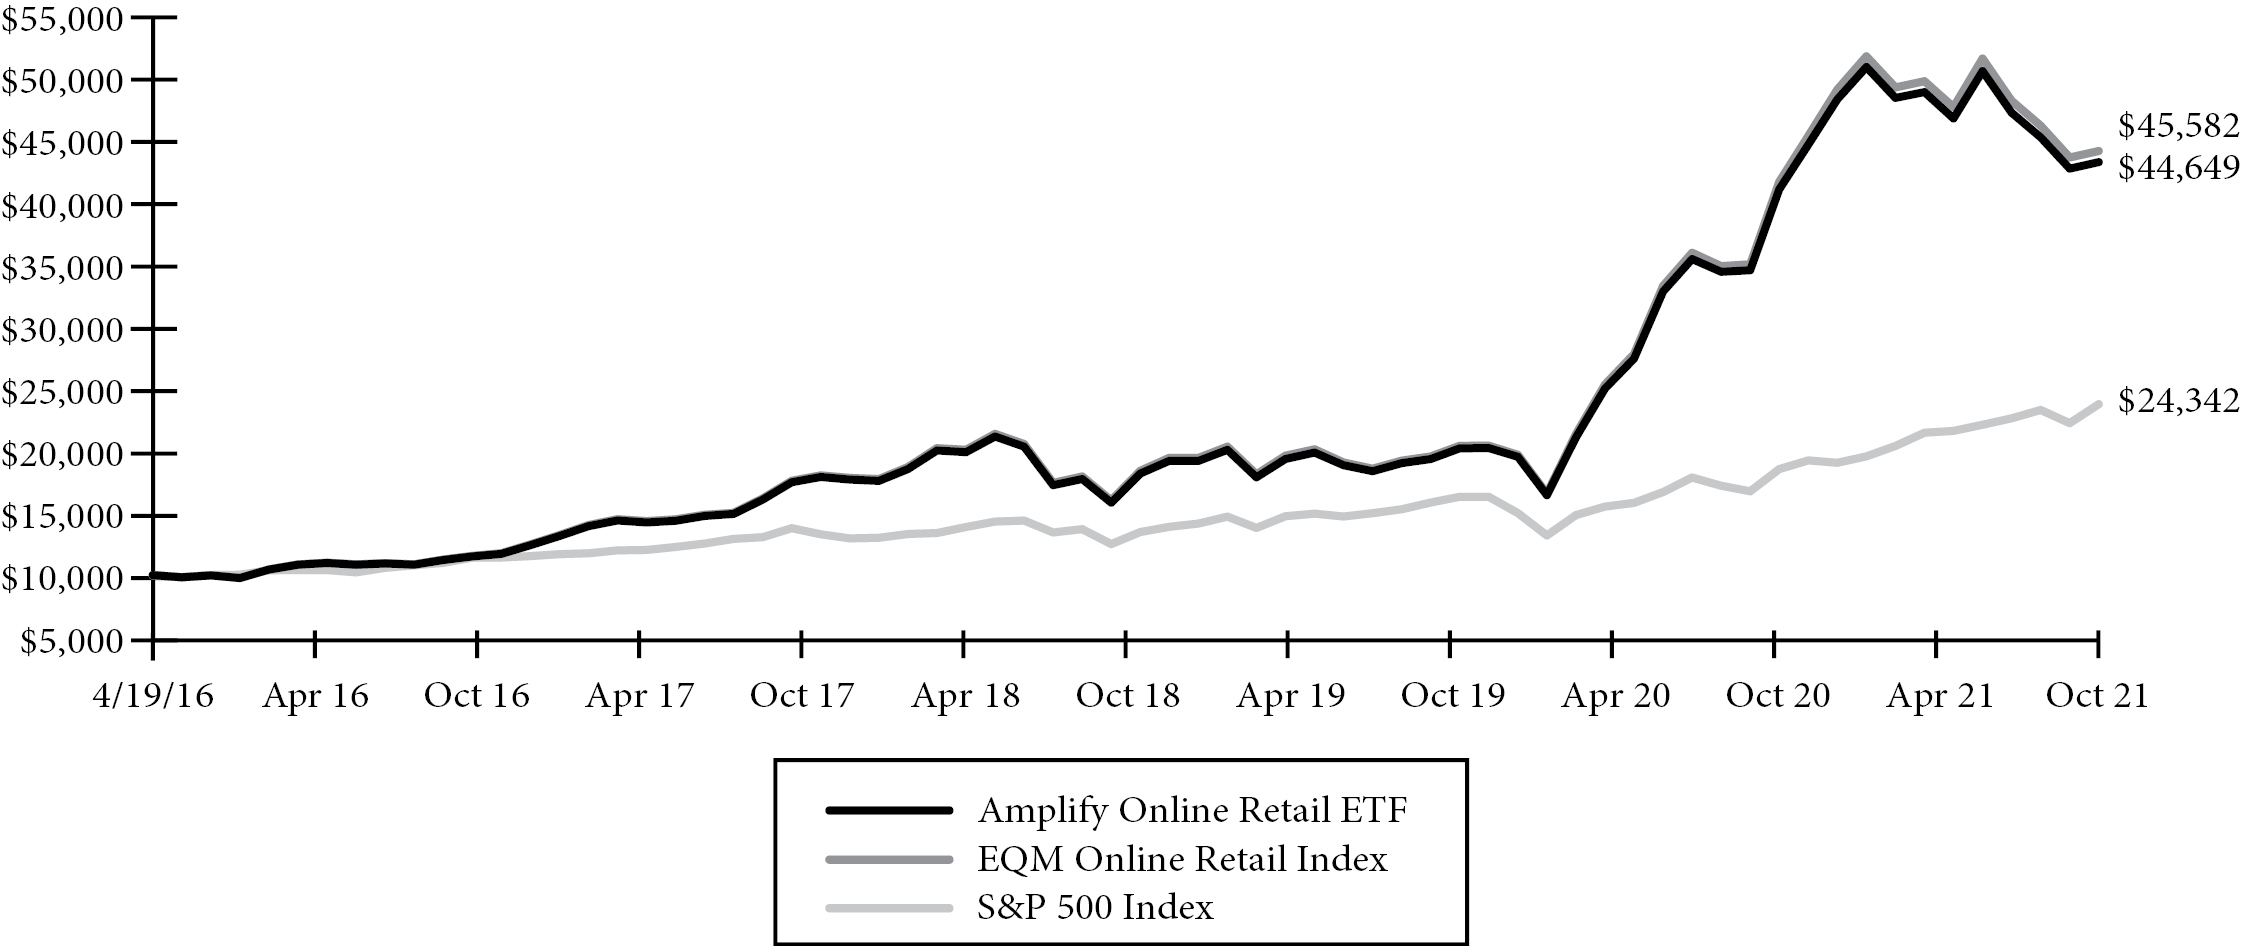
Amplify CWP Enhanced Dividend Income ETF
Fund Performance
October 31, 2021 (Unaudited)
Growth of a $10,000 Investment
(at Net Asset Value)
| | ANNUALIZED RETURNS |
| | | One Year | | Three Year | | Inception to Date(a) |
| | | Net Asset
Value | | Market
Price | | Net Asset
Value | | Market
Price | | Net Asset
Value | | Market
Price |
Amplify CWP Enhanced Dividend Income ETF | | 33.81% | | 33.59% | | 16.31% | | 16.30% | | 14.62% | | 14.63% |
Cboe S&P 500 BuyWrite Index | | 31.54% | | 31.54% | | 7.75% | | 7.75% | | 7.41% | | 7.41% |
Dow Jones Industrial Average | | 35.16% | | 35.16% | | 12.56% | | 12.56% | | 12.78% | | 12.78% |
The performance data quoted herein represents past performance and the return and value of an investment in the Fund will fluctuate so that shares, when redeemed or sold in the market, may be worth more or less than their original cost. Past performance is no guarantee of future performance and should not be considered as a representation of the future results of the Fund. The Fund’s performance assumes the reinvestment of all dividends and all capital gains. Index returns assume reinvestment of dividends and, unlike a Fund’s returns, do not reflect any fees or expenses. If such fees and expenses were included in the index returns, the performance would have been lower. Please note that one cannot invest directly in an unmanaged index.
There are no assurances that the Fund will meet its stated objectives.
The Fund’s holdings and allocations are subject to change and should not be considered recommendations to buy individual securities.
Returns shown do not reflect the deduction of taxes that a shareholder would pay on Fund distributions or the redemption of Fund shares.
5
Amplify ETF Trust
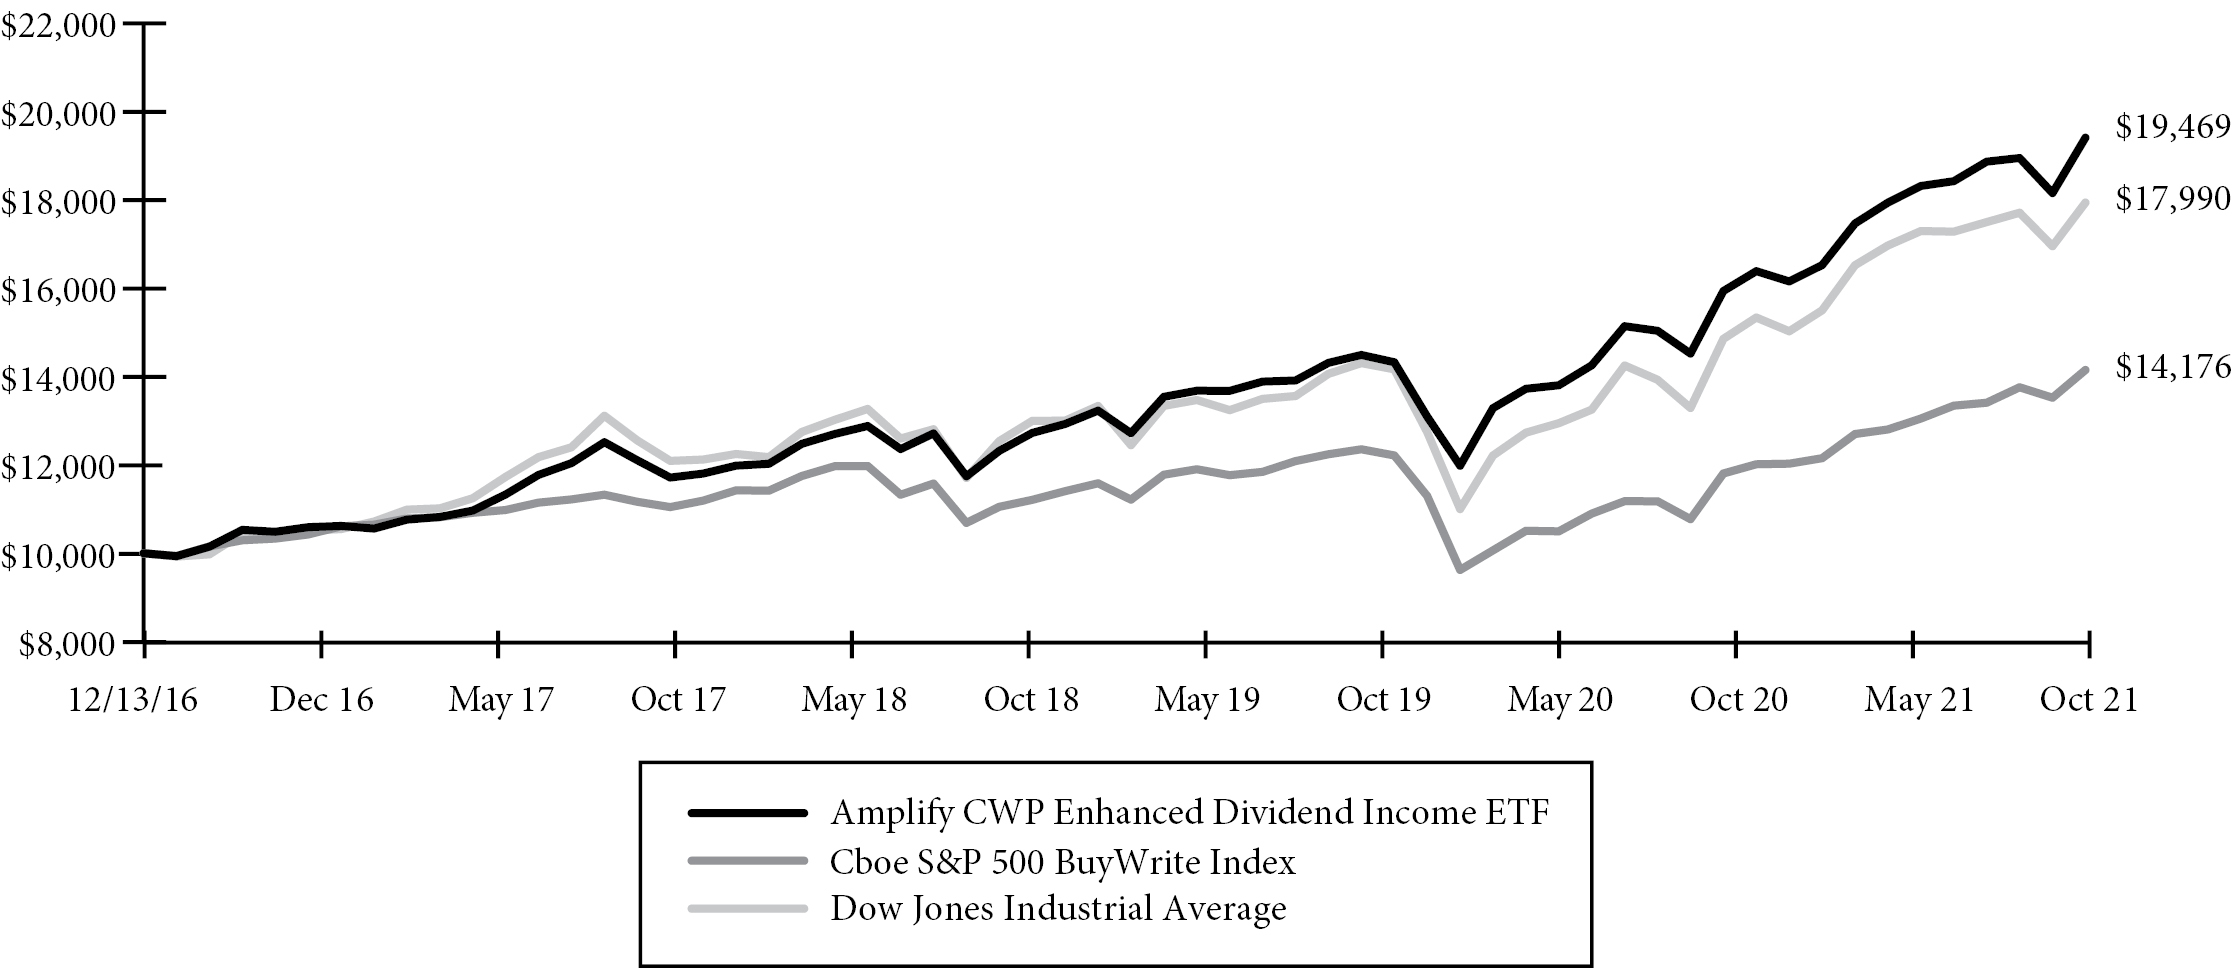
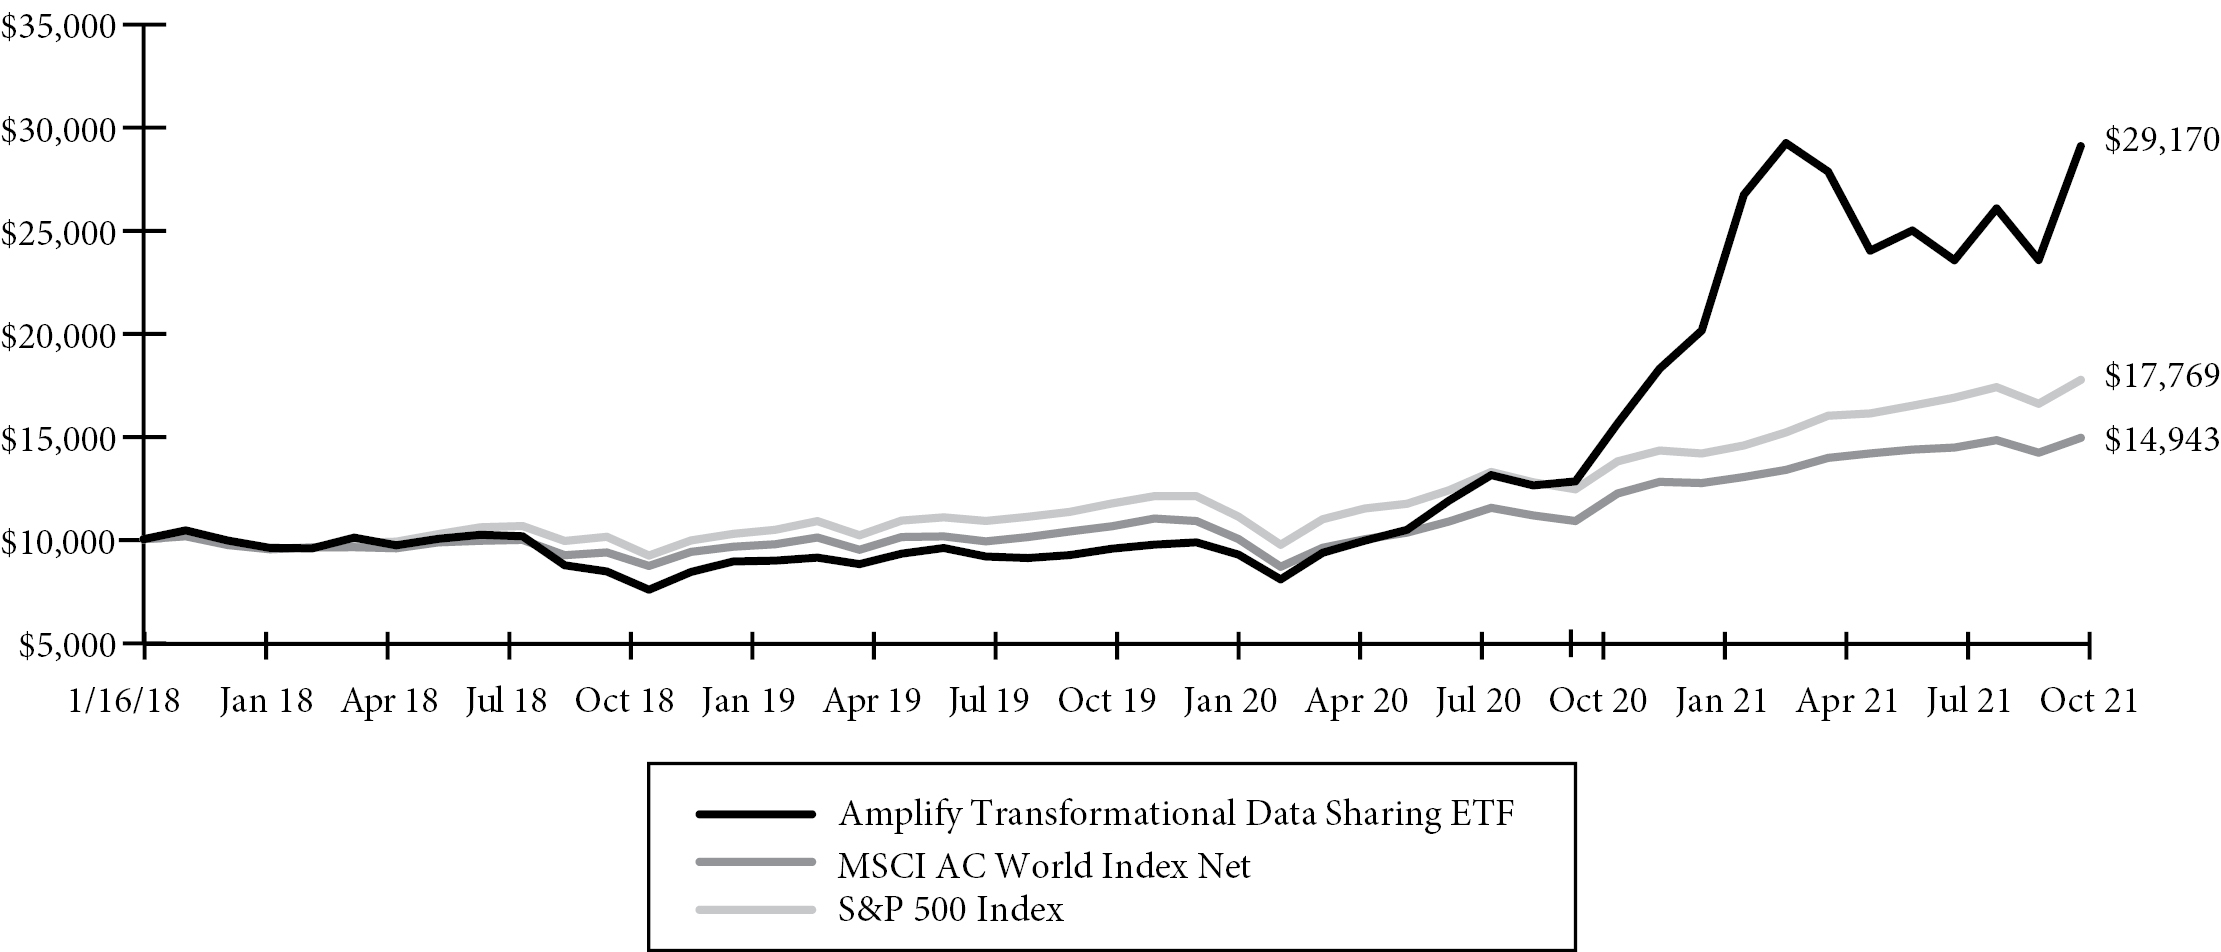
Amplify Transformational Data Sharing ETF
Fund Performance
October 31, 2021 (Unaudited)
Growth of a $10,000 Investment
(at Net Asset Value)
| | ANNUALIZED RETURNS |
| | | One Year | | Three Year | | Inception to Date(a) |
| | | Net Asset
Value | | Market
Price | | Net Asset
Value | | Market
Price | | Net Asset
Value | | Market
Price |
Amplify Transformational Data Sharing ETF | | 127.54% | | 127.14% | | 49.52% | | 49.58% | | 32.65% | | 32.68% |
MSCI AC World Index Net | | 37.28% | | 37.28% | | 17.47% | | 17.47% | | 11.18% | | 11.18% |
S&P 500 Index | | 42.91% | | 42.91% | | 21.48% | | 21.48% | | 16.38% | | 16.38% |
The performance data quoted herein represents past performance and the return and value of an investment in the Fund will fluctuate so that shares, when redeemed or sold in the market, may be worth more or less than their original cost. Past performance is no guarantee of future performance and should not be considered as a representation of the future results of the Fund. The Fund’s performance assumes the reinvestment of all dividends and all capital gains. Index returns assume reinvestment of dividends and, unlike a Fund’s returns, do not reflect any fees or expenses. If such fees and expenses were included in the index returns, the performance would have been lower. Please note that one cannot invest directly in an unmanaged index.
There are no assurances that the Fund will meet its stated objectives.
The Fund’s holdings and allocations are subject to change and should not be considered recommendations to buy individual securities.
Returns shown do not reflect the deduction of taxes that a shareholder would pay on Fund distributions or the redemption of Fund shares.
6
Amplify ETF Trust
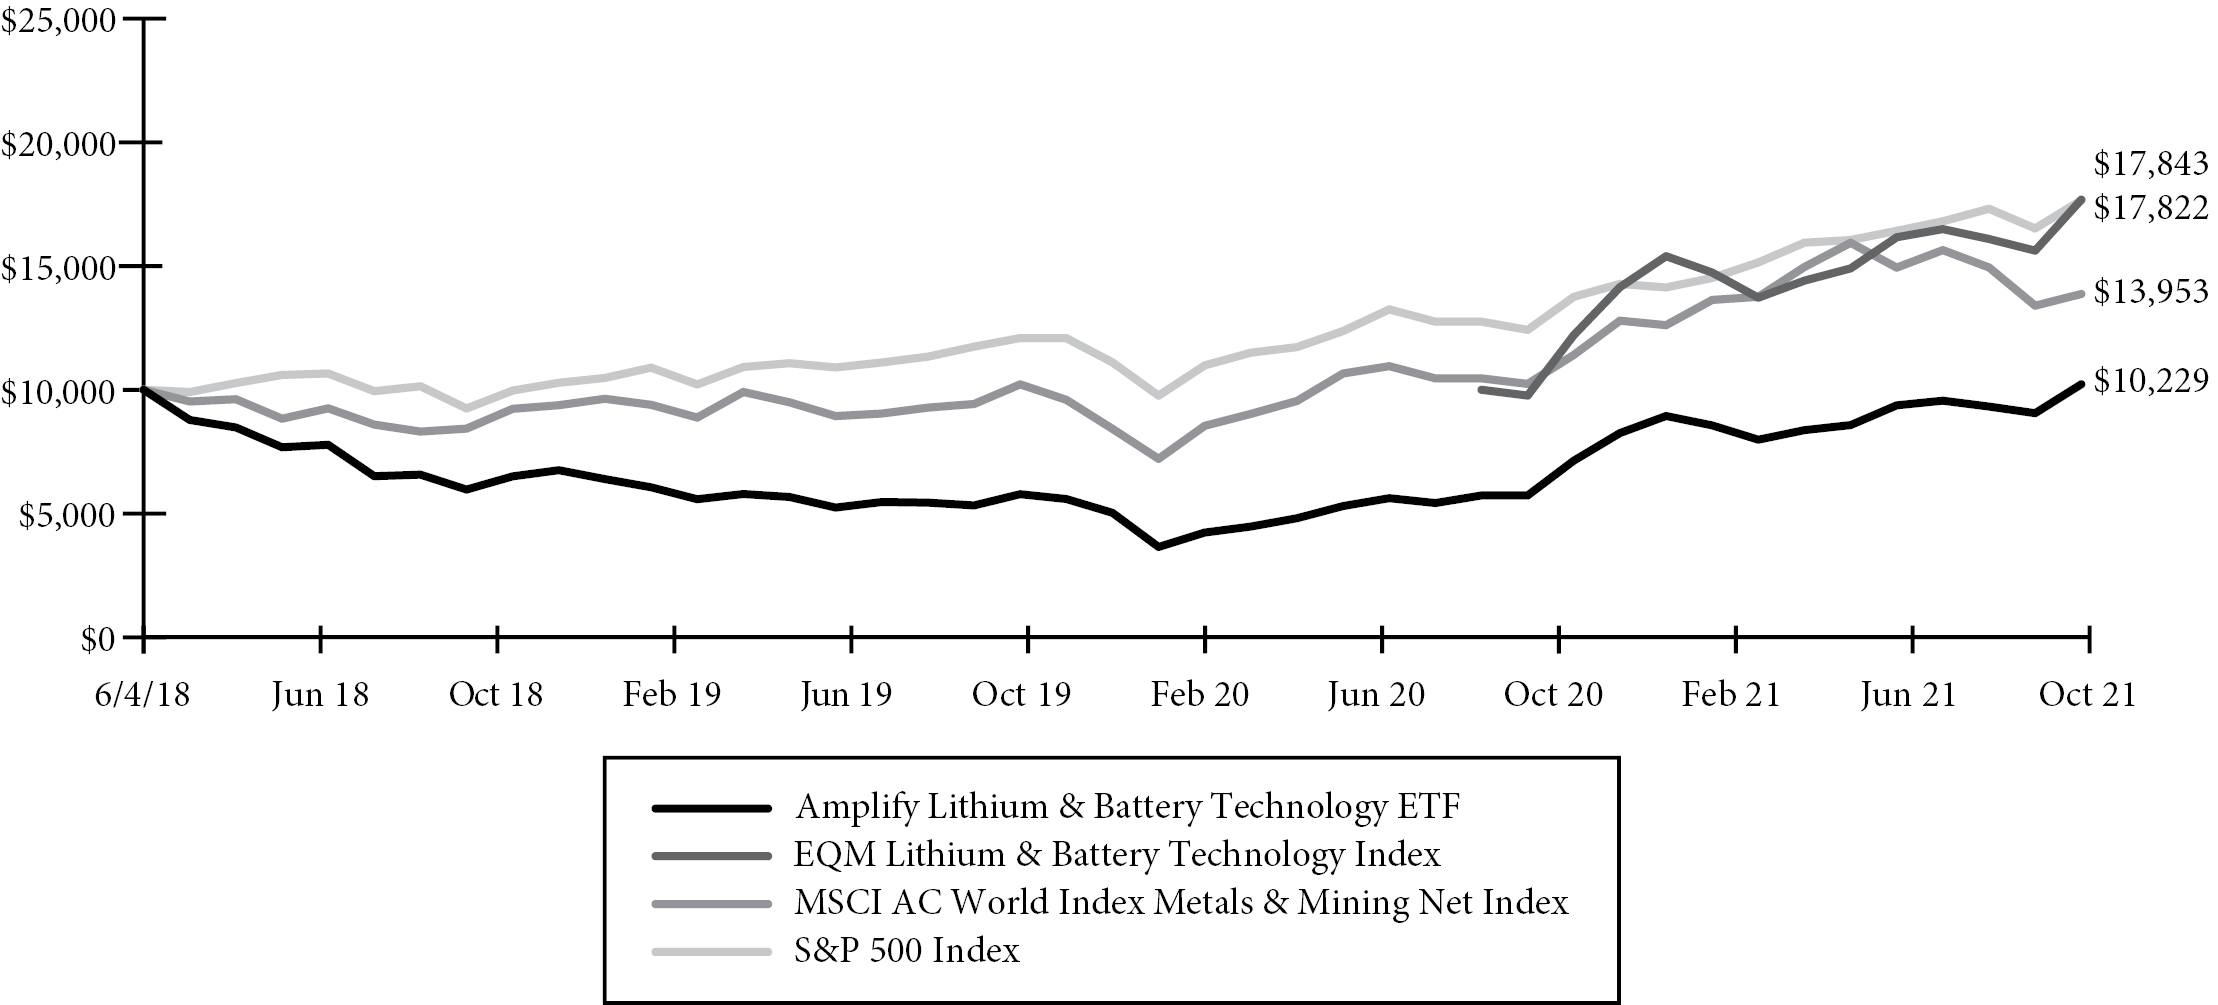
Amplify Lithium & Battery Technology ETF
Fund Performance
October 31, 2021 (Unaudited)
Growth of a $10,000 Investment
(at Net Asset Value)
| | ANNUALIZED RETURNS |
| | | One Year | | Three Year | | Inception to Date(a) |
| | | Net Asset
Value | | Market
Price | | Net Asset
Value | | Market
Price | | Net Asset
Value | | Market
Price |
Amplify Lithium & Battery Technology ETF | | 81.32% | | 81.13% | | 16.70% | | 16.76% | | 0.67% | | 0.75% |
EQM Lithium & Battery Technology Index(b) | | 82.78% | | 82.78% | | N/A | | N/A | | 73.89%(c) | | 73.89%(c) |
MSCI AC World Index Metals & Mining Net Index | | 36.22% | | 36.22% | | 17.67% | | 17.67% | | 10.27% | | 10.27% |
S&P 500 Index | | 42.91% | | 42.91% | | 21.48% | | 21.48% | | 18.48% | | 18.48% |
The performance data quoted herein represents past performance and the return and value of an investment in the Fund will fluctuate so that shares, when redeemed or sold in the market, may be worth more or less than their original cost. Past performance is no guarantee of future performance and should not be considered as a representation of the future results of the Fund. The Fund’s performance assumes the reinvestment of all dividends and all capital gains. Index returns assume reinvestment of dividends and, unlike a Fund’s returns, do not reflect any fees or expenses. If such fees and expenses were included in the index returns, the performance would have been lower. Please note that one cannot invest directly in an unmanaged index.
There are no assurances that the Fund will meet its stated objectives.
The Fund’s holdings and allocations are subject to change and should not be considered recommendations to buy individual securities.
Returns shown do not reflect the deduction of taxes that a shareholder would pay on Fund distributions or the redemption of Fund shares.
7
Amplify ETF Trust
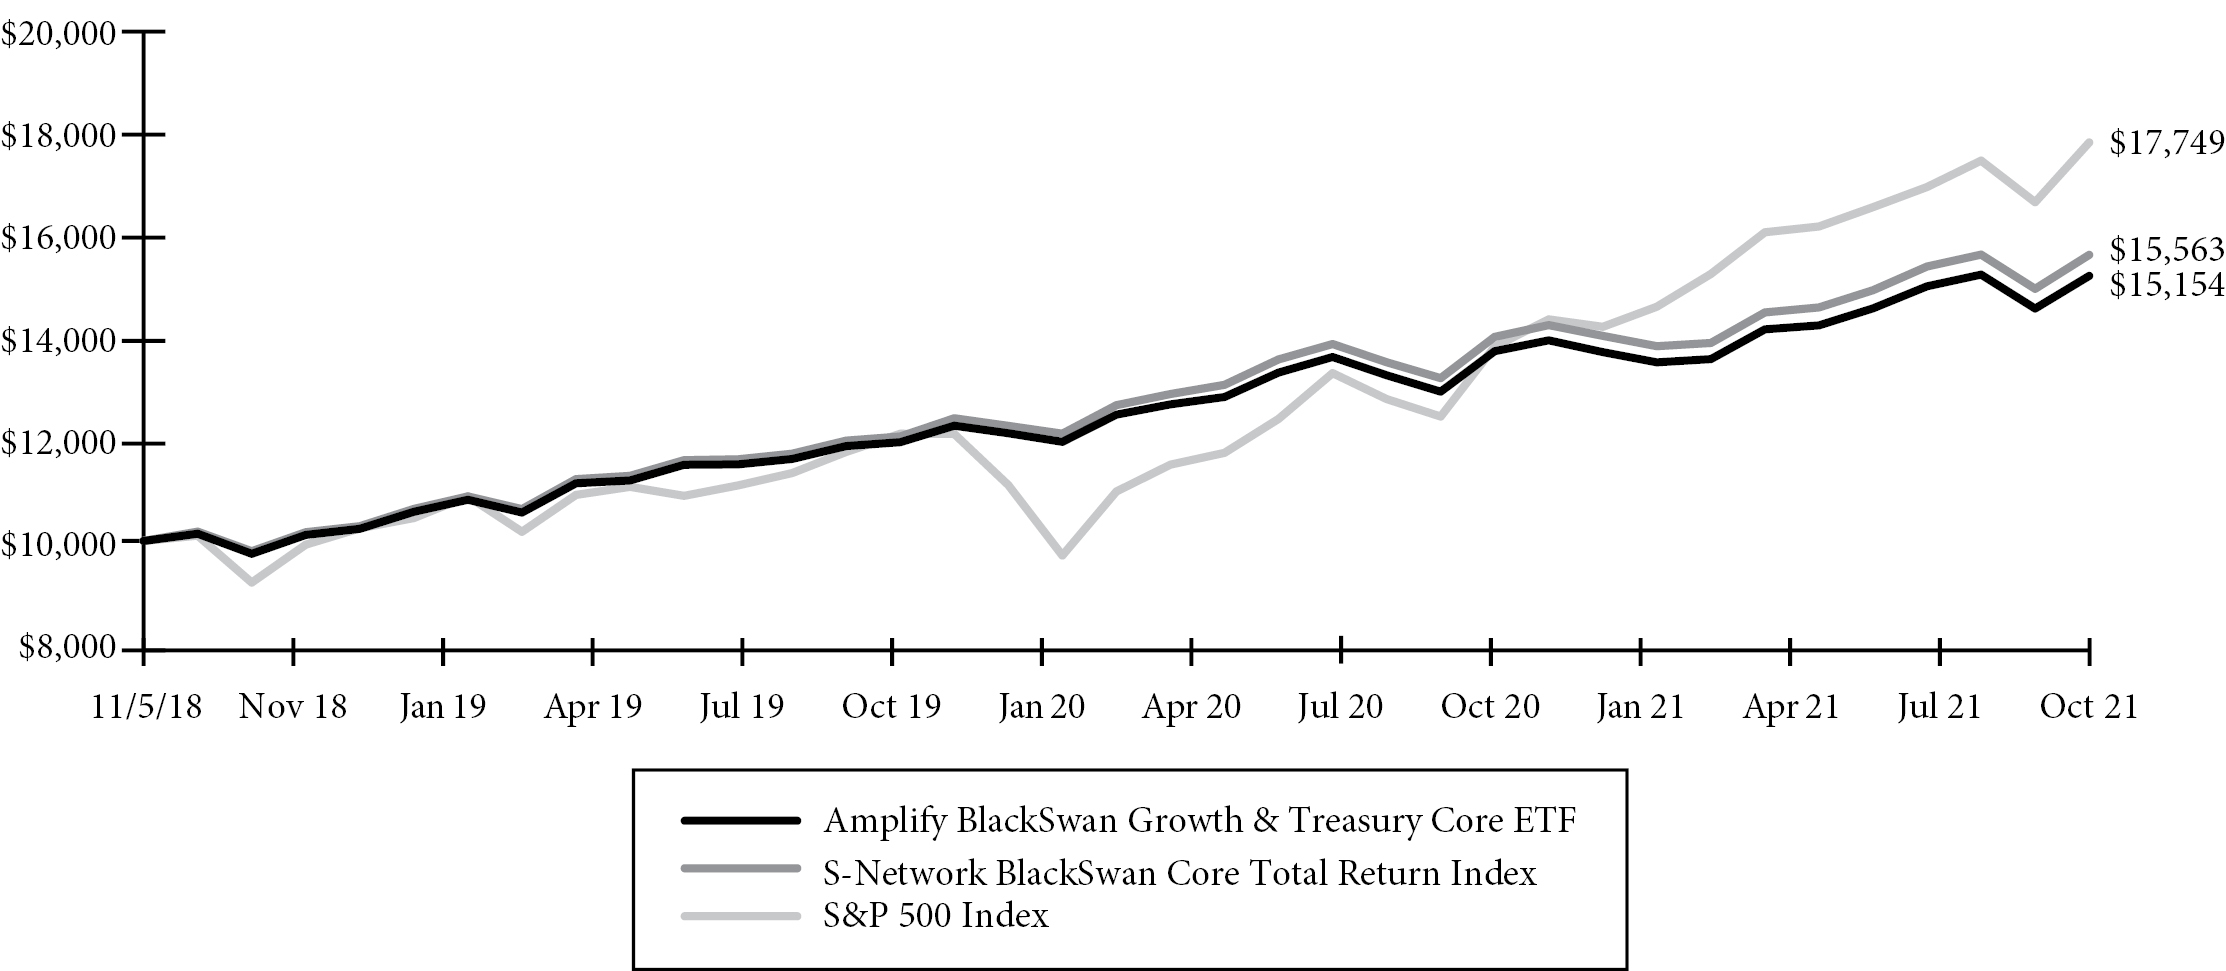
Amplify BlackSwan Growth & Treasury Core ETF
Fund Performance
October 31, 2021 (Unaudited)
Growth of a $10,000 Investment
(at Net Asset Value)
| | ANNUALIZED RETURNS |
| | | One Year | | Inception to Date(a) |
| | | Net Asset
Value | | Market
Price | | Net Asset
Value | | Market
Price |
Amplify BlackSwan Growth & Treasury Core ETF | | 17.44% | | 17.64% | | 14.93% | | 14.92% |
S-Network BlackSwan Core Total Return Index | | 18.20% | | 18.20% | | 15.96% | | 15.96% |
S&P 500 Index | | 42.91% | | 42.91% | | 21.18% | | 21.18% |
The performance data quoted herein represents past performance and the return and value of an investment in the Fund will fluctuate so that shares, when redeemed or sold in the market, may be worth more or less than their original cost. Past performance is no guarantee of future performance and should not be considered as a representation of the future results of the Fund. The Fund’s performance assumes the reinvestment of all dividends and all capital gains. Index returns assume reinvestment of dividends and, unlike a Fund’s returns, do not reflect any fees or expenses. If such fees and expenses were included in the index returns, the performance would have been lower. Please note that one cannot invest directly in an unmanaged index.
There are no assurances that the Fund will meet its stated objectives.
The Fund’s holdings and allocations are subject to change and should not be considered recommendations to buy individual securities.
Returns shown do not reflect the deduction of taxes that a shareholder would pay on Fund distributions or the redemption of Fund shares.
8
Amplify ETF Trust
Amplify International Online Retail ETF
Fund Performance
October 31, 2021 (Unaudited)
Growth of a $10,000 Investment
(at Net Asset Value)

| | ANNUALIZED RETURNS |
| | | One Year | | Inception to Date(a) |
| | | Net Asset
Value | | Market
Price | | Net Asset
Value | | Market
Price |
Amplify International Online Retail ETF | | 4.68% | | 4.60% | | 22.35% | | 22.39% |
EQM International Ecommerce Index | | 4.99% | | 4.99% | | 23.17% | | 23.17% |
S&P 500 Index | | 42.91% | | 42.91% | | 24.59% | | 24.59% |
The performance data quoted herein represents past performance and the return and value of an investment in the Fund will fluctuate so that shares, when redeemed or sold in the market, may be worth more or less than their original cost. Past performance is no guarantee of future performance and should not be considered as a representation of the future results of the Fund. The Fund’s performance assumes the reinvestment of all dividends and all capital gains. Index returns assume reinvestment of dividends and, unlike a Fund’s returns, do not reflect any fees or expenses. If such fees and expenses were included in the index returns, the performance would have been lower. Please note that one cannot invest directly in an unmanaged index.
There are no assurances that the Fund will meet its stated objectives.
The Fund’s holdings and allocations are subject to change and should not be considered recommendations to buy individual securities.
Returns shown do not reflect the deduction of taxes that a shareholder would pay on Fund distributions or the redemption of Fund shares.
9
Amplify ETF Trust
Amplify Seymour Cannabis ETF
Fund Performance
October 31, 2021 (Unaudited)
Growth of a $10,000 Investment
(at Net Asset Value)

| | ANNUALIZED RETURNS |
| | | One Year | | Inception to Date(a) |
| | | Net Asset
Value | | Market
Price | | Net Asset
Value | | Market
Price |
Amplify Seymour Cannabis ETF | | 47.93% | | 46.81% | | -13.89% | | -13.92% |
S&P 500 Index | | 42.91% | | 42.91% | | 23.06% | | 23.06% |
The performance data quoted herein represents past performance and the return and value of an investment in the Fund will fluctuate so that shares, when redeemed or sold in the market, may be worth more or less than their original cost. Past performance is no guarantee of future performance and should not be considered as a representation of the future results of the Fund. The Fund’s performance assumes the reinvestment of all dividends and all capital gains. Index returns assume reinvestment of dividends and, unlike a Fund’s returns, do not reflect any fees or expenses. If such fees and expenses were included in the index returns, the performance would have been lower. Please note that one cannot invest directly in an unmanaged index.
There are no assurances that the Fund will meet its stated objectives.
The Fund’s holdings and allocations are subject to change and should not be considered recommendations to buy individual securities.
Returns shown do not reflect the deduction of taxes that a shareholder would pay on Fund distributions or the redemption of Fund shares.
10
Amplify ETF Trust
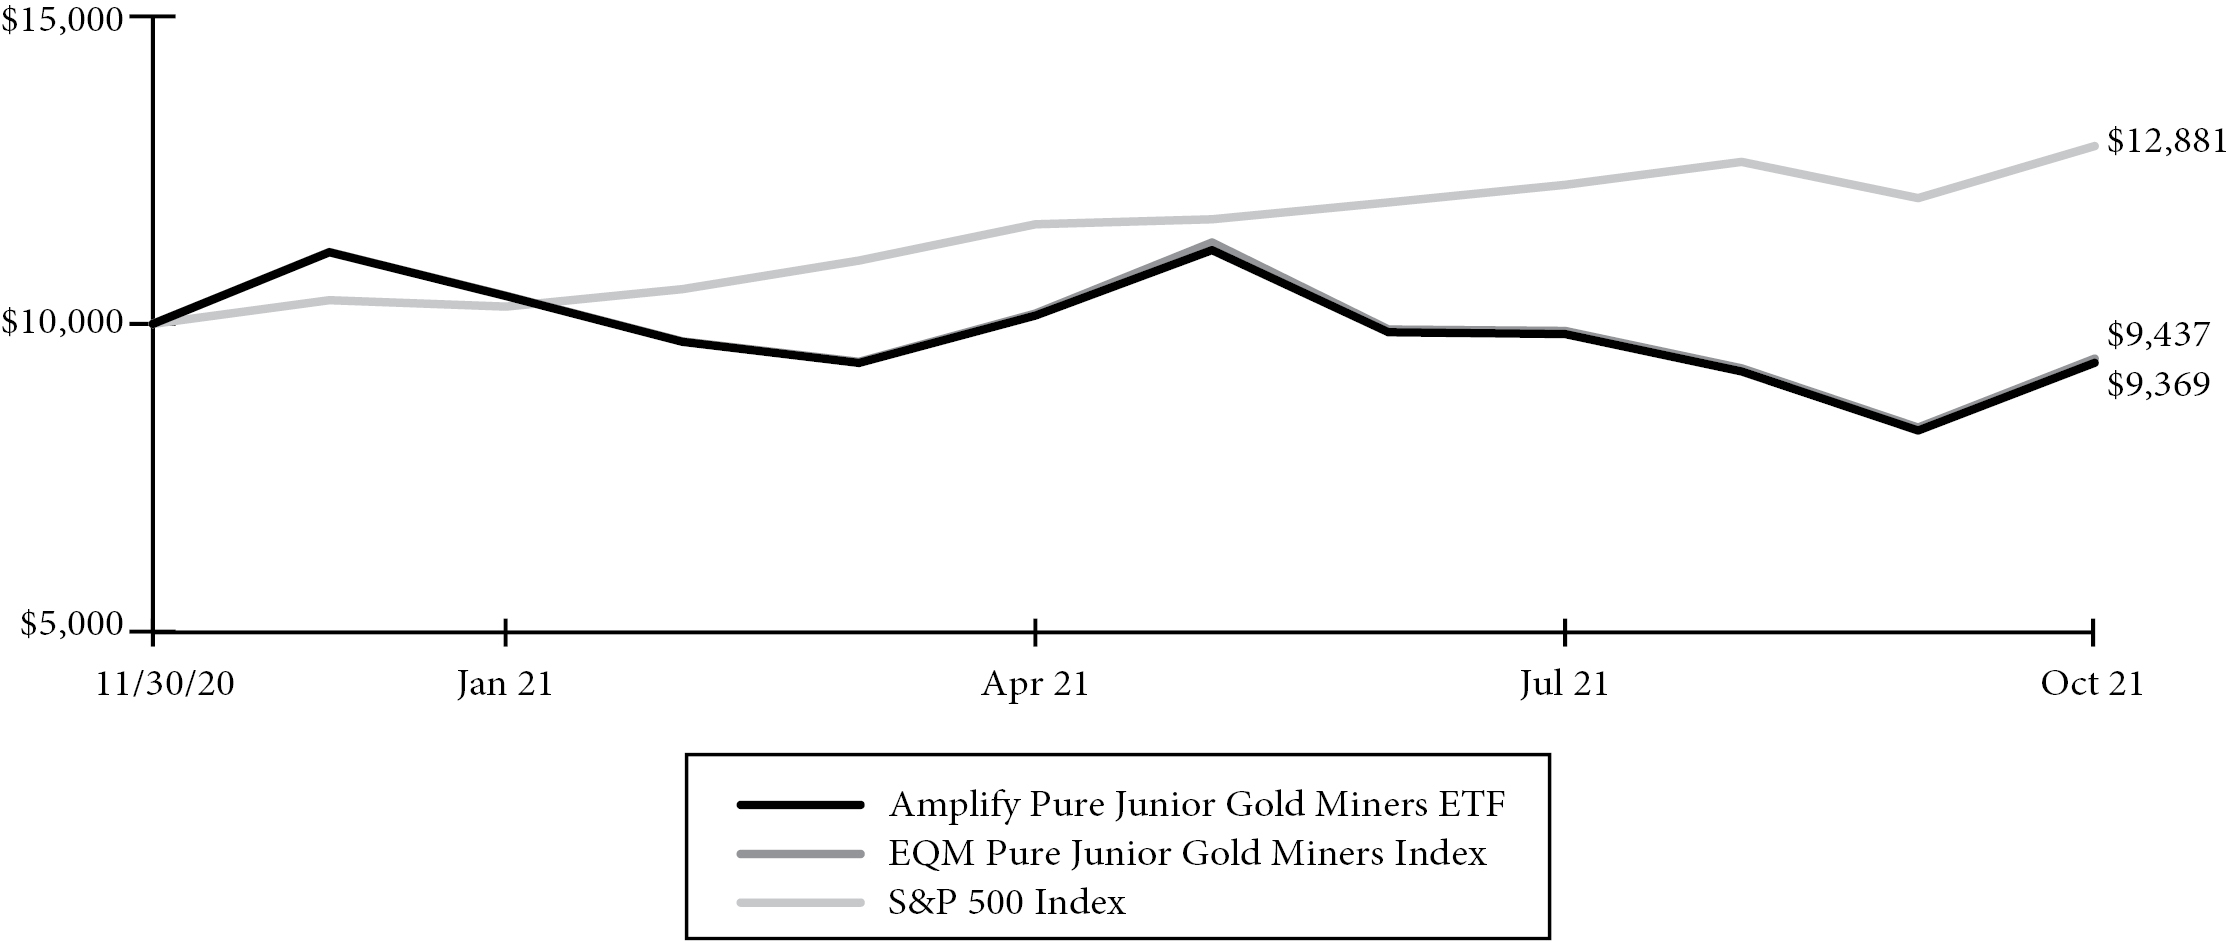
Amplify Pure Junior Gold Miners ETF
Fund Performance
October 31, 2021 (Unaudited)
Growth of a $10,000 Investment
(at Net Asset Value)
| | TOTAL RETURN FOR THE PERIOD
ENDED OCTOBER 31, 2021 |
| | | Inception to Date(a) |
| | | Net Asset
Value | | Market
Price |
Amplify Pure Junior Gold Miners ETF | | -6.31% | | -6.08% |
EQM Pure Junior Gold Miners Index | | -5.63% | | -5.63% |
S&P 500 Index | | 28.81% | | 28.81% |
The performance data quoted herein represents past performance and the return and value of an investment in the Fund will fluctuate so that shares, when redeemed or sold in the market, may be worth more or less than their original cost. Past performance is no guarantee of future performance and should not be considered as a representation of the future results of the Fund. The Fund’s performance assumes the reinvestment of all dividends and all capital gains. Index returns assume reinvestment of dividends and, unlike a Fund’s returns, do not reflect any fees or expenses. If such fees and expenses were included in the index returns, the performance would have been lower. Please note that one cannot invest directly in an unmanaged index.
There are no assurances that the Fund will meet its stated objectives.
The Fund’s holdings and allocations are subject to change and should not be considered recommendations to buy individual securities.
Returns shown do not reflect the deduction of taxes that a shareholder would pay on Fund distributions or the redemption of Fund shares.
11
Amplify ETF Trust
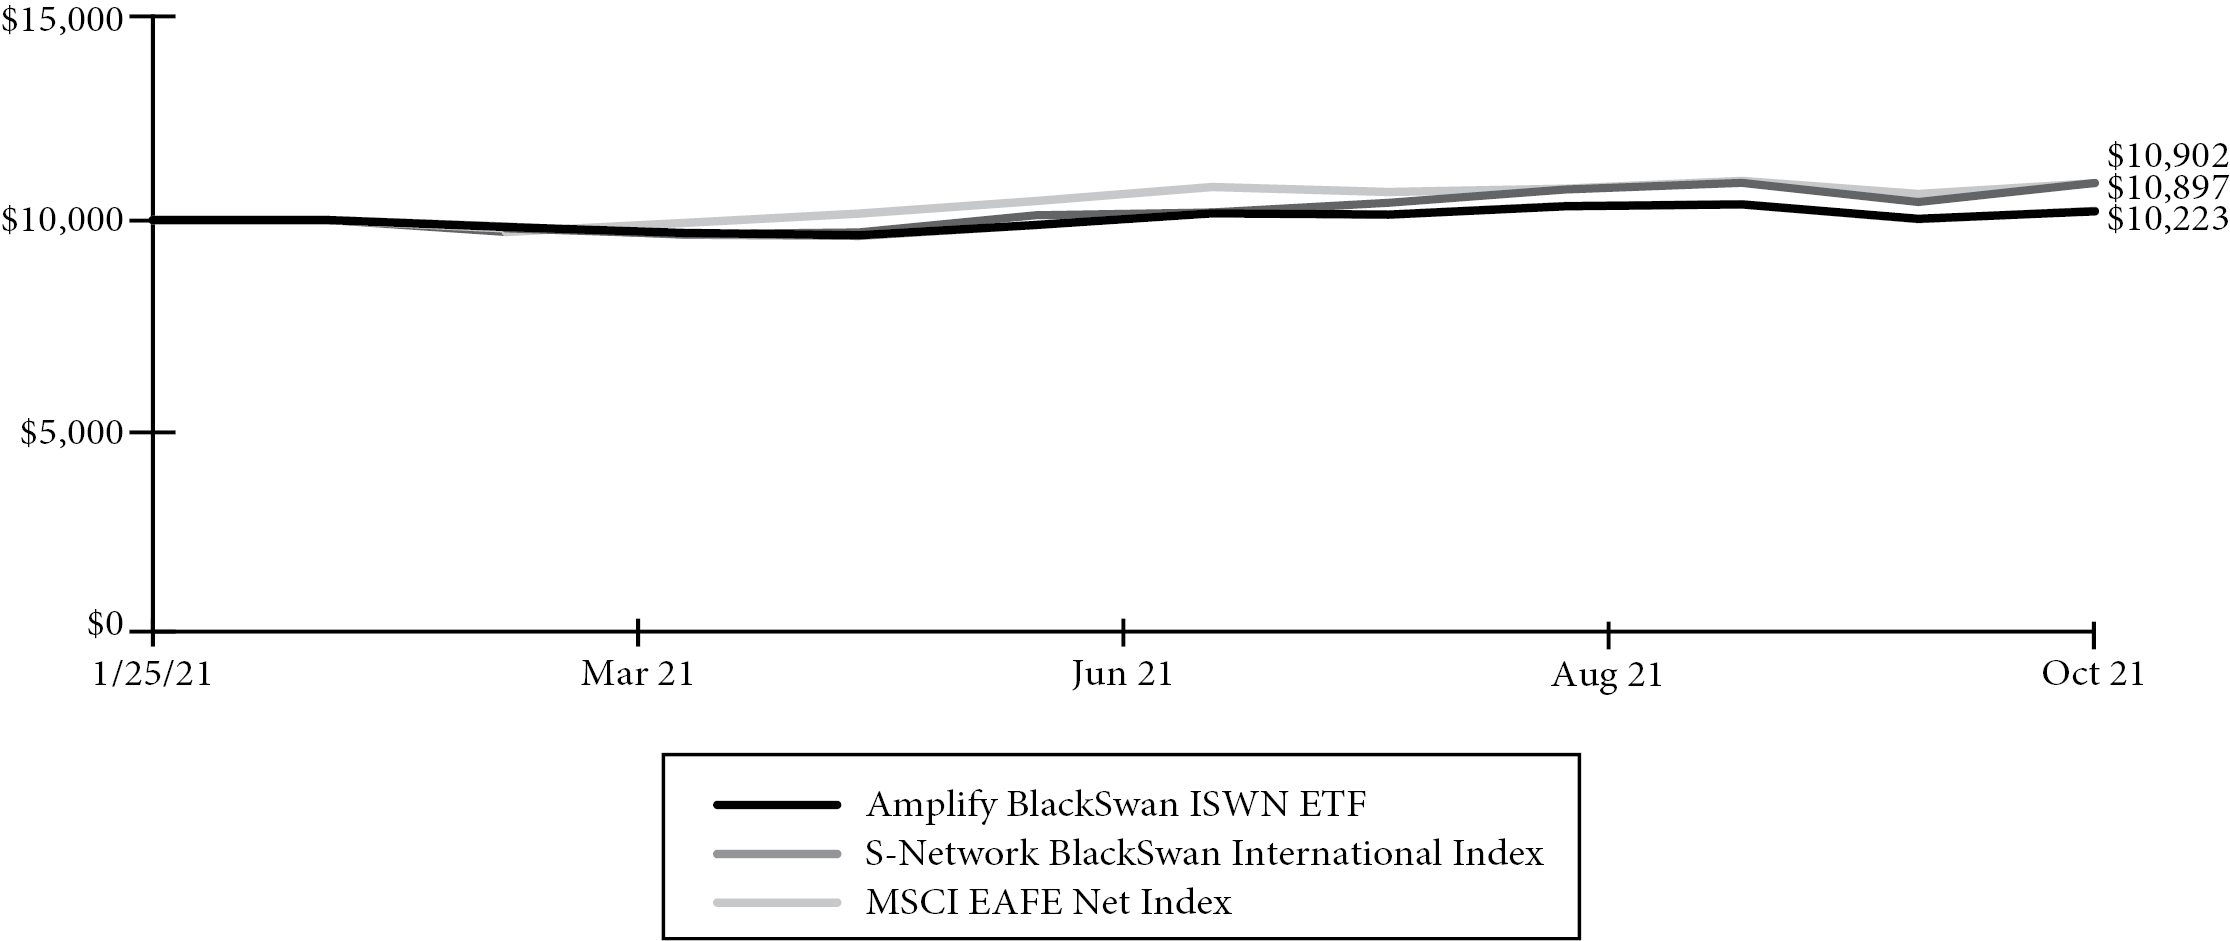
Amplify BlackSwan ISWN ETF
Fund Performance
October 31, 2021 (Unaudited)
Growth of a $10,000 Investment
(at Net Asset Value)
| | TOTAL RETURN FOR THE PERIOD ENDED OCTOBER 31, 2021 |
| | | Inception to Date(a) |
| | | Net Asset
Value | | Market
Price |
Amplify BlackSwan ISWN ETF | | 2.23% | | 2.12% |
S-Network BlackSwan International Index | | 2.57% | | 2.57% |
MSCI EAFE Net Index | | 8.97% | | 8.97% |
The performance data quoted herein represents past performance and the return and value of an investment in the Fund will fluctuate so that shares, when redeemed or sold in the market, may be worth more or less than their original cost. Past performance is no guarantee of future performance and should not be considered as a representation of the future results of the Fund. The Fund’s performance assumes the reinvestment of all dividends and all capital gains. Index returns assume reinvestment of dividends and, unlike a Fund’s returns, do not reflect any fees or expenses. If such fees and expenses were included in the index returns, the performance would have been lower. Please note that one cannot invest directly in an unmanaged index.
There are no assurances that the Fund will meet its stated objectives.
The Fund’s holdings and allocations are subject to change and should not be considered recommendations to buy individual securities.
Returns shown do not reflect the deduction of taxes that a shareholder would pay on Fund distributions or the redemption of Fund shares.
12
Amplify ETF Trust
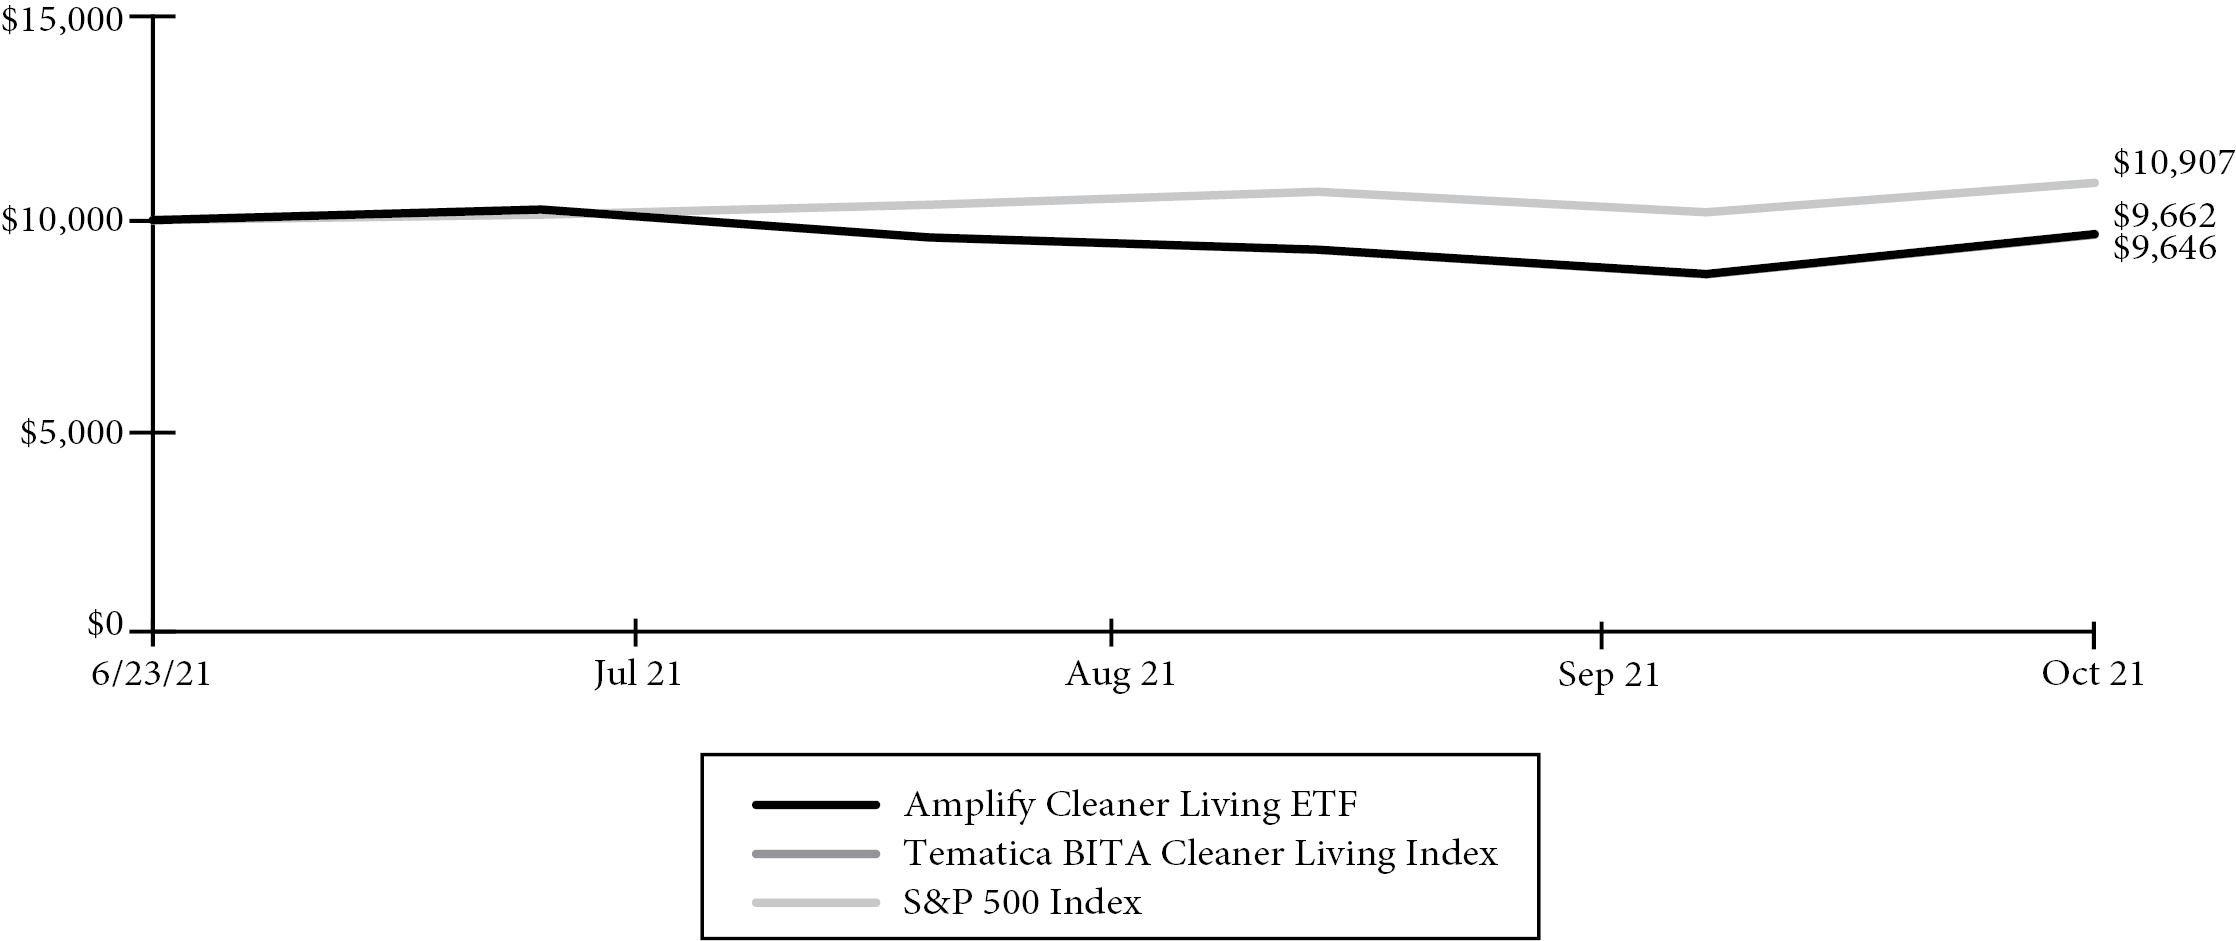
Amplify Cleaner Living ETF
Fund Performance
October 31, 2021 (Unaudited)
Growth of a $10,000 Investment
(at Net Asset Value)
| | TOTAL RETURN FOR THE PERIOD ENDED OCTOBER 31, 2021 |
| | | Inception to Date(a) |
| | | Net Asset
Value | | Market
Price |
Amplify Cleaner Living ETF | | -3.54% | | -3.25% |
Tematica BITA Cleaner Living Index | | -3.38% | | -3.38% |
S&P 500 Index | | 9.07% | | 9.07% |
The performance data quoted herein represents past performance and the return and value of an investment in the Fund will fluctuate so that shares, when redeemed or sold in the market, may be worth more or less than their original cost. Past performance is no guarantee of future performance and should not be considered as a representation of the future results of the Fund. The Fund’s performance assumes the reinvestment of all dividends and all capital gains. Index returns assume reinvestment of dividends and, unlike a Fund’s returns, do not reflect any fees or expenses. If such fees and expenses were included in the index returns, the performance would have been lower. Please note that one cannot invest directly in an unmanaged index.
There are no assurances that the Fund will meet its stated objectives.
The Fund’s holdings and allocations are subject to change and should not be considered recommendations to buy individual securities.
Returns shown do not reflect the deduction of taxes that a shareholder would pay on Fund distributions or the redemption of Fund shares.
13
Amplify ETF Trust
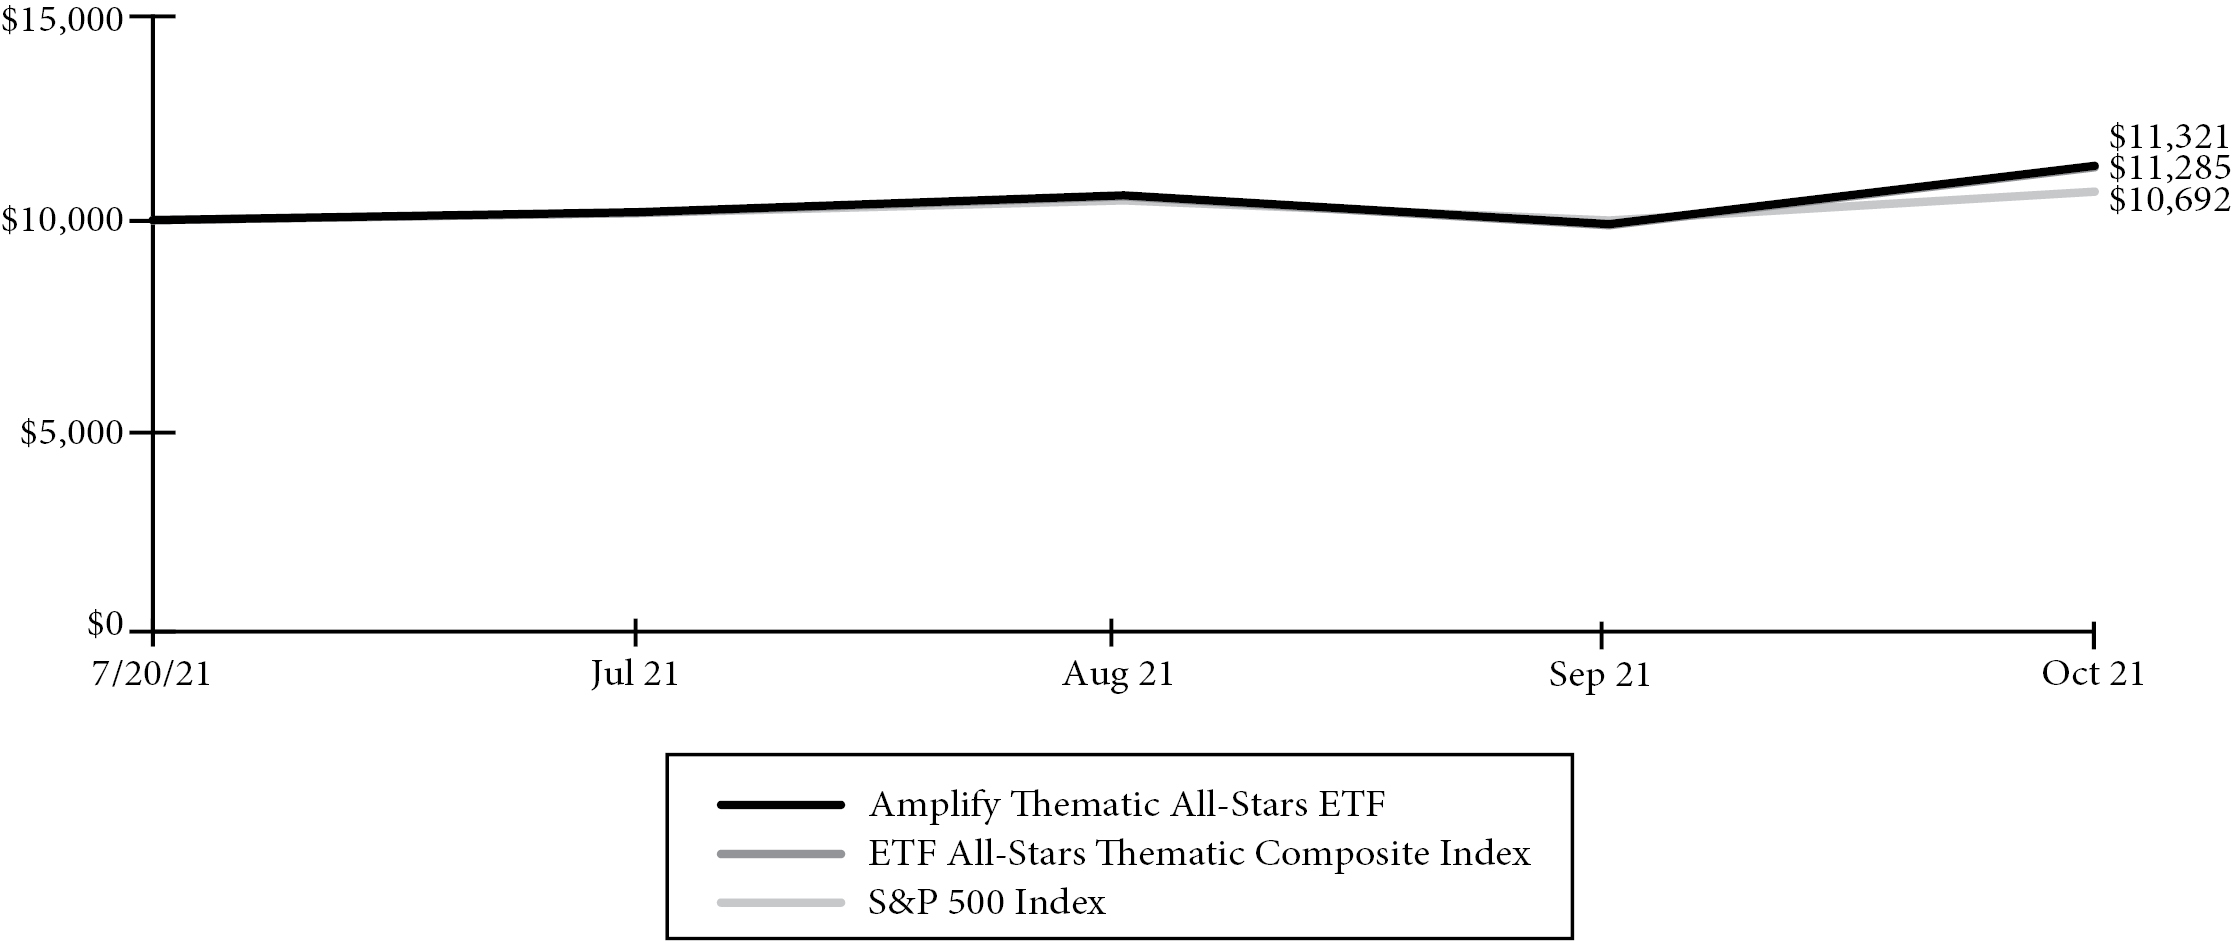
Amplify Thematic All-Stars ETF
Fund Performance
October 31, 2021 (Unaudited)
Growth of a $10,000 Investment
(at Net Asset Value)
| | TOTAL RETURN FOR THE PERIOD ENDED OCTOBER 31, 2021 |
| | | Inception to Date(a) |
| | | Net Asset
Value | | Market
Price |
Amplify Thematic All-Stars ETF | | 12.85% | | 13.16% |
ETF All-Stars Thematic Composite Index | | 13.21% | | 13.21% |
S&P 500 Index | | 6.92% | | 6.92% |
The performance data quoted herein represents past performance and the return and value of an investment in the Fund will fluctuate so that shares, when redeemed or sold in the market, may be worth more or less than their original cost. Past performance is no guarantee of future performance and should not be considered as a representation of the future results of the Fund. The Fund’s performance assumes the reinvestment of all dividends and all capital gains. Index returns assume reinvestment of dividends and, unlike a Fund’s returns, do not reflect any fees or expenses. If such fees and expenses were included in the index returns, the performance would have been lower. Please note that one cannot invest directly in an unmanaged index.
There are no assurances that the Fund will meet its stated objectives.
The Fund’s holdings and allocations are subject to change and should not be considered recommendations to buy individual securities.
Returns shown do not reflect the deduction of taxes that a shareholder would pay on Fund distributions or the redemption of Fund shares.
14
Amplify ETF Trust
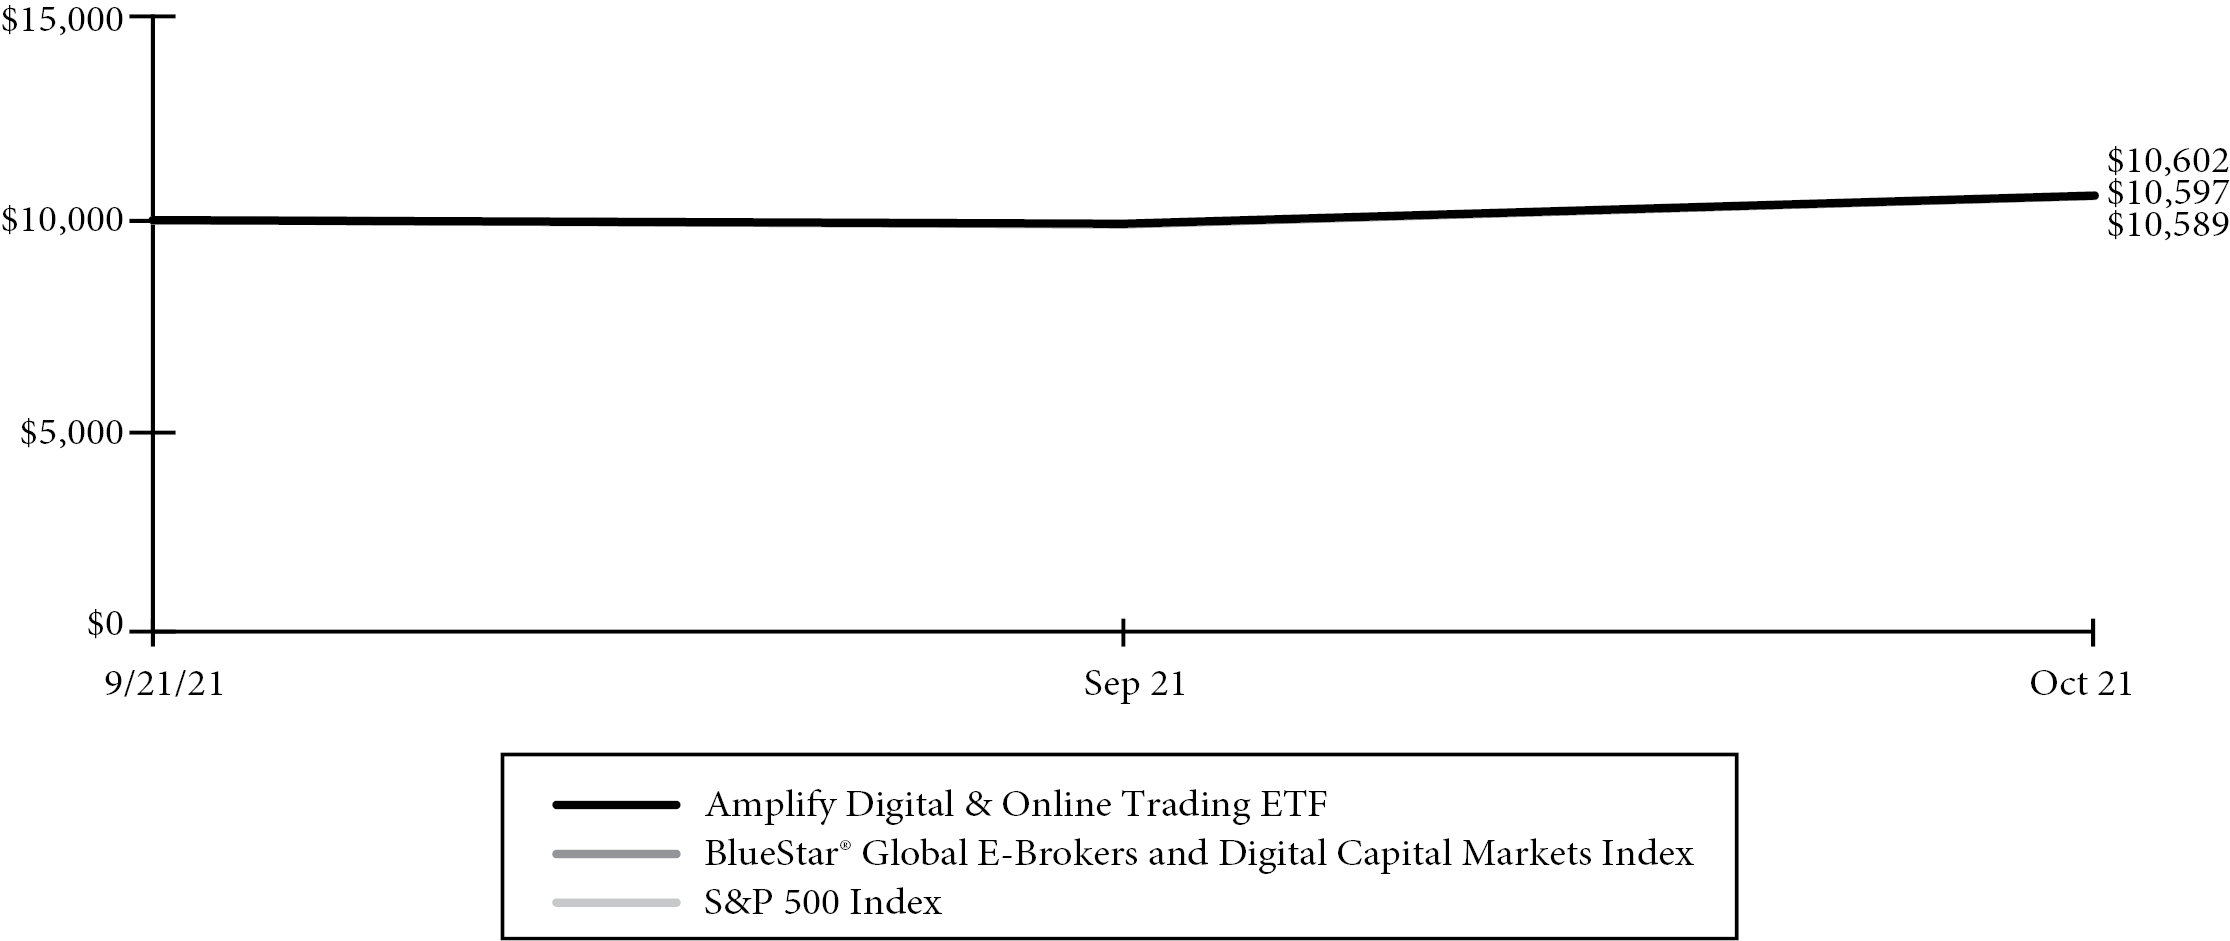
Amplify Digital & Online Trading ETF
Fund Performance
October 31, 2021 (Unaudited)
Growth of a $10,000 Investment
(at Net Asset Value)
| | TOTAL RETURN FOR THE PERIOD ENDED OCTOBER 31, 2021 |
| | | Inception to Date(a) |
| | | Net Asset
Value | | Market
Price |
Amplify Digital & Online Trading ETF | | 5.97% | | 6.17% |
BlueStar® Global E-Brokers and Digital Capital Markets Index | | 6.02% | | 6.02% |
S&P 500 Index | | 5.89% | | 5.89% |
The performance data quoted herein represents past performance and the return and value of an investment in the Fund will fluctuate so that shares, when redeemed or sold in the market, may be worth more or less than their original cost. Past performance is no guarantee of future performance and should not be considered as a representation of the future results of the Fund. The Fund’s performance assumes the reinvestment of all dividends and all capital gains. Index returns assume reinvestment of dividends and, unlike a Fund’s returns, do not reflect any fees or expenses. If such fees and expenses were included in the index returns, the performance would have been lower. Please note that one cannot invest directly in an unmanaged index.
There are no assurances that the Fund will meet its stated objectives.
The Fund’s holdings and allocations are subject to change and should not be considered recommendations to buy individual securities.
Returns shown do not reflect the deduction of taxes that a shareholder would pay on Fund distributions or the redemption of Fund shares.
15
Amplify ETF Trust
Amplify High Income ETF
Schedule of Investments
October 31, 2021
Description | | Shares | | Value |
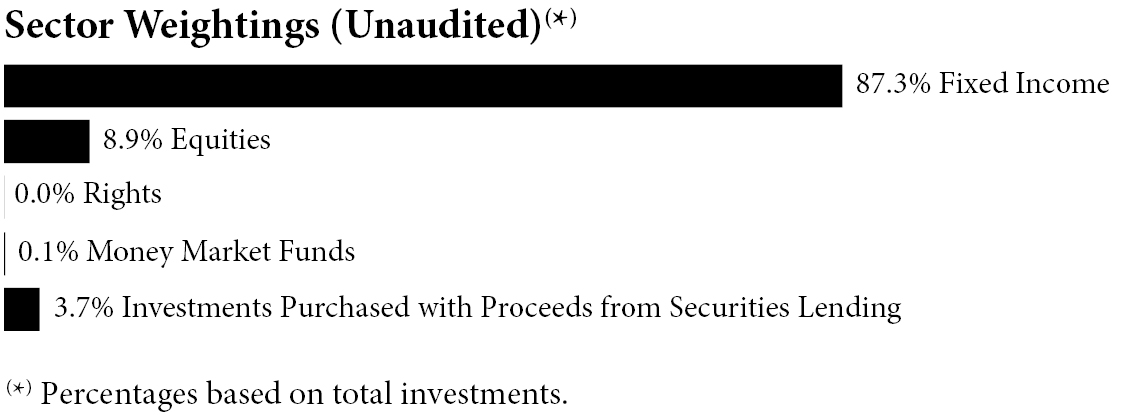
INVESTMENT COMPANIES — 99.7% | | | | | |
Equity — 9.3% | | | | | |
Aberdeen Total Dynamic
Dividend Fund | | 1,237,101 | | $ | 12,432,865 |
BlackRock Enhanced Equity
Dividend Trust | | 669,182 | | | 6,905,958 |
BlackRock Enhanced Global Dividend Trust(a) | | 287,642 | | | 3,500,603 |
John Hancock Tax-Advantaged Dividend Income Fund | | 172,217 | | | 4,224,483 |
Liberty All-Star Equity Fund(a) | | 1,723,776 | | | 14,531,432 |
| | | | | | 41,595,341 |
Fixed Income — 90.4% | | | | | |
AllianceBernstein Global High Income Fund, Inc. | | 1,043,268 | | | 12,978,254 |
BlackRock Corporate High Yield Fund, Inc. | | 705,748 | | | 8,588,953 |
BlackRock Credit Allocation Income Trust | | 869,615 | | | 13,244,236 |
BlackRock Debt Strategies Fund, Inc. | | 173,390 | | | 2,035,599 |
BlackRock Taxable Municipal
Bond Trust | | 182,562 | | | 4,772,171 |
Blackstone Strategic Credit Fund | | 921,529 | | | 12,855,330 |
Calamos Global Dynamic
Income Fund | | 297,623 | | | 3,092,303 |
DoubleLine Income Solutions Fund | | 737,425 | | | 13,022,925 |
DoubleLine Yield Opportunities Fund | | 665,199 | | | 12,931,469 |
Eaton Vance Floating-Rate Income
Trust(a) | | 676,784 | | | 10,144,992 |
Eaton Vance Limited Duration Income Fund | | 1,001,721 | | | 13,222,717 |
Eaton Vance Senior Floating - Rate Trust(a) | | 808,551 | | | 12,047,410 |
First Trust High Income Long/Short Fund | | 759,159 | | | 12,184,502 |
First Trust High Yield Opportunities 2027 Term Fund | | 644,369 | | | 13,493,087 |
First Trust Intermediate Duration Preferred & Income Fund(a) | | 134,374 | | | 3,423,850 |
Flaherty & Crumrine Preferred and Income Securities Fund, Inc. | | 115,102 | | | 2,587,493 |
Description | | Shares | | Value |
Highland Income Fund | | 970,242 | | $ | 11,051,056 |
NexPoint Strategic Opportunities Fund | | 520,844 | | | 7,911,620 |
Nuveen AMT-Free Quality Municipal Income Fund | | 451,679 | | | 6,856,487 |
Nuveen Core Plus Impact Fund(a) | | 674,781 | | | 12,490,196 |
Nuveen Credit Strategies Income Fund | | 917,136 | | | 6,043,926 |
Nuveen Floating Rate Income Fund | | 1,302,338 | | | 13,335,941 |
Nuveen Municipal Credit Opportunities Fund | | 382,066 | | | 5,746,273 |
Nuveen Preferred & Income Opportunities Fund | | 516,669 | | | 5,156,357 |
Nuveen Preferred & Income Securities Fund | | 783,150 | | | 7,784,511 |
Nuveen Quality Municipal
Income Fund | | 334,947 | | | 5,235,222 |
Oxford Lane Capital Corp. | | 2,080,916 | | | 16,647,328 |
PGIM Global High Yield Fund, Inc. | | 811,915 | | | 12,730,827 |
PGIM High Yield Bond Fund, Inc.(a) | | 790,650 | | | 13,037,818 |
PIMCO Corporate & Income Opportunity Fund | | 782,533 | | | 14,187,323 |
PIMCO Dynamic Credit and Mortgage Income Fund | | 663,575 | | | 14,266,863 |
PIMCO Dynamic Income Fund | | 516,683 | | | 13,841,938 |
PIMCO Dynamic Income Opportunities Fund | | 443,555 | | | 9,217,073 |
PIMCO High Income Fund | | 1,388,671 | | | 8,915,268 |
PIMCO Income Strategy Fund II | | 1,010,018 | | | 10,191,082 |
Templeton Global Income Fund | | 2,337,933 | | | 12,765,114 |
Virtus AllianzGI Convertible & Income Fund | | 2,162,960 | | | 13,605,018 |
Wells Fargo Income Opportunities
Fund | | 1,476,453 | | | 13,214,254 |
Western Asset Emerging Markets Debt Fund, Inc. | | 815,698 | | | 11,142,435 |
Western Asset High Income Opportunity Fund, Inc. | | 1,883,211 | | | 9,830,361 |
| | | | | | 405,829,582 |
Total Investment Companies
(Cost $432,854,808) | | | | | 447,424,923 |
| | | | | | |
RIGHTS — 0.0%(b) | | | | | |
Liberty All-Star Equity Fund(a)(c) | | 1,671,456 | | | 61,510 |
Total Rights
(Cost $0) | | | | | 61,510 |
| | | | | | |
MONEY MARKET FUNDS — 0.1% | | | | | |
Invesco Government & Agency Portfolio - Institutional
Class — 0.03%(d) | | 479,599 | | | 479,599 |
Total Money Market Funds
(Cost $479,599) | | | | | 479,599 |
The accompanying notes are an integral part of the financial statements.
16
Amplify ETF Trust
Amplify High Income ETF
Schedule of Investments
October 31, 2021 (Continued)
Description | | Shares | | Value |
INVESTMENTS PURCHASED WITH PROCEEDS FROM SECURITIES LENDING — 3.8% | | | | | |
First American Government Obligations Fund - Class X — 0.03%(d) | | 17,004,950 | | $ | 17,004,950 |
Total Investments Purchased with Proceeds from Securities Lending
(Cost $17,004,950) | | | | | 17,004,950 |
| | | | | | |
Total Investments — 103.6% | | | | | |
(Cost $450,339,357) | | | | $ | 464,970,982 |
Percentages are based on Net Assets of $448,970,862.
The accompanying notes are an integral part of the financial statements.
17
Amplify ETF Trust
Amplify Online Retail ETF
Schedule of Investments
October 31, 2021
Description | | Shares | | Value |
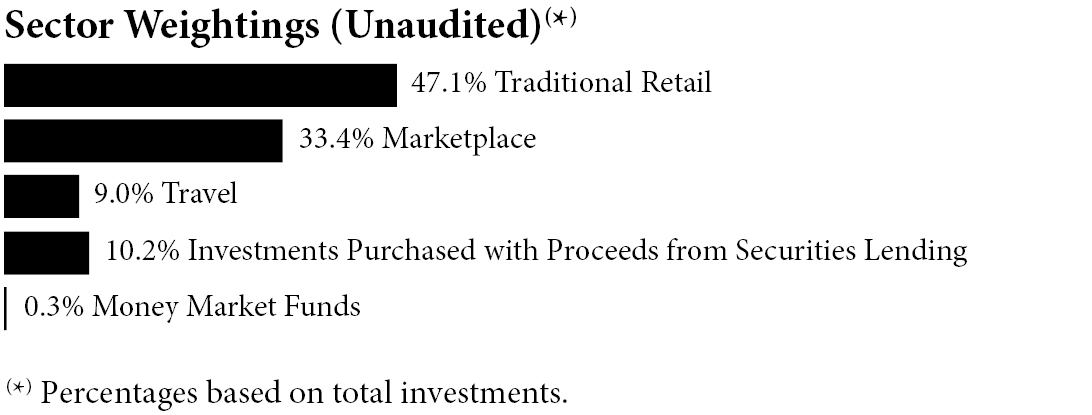
COMMON STOCKS — 99.7% | | | | | |
Marketplace — 37.2% | | | | | |
Alibaba Group Holding Ltd. - ADR(a) | | 35,159 | | $ | 5,799,125 |
BigCommerce Holdings, Inc.(a) | | 370,291 | | | 17,111,147 |
ContextLogic, Inc. - Class A(a)(b) | | 1,761,419 | | | 8,983,237 |
Copart, Inc.(a) | | 138,924 | | | 21,573,508 |
Coupang, Inc.(a) | | 202,167 | | | 6,016,490 |
Dada Nexus Ltd. - ADR(a) | | 335,218 | | | 6,808,278 |
Delivery Hero SE (a)(c) | | 57,897 | | | 7,198,223 |
DoorDash, Inc. - Class A(a) | | 122,242 | | | 23,812,742 |
Etsy, Inc.(a) | | 105,726 | | | 26,504,451 |
Fiverr International Ltd. - ADR(a) | | 43,405 | | | 7,394,042 |
Groupon, Inc. (a)(b) | | 372,929 | | | 7,913,553 |
Jumia Technologies AG - ADR(a)(b) | | 283,483 | | | 4,952,448 |
Just Eat Takeaway.com NV(a)(c) | | 281,394 | | | 20,207,150 |
KE Holdings, Inc. - ADR(a) | | 147,296 | | | 2,683,733 |
Liquidity Services, Inc.(a) | | 634,218 | | | 14,003,533 |
Lyft, Inc. - Class A(a) | | 347,322 | | | 15,931,660 |
MercadoLibre, Inc.(a) | | 5,569 | | | 8,247,800 |
Ozon Holdings PLC - ADR(a)(b) | | 131,914 | | | 5,936,130 |
PayPal Holdings, Inc.(a) | | 70,017 | | | 16,285,254 |
Pinduoduo, Inc. - ADR(a) | | 62,240 | | | 5,534,381 |
Poshmark, Inc. - Class A(a)(b) | | 471,418 | | | 11,469,600 |
Rakuten Group, Inc. | | 617,800 | | | 6,775,609 |
Shopify, Inc. - Class A - ADR(a) | | 6,793 | | | 9,963,497 |
The RealReal, Inc.(a) | | 1,192,550 | | | 15,538,927 |
ThredUp, Inc. - Class A(a)(b) | | 949,052 | | | 20,537,485 |
Uber Technologies, Inc.(a) | | 363,654 | | | 15,935,318 |
Upwork, Inc.(a) | | 431,219 | | | 20,319,039 |
| | | | | | 333,436,360 |
Traditional Retail — 52.5% | | | | | |
1-800-Flowers.com, Inc. - Class A(a) | | 522,082 | | | 16,769,274 |
Amazon.com, Inc.(a) | | 5,350 | | | 18,042,500 |
AO World PLC(a) | | 2,056,845 | | | 4,118,194 |
ASKUL Corp. | | 444,000 | | | 6,022,584 |
ASOS PLC(a) | | 105,331 | | | 3,577,823 |
CarParts.com, Inc.(a) | | 1,133,004 | | | 17,255,651 |
Carvana Co.(a) | | 72,599 | | | 22,010,565 |
Description | | Shares | | Value |
Casper Sleep, Inc.(a)(b) | | 1,811,371 | | $ | 6,593,390 |
Chegg, Inc.(a) | | 222,939 | | | 13,251,494 |
Chewy, Inc. - Class A(a)(b) | | 254,528 | | | 19,293,222 |
Cimpress PLC - ADR(a) | | 70,659 | | | 6,311,262 |
eBay, Inc. | | 284,866 | | | 21,854,919 |
Farfetch Ltd. - Class A - ADR(a) | | 175,776 | | | 6,892,177 |
HelloFresh SE(a) | | 90,492 | | | 7,322,629 |
IAC/InterActiveCorp(a) | | 110,607 | | | 16,853,189 |
iQIYI, Inc. - ADR(a)(b) | | 573,581 | | | 4,749,251 |
JD.com, Inc. - ADR(a) | | 108,067 | | | 8,459,485 |
Lands’ End, Inc.(a) | | 769,151 | | | 20,213,288 |
MYT Netherlands Parent BV - ADR(a)(b) | | 261,998 | | | 6,916,747 |
Netflix, Inc.(a) | | 34,956 | | | 24,130,476 |
Ocado Group PLC(a) | | 262,997 | | | 6,489,443 |
Overstock.com, Inc.(a) | | 242,400 | | | 23,083,752 |
Peloton Interactive, Inc. - Class A(a) | | 178,549 | | | 16,326,521 |
PetMed Express, Inc.(b) | | 611,504 | | | 17,385,059 |
Purple Innovation, Inc.(a) | | 552,705 | | | 10,667,206 |
Qurate Retail, Inc. - Class A | | 1,306,382 | | | 13,638,628 |
Revolve Group, Inc.(a) | | 365,190 | | | 27,403,858 |
Shutterstock, Inc. | | 197,523 | | | 23,929,911 |
Spotify Technology SA - ADR(a) | | 32,940 | | | 9,532,836 |
Stitch Fix, Inc. - Class A(a) | | 400,470 | | | 13,856,262 |
THG PLC(a) | | 844,686 | | | 2,503,887 |
Vipshop Holdings Ltd. - ADR(a) | | 291,789 | | | 3,256,365 |
Vroom, Inc.(a)(b) | | 443,754 | | | 8,489,014 |
Wayfair, Inc. - Class A(a)(b) | | 57,486 | | | 14,319,763 |
Zalando SE(a)(c) | | 72,129 | | | 6,802,247 |
zooplus AG(a) | | 27,099 | | | 14,986,604 |
ZOZO, Inc. | | 228,000 | | | 7,291,599 |
| | | | | | 470,601,075 |
Travel — 10.0% | | | | | |
Airbnb, Inc. - Class A(a) | | 122,132 | | | 20,843,047 |
Booking Holdings, Inc.(a) | | 7,559 | | | 18,298,676 |
Expedia Group, Inc.(a) | | 100,377 | | | 16,502,983 |
MakeMyTrip Ltd. - ADR(a) | | 299,019 | | | 9,469,932 |
On the Beach Group PLC(a)(c) | | 1,413,910 | | | 5,775,997 |
Trip.com Group Ltd. - ADR(a) | | 196,347 | | | 5,607,670 |
TripAdvisor, Inc.(a) | | 408,923 | | | 13,482,191 |
| | | | | | 89,980,496 |
Total Common Stocks
(Cost $863,942,199) | | | | | 894,017,931 |
| | | | | | |
MONEY MARKET FUNDS — 0.3% | | | | | |
Invesco Government & Agency Portfolio - Institutional
Class — 0.03%(d) | | 3,105,588 | | | 3,105,588 |
Total Money Market Funds
(Cost $3,105,588) | | | | | 3,105,588 |
The accompanying notes are an integral part of the financial statements.
18
Amplify ETF Trust
Amplify Online Retail ETF
Schedule of Investments
October 31, 2021 (Continued)
Description | | Shares | | Value |
INVESTMENTS PURCHASED WITH PROCEEDS FROM SECURITIES LENDING — 11.3% | | | | | |
First American Government Obligations Fund - Class X — 0.03%(d) | | 101,273,216 | | $ | 101,273,216 |
Total Investments Purchased with Proceeds from Securities Lending
(Cost $101,273,216) | | | | | 101,273,216 |
| | | | | | |
Total Investments — 111.3% | | | | | |
(Cost $968,321,003) | | | | $ | 998,396,735 |
Percentages are based on Net Assets of $896,681,584.
ADR - American Depositary Receipt
For Fund compliance purposes, the Fund’s industry classifications refer to any one or more of the industry sub-classifications used by one or more widely recognized market indexes or ratings group indexes, and/or they may be defined by Fund management. This definition may not apply for purposes of this report, which may combine sub-classifications for reporting ease. Industries are shown as a percentage of net assets.
The accompanying notes are an integral part of the financial statements.
19
Amplify ETF Trust
Amplify CWP Enhanced Dividend Income ETF
Schedule of Investments
October 31, 2021

Description | | Shares | | Value |
COMMON STOCKS — 77.3% | | | | | |
Consumer Discretionary — 13.5% | | | | | |
McDonald’s Corp. | | 160,743 | | $ | 39,470,444 |
NIKE, Inc. - Class B | | 147,811 | | | 24,727,302 |
The Home Depot, Inc. | | 106,341 | | | 39,531,203 |
| | | | | | 103,728,949 |
Consumer Staples — 6.1% | | | | | |
The Procter & Gamble Co. | | 157,792 | | | 22,562,678 |
Walmart, Inc. | | 164,028 | | | 24,509,064 |
| | | | | | 47,071,742 |
Energy — 7.1% | | | | | |
Chevron Corp.(a) | | 376,276 | | | 43,079,839 |
Marathon Petroleum Corp. | | 169,961 | | | 11,205,529 |
| | | | | | 54,285,368 |
Financials — 12.7% | | | | | |
Intercontinental Exchange, Inc. | | 185,550 | | | 25,691,253 |
JPMorgan Chase & Co. | | 201,888 | | | 34,298,752 |
The Goldman Sachs Group, Inc. | | 90,293 | | | 37,322,612 |
| | | | | | 97,312,617 |
Health Care — 9.1% | | | | | |
Johnson & Johnson | | 134,064 | | | 21,836,344 |
UnitedHealth Group, Inc. | | 105,018 | | | 48,357,639 |
| | | | | | 70,193,983 |
Industrials — 9.7% | | | | | |
3M Co. | | 82,600 | | | 14,758,968 |
CSX Corp. | | 671,220 | | | 24,278,027 |
Honeywell International, Inc. | | 161,192 | | | 35,239,795 |
| | | | | | 74,276,790 |
Information Technology — 16.2% | | | | | |
Apple, Inc.(a) | | 279,855 | | | 41,922,279 |
Microsoft Corp. | | 144,020 | | | 47,759,913 |
Visa, Inc. - Class A(a) | | 161,816 | | | 34,267,774 |
| | | | | | 123,949,966 |
Description | | Shares | | Value |
Utilities — 2.9% | | | | | |
Duke Energy Corp. | | 214,936 | | $ | 21,925,621 |
Total Common Stocks
(Cost $524,037,380) | | | | | 592,745,036 |
| | | | | | |
EXCHANGE TRADED FUNDS — 9.4% | | | | | |
SPDR Dow Jones Industrial Average ETF Trust | | 97,832 | | | 35,046,358 |
SPDR S&P 500 ETF Trust | | 80,540 | | | 36,987,995 |
Total Exchange Traded Funds
(Cost $71,407,466) | | | | | 72,034,353 |
| | | | | | |
Total Investments — 86.7% | | | | | |
(Cost $595,444,846) | | | | $ | 664,779,389 |
Percentages are based on Net Assets of $766,353,441.
The Global Industry Classification Standard (GICS®) was developed by and/or is the exclusive property of MSCI, Inc. and Standard & Poor’s Financial Services LLC (“S&P”). GICS® is a service mark of MSCI, Inc. and S&P and has been licensed for use by U.S. Bank Global Fund Services.
The accompanying notes are an integral part of the financial statements.
20
Amplify ETF Trust
Amplify CWP Enhanced Dividend Income ETF
Schedule of Options Written
October 31, 2021
| | Contracts | | Notional
Amount | | Value |
Call Options Written(a) — 0.00%(b) | | | | | | | | | | |
Apple, Inc., Expires 11/19/2021, Strike Price $165.00 | | 2,500 | | $ | (37,450,000 | ) | | $ | (43,750 | ) |
Chevron Corp., Expires 11/19/2021, Strike Price $120.00 | | 3,000 | | | (34,347,000 | ) | | | (112,500 | ) |
Visa, Inc., Expires 11/19/2021, Strike Price $225.00 | | 200 | | | (4,235,400 | ) | | | (17,100 | ) |
Total Call Options Written | | | | | | | | | | |
(Premiums Received $258,764) | | | | | | | | $ | (173,350 | ) |
The accompanying notes are an integral part of the financial statements.
21
Amplify ETF Trust
Amplify Transformational Data Sharing ETF
Schedule of Investments
October 31, 2021
Description | | Shares | | Value |
COMMON STOCKS — 87.2% | | | | | |
Banks — 4.6% | | | | | |
Silvergate Capital Corp.(a) | | 442,385 | | $ | 69,286,339 |
| | | | | | |
Diversified Financials — 22.7% | | | | | |
CME Group, Inc. | | 227,113 | | | 50,089,772 |
Coinbase Global, Inc. - Class A(a) | | 236,270 | | | 75,469,363 |
EQONEX Ltd.(a)(b) | | 1,885,859 | | | 12,918,134 |
Galaxy Digital Holdings Ltd.(a)(b) | | 2,849,814 | | | 77,094,193 |
Mogo, Inc.(a)(b) | | 4,385,716 | | | 24,077,581 |
Nocturne Acquisition Corp.(a)(e) | | 380,000 | | | 3,936,800 |
Power & Digital Infrastructure Acquisition Corp. - Class A(a)(e) | | 477,768 | | | 5,972,100 |
Robinhood Markets, Inc. - Class A(a)(b) | | 392,831 | | | 13,737,300 |
SBI Holdings, Inc./Japan | | 1,930,997 | | | 49,844,204 |
Vontobel Holding AG | | 122,234 | | | 11,307,580 |
WisdomTree Investments, Inc. | | 2,240,749 | | | 14,318,386 |
| | | | | | 338,765,413 |
Media & Entertainment — 3.4% | | | | | |
Tencent Holdings Ltd. | | 113,125 | | | 6,993,526 |
Twitter, Inc.(a) | | 273,283 | | | 14,631,572 |
Z Holdings Corp. | | 4,655,090 | | | 28,835,214 |
| | | | | | 50,460,312 |
Retailing — 3.4% | | | | | |
Overstock.com, Inc.(a) | | 470,386 | | | 44,794,859 |
Rakuten Group, Inc. | | 577,747 | | | 6,336,334 |
| | | | | | 51,131,193 |
Semiconductors & Semiconductor Equipment — 6.4% | | | | | |
Advanced Micro Devices, Inc.(a) | | 158,363 | | | 19,039,983 |
NVIDIA Corp. | | 252,204 | | | 64,480,997 |
Taiwan Semiconductor Manufacturing Co. Ltd. - ADR | | 111,798 | | | 12,711,433 |
| | | | | | 96,232,413 |
Description | | Shares | | Value |
Software & Services — 44.4% | | | | | | |
Accenture PLC - Class A | | | 77,846 | | $ | 27,930,366 |
Argo Blockchain PLC(a) | | | 22,856,985 | | | 38,162,750 |
Bakkt Holdings, Inc.(a)(b) | | | 852,609 | | | 36,252,935 |
BIGG Digital Assets, Inc.(a)(b) | | | 6,317,198 | | | 8,013,899 |
Bitfarms Ltd./Canada(a)(b) | | | 7,784,367 | | | 39,311,808 |
Cleanspark, Inc.(a)(b) | | | 910,847 | | | 18,453,760 |
Digital Garage, Inc. | | | 862,376 | | | 40,101,714 |
GMO internet, Inc. | | | 1,556,967 | | | 42,825,984 |
Hive Blockchain Technologies Ltd.(a)(b) | | | 15,442,272 | | | 54,527,092 |
Hut 8 Mining Corp.(a)(b) | | | 5,366,622 | | | 72,069,536 |
International Business Machines Corp. | | | 200,944 | | | 25,138,094 |
Marathon Digital Holdings, Inc.(a)(b) | | | 595,300 | | | 31,098,472 |
Oracle Corp. | | | 295,743 | | | 28,373,583 |
PayPal Holdings, Inc.(a) | | | 234,178 | | | 54,467,461 |
Riot Blockchain, Inc.(a)(b) | | | 1,425,652 | | | 38,806,247 |
Square, Inc. - Class A(a) | | | 220,315 | | | 56,070,168 |
Stronghold Digital
Mining, Inc. - Class A(a) | | | 336,715 | | | 9,246,194 |
Voyager Digital Ltd.(a)(b) | | | 2,846,322 | | | 43,375,592 |
| | | | | | | 664,225,655 |
Technology Hardware &
Equipment — 1.7% | | | | | | |
Canaan, Inc. - ADR(a)(b) | | | 2,437,609 | | | 20,890,309 |
Samsung Electronics Co. Ltd. | | | 81,612 | | | 4,874,860 |
| | | | | | | 25,765,169 |
Telecommunication Services — 0.6% | | | | | | |
SoftBank Group Corp. | | | 158,346 | | | 8,563,674 |
Total Common Stocks
(Cost $1,107,702,164) | | | | | | 1,304,430,168 |
| | | | Par Value | | | |
CONVERTIBLE BONDS — 1.8% | | | | | | |
Core Scientific, Inc. 4.000% Cash and 6.000% PIK, 04/19/2025(c)(f)(g) | | $ | 26,678,603 | | | 26,678,603 |
Total Convertible Bonds
(Cost $26,668,740) | | | | | | 26,678,603 |
| | | | | | | |
| | | Shares | | |
EXCHANGE TRADED FUNDS — 4.3% | | | | | | |
3iQ CoinShares Bitcoin ETF(a) | | | 2,050,874 | | | 21,431,633 |
Bitcoin ETF(a) | | | 916,554 | | | 21,804,820 |
Purpose Bitcoin ETF(a)(b) | | | 1,823,306 | | | 21,515,011 |
Total Exchange Traded Funds
(Cost $49,153,041) | | | | | | 64,751,464 |
The accompanying notes are an integral part of the financial statements.
22
Amplify ETF Trust
Amplify Transformational Data Sharing ETF
Schedule of Investments
October 31, 2021 (Continued)
Description | | Shares | | Value |
MONEY MARKET FUNDS — 6.1% | | | | | |
Invesco Government & Agency Portfolio - Institutional
Class — 0.03%(d) | | 91,164,274 | | $ | 91,164,274 |
Total Money Market Funds
(Cost $91,164,274) | | | | | 91,164,274 |
| | | | | | |
INVESTMENTS PURCHASED WITH PROCEEDS FROM SECURITIES LENDING — 14.3% | | | | | |
First American Government Obligations Fund - Class X — 0.03%(d) | | 213,507,916 | | | 213,507,916 |
Total Investments Purchased with Proceeds from Securities Lending
(Cost $213,507,916) | | | | | 213,507,916 |
| | | | | | |
Total Investments — 113.7% | | | | | |
(Cost $1,488,196,135) | | | | $ | 1,700,532,425 |
Percentages are based on Net Assets of $1,495,050,269.
For Fund compliance purposes, the Fund’s industry classifications refer to any one or more of the industry sub-classifications used by one or more widely recognized market indexes or rating group indexes, and/or they may be defined by Fund management. This definition may not apply for purposes of this report, which may combine sub-classifications for reporting ease. Industries are shown as a percentage of net assets.
The Global Industry Classification Standard (GICS®) was developed by and/or is the exclusive property of MSCI, Inc. and Standard & Poor’s Financial Services LLC (“S&P”). GICS® is a service mark of MSCI, Inc. and S&P and has been licensed for use by U.S. Bank Global Fund Services.
The accompanying notes are an integral part of the financial statements.
23
Amplify ETF Trust
Amplify Lithium & Battery Technology ETF
Schedule of Investments
October 31, 2021
Description | | Shares | | Value |
COMMON STOCKS — 99.6% | | | | | |
Consumer Discretionary — 26.4% | | | | | |
Arrival SA(a)(b) | | 30,196 | | $ | 499,140 |
BYD Co. Ltd. - Class H | | 335,102 | | | 12,774,405 |
EVgo, Inc.(a)(b) | | 149,297 | | | 1,391,448 |
Fisker, Inc.(a)(b) | | 5,200 | | | 83,460 |
Li Auto, Inc. - ADR(b) | | 98,034 | | | 3,198,850 |
Lucid Group, Inc.(a)(b) | | 146,579 | | | 5,421,957 |
NIO, Inc. - ADR(b) | | 169,135 | | | 6,665,610 |
Panasonic Corp. | | 365,528 | | | 4,465,872 |
QuantumScape Corp.(a)(b) | | 24,313 | | | 703,618 |
Tesla, Inc.(b) | | 20,442 | | | 22,772,388 |
XPeng, Inc. - ADR(b) | | 79,759 | | | 3,719,162 |
Yadea Group Holdings Ltd.(c) | | 78,830 | | | 135,765 |
| | | | | | 61,831,675 |
Industrials — 19.9% | | | | | |
Akasol AG(a)(b)(c) | | 8,532 | | | 1,248,658 |
Blink Charging Co.(a)(b) | | 38,961 | | | 1,238,960 |
ChargePoint Holdings, Inc.(b) | | 84,745 | | | 2,099,981 |
Description | | Shares | | Value |
Contemporary Amperex Technology Co. Ltd. | | 171,507 | | $ | 17,131,671 |
Ecopro BM Co. Ltd.(b) | | 6,814 | | | 2,390,192 |
EnerSys | | 15,923 | | | 1,274,477 |
Eos Energy Enterprises, Inc.(a)(b) | | 82,117 | | | 866,334 |
Eve Energy Co. Ltd. | | 245,173 | | | 4,346,550 |
FREYR Battery SA(a)(b) | | 120,878 | | | 1,224,494 |
FuelCell Energy, Inc.(a)(b) | | 216,452 | | | 1,729,452 |
GS Yuasa Corp. | | 54,228 | | | 1,177,101 |
Hyliion Holdings Corp.(a)(b) | | 134,273 | | | 1,086,269 |
Nikola Corp.(a)(b) | | 143,028 | | | 1,687,730 |
Plug Power, Inc.(b) | | 103,259 | | | 3,951,722 |
PROTERRA, Inc.(b) | | 125,101 | | | 1,402,382 |
Romeo Power, Inc.(b) | | 186,336 | | | 808,698 |
The Lion Electric Co.(a)(b) | | 98,723 | | | 1,406,803 |
Varta AG(a) | | 10,521 | | | 1,617,586 |
| | | | | | 46,689,060 |
Information Technology — 10.7% | | | | | |
Dynapack International Technology Corp. | | 322,814 | | | 1,114,413 |
Iljin Materials Co. Ltd. | | 21,319 | | | 1,833,520 |
L&F Co. Ltd. | | 15,760 | | | 2,482,920 |
NAURA Technology Group Co. Ltd. | | 66,084 | | | 3,833,807 |
NEC Corp. | | 52,612 | | | 2,686,570 |
Samsung SDI Co. Ltd. | | 9,077 | | | 5,701,526 |
Simplo Technology Co. Ltd. | | 105,639 | | | 1,135,842 |
SolarEdge Technologies, Inc.(b) | | 8,859 | | | 3,142,110 |
Wuxi Lead Intelligent Equipment Co. Ltd. | | 237,192 | | | 3,011,185 |
| | | | | | 24,941,893 |
Materials — 42.1% | | | | | |
African Rainbow Minerals Ltd. | | 75,168 | | | 1,001,567 |
Albemarle Corp. | | 17,578 | | | 4,402,762 |
AMG Advanced Metallurgical
Group NV | | 38,288 | | | 1,130,427 |
Aneka Tambang Tbk | | 8,415,027 | | | 1,389,883 |
BHP Group Ltd. - ADR(a) | | 209,146 | | | 11,469,567 |
China Molybdenum Co. Ltd. - Class H | | 4,319,132 | | | 2,681,243 |
Eramet SA(b) | | 16,649 | | | 1,391,506 |
First Quantum Minerals Ltd. | | 123,960 | | | 2,934,735 |
Ganfeng Lithium Co. Ltd. - Class H(c) | | 229,948 | | | 4,311,987 |
Glencore PLC | | 1,633,518 | | | 8,165,354 |
IGO Ltd. | | 236,694 | | | 1,716,425 |
ioneer Ltd.(b) | | 3,637,048 | | | 1,874,132 |
Jinchuan Group International Resources Co. Ltd. | | 9,467,554 | | | 1,521,039 |
Johnson Matthey PLC | | 47,806 | | | 1,788,063 |
Largo Resources Ltd.(b) | | 78,392 | | | 978,000 |
LG Chem Ltd. | | 8,831 | | | 6,317,843 |
The accompanying notes are an integral part of the financial statements.
24
Amplify ETF Trust
Amplify Lithium & Battery Technology ETF
Schedule of Investments
October 31, 2021 (Continued)
Description | | Shares | | Value |
Lithium Americas Corp.(b) | | 91,309 | | $ | 2,648,669 |
Livent Corp.(b) | | 70,028 | | | 1,976,190 |
Lundin Mining Corp. | | 202,537 | | | 1,762,543 |
Mineral Resources Ltd. | | 45,275 | | | 1,314,298 |
MMC Norilsk Nickel PJSC - ADR | | 199,095 | | | 6,229,683 |
Orocobre Ltd.(b) | | 389,494 | | | 2,607,663 |
Piedmont Lithium, Inc.(b) | | 20,828 | | | 1,298,417 |
Pilbara Minerals Ltd.(b) | | 1,030,750 | | | 1,705,834 |
Showa Denko KK | | 58,116 | | | 1,458,828 |
Sociedad Quimica y Minera de Chile SA - ADR | | 51,548 | | | 2,829,470 |
South32 Ltd. | | 989,484 | | | 2,657,282 |
Standard Lithium Ltd.(b) | | 168,018 | | | 1,907,444 |
Sumitomo Metal Mining Co. Ltd. | | 59,785 | | | 2,320,062 |
Umicore SA | | 43,409 | | | 2,487,970 |
Vale Indonesia Tbk PT | | 3,849,881 | | | 1,317,941 |
Vulcan Energy Resources Ltd.(b) | | 142,642 | | | 1,342,349 |
Western Areas Ltd.(b) | | 618,346 | | | 1,469,871 |
Yunnan Energy New Material Co. Ltd. | | 118,211 | | | 5,389,164 |
Zhejiang Huayou Cobalt Co. Ltd. | | 161,379 | | | 2,800,484 |
| | | | | | 98,598,695 |
Utilities — 0.5% | | | | | |
Fastned BV(a)(b) | | 19,024 | | | 1,139,175 |
Total Common Stocks
(Cost $206,193,000) | | | | | 233,200,498 |
| | | | | | |
MONEY MARKET FUNDS — 0.1% | | | | | |
Invesco Government & Agency Portfolio - Institutional
Class — 0.03%(d) | | 316,257 | | | 316,257 |
Total Money Market Funds
(Cost $316,257) | | | | | 316,257 |
| | | | | | |
INVESTMENTS PURCHASED WITH PROCEEDS FROM SECURITIES LENDING — 11.9% | | | | | |
First American Government Obligations Fund - Class X — 0.03%(d) | | 27,769,985 | | | 27,769,985 |
Total Investments Purchased with Proceeds from Securities Lending
(Cost $27,769,985) | | | | | 27,769,985 |
| | | | | | |
Total Investments — 111.6% | | | | | |
(Cost $234,279,242) | | | | $ | 261,286,740 |
Percentages are based on Net Assets of $234,137,185.
ADR - American Depositary Receipt
For Fund compliance purposes, the Fund’s industry classifications refer to any one or more of the industry sub-classifications used by one or more widely recognized market indexes or ratings group indexes, and/or they may be defined by Fund management. This definition may not apply for purposes of this report, which may combine sub-classifications for reporting ease. Industries are shown as a percentage of net assets.
The Global Industry Classification Standard (GICS®) was developed by and/or is the exclusive property of MSCI, Inc. and Standard & Poor’s Financial Services LLC (“S&P”). GICS® is a service mark of MSCI, Inc. and S&P and has been licensed for use by U.S. Bank Global Fund Services.
The accompanying notes are an integral part of the financial statements.
25
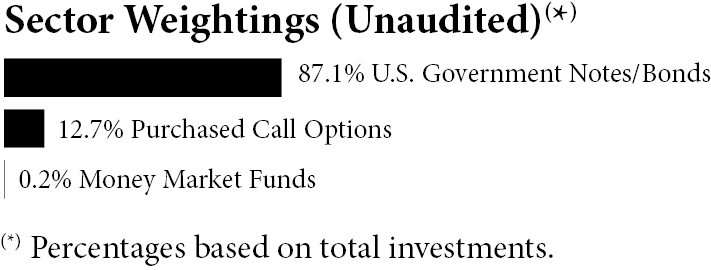
Amplify ETF Trust
Amplify BlackSwan Growth & Treasury Core ETF
Schedule of Investments
October 31, 2021
Description | | | | Par Value | | Value |
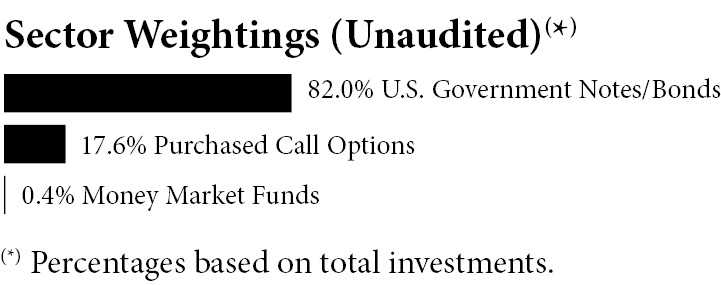
U.S. GOVERNMENT NOTES/BONDS — 81.9% | | | | | | | | |
0.125%, 04/30/2023 | | | | $ | 42,246,000 | | $ | 42,108,205 |
0.375%, 04/15/2024 | | | | | 136,686,000 | | | 135,775,649 |
0.750%, 04/30/2026 | | | | | 137,361,000 | | | 135,069,861 |
1.250%, 04/30/2028 | | | | | 137,241,000 | | | 135,903,437 |
1.125%, 02/15/2031 | | | | | 142,645,000 | | | 137,697,002 |
1.875%, 02/15/2051 | | | | | 162,794,000 | | | 159,970,542 |
Total U.S. Government Notes/Bonds
(Cost $743,870,643) | | | | | | | | 746,524,696 |
| | Contracts | | Notional
Amount | | |
PURCHASED CALL OPTIONS(a) — 17.5% | | | | | | | |
SPDR S&P 500 ETF Trust, Expires 12/17/2021, Strike Price $324.00 | | 7,124 | | $ | 327,169,700 | | 96,697,614 |
SPDR S&P 500 ETF Trust, Expires 6/17/2022, Strike Price $375.00 | | 6,887 | | | 316,285,475 | | 62,991,946 |
Total Purchased Call Options
(Cost $89,816,615) | | | | | | | 159,689,560 |
| | Shares | | | | |
MONEY MARKET FUNDS — 0.4% | | | | | | | |
Invesco Government & Agency Portfolio - Institutional Class — 0.03%(b) | | 3,677,816 | | | | | 3,677,816 |
Total Money Market Funds
(Cost $3,677,816) | | | | | | | 3,677,816 |
Total Investments — 99.8%
(Cost $837,365,074) | | | | | | $ | 909,892,072 |
Percentages are based on Net Assets of $911,466,600.
The accompanying notes are an integral part of the financial statements.
26
Amplify ETF Trust
Amplify International Online Retail ETF
Schedule of Investments
October 31, 2021
Description | | Shares | | Value |
COMMON STOCKS — 99.9% | | | | | |
Marketplace — 43.0% | | | | | |
Alibaba Group Holding Ltd. - ADR(a) | | 897 | | $ | 147,951 |
Americanas SA(a) | | 28,500 | | | 150,160 |
Baozun, Inc. - ADR(a) | | 7,492 | | | 129,612 |
Coupang, Inc.(a) | | 5,932 | | | 176,536 |
Dada Nexus Ltd. - ADR(a) | | 7,049 | | | 143,165 |
Deliveroo PLC(a)(b) | | 44,898 | | | 166,353 |
Delivery Hero SE(a)(b) | | 1,301 | | | 161,925 |
Demae-Can Co. Ltd.(a) | | 10,900 | | | 130,007 |
DiDi Global, Inc. - ADR(a)(c) | | 17,749 | | | 143,234 |
DingDong Cayman Ltd. - ADR(a)(c) | | 6,011 | | | 168,488 |
Fiverr International Ltd.(a) | | 938 | | | 159,788 |
Global-e Online Ltd. - ADR(a)(c) | | 2,714 | | | 157,032 |
Jumia Technologies AG - ADR(a)(c) | | 8,950 | | | 156,356 |
Just Eat Takeaway.com NV(a)(b) | | 2,302 | | | 165,487 |
KE Holdings, Inc. - ADR(a) | | 7,473 | | | 136,158 |
Kogan.com Ltd. | | 23,430 | | | 174,927 |
Koreacenter Co. Ltd.(a) | | 29,071 | | | 174,394 |
Meituan - Class B(a)(b) | | 4,400 | | | 152,492 |
MercadoLibre, Inc.(a) | | 110 | | | 162,912 |
Mercari, Inc.(a) | | 2,700 | | | 145,626 |
Description | | Shares | | Value |
Missfresh Ltd. - ADR(a) | | 36,250 | | $ | 143,187 |
Ozon Holdings PLC - ADR(a) | | 3,385 | | | 152,325 |
Pinduoduo, Inc. - ADR(a) | | 1,507 | | | 134,002 |
Prosus NV | | 2,034 | | | 179,386 |
Rakuten Group, Inc. | | 17,200 | | | 188,555 |
Sea Ltd. - ADR(a) | | 515 | | | 176,939 |
Shopify, Inc. - Class A - ADR(a) | | 121 | | | 177,474 |
Tencent Holdings Ltd. | | 2,400 | | | 148,399 |
Uxin Ltd. - ADR(a) | | 52,918 | | | 127,003 |
Yixin Group Ltd.(a)(b) | | 750,500 | | | 140,857 |
| | | | | | 4,670,730 |
Traditional Retail — 48.7% | | | | | |
About You Holding SE(a) | | 3,261 | | | 75,476 |
AO World PLC(a) | | 37,174 | | | 74,549 |
ASKUL Corp. | | 11,300 | | | 153,210 |
ASOS PLC(a) | | 4,490 | | | 152,758 |
BHG Group AB(a) | | 12,009 | | | 138,218 |
boohoo Group PLC(a) | | 66,481 | | | 165,626 |
Boozt AB(a)(b) | | 9,940 | | | 167,470 |
China Literature Ltd.(a)(b) | | 19,600 | | | 136,436 |
Cimpress PLC(a) | | 1,973 | | | 176,228 |
Cogobuy Group(a)(b) | | 172,000 | | | 63,458 |
Danawa Co. Ltd.(a) | | 3,356 | | | 80,414 |
D-MARKET Elektronik Hizmetler
ve Ticaret AS - ADR(a) | | 29,761 | | | 135,413 |
Dustin Group AB(b) | | 8,191 | | | 100,236 |
Farfetch Ltd. - Class A(a) | | 4,447 | | | 174,367 |
HelloFresh SE(a) | | 1,763 | | | 142,816 |
Home24 SE(a) | | 5,462 | | | 71,363 |
iQIYI, Inc. - ADR(a) | | 16,496 | | | 136,587 |
Istyle, Inc.(a) | | 19,800 | | | 68,590 |
JD.com, Inc. - ADR(a) | | 1,845 | | | 144,427 |
Kitanotatsujin Corp. | | 19,900 | | | 72,253 |
LightInTheBox Holding
Co. Ltd. - ADR(a)(c) | | 36,957 | | | 55,435 |
MonotaRO Co. Ltd. | | 7,400 | | | 167,437 |
MYT Netherlands Parent BV - ADR(a) | | 6,236 | | | 164,630 |
Newegg Commerce, Inc.(a)(c) | | 10,638 | | | 125,528 |
Ocado Group PLC(a) | | 7,838 | | | 193,713 |
Oisix ra daichi, Inc.(a) | | 4,100 | | | 171,155 |
Onion Global Ltd. - ADR(a) | | 5,167 | | | 28,935 |
PChome Online, Inc. | | 40,000 | | | 208,569 |
Redbubble Ltd.(a) | | 50,449 | | | 157,253 |
Shop Apotheke Europe NV(a)(b) | | 1,085 | | | 164,485 |
So-Young International, Inc. - ADR(a) | | 12,743 | | | 50,335 |
SRP Groupe SA(a)(b) | | 26,294 | | | 64,204 |
Syuppin Co. Ltd. | | 7,200 | | | 79,372 |
Temple & Webster Group Ltd.(a) | | 18,499 | | | 176,045 |
The accompanying notes are an integral part of the financial statements.
27
Amplify ETF Trust
Amplify International Online Retail ETF
Schedule of Investments
October 31, 2021 (Continued)
Description | | Shares | | Value |
THG PLC(a) | | 27,658 | | $ | 82,118 |
Vipshop Holdings Ltd. - ADR(a) | | 12,832 | | | 143,205 |
YES24 Co. Ltd. | | 20,306 | | | 169,948 |
Zalando SE(a)(b) | | 1,951 | | | 184,190 |
Zero to Seven, Inc.(a) | | 19,665 | | | 176,700 |
zooplus AG(a) | | 290 | | | 160,552 |
ZOZO, Inc. | | 4,500 | | | 143,850 |
| | | | | | 5,297,554 |
Travel — 8.2% | | | | | |
Airtrip Corp. | | 4,500 | | | 152,138 |
Despegar.com Corp.(a) | | 6,010 | | | 66,831 |
MakeMyTrip Ltd.(a) | | 5,342 | | | 169,181 |
On the Beach Group PLC(a)(b) | | 14,478 | | | 59,239 |
Open Door, Inc.(a) | | 3,200 | | | 70,637 |
Trip.com Group Ltd. - ADR(a) | | 4,557 | | | 130,148 |
Trivago NV - ADR(a)(c) | | 28,873 | | | 76,225 |
Webjet Ltd.(a) | | 36,081 | | | 171,275 |
| | | | | | 895,674 |
Total Common Stocks
(Cost $13,209,877) | | | | | 10,863,958 |
| | | | | | |
MONEY MARKET FUNDS — 0.1% | | | | | |
Invesco Government & Agency Portfolio - Institutional
Class — 0.03%(d) | | 9,667 | | | 9,667 |
Total Money Market Funds
(Cost $9,667) | | | | | 9,667 |
| | | | | | |
INVESTMENTS PURCHASED WITH PROCEEDS FROM SECURITIES LENDING — 8.8% | | | | | |
First American Government Obligations Fund - Class X — 0.03%(d) | | 959,654 | | | 959,654 |
Total Investments Purchased with Proceeds from Securities Lending
(Cost $959,654) | | | | | 959,654 |
| | | | | | |
Total Investments — 108.8% | | | | | |
(Cost $14,179,198) | | | | $ | 11,833,279 |
Percentages are based on Net Assets of $10,871,844.
ADR - American Depositary Receipt
For Fund compliance purposes, the Fund’s industry classifications refer to any one or more of the industry sub-classifications used by one or more widely recognized market indexes or ratings group indexes, and/or they may be defined by Fund management. This definition may not apply for purposes of this report, which may combine sub-classifications for reporting ease. Industries are shown as a percentage of net assets.
The accompanying notes are an integral part of the financial statements.
28
Amplify ETF Trust
Amplify Seymour Cannabis ETF
Schedule of Investments
October 31, 2021
Description | | Shares | | Value |
COMMON STOCKS — 68.3% | | | | | |
Consumer Discretionary — 4.3% | | | | | |
Greenlane Holdings, Inc. - Class A(a) | | 929,306 | | $ | 1,589,113 |
GrowGeneration Corp.(a) | | 134,826 | | | 2,842,132 |
| | | | | | 4,431,245 |
Consumer Staples — 5.8% | | | | | |
Neptune Wellness Solutions,
Inc. - ADR(a) | | 1,623,160 | | | 826,838 |
Village Farms International,
Inc. - ADR(a) | | 685,041 | | | 5,185,760 |
| | | | | | 6,012,598 |
Financials — 16.7% | | | | | |
AFC Gamma, Inc.(b)(c) | | 252,255 | | | 5,917,902 |
RIV Capital, Inc.(a)(d) | | 2,707,210 | | | 3,499,948 |
WM Technology, Inc.(a) | | 644,667 | | | 7,890,724 |
| | | | | | 17,308,574 |
Health Care — 32.9% | | | | | |
Aleafia Health, Inc.(a) | | 74,732 | | | 15,096 |
Arena Pharmaceuticals, Inc.(a)(b) | | 4,791 | | | 274,956 |
Auxly Cannabis Group, Inc.(a) | | 2,895,389 | | | 502,997 |
Canopy Growth Corp. - ADR(a) | | 467,875 | | | 5,909,261 |
Cara Therapeutics, Inc.(a) | | 192,351 | | | 3,237,267 |
cbdMD, Inc.(a) | | 507,635 | | | 898,514 |
Charlotte’s Web Holdings, Inc.(a) | | 1,161,176 | | | 1,895,261 |
Clever Leaves Holdings, Inc. - ADR(a)(b) | | 225,896 | | | 1,508,985 |
Cronos Group, Inc. - ADR(a) | | 487,478 | | | 2,530,011 |
IM Cannabis Corp.(a) | | 89,250 | | | 243,750 |
Jazz Pharmaceuticals Plc - ADR(a)(b) | | 21,348 | | | 2,840,181 |
MediPharm Labs Corp.(a) | | 3,247,526 | | | 656,013 |
Organigram Holdings, Inc. - ADR(a) | | 626,553 | | | 1,384,682 |
PerkinElmer, Inc. | | 81 | | | 14,328 |
The Valens Co., Inc.(a) | | 1,810,942 | | | 2,721,681 |
Tilray, Inc.(a) | | 809,890 | | | 8,341,867 |
Zynerba Pharmaceuticals, Inc.(a) | | 255,474 | | | 978,466 |
| | | | | | 33,953,316 |
Industrials — 3.8% | | | | | |
Akerna Corp.(a) | | 245,766 | | | 656,195 |
Hydrofarm Holdings Group, Inc.(a)(b) | | 100,677 | | | 3,319,321 |
| | | | | | 3,975,516 |
Description | | Shares | | Value |
Real Estate — 4.8% | | | | | |
Innovative Industrial
Properties, Inc.(b)(c) | | 18,652 | | $ | 4,907,155 |
Total Common Stocks
(Cost $113,901,907) | | | | | 70,588,404 |
| | | | | | |
MONEY MARKET FUNDS — 14.6% | | | | | |
Dreyfus Government Cash
Management — 0.030%(a)(e) | | 15,100,000 | | | 15,100,000 |
Total Money Market Funds
(Cost $15,100,000) | | | | | 15,100,000 |
| | | | | | |
Total Investments — 82.9%
(Cost $129,001,907) | | | | $ | 85,688,404 |
Percentages are based on Net Assets of $103,360,817.
ADR - American Depositary Receipt
For Fund compliance purposes, the Fund’s industry classifications refer to any one or more of the industry sub-classifications used by one or more widely recognized market indexes or ratings group indexes, and/or they may be defined by Fund management. This definition may not apply for purposes of this report, which may combine sub-classifications for reporting ease. Industries are shown as a percentage of net assets.
The Global Industry Classification Standard (GICS®) was developed by and/or is the exclusive property of MSCI, Inc. and Standard & Poor’s Financial Services LLC (“S&P”). GICS® is a service mark of MSCI, Inc. and S&P and has been licensed for use by U.S. Bank Global Fund Services.
The accompanying notes are an integral part of the financial statements.
29
Amplify ETF Trust
Amplify Seymour Cannabis ETF
Schedule of Total Return Swaps
October 31, 2021
Reference Entity(a) | | Counterparty | | Long/Short | | Expiration
Date | | Financing
Rate(b) | | Payment
Frequency | | Notional
Amount | | Value/Unrealized
Appreciation
(Depreciation) |
Ayr Wellness, Inc. | | Cowen Financial Products, LLC | | Long | | 05/03/2022 | | 1.57% | | Monthly | | $ | 3,737,758 | | $ | (124,388 | ) |
Columbia Care, Inc. | | Cowen Financial Products, LLC | | Long | | 05/03/2022 | | 1.57% | | Monthly | | | 1,018,632 | | | (153,459 | ) |
Cresco Labs, Inc. | | Cowen Financial Products, LLC | | Long | | 05/03/2022 | | 1.57% | | Monthly | | | 5,686,902 | | | (184,798 | ) |
Curaleaf Holdings, Inc. | | Cowen Financial Products, LLC | | Long | | 05/03/2022 | | 1.57% | | Monthly | | | 6,514,755 | | | (551,912 | ) |
Green Thumb Industries, Inc. | | Cowen Financial Products, LLC | | Long | | 05/03/2022 | | 1.57% | | Monthly | | | 6,418,685 | | | (1,022,584 | ) |
Trulieve Cannabis Corp. | | Cowen Financial Products, LLC | | Long | | 05/03/2022 | | 1.57% | | Monthly | | | 5,361,210 | | | (225,569 | ) |
Verano Holdings Corp. | | Cowen Financial Products, LLC | | Long | | 05/03/2022 | | 1.57% | | Monthly | | | 2,300,625 | | | 78,496 | |
| | | | | | | | | | | | | | | | $ | (2,184,214 | ) |
The accompanying notes are an integral part of the financial statements.
30
Amplify ETF Trust
Amplify Pure Junior Gold Miners ETF
Schedule of Investments
October 31, 2021
Description | | Shares | | Value |
COMMON STOCKS — 99.8% | | | | | |
Materials — 99.8% | | | | | |
Alamos Gold, Inc. | | 6,013 | | $ | 44,532 |
Alkane Resources Ltd.(a) | | 64,760 | | | 43,534 |
Archi Indonesia Tbk PT(a) | | 607,950 | | | 26,176 |
Argonaut Gold, Inc.(a) | | 20,309 | | | 51,446 |
B2Gold Corp. | | 13,159 | | | 54,248 |
Caledonia Mining Corp. PLC | | 2,108 | | | 26,118 |
Calibre Mining Corp.(a) | | 20,172 | | | 24,085 |
Centamin PLC | | 37,898 | | | 48,707 |
Centerra Gold, Inc. | | 6,057 | | | 45,346 |
Coeur Mining, Inc.(a) | | 8,666 | | | 54,856 |
Dacian Gold Ltd.(a) | | 282,777 | | | 48,851 |
DRDGOLD Ltd. - ADR | | 5,198 | | | 46,886 |
Dundee Precious Metals, Inc. | | 6,694 | | | 43,959 |
Eldorado Gold Corp.(a) | | 5,249 | | | 46,877 |
Equinox Gold Corp.(a) | | 6,048 | | | 44,791 |
Evolution Mining Ltd. | | 18,620 | | | 50,767 |
Gold Road Resources Ltd. | | 44,797 | | | 46,601 |
Golden Star Resources Ltd.(a) | | 17,296 | | | 54,482 |
Gran Colombia Gold Corp. | | 10,769 | | | 44,047 |
Great Bear Resources Ltd.(a) | | 2,786 | | | 38,996 |
Great Panther Mining Ltd.(a) | | 97,506 | | | 43,127 |
Greatland Gold PLC(a) | | 130,629 | | | 31,067 |
i-80 Gold Corp.(a) | | 14,100 | | | 34,012 |
IAMGOLD Corp.(a) | | 17,954 | | | 49,391 |
Jaguar Mining, Inc. | | 7,471 | | | 25,917 |
K92 Mining, Inc.(a) | | 8,887 | | | 51,764 |
Karora Resources, Inc.(a) | | 9,745 | | | 34,749 |
Koza Altin Isletmeleri AS(a) | | 5,678 | | | 63,363 |
Lundin Gold, Inc.(a) | | 5,523 | | | 50,483 |
McEwen Mining, Inc.(a) | | 41,628 | | | 45,791 |
Novagold Resources, Inc.(a) | | 4,272 | | | 31,156 |
OceanaGold Corp.(a) | | 25,205 | | | 46,972 |
Description | | Shares | | Value |
Osisko Gold Royalties Ltd. | | 3,811 | | $ | 48,054 |
Osisko Mining, Inc.(a) | | 17,195 | | | 37,038 |
Pan African Resources PLC | | 209,515 | | | 49,742 |
Perseus Mining Ltd.(a) | | 40,759 | | | 48,370 |
Petropavlovsk PLC(a) | | 151,818 | | | 49,612 |
Pretium Resources, Inc.(a) | | 4,261 | | | 51,460 |
Ramelius Resources Ltd. | | 40,170 | | | 47,973 |
Red 5 Ltd.(a) | | 87,242 | | | 17,037 |
Regis Resources Ltd. | | 28,893 | | | 43,403 |
Resolute Mining Ltd.(a) | | 138,544 | | | 43,705 |
Royal Gold, Inc. | | 625 | | | 61,887 |
Sabina Gold & Silver Corp.(a) | | 18,973 | | | 21,582 |
Seabridge Gold, Inc.(a) | | 2,246 | | | 41,416 |
Silver Lake Resources Ltd.(a) | | 39,762 | | | 50,622 |
SSR Mining, Inc. | | 3,159 | | | 49,747 |
St Barbara Ltd. | | 41,298 | | | 45,443 |
Torex Gold Resources, Inc.(a) | | 4,142 | | | 48,085 |
Wesdome Gold Mines Ltd.(a) | | 5,675 | | | 50,956 |
West African Resources Ltd.(a) | | 47,798 | | | 46,671 |
Westgold Resources Ltd. | | 32,338 | | | 47,364 |
Yamana Gold, Inc. | | 11,305 | | | 44,324 |
| | | | | | 2,337,588 |
Total Common Stocks
(Cost $2,619,623) | | | | | 2,337,588 |
| | | | | | |
MONEY MARKET FUNDS — 0.2% | | | | | |
Invesco Government & Agency Portfolio - Institutional
Class — 0.03%(b) | | 5,135 | | | 5,135 |
Total Money Market Funds
(Cost $5,135) | | | | | 5,135 |
| | | | | | |
Total Investments — 100.0% | | | | | |
(Cost $2,624,758) | | | | $ | 2,342,723 |
Percentages are based on Net Assets of $2,342,344.
ADR - American Depositary Receipt
For Fund compliance purposes, the Fund’s industry classifications refer to any one or more of the industry sub-classifications used by one or more widely recognized market indexes or rating group indexes, and/or they may be defined by Fund management. This definition may not apply for purposes of this report, which may combine sub-classifications for reporting ease. Industries are shown as a percentage of net assets.
The Global Industry Classification Standard (GICS®) was developed by and/or is the exclusive property of MSCI, Inc. and Standard & Poor’s Financial Services LLC (“S&P”). GICS® is a service mark of MSCI, Inc. and S&P and has been licensed for use by U.S. Bank Global Fund Services.
The accompanying notes are an integral part of the financial statements.
31
Amplify ETF Trust
Amplify BlackSwan ISWN ETF
Schedule of Investments
October 31, 2021
Description | | | | Par Value | | Value |
U.S. GOVERNMENT NOTES/BONDS — 86.9% | | | | | | | | |
0.125%, 04/30/2023 | | | | $ | 2,112,000 | | $ | 2,105,111 |
0.375%, 04/15/2024 | | | | | 6,880,000 | | | 6,834,178 |
0.750%, 04/30/2026 | | | | | 6,902,000 | | | 6,786,877 |
1.250%, 04/30/2028 | | | | | 6,889,000 | | | 6,821,859 |
1.125%, 02/15/2031 | | | | | 7,215,000 | | | 6,964,730 |
1.875%, 02/15/2051 | | | | | 8,306,000 | | | 8,161,943 |
Total U.S. Government Notes/Bonds
(Cost $37,532,145) | | | | | | | | 37,674,698 |
| | Contracts | | Notional
Amount | | |
PURCHASED CALL OPTIONS(a) — 12.7% | | | | | | | |
iShares MSCI EAFE ETF, Expires 12/17/2021, Strike Price $63.00 | | 1,917 | | $ | 15,429,933 | | 3,393,090 |
iShares MSCI EAFE ETF, Expires 6/17/2022, Strike Price $72.00 | | 2,088 | | | 16,806,312 | | 2,114,100 |
Total Purchased Call Options
(Cost $5,112,671) | | | | | | | 5,507,190 |
| | Shares | | | | |
MONEY MARKET FUNDS — 0.2% | | | | | | | |
Invesco Government & Agency Portfolio - Institutional Class — 0.03%(b) | | 98,010 | | | | | 98,010 |
Total Money Market Funds
(Cost $98,010) | | | | | | | 98,010 |
| | | | | | | | |
Total Investments — 99.8% | | | | | | | |
(Cost $42,742,826) | | | | | | $ | 43,279,898 |
Percentages are based on Net Assets of $43,353,422.
The accompanying notes are an integral part of the financial statements.
32
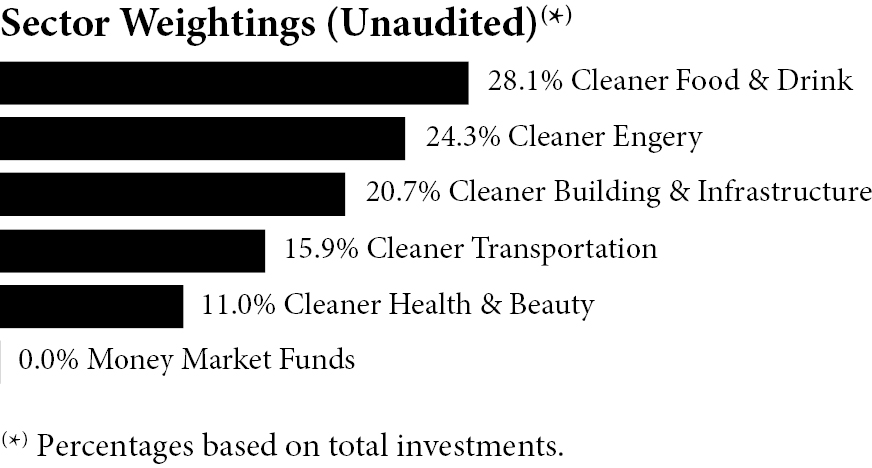
Amplify ETF Trust
Amplify Cleaner Living ETF
Schedule of Investments
October 31, 2021
Description | | Shares | | Value |
COMMON STOCKS — 100.0% | | | | | |
Cleaner Building &
Infrastructure — 20.7% | | | | | |
Array Technologies, Inc.(a) | | 1,030 | | $ | 21,991 |
Ballard Power Systems, Inc.(a) | | 914 | | | 16,565 |
Beam Global(a) | | 478 | | | 15,057 |
Blink Charging Co.(a) | | 422 | | | 13,420 |
Bloom Energy Corp. - Class A(a) | | 650 | | | 20,319 |
Daqo New Energy Corp. - ADR(a) | | 242 | | | 18,825 |
Enphase Energy, Inc.(a) | | 112 | | | 25,943 |
FuelCell Energy, Inc.(a) | | 1,572 | | | 12,560 |
Hannon Armstrong Sustainable Infrastructure Capital, Inc.(b) | | 308 | | | 18,603 |
JinkoSolar Holding Co. Ltd. - ADR(a) | | 360 | | | 21,535 |
Schnitzer Steel Industries, Inc. | | 298 | | | 16,032 |
SolarEdge Technologies, Inc.(a) | | 68 | | | 24,118 |
TPI Composites, Inc.(a) | | 376 | | | 12,645 |
Trex Co., Inc.(a) | | 166 | | | 17,662 |
| | | | | | 255,275 |
Cleaner Energy — 24.3% | | | | | |
Azure Power Global Ltd.(a) | | 768 | | | 18,271 |
Boralex, Inc. | | 526 | | | 16,278 |
Brookfield Renewable Corp. - Class A | | 392 | | | 16,236 |
Brookfield Renewable Partners LP(a) | | 416 | | | 16,676 |
Canadian Solar, Inc.(a) | | 412 | | | 17,118 |
Clean Energy Fuels Corp.(a) | | 1,540 | | | 14,199 |
First Solar, Inc.(a) | | 208 | | | 24,875 |
Gevo, Inc.(a) | | 1,990 | | | 14,388 |
Innergex Renewable Energy, Inc. | | 942 | | | 15,680 |
NextEra Energy Partners LP | | 224 | | | 19,331 |
Ormat Technologies, Inc. | | 234 | | | 16,925 |
ReneSola Ltd. - ADR(a) | | 1,762 | | | 15,664 |
Renewable Energy Group, Inc.(a) | | 248 | | | 15,872 |
Sunnova Energy International, Inc.(a) | | 522 | | | 23,260 |
SunPower Corp.(a) | | 644 | | | 21,677 |
Sunrun, Inc.(a) | | 370 | | | 21,342 |
VivoPower International PLC(a) | | 2,218 | | | 10,957 |
| | | | | | 298,749 |
Description | | Shares | | Value |
Cleaner Food & Dining — 28.1% | | | | | |
BellRing Brands, Inc. - Class A(a) | | 564 | | $ | 15,127 |
Beyond Meat, Inc.(a) | | 108 | | | 10,690 |
Calavo Growers, Inc. | | 234 | | | 9,407 |
Calyxt, Inc.(a) | | 3,446 | | | 11,337 |
Chipotle Mexican Grill, Inc.(a) | | 12 | | | 21,348 |
Else Nutrition Holdings, Inc.(a) | | 7,556 | | | 10,562 |
Fresh Del Monte Produce, Inc. | | 460 | | | 15,405 |
Freshpet, Inc.(a) | | 94 | | | 14,656 |
Kura Sushi USA, Inc. - Class A(a) | | 426 | | | 18,139 |
Laird Superfood, Inc.(a) | | 502 | | | 8,765 |
Landec Corp.(a) | | 1,330 | | | 12,928 |
Mission Produce, Inc.(a) | | 706 | | | 13,407 |
National Beverage Corp. | | 326 | | | 18,386 |
Natural Grocers by Vitamin
Cottage, Inc. | | 1,424 | | | 17,344 |
Oatly Group AB - ADR(a) | | 558 | | | 7,193 |
Pilgrim’s Pride Corp.(a) | | 694 | | | 19,543 |
Primo Water Corp. | | 906 | | | 14,422 |
Sanderson Farms, Inc. | | 96 | | | 18,187 |
Sprouts Farmers Market, Inc.(a) | | 552 | | | 12,221 |
SunOpta, Inc.(a) | | 1,212 | | | 9,402 |
Tattooed Chef, Inc.(a) | | 722 | | | 12,974 |
The Alkaline Water Co., Inc.(a) | | 11,072 | | | 18,823 |
The Hain Celestial Group, Inc.(a) | | 384 | | | 17,230 |
The Simply Good Foods Co.(a) | | 456 | | | 18,080 |
| | | | | | 345,576 |
Cleaner Health & Beauty — 11.0% | | | | | |
Herbalife Nutrition Ltd.(a) | | 308 | | | 14,291 |
Lululemon Athletica, Inc.(a) | | 48 | | | 22,369 |
Medifast, Inc. | | 58 | | | 11,384 |
Nautilus, Inc.(a) | | 980 | | | 10,025 |
Peloton Interactive, Inc. - Class A(a) | | 148 | | | 13,533 |
Planet Fitness, Inc. - Class A(a) | | 222 | | | 17,660 |
The Honest Co., Inc.(a) | | 904 | | | 8,272 |
Tivity Health, Inc.(a) | | 606 | | | 15,162 |
USANA Health Sciences, Inc.(a) | | 158 | | | 15,335 |
WW International, Inc.(a) | | 430 | | | 7,465 |
| | | | | | 135,496 |
Cleaner Transportation — 15.9% | | | | | |
Arcimoto, Inc.(a) | | 1,178 | | | 13,759 |
AYRO, Inc.(a) | | 3,052 | | | 9,003 |
ElectraMeccanica Vehicles Corp.(a) | | 3,706 | | | 13,156 |
GreenPower Motor Co., Inc.(a) | | 962 | | | 13,689 |
Kandi Technologies Group, Inc.(a) | | 2,616 | | | 11,458 |
Li Auto, Inc. - ADR(a) | | 592 | | | 19,317 |
Nikola Corp.(a) | | 948 | | | 11,186 |
NIO, Inc. - ADR(a) | | 364 | | | 14,345 |
The accompanying notes are an integral part of the financial statements.
33
Amplify ETF Trust
Amplify Cleaner Living ETF
Schedule of Investments
October 31, 2021 (Continued)
Description | | Shares | | Value |
Niu Technologies - ADR(a) | | 486 | | $ | 12,724 |
Plug Power, Inc.(a) | | 522 | | | 19,977 |
Tesla, Inc.(a) | | 28 | | | 31,192 |
Workhorse Group, Inc.(a) | | 1,072 | | | 7,215 |
XPeng, Inc. - ADR(a) | | 400 | | | 18,652 |
| | | | | | 195,673 |
Total Common Stocks
(Cost $1,274,235) | | | | | 1,230,769 |
| | | | | | |
MONEY MARKET FUNDS — 0.0%(c) | | | | | |
Invesco Government & Agency Portfolio - Institutional
Class — 0.03%(d) | | 592 | | | 592 |
Total Money Market Funds
(Cost $592) | | | | | 592 |
| | | | | | |
Total Investments — 100.0% | | | | | |
(Cost $1,274,827) | | | | $ | 1,231,361 |
Percentages are based on Net Assets of $1,230,870.
ADR - American Depositary Receipt
For Fund compliance purposes, the Fund’s industry classifications refer to any one or more of the industry sub-classifications used by one or more widely recognized market indexes or ratings group indexes, and/or they may be defined by Fund management. This definition may not apply for purposes of this report, which may combine sub-classifications for reporting ease. Industries are shown as a percentage of net assets.
The accompanying notes are an integral part of the financial statements.
34
Amplify ETF Trust
Amplify Thematic All-Stars ETF
Schedule of Investments
October 31, 2021

Description | | Shares | | Value |
COMMON STOCKS — 99.4% | | | | | |
Communication Services — 9.0% | | | | | |
Activision Blizzard, Inc. | | 300 | | $ | 23,457 |
Alphabet, Inc. - Class A(a) | | 88 | | | 260,561 |
Baidu, Inc. - Class A(a) | | 2,220 | | | 46,232 |
Iridium Communications, Inc.(a) | | 593 | | | 24,046 |
Meta Platforms, Inc. - Class A(a) | | 249 | | | 80,569 |
NetEase, Inc. | | 1,305 | | | 25,784 |
Netflix, Inc.(a) | | 92 | | | 63,509 |
Roku, Inc.(a) | | 205 | | | 62,505 |
Sea Ltd. - ADR(a) | | 262 | | | 90,015 |
Snap, Inc. - Class A(a) | | 700 | | | 36,806 |
Spotify Technology SA(a) | | 369 | | | 106,789 |
Tencent Holdings Ltd. | | 920 | | | 56,886 |
Twitter, Inc.(a) | | 1,460 | | | 78,168 |
Zillow Group, Inc. - Class C(a) | | 599 | | | 62,074 |
| | | | | | 1,017,401 |
Consumer Discretionary — 12.6% | | | | | |
2U, Inc.(a) | | 727 | | | 21,476 |
Alibaba Group Holding Ltd.(a) | | 3,315 | | | 69,462 |
Amazon.com, Inc.(a) | | 68 | | | 229,325 |
Aptiv PLC(a) | | 164 | | | 28,354 |
BYD Co Ltd. - Class H | | 810 | | | 30,884 |
DraftKings, Inc. - Class A(a) | | 620 | | | 28,886 |
Etsy, Inc.(a) | | 169 | | | 42,367 |
JD.com, Inc. - Class A(a) | | 680 | | | 27,133 |
MercadoLibre, Inc.(a) | | 21 | | | 31,101 |
NIO, Inc. - ADR(a) | | 2,537 | | | 99,983 |
Peloton Interactive, Inc. - Class A(a) | | 211 | | | 19,294 |
Tesla, Inc.(a) | | 667 | | | 743,038 |
XPeng, Inc. - Class A(a) | | 2,182 | | | 50,994 |
| | | | | | 1,422,297 |
Description | | Shares | | Value |
Financials — 1.6% | | | | | |
Coinbase Global, Inc. - Class A(a) | | 469 | | $ | 149,808 |
Upstart Holdings, Inc.(a) | | 85 | | | 27,373 |
| | | | | | 177,181 |
Health Care — 4.5% | | | | | |
Agilent Technologies, Inc. | | 132 | | | 20,789 |
CRISPR Therapeutics AG(a) | | 349 | | | 31,874 |
Danaher Corp. | | 147 | | | 45,830 |
Dexcom, Inc.(a) | | 50 | | | 31,161 |
Exact Sciences Corp.(a) | | 261 | | | 24,852 |
Fate Therapeutics, Inc.(a) | | 418 | | | 22,488 |
Illumina, Inc.(a) | | 58 | | | 24,073 |
Intellia Therapeutics, Inc.(a) | | 269 | | | 35,772 |
Intuitive Surgical, Inc.(a) | | 184 | | | 66,448 |
Invitae Corp.(a) | | 1,033 | | | 27,375 |
Regeneron Pharmaceuticals, Inc.(a) | | 39 | | | 24,958 |
Teladoc Health, Inc.(a) | | 897 | | | 134,182 |
Veracyte, Inc.(a) | | 397 | | | 19,008 |
| | | | | | 508,810 |
Industrials — 8.7% | | | | | |
ABB Ltd. | | 1,904 | | | 63,116 |
AeroVironment, Inc.(a) | | 260 | | | 23,169 |
Array Technologies, Inc.(a) | | 1,849 | | | 39,476 |
Ballard Power Systems, Inc.(a) | | 3,746 | | | 67,785 |
Bloom Energy Corp. - Class A(a) | | 1,379 | | | 43,108 |
Booz Allen Hamilton Holding Corp. | | 289 | | | 25,103 |
ChargePoint Holdings, Inc.(a) | | 984 | | | 24,383 |
Evoqua Water Technologies Corp.(a) | | 551 | | | 23,048 |
FANUC Corp. | | 120 | | | 23,479 |
Lockheed Martin Corp. | | 60 | | | 19,939 |
Pentair PLC | | 437 | | | 32,325 |
Plug Power, Inc.(a) | | 4,546 | | | 173,975 |
Roper Technologies, Inc. | | 53 | | | 25,857 |
Science Applications International
Corp. | | 227 | | | 20,380 |
Shoals Technologies Group, Inc. - Class A(a) | | 1,645 | | | 50,979 |
Sunrun, Inc.(a) | | 2,769 | | | 159,716 |
Tetra Tech, Inc. | | 137 | | | 24,065 |
TPI Composites, Inc.(a) | | 601 | | | 20,212 |
Vestas Wind Systems A/S | | 1,709 | | | 73,987 |
Xylem, Inc./NY | | 368 | | | 48,057 |
| | | | | | 982,159 |
Information Technology — 57.2% | | | | | |
3D Systems Corp.(a) | | 715 | | | 20,134 |
Accenture PLC - Class A | | 124 | | | 44,490 |
Adobe, Inc.(a) | | 58 | | | 37,721 |
Advanced Micro Devices, Inc.(a) | | 1,076 | | | 129,367 |
The accompanying notes are an integral part of the financial statements.
35
Amplify ETF Trust
Amplify Thematic All-Stars ETF
Schedule of Investments
October 31, 2021 (Continued)
Description | | Shares | | Value |
Adyen NV(a)(b) | | 16 | | $ | 48,336 |
Akamai Technologies, Inc.(a) | | 1,012 | | | 106,726 |
Ambarella, Inc.(a) | | 197 | | | 36,609 |
Analog Devices, Inc. | | 298 | | | 51,700 |
Apple, Inc. | | 452 | | | 67,710 |
Arista Networks, Inc.(a) | | 82 | | | 33,595 |
Atlassian Corp. PLC - Class A(a) | | 65 | | | 29,778 |
Brooks Automation, Inc. | | 228 | | | 26,551 |
Canadian Solar, Inc.(a) | | 988 | | | 41,051 |
Check Point Software Technologies Ltd.(a) | | 332 | | | 39,707 |
Cisco Systems, Inc. | | 2,601 | | | 145,578 |
Cloudflare, Inc. - Class A(a) | | 698 | | | 135,915 |
Coupa Software, Inc.(a) | | 86 | | | 19,582 |
Crowdstrike Holdings, Inc. - Class A(a) | | 683 | | | 192,469 |
CyberArk Software Ltd.(a) | | 263 | | | 47,369 |
Daqo New Energy Corp. - ADR(a) | | 704 | | | 54,764 |
DocuSign, Inc.(a) | | 218 | | | 60,667 |
Dropbox, Inc. - Class A(a) | | 1,140 | | | 34,759 |
Enphase Energy, Inc.(a) | | 1,621 | | | 375,472 |
Everbridge, Inc.(a) | | 156 | | | 24,852 |
F5 Networks, Inc.(a) | | 146 | | | 30,828 |
Fastly, Inc. - Class A(a) | | 469 | | | 23,736 |
First Solar, Inc.(a) | | 1,642 | | | 196,367 |
Fortinet, Inc.(a) | | 284 | | | 95,521 |
Infineon Technologies AG | | 493 | | | 23,046 |
Intel Corp. | | 1,093 | | | 53,557 |
International Business Machines Corp. | | 362 | | | 45,286 |
Intuit, Inc. | | 43 | | | 26,918 |
Itron, Inc.(a) | | 643 | | | 50,006 |
JinkoSolar Holding Co Ltd. - ADR(a) | | 698 | | | 41,754 |
Juniper Networks, Inc. | | 1,366 | | | 40,324 |
Keyence Corp. | | 37 | | | 22,231 |
Mandiant, Inc.(a) | | 2,599 | | | 45,327 |
Microsoft Corp. | | 576 | | | 191,013 |
MicroStrategy, Inc.(a) | | 41 | | | 29,317 |
Mimecast Ltd.(a) | | 827 | | | 62,389 |
MongoDB, Inc.(a) | | 57 | | | 29,714 |
NVIDIA Corp. | | 2,122 | | | 542,532 |
NXP Semiconductors NV | | 264 | | | 53,027 |
Okta, Inc.(a) | | 580 | | | 143,364 |
ON Semiconductor Corp.(a) | | 1,066 | | | 51,243 |
Oracle Corp. | | 458 | | | 43,941 |
Palantir Technologies, Inc. - Class A(a) | | 2,370 | | | 61,336 |
Palo Alto Networks, Inc.(a) | | 310 | | | 157,818 |
PayPal Holdings, Inc.(a) | | 582 | | | 135,367 |
QUALCOMM, Inc. | | 576 | | | 76,631 |
Qualys, Inc.(a) | | 539 | | | 67,095 |
Rapid7, Inc.(a) | | 333 | | | 42,874 |
Description | | Shares | | Value |
Sailpoint Technologies Holdings, Inc.(a) | | 435 | | $ | 20,871 |
salesforce.com, Inc.(a) | | 292 | | | 87,509 |
Samsung SDI Co. Ltd. | | 57 | | | 35,803 |
ServiceNow, Inc.(a) | | 65 | | | 45,354 |
Shopify, Inc. - Class A(a) | | 116 | | | 170,141 |
Skyworks Solutions, Inc. | | 125 | | | 20,891 |
SolarEdge Technologies, Inc.(a) | | 789 | | | 279,843 |
Splunk, Inc.(a) | | 567 | | | 93,453 |
Square, Inc. - Class A(a) | | 1,292 | | | 328,814 |
STMicroelectronics NV | | 550 | | | 26,042 |
SunPower Corp.(a) | | 2,075 | | | 69,844 |
Tenable Holdings, Inc.(a) | | 1,146 | | | 61,024 |
Teradyne, Inc. | | 215 | | | 29,722 |
Trend Micro, Inc./Japan | | 434 | | | 24,474 |
Trimble, Inc.(a) | | 758 | | | 66,226 |
Twilio, Inc. - Class A(a) | | 505 | | | 147,137 |
UiPath, Inc. - Class A(a) | | 1,162 | | | 58,391 |
Unity Software, Inc.(a) | | 884 | | | 133,758 |
Varonis Systems, Inc.(a) | | 738 | | | 47,778 |
Visa, Inc. - Class A | | 89 | | | 18,848 |
VMware, Inc. - Class A(a) | | 562 | | | 85,255 |
Workday, Inc. - Class A(a) | | 130 | | | 37,697 |
Xilinx, Inc. | | 153 | | | 27,540 |
Xinyi Solar Holdings Ltd. | | 24,368 | | | 50,997 |
Zoom Video Communications, Inc. - Class A(a) | | 429 | | | 117,825 |
Zscaler, Inc.(a) | | 615 | | | 196,099 |
| | | | | | 6,468,800 |
Materials — 1.7% | | | | | |
Albemarle Corp. | | 461 | | | 115,467 |
Ecolab, Inc. | | 187 | | | 41,555 |
Livent Corp.(a) | | 1,329 | | | 37,504 |
| | | | | | 194,526 |
Real Estate — 1.9% | | | | | |
American Tower Corp.(c) | | 77 | | | 21,712 |
CoreSite Realty Corp.(c) | | 176 | | | 25,073 |
Crown Castle International Corp.(c) | | 170 | | | 30,651 |
CyrusOne, Inc.(c) | | 298 | | | 24,442 |
Digital Realty Trust, Inc.(c) | | 226 | | | 35,665 |
Equinix, Inc.(c) | | 99 | | | 82,870 |
| | | | | | 220,413 |
Utilities — 2.2% | | | | | |
American Water Works Co, Inc. | | 215 | | | 37,449 |
Atlantica Sustainable Infrastructure PLC | | 691 | | | 27,191 |
Essential Utilities, Inc. | | 423 | | | 19,911 |
NextEra Energy, Inc. | | 374 | | | 31,913 |
Ormat Technologies, Inc. | | 490 | | | 35,442 |
The accompanying notes are an integral part of the financial statements.
36
Amplify ETF Trust
Amplify Thematic All-Stars ETF
Schedule of Investments
October 31, 2021 (Continued)
Description | | Shares | | Value |
Orsted AS(b) | | 258 | | $ | 36,442 |
Sunnova Energy International, Inc.(a) | | 1,379 | | | 61,448 |
| | | | | | 249,796 |
Total Common Stocks
(Cost $10,367,364) | | | | | 11,241,383 |
| | | | | | |
PREFERRED STOCKS — 0.2% | | | | | |
Materials — 0.2% | | | | | |
Sociedad Quimica y Minera de Chile SA - Class B | | 491 | | | 26,737 |
Total Preferred Stocks
(Cost $24,766) | | | | | 26,737 |
| | | | | | |
MONEY MARKET FUNDS — 0.4% | | | | | |
Invesco Government & Agency Portfolio - Institutional Class — 0.03%(d) | | 50,138 | | | 50,138 |
Total Money Market Funds
(Cost $50,138) | | | | | 50,138 |
| | | | | | |
Total Investments — 100.0% | | | | | |
(Cost $10,442,268) | | | | $ | 11,318,258 |
Percentages are based on Net Assets of $11,307,828.
ADR - American Depositary Receipt
For Fund compliance purposes, the Fund’s industry classifications refer to any one or more of the industry sub-classifications used by one or more widely recognized market indexes or rating group indexes, and/or they may be defined by Fund management. This definition may not apply for purposes of this report, which may combine sub-classifications for reporting ease. Industries are shown as a percentage of net assets.
The Global Industry Classification Standard (GICS®) was developed by and/or is the exclusive property of MSCI, Inc. and Standard & Poor’s Financial Services LLC (“S&P”). GICS® is a service mark of MSCI, Inc. and S&P and has been licensed for use by U.S. Bank Global Fund Services.
The accompanying notes are an integral part of the financial statements.
37
Amplify ETF Trust
Amplify Digital & Online Trading ETF
Schedule of Investments
October 31, 2021
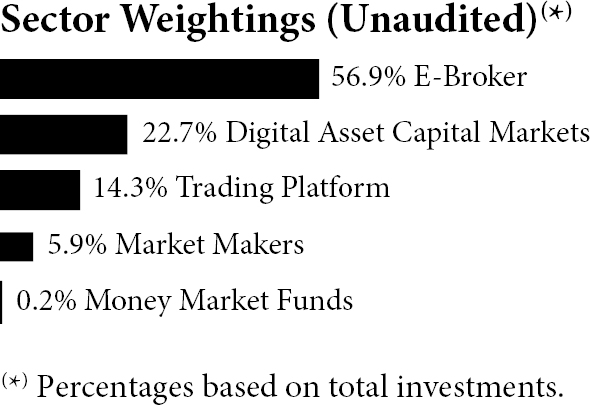
Description | | Shares | | Value |
COMMON STOCKS — 99.3% | | | | | |
Digital Asset Capital Markets — 22.6% | | | | | |
BC Technology Group Ltd.(a) | | 2,000 | | $ | 3,517 |
Coinbase Global, Inc. - Class A(a) | | 206 | | | 65,800 |
Galaxy Digital Holdings Ltd.(a) | | 976 | | | 26,362 |
Moneylion, Inc.(a) | | 366 | | | 2,156 |
Silvergate Capital Corp.(a) | | 236 | | | 36,962 |
Voyager Digital Ltd.(a) | | 1,092 | | | 16,615 |
| | | | | | 151,412 |
E-Broker — 56.7% | | | | | |
flatexDEGIRO AG(a) | | 982 | | | 22,342 |
Futu Holdings Ltd. - ADR(a) | | 276 | | | 14,771 |
IG Group Holdings PLC | | 2,233 | | | 24,288 |
Interactive Brokers Group, Inc. | | 434 | | | 30,749 |
KGI Securities Thailand PCL | | 53,100 | | | 10,562 |
Matsui Securities Co. Ltd. | | 1,400 | | | 10,031 |
Monex Group, Inc. | | 3,800 | | | 24,595 |
Robinhood Markets, Inc. - Class A(a) | | 1,329 | | | 46,475 |
SoFi Technologies, Inc.(a) | | 3,177 | | | 63,826 |
Swissquote Group Holding SA | | 127 | | | 25,768 |
The Charles Schwab Corp. | | 743 | | | 60,948 |
Up Fintech Holding Ltd. - ADR(a) | | 1,876 | | | 12,138 |
XP, Inc. - Class A(a) | | 876 | | | 28,742 |
X-Trade Brokers Dom Maklerski SA(b) | | 1,021 | | | 4,205 |
| | | | | | 379,440 |
Market Makers — 5.7% | | | | | |
Flow Traders(b) | | 429 | | | 14,576 |
Virtu Financial, Inc. - Class A | | 961 | | | 23,910 |
| | | | | | 38,486 |
Trading Platform — 14.3% | | | | | |
CMC Markets PLC(b) | | 1,592 | | | 5,510 |
MarketAxess Holdings, Inc. | | 118 | | | 48,223 |
Plus500 Ltd. | | 626 | | | 11,297 |
Tradeweb Markets, Inc. - Class A | | 342 | | | 30,472 |
| | | | | | 95,502 |
Total Common Stocks
(Cost $628,490) | | | | | 664,840 |
Description | | Shares | | Value |
MONEY MARKET FUNDS — 0.2% | | | | | |
Invesco Government & Agency Portfolio - Institutional Class — 0.03%(c) | | 1,661 | | $ | 1,661 |
Total Money Market Funds
(Cost $1,661) | | | | | 1,661 |
| | | | | | |
Total Investments — 99.5% | | | | | |
(Cost $630,151) | | | | $ | 666,501 |
Percentages are based on Net Assets of $669,490.
ADR - American Depositary Receipt
For Fund compliance purposes, the Fund’s industry classifications refer to any one or more of the industry sub-classifications used by one or more widely recognized market indexes or ratings group indexes, and/or they may be defined by Fund management. This definition may not apply for purposes of this report, which may combine sub-classifications for reporting ease. Industries are shown as a percentage of net assets.
The accompanying notes are an integral part of the financial statements.
38
Amplify ETF Trust
Statements of Assets and Liabilities
October 31, 2021
| | Amplify
High Income
ETF | | Amplify
Online
Retail ETF | | Amplify
CWP Enhanced
Dividend
Income ETF | | Amplify
Transformational
Data Sharing
ETF | | Amplify
Lithium &
Battery
Technology ETF |
Assets: | | | | | | | | | | | | | | | | | |
Investments, at Cost | | $ | 450,339,357 | | | $ | 968,321,003 | | | $ | 595,444,846 | | $ | 1,488,196,135 | | $ | 234,279,242 |
Foreign Currency, at Cost | | | — | | | | 1,440 | | | | — | | | — | | | — |
Investments, at Value | | $ | 464,970,982 | | | $ | 998,396,735 | | | $ | 664,779,389 | | $ | 1,700,532,425 | | $ | 261,286,740 |
Foreign Currency, at Value | | | — | | | | 1,446 | | | | — | | | — | | | — |
Cash | | | — | | | | — | | | | 100,727,108 | | | — | | | 3,423,289 |
Receivable for Capital Shares Sold | | | 851,920 | | | | — | | | | 3,699,180 | | | 5,536,670 | | | 23,512,800 |
Receivable for Investments Sold | | | — | | | | — | | | | 141,789 | | | 15,153,144 | | | 18,961,592 |
Dividends and Interest Receivable | | | 1,105,682 | | | | 39,472 | | | | 718,391 | | | 923,795 | | | 106,173 |
Securities Lending Income Receivable | | | 81,432 | | | | 24,864 | | | | — | | | 811,880 | | | 42,178 |
Total Assets | | | 467,010,016 | | | | 998,462,517 | | | | 770,065,857 | | | 1,722,957,914 | | | 307,332,772 |
| | | | | | | | | | | | | | | | | | |
Liabilities: | | | | | | | | | | | | | | | | | |
Options Written, at Value (Premiums Received $0, $0, $258,764, $0, $0) | | | — | | | | — | | | | 173,350 | | | — | | | — |
Payable for Fund Shares Redeemed | | | — | | | | — | | | | — | | | — | | | 22,414,075 |
Payable for Investments Purchased | | | 848,690 | | | | — | | | | 3,204,947 | | | 3,210,509 | | | 22,903,393 |
Payable to Authorized Participant | | | — | | | | — | | | | — | | | 10,403,020 | | | — |
Collateral Received for Securities Loaned (See Note 4) | | | 17,004,950 | | | | 101,273,216 | | | | — | | | 213,507,916 | | �� | 27,769,985 |
Advisory Fees Payable, net of waiver, if any | | | 185,514 | | | | 507,717 | | | | 334,119 | | | 786,200 | | | 108,134 |
Total Liabilities | | | 18,039,154 | | | | 101,780,933 | | | | 3,712,416 | | | 227,907,645 | | | 73,195,587 |
| | | | | | | | | | | | | | | | | | |
Net Assets | | $ | 448,970,862 | | | $ | 896,681,584 | | | $ | 766,353,441 | | $ | 1,495,050,269 | | $ | 234,137,185 |
| | | | | | | | | | | | | | | | | | |
Net Assets Consist of: | | | | | | | | | | | | | | | | | |
Paid-in Capital ($0.01 par value) | | $ | 263,500 | | | $ | 81,000 | | | $ | 206,500 | | $ | 270,000 | | $ | 119,500 |
Additional Paid-in Capital | | | 453,687,514 | | | | 941,852,071 | | | | 698,846,404 | | | 1,300,360,942 | | | 214,205,615 |
Total Distributable Earnings (Accumulated Deficit) | | | (4,980,152 | ) | | | (45,251,487 | ) | | | 67,300,537 | | | 194,419,327 | | | 19,812,070 |
Net Assets | | $ | 448,970,862 | | | $ | 896,681,584 | | | $ | 766,353,441 | | $ | 1,495,050,269 | | $ | 234,137,185 |
| | | | | | | | | | | | | | | | | | |
Outstanding Shares of Beneficial Interest (unlimited authorized – $0.01 par value) | | | 26,350,000 | | | | 8,100,000 | | | | 20,650,000 | | | 27,000,000 | | | 11,950,000 |
Net Asset Value, Offering and Redemption Price per Share | | $ | 17.04 | | | $ | 110.70 | | | $ | 37.11 | | $ | 55.37 | | $ | 19.59 |
Includes Loaned Securities with a Value of | | $ | 16,328,804 | | | $ | 98,390,297 | | | $ | — | | $ | 229,855,550 | | $ | 27,183,380 |
The accompanying notes are an integral part of these financial statements.
39
Amplify ETF Trust
Statements of Assets and Liabilities
October 31, 2021
| | Amplify
BlackSwan
Growth &
Treasury Core
ETF | | Amplify
International
Online Retail
ETF | | Amplify
Seymour
Cannabis
ETF | | Amplify
Pure Junior
Gold Miners
ETF | | Amplify
BlackSwan
ISWN ETF |
Assets: | | | | | | | | | | | | | | | | | | |
Investments, at Cost | | $ | 837,365,074 | | $ | 14,179,198 | | | $ | 129,001,907 | | | $ | 2,624,758 | | | $ | 42,742,826 |
Foreign Currency, at Cost | | | — | | | — | | | | 7,683 | | | | — | | | | — |
Investments, at Value | | $ | 909,892,072 | | $ | 11,833,279 | | | $ | 85,688,404 | | | $ | 2,342,723 | | | $ | 43,279,898 |
Foreign Currency, at Value | | | — | | | — | | | | 7,884 | | | | — | | | | — |
Cash | | | — | | | — | | | | 19,513 | | | | — | | | | — |
Cash Collateral for Securities Lending | | | — | | | — | | | | 3,380,082 | | | | — | | | | — |
Collateral for Swaps | | | — | | | — | | | | 19,940,000 | | | | — | | | | — |
Receivable for Capital Shares Sold | | | 3,571,570 | | | — | | | | — | | | | — | | | | — |
Receivable for Investments Sold | | | — | | | 1,080,137 | | | | — | | | | — | | | | — |
Dividends and Interest Receivable | | | 2,407,534 | | | 3,745 | | | | 213 | | | | 575 | | | | 122,005 |
Securities Lending Income Receivable | | | — | | | 8,766 | | | | 5,386 | | | | — | | | | — |
Total Assets | | | 915,871,176 | | | 12,925,927 | | | | 109,041,482 | | | | 2,343,298 | | | | 43,401,903 |
| | | | | | | | | | | | | | | | | | | |
Liabilities: | | | | | | | | | | | | | | | | | | |
Payable for Investments Purchased | | | 3,354,821 | | | — | | | | — | | | | — | | | | — |
Payable to Broker for Options | | | 687,326 | | | — | | | | — | | | | — | | | | 31,222 |
Collateral Received for Securities Loaned (See Note 4) | | | — | | | 959,654 | | | | 3,380,082 | | | | — | | | | — |
Payable to Broker for Swaps | | | — | | | — | | | | 1,426 | | | | — | | | | — |
Net Unrealized Depreciation on Swaps | | | — | | | — | | | | 2,184,214 | | | | — | | | | — |
Payable for Fund Shares Redeemed | | | — | | | 1,087,160 | | | | — | | | | — | | | | — |
Advisory Fees Payable, net of waiver, if any | | | 362,429 | | | 7,269 | | | | 42,563 | | | | 954 | | | | 17,259 |
Accrued Compliance Fees | | | — | | | — | | | | 253 | | | | — | | | | — |
Accrued Custody Fees | | | — | | | — | | | | 2,260 | | | | — | | | | — |
Accrued Accounting, Administration & Transfer Agent Fees | | | — | | | — | | | | 11,878 | | | | — | | | | — |
Other Payables and Accrued Expenses | | | — | | | — | | | | 57,989 | | | | — | | | | — |
Total Liabilities | | | 4,404,576 | | | 2,054,083 | | | | 5,680,665 | | | | 954 | | | | 48,481 |
| | | | | | | | | | | | | | | | | | | |
Net Assets | | $ | 911,466,600 | | $ | 10,871,844 | | | $ | 103,360,817 | | | $ | 2,342,344 | | | $ | 43,353,422 |
| | | | | | | | | | | | | | | | | | | |
Net Assets Consist of: | | | | | | | | | | | | | | | | | | |
Paid-in Capital ($0.01 par value) | | $ | 255,200 | | $ | 2,500 | | | $ | 59,500 | | | $ | 1,000 | | | $ | 17,000 |
Additional Paid-in Capital | | | 795,161,675 | | | 14,101,574 | | | | 159,296,069 | | | | 2,644,706 | | | | 42,619,533 |
Total Distributable Earnings (Accumulated Deficit) | | | 116,049,725 | | | (3,232,230 | ) | | | (55,994,752 | ) | | | (303,362 | ) | | | 716,889 |
Net Assets | | $ | 911,466,600 | | $ | 10,871,844 | | | $ | 103,360,817 | | | $ | 2,342,344 | | | $ | 43,353,422 |
| | | | | | | | | | | | | | | | | | | |
Outstanding Shares of Beneficial Interest (unlimited authorized – $0.01 par value) | | | 25,520,000 | | | 250,000 | | | | 5,950,000 | | | | 100,000 | | | | 1,700,000 |
Net Asset Value, Offering and Redemption Price per Share | | $ | 35.72 | | $ | 43.49 | | | $ | 17.37 | | | $ | 23.42 | | | $ | 25.50 |
Includes Loaned Securities with a Value of | | $ | — | | $ | 907,102 | | | $ | 3,255,082 | | | $ | — | | | $ | — |
The accompanying notes are an integral part of these financial statements.
40
Amplify ETF Trust
Statements of Assets and Liabilities
October 31, 2021
| | Amplify
Cleaner Living
ETF | | Amplify
Thematic
All-Stars
ETF | | Amplify
Digital &
Online Trading
ETF |
Assets: | | | | | | | | | | |
Investments, at Cost | | $ | 1,274,827 | | | $ | 10,442,268 | | $ | 630,151 |
Investments, at Value | | $ | 1,231,361 | | | $ | 11,318,258 | | $ | 666,501 |
Receivable for Investments Sold | | | — | | | | — | | | 2,855 |
Dividends and Interest Receivable | | | 83 | | | | 452 | | | 465 |
Total Assets | | | 1,231,444 | | | | 11,318,710 | | | 669,821 |
| | | | | | | | | | | |
Liabilities: | | | | | | | | | | |
Payable for Investments Purchased | | | — | | | | 7,066 | | | — |
Advisory Fees Payable, net of waiver, if any | | | 574 | | | | 3,816 | | | 331 |
Total Liabilities | | | 574 | | | | 10,882 | | | 331 |
| | | | | | | | | | | |
Net Assets | | $ | 1,230,870 | | | $ | 11,307,828 | | $ | 669,490 |
| | | | | | | | | | | |
Net Assets Consist of: | | | | | | | | | | |
Paid-in Capital ($0.01 par value) | | $ | 500 | | | $ | 4,000 | | $ | 250 |
Additional Paid-in Capital | | | 1,275,500 | | | | 10,493,521 | | | 631,500 |
Total Distributable Earnings (Accumulated Deficit) | | | (45,130 | ) | | | 810,307 | | | 37,740 |
Net Assets | | $ | 1,230,870 | | | $ | 11,307,828 | | $ | 669,490 |
| | | | | | | | | | | |
Outstanding Shares of Beneficial Interest (unlimited authorized – $0.01 par value) | | | 50,000 | | | | 400,000 | | | 25,000 |
Net Asset Value, Offering and Redemption Price per Share | | $ | 24.62 | | | $ | 28.27 | | $ | 26.78 |
The accompanying notes are an integral part of these financial statements.
41
Amplify ETF Trust
Statements of Operations
For the Year Ended October 31, 2021
| | Amplify
High Income
ETF | | Amplify
Online Retail
ETF | | Amplify
CWP
Enhanced Dividend
Income ETF | | Amplify
Transformational
Data Sharing
ETF | | Amplify
Lithium &
Battery
Technology
ETF |
Investment Income: | | | | | | | | | | | | | | | | | | | |
Dividend Income (Net of Foreign Withholding Tax of $0, $32,124, $0, $430,767, and $148,438, respectively) | | $ | 19,218,364 | | $ | 7,232,453 | | | $ | 7,826,992 | | | $ | 4,756,320 | | | $ | 2,321,433 | |
Interest Income | | | 633 | | | 439 | | | | 1,256 | | | | 244,414 | | | | 126 | |
Securities Lending Income | | | 245,660 | | | 730,530 | | | | — | | | | 6,496,427 | | | | 703,054 | |
Total Investment Income | | | 19,464,657 | | | 7,963,422 | | | | 7,828,248 | | | | 11,497,161 | | | | 3,024,613 | |
Expenses: | | | | | | | | | | | | | | | | | | | |
Advisory Fees | | | 1,836,118 | | | 8,698,519 | | | | 2,484,057 | | | | 6,993,157 | | | | 829,169 | |
Total Expenses | | | 1,836,118 | | | 8,698,519 | | | | 2,484,057 | | | | 6,993,157 | | | | 829,169 | |
Advisory Fees Waived (See Note 3) | | | — | | | — | | | | (273,759 | ) | | | (294,974 | ) | | | — | |
Net Expenses | | | 1,836,118 | | | 8,698,519 | | | | 2,210,298 | | | | 6,698,183 | | | | 829,169 | |
Net Investment Income (Loss) | | | 17,628,539 | | | (735,097 | ) | | | 5,617,950 | | | | 4,798,978 | | | | 2,195,444 | |
| | | | | | | | | | | | | | | | | | | | |
Realized and Unrealized Gain (Loss): | | | | | | | | | | | | | | | | | | | |
Net Realized Gain (Loss) on: | | | | | | | | | | | | | | | | | | | |
Investments | | | 3,387,191 | | | 426,996,089 | | | | 10,433,640 | | | | 175,532,891 | | | | 10,303,097 | |
Capital Gain Distributions from Underlying Closed End Funds | | | 1,718,032 | | | — | | | | — | | | | — | | | | — | |
Payment from Affiliate (See Note 5) | | | — | | | — | | | | — | | | | — | | | | — | |
Foreign Currency | | | — | | | (262,197 | ) | | | — | | | | (278,978 | ) | | | (223,761 | ) |
Options Written | | | — | | | — | | | | 3,809,145 | | | | — | | | | — | |
Net Change in Unrealized Appreciation/Depreciation on: | | | | | | | | | | | | | | | | | | | |
Investments | | | 55,915,231 | | | (156,892,686 | ) | | | 69,610,170 | | | | 178,690,823 | | | | 27,385,019 | |
Foreign Currency | | | — | | | (1,273 | ) | | | — | | | | (11,686 | ) | | | (3,719 | ) |
Options Written | | | — | | | — | | | | 85,414 | | | | — | | | | — | |
Net Realized and Unrealized Gain | | | 61,020,454 | | | 269,839,933 | | | | 83,938,369 | | | | 353,933,050 | | | | 37,460,636 | |
| | | | | | | | | | | | | | | | | | | | |
Net Increase in Net Assets Resulting from Operations | | $ | 78,648,993 | | $ | 269,104,836 | | | $ | 89,556,319 | | | $ | 358,732,028 | | | $ | 39,656,080 | |
The accompanying notes are an integral part of these financial statements.
42
Amplify ETF Trust
Statements of Operations
For the Year/Period Ended October 31, 2021
| | Amplify
BlackSwan
Growth &
Treasury Core
ETF | | Amplify
International
Online Retail
ETF | | Amplify
Seymour
Cannabis
ETF | | Amplify
Pure Junior
Gold Miners
ETF(a) | | Amplify
BlackSwan
ISWN
ETF(b) |
Investment Income: | | | | | | | | | | | | | | | | | | |
Dividend Income (Net of Foreign Withholding Tax of $0, $4,552, $93, $1,879, $0 respectively) | | $ | — | | $ | 16,419 | | | $ | 375,754 | | | $ | 19,983 | | | $ | — |
Interest Income | | | 5,903,864 | | | 21 | | | | 1,459 | | | | — | | | | 226,315 |
Securities Lending Income | | | — | | | 78,018 | | | | 457,134 | | | | — | | | | — |
Total Investment Income | | | 5,903,864 | | | 94,458 | | | | 834,347 | | | | 19,983 | | | | 226,315 |
Expenses: | | | | | | | | | | | | | | | | | | |
Advisory Fees | | | 3,892,185 | | | 143,043 | | | | 677,878 | | | | 9,917 | | | | 127,552 |
Other Expenses | | | — | | | — | | | | 95,245 | | | | — | | | | — |
Fund Accounting, Administration & Transfer Agent Fees | | | — | | | — | | | | 68,544 | | | | — | | | | — |
Custody Expenses | | | — | | | — | | | | 49,308 | | | | — | | | | — |
Legal Fees | | | — | | | — | | | | 33,674 | | | | — | | | | — |
Audit Fees | | | — | | | — | | | | 23,656 | | | | — | | | | — |
Trustee Fees | | | — | | | — | | | | 19,897 | | | | — | | | | — |
Principal Financial Officer Fees | | | — | | | — | | | | 15,012 | | | | — | | | | — |
Shareholder Servicing Fees | | | — | | | — | | | | 13,411 | | | | — | | | | — |
Compliance Fees | | | — | | | — | | | | 12,925 | | | | — | | | | — |
Total Expenses | | | 3,892,185 | | | 143,043 | | | | 1,009,550 | | | | 9,917 | | | | 127,552 |
Advisory Fees Waived/Reimbursed (See Note 3) | | | — | | | — | | | | (227,383 | ) | | | — | | | | — |
Net Expenses | | | 3,892,185 | | | 143,043 | | | | 782,167 | | | | 9,917 | | | | 127,552 |
Net Investment Income (Loss) | | | 2,011,679 | | | (48,585 | ) | | | 52,180 | | | | 10,066 | | | | 98,763 |
| | | | | | | | | | | | | | | | | | | |
Realized and Unrealized Gain (Loss): | | | | | | | | | | | | | | | | | | |
Net Realized Gain (Loss) on: | | | | | | | | | | | | | | | | | | |
Investments | | | 51,368,367 | | | 3,709,327 | | | | 3,935,183 | | | | 70,324 | | | | 161,928 |
Foreign Currency | | | — | | | (21,841 | ) | | | (864 | ) | | | (830 | ) | | | — |
Swaps | | | — | | | — | | | | (13,078,332 | ) | | | — | | | | — |
Net Change in Unrealized Appreciation/Depreciation on: | | | | | | | | | | | | | | | | | | |
Investments | | | 68,389,186 | | | (3,980,605 | ) | | | (41,660,617 | ) | | | (282,036 | ) | | | 537,072 |
Foreign Currency | | | — | | | (109 | ) | | | (43 | ) | | | — | | | | — |
Options Written | | | — | | | — | | | | — | | | | — | | | | — |
Swaps | | | — | | | — | | | | (2,184,214 | ) | | | — | | | | — |
Net Realized and Unrealized Gain (Loss) | | | 119,757,553 | | | (293,228 | ) | | | (52,988,887 | ) | | | (212,542 | ) | | | 699,000 |
| | | | | | | | | | | | | | | | | | | |
Net Increase (Decrease) in Net Assets Resulting from Operations | | $ | 121,769,232 | | $ | (341,813 | ) | | $ | (52,936,707 | ) | | $ | (202,476 | ) | | $ | 797,763 |
The accompanying notes are an integral part of these financial statements.
43
Amplify ETF Trust
Statements of Operations
For the Period Ended October 31, 2021
| | Amplify
Cleaner Living
ETF(a) | | Amplify
Thematic
All-Stars
ETF(b) | | Amplify
Digital &
Online Trading
ETF(c) |
Investment Income: | | | | | | | | | | | | |
Dividend Income (Net of Foreign Withholding Tax of $96, $87, $53) | | $ | 808 | | | $ | 5,122 | | | $ | 1,417 | |
Total Investment Income | | | 808 | | | | 5,122 | | | | 1,417 | |
Expenses: | | | | | | | | | | | | |
Advisory Fees | | | 2,467 | | | | 9,622 | | | | 414 | |
Total Expenses | | | 2,467 | | | | 9,622 | | | | 414 | |
Net Expenses | | | 2,467 | | | | 9,622 | | | | 414 | |
Net Investment Income (Loss) | | | (1,659 | ) | | | (4,500 | ) | | | 1,003 | |
| | | | | | | | | | | | | |
Realized and Unrealized Gain (Loss): | | | | | | | | | | | | |
Net Realized Gain (Loss) on: | | | | | | | | | | | | |
Investments | | | (3 | ) | | | 12,551 | | | | 406 | |
Payment from Affiliate (See Note 5) | | | — | | | | 922 | | | | — | |
Foreign Currency | | | (2 | ) | | | (562 | ) | | | (10 | ) |
Net Change in Unrealized Appreciation/Depreciation on: | | | | | | | | | | | | |
Investments | | | (43,466 | ) | | | 875,990 | | | | 36,350 | |
Foreign Currency | | | — | | | | 15 | | | | (9 | ) |
Net Realized and Unrealized Gain (Loss) | | | (43,471 | ) | | | 888,916 | | | | 36,737 | |
| | | | | | | | | | | | | |
Net Increase (Decrease) in Net Assets Resulting from Operations | | $ | (45,130 | ) | | $ | 884,416 | | | $ | 37,740 | |
The accompanying notes are an integral part of these financial statements.
44
Amplify ETF Trust
Statements of Changes in Net Assets
| | Amplify High Income ETF |
| | | Year Ended
October 31,
2021 | | Year Ended
October 31,
2020 |
Operations: | | | | | | | | |
Net Investment Income | | $ | 17,628,539 | | | $ | 13,935,321 | |
Net Realized Gain (Loss) on Investments | | | 3,387,191 | | | | (1,099,924 | ) |
Capital Gain Distributions from Underlying Closed End Funds | | | 1,718,032 | | | | 1,390,533 | |
Net Change in Unrealized Appreciation/(Depreciation) on Investments | | | 55,915,231 | | | | (42,467,094 | ) |
Net Increase (Decrease) in Net Assets Resulting from Operations | | | 78,648,993 | | | | (28,241,164 | ) |
| | | | | | | | | |
Distributions to Shareholders: | | | | | | | | |
Dividends and Distributions | | | (19,232,860 | ) | | | (14,936,155 | ) |
Return of Capital | | | (14,547,140 | ) | | | (8,398,167 | ) |
Total Distributions | | | (33,780,000 | ) | | | (23,334,322 | ) |
| | | | | | | | | |
Capital Share Transactions: | | | | | | | | |
Subscriptions | | | 262,958,955 | | | | 62,258,910 | |
Redemptions | | | (81,677,680 | ) | | | (24,867,355 | ) |
Transaction Fees (Note 1) | | | 542 | | | | 325 | |
Increase in Net Assets from Capital Share Transactions | | | 181,281,817 | | | | 37,391,880 | |
| | | | | | | | | |
Total Increase (Decrease) in Net Assets | | | 226,150,810 | | | | (14,183,606 | ) |
| | | | | | | | | |
Net Assets: | | | | | | | | |
Beginning of Period | | | 222,820,052 | | | | 237,003,658 | |
End of Period | | $ | 448,970,862 | | | $ | 222,820,052 | |
| | | | | | | | | |
Share Transactions: | | | | | | | | |
Subscriptions | | | 15,500,000 | | | | 3,900,000 | |
Redemptions | | | (4,750,000 | ) | | | (1,750,000 | ) |
Net Increase in Shares Outstanding from Share Transactions | | | 10,750,000 | | | | 2,150,000 | |
The accompanying notes are an integral part of these financial statements.
45
Amplify ETF Trust
Statements of Changes in Net Assets
| | Amplify Online Retail ETF |
| | | Year Ended
October 31,
2021 | | Year Ended
October 31,
2020 |
Operations: | | | | | | | | |
Net Investment Income (Loss) | | $ | (735,097 | ) | | $ | 3,815,416 | |
Net Realized Gain on Investments and Foreign Currency | | | 426,733,892 | | | | 55,142,426 | |
Net Change in Unrealized Appreciation/(Depreciation) on Investments and Foreign Currency | | | (156,893,959 | ) | | | 209,496,649 | |
Net Increase in Net Assets Resulting from Operations | | | 269,104,836 | | | | 268,454,491 | |
| | | | | | | | | |
Distributions to Shareholders: | | | | | | | | |
Dividends and Distributions | | | (7,766,866 | ) | | | (732,203 | ) |
Total Distributions | | | (7,766,866 | ) | | | (732,203 | ) |
| | | | | | | | | |
Capital Share Transactions: | | | | | | | | |
Subscriptions | | | 797,325,220 | | | | 618,618,455 | |
Redemptions | | | (1,133,127,475 | ) | | | (155,200,420 | ) |
Transaction Fees (Note 1) | | | 365 | | | | — | |
Increase (Decrease) in Net Assets from Capital Share Transactions | | | (335,801,890 | ) | | | 463,418,035 | |
| | | | | | | | | |
Total Increase (Decrease) in Net Assets | | | (74,463,920 | ) | | | 731,140,323 | |
| | | | | | | | | |
Net Assets: | | | | | | | | |
Beginning of Period | | | 971,145,504 | | | | 240,005,181 | |
End of Period | | $ | 896,681,584 | | | $ | 971,145,504 | |
| | | | | | | | | |
Share Transactions: | | | | | | | | |
Subscriptions | | | 6,950,000 | | | | 8,200,000 | |
Redemptions | | | (9,800,000 | ) | | | (2,200,000 | ) |
Net Increase (Decrease) in Shares Outstanding from Share Transactions | | | (2,850,000 | ) | | | 6,000,000 | |
The accompanying notes are an integral part of these financial statements.
46
Amplify ETF Trust
Statements of Changes in Net Assets
| | Amplify CWP Enhanced
Dividend Income ETF |
| | | Year Ended
October 31,
2021 | | Year Ended
October 31,
2020 |
Operations: | | | | | | | | |
Net Investment Income | | $ | 5,617,950 | | | $ | 662,292 | |
Net Realized Gain on Investments and Options Written | | | 14,242,785 | | | | 931,911 | |
Net Change in Unrealized Appreciation on Investments and Options Written | | | 69,695,584 | | | | (1,732,958 | ) |
Net Increase (Decrease) in Net Assets Resulting from Operations | | | 89,556,319 | | | | (138,755 | ) |
| | | | | | | | | |
Distributions to Shareholders: | | | | | | | | |
Dividends and Distributions | | | (20,392,493 | ) | | | (1,242,172 | ) |
Return of Capital | | | (1,776,088 | ) | | | (1,835,660 | ) |
Total Distributions | | | (22,168,581 | ) | | | (3,077,832 | ) |
| | | | | | | | | |
Capital Share Transactions: | | | | | | | | |
Subscriptions | | | 595,631,420 | | | | 96,408,995 | |
Redemptions | | | (3,333,540 | ) | | | (7,810,200 | ) |
Increase in Net Assets from Capital Share Transactions | | | 592,297,880 | | | | 88,598,795 | |
| | | | | | | | | |
Total Increase in Net Assets | | | 659,685,618 | | | | 85,382,208 | |
| | | | | | | | | |
Net Assets: | | | | | | | | |
Beginning of Period | | | 106,667,823 | | | | 21,285,615 | |
End of Period | | $ | 766,353,441 | | | $ | 106,667,823 | |
| | | | | | | | | |
Share Transactions: | | | | | | | | |
Subscriptions | | | 17,100,000 | | | | 3,200,000 | |
Redemptions | | | (100,000 | ) | | | (250,000 | ) |
Net Increase in Shares Outstanding from Share Transactions | | | 17,000,000 | | | | 2,950,000 | |
The accompanying notes are an integral part of these financial statements.
47
Amplify ETF Trust
Statements of Changes in Net Assets
| | Amplify Transformational
Data Sharing ETF |
| | | Year Ended
October 31,
2021 | | Year Ended
October 31,
2020 |
Operations: | | | | | | | | |
Net Investment Income | | $ | 4,798,978 | | | $ | 840,071 | |
Net Realized Gain (Loss) on Investments and Foreign Currency | | | 175,253,913 | | | | (3,948,372 | ) |
Net Change in Unrealized Appreciation on Investments and Foreign Currency | | | 178,679,137 | | | | 34,528,155 | |
Net Increase in Net Assets Resulting from Operations | | | 358,732,028 | | | | 31,419,854 | |
| | | | | | | | | |
Distributions to Shareholders: | | | | | | | | |
Dividends and Distributions | | | (6,448,385 | ) | | | (2,023,741 | ) |
Total Distributions | | | (6,448,385 | ) | | | (2,023,741 | ) |
| | | | | | | | | |
Capital Share Transactions: | | | | | | | | |
Subscriptions | | | 1,572,103,930 | | | | 21,052,480 | |
Redemptions | | | (562,188,520 | ) | | | (17,050,305 | ) |
Transaction Fees (Note 1) | | | 146,391 | | | | 37,821 | |
Increase in Net Assets from Capital Share Transactions | | | 1,010,061,801 | | | | 4,039,996 | |
| | | | | | | | | |
Total Increase in Net Assets | | | 1,362,345,444 | | | | 33,436,109 | |
| | | | | | | | | |
Net Assets: | | | | | | | | |
Beginning of Period | | | 132,704,825 | | | | 99,268,716 | |
End of Period | | $ | 1,495,050,269 | | | $ | 132,704,825 | |
| | | | | | | | | |
Share Transactions: | | | | | | | | |
Subscriptions | | | 33,150,000 | | | | 850,000 | |
Redemptions | | | (11,500,000 | ) | | | (950,000 | ) |
Net Increase (Decrease) in Shares Outstanding from Share Transactions | | | 21,650,000 | | | | (100,000 | ) |
The accompanying notes are an integral part of these financial statements.
48
Amplify ETF Trust
Statements of Changes in Net Assets
| | Amplify Lithium & Battery
Technology ETF |
| | | Year Ended
October 31,
2021 | | Year Ended
October 31,
2020 |
Operations: | | | | | | | | |
Net Investment Income | | $ | 2,195,444 | | | $ | 86,973 | |
Net Realized Gain (Loss) on Investments and Foreign Currency | | | 10,079,336 | | | | (2,180,602 | ) |
Net Change in Unrealized Appreciation on Investments and Foreign Currency | | | 27,381,300 | | | | 2,407,462 | |
Net Increase in Net Assets Resulting from Operations | | | 39,656,080 | | | | 313,833 | |
| | | | | | | | | |
Distributions to Shareholders: | | | | | | | | |
Dividends and Distributions | | | (87,235 | ) | | | (158,755 | ) |
Total Distributions | | | (87,235 | ) | | | (158,755 | ) |
| | | | | | | | | |
Capital Share Transactions: | | | | | | | | |
Subscriptions | | | 255,769,840 | | | | 7,562,990 | |
Redemptions | | | (71,153,030 | ) | | | (2,749,750 | ) |
Transaction Fees (Note 1) | | | 204,554 | | | | 11,355 | |
Increase in Net Assets from Capital Share Transactions | | | 184,821,364 | | | | 4,824,595 | |
| | | | | | | | | |
Total Increase in Net Assets | | | 224,390,209 | | | | 4,979,673 | |
| | | | | | | | | |
Net Assets: | | | | | | | | |
Beginning of Period | | | 9,746,976 | | | | 4,767,303 | |
End of Period | | $ | 234,137,185 | | | $ | 9,746,976 | |
| | | | | | | | | |
Share Transactions: | | | | | | | | |
Subscriptions | | | 15,050,000 | | | | 700,000 | |
Redemptions | | | (4,000,000 | ) | | | (250,000 | ) |
Net Increase in Shares Outstanding from Share Transactions | | | 11,050,000 | | | | 450,000 | |
The accompanying notes are an integral part of these financial statements.
49
Amplify ETF Trust
Statements of Changes in Net Assets
| | Amplify BlackSwan Growth &
Treasury Core ETF |
| | | Year Ended
October 31,
2021 | | Year Ended
October 31,
2020 |
Operations: | | | | | | | | |
Net Investment Income | | $ | 2,011,679 | | | $ | 1,343,601 | |
Net Realized Gain on Investments | | | 51,368,367 | | | | 19,256,613 | |
Net Change in Unrealized Appreciation/(Depreciation) on Investments | | | 68,389,186 | | | | (3,551,248 | ) |
Net Increase in Net Assets Resulting from Operations | | | 121,769,232 | | | | 17,048,966 | |
| | | | | | | | | |
Distributions to Shareholders: | | | | | | | | |
Dividends and Distributions | | | (11,566,239 | ) | | | (4,804,059 | ) |
Total Distributions | | | (11,566,239 | ) | | | (4,804,059 | ) |
| | | | | | | | | |
Capital Share Transactions: | | | | | | | | |
Subscriptions | | | 262,913,280 | | | | 832,147,600 | |
Redemptions | | | (146,881,040 | ) | | | (283,461,565 | ) |
Transaction Fees (Note 1) | | | — | | | | 1,888 | |
Increase in Net Assets from Capital Share Transactions | | | 116,032,240 | | | | 548,687,923 | |
| | | | | | | | | |
Total Increase in Net Assets | | | 226,235,233 | | | | 560,932,830 | |
| | | | | | | | | |
Net Assets: | | | | | | | | |
Beginning of Period | | | 685,231,367 | | | | 124,298,537 | |
End of Period | | $ | 911,466,600 | | | $ | 685,231,367 | |
| | | | | | | | | |
Share Transactions: | | | | | | | | |
Subscriptions | | | 7,790,000 | | | | 27,300,000 | |
Redemptions | | | (4,470,000 | ) | | | (9,450,000 | ) |
Net Increase in Shares Outstanding from Share Transactions | | | 3,320,000 | | | | 17,850,000 | |
The accompanying notes are an integral part of these financial statements.
50
Amplify ETF Trust
Statements of Changes in Net Assets
| | Amplify International
Online Retail ETF |
| | | Year Ended
October 31,
2021 | | Year Ended
October 31,
2020 |
Operations: | | | | | | | | |
Net Investment Loss | | $ | (48,585 | ) | | $ | (9,636 | ) |
Net Realized Gain on Investments and Foreign Currency | | | 3,687,486 | | | | 858,594 | |
Net Change in Unrealized Appreciation/(Depreciation) on Investments and Foreign Currency | | | (3,980,714 | ) | | | 1,500,052 | |
Net Increase (Decrease) in Net Assets Resulting from Operations | | | (341,813 | ) | | | 2,349,010 | |
| | | | | | | | | |
Distributions to Shareholders: | | | | | | | | |
Dividends and Distributions | | | — | | | | (3,649 | ) |
Total Distributions | | | — | | | | (3,649 | ) |
| | | | | | | | | |
Capital Share Transactions: | | | | | | | | |
Subscriptions | | | 18,451,695 | | | | 8,040,575 | |
Redemptions | | | (17,632,948 | ) | | | (2,006,903 | ) |
Transaction Fees (Note 1) | | | 9,045 | | | | 2,278 | |
Increase in Net Assets from Capital Share Transactions | | | 827,792 | | | | 6,035,950 | |
| | | | | | | | | |
Total Increase in Net Assets | | | 485,979 | | | | 8,381,311 | |
| | | | | | | | | |
Net Assets: | | | | | | | | |
Beginning of Period | | | 10,385,865 | | | | 2,004,554 | |
End of Period | | $ | 10,871,844 | | | $ | 10,385,865 | |
| | | | | | | | | |
Share Transactions: | | | | | | | | |
Subscriptions | | | 350,000 | | | | 225,000 | |
Redemptions | | | (350,000 | ) | | | (50,000 | ) |
Net Increase in Shares Outstanding from Share Transactions | | | — | | | | 175,000 | |
The accompanying notes are an integral part of these financial statements.
51
Amplify ETF Trust
Statements of Changes in Net Assets
| | Amplify Seymour Cannabis ETF |
| | | Year Ended
October 31,
2021 | | Year Ended
October 31,
2020 |
Operations: | | | | | | | | |
Net Investment Income | | $ | 52,180 | | | $ | 142,026 | |
Net Realized Loss on Investments, Foreign Currency and Swaps | | | (9,144,013 | ) | | | (2,022,490 | ) |
Net Change in Unrealized Appreciation/(Depreciation) on Investments, Foreign Currency and Swaps | | | (43,844,874 | ) | | | 521,916 | |
Net Decrease in Net Assets Resulting from Operations | | | (52,936,707 | ) | | | (1,358,548 | ) |
| | | | | | | | | |
Distributions to Shareholders: | | | | | | | | |
Dividends and Distributions | | | (151,546 | ) | | | (27,000 | ) |
Total Distributions | | | (151,546 | ) | | | (27,000 | ) |
| | | | | | | | | |
Capital Share Transactions: | | | | | | | | |
Subscriptions | | | 178,766,815 | | | | 2,418,214 | |
Redemptions | | | (28,814,980 | ) | | | — | |
Transaction Fees (Note 1) | | | — | | | | 5 | |
Increase in Net Assets from Capital Share Transactions | | | 149,951,835 | | | | 2,418,219 | |
| | | | | | | | | |
Total Increase in Net Assets | | | 96,863,582 | | | | 1,032,671 | |
| | | | | | | | | |
Net Assets: | | | | | | | | |
Beginning of Period | | | 6,497,235 | | | | 5,464,564 | |
End of Period | | $ | 103,360,817 | | | $ | 6,497,235 | |
| | | | | | | | | |
Share Transactions: | | | | | | | | |
Subscriptions | | | 6,350,000 | | | | 200,000 | |
Redemptions | | | (950,000 | ) | | | — | |
Net Increase in Shares Outstanding from Share Transactions | | | 5,400,000 | | | | 200,000 | |
The accompanying notes are an integral part of these financial statements.
52
Amplify ETF Trust
Statement of Changes in Net Assets
| | Amplify Pure
Junior Gold
Miners ETF |
| | | Period Ended
October 31,
2021(a) |
Operations: | | | | |
Net Investment Income | | $ | 10,066 | |
Net Realized Gain on Investments and Foreign Currency | | | 69,494 | |
Net Change in Unrealized Depreciation on Investments and Foreign Currency | | | (282,036 | ) |
Net Decrease in Net Assets Resulting from Operations | | | (202,476 | ) |
| | | | | |
Capital Share Transactions: | | | | |
Subscriptions | | | 3,208,180 | |
Redemptions | | | (663,360 | ) |
Increase in Net Assets from Capital Share Transactions | | | 2,544,820 | |
| | | | | |
Total Increase in Net Assets | | | 2,342,344 | |
| | | | | |
Net Assets: | | | | |
Beginning of Period | | | — | |
End of Period | | $ | 2,342,344 | |
| | | | | |
Share Transactions: | | | | |
Subscriptions | | | 125,000 | |
Redemptions | | | (25,000 | ) |
Net Increase in Shares Outstanding from Share Transactions | | | 100,000 | |
The accompanying notes are an integral part of these financial statements.
53
Amplify ETF Trust
Statement of Changes in Net Assets
| | Amplify
BlackSwan
ISWN ETF |
| | | Period Ended
October 31,
2021(a) |
Operations: | | | | |
Net Investment Income | | $ | 98,763 | |
Net Realized Gain on Investments | | | 161,928 | |
Net Change in Unrealized Appreciation on Investments | | | 537,072 | |
Net Increase in Net Assets Resulting from Operations | | | 797,763 | |
| | | | | |
Distributions to Shareholders: | | | | |
Dividends and Distributions | | | (80,874 | ) |
Total Distributions | | | (80,874 | ) |
| | | | | |
Capital Share Transactions: | | | | |
Subscriptions | | | 43,882,143 | |
Redemptions | | | (1,245,610 | ) |
Increase in Net Assets from Capital Share Transactions | | | 42,636,533 | |
| | | | | |
Total Increase in Net Assets | | | 43,353,422 | |
| | | | | |
Net Assets: | | | | |
Beginning of Period | | | — | |
End of Period | | $ | 43,353,422 | |
| | | | | |
Share Transactions: | | | | |
Subscriptions | | | 1,750,000 | |
Redemptions | | | (50,000 | ) |
Net Increase in Shares Outstanding from Share Transactions | | | 1,700,000 | |
The accompanying notes are an integral part of these financial statements.
54
Amplify ETF Trust
Statement of Changes in Net Assets
| | Amplify
Cleaner Living
ETF |
| | | Period Ended
October 31,
2021(a) |
Operations: | | | | |
Net Investment Loss | | $ | (1,659 | ) |
Net Realized Loss on Investments | | | (5 | ) |
Net Change in Unrealized Depreciation on Investments | | | (43,466 | ) |
Net Decrease in Net Assets Resulting from Operations | | | (45,130 | ) |
| | | | | |
Capital Share Transactions: | | | | |
Subscriptions | | | 1,276,000 | |
Increase in Net Assets from Capital Share Transactions | | | 1,276,000 | |
| | | | | |
Total Increase in Net Assets | | | 1,230,870 | |
| | | | | |
Net Assets: | | | | |
Beginning of Period | | | — | |
End of Period | | $ | 1,230,870 | |
| | | | | |
Share Transactions: | | | | |
Subscriptions | | | 50,000 | |
Net Increase in Shares Outstanding from Share Transactions | | | 50,000 | |
The accompanying notes are an integral part of these financial statements.
55
Amplify ETF Trust
Statement of Changes in Net Assets
| | Amplify
Thematic
All-Stars
ETF |
| | | Period Ended
October 31,
2021(a) |
Operations: | | | | |
Net Investment Loss | | $ | (4,500 | ) |
Net Realized Gain on Investments and Foreign Currency | | | 12,911 | |
Net Change in Unrealized Appreciation on Investments and Foreign Currency | | | 876,005 | |
Net Increase in Net Assets Resulting from Operations | | | 884,416 | |
| | | | | |
Capital Share Transactions: | | | | |
Subscriptions | | | 11,046,665 | |
Redemptions | | | (623,290 | ) |
Transaction Fees (Note 1) | | | 37 | |
Increase in Net Assets from Capital Share Transactions | | | 10,423,412 | |
| | | | | |
Total Increase in Net Assets | | | 11,307,828 | |
| | | | | |
Net Assets: | | | | |
Beginning of Period | | | — | |
End of Period | | $ | 11,307,828 | |
| | | | | |
Share Transactions: | | | | |
Subscriptions | | | 425,000 | |
Redemptions | | | (25,000 | ) |
Net Increase in Shares Outstanding from Share Transactions | | | 400,000 | |
The accompanying notes are an integral part of these financial statements.
56
Amplify ETF Trust
Statement of Changes in Net Assets
| | Amplify
Digital &
Online Trading
ETF |
| | | Period Ended
October 31,
2021(a) |
Operations: | | | |
Net Investment Income | | $ | 1,003 |
Net Realized Gain on Investments and Foreign Currency | | | 396 |
Net Change in Unrealized Appreciation on Investments and Foreign Currency | | | 36,341 |
Net Increase in Net Assets Resulting from Operations | | | 37,740 |
| | | | |
Capital Share Transactions: | | | |
Subscriptions | | | 631,750 |
Increase in Net Assets from Capital Share Transactions | | | 631,750 |
| | | | |
Total Increase in Net Assets | | | 669,490 |
| | | | |
Net Assets: | | | |
Beginning of Period | | | — |
End of Period | | $ | 669,490 |
| | | | |
Share Transactions: | | | |
Subscriptions | | | 25,000 |
Net Increase in Shares Outstanding from Share Transactions | | | 25,000 |
The accompanying notes are an integral part of these financial statements.
57
Amplify ETF Trust
Amplify High Income ETF
Financial Highlights
| | Year Ended
October 31,
2021 | | Year Ended
October 31,
2020 | | Period Ended
October 31,
2019(a) | | Year Ended
December 31,
2018 | | Year Ended
December 31,
2017 | | Year Ended
December 31,
2016 |
Net Asset Value, Beginning of Year/Period | | $ | 14.28 | | | $ | 17.62 | | | $ | 16.09 | | | $ | 19.49 | | | $ | 18.55 | | | $ | 17.84 | |
Income (Loss) from Investment Operations: | | | | | | | | | | | | | | | | | | | | | | | | |
Net Investment Income(b) | | | 0.81 | | | | 0.97 | | | | 0.86 | | | | 1.13 | | | | 1.22 | | | | 1.22 | |
Net Realized and Unrealized Gain (Loss)(c) | | | 3.48 | | | | (2.69 | ) | | | 1.97 | | | | (2.97 | ) | | | 1.31 | | | | 1.41 | |
Total from Investment Operations | | | 4.29 | | | | (1.72 | ) | | | 2.83 | | | | (1.84 | ) | | | 2.53 | | | | 2.63 | |
| | | | | | | | | | | | | | | | | | | | | | | | | |
Distributions to Shareholders | | | | | | | | | | | | | | | | | | | | | | | | |
Net Investment Income | | | (0.86 | ) | | | (1.03 | ) | | | (0.87 | ) | | | (1.13 | ) | | | (1.20 | ) | | | (1.20 | ) |
Return of Capital | | | (0.67 | ) | | | (0.59 | ) | | | (0.43 | ) | | | (0.43 | ) | | | (0.39 | ) | | | (0.72 | ) |
Total from Distributions | | | (1.53 | ) | | | (1.62 | ) | | | (1.30 | ) | | | (1.56 | ) | | | (1.59 | ) | | | (1.92 | ) |
| | | | | | | | | | | | | | | | | | | | | | | | | |
Capital Share Transactions | | | | | | | | | | | | | | | | | | | | | | | | |
Transaction Fees | | | 0.00 | (i) | | | 0.00 | (i) | | | — | | | | — | | | | — | | | | — | |
| | | | | | | | | | | | | | | | | | | | | | | | | |
Net Asset Value, End of Year/Period | | $ | 17.04 | | | $ | 14.28 | | | $ | 17.62 | | | $ | 16.09 | | | $ | 19.49 | | | $ | 18.55 | |
| | | | | | | | | | | | | | | | | | | | | | | | | |
Total Return on Net Asset Value(d) | | | 30.71 | %(h) | | | -9.84 | % | | | 17.86 | %(h) | | | -9.97 | % | | | 14.03 | % | | | 15.42 | % |
| | | | | | | | | | | | | | | | | | | | | | | | | |
Supplemental Data: | | | | | | | | | | | | | | | | | | | | | | | | |
Net Assets, End of Year/Period (000’s) | | $ | 448,971 | | | $ | 222,820 | | | $ | 237,004 | | | $ | 174,526 | | | $ | 222,223 | | | $ | 117,817 | |
Ratio of Expenses to Average Net Assets | | | 0.50 | % | | | 0.50 | % | | | 0.50 | %(f) | | | 0.50 | % | | | 0.50 | % | | | 0.50 | % |
Ratio of Net Investment Income to Average Net Assets(e) | | | 4.81 | % | | | 6.29 | % | | | 5.93 | %(f) | | | 6.19 | % | | | 6.27 | % | | | 6.62 | % |
Portfolio Turnover(g) | | | 90 | % | | | 43 | % | | | 28 | %(h) | | | 40 | % | | | 34 | % | | | 17 | % |
The accompanying notes are an integral part of these financial statements.
58
Amplify ETF Trust
Amplify Online Retail ETF
Financial Highlights
| | Year Ended
October 31,
2021 | | Year Ended
October 31,
2020 | | Year Ended
October 31,
2019 | | Year Ended
October 31,
2018 | | Year Ended
October 31,
2017 |
Net Asset Value, Beginning of Year | | $ | 88.69 | | | $ | 48.49 | | | $ | 43.86 | | | $ | 37.41 | | | $ | 27.18 | |
Income (Loss) from Investment Operations: | | | | | | | | | | | | | | | | | | | | |
Net Investment Income (Loss)(a) | | | (0.07 | ) | | | 0.58 | | | | 0.16 | | | | (0.17 | ) | | | (0.13 | ) |
Net Realized and Unrealized Gain(b) | | | 22.70 | | | | 39.77 | | | | 4.47 | | | | 6.62 | | | | 10.36 | (c) |
Total from Investment Operations | | | 22.63 | | | | 40.35 | | | | 4.63 | | | | 6.45 | | | | 10.23 | |
| | | | | | | | | | | | | | | | | | | | | |
Distributions to Shareholders | | | | | | | | | | | | | | | | | | | | |
Net Investment Income | | | (0.62 | ) | | | (0.15 | ) | | | — | | | | — | | | | — | |
Total from Distributions | | | (0.62 | ) | | | (0.15 | ) | | | — | | | | — | | | | — | |
| | | | | | | | | | | | | | | | | | | | | |
Capital Share Transactions | | | | | | | | | | | | | | | | | | | | |
Transaction Fees | | | 0.00 | (d) | | | — | | | | — | | | | — | | | | — | |
| | | | | | | | | | | | | | | | | | | | | |
Net Asset Value, End of Year | | $ | 110.70 | | | $ | 88.69 | | | $ | 48.49 | | | $ | 43.86 | | | $ | 37.41 | |
| | | | | | | | | | | | | | | | | | | | | |
Total Return on Net Asset Value(e) | | | 25.49 | % | | | 83.46 | % | | | 10.54 | % | | | 17.25 | % | | | 37.64 | %(f) |
| | | | | | | | | | | | | | | | | | | | | |
Supplemental Data: | | | | | | | | | | | | | | | | | | | | |
Net Assets, End of Year (000’s) | | $ | 896,682 | | | $ | 971,146 | | | $ | 240,005 | | | $ | 370,632 | | | $ | 108,482 | |
Ratio of Expenses to Average Net Assets | | | 0.65 | % | �� | | 0.65 | % | | | 0.65 | % | | | 0.65 | % | | | 0.65 | % |
Ratio of Net Investment Income (Loss) to Average Net Assets | | | -0.06 | % | | | 0.82 | % | | | 0.33 | % | | | -0.35 | % | | | -0.38 | % |
Portfolio Turnover(g) | | | 61 | % | | | 28 | % | | | 36 | % | | | 17 | % | | | 11 | % |
The accompanying notes are an integral part of these financial statements.
59
Amplify ETF Trust
Amplify CWP Enhanced Dividend Income ETF
Financial Highlights
| | Year Ended
October 31,
2021 | | Year Ended
October 31,
2020 | | Year Ended
October 31,
2019 | | Year Ended
October 31,
2018 | | Period Ended
October 31,
2017(a) |
Net Asset Value, Beginning of Year/Period | | $ | 29.22 | | | $ | 30.41 | | | $ | 28.51 | | | $ | 27.54 | | | $ | 25.00 | |
Income from Investment Operations: | | | | | | | | | | | | | | | | | | | | |
Net Investment Income(b) | | | 0.49 | | | | 0.48 | | | | 0.58 | | | | 0.45 | | | | 0.39 | |
Net Realized and Unrealized Gain(c) | | | 9.22 | | | | 0.79 | | | | 2.93 | | | | 2.02 | | | | 2.92 | |
Total from Investment Operations | | | 9.71 | | | | 1.27 | | | | 3.51 | | | | 2.47 | | | | 3.31 | |
| | | | | | | | | | | | | | | | | | | | | |
Distributions to Shareholders | | | | | | | | | | | | | | | | | | | | |
Net Investment Income | | | (1.56 | ) | | | (0.27 | ) | | | (1.61 | ) | | | (1.29 | ) | | | (0.57 | ) |
Net Realized Gains | | | (0.11 | ) | | | (0.86 | ) | | | — | | | | — | | | | — | |
Return of Capital | | | (0.15 | ) | | | (1.33 | ) | | | — | | | | (0.21 | ) | | | (0.20 | ) |
Total from Distributions | | | (1.82 | ) | | | (2.46 | ) | | | (1.61 | ) | | | (1.50 | ) | | | (0.77 | ) |
| | | | | | | | | | | | | | | | | | | | | |
Net Asset Value, End of Year/Period | | $ | 37.11 | | | $ | 29.22 | | | $ | 30.41 | | | $ | 28.51 | | | $ | 27.54 | |
| | | | | | | | | | | | | | | | | | | | | |
Total Return on Net Asset Value(d) | | | 33.81 | % | | | 4.40 | % | | | 12.63 | % | | | 9.12 | % | | | 13.40 | %(g) |
| | | | | | | | | | | | | | | | | | | | | |
Supplemental Data: | | | | | | | | | | | | | | | | | | | | |
Net Assets, End of Year/Period (000’s) | | $ | 766,353 | | | $ | 106,668 | | | $ | 21,286 | | | $ | 15,680 | | | $ | 11,016 | |
Ratio of Expenses to Average Net Assets (Before Advisory Fees Waived) | | | 0.61 | % | | | 0.95 | % | | | 0.95 | % | | | 0.95 | % | | | N/A | |
Ratio of Expenses to Average Net Assets (After Advisory Fees Waived) | | | 0.54 | % | | | 0.49 | % | | | 0.49 | % | | | 0.94 | % | | | 0.95 | %(e) |
Ratio of Net Investment Income to Average Net Assets (Before Advisory Fees Waived) | | | 1.31 | % | | | 1.16 | % | | | 1.50 | % | | | 1.53 | % | | | N/A | |
Ratio of Net Investment Income to Average Net Assets (After Advisory Fees Waived) | | | 1.38 | % | | | 1.62 | % | | | 1.96 | % | | | 1.54 | % | | | 1.67 | %(e) |
Portfolio Turnover(f) | | | 89 | % | | | 86 | % | | | 115 | % | | | 151 | % | | | 187 | %(g) |
The accompanying notes are an integral part of these financial statements.
60
Amplify ETF Trust
Amplify Transformational Data Sharing ETF
Financial Highlights
| | Year Ended
October 31,
2021 | | Year Ended
October 31,
2020 | | Year Ended
October 31,
2019 | | Period Ended
October 31,
2018(a) |
Net Asset Value, Beginning of Year/Period | | $ | 24.80 | | | $ | 18.21 | | | $ | 17.45 | | | $ | 20.00 | |
Income (Loss) from Investment Operations: | | | | | | | | | | | | | | | | |
Net Investment Income(b) | | | 0.24 | | | | 0.17 | | | | 0.23 | | | | 0.14 | |
Net Realized and Unrealized Gain (Loss)(c) | | | 30.98 | | | | 6.80 | | | | 0.71 | | | | (2.69 | )(d) |
Total from Investment Operations | | | 31.22 | | | | 6.97 | | | | 0.94 | | | | (2.55 | ) |
| | | | | | | | | | | | | | | | | |
Distributions to Shareholders | | | | | | | | | | | | | | | | |
Net Investment Income | | | (0.66 | ) | | | (0.39 | ) | | | (0.19 | ) | | | — | |
Total from Distributions | | | (0.66 | ) | | | (0.39 | ) | | | (0.19 | ) | | | — | |
| | | | | | | | | | | | | | | | | |
Capital Share Transactions | | | | | | | | | | | | | | | | |
Transaction Fees | | | 0.01 | | | | 0.01 | | | | 0.01 | | | | 0.00 | (e) |
| | | | | | | | | | | | | | | | | |
Net Asset Value, End of Year/Period | | $ | 55.37 | | | $ | 24.80 | | | $ | 18.21 | | | $ | 17.45 | |
| | | | | | | | | | | | | | | | | |
Total Return on Net Asset Value(f) | | | 127.54 | % | | | 38.97 | % | | | 5.72 | % | | | -12.74 | %(g)(j) |
| | | | | | | | | | | | | | | | | |
Supplemental Data: | | | | | | | | | | | | | | | | |
Net Assets, End of Year/Period (000’s) | | $ | 1,495,050 | | | $ | 132,705 | | | $ | 99,269 | | | $ | 131,762 | |
Ratio of Expenses to Average Net Assets (Before Advisory Fees Waived) | | | 0.73 | % | | | 0.90 | % | | | 0.90 | % | | | 0.90 | %(h) |
Ratio of Expenses to Average Net Assets (After Advisory Fees Waived) | | | 0.70 | % | | | 0.70 | % | | | 0.70 | % | | | 0.70 | %(h) |
Ratio of Net Investment Income to Average Net Assets (Before Advisory Fees Waived) | | | 0.47 | % | | | 0.65 | % | | | 1.15 | % | | | 0.68 | %(h) |
Ratio of Net Investment Income to Average Net Assets (After Advisory Fees Waived) | | | 0.50 | % | | | 0.85 | % | | | 1.35 | % | | | 0.88 | %(h) |
Portfolio Turnover(i) | | | 41 | % | | | 44 | % | | | 35 | % | | | 44 | %(j) |
The accompanying notes are an integral part of these financial statements.
61
Amplify ETF Trust
Amplify Lithium & Battery Technology ETF
Financial Highlights
| | Year Ended
October 31,
2021 | | Year Ended
October 31,
2020 | | Year Ended
October 31,
2019 | | Period Ended
October 31,
2018(a) |
Net Asset Value, Beginning of Year/Period | | $ | 10.83 | | | $ | 10.59 | | | $ | 12.87 | | | $ | 20.00 | |
Income (Loss) from Investment Operations: | | | | | | | | | | | | | | | | |
Net Investment Income(b) | | | 0.27 | | | | 0.16 | | | | 0.29 | | | | 0.13 | |
Net Realized and Unrealized Gain (Loss)(c) | | | 8.50 | | | | 0.41 | | | | (2.48 | ) | | | (7.27 | )(d) |
Total from Investment Operations | | | 8.77 | | | | 0.57 | | | | (2.19 | ) | | | (7.14 | ) |
| | | | | | | | | | | | | | | | | |
Distributions to Shareholders | | | | | | | | | | | | | | | | |
Net Investment Income | | | (0.03 | ) | | | (0.35 | ) | | | (0.10 | ) | | | — | |
Total from Distributions | | | (0.03 | ) | | | (0.35 | ) | | | (0.10 | ) | | | — | |
| | | | | | | | | | | | | | | | | |
Capital Share Transactions | | | | | | | | | | | | | | | | |
Transaction Fees | | | 0.02 | | | | 0.02 | | | | 0.01 | | | | 0.01 | |
| | | | | | | | | | | | | | | | | |
Net Asset Value, End of Year/Period | | $ | 19.59 | | | $ | 10.83 | | | $ | 10.59 | | | $ | 12.87 | |
| | | | | | | | | | | | | | | | | |
Total Return on Net Asset Value(e) | | | 81.32 | % | | | 5.56 | % | | | -16.96 | % | | | -35.65 | %(f)(i) |
| | | | | | | | | | | | | | | | | |
Supplemental Data: | | | | | | | | | | | | | | | | |
Net Assets, End of Year/Period (000’s) | | $ | 234,137 | | | $ | 9,747 | | | $ | 4,767 | | | $ | 6,435 | |
Ratio of Expenses to Average Net Assets (Before Advisory Fees Waived) | | | N/A | | | | 0.89 | % | | | 0.92 | % | | | 0.92 | %(g) |
Ratio of Expenses to Average Net Assets (After Advisory Fees Waived) | | | 0.59 | % | | | 0.71 | % | | | 0.72 | % | | | 0.72 | %(g) |
Ratio of Net Investment Income to Average Net Assets (Before Advisory Fees Waived) | | | N/A | | | | 1.42 | % | | | 2.23 | % | | | 1.82 | %(g) |
Ratio of Net Investment Income to Average Net Assets (After Advisory Fees Waived) | | | 1.57 | % | | | 1.60 | % | | | 2.43 | % | | | 2.02 | %(g) |
Portfolio Turnover(h) | | | 51 | % | | | 131 | % | | | 61 | % | | | 12 | %(i) |
The accompanying notes are an integral part of these financial statements.
62
Amplify ETF Trust
Amplify BlackSwan Growth & Treasury Core ETF
Financial Highlights
| | Year Ended
October 31,
2021 | | Year Ended
October 31,
2020 | | Period Ended
October 31,
2019(a) |
Net Asset Value, Beginning of Year/Period | | $ | 30.87 | | | $ | 28.57 | | | $ | 25.00 | |
Income from Investment Operations: | | | | | | | | | | | | |
Net Investment Income(b) | | | 0.09 | | | | 0.12 | | | | 0.43 | |
Net Realized and Unrealized Gain(c) | | | 5.25 | | | | 3.05 | (d) | | | 3.52 | |
Total from Investment Operations | | | 5.34 | | | | 3.17 | | | | 3.95 | |
| | | | | | | | | | | | | |
Distributions to Shareholders | | | | | | | | | | | | |
Net Investment Income | | | (0.07 | ) | | | (0.19 | ) | | | (0.38 | ) |
Net Realized Gains | | | (0.42 | ) | | | (0.68 | ) | | | — | |
Total from Distributions | | | (0.49 | ) | | | (0.87 | ) | | | (0.38 | ) |
| | | | | | | | | | | | | |
Capital Share Transactions | | | | | | | | | | | | |
Transaction Fees | | | — | | | | 0.00 | (e) | | | — | |
| | | | | | | | | | | | | |
Net Asset Value, End of Year/Period | | $ | 35.72 | | | $ | 30.87 | | | $ | 28.57 | |
| | | | | | | | | | | | | |
Total Return on Net Asset Value(f) | | | 17.44 | % | | | 11.29 | %(j) | | | 15.94 | %(i) |
| | | | | | | | | | | | | |
Supplemental Data: | | | | | | | | | | | | |
Net Assets, End of Year/Period (000’s) | | $ | 911,467 | | | $ | 685,231 | | | $ | 124,299 | |
Ratio of Expenses to Average Net Assets | | | 0.49 | % | | | 0.49 | % | | | 0.49 | %(g) |
Ratio of Net Investment Income to Average Net Assets | | | 0.25 | % | | | 0.40 | % | | | 1.64 | %(g) |
Portfolio Turnover(h) | | | 194 | % | | | 162 | % | | | 154 | %(i) |
The accompanying notes are an integral part of these financial statements.
63
Amplify ETF Trust
Amplify International Online Retail ETF
Financial Highlights
| | Year Ended
October 31,
2021 | | Year Ended
October 31,
2020 | | Period Ended
October 31,
2019(a) |
Net Asset Value, Beginning of Year/Period | | $ | 41.54 | | | $ | 26.73 | | | $ | 25.00 | |
Income (Loss) from Investment Operations: | | | | | | | | | | | | |
Net Investment Loss(b) | | | (0.12 | ) | | | (0.07 | ) | | | (0.07 | ) |
Net Realized and Unrealized Gain(c) | | | 2.05 | | | | 14.92 | (d) | | | 1.79 | |
Total from Investment Operations | | | 1.93 | | | | 14.85 | | | | 1.72 | |
| | | | | | | | | | | | | |
Distributions to Shareholders | | | | | | | | | | | | |
Net Investment Income | | | — | | | | (0.05 | ) | | | — | |
Total from Distributions | | | — | | | | (0.05 | ) | | | — | |
| | | | | | | | | | | | | |
Capital Share Transactions | | | | | | | | | | | | |
Transaction Fees | | | 0.02 | | | | 0.01 | | | | 0.01 | |
| | | | | | | | | | | | | |
Net Asset Value, End of Year/Period | | $ | 43.49 | | | $ | 41.54 | | | $ | 26.73 | |
| | | | | | | | | | | | | |
Total Return on Net Asset Value(e) | | | 4.68 | % | | | 55.70 | %(i) | | | 6.91 | %(h) |
| | | | | | | | | | | | | |
Supplemental Data: | | | | | | | | | | | | |
Net Assets, End of Year/Period (000’s) | | $ | 10,872 | | | $ | 10,386 | | | $ | 2,005 | |
Ratio of Expenses to Average Net Assets | | | 0.69 | % | | | 0.69 | % | | | 0.69 | %(f) |
Ratio of Net Investment Loss to Average Net Assets | | | -0.24 | % | | | -0.21 | % | | | -0.34 | %(f) |
Portfolio Turnover(g) | | | 69 | % | | | 83 | % | | | 64 | %(h) |
The accompanying notes are an integral part of these financial statements.
64
Amplify ETF Trust
Amplify Seymour Cannabis ETF
Financial Highlights
| | Year Ended
October 31,
2021 | | Year Ended
October 31,
2020 | | Period Ended
October 31,
2019(a) |
Net Asset Value, Beginning of Year/Period | | $ | 11.81 | | | $ | 15.61 | | | $ | 24.71 | |
Income (Loss) from Investment Operations: | | | | | | | | | | | | |
Net Investment Income(b) | | | 0.01 | | | | 0.31 | | | | — | (c) |
Net Realized and Unrealized Gain (Loss)(d) | | | 5.65 | | | | (4.03 | ) | | | (9.10 | ) |
Total from Investment Operations | | | 5.66 | | | | (3.72 | ) | | | (9.10 | ) |
| | | | | | | | | | | | | |
Distributions to Shareholders | | | | | | | | | | | | |
Net Investment Income | | | (0.10 | ) | | | (0.08 | ) | | | — | |
Total from Distributions | | | (0.10 | ) | | | (0.08 | ) | | | — | |
| | | | | | | | | | | | | |
Capital Share Transactions | | | | | | | | | | | | |
Transaction Fees | | | — | | | | 0.00 | (c) | | | — | |
| | | | | | | | | | | | | |
Net Asset Value, End of Year/Period | | $ | 17.37 | | | $ | 11.81 | | | $ | 15.61 | |
| | | | | | | | | | | | | |
Total Return on Net Asset Value(e) | | | 47.93 | % | | | -24.94 | % | | | -37.28 | %(h) |
| | | | | | | | | | | | | |
Supplemental Data: | | | | | | | | | | | | |
Net Assets, End of Year/Period (000’s) | | $ | 103,361 | | | $ | 6,497 | | | $ | 5,465 | |
Ratio of Expenses to Average Net Assets (Before Advisory Fees Waived/Reimbursed & Securities Lending Credit) | | | 0.97 | % | | | 5.61 | % | | | 6.14 | %(f) |
Ratio of Expenses to Average Net Assets (After Advisory Fees Waived/Reimbursed) | | | 0.75 | % | | | 2.22 | % | | | 5.73 | %(f) |
Ratio of Expenses to Average Net Assets (After Advisory Fees Waived/Reimbursed & Securities Lending Credit) | | | 0.75 | % | | | 0.75 | % | | | 0.75 | %(f) |
Ratio of Net Investment Income to Average Net Assets (Before Advisory Fees Waived) | | | -0.17 | % | | | -1.93 | % | | | 6.14 | %(f) |
Ratio of Net Investment Income to Average Net Assets (After Advisory Fees Waived) | | | 0.05 | % | | | 2.93 | % | | | -0.10 | %(f) |
Portfolio Turnover(g) | | | 124 | % | | | 64 | % | | | 23 | %(h) |
The accompanying notes are an integral part of these financial statements.
65
Amplify ETF Trust
Amplify Pure Junior Gold Miners ETF
Financial Highlights
| | Period Ended
October 31,
2021(a) |
Net Asset Value, Beginning of Period | | $ | 25.00 | |
Income (Loss) from Investment Operations: | | | | |
Net Investment Income(b) | | | 0.11 | |
Net Realized and Unrealized Loss(c) | | | (1.69 | ) |
Total from Investment Operations | | | (1.58 | ) |
| | | | | |
Net Asset Value, End of Period | | $ | 23.42 | |
| | | | | |
Total Return on Net Asset Value(d) | | | -6.31 | %(f) |
| | | | | |
Supplemental Data: | | | | |
Net Assets, End of Period (000’s) | | $ | 2,342 | |
Ratio of Expenses to Average Net Assets | | | 0.49 | %(e) |
Ratio of Net Investment Income to Average Net Assets | | | 0.50 | %(e) |
Portfolio Turnover(g) | | | 36 | %(f) |
The accompanying notes are an integral part of these financial statements.
66
Amplify ETF Trust
Amplify BlackSwan ISWN ETF
Financial Highlights
| | Period Ended
October 31,
2021(a) |
Net Asset Value, Beginning of Period | | $ | 25.00 | |
Income from Investment Operations: | | | | |
Net Investment Income(b) | | | 0.07 | |
Net Realized and Unrealized Gain(c) | | | 0.48 | |
Total from Investment Operations | | | 0.55 | |
| | | | | |
Distributions to Shareholders | | | | |
Net Investment Income | | | (0.05 | ) |
Total from Distributions | | | (0.05 | ) |
| | | | | |
Net Asset Value, End of Period | | $ | 25.50 | |
| | | | | |
Total Return on Net Asset Value(d) | | | 2.23 | %(f) |
| | | | | |
Supplemental Data: | | | | |
Net Assets, End of Period (000’s) | | $ | 43,353 | |
Ratio of Expenses to Average Net Assets | | | 0.49 | %(e) |
Ratio of Net Investment Income to Average Net Assets | | | 0.38 | %(e) |
Portfolio Turnover(g) | | | 123 | %(f) |
The accompanying notes are an integral part of these financial statements.
67
Amplify ETF Trust
Amplify Cleaner Living ETF
Financial Highlights
| | Period Ended
October 31,
2021(a) |
Net Asset Value, Beginning of Period | | $ | 25.52 | |
Income (Loss) from Investment Operations: | | | | |
Net Investment Loss(b) | | | (0.03 | ) |
Net Realized and Unrealized Loss(c) | | | (0.87 | ) |
Total from Investment Operations | | | (0.90 | ) |
| | | | | |
Net Asset Value, End of Period | | $ | 24.62 | |
| | | | | |
Total Return on Net Asset Value(d) | | | -3.54 | %(f) |
| | | | | |
Supplemental Data: | | | | |
Net Assets, End of Period (000’s) | | $ | 1,231 | |
Ratio of Expenses to Average Net Assets | | | 0.59 | %(e) |
Ratio of Net Investment Income to Average Net Assets | | | -0.40 | %(e) |
Portfolio Turnover(g) | | | 0 | %(f) |
The accompanying notes are an integral part of these financial statements.
68
Amplify ETF Trust
Amplify Thematic All-Stars ETF
Financial Highlights
| | Period Ended
October 31,
2021(a) |
Net Asset Value, Beginning of Period | | $ | 25.05 | |
Income (Loss) from Investment Operations: | | | | |
Net Investment Loss(b) | | | (0.02 | ) |
Net Realized and Unrealized Gain(c) | | | 3.24 | |
Total from Investment Operations | | | 3.22 | |
| | | | | |
Capital Share Transactions | | | | |
Transaction Fees | | | 0.00(h) | |
Net Asset Value, End of Period | | $ | 28.27 | |
| | | | | |
Total Return on Net Asset Value(d) | | | 12.85 | %(f)(i) |
| | | | | |
Supplemental Data: | | | | |
Net Assets, End of Period (000’s) | | $ | 11,308 | |
Ratio of Expenses to Average Net Assets | | | 0.49 | %(e) |
Ratio of Net Investment Income to Average Net Assets | | | -0.23 | %(e) |
Portfolio Turnover(g) | | | 48 | %(f) |
The accompanying notes are an integral part of these financial statements.
69
Amplify ETF Trust
Amplify Digital & Online Trading ETF
Financial Highlights
| | Period Ended
October 31,
2021(a) |
Net Asset Value, Beginning of Period | | $ | 25.27 | |
Income (Loss) from Investment Operations: | | | | |
Net Investment Income(b) | | | 0.04 | |
Net Realized and Unrealized Gain(c) | | | 1.47 | |
Total from Investment Operations | | | 1.51 | |
| | | | | |
Net Asset Value, End of Period | | $ | 26.78 | |
| | | | | |
Total Return on Net Asset Value(d) | | | 5.97 | %(f) |
| | | | | |
Supplemental Data: | | | | |
Net Assets, End of Period (000’s) | | $ | 669 | |
Ratio of Expenses to Average Net Assets | | | 0.59 | %(e) |
Ratio of Net Investment Income to Average Net Assets | | | 1.43 | %(e) |
Portfolio Turnover(g) | | | 7 | %(f) |
The accompanying notes are an integral part of these financial statements.
70
Amplify ETF Trust
Notes to the Financial Statements
October 31, 2021
1. ORGANIZATION
Amplify ETF Trust (the “Trust”) was organized as a Massachusetts business trust on January 6, 2015, and is authorized to issue an unlimited number of shares in one or more series of funds. The Trust is an open-end management investment company, registered under the Investment Company Act of 1940, as amended (the “1940 Act”). The Trust consists of three diversified funds, Amplify High Income ETF (“YYY”), Amplify Online Retail ETF (“IBUY”) and Amplify Transformational Data Sharing ETF (“BLOK”) and ten non-diversified funds, Amplify CWP Enhanced Dividend Income ETF (“DIVO”), Amplify Lithium & Battery Technology ETF (formerly Amplify Advanced Battery Metals and Materials ETF) (“BATT”), Amplify BlackSwan Growth & Treasury Core ETF (“SWAN”), Amplify International Online Retail ETF (“XBUY”), Amplify Seymour Cannabis ETF (“CNBS”), Amplify Pure Junior Gold Miners ETF (“JGLD”), Amplify BlackSwan ISWN ETF (“ISWN”), Amplify Cleaner Living ETF (“DTOX”), Amplify Thematic All-Stars ETF (“MVPS”) and Amplify Digital & Online Trading ETF (“BIDS”) (each a “Fund” and collectively the “Funds”). Each Fund represents a beneficial interest in a separate portfolio of securities and other assets, with their own investment objectives and policies.
The investment objective of YYY is to seek investment results that generally correspond (before fees and expenses) to the price and yield of the ISE High IncomeTM Index. YYY commenced operations on June 11, 2012. The investment objective of IBUY is to seek investment results that generally correspond (before fees and expenses) to the price and yield of the EQM Online Retail Index. IBUY commenced operations on April 19, 2016. The investment objective of DIVO is to seek to provide current income as its primary objective and to provide capital appreciation as its secondary objective. DIVO commenced operations on December 13, 2016. The investment objective of BLOK is to seek to provide investors with total return. BLOK commenced operations on January 16, 2018. The investment objective of BATT is to seek investment results that generally correspond (before fees and expenses) to the price and yield of the EQM Lithium & Battery Technology Index. BATT commenced operations on June 4, 2018. The investment objective of SWAN is to seek investment results that generally correspond (before fees and expenses) to the price and yield of the S-Network BlackSwan Core Index. SWAN commenced operations on November 5, 2018. The investment objective of XBUY is to seek investment results that generally correspond (before fees and expenses) to the price and yield of the EQM International Ecommerce Index. XBUY commenced operations on January 29, 2019. The investment objective of CNBS is to seek to provide investors capital appreciation. CNBS commenced operations on July 22, 2019. The investment objective of JGLD is to seek investment results that generally correspond (before fees and expenses) to the price and yield of the EQM Pure Junior Gold Miners Index. JGLD commenced operations on November 30, 2020. The investment objective of ISWN is to seek investment results that generally correspond (before fees and expenses) to the price and yield of the S-Network BlackSwan International Index. ISWN commenced operations on January 25, 2021. The investment objective of DTOX is to seek investment results that generally correspond (before fees and expenses) to the price and yield of the Tematica BITA Cleaner Living Index. DTOX commenced operations on June 23, 2021. The investment objective of MVPS is to seek investment results that generally correspond (before fees and expenses) to the price and yield of the ETF All-Stars Thematic Composite Index. MVPS commenced operations on July 20, 2021. The investment objective of BIDS is to seek s investment results that generally correspond (before fees and expenses) to the price and yield of the BlueStar® Global E-Brokers and Digital Capital Markets Index. BIDS commenced operations on September 21, 2021.
The Funds list and principally trade their shares on the New York Stock Exchange Arca (“NYSE”) (“Exchange”). Shares of the Funds trade on the Exchange at market prices that may be below, at, or above the Funds’ net asset value (“NAV”). YYY, IBUY, DIVO, BLOK, BATT, and CNBS will issue and redeem shares on a continuous basis at NAV only in large blocks of shares, typically 50,000 shares, called “Creation Units.” SWAN will issue and redeem shares on a continuous basis at NAV only in creation units of, typically 10,000 shares. XBUY, JGLD, ISWN, DTOX, MVPS and BIDS will issue and redeem shares on a continuous basis at NAV only in creation units of, typically 25,000 shares. Creation Units will be issued and redeemed principally in-kind for securities included in a specified universe. Once created, shares generally will trade in the secondary market at market prices that change throughout the day in quantities less than a Creation Unit. Except when aggregated in Creation Units, shares are not redeemable securities of a Fund. Shares of a Fund may only be purchased or redeemed by certain financial institutions (“Authorized Participants”). An Authorized Participant is either (i) a broker-dealer or other participant in the clearing process through the Continuous Net Settlement System of the National Securities Clearing Corporation or
71
Amplify ETF Trust
Notes to the Financial Statements
October 31, 2021 (Continued)
(ii) a DTC participant and, in each case, must have executed an Authorized Participant Agreement with Foreside Fund Services, LLC (“the Distributor”). Most retail investors will not qualify as Authorized Participants or have the resources to buy and sell whole Creation Units. Therefore, they will be unable to purchase or redeem the shares directly from the Funds. Rather, most retail investors will purchase shares in the secondary market with the assistance of a broker and will be subject to customary brokerage commissions or fees.
A creation unit will generally not be issued until the transfer of good title of the deposit securities to CNBS and the payment of any cash amounts have been completed. To the extent contemplated by the applicable authorized participant agreement, Creation Units of CNBS will be issued to such authorized participant notwithstanding the fact that CNBS deposits have not been received in part or in whole, in reliance on the undertaking of the authorized participant to deliver the missing deposit securities as soon as possible, which undertaking shall be secured by such authorized participant’s delivery and maintenance of collateral consisting of cash in the form of U.S. dollars immediately available funds having a value (marked to market daily) at least equal to 105% of the value of the missing deposit securities.
Each Fund currently offers one class of shares, which has no front end sales load, no deferred sales charge, and no redemption fee. A purchase or redemption (i.e. creation or redemption) transaction fee of $500 is imposed for the transfer and other transaction costs associated with the purchase or redemption of Creation Units for YYY, IBUY, DIVO, BLOK, CNBS and DTOX. A purchase or redemption transaction fee of $1,000 is imposed for BATT. A purchase or redemption transaction fee of $250 is imposed for SWAN and ISWN. A purchase or redemption transaction fee of $750 is imposed for XBUY, JGLD and BIDS. A purchase or redemption transaction fee of $1,500 is imposed for MVPS. The Funds may issue an unlimited number of shares of beneficial interest, with par value of $0.01 per share. All shares of the Funds have equal rights and privileges.
2. SIGNIFICANT ACCOUNTING POLICIES
The Funds are investment companies and accordingly follow the investment company accounting and reporting guidance of the Financial Accounting Standards Board (“FASB”) Accounting Standards Codification (“ASC”) Topic 946, Financial Services – Investment Companies.
The following is a summary of significant accounting policies consistently followed by the Funds in the preparation of their financial statements. These policies are in conformity with accounting principles generally accepted in the United States of America (“U.S. GAAP”).
SECURITY VALUATION
In accordance with the authoritative guidance on fair value measurements and disclosure under U.S. GAAP, the Funds disclose fair value of their investments in a hierarchy that prioritizes the inputs to valuation techniques used to measure fair value. The objective of a fair value measurement is to determine the price that would be received to sell an asset or paid to transfer a liability in an orderly transaction between market participants at the measurement date (an exit price). Accordingly, the fair value hierarchy gives the highest priority to quoted prices (unadjusted) in active markets for identical assets or liabilities (Level 1) and the lowest priority to unobservable inputs (Level 3). The following describes the levels of the fair value hierarchy:
Level 1 – Unadjusted quoted prices in active markets for identical, unrestricted assets or liabilities that the Funds have the ability to access at the measurement date;
Level 2 – Quoted prices which are not active, or inputs that are observable (either directly or indirectly) for substantially the full term of the asset or liability; and
Level 3 – Prices, inputs or exotic modeling techniques which are both significant to the fair value measurement and unobservable (supported by little or no market activity).
72
Amplify ETF Trust
Notes to the Financial Statements
October 31, 2021 (Continued)
The valuation techniques used by the Funds to measure fair value for the year ended October 31, 2021 maximized the use of observable inputs and minimized the use of unobservable inputs.
For the year ended October 31, 2021, there have been no significant changes to the Funds’ fair valuation methodologies.
Common stocks, preferred stock, and other equity securities listed on any national or foreign exchange (excluding Nasdaq) and the London Stock Exchange Alternative Investment Market (“AIM”) will be valued at the last price on the exchange on which they are principally traded or, for Nasdaq and AIM securities, the official closing price. Securities traded on more than one securities exchange are valued at the last sale price or official closing price, as applicable, at the close of the exchange representing the principal market for such securities. Foreign securities and other assets denominated in foreign currencies are translated into U.S. dollars at the current exchange rate, which approximates fair value. Redeemable securities issued by open-end investment companies shall be valued at the investment company’s applicable NAV, with the exception of exchange-traded open-end and closed-end investment companies which are priced as equity securities. Exchange-traded options will be valued at the current mean price where such contracts are principally traded. Securities traded in the over-the-counter market are valued at the mean of the bid and the asked price, if available, and otherwise at their closing bid price. Fixed income securities will be valued at the mean price. Fixed income securities having a remaining maturity of 60 days or less when purchased will be valued at the current market price. If there is no current market available then the securities will be valued at cost and adjusted for amortization of premiums and accretions of discounts. Swaps will be valued by using the market close price of the underlying holdings. If there is no current market price available, then the securities will be valued at the last price.
If no quotation is available from either a pricing service, or one or more brokers or if the pricing committee has reason to question the reliability or accuracy of a quotation supplied, securities are valued at fair value as determined in good faith by the pricing committee, pursuant to procedures established under the general supervision and responsibility of the Fund’s Board of Trustees (the “Board”).
The following is a summary of the fair valuations according to the inputs used to value the Funds’ investments as of October 31, 2021:
Category | | YYY | | IBUY | | DIVO | | BLOK | | BATT |
Investments in Securities | | | | | | | | | | | | | | | |
Assets | | | | | | | | | | | | | | | |
Level 1 | | | | | | | | | | | | | | | |
Investment Companies | | $ | 447,424,923 | | $ | — | | $ | — | | $ | — | | $ | — |
Common Stocks | | | — | | | 894,017,931 | | | 592,745,036 | | | 1,304,430,168 | | | 233,200,498 |
Exchange Traded Funds | | | | | | | | | 72,034,353 | | | 64,751,464 | | | — |
Money Market Funds | | | 479,599 | | | 3,105,588 | | | — | | | 91,164,274 | | | 316,257 |
Investments Purchased with Proceeds from Securities Lending | | | 17,004,950 | | | 101,273,216 | | | — | | | 213,507,916 | | | 27,769,985 |
Total Level 1 | | | 464,909,472 | | | 998,396,735 | | | 664,779,389 | | | 1,673,853,822 | | | 261,286,740 |
Level 2 | | | | | | | | | | | | | | | |
Rights | | $ | 61,510 | | $ | — | | $ | — | | $ | — | | $ | — |
Total Level 2 | | | 61,510 | | | — | | | — | | | — | | | — |
73
Amplify ETF Trust
Notes to the Financial Statements
October 31, 2021 (Continued)
Category | | YYY | | IBUY | | DIVO | | BLOK | | BATT |
Level 3 | | | | | | | | | | | | | | | |
Convertible Bonds | | | — | | | — | | | — | | | 26,678,603 | | | — |
Total Level 3 | | | — | | | — | | | — | | | 26,678,603 | | | — |
Total | | $ | 464,970,982 | | $ | 998,396,735 | | $ | 664,779,389 | | $ | 1,700,532,425 | | $ | 261,286,740 |
Other Financial Instruments(a) | | | | | | | | | | | | | | | |
Liabilities | | | | | | | | | | | | | | | |
Level 1 | | | | | | | | | | | | | | | |
Options Written | | $ | — | | $ | — | | $ | 173,350 | | $ | — | | $ | — |
Total Level 1 | | | — | | | — | | | 173,350 | | | — | | | — |
Level 2 | | | — | | | — | | | — | | | — | | | — |
Total Level 2 | | | — | | | — | | | — | | | — | | | — |
Level 3 | | | — | | | — | | | — | | | — | | | — |
Total Level 3 | | | — | | | — | | | — | | | — | | | — |
Total | | $ | — | | $ | — | | $ | 173,350 | | $ | — | | $ | — |
Category | | SWAN | | XBUY | | CNBS | | JGLD | | ISWN |
Investments in Securities | | | | | | | | | | | | | | | |
Assets | | | | | | | | | | | | | | | |
Level 1 | | | | | | | | | | | | | | | |
Common Stocks | | $ | — | | $ | 10,863,958 | | $ | 70,588,404 | | $ | 2,337,588 | | $ | — |
Money Market Funds | | | 3,677,816 | | | 9,667 | | | 15,100,000 | | | 5,135 | | | 98,010 |
Purchased Options | | | 159,689,560 | | | — | | | — | | | — | | | 5,507,190 |
U.S. Government Notes/Bonds | | | 746,524,696 | | | — | | | — | | | — | | | 37,674,698 |
Investments Purchased with Proceeds from Securities Lending | | | — | | | 959,654 | | | — | | | — | | | — |
Total Level 1 | | | 909,892,072 | | | 11,833,279 | | | 85,688,404 | | | 2,342,723 | | | 43,279,898 |
Level 2 | | | | | | | | | | | | | | | |
Total Level 2 | | | — | | | — | | | — | | | — | | | — |
Level 3 | | | | | | | | | | | | | | | |
Total Level 3 | | | — | | | — | | | — | | | — | | | — |
Total | | $ | 909,892,072 | | $ | 11,833,279 | | $ | 85,688,404 | | $ | 2,342,723 | | $ | 43,279,898 |
Other Financial Instruments(a) | | | | | | | | | | | | | | | |
Liabilities | | | | | | | | | | | | | | | |
Level 1 | | | | | | | | | | | | | | | |
Total Return Swaps | | $ | — | | $ | — | | $ | 2,184,214 | | $ | — | | $ | — |
Total Level 1 | | | — | | | — | | | 2,184,214 | | | — | | | — |
Level 2 | | | — | | | — | | | — | | | — | | | — |
Total Level 2 | | | — | | | — | | | — | | | — | | | — |
Level 3 | | | — | | | — | | | — | | | — | | | — |
Total Level 3 | | | — | | | — | | | — | | | — | | | — |
Total | | $ | — | | $ | — | | $ | 2,184,214 | | $ | — | | $ | — |
74
Amplify ETF Trust
Notes to the Financial Statements
October 31, 2021 (Continued)
Category | | DTOX | | MVPS | | BIDS |
Investments in Securities | | | | | | | | | |
Assets | | | | | | | | | |
Level 1 | | | | | | | | | |
Common Stocks | | $ | 1,230,769 | | $ | 11,241,383 | | $ | 664,840 |
Preferred Stock | | | — | | | 26,737 | | | — |
Money Market Funds | | | 592 | | | 50,138 | | | 1,661 |
Investments Purchased with Proceeds from Securities Lending | | | — | | | — | | | — |
Total Level 1 | | | 1,231,361 | | | 11,318,258 | | | 666,501 |
Level 2 | | | | | | | | | |
Total Level 2 | | | — | | | — | | | — |
Level 3 | | | | | | | | | |
Total Level 3 | | | — | | | — | | | — |
Total | | $ | 1,231,361 | | $ | 11,318,258 | | $ | 666,501 |
See the Schedules of Investments for further disaggregation of investment categories.
For the year ended October 31, 2021, there were no transfers into or out of Level 3 for the Funds. Below is a reconciliation of securities in Level 3 for the Funds.
| | Balance as of
10/31/2020 | | Net Realized
Gain (Loss) | | Change in Net
Unrealized
Appreciation
(Depreciation) | | Purchases/
Acquisition | | Sales | | Corporate
Action | | Transfers
In/Out of
Level 3 | | Balance as of
10/31/2021 | | Net Change
in Unrealized
Appreciation
(Depreciation) on
Securities held at
10/31/2021 |
BATT – Common Stocks | | $ | — | | $ | (241,385 | ) | | $ | 241,991 | | $ | — | | $ | — | | $ | (606 | ) | | $ | — | | $ | — | | $ | — |
BLOK – Convertible Bonds | | | — | | | — | | | | 9,863 | | | 26,668,740 | | | — | | | — | | | | — | | | 26,678,603 | | | 26,678,603 |
The following is a summary of quantitative information about Level 3 Fair Value Measurements:
BLOK | | Fair Value
as of
10/31/2021 | | Valuation
Techniques | | Unobservable
Input | | Range/Weighted
Average Unobservable
Input |
Convertible Bonds | | $ | 26,678,603 | | Cost | | None | | — |
OPTION WRITING
DIVO will employ an option strategy in which it will write U.S. exchange-traded covered call options on Equity Securities in the portfolio in order to seek additional income (in the form of premiums on the options) and selective repurchase of such options. A call option written (sold) by DIVO will give the holder (buyer) the right to buy a certain equity security at a predetermined strike price from DIVO. A premium is the income received by an investor who sells or writes an option contract to another party. DIVO seeks to lower risk and enhance total return by tactically selling short-term call options on some, or all, of the equity securities in the portfolio. Specifically, DIVO seeks to provide gross income of approximately 2-3% from dividend income and 2-4% from option premium, plus the potential for capital appreciation. Unlike a systematic covered call program, DIVO is not obligated to continuously cover each individual equity position. When one of the underlying stocks demonstrates strength or an increase in implied volatility, DIVO identifies that opportunity and sells call options tactically, rather than keeping all positions covered and limiting potential upside.
75
Amplify ETF Trust
Notes to the Financial Statements
October 31, 2021 (Continued)
When DIVO writes an option, an amount equal to the premium received by DIVO is recorded as a liability and is subsequently adjusted to the current fair value of the option written. Premiums received from writing options that expire unexercised are treated by DIVO on the expiration date as realized gains from options written. The difference between the premium and the amount paid on effecting a closing purchase transaction, including brokerage commissions, is also treated as a realized gain, or, if the premium is less than the amount paid for the closing purchase transaction, as a realized loss. If a call option is exercised, the premium is added to the proceeds from the sale of the underlying security in determining whether DIVO has realized a gain or loss. DIVO, as a writer of an option, bears the market risk of an unfavorable change in the price of the security underlying the written option. During the period, DIVO used written covered call options in a manner consistent with the strategy described above.
SWAN and ISWN’s investments in options contracts will primarily be long-term equity anticipation securities known as LEAP Options. LEAP Options are long-term exchange-traded call options that allow holders the opportunity to participate in the underlying securities’ appreciation in excess of a specified strike price without receiving payments equivalent to any cash dividends declared on the underlying securities. A holder of a LEAP Option will be entitled to receive a specified number of shares of the underlying stock upon payment of the exercise price, and therefore the LEAP Option will be exercisable at any time the price of the underlying stock is above the strike price. However, if at expiration the price of the underlying stock is at or below the strike price, the LEAP Option will expire and be worthless.
SWAP AGREEMENTS
CNBS may enter into total return swaps for investment purposes. Total return swaps are agreements to exchange the return generated by one instrument for the return generated by another instrument. For example, the agreement to pay a predetermined or fixed interest rate in exchange for a market-linked return based on a notional amount. To the extent the total return of a referenced index or instrument exceeds the offsetting interest obligation, a Fund will receive a payment from the counterparty. To the extent it is less, a Fund will make a payment to the counterparty. The marked-to-market value less a financing rate, if any, is recorded in net unrealized appreciation (depreciation) on swaps on the Statements of Assets and Liabilities. At termination or maturity date, a net cash flow is exchanged where the total return is equivalent to the return of the underlying reference asset less a financing rate, if any, and is recorded in net realized gain (loss) on swaps on the Statements of Operations. To the extent the marked-to market value of a total return swap appreciates to the benefit of a Fund and exceeds certain contractual thresholds, a Fund’s counterparty may be contractually required to provide collateral. If the marked-to-market value of a total return swap depreciates in value to the benefit of a counterparty and exceeds certain contractual thresholds, a Fund would generally be required to provide collateral for the benefit of its counterparty. Assets provided by the Funds as collateral are reflected as a component of investments in unaffiliated securities at value on the Statements of Assets and Liabilities and are noted on the Schedules of Investments. Assets provided to a Fund by a counterparty as collateral are not assets of the Fund and are not a component of a Fund’s net asset value.
The value of derivative instruments on the Statements of Assets and Liabilities for DIVO, SWAN, CNBS, and ISWN as of October 31, 2021 is as follows:
DIVO
Statement of Assets and Liabilities - Values of Derivative Instruments as of October 31, 2021
| | Liability Derivatives | | |
Derivatives | | Location | Value | |
Equity Contracts - Options | | Options Written, at Value | $ | 173,350 | |
The effect of Derivative Instruments on the Statement of Operations for the year ended October 31, 2021 is as follows:
Amount of Realized Gain on
Derivatives Recognized in Income | | | | Change in Unrealized Appreciation on
Derivatives Recognized in Income |
Derivatives | | Options Written | | Derivatives | | Options Written |
Equity Contracts | | $ | 3,809,145 | | Equity Contracts | | $ | 85,414 |
76
Amplify ETF Trust
Notes to the Financial Statements
October 31, 2021 (Continued)
SWAN
Statement of Assets and Liabilities - Values of Derivative Instruments as of October 31, 2021
| | Asset Derivatives | | |
Derivatives | | Location | | Value | |
Equity Contracts - Options | | Investments, at Value | | $ | 159,689,560 | |
The effect of Derivative Instruments on the Statement of Operations for the year ended October 31, 2021 is as follows:
Amount of Realized Gain on
Derivatives Recognized in Income | | | | Change in Unrealized Appreciation on
Derivatives Recognized in Income |
Derivatives | | Options Purchased | | Derivatives | | Options Purchased |
Equity Contracts | | $ | 82,662,467 | | Equity Contracts | | $ | 64,555,904 |
CNBS
Statement of Assets and Liabilities - Values of Derivative Instruments as of October 31, 2021
| | Liability Derivatives | | |
Derivatives | | Location | | Value | |
Swaps | | Net Unrealized Depreciation on Swaps | | $ | (2,184,214) | |
The effect of Derivative Instruments on the Statement of Operations for the year ended October 31, 2021 is as follows:
Amount of Realized Loss on
Derivatives Recognized in Income | | | | Change in Unrealized Depreciation on
Derivatives Recognized in Income |
Derivatives | | Swaps Executed | | Derivatives | | Swaps Executed |
Swaps | | $ | (13,078,332) | | Swaps | | $ | (2,184,214) |
ISWN
Statement of Assets and Liabilities - Values of Derivative Instruments as of October 31, 2021
| | Asset Derivatives | | |
Derivatives | | Location | | Value | |
Equity Contracts - Options | | Investments, at Value | | $ | 5,507,190 | |
The effect of Derivative Instruments on the Statement of Operations for the period ended October 31, 2021 is as follows:
Amount of Realized Gain on
Derivatives Recognized in Income | | | | Change in Unrealized Appreciation on
Derivatives Recognized in Income |
Derivatives | | Options Purchased | | Derivatives | | Options Purchased |
Equity Contracts | | $ | 976,595 | | Equity Contracts | | $ | 394,519 |
The average monthly value of options written in DIVO during the year ended October 31, 2021 was $(415,284). The average monthly value of options purchased in SWAN during the year ended October 31, 2021 was $129,363,778. The average monthly notional amount of swaps executed in CNBS during the year ended October 31, 2021 was $18,170,542. The average monthly value of options purchased in ISWN during the period ended October 31, 2021 was $5,009,847.
77
Amplify ETF Trust
Notes to the Financial Statements
October 31, 2021 (Continued)
OFFSETTING ASSETS AND LIABILITIES
DIVO and CNBS are subject to various Master Netting Arrangements, which govern the terms of certain transactions with select counterparties. The Master Netting Arrangements allow the Funds to close out and net their total exposure to a counterparty in the event of a default with respect to all the transactions governed under a single agreement with a counterparty. The Master Netting Arrangements also specify collateral posting arrangements at pre-arranged exposure levels. Under the Master Netting Arrangements, collateral is routinely transferred if the total net exposure to certain transactions (net of existing collateral already in place) governed under the relevant Master Netting Arrangement with a counterparty in a given account exceeds a specified threshold depending on the counterparty and type of Master Netting Arrangement.
The effect of Derivative Instruments on the Statement of Operations for the year ended October 31, 2021 is as follows:
Liabilities | | | | | | | | Gross Amounts not offset in
the Statement of Assets and
Liabilities | | |
Description/Counterparty | | Gross
Amounts of
Recognized
Liabilities | | Gross
Amounts
Offset in the
Statement of
Assets and
Liabilities | | Net Amounts
Presented in
the Statement
of Assets and
Liabilities | | Financial
Instruments | | Collateral
Pledged | | Net Amount |
DIVO | | | | | | | | | | | | | | | | | | |
Options Written | | | | | | | | | | | | | | | | | | |
Susquehanna Financial Group | | $ | 173,350 | | $ | — | | $ | 173,350 | | $ | 173,350 | | $ | — | | $ | — |
CNBS | | | | | | | | | | | | |
Swaps Executed | | | | | | | | | | | | | | | | | | |
Cowen Financial Products, LLC | | $ | 2,184,214 | | $ | — | | $ | 2,184,214 | | $ | — | | $ | 2,184,214 | | $ | — |
In some instances, the collateral amounts disclosed in the tables were adjusted due to the requirement to limit the collateral amounts to avoid the effect of overcollateralization. Actual collateral received/pledged may be more than the amounts disclosed herein.
SHARE VALUATION
The NAV per share of the Funds is calculated by dividing the sum of the value of the securities held by the Funds, plus cash and other assets, minus all liabilities (including estimated accrued expenses) by the total number of shares outstanding for each Fund, rounded to the nearest cent. The Funds’ shares will not be priced on the days on which the NYSE is closed for trading. The offering and redemption price per share for the Funds is equal to the Funds’ NAV.
USE OF ESTIMATES
The preparation of financial statements in conformity with U.S. GAAP requires management to make estimates and assumptions that affect the reported assets and liabilities and disclosure of contingent assets and liabilities at the date of the financial statements, as well as the reported amounts of revenues and expenses during the period. Actual results could differ from those estimates.
FOREIGN CURRENCY TRANSLATION
The books and records of the Funds are maintained in U.S. dollars. Investment securities and other assets and liabilities denominated in a foreign currency are translated into U.S. dollars on the date of valuation. Purchases and sales of investment securities, income and expenses are translated into U.S. dollars at the relevant rates of exchange prevailing on the respective dates of such transactions. The Funds do not isolate that portion of realized or unrealized gains and losses resulting from changes in the foreign exchange rates on investments and currency gains or losses realized between the trade and settlement dates on securities transactions from fluctuations arising from changes in the market prices of the securities. These gains and losses are included in net realized and unrealized gains
78
Amplify ETF Trust
Notes to the Financial Statements
October 31, 2021 (Continued)
(loss) on investments on the Statements of Operations. Net realized and unrealized gains and losses on foreign currency transactions represent net foreign exchange gains or losses from foreign currency exchange contracts, disposition of foreign currencies, currency gains or losses realized between trade and settlement dates on foreign currency transactions and the difference between the amount of the investment income and foreign withholding taxes recorded on the Funds’ books and the U.S. dollar equivalent amounts actually received or paid.
SECURITY TRANSACTIONS AND INVESTMENT INCOME
Security transactions are accounted for on trade date. Costs used in determining realized gains and losses on the sale of investment securities are based on specific identification. Dividend income is recorded on the ex-dividend date. Interest income is recognized on the accrual basis. Withholding taxes on foreign dividends have been provided for in accordance with the Funds’ understanding of the applicable country’s tax rules and rates. Discounts and premiums on securities purchased are accreted and amortized over the lives of the respective securities using the effective interest method.
Paid-in-kind interest income received in the form of securities in-lieu of cash are recorded at the fair value of the securities received.
Distributions received from the Fund’s investments in closed-end funds (“CEFs”) are recorded as ordinary income, net realized capital gain or return of capital based on information reported by the CEFs and management’s estimates of such amounts based on historical information. These estimates are adjusted with the tax returns after the actual source of distributions has been disclosed by the CEFs and may differ from the estimated amounts.
DIVIDENDS AND DISTRIBUTIONS TO SHAREHOLDERS
Dividends from net investment income and net realized capital gains, if any, will be declared and paid at least annually by the Funds. All distributions are recorded on the ex-dividend date.
The amount and character of income and capital gain distributions to be paid, if any, are determined in accordance with income tax regulations, which may differ from U.S. GAAP. As a result, net investment income (loss) and net realized gain (loss) on investments and foreign currency for a reporting period may differ significantly from distributions during such period. These book/tax differences may be temporary or permanent. To the extent these differences are permanent in nature, they are charged or credited to distributable earnings/ (accumulated deficit) and paid-in capital, as appropriate, in the period that the differences arise.
GUARANTEES AND INDEMNIFICATIONS
In the normal course of business, the Funds enter into contracts with service providers that contain general indemnification clauses. The Funds’ maximum exposure under these arrangements is unknown, as this would involve future claims that may be made against the Funds that have not yet occurred. However, based on experience, the Funds expect risk of loss to be remote.
ORGANIZATIONAL AND OFFERING COSTS
All organizational costs incurred to establish the Funds were paid by the Adviser and are not subject to reimbursement.
3. AGREEMENTS
The Adviser serves as investment adviser to the Funds. Pursuant to an Investment Management Agreement (the “Management Agreement”) between the Trust, on behalf of the Funds, and the Adviser, the Adviser provides investment advice to the Funds and oversees the day-to-day operations of the Funds, subject to the direction and control of the Board and the officers of the Trust.
79
Amplify ETF Trust
Notes to the Financial Statements
October 31, 2021 (Continued)
Under the Management Agreement, the Funds will pay the following investment advisory fees to the Adviser as compensation for the services rendered, facilities furnished, and expenses paid by it (with the exception of CNBS), including the cost of transfer agency, custody, fund administration, legal, audit and other service and license fees, but excluding interest, taxes, brokerage commissions, and other expenses connected with the execution of portfolio transactions, distribution and service fees payable pursuant to a Rule 12b-1 Plan, if any, and extraordinary expenses.
Fund | | Annual Rate of
Average Daily
Net Assets |
YYY | | 0.50% |
IBUY | | 0.65% |
DIVO | | 0.55% |
BLOK | | 0.70% |
BATT | | 0.59% |
SWAN | | 0.49% |
XBUY | | 0.69% |
CNBS | | 0.65% |
JGLD | | 0.49% |
ISWN | | 0.49% |
DTOX | | 0.59% |
MVPS | | 0.49% |
BIDS | | 0.59% |
For the period November 1, 2020 to February 28, 2021, DIVO and BLOK were obligated to pay the Adviser 0.95% and 0.90%, respectively at an annual rate of average daily net assets. Effective March 1, 2021, DIVO and BLOK were obligated to pay the Adviser 0.55% and 0.70%, respectively at an annual rate of average daily net assets.
Pursuant to a contractual agreement between the Trust, on behalf of DIVO and BLOK, management fees paid to the Adviser were reduced by 0.46% and 0.20%, respectively from November 1, 2020 to February 28, 2021. This contractual agreement expired on March 1, 2021. For the period ended October 31, 2021, the Adviser’s management fee was reduced by $273,759 and $294,974 in DIVO and BLOK, respectively. The Adviser is not eligible to recoup these amounts.
Pursuant to a contractual agreement between the Trust on behalf of CNBS, the Adviser has agreed to waive or reduce its fees to assume other expenses of CNBS, if necessary, in amounts that limit CNBS’ total operating expenses (exclusive of any Rule 12b-1 fees, taxes, interest, brokerage fees, acquired fund fees and expenses, expenses incurred in connection with any merger, reorganization, or proxy solicitation, litigation, and other extraordinary expenses) to not more than 0.75% of the average daily net assets of CNBS. For the period ended October 31, 2021, the Adviser’s management fee was reduced by $211,704 and the Advisor paid $15,679 of fund expenses. This contractual agreement will continue until March 1, 2022. The Adviser is entitled to recoup any fees that it waived and/or fund expenses that it paid for a period of three years following such fee waivers and/or expense payments per the Expense Reimbursement and Fee Waiver Agreement as outlined in the schedule below:
Recoupment Expiration | | Amount of
Recoupment |
October 31, 2022 | | $ | 5,512 |
October 31, 2023 | | $ | 164,282 |
October 31, 2024 | | $ | 227,383 |
80
Amplify ETF Trust
Notes to the Financial Statements
October 31, 2021 (Continued)
The Adviser has overall responsibility for overseeing the investment of the Funds’ assets, managing the Funds’ business affairs and providing certain clerical, bookkeeping and other administrative services for the Trust. Penserra Capital Management, LLC (“Penserra”) serves as the Sub-Adviser to YYY, IBUY, XBUY, CNBS, DTOX, and BIDS. Toroso Investments, LLC (“Toroso”) serves as the Sub-Adviser to BLOK, BATT, JGLD, and MVPS. Penserra and Capital Wealth Planning, LLC (“CWP”) serve as the Sub-Advisers to DIVO. ARGI Investment Services, LLC (“ARGI”) and Toroso serve as the Sub-Advisers to SWAN and ISWN (Penserra, together with CWP, Toroso, and ARGI the “Sub-Advisers,” and each, a “Sub-Adviser”). Each Sub-Adviser has responsibility for selecting and continuously monitoring the Fund’s investments. Sub-Advisory fees earned by Penserra, CWP, Toroso, and ARGI are paid by the Adviser.
For the year ended October 31, 2021, the Funds paid Penserra Securities, LLC, an affiliate of Penserra, $72,375 for brokerage commissions. U.S. Bancorp Fund Services, LLC (“Fund Services” or “Administrator”), doing business as U.S. Bank Global Fund Services, acts as the Funds’ Administrator and, in that capacity, performs various administrative and accounting services for the Funds. The Administrator prepares various federal and state regulatory filings, reports and returns for the Funds, including regulatory compliance monitoring and financial reporting; prepares reports and materials to be supplied to the Board; monitors the activities of the Funds’ custodian, transfer agent and accountant. Fund Services also serves as the transfer agent and fund accountant to the Funds. U.S. Bank N.A. (“USB”), an affiliate of Fund Services, serves as the Funds’ custodian and securities lending agent with the exception of CNBS. Cowen Execution Service, LLC (“Cowen”) serves as the custodian and securities lending agent (together, USB and Cowen are the “Securities Lending Agents”) for CNBS. For the period ended October 31, 2021, CNBS paid Cowen and Company, LLC, an affiliate of Cowen, $130,190 for brokerage commissions.
The Distributor acts as the Funds’ principal underwriter in a continuous public offering of the Funds’ shares.
Certain officers and Trustees of the Trust are also officers or employees of the Adviser or its affiliates. For their services, the Chief Compliance Officer and the Principal Financial Officer are entitled to receive compensation via reimbursement to the Adviser from CNBS pursuant to their fee arrangements with CNBS.
4. SECURITIES LENDING
The Funds may lend up to 33 1/3% of the value of the securities in their portfolios to brokers, dealers and financial institutions (but not individuals) under terms of participation in a securities lending programs administered by the Securities Lending Agents. The securities lending agreements require that loans are collateralized at all times in an amount equal to at least 102% of the value of any domestic loaned securities at the time of the loan, plus accrued interest. The use of loans of foreign securities, which are denominated and payable in U.S. dollars, shall be collateralized in an amount equal to 105% of the value of any loaned securities at the time of the loan plus accrued interest.
The Funds receive compensation in the form of fees and earn interest on the non-cash and cash collateral. Due to timing issues of when a security is recalled from loan, the financial statements may differ in presentation. The amount of fees depends on a number of factors including the type of security and length of the loan. The Funds continue to receive interest payments or dividends on the securities loaned during the borrowing period. Gain or loss in the value of securities loaned that may occur during the term of the loan will be for the account of the Funds. The Funds have the right under the terms of the securities lending agreements to recall the securities from the borrower on demand.
As of October 31, 2021, YYY, IBUY, BLOK, BATT, XBUY, and CNBS had loaned securities and received cash collateral for the loans. The cash collateral is invested by the Securities Lending Agents in accordance with approved investment guidelines. Those guidelines require the cash collateral to be invested in readily marketable, high quality, short-term obligations; however, such investments are subject to risk of payment delays or default on the part of the issuer or counterparty or otherwise may not generate sufficient interest to support the costs associated with securities lending. The Funds could also experience delays in recovering its securities and possible loss of income or value if the borrower fails to return the borrowed securities, although the Funds are indemnified from this risk by contract with the Securities Lending Agents.
81
Amplify ETF Trust
Notes to the Financial Statements
October 31, 2021 (Continued)
As of October 31, 2021, the values of the securities on loan and payable for collateral due to brokers were as follows:
Fund | | Value of
Securities on
Loan | | Payable for
Collateral
Received |
YYY | | $ | 16,328,804 | | $ | 17,004,950 | (a) |
IBUY | | $ | 98,390,297 | | $ | 101,273,216 | (a) |
DIVO | | $ | — | | $ | — | |
BLOK | | $ | 229,855,550 | | $ | 213,507,916 | (a) |
BATT | | $ | 27,183,380 | | $ | 27,769,985 | (a) |
SWAN | | $ | — | | $ | — | |
XBUY | | $ | 907,102 | | $ | 959,654 | (a) |
CNBS | | $ | 3,255,082 | | $ | 3,380,082 | (b) |
JGLD | | $ | — | | $ | — | |
ISWN | | $ | — | | $ | — | |
DTOX | | $ | — | | $ | — | |
MVPS | | $ | — | | $ | — | |
BIDS | | $ | — | | $ | — | |
The interest income earned by the Funds on investments of cash collateral received from borrowers for the securities loaned to them (“Securities Lending Income”) is reflected in the Funds’ Statements of Operations. Fees and interest income earned on collateral investments and recognized by the Funds during the year ended October 31, 2021, were as follows:
Fund | | Fees and Interest
Earned |
YYY | | $ | 245,660 |
IBUY | | $ | 730,530 |
DIVO | | $ | — |
BLOK | | $ | 6,496,427 |
BATT | | $ | 703,054 |
SWAN | | $ | — |
XBUY | | $ | 78,018 |
CNBS | | $ | 457,134 |
JGLD | | $ | — |
ISWN | | $ | — |
DTOX | | $ | — |
MVPS | | $ | — |
BIDS | | $ | — |
82
Amplify ETF Trust
Notes to the Financial Statements
October 31, 2021 (Continued)
Fees and interest income earned on collateral investments and recognized by the Funds under the securities lending program is reflected in the Funds’ Statements of Operations as securities lending income.
Due to the absence of a master netting agreement related to the Funds’ participation in securities lending, no additional offsetting disclosures have been made on behalf of the Funds for the total borrowings listed above.
5. INVESTMENT TRANSACTIONS
For the year/period ended October 31, 2021, the purchases and sales of investments in securities, excluding in-kind transactions and short-term securities were:
Fund | | Purchases | | Sales |
YYY | | $ | 341,016,892 | | $ | 327,539,598 |
IBUY | | | 807,554,398 | | | 799,616,581 |
DIVO | | | 331,434,666 | | | 378,716,541 |
BLOK | | | 750,573,687 | | | 374,745,161 |
BATT | | | 142,333,312 | | | 70,523,920 |
SWAN | | | 1,661,585,785 | | | 1,477,829,074 |
XBUY | | | 14,122,198 | | | 13,840,553 |
CNBS | | | 99,759,934 | | | 133,378,566 |
JGLD | | | 750,918 | | | 720,539 |
ISWN | | | 68,594,258 | | | 28,389,661 |
DTOX | | | — | | | — |
MVPS | | | 2,520,540 | | | 1,088,607 |
BIDS | | | 6,945 | | | 9,475 |
For the year/period ended October 31, 2021, in-kind transactions associated with creations and redemptions were:
Fund | | Purchases | | Sales |
YYY | | $ | 238,939,833 | | $ | 80,041,551 |
IBUY | | | 759,887,886 | | | 1,114,416,913 |
DIVO | | | 538,709,761 | | | 2,994,044 |
BLOK | | | 1,018,610,925 | | | 484,833,754 |
BATT | | | 176,366,679 | | | 62,222,561 |
SWAN | | | 1,491,335 | | | — |
XBUY | | | 17,163,671 | | | 16,659,273 |
CNBS | | | 167,818,394 | | | 27,616,879 |
JGLD | | | 3,189,620 | | | 661,138 |
ISWN | | | — | | | — |
DTOX | | | 1,274,729 | | | — |
MVPS | | | 9,573,258 | | | 625,205 |
BIDS | | | 630,593 | | | — |
83
Amplify ETF Trust
Notes to the Financial Statements
October 31, 2021 (Continued)
There were no purchases or sales of long-term U.S. Government securities by the Funds, except SWAN and ISWN. Included in the amounts for SWAN were $1,586,681,018 of purchases and $1,420,485,846 of sales of U.S. Government Securities during the year ended October 31, 2021. Included in the amounts for ISWN were $66,710,092 of purchases and $28,389,661 of sales of U.S. Government Securities during the period ended October 31, 2021.
During the year ended October 31, 2021, MVPS had a trade error due to incorrect trade instructions. This resulted in a loss to the Fund of $922, which was reimbursed to the Fund by an affiliate.
6. FEDERAL INCOME TAXES
As of and during the year ended October 31, 2021, the Funds did not have any tax positions that did not meet the “more-likely-than-not” threshold of being sustained by the applicable tax authority. As of and during the year/period ended October 31, 2021, the Funds did not have liabilities for any unrecognized tax benefits. The Funds recognize interest and penalties, if any, related to unrecognized tax benefits on uncertain tax positions as income tax expense in the Statements of Operations. During the year ended October 31, 2021, the Funds did not incur any interest or penalties.
The tax composition of distributions paid during the year ended October 31, 2021 for the Funds was as follows:
| | Ordinary Income | | Capital Gains | | Return of Capital |
YYY | | $ | 19,232,860 | | $ | — | | $ | 14,547,140 |
IBUY | | | 7,766,866 | | | — | | | — |
DIVO | | | 19,139,503 | | | 1,252,990 | | | 1,776,088 |
BLOK | | | 6,448,385 | | | — | | | — |
BATT | | | 87,235 | | | — | | | — |
SWAN | | | 8,793,909 | | | 2,772,330 | | | — |
XBUY | | | — | | | — | | | — |
CNBS | | | 151,546 | | | — | | | — |
JGLD | | | — | | | — | | | — |
ISWN | | | 80,874 | | | — | | | — |
DTOX | | | — | | | — | | | — |
MVPS | | | — | | | — | | | — |
BIDS | | | — | | | — | | | — |
The tax composition of distributions paid during the year/period ended October 31, 2020 for the Funds was as follows:
| | Ordinary Income | | Capital Gains | | Return of Capital |
YYY | | $ | 14,936,155 | | $ | — | | $ | 8,398,167 |
IBUY | | | 732,203 | | | — | | | — |
DIVO | | | 597,840 | | | 644,332 | | | 1,835,660 |
BLOK | | | 2,023,741 | | | — | | | — |
BATT | | | 158,755 | | | — | | | — |
SWAN | | | 4,804,059 | | | — | | | — |
XBUY | | | 3,649 | | | — | | | — |
CNBS | | | 27,000 | | | — | | | — |
84
Amplify ETF Trust
Notes to the Financial Statements
October 31, 2021 (Continued)
The Funds intend to meet the requirements of Subchapter M of the Internal Revenue Code applicable to regulated investment companies and will distribute substantially all taxable income and capital gains to shareholders. Therefore, no federal income or excise tax provision has been made.
The cost basis of investments and distributable earnings (accumulated deficit) for federal income tax purposes as of October 31, 2021 was as follows:
| | YYY | | IBUY | | DIVO | | BLOK | | BATT |
| | | Investments | | Investments | | Investments | | Investments | | Investments |
Tax cost of investments | | $ | 452,911,670 | | | $ | 999,169,075 | | | $ | 597,529,313 | | | $ | 1,596,943,658 | | | $ | 238,820,821 | |
Gross tax unrealized appreciation | | | 22,480,438 | | | | 161,769,590 | | | | 73,771,942 | | | | 290,133,116 | | | | 41,755,574 | |
Gross tax unrealized depreciation | | | (10,421,126 | ) | | | (162,541,930 | ) | | | (6,521,866 | ) | | | (186,544,349 | ) | | | (19,289,655 | ) |
Net tax unrealized appreciation (depreciation) | | | 12,059,312 | | | | (772,340 | ) | | | 67,250,076 | | | | 103,588,767 | | | | 22,465,919 | |
Undistributed ordinary income | | | — | | | | — | | | | — | | | | 164,093,930 | | | | 5,182,897 | |
Undistributed long-term capital gain | | | — | | | | — | | | | — | | | | — | | | | — | |
Total accumulated gain | | | — | | | | — | | | | — | | | | 164,093,930 | | | | 5,182,897 | |
Other accumulated gain (loss) | | | (17,039,464 | ) | | | (44,479,147 | ) | | | 50,461 | | | | (73,263,370 | ) | | | (7,836,746 | ) |
Distributable earnings/(accumulated deficit) | | $ | (4,980,152 | ) | | $ | (45,251,487 | ) | | $ | 67,300,537 | | | $ | 194,419,327 | | | $ | 19,812,070 | |
| | SWAN | | XBUY | | CNBS | | JGLD | | ISWN |
| | | Investments | | Investments | | Investments | | Investments | | Investments |
Tax cost of investments | | $ | 837,817,797 | | | $ | 14,328,550 | | | $ | 139,796,195 | | | $ | 2,642,048 | | | $ | 42,744,288 | |
Gross tax unrealized appreciation | | | 78,354,189 | | | | 977,180 | | | | 3,778,407 | | | | 85,365 | | | | 1,083,348 | |
Gross tax unrealized depreciation | | | (6,279,914 | ) | | | (3,472,451 | ) | | | (57,886,198 | ) | | | (384,690 | ) | | | (547,738 | ) |
Net tax unrealized appreciation (depreciation) | | | 72,074,275 | | | | (2,495,271 | ) | | | (54,107,791 | ) | | | (299,325 | ) | | | 535,610 | |
Undistributed ordinary income | | | 17,819,200 | | | | — | | | | — | | | | 13,393 | | | | 181,279 | |
Undistributed long-term capital gain | | | 26,156,250 | | | | — | | | | — | | | | — | | | | — | |
Total accumulated gain | | | 43,975,450 | | | | — | | | | — | | | | 13,393 | | | | 181,279 | |
Other accumulated gain (loss) | | | — | | | | (736,959 | ) | | | (1,886,961 | ) | | | (17,430 | ) | | | — | |
Distributable earnings/(accumulated deficit) | | $ | 116,049,725 | | | $ | (3,232,230 | ) | | $ | (55,994,752 | ) | | $ | (303,362 | ) | | $ | 716,889 | |
| | DTOX | | MVPS | | BIDS |
| | | Investments | | Investments | | Investments |
Tax cost of investments | | $ | 1,274,827 | | | $ | 10,504,494 | | | $ | 630,849 | |
Gross tax unrealized appreciation | | | 104,872 | | | | 1,187,702 | | | | 85,423 | |
Gross tax unrealized depreciation | | | (148,338 | ) | | | (373,938 | ) | | | (49,771 | ) |
Net tax unrealized appreciation (depreciation) | | | (43,466 | ) | | | 813,764 | | | | 35,652 | |
Undistributed ordinary income | | | — | | | | — | | | | 2,097 | |
Undistributed long-term capital gain | | | — | | | | 138 | | | | — | |
Total accumulated gain | | | — | | | | 138 | | | | 2,097 | |
Other accumulated gain (loss) | | | (1,664 | ) | | | (3,595 | ) | | | (9 | ) |
Distributable earnings/(accumulated deficit) | | $ | (45,130 | ) | | $ | 810,307 | | | $ | 37,740 | |
85
Amplify ETF Trust
Notes to the Financial Statements
October 31, 2021 (Continued)
The difference between book and tax-basis cost is attributable to the deferral on wash sales and passive foreign investment companies.
At October 31, 2021, the Funds deferred, on a tax basis, late year ordinary losses of:
| | Late Year
Ordinary Loss
Deferral |
YYY | | $ | — |
IBUY | | | 5,578,170 |
DIVO | | | — |
BLOK | | | — |
BATT | | | — |
SWAN | | | — |
XBUY | | | 49,674 |
CNBS | | | — |
JGLD | | | — |
ISWN | | | — |
DTOX | | | 1,664 |
MVPS | | | 3,610 |
BIDS | | | — |
At October 31, 2021, the Funds had the following capital loss carryforwards:
| | Short-Term | | Long-Term | | Expires |
YYY | | $ | 1,854,161 | | $ | 15,185,303 | | Unlimited |
IBUY | | | 10,443,551 | | | 28,456,548 | | Unlimited |
DIVO | | | — | | | — | | — |
BLOK | | | 68,306,024 | | | 4,947,905 | | Unlimited |
BATT | | | 5,904,508 | | | 1,928,376 | | Unlimited |
SWAN | | | — | | | — | | — |
XBUY | | | 629,249 | | | 58,008 | | Unlimited |
CNBS | | | 1,887,162 | | | — | | Unlimited |
JGLD | | | 17,429 | | | — | | Unlimited |
ISWN | | | — | | | — | | — |
DTOX | | | — | | | — | | — |
MVPS | | | — | | | — | | — |
BIDS | | | — | | | — | | — |
86
Amplify ETF Trust
Notes to the Financial Statements
October 31, 2021 (Continued)
Additionally, U.S. GAAP require that certain components of net assets relating to permanent differences be reclassified between financial and tax reporting. These reclassifications have no effect on net assets or NAV per share. The permanent differences primarily relate to equalization, net operating losses, return of capital distributions, and redemption-in-kind transactions. For the year ended October 31, 2021, the following table shows the reclassifications made:
| | Distributable
Earnings
(Accumulated
Deficit) | | Paid-In Capital |
YYY | | $ | (7,892,409 | ) | | $ | 7,892,409 | |
IBUY | | | (460,488,340 | ) | | | 460,488,340 | |
DIVO | | | (834,206 | ) | | | 834,206 | |
BLOK | | | (161,786,589 | ) | | | 161,786,589 | |
BATT | | | (15,259,845 | ) | | | 15,259,845 | |
SWAN | | | (4,469,100 | ) | | | 4,469,100 | |
XBUY | | | (4,270,248 | ) | | | 4,270,248 | |
CNBS | | | 880,690 | | | | (880,690 | ) |
JGLD | | | (100,886 | ) | | | 100,886 | |
ISWN | | | — | | | | — | |
DTOX | | | — | | | | — | |
MVPS | | | (74,109 | ) | | | 74,109 | |
BIDS | | | — | | | | — | |
During the year ended October 31, 2021, the Funds realized the following net capital gains (losses) resulting from in-kind redemptions, in which shareholders exchanged Fund shares for securities held by the Funds rather than for cash. Because such gains (losses) are not taxable to the Funds, and gains are not distributed to shareholders, they have been reclassified from total distributable earnings (accumulated deficit) to paid-in capital.
| | | | |
YYY | | $ | 9,496,729 | |
IBUY | | | 460,543,566 | |
DIVO | | | 834,206 | |
BLOK | | | 161,786,589 | |
BATT | | | 15,259,845 | |
SWAN | | | — | |
XBUY | | | 4,311,166 | |
CNBS | | | 11,369,675 | |
JGLD | | | 100,886 | |
ISWN | | | — | |
DTOX | | | — | |
MVPS | | | 74,106 | |
BIDS | | | — | |
87
Amplify ETF Trust
Notes to the Financial Statements
October 31, 2021 (Continued)
7. PRINCIPAL RISKS
BLOCKCHAIN INVESTMENTS RISK (BLOK only)
An investment in companies actively engaged in blockchain technology may be subject to the following risks:
The technology is new and many of its uses may be untested. The mechanics of using distributed ledger technology to transact in other types of assets, such as securities or derivatives, is less clear. There is no assurance that widespread adoption will occur. A lack of expansion in the usage of blockchain technology could adversely affect an investment in the Fund.
Theft, loss or destruction. Transacting on a blockchain depends in part specifically on the use of cryptographic keys that are required to access a user’s account (or “wallet”). The theft, loss or destruction of these keys impairs the value of ownership claims users have over the relevant assets being represented by the ledger (whether “smart contracts,” securities, currency or other digital assets). The theft, loss or destruction of private or public keys needed to transact on a blockchain could also adversely affect a company’s business or operations if it were dependent on the ledger. Competing platforms and technologies. The development and acceptance of competing platforms or technologies may cause consumers or investors to use an alternative to blockchains.
Cyber security incidents. Cyber security incidents may compromise an issuer, its operations or its business. Cyber security incidents may also specifically target user’s transaction history, digital assets, or identity, thereby leading to privacy concerns. In addition, certain features of blockchain technology, such as decentralization, open source protocol, and reliance on peer-to-peer connectivity, may increase the risk of fraud or cyber-attack by potentially reducing the likelihood of a coordinated response.
Developmental risk. Blockchain technology may never develop optimized transactional processes that lead to realized economic returns for any company in which the Fund invests. Companies that are developing applications of blockchain technology applications may not in fact do so or may not be able to capitalize on those blockchain technologies. The development of new or competing platforms may cause consumers and investors to use alternatives to blockchains.
Intellectual property claims. A proliferation of recent startups attempting to apply blockchain technology in different contexts means the possibility of conflicting intellectual property claims could be a risk to an issuer, its operations or its business. This could also pose a risk to blockchain platforms that permit transactions in digital securities. Regardless of the merit of any intellectual property or other legal action, any threatened action that reduces confidence in the viability of blockchain may adversely affect an investment in the Fund.
Lack of liquid markets, and possible manipulation of blockchain-based assets. Digital assets that are represented and trade on a blockchain may not necessarily benefit from viable trading markets. Stock exchanges have listing requirements and vet issuers, and perhaps users. These conditions may not necessarily be replicated on a blockchain, depending on the platform’s controls and other policies. The more lenient a blockchain is about vetting issuers of digital assets or users that transact on the platform, the higher the potential risk for fraud or the manipulation of digital assets. These factors may decrease liquidity or volume or increase volatility of digital securities or other assets trading on a blockchain.
Lack of regulation. Digital commodities and their associated platforms are largely unregulated, and the regulatory environment is rapidly evolving. Because blockchain works by having every transaction build on every other transaction, participants can self-police any corruption, which can mitigate the need to depend on the current level of legal or government safeguards to monitor and control the flow of business transactions. As a result, companies engaged in such blockchain activities may be exposed to adverse regulatory action, fraudulent activity or even failure. Third party product defects or vulnerabilities. Where blockchain systems are built using third party products, those products may contain technical defects or vulnerabilities beyond a company’s control. Open-source technologies that are used to build a blockchain application, may also introduce defects and vulnerabilities.
88
Amplify ETF Trust
Notes to the Financial Statements
October 31, 2021 (Continued)
Reliance on the Internet. Blockchain functionality relies on the Internet. A significant disruption of Internet connectivity affecting large numbers of users or geographic areas could impede the functionality of blockchain technologies and adversely affect the Fund. In addition, certain features of blockchain technology, such as decentralization, open source protocol, and reliance on peer-to-peer connectivity, may increase the risk of fraud or cyber-attack by potentially reducing the likelihood of a coordinated response.
BIOTECHNOLOGY COMPANIES RISK (CNBS only)
A biotechnology company’s valuation can often be based largely on the potential or actual performance of a limited number of products and can accordingly be greatly affected if one of its products proves, among other things, unsafe, ineffective or unprofitable. Biotechnology companies are subject to regulation by, and the restrictions of, the FDA, the U.S. Environmental Protection Agency, state and local governments, and non-U.S. regulatory authorities.
CANNABIS INDUSTRY RISK (CNBS only)
Companies involved in the cannabis industry face competition, may have limited access to the services of banks, may have substantial burdens on company resources due to litigation, complaints or enforcement actions, and are heavily dependent on receiving necessary permits and authorizations to engage in medical cannabis research or to otherwise cultivate, possess or distribute cannabis. Since the use of cannabis is illegal under U.S. federal law, federally regulated banking institutions may be unwilling to make financial services available to growers and sellers of cannabis.
CONCENTRATION RISK (YYY, IBUY and XBUY only)
To the extent that the Index concentrates in the securities of issuers in a particular industry or sector, the Fund will also concentrate its investments to approximately the same extent. The Fund may be susceptible to loss due to adverse occurrences to the extent that the Fund’s investments are concentrated in a particular issuer or issuers, region, market, industry, group of industries, sector or asset class.
COUNTERPARY RISK (CNBS only)
The Fund may invest in financial instruments involving counterparties that attempt to gain exposure to a particular securities without actually purchasing those securities. The Fund’s use of such financial instruments, including swap arrangements, involves risks that are different from those associated with ordinary portfolio securities transactions. For example, if a swap agreement counterparty defaults on its payment obligations to the Fund, this default will cause the value of your investment in the Fund to decrease.
COVERED CALL RISK (DIVO only)
Covered call risk is the risk that the Fund will forgo, during the option’s life, the opportunity to profit from increases in the market value of the security covering the call option above the sum of the premium and the strike price of the call, but has retained the risk of loss should the price of the underlying security decline. In addition, as the Fund writes covered calls over more of its portfolio, its ability to benefit from capital appreciation becomes more limited. The writer of an option has no control over the time when it may be required to fulfill its obligation as a writer of the option. Once an option writer has received an exercise notice, it cannot effect a closing purchase transaction in order to terminate its obligation under the option and must deliver the underlying security at the exercise price.
89
Amplify ETF Trust
Notes to the Financial Statements
October 31, 2021 (Continued)
DIGITAL ASSET RISK (BIDS only)
While the Fund will not directly invest in digital assets, certain of the Fund’s investments may be subject to the risks associated with investing in digital assets. The technologies underpinning digital assets are highly disruptive, and the future successes of such technologies are highly uncertain. Further, because the development of digital asset technologies is in a nascent stage, digital asset companies may be rapidly eclipsed by newer and more disruptive technological advances that render current digital assets or technologies outdated or undesirable. Further, digital asset companies may be subject to the risks posed by conflicting intellectual property claims among digital assets, which may reduce confidence in the viability of a digital asset. Because of the uncertainty of digital asset technologies, the values of the securities of these companies may be highly volatile. Digital assets may be traded on exchanges that are unregulated and often located outside the United States. Digital asset exchanges may stop operating or permanently shut down due to fraud, theft, disruption, technical glitches, hackers, malware or security compromises or failures in the underlying blockchain, ledger or software. Digital Assets are also at risk of possible manipulation and vulnerabilities surrounding the use of third-party products, which may be subject to technical defects beyond a company’s control. Further, digital assets are not maintained in traditional custodial arrangements, and instead are typically held in “wallets,” which are public digital addresses accessible only by “private keys.” If a private key is stolen, lost, damaged or destroyed, the digital assets attributable to such private key may be irreversibly lost without the possibility of recovery. Over their short history, digital assets have experienced tremendous price volatility compared to traditional asset classes and may experience significant illiquidity in stressed market conditions. The values of digital assets should not be expected to be connected or correlated to traditional economic or market forces, and the value of the investments in digital assets could decline rapidly, including to zero, as a digital asset may decline in popularity, acceptance or use, thereby impairing its price.
Many companies often employ the technology surrounding digital assets to optimize their business practices, whether by using the technology within their business or operating business lines involved in the operation of the technology. There are currently relatively few companies for which digital assets represent an attributable and significant revenue stream. Because of this, the financial strength of companies associated with digital assets and the digital assets market may not be a reflection of their actual connection and exposure to digital assets, but rather a result of other business operations.
FINANCIAL COMPANIES RISK
Financial companies, such as retail and commercial banks, insurance companies and financial services companies, are especially subject to the adverse effects of economic recession, currency exchange rates, extensive government regulation, decreases in the availability of capital, volatile interest rates, portfolio concentrations in geographic markets, industries or products (such as commercial and residential real estate loans) and competition from new entrants and blurred distinctions in their fields of business.
FOREIGN INVESTMENT RISK (XBUY only)
Securities issued by Non-U.S. companies present risks beyond those of securities of U.S. issuers. Risks of investing in the securities of foreign companies include: different accounting standards; expropriation, nationalization or other adverse political or economic developments; currency devaluation, blockages or transfer restrictions; changes in foreign currency exchange rates; taxes; restrictions on foreign investments and exchange of securities; and less government supervision and regulation of issuers in foreign countries. Prices of foreign securities also may be more volatile.
FUND OF FUNDS RISK (YYY only)
Because the Fund is a fund of funds, its investment performance largely depends on the investment performance of the Underlying Funds in which it invests. An investment in the Fund is subject to the risks associated with the Underlying Funds that comprise the Index. The Fund will pay indirectly a proportional share of the fees and expenses of the Underlying Funds in which it invests, including their investment advisory and administration fees, in addition to its own fees and expenses. In addition, at times certain segments of the market represented by constituent Underlying Funds may be out of favor and underperform other segments.
90
Amplify ETF Trust
Notes to the Financial Statements
October 31, 2021 (Continued)
GOLD MINING INDUSTRY RISK (JGLD only)
The Fund is sensitive to changes in, and its performance will depend to a greater extent on, the overall condition of the gold mining industry. In times of stable economic growth, traditional equity and debt investments could offer greater appreciation potential and the value of gold and other precious metals may be adversely affected, which could in turn affect the Fund’s returns. The gold and precious metals industry can be significantly affected by competitive pressures, central bank operations, events relating to international political developments, the success of exploration projects, commodity prices, adverse environmental developments and tax and government regulations.
HEALTH CARE COMPANIES RISK (CNBS only)
Health care companies are subject to extensive government regulation and their profitability can be significantly affected by restrictions on government reimbursement for medical expenses, rising costs of medical products and services, pricing pressure (including price discounting), limited product lines, and an increased emphasis on the delivery of healthcare through outpatient services. Health care companies are heavily dependent on obtaining and defending patents, which may be time consuming and costly, and the expiration of patents may also adversely affect the profitability of the companies. Health care companies are also subject to extensive litigation based on product liability and similar claims. In addition, their products can become obsolete due to industry innovation, changes in technologies, or other market developments. Many new products in the health care field require significant research and development and may be subject to regulatory approvals, all of which may be time consuming and costly with no guarantee that any product will come to market.
INFORMATION TECHNOLOGY COMPANIES RISK (IBUY, BLOK, and BATT only)
Information technology companies are generally subject to the following risks: rapidly changing technologies; short product life cycles; fierce competition; aggressive pricing and reduced profit margins; the loss of patent, copyright and trademark protections; cyclical market patterns; evolving industry standards; and frequent new product introductions. Information technology companies may be smaller and less experienced companies, with limited product lines, markets or financial resources and fewer experienced management or marketing personnel. Information technology company stocks, especially those which are internet related, have experienced extreme price and volume fluctuations that are often unrelated to their operating performance.
LEVERAGE RISK (YYY only)
Leverage may result from ordinary borrowings or may be inherent in the structure of certain Underlying Fund investments such as derivatives. If the prices of those investments decrease, or if the cost of borrowing exceeds any increase in the prices of those investments, the NAV of the Underlying Fund’s shares will decrease faster than if the Underlying Fund had not used leverage. To repay borrowings, an Underlying Fund may have to sell investments at a time and at a price that is unfavorable to the Underlying Fund. Interest on borrowings is an expense the Underlying Fund would not otherwise incur. Leverage magnifies the potential for gain and the risk of loss. If an Underlying Fund uses leverage, there can be no assurance that the Underlying Fund’s leverage strategy will be successful.
MARKET EVENTS RISK
Turbulence in the economic, political and financial system has historically resulted, and may continue to result, in an unusually high degree of volatility in the capital markets. Both domestic and foreign capital markets have been experiencing increased volatility and turmoil, with issuers that have exposure to the real estate, mortgage and credit markets particularly affected, and t is uncertain whether or for how long these conditions could continue. Reduced liquidity in equity, credit and fixed-income markets may adversely affect many issuers worldwide. This reduced liquidity may result in less money being available to purchase raw materials, goods and services from emerging markets, which may, in turn, bring down the prices of these economic staples. It may also result in small or emerging market issuers having more difficulty obtaining financing, which may, in turn, cause a decline in their security prices. These events and possible continued market turbulence may have an adverse effect on the Fund.
In addition, local, regional or global events such as war, acts of terrorism, spread of infectious diseases or other public health issues, recessions, or other events could have a significant negative impact on a Fund and its investments. Such events may affect certain geographic regions, countries, sectors and industries more significantly than others. Such events could adversely affect the prices and liquidity of a
91
Amplify ETF Trust
Notes to the Financial Statements
October 31, 2021 (Continued)
Fund’s portfolio securities or other instruments and could result in disruptions in the trading markets. Any of such circumstances could have a materially negative impact on the value of a Fund’s Shares and result in increased market volatility. During any such events, a Fund’s Shares may trade at increased premiums or discounts to their NAV.
Health crises caused by the outbreak of infectious diseases or other public health issues, may exacerbate other pre-existing political, social, economic, market and financial risks. The impact of any such events, could negatively affect the global economy, as well as the economies of individual countries or regions, the financial performance of individual companies, sectors and industries, and the markets in general in significant and unforeseen ways. Any such impact could adversely affect the prices and liquidity of the securities and other instruments in which a Fund invests and negatively impact a Fund’s investment return.
For example, an outbreak of a respiratory disease designated as COVID-19 was first detected in China in December 2019 and subsequently spread internationally. The transmission of COVID-19 and efforts to contain its spread have resulted in international, national and local border closings and other significant travel restrictions and disruptions, significant disruptions to business operations, supply chains and customer activity, event cancellations and restrictions, service cancellations, reductions and other changes, significant challenges in healthcare service preparation and delivery, and quarantines, as well as general concern and uncertainty that has negatively affected the economic environment. These impacts also have caused significant volatility and declines in global financial markets, which have caused losses for investors. The impact of this COVID-19 pandemic may be short term or may last for an extended period of time, and in either case could result in a substantial economic downturn or recession.
In addition, the operations of a Fund, the Adviser and a Fund’s other service providers may be significantly impacted, or even temporarily or permanently halted, as a result of government quarantine measures, voluntary and precautionary restrictions on travel or meetings and other factors related to a public health emergency, including its potential adverse impact on the health of any such entity’s personnel.
MARKET PRICE DISCOUNT FROM/PREMIUM TO NET ASSET VALUE RISK (YYY only)
The shares of the Underlying Funds may trade at a discount or premium to their NAV. This characteristic is a risk separate and distinct from the risk that an Underlying Fund’s NAV could decrease as a result of investment activities. Whether investors, such as the Fund, will realize gains or losses upon the sale of shares will depend not on the Underlying Funds’ NAVs, but entirely upon whether the market price of the Underlying Funds’ shares at the time of sale is above or below an investor’s purchase price for shares.
METALS AND MINING COMPANIES RISK (BATT and JGLD only)
The Fund will invest in securities that are issued by and/or have exposure to, companies primarily involved in the metals and mining industry. Investments in metals and mining companies may be speculative and subject to greater price volatility than investments in other types of companies. The profitability of companies in the metals and mining industry is related to, among other things, worldwide metal prices and extraction and production costs. Worldwide metal prices may fluctuate substantially over short periods of time, and as a result, the Fund’s Share price may be more volatile than other types of investments. In addition, metals and mining companies may be significantly affected by changes in global demand for certain metals, economic developments, energy conservation, the success of exploration projects, changes in exchange rates, interest rates, economic conditions, tax treatment, trade treaties, and government regulation and intervention, and events in the regions that the companies to which the Fund has exposure operate (e.g., expropriation, nationalization, confiscation of assets and property, the imposition of restrictions on foreign investments or repatriation of capital, military coups, social or political unrest, violence and labor unrest). Metals and mining companies may also be subject to the effects of competitive pressures in the metals and mining industry.
OPTIONS RISK (SWAN and ISWN only)
Investing in options, including LEAP Options, and other instruments with option-type elements may increase the volatility and/or transaction expenses of the Fund. An option may expire without value, resulting in a loss of the Fund’s initial investment and may be less liquid and more volatile than an investment in the underlying securities. The Fund’s ability to close out its position as a purchaser of a call option is dependent, in part, upon the liquidity of the options market. There are significant differences between the securities and options markets that could result in an imperfect correlation among these markets, causing a given transaction not to achieve its objectives. The Fund may also purchase over-the-counter call options, which involves risks different from, and possibly greater than, the risks associated
92
Amplify ETF Trust
Notes to the Financial Statements
October 31, 2021 (Continued)
with exchange-listed call options. In some instances, over-the-counter call options may expose the Fund to the risk that a counterparty may be unable to perform according to a contract, and that any deterioration in a counterparty’s creditworthiness could adversely affect the instrument. In addition, the Fund may be exposed to a risk that losses may exceed the amount originally invested.
PHARMACEUTICAL COMPANIES RISK (CNBS only)
Companies in the pharmaceutical industry can be significantly affected by, among other things, government approval of products and services, government regulation and reimbursement rates, product liability claims, patent expirations and protection of intense competition.
ONLINE RETAIL RISK (IBUY and XBUY only)
Companies that operate in the online marketplace, retail and travel segments are subject to fluctuating consumer demand. Unlike traditional brick and mortar retailers, online marketplaces and retailers must assume shipping costs or pass such costs to consumers. Consumer access to price information for the same or similar products may cause companies that operate in the online marketplace, retail and travel segments to reduce profit margins in order to compete. Profit margins in the travel industry are particularly sensitive to seasonal demand, fuel costs and consumer perception of various risks associated with travel to various destinations. Due to the nature of their business models, companies that operate in the online marketplace, retail and travel segments may also be subject to heightened cybersecurity risk, including the risk of theft or damage to vital hardware, software and information systems. The loss or public dissemination of sensitive customer information or other proprietary data may negatively affect the financial performance of such companies to a greater extent than traditional brick and mortar retailers. As a result of such companies being web-based and the fact that they process, store, and transmit large amounts of data, including personal information, for their customers, failure to prevent or mitigate data loss or other security breaches, including breaches of vendors’ technology and systems, could expose companies that operate in the online marketplace, retail and travel segments or their customers to a risk of loss or misuse of such information, adversely affect their operating results, result in litigation or potential liability, and otherwise harm their businesses.
RARE EARTH METAL COMPANIES RISK (BATT only)
Rare earth metals have more specialized uses and are often more difficult to extract. The use of strategic metals in modern technology has increased dramatically over the past years. Consequently, the demand for these metals has strained supply, which has the potential to result in a shortage of such materials which could adversely affect the companies in the Fund’s portfolio. Companies involved in the various activities that are related to the mining, refining and/or manufacturing of rare earth metals tend to be small-, medium- and micro-capitalization companies with volatile share prices, are highly dependent on the price of rare earth metals, which may fluctuate substantially over short periods of time. The value of such companies may be significantly affected by events relating to international, national and local political and economic developments, energy conservation efforts, the success of exploration projects, commodity prices, tax and other government regulations, depletion of resources, and mandated expenditures for safety and pollution control devices. The mining, refining and/or manufacturing of rare earth metals can be capital intensive and, if companies involved in such activities are not managed well, the share prices of such companies could decline even as prices for the underlying rare earth metals are rising. In addition, companies involved in the various activities that are related to the mining, refining and/or manufacturing of rare earth metals may be at risk for environmental damage claims.
8. SUBSEQUENT EVENTS
The Funds have evaluated the need for additional disclosures and/or adjustments resulting from subsequent events through the date the financial statements were issued. The evaluation did not result in any subsequent events that necessitated disclosure and/or adjustment.
93
Amplify ETF Trust
Report of Independent Registered Public Accounting Firm
To the Shareholders and Board of Trustees of Amplify ETF Trust
Opinion on the Financial Statements
We have audited the accompanying statements of assets and liabilities, including the schedules of investments, options written, and total return swaps (as applicable), of Amplify ETF Trust comprising the funds listed below (the “Funds”) as of October 31, 2021, the related statements of operations, the statements of changes in net assets, the related notes, and the financial highlights for each of the periods indicated below (collectively referred to as the “financial statements���). In our opinion, the financial statements present fairly, in all material respects, the financial position of each of the Funds as of October 31, 2021, the results of their operations, the changes in net assets, and the financial highlights for each of the periods indicated below in conformity with accounting principles generally accepted in the United States of America.
Fund Name | Statements of Operations | Statements of Changes in Net Assets | Financial Highlights |
Amplify High Income ETF | For the year ended October 31, 2021 | For the years ended October 31, 2021 and 2020 | For the years ended October 31, 2021 and 2020, the period from January 1, 2019 through October 31, 2019, and the years ended December 31, 2018, 2017, and 2016 |
Amplify Online Retail ETF | For the year ended October 31, 2021 | For the years ended October 31, 2021 and 2020 | For the years ended October 31, 2021, 2020, 2019, 2018, and 2017 |
Amplify CWP Enhanced Dividend Income ETF | For the year ended October 31, 2021 | For the years ended October 31, 2021 and 2020 | For the years ended October 31, 2021, 2020, 2019, and 2018 and for the period from December 13, 2016 (commencement of operations) through October 31, 2017 |
Amplify Transformational Data Sharing ETF | For the year ended October 31, 2021 | For the years ended October 31, 2021 and 2020 | For the years ended October 31, 2021, 2020, and 2019 and for the period from January 16, 2018 (commencement of operations) through October 31, 2018 |
Amplify Lithium & Battery Technology ETF | For the year ended October 31, 2021 | For the years ended October 31, 2021 and 2020 | For the years ended October 31, 2021, 2020, and 2019 and for the period from June 4, 2018 (commencement of operations) through October 31, 2018 |
Amplify BlackSwan Growth & Treasury Core ETF | For the year ended October 31, 2021 | For the years ended October 31, 2021 and 2020 | For the years ended October 31, 2021 and 2020 and for the period of November 5, 2018 (commencement of operations) through October 31, 2019 |
Amplify International Online Retail ETF | For the year ended October 31, 2021 | For the years ended October 31, 2021 and 2020 | For the years ended October 31, 2021 and 2020 and for the period from January 29, 2019 (commencement of operations) through October 31, 2019 |
Amplify Seymour Cannabis ETF | For the year ended October 31, 2021 | For the years ended October 31, 2021 and 2020 | For the years ended October 31, 2021 and 2020 and for the period from July 22, 2019 (commencement of operations) through October 31, 2019 |
Amplify Pure Junior Gold Miners ETF | For the period from November 30, 2020 (commencement of operations) through October 31, 2021 |
Amplify BlackSwan ISWN ETF | For the period from January 25, 2021 (commencement of operations) through October 31, 2021 |
Amplify Cleaner Living ETF | For the period from June 23, 2021 (commencement of operations) through October 31, 2021 |
Amplify Thematic All-Stars ETF | For the period from July 20, 2021 (commencement of operations) through October 31, 2021 |
Amplify Digital & Online Trading ETF | For the period from September 21, 2021 (commencement of operations) through Octo-ber 31, 2021 |
94
Amplify ETF Trust
Report of Independent Registered Public Accounting Firm
(Continued)
Basis for Opinion
These financial statements are the responsibility of the Funds’ management. Our responsibility is to express an opinion on the Funds’ financial statements based on our audits. We are a public accounting firm registered with the Public Company Accounting Oversight Board (United States) (“PCAOB”) and are required to be independent with respect to the Funds in accordance with the U.S. federal securities laws and the applicable rules and regulations of the Securities and Exchange Commission and the PCAOB.
We conducted our audits in accordance with the standards of the PCAOB. Those standards require that we plan and perform the audit to obtain reasonable assurance about whether the financial statements are free of material misstatement whether due to error or fraud.
Our audits included performing procedures to assess the risks of material misstatement of the financial statements, whether due to error or fraud, and performing procedures that respond to those risks. Such procedures included examining, on a test basis, evidence regarding the amounts and disclosures in the financial statements. Our procedures included confirmation of securities owned as of October 31, 2021, by correspondence with the custodian and brokers; when replies were not received from brokers, we performed other auditing procedures. Our audits also included evaluating the accounting principles used and significant estimates made by management, as well as evaluating the overall presentation of the financial statements. We believe that our audits provide a reasonable basis for our opinion.
We have served as the Funds’ auditor since 2015. We have served as the auditor of one or more investment companies advised by Exchange Traded Concepts, LLC since 2012.

COHEN & COMPANY, LTD.
Milwaukee, Wisconsin
December 23, 2021
95
Amplify ETF Trust
Board Considerations Regarding Approval of
Investment Management Agreement and Sub-Advisory Agreements
October 31, 2021 (Unaudited)
AMPLIFY HIGH INCOME ETF
Pursuant to Section 15(c) of the Investment Company Act of 1940 (the “1940 Act”), at a meeting held on September 14, 2021, the Board of Trustees (the “Board”) of Amplify ETF Trust (the “Trust”) considered the approval of, and approved, the following agreements (collectively, the “Agreements”): (1) an Investment Management Agreement between Amplify Investments LLC (the “Adviser”) and the Trust, on behalf of the Amplify High Income ETF (the “Fund”) and (2) an Investment Sub-Advisory Agreement between the Adviser and Penserra Capital Management LLC (the “Sub-Adviser”), on behalf of the Fund (collectively, the “Agreements”).
The Fund was originally approved by the Board and its Independent Trustees on or about December 11, 2018 for an initial two-year term. After their initial two-year term, the Agreements must be approved: (i) by the vote of the Trustees or by a vote of the shareholders of the Fund; and (ii) by the vote of a majority of the Trustees who are not parties to the Agreements or “interested persons” of any party thereto, as defined in the 1940 Act (the “Independent Trustees”), cast in person at a meeting called for the purpose of voting on such approval. At the December 11, 2018 meeting, the Board, including the Independent Trustees, approved the retention of the Adviser and the Sub-Adviser and the Agreements for the initial two-year term.
Each year after the initial two-year term, the Board will call and hold a meeting to decide whether to renew the Agreements for an additional one-year term. In preparation for such meetings, the Board requests and reviews a wide variety of information from the Adviser and the Sub-Adviser. Thus, a meeting was held on September 14, 2021, to discuss and review the Agreements with respect to the Fund. At the September 14, 2021meeting, the Board, including the Independent Trustees, approved the retention of the Adviser and the Sub-Adviser and the Agreements for an additional one-year term.
Prior to the meeting held on September 14, 2021, the Board, including the Independent Trustees, reviewed written materials from the Adviser and the Sub-Adviser regarding, among other things: (i) the nature, extent and quality of the services to be provided to fund shareholders by the Adviser and the Sub-Adviser; (ii) the Adviser and the Sub-Adviser’s costs and profits expected to be realized in providing their services, including any fall-out benefits expected to be enjoyed by the Adviser and the Sub-Adviser; and (iii) the existence, or anticipated existence, of economies of scale.
Prior to and at the meeting held on September 14, 2021, representatives from the Adviser and the Sub-Adviser, along with other service providers of the Fund, presented additional oral and written information to help the Board evaluate the Adviser and the Sub-Adviser’s fees and other aspects of the Agreements. Among other things, representatives from the Adviser and the Sub-Adviser provided overviews of their advisory businesses, including investment personnel and investment processes. The representatives also discussed the rationale for launching the Fund, the Fund’s fees and fee structures of comparable investment companies. The Board then discussed the written materials that it received before the meeting and the Adviser and Sub-Adviser’s oral presentations and any other information that the Board received at the meeting, and deliberated on the approval of the Agreements in light of this information. In its deliberations, the Board did not identify any single piece of information discussed below that was all-important, controlling or determinative of its decision.
Nature, Extent and Quality of Services. In evaluating the nature, extent and quality of the Adviser’s services, the Trustees considered information concerning the functions to be performed by the Adviser and the Sub-Adviser and the personnel and resources of the Adviser and Sub-Adviser, including the investment management team that will be responsible for the day-to-day management of the Fund and the portfolio manager responsible for investing the portfolio of the Fund. The Trustees considered statements by the Adviser and Sub-Adviser regarding their respective financial conditions, that each was financially stable and could support its performance of the services under its Agreement. The Trustees also considered the services to be provided by the Adviser in its oversight of the Fund’s service providers.
Based on their review, the Trustees concluded that the nature, extent and quality of the services to be provided by the Adviser and Sub-Adviser to the Fund under the respective Agreement were expected to be appropriate and reasonable.
96
Amplify ETF Trust
Board Considerations Regarding Approval of
Investment Management Agreement and Sub-Advisory Agreements
October 31, 2021 (Unaudited) (Continued)
Fees, Expenses and Profitability. The Trustees discussed the information provided by the Adviser on the Fund’s proposed investment management fee of 0.50% as compared to information provided by the Adviser on other similar products. The Trustees also considered that the Adviser and Sub-Adviser had managed this Fund to the Board’s satisfaction over the course of the previous two years. The Trustees noted that the proposed annual investment management fee to be charged to the Fund was a unitary fee, and that the Adviser has agreed to pay all other expenses of the Fund, including fees payable to the Sub-Adviser, except brokerage commissions and other expenses connected with the execution of portfolio transactions, taxes, interest, distribution and service fees payable pursuant to a 12b-1 Plan, if any, and extraordinary expenses. The Board concluded that the unitary investment management fee to be charged to the Fund is reasonable and appropriate in light of the services expected to be provided by the Adviser and Sub-Adviser. In conjunction with their review of the unitary investment management fee, the Trustees considered information provided by the Adviser and Sub-Adviser on their costs to be incurred in connection with the proposed Agreement and their estimated profitability and that any profitability would not be excessive. The Trustees concluded that the estimated profits to be realized by the Adviser and the Sub-Adviser with respect to the Fund appeared to be reasonable.
Economies of Scale and Whether the Fee Level Reflects These Economies of Scale. The Trustees considered the information provided by the Adviser and the Sub-Adviser as to the extent to which economies of scale may be realized as the Fund grows and whether the fee level reflects economies of scale for the benefit of shareholders. The Trustees noted that any reduction in fixed costs associated with the management of the Fund would be enjoyed by the Adviser and Sub-Adviser, but that a unitary fee provides a level of certainty in expenses for the Fund. The Trustees considered whether the proposed advisory fee rate for the Fund is reasonable in relation to the projected asset size of the Fund. The Trustees noted the Adviser’s and Sub-Adviser’s views on their expectations for growth, noting that, initially, the Adviser did not anticipate any material economies of scale. The Trustees concluded that the flat investment management fee was reasonable and appropriate.
The Trustees noted that the Adviser and Sub-Adviser had not identified any further benefits that it would derive from its relationship with the Fund, and had noted that it will not, initially, have any soft dollar arrangements.
Based on all of the information considered and the conclusions reached, the Board, including the Independent Trustees, have determined to approve the Agreements for the Fund.
97
Amplify ETF Trust
Board Considerations Regarding Approval of
Investment Management Agreement and Sub-Advisory Agreements
October 31, 2021 (Unaudited) (Continued)
AMPLIFY ONLINE RETAIL ETF
Pursuant to Section 15(c) of the Investment Company Act of 1940 (the “1940 Act”), at a meeting held on September 14, 2021, the Board of Trustees (the “Board”) of Amplify ETF Trust (the “Trust”) considered the approval of, and approved, the following agreements (collectively, the “Agreements”): (1) an Investment Management Agreement between Amplify Investments LLC (the “Adviser”) and the Trust, on behalf of the Amplify Online Retail ETF (the “Fund”) and (2) an Investment Sub-Advisory Agreement between the Adviser and Penserra Capital Management LLC (the “Sub-Adviser”), on behalf of the Fund (collectively, the “Agreements”).
The Fund was originally approved by the Board and its Independent Trustees on or about November 5, 2015 for an initial two-year term. After their initial two-year term, the Agreements must be approved: (i) by the vote of the Trustees or by a vote of the shareholders of the Fund; and (ii) by the vote of a majority of the Trustees who are not parties to the Agreements or “interested persons” of any party thereto, as defined in the 1940 Act (the “Independent Trustees”), cast in person at a meeting called for the purpose of voting on such approval for an additional one year term. In preparation for the meetings, the Board requests and reviews a wide variety of information from the Adviser and the Sub-Adviser. Thus, a meeting was held on September 12, 2017, to discuss and review the Agreements with respect to the Fund. At the September 12, 2017 meeting, the Board, including the Independent Trustees, approved the retention of the Adviser and the Sub-Adviser and the Agreements for an additional one-year term. Thereafter, the Board held meetings on September 18, 2018 and September 17, 2019, and September 15, 2020, to discuss and review the Agreements with respect to the Fund. At each of those meetings, the Board, including the Independent Trustees, approved the retention of the Adviser and the Sub-Adviser and the Agreements for an additional one- year term.
On or about September 14, 2021, the Board called and held a meeting to decide whether to renew the Agreements for an additional one-year term. At the September 14, 2021 meeting, the Board, including the Independent Trustees, approved the retention of the Adviser and the Sub-Adviser and the Agreements for an additional one-year term.
Prior to the meeting held on September 14, 2021, the Board, including the Independent Trustees, reviewed written materials from the Adviser and the Sub-Adviser regarding, among other things: (i) the nature, extent and quality of the services to be provided to fund shareholders by the Adviser and the Sub-Adviser; (ii) the Adviser and the Sub-Adviser’s costs and profits expected to be realized in providing their services, including any fall-out benefits expected to be enjoyed by the Adviser and the Sub-Adviser; and (iii) the existence, or anticipated existence, of economies of scale.
Prior to and at the meeting held on September 14, 2021, representatives from the Adviser and the Sub-Adviser, along with other service providers of the Fund, presented additional oral and written information to help the Board evaluate the Adviser and the Sub-Adviser’s fees and other aspects of the Agreements. Among other things, representatives from the Adviser and the Sub- Adviser provided overviews of their advisory businesses, including investment personnel and investment processes. The representatives also discussed the rationale for launching the Fund, the Fund’s fees and fee structures of comparable investment companies. The Board then discussed the written materials that it received before the meeting and the Adviser and Sub- Adviser’s oral presentations and any other information that the Board received at the meeting, and deliberated on the approval of the Agreements in light of this information. In its deliberations, the Board did not identify any single piece of information discussed below that was all-important, controlling or determinative of its decision.
Nature, Extent and Quality of Services. In evaluating the nature, extent and quality of the Adviser’s services, the Trustees considered information concerning the functions to be performed by the Adviser and the Sub-Adviser and the personnel and resources of the Adviser and Sub-Adviser, including the investment management team that will be responsible for the day-to-day management of the Fund and the portfolio manager responsible for investing the portfolio of the Fund. The Trustees also considered statements by the Adviser and Sub-Adviser regarding their respective financial conditions, that each was financially stable and could support its performance of the services under its Agreement. The Trustees also considered the services to be provided by the Adviser in its oversight of the Fund’s service providers.
98
Amplify ETF Trust
Board Considerations Regarding Approval of
Investment Management Agreement and Sub-Advisory Agreements
October 31, 2021 (Unaudited) (Continued)
Based on their review, the Trustees concluded that the nature, extent and quality of the services to be provided by the Adviser and Sub-Adviser to the Fund under the respective Agreement were expected to be appropriate and reasonable.
Fees, Expenses and Profitability. The Trustees discussed the information provided by the Adviser on the Fund’s proposed investment management fee of 0.65% as compared to information provided by the Adviser on other similar products. The Trustees also considered that the Adviser and Sub-Adviser had managed this Fund to the Board’s satisfaction over the course of the previous four years. The Trustees noted that the proposed annual investment management fee to be charged to the Fund was a unitary fee, and that the Adviser has agreed to pay all other expenses of the Fund, including fees payable to the Sub-Adviser, except brokerage commissions and other expenses connected with the execution of portfolio transactions, taxes, interest, distribution and service fees payable pursuant to a 12b-1 Plan, if any, and extraordinary expenses. The Board concluded that the unitary investment management fee to be charged to the Fund is reasonable and appropriate in light of the services expected to be provided by the Adviser and Sub-Adviser. In conjunction with their review of the unitary investment management fee, the Trustees considered information provided by the Adviser and Sub-Adviser on their costs to be incurred in connection with the proposed Agreement and their estimated profitability and that any profitability would not be excessive. The Trustees concluded that the estimated profits to be realized by the Adviser and Sub-Adviser with respect to the Fund appeared to be reasonable.
Economies of Scale and Whether the Fee Level Reflects These Economies of Scale. The Trustees considered the information provided by the Adviser and the Sub-Adviser as to the extent to which economies of scale may be realized as the Fund grows and whether the fee level reflects economies of scale for the benefit of shareholders. The Trustees noted that any reduction in fixed costs associated with the management of the Fund would be enjoyed by the Adviser and Sub-Adviser, but that a unitary fee provides a level of certainty in expenses for the Fund. The Trustees considered whether the proposed advisory fee rate for the Fund is reasonable in relation to the projected asset size of the Fund. The Trustees noted the Adviser’s and Sub-Adviser’s views on their expectations for growth, noting that, initially, the Adviser did not anticipate any material economies of scale. The Trustees concluded that the flat investment management fee was reasonable and appropriate.
The Trustees noted that the Adviser and Sub-Adviser had not identified any further benefits that it would derive from its relationship with the Fund, and had noted that it will not, initially, have any soft dollar arrangements.
Based on all of the information considered and the conclusions reached, the Board, including the Independent Trustees, have determined to approve the Agreements for the Fund.
99
Amplify ETF Trust
Board Considerations Regarding Approval of
Investment Management Agreement and Sub-Advisory Agreements
October 31, 2021 (Unaudited) (Continued)
AMPLIFY BLACKSWAN GROWTH & TREASURY CORE ETF
Pursuant to Section 15(c) of the Investment Company Act of 1940 (the “1940 Act”), at a meeting held on September 14, 2021, the Board of Trustees (the “Board”) of Amplify ETF Trust (the “Trust”) considered the approval of, and approved, the following agreements (collectively, the “Agreements”): (1) an Investment Management Agreement between Amplify Investments LLC (the “Adviser”) and the Trust, on behalf of the Amplify BlackSwan Growth & Treasury Core ETF (the “Fund”) and (2) an Investment Sub-Advisory Agreement between the Adviser and Toroso Investments, LLC (“Toroso”) and (3) an Investment Sub-Advisory Agreement between the Adviser and ARGI Investment Services, LLC (hereinafter referred to as “ARGI”. Toroso and ARGI will be collectively referred to hereinafter as the “Sub-Advisers”), on behalf of the Fund (collectively, the “Agreements”).
The Fund was originally approved by the Board and its Independent Trustees on or about September 18, 2018 and October 4, 2018 for an initial two-year term. After their initial two-year term, the Agreements must be approved: (i) by the vote of the Trustees or by a vote of the shareholders of the Fund; and (ii) by the vote of a majority of the Trustees who are not parties to the Agreements or “interested persons” of any party thereto, as defined in the 1940 Act (the “Independent Trustees”), cast in person at a meeting called for the purpose of voting on such approval. At the September 18, 2018 and the October 4, 2018 meetings, the Board, including the Independent Trustees, approved the retention of the Adviser and the Sub-Advisers and the Agreements for the initial two-year term.
Each year after the initial two-year term, the Board will call and hold a meeting to decide whether to renew the Agreements for an additional one-year term. In preparation for such meetings, the Board requests and reviews a wide variety of information from the Adviser and the Sub-Advisers. Thus, a meeting was held on September 14, 2021, to discuss and review the Agreements with respect to the Fund. At the September 14, 2021 meeting, the Board, including the Independent Trustees, approved the retention of the Adviser and the Sub-Advisers and the Agreements for an additional one-year term.
Prior to the meeting held on September 14, 2021, the Board, including the Independent Trustees, reviewed written materials from the Adviser and the Sub-Advisers regarding, among other things: (i) the nature, extent and quality of the services to be provided to fund shareholders by the Adviser and the Sub-Advisers; (ii) the Adviser and the Sub-Advisers’ costs and profits expected to be realized in providing their services, including any fall-out benefits expected to be enjoyed by the Adviser and the Sub-Advisers; and (iii) the existence, or anticipated existence, of economies of scale.
Prior to and at the meeting held on September 14, 2021, representatives from the Adviser and the Sub-Advisers, along with other service providers of the Fund, presented additional oral and written information to help the Board evaluate the Adviser and the Sub-Advisers’ fees and other aspects of the Agreements. Among other things, representatives from the Adviser and the Sub- Advisers provided overviews of their advisory businesses, including investment personnel and investment processes. The representatives also discussed the rationale for launching the Fund, the Fund’s fees and fee structures of comparable investment companies. The Board then discussed the written materials that it received before the meeting and the Adviser and Sub-Advisers’ oral presentations and any other information that the Board received at the meeting, and deliberated on the approval of the Agreements in light of this information. In its deliberations, the Board did not identify any single piece of information discussed below that was all-important, controlling or determinative of its decision.
Nature, Extent and Quality of Services. In evaluating the nature, extent and quality of the Adviser’s services, the Trustees considered information concerning the functions to be performed by the Adviser and the Sub-Advisers and the personnel and resources of the Adviser and Sub-Advisers, including the investment management team that will be responsible for the day-to-day management of the Fund and the portfolio manager responsible for investing the portfolio of the Fund. The Trustees considered statements by the Adviser and Sub-Advisers regarding their respective financial conditions, that each was financially stable and could support its performance of the services under its Agreement. The Trustees also considered the services to be provided by the Adviser in its oversight of the Fund’s service providers.
100
Amplify ETF Trust
Board Considerations Regarding Approval of
Investment Management Agreement and Sub-Advisory Agreements
October 31, 2021 (Unaudited) (Continued)
Based on their review, the Trustees concluded that the nature, extent and quality of the services to be provided by the Adviser and Sub-Advisers to the Fund under the respective Agreement were expected to be appropriate and reasonable.
Fees, Expenses and Profitability. The Trustees discussed the information provided by the Adviser on the Fund’s proposed investment management fee of 0.49% as compared to information provided by the Adviser on other similar products. The Trustees also considered that the Adviser and Sub-Advisers had managed this Fund to the Board’s satisfaction over the course of the previous two years. The Trustees noted that the proposed annual investment management fee to be charged to the Fund was a unitary fee, and that the Adviser has agreed to pay all other expenses of the Fund, including fees payable to the Sub-Advisers, except brokerage commissions and other expenses connected with the execution of portfolio transactions, taxes, interest, distribution and service fees payable pursuant to a 12b-1 Plan, if any, and extraordinary expenses. The Board concluded that the unitary investment management fee to be charged to the Fund is reasonable and appropriate in light of the services expected to be provided by the Adviser and Sub-Advisers. In conjunction with their review of the unitary investment management fee, the Trustees considered information provided by the Adviser and Sub-Advisers on their costs to be incurred in connection with the proposed Agreement and their estimated profitability and that any profitability would not be excessive. The Trustees concluded that the estimated profits to be realized by the Adviser and Sub-Advisers with respect to the Fund appeared to be reasonable.
Economies of Scale and Whether the Fee Level Reflects These Economies of Scale. The Trustees considered the information provided by the Adviser and the Sub-Advisers as to the extent to which economies of scale may be realized as the Fund grows and whether the fee level reflects economies of scale for the benefit of shareholders. The Trustees noted that any reduction in fixed costs associated with the management of the Fund would be enjoyed by the Adviser and Sub-Advisers, but that a unitary fee provides a level of certainty in expenses for the Fund. The Trustees considered whether the proposed advisory fee rate for the Fund is reasonable in relation to the projected asset size of the Fund. The Trustees noted the Adviser’s and Sub-Advisers’ views on their expectations for growth, noting that, initially, the Adviser did not anticipate any material economies of scale. The Trustees concluded that the flat investment management fee was reasonable and appropriate.
The Trustees noted that the Adviser and Sub-Advisers had not identified any further benefits that it would derive from its relationship with the Fund, and had noted that it will not, initially, have any soft dollar arrangements.
Based on all the information considered and the conclusions reached, the Board, including the Independent Trustees, have determined to approve the Agreements for the Fund.
101
Amplify ETF Trust
Board Considerations Regarding Approval of
Investment Management Agreement and Sub-Advisory Agreements
October 31, 2021 (Unaudited) (Continued)
FOR AMPLIFY INTERNATIONAL ONLINE RETAIL ETF
Pursuant to Section 15(c) of the Investment Company Act of 1940 (the “1940 Act”), at a meeting held on September 14, 2021, the Board of Trustees (the “Board”) of Amplify ETF Trust (the “Trust”) considered the approval of, and approved, the following agreements (collectively, the “Agreements”): (1) an Investment Management Agreement between Amplify Investments LLC (the “Adviser”) and the Trust, on behalf of the Amplify International Online Retail ETF (the “Fund”) and (2) an Investment Sub-Advisory Agreement between the Adviser and Penserra Capital Management LLC (the “Sub-Adviser”), on behalf of the Fund (collectively, the “Agreements”).
The Fund was originally approved by the Board and its Independent Trustees on or about September 18, 2018 for an initial two-year term. After their initial two-year term, the Agreements must be approved: (i) by the vote of the Trustees or by a vote of the shareholders of the Fund; and (ii) by the vote of a majority of the Trustees who are not parties to the Agreements or “interested persons” of any party thereto, as defined in the 1940 Act (the “Independent Trustees”), cast in person at a meeting called for the purpose of voting on such approval. Thus, a meeting was held on September 18, 2018, to discuss and review the Agreements with respect to the Fund. At the September 18, 2018 meeting, the Board, including the Independent Trustees, approved the retention of the Adviser and the Sub-Adviser and the Agreements for the initial two-year term.
Each year after the initial two-year term, the Board will call and hold a meeting to decide whether to renew the Agreements for an additional one-year term. In preparation for such meetings, the Board requests and reviews a wide variety of information from the Adviser and the Sub-Adviser. Thus, a meeting was held on September 14, 2021, to discuss and review the Agreements with respect to the Fund. At the September 14, 2021 meeting, the Board, including the Independent Trustees, approved the retention of the Adviser and the Sub-Adviser and the Agreements for an additional one-year term.
Prior to the meeting held on September 14, 2021, the Board, including the Independent Trustees, reviewed written materials from the Adviser and the Sub-Adviser regarding, among other things: (i) the nature, extent and quality of the services to be provided to fund shareholders by the Adviser and the Sub-Adviser; (ii) the Adviser and the Sub-Adviser’s costs and profits expected to be realized in providing their services, including any fall-out benefits expected to be enjoyed by the Adviser and the Sub-Adviser; and (iii) the existence, or anticipated existence, of economies of scale.
Prior to and at the meeting held on September 14, 2021, representatives from the Adviser and the Sub-Adviser, along with other service providers of the Fund, presented additional oral and written information to help the Board evaluate the Adviser and the Sub-Adviser’s fees and other aspects of the Agreements. Among other things, representatives from the Adviser and the Sub- Adviser provided overviews of their advisory businesses, including investment personnel and investment processes. The representatives also discussed the rationale for launching the Fund, the Fund’s fees and fee structures of comparable investment companies. The Board then discussed the written materials that it received before the meeting and the Adviser and Sub- Adviser’s oral presentations and any other information that the Board received at the meeting, and deliberated on the approval of the Agreements in light of this information. In its deliberations, the Board did not identify any single piece of information discussed below that was all-important, controlling or determinative of its decision.
Nature, Extent and Quality of Services. In evaluating the nature, extent and quality of the Adviser’s services, the Trustees considered information concerning the functions to be performed by the Adviser and the Sub-Adviser and the personnel and resources of the Adviser and Sub-Adviser, including the investment management team that will be responsible for the day-to-day management of the Fund and the portfolio manager responsible for investing the portfolio of the Fund. The Trustees also considered statements by the Adviser and Sub-Adviser regarding their respective financial conditions, that each was financially stable and could support its performance of the services under its Agreement. The Trustees also considered the services to be provided by the Adviser in its oversight of the Fund’s service providers.
102
Amplify ETF Trust
Board Considerations Regarding Approval of
Investment Management Agreement and Sub-Advisory Agreements
October 31, 2021 (Unaudited) (Continued)
Based on their review, the Trustees concluded that the nature, extent and quality of the services to be provided by the Adviser and Sub-Adviser to the Fund under the respective Agreement were expected to be appropriate and reasonable.
Fees, Expenses and Profitability. The Trustees discussed the information provided by the Adviser on the Fund’s proposed investment management fee of 0.69% as compared to information provided by the Adviser on other similar products. The Trustees also considered that the Adviser and Sub-Adviser had managed this Fund to the Board’s satisfaction over the course of the previous two years. The Trustees noted that the proposed annual investment management fee to be charged to the Fund was a unitary fee, and that the Adviser has agreed to pay all other expenses of the Fund, including fees payable to the Sub-Adviser, except brokerage commissions and other expenses connected with the execution of portfolio transactions, taxes, interest, distribution and service fees payable pursuant to a 12b-1 Plan, if any, and extraordinary expenses. The Board concluded that the unitary investment management fee to be charged to the Fund is reasonable and appropriate in light of the services expected to be provided by the Adviser and Sub-Adviser. In conjunction with their review of the unitary investment management fee, the Trustees considered information provided by the Adviser and Sub-Adviser on their costs to be incurred in connection with the proposed Agreement and their estimated profitability and that any profitability would not be excessive. The Trustees concluded that the estimated profits to be realized by the Adviser and the Sub-Adviser with respect to the Fund appeared to be reasonable.
Economies of Scale and Whether the Fee Level Reflects These Economies of Scale. The Trustees considered the information provided by the Adviser and the Sub-Adviser as to the extent to which economies of scale may be realized as the Fund grows and whether the fee level reflects economies of scale for the benefit of shareholders. The Trustees noted that any reduction in fixed costs associated with the management of the Fund would be enjoyed by the Adviser and Sub-Adviser, but that a unitary fee provides a level of certainty in expenses for the Fund. The Trustees considered whether the proposed advisory fee rate for the Fund is reasonable in relation to the projected asset size of the Fund. The Trustees noted the Adviser’s and Sub-Adviser’s views on their expectations for growth, noting that, initially, the Adviser did not anticipate any material economies of scale. The Trustees concluded that the flat investment management fee was reasonable and appropriate.
The Trustees noted that the Adviser and Sub-Adviser had not identified any further benefits that it would derive from its relationship with the Fund, and had noted that it will not, initially, have any soft dollar arrangements.
Based on all of the information considered and the conclusions reached, the Board, including the Independent Trustees, have determined to approve the Agreements for the Fund.
103
Amplify ETF Trust
Board Considerations Regarding Approval of
Investment Management Agreement and Sub-Advisory Agreements
October 31, 2021 (Unaudited) (Continued)
AMPLIFY CLEANER LIVING ETF
Pursuant to Section 15(c) of the Investment Company Act of 1940 (the “1940 Act”), at a meeting held on June 8, 2021, the Board of Trustees (the “Board”) of Amplify ETF Trust (the “Trust”) considered the approval of, and approved, the following agreements (collectively, the “Agreements”): (1) an Investment Management Agreement between Amplify Investments LLC (the “Adviser”) and the Trust, on behalf of the Amplify Cleaner Living ETF (the “Fund”) and (2) an Investment Sub-Advisory Agreement between the Adviser and Penserra Capital Management, LLC (“Sub-Adviser”), on behalf of the Fund (collectively, the “Agreements”).
The Fund was originally approved by the Board and its Independent Trustees on or about June 8, 2021 for an initial two-year term. After their initial two-year term, the Agreements must be approved: (i) by the vote of the Trustees or by a vote of the shareholders of the Fund; and (ii) by the vote of a majority of the Trustees who are not parties to the Agreements or “interested persons” of any party thereto, as defined in the 1940 Act (the “Independent Trustees”), cast in person at a meeting called for the purpose of voting on such approval. At the June 8, 2021 meeting, the Board, including the Independent Trustees, approved the retention of the Adviser and the Sub-Adviser and the Agreements for the initial two-year term.
On or about June 8, 2021, the Board called and held a meeting to decide whether to approve the Agreements for an initial two-year term. In preparation for such meetings, the Board requests and reviews a wide variety of information from the Adviser and the Sub-Adviser. At the June 8, 2021 meeting, the Board, including the Independent Trustees, approved the retention of the Adviser and the Sub-Adviser and the Agreements for the initial two-year term.
Prior to the meeting held on June 8, 2021, the Board, including the Independent Trustees, reviewed written materials from the Adviser and the Sub-Adviser regarding, among other things: (i) the nature, extent and quality of the services to be provided to fund shareholders by the Adviser and the Sub-Adviser; (ii) the Adviser and the Sub-Adviser’s costs and profits expected to be realized in providing their services, including any fall-out benefits expected to be enjoyed by the Adviser and the Sub-Adviser; and (iii) the existence, or anticipated existence, of economies of scale.
Prior to and at the meeting held on June 8, 2021, representatives from the Adviser and the Sub-Adviser, along with other service providers of the Fund, presented additional oral and written information to help the Board evaluate the Adviser and the Sub-Adviser’s fees and other aspects of the Agreements. Among other things, representatives from the Adviser and the Sub-Adviser provided overviews of their advisory businesses, including investment personnel and investment processes. The representatives also discussed the rationale for launching the Fund, the Fund’s fees and fee structures of comparable investment companies. The Board then discussed the written materials that it received before the meeting and the Adviser and Sub-Adviser’s oral presentations and any other information that the Board received at the meeting and deliberated on the approval of the Agreements in light of this information. In its deliberations, the Board did not identify any single piece of information discussed below that was all-important, controlling or determinative of its decision.
Nature, Extent and Quality of Services. In evaluating the nature, extent and quality of the Adviser’s services, the Trustees considered information concerning the functions to be performed by the Adviser and the Sub-Adviser and the personnel and resources of the Adviser and Sub-Adviser, including the investment management team that will be responsible for the day-to-day management of the Fund and the portfolio manager responsible for investing the portfolio of the Fund. The Trustees also considered statements by the Adviser and Sub-Adviser regarding their respective financial conditions, that each was financially stable and could support its performance of the services under its Agreement. The Trustees also considered the services to be provided by the Adviser in its oversight of the Fund’s service providers.
Based on their review, the Trustees concluded that the nature, extent and quality of the services to be provided by the Adviser and Sub-Adviser to the Fund under the respective Agreement were expected to be appropriate and reasonable.
104
Amplify ETF Trust
Board Considerations Regarding Approval of
Investment Management Agreement and Sub-Advisory Agreements
October 31, 2021 (Unaudited) (Continued)
Fees, Expenses and Profitability. The Trustees discussed the information provided by the Adviser on the Fund’s proposed initial investment management fee of 0.59% as compared to information provided by the Adviser on other similar products. The Trustees noted that the proposed annual investment management fee to be charged to the Fund was a unitary fee, and that the Adviser has agreed to pay all other expenses of the Fund, including fees payable to the Sub-Adviser, except brokerage commissions and other expenses connected with the execution of portfolio transactions, taxes, interest, distribution and service fees payable pursuant to a 12b-1 Plan, if any, and extraordinary expenses. The Board concluded that the unitary investment management fee to be charged to the Fund is reasonable and appropriate in light of the services expected to be provided by the Adviser and Sub-Adviser. In conjunction with their review of the unitary investment management fee, the Trustees considered information provided by the Adviser and Sub-Adviser on their costs to be incurred in connection with the proposed Agreement and their estimated profitability and that any profitability would not be excessive. The Trustees concluded that the estimated profits to be realized by the Adviser and Sub-Adviser with respect to the Fund appeared to be reasonable.
Economies of Scale and Whether the Fee Level Reflects These Economies of Scale. The Trustees considered the information provided by the Adviser and the Sub-Adviser as to the extent to which economies of scale may be realized as the Fund grows and whether the fee level reflects economies of scale for the benefit of shareholders. The Trustees noted that any reduction in fixed costs associated with the management of the Fund would be enjoyed by the Adviser and Sub-Adviser, but that a unitary fee provides a level of certainty in expenses for the Fund. The Trustees considered whether the proposed advisory fee rate for the Fund is reasonable in relation to the projected asset size of the Fund. The Trustees noted the Adviser’s and Sub-Adviser’s views on their expectations for growth, noting that, initially, the Adviser did not anticipate any material economies of scale. The Trustees concluded that the flat investment management fee was reasonable and appropriate.
The Trustees noted that the Adviser and Sub-Adviser had not identified any further benefits that it would derive from its relationship with the Fund, and had noted that they will not, initially, have any soft dollar arrangements.
Based on all of the information considered and the conclusions reached, the Board, including the Independent Trustees, have determined to approve the Agreements for the Fund.
105
Amplify ETF Trust
Board Considerations Regarding Approval of
Investment Management Agreement and Sub-Advisory Agreements
October 31, 2021 (Unaudited) (Continued)
AMPLIFY THEMATIC ALL-STARS ETF
Pursuant to Section 15(c) of the Investment Company Act of 1940 (the “1940 Act”), at a meeting held on June 8, 2021, the Board of Trustees (the “Board”) of Amplify ETF Trust (the “Trust”) considered the approval of, and approved, the following agreements (collectively, the “Agreements”): (1) an Investment Management Agreement between Amplify Investments LLC (the “Adviser”) and the Trust, on behalf of the Amplify Thematic All-Stars ETF (the “Fund”) and (2) an Investment Sub-Advisory Agreement between the Adviser and Toroso Investments, LLC (“Sub-Adviser”), on behalf of the Fund (collectively, the “Agreements”).
The Fund was originally approved by the Board and its Independent Trustees on or about June 8, 2021 for an initial two-year term. After their initial two-year term, the Agreements must be approved: (i) by the vote of the Trustees or by a vote of the shareholders of the Fund; and (ii) by the vote of a majority of the Trustees who are not parties to the Agreements or “interested persons” of any party thereto, as defined in the 1940 Act (the “Independent Trustees”), cast in person at a meeting called for the purpose of voting on such approval. At the June 8, 2021 meeting, the Board, including the Independent Trustees, approved the retention of the Adviser and the Sub-Adviser and the Agreements for the initial two-year term.
On or about June 8, 2021, the Board called and held a meeting to decide whether to approve the Agreements for an initial two-year term. In preparation for such meetings, the Board requests and reviews a wide variety of information from the Adviser and the Sub-Adviser. At the June 8, 2021 meeting, the Board, including the Independent Trustees, approved the retention of the Adviser and the Sub-Adviser and the Agreements for the initial two-year term.
Prior to the meeting held on June 8, 2021, the Board, including the Independent Trustees, reviewed written materials from the Adviser and the Sub-Adviser regarding, among other things: (i) the nature, extent and quality of the services to be provided to fund shareholders by the Adviser and the Sub-Adviser; (ii) the Adviser and the Sub-Adviser’s costs and profits expected to be realized in providing their services, including any fall-out benefits expected to be enjoyed by the Adviser and the Sub-Adviser; and (iii) the existence, or anticipated existence, of economies of scale.
Prior to and at the meeting held on June 8, 2021, representatives from the Adviser and the Sub-Adviser, along with other service providers of the Fund, presented additional oral and written information to help the Board evaluate the Adviser and the Sub-Adviser’s fees and other aspects of the Agreements. Among other things, representatives from the Adviser and the Sub-Adviser provided overviews of their advisory businesses, including investment personnel and investment processes. The representatives also discussed the rationale for launching the Fund, the Fund’s fees and fee structures of comparable investment companies. The Board then discussed the written materials that it received before the meeting and the Adviser and Sub-Adviser’s oral presentations and any other information that the Board received at the meeting and deliberated on the approval of the Agreements in light of this information. In its deliberations, the Board did not identify any single piece of information discussed below that was all-important, controlling or determinative of its decision.
Nature, Extent and Quality of Services. In evaluating the nature, extent and quality of the Adviser’s services, the Trustees considered information concerning the functions to be performed by the Adviser and the Sub-Adviser and the personnel and resources of the Adviser and Sub-Adviser, including the investment management team that will be responsible for the day-to-day management of the Fund and the portfolio manager responsible for investing the portfolio of the Fund. The Trustees also considered statements by the Adviser and Sub-Adviser regarding their respective financial conditions, that each was financially stable and could support its performance of the services under its Agreement. The Trustees also considered the services to be provided by the Adviser in its oversight of the Fund’s service providers.
Based on their review, the Trustees concluded that the nature, extent and quality of the services to be provided by the Adviser and Sub-Adviser to the Fund under the respective Agreement were expected to be appropriate and reasonable.
106
Amplify ETF Trust
Board Considerations Regarding Approval of
Investment Management Agreement and Sub-Advisory Agreements
October 31, 2021 (Unaudited) (Continued)
Fees, Expenses and Profitability. The Trustees discussed the information provided by the Adviser on the Fund’s proposed initial investment management fee of 0.49% as compared to information provided by the Adviser on other similar products. The Trustees noted that the proposed annual investment management fee to be charged to the Fund was a unitary fee, and that the Adviser has agreed to pay all other expenses of the Fund, including fees payable to the Sub-Adviser, except brokerage commissions and other expenses connected with the execution of portfolio transactions, taxes, interest, distribution and service fees payable pursuant to a 12b-1 Plan, if any, and extraordinary expenses. The Board concluded that the unitary investment management fee to be charged to the Fund is reasonable and appropriate in light of the services expected to be provided by the Adviser and Sub-Adviser. In conjunction with their review of the unitary investment management fee, the Trustees considered information provided by the Adviser and Sub-Adviser on their costs to be incurred in connection with the proposed Agreement and their estimated profitability and that any profitability would not be excessive. The Trustees concluded that the estimated profits to be realized by the Adviser and Sub-Adviser with respect to the Fund appeared to be reasonable.
Economies of Scale and Whether the Fee Level Reflects These Economies of Scale. The Trustees considered the information provided by the Adviser and the Sub-Adviser as to the extent to which economies of scale may be realized as the Fund grows and whether the fee level reflects economies of scale for the benefit of shareholders. The Trustees noted that any reduction in fixed costs associated with the management of the Fund would be enjoyed by the Adviser and Sub-Adviser, but that a unitary fee provides a level of certainty in expenses for the Fund. The Trustees considered whether the proposed advisory fee rate for the Fund is reasonable in relation to the projected asset size of the Fund. The Trustees noted the Adviser’s and Sub-Adviser’s views on their expectations for growth, noting that, initially, the Adviser did not anticipate any material economies of scale. The Trustees concluded that the flat investment management fee was reasonable and appropriate.
The Trustees noted that the Adviser and Sub-Adviser had not identified any further benefits that it would derive from its relationship with the Fund, and had noted that they will not, initially, have any soft dollar arrangements.
Based on all of the information considered and the conclusions reached, the Board, including the Independent Trustees, have determined to approve the Agreements for the Fund.
107
Amplify ETF Trust
Board Considerations Regarding Approval of
Investment Management Agreement and Sub-Advisory Agreements
October 31, 2021 (Unaudited) (Continued)
AMPLIFY DIGITAL & ONLINE TRADING ETF
Pursuant to Section 15(c) of the Investment Company Act of 1940 (the “1940 Act”), at a meeting held on June 8, 2021, the Board of Trustees (the “Board”) of Amplify ETF Trust (the “Trust”) considered the approval of, and approved, the following agreements (collectively, the “Agreements”): (1) an Investment Management Agreement between Amplify Investments LLC (the “Adviser”) and the Trust, on behalf of the Amplify Digital & Online Trading ETF (the “Fund”) and (2) an Investment Sub-Advisory Agreement between the Adviser and Penserra Capital Management, LLC (“Sub-Adviser”), on behalf of the Fund (collectively, the “Agreements”).
The Fund was originally approved by the Board and its Independent Trustees on or about June 8, 2021 for an initial two-year term. After their initial two-year term, the Agreements must be approved: (i) by the vote of the Trustees or by a vote of the shareholders of the Fund; and (ii) by the vote of a majority of the Trustees who are not parties to the Agreements or “interested persons” of any party thereto, as defined in the 1940 Act (the “Independent Trustees”), cast in person at a meeting called for the purpose of voting on such approval. At the June 8, 2021 meeting, the Board, including the Independent Trustees, approved the retention of the Adviser and the Sub-Adviser and the Agreements for the initial two-year term.
On or about June 8, 2021, the Board called and held a meeting to decide whether to approve the Agreements for an initial two-year term. In preparation for such meetings, the Board requests and reviews a wide variety of information from the Adviser and the Sub-Adviser. At the June 8, 2021 meeting, the Board, including the Independent Trustees, approved the retention of the Adviser and the Sub-Adviser and the Agreements for the initial two-year term.
Prior to the meeting held on June 8, 2021, the Board, including the Independent Trustees, reviewed written materials from the Adviser and the Sub-Adviser regarding, among other things: (i) the nature, extent and quality of the services to be provided to fund shareholders by the Adviser and the Sub-Adviser; (ii) the Adviser and the Sub-Adviser’s costs and profits expected to be realized in providing their services, including any fall-out benefits expected to be enjoyed by the Adviser and the Sub-Adviser; and (iii) the existence, or anticipated existence, of economies of scale.
Prior to and at the meeting held on June 8, 2021, representatives from the Adviser and the Sub-Adviser, along with other service providers of the Fund, presented additional oral and written information to help the Board evaluate the Adviser and the Sub-Adviser’s fees and other aspects of the Agreements. Among other things, representatives from the Adviser and the Sub-Adviser provided overviews of their advisory businesses, including investment personnel and investment processes. The representatives also discussed the rationale for launching the Fund, the Fund’s fees and fee structures of comparable investment companies. The Board then discussed the written materials that it received before the meeting and the Adviser and Sub-Adviser’s oral presentations and any other information that the Board received at the meeting and deliberated on the approval of the Agreements in light of this information. In its deliberations, the Board did not identify any single piece of information discussed below that was all-important, controlling or determinative of its decision.
Nature, Extent and Quality of Services. In evaluating the nature, extent and quality of the Adviser’s services, the Trustees considered information concerning the functions to be performed by the Adviser and the Sub-Adviser and the personnel and resources of the Adviser and Sub-Adviser, including the investment management team that will be responsible for the day-to-day management of the Fund and the portfolio manager responsible for investing the portfolio of the Fund. The Trustees also considered statements by the Adviser and Sub-Adviser regarding their respective financial conditions, that each was financially stable and could support its performance of the services under its Agreement. The Trustees also considered the services to be provided by the Adviser in its oversight of the Fund’s service providers.
Based on their review, the Trustees concluded that the nature, extent and quality of the services to be provided by the Adviser and Sub-Adviser to the Fund under the respective Agreement were expected to be appropriate and reasonable.
Fees, Expenses and Profitability. The Trustees discussed the information provided by the Adviser on the Fund’s proposed initial investment management fee of 0.59% as compared to information provided by the Adviser on other similar products. The Trustees noted that the proposed annual investment management fee to be charged to the Fund was a unitary fee, and that the Adviser has agreed to pay all other expenses of the Fund, including fees payable to the Sub-Adviser, except brokerage commissions and other expenses connected with the execution of portfolio transactions, taxes, interest, distribution and service fees payable pursuant to a 12b-1 Plan, if any, and
108
Amplify ETF Trust
Board Considerations Regarding Approval of
Investment Management Agreement and Sub-Advisory Agreements
October 31, 2021 (Unaudited) (Continued)
extraordinary expenses. The Board concluded that the unitary investment management fee to be charged to the Fund is reasonable and appropriate in light of the services expected to be provided by the Adviser and Sub-Adviser. In conjunction with their review of the unitary investment management fee, the Trustees considered information provided by the Adviser and Sub-Adviser on their costs to be incurred in connection with the proposed Agreement and their estimated profitability and that any profitability would not be excessive. The Trustees concluded that the estimated profits to be realized by the Adviser and Sub-Adviser with respect to the Fund appeared to be reasonable.
Economies of Scale and Whether the Fee Level Reflects These Economies of Scale. The Trustees considered the information provided by the Adviser and the Sub-Adviser as to the extent to which economies of scale may be realized as the Fund grows and whether the fee level reflects economies of scale for the benefit of shareholders. The Trustees noted that any reduction in fixed costs associated with the management of the Fund would be enjoyed by the Adviser and Sub-Adviser, but that a unitary fee provides a level of certainty in expenses for the Fund. The Trustees considered whether the proposed advisory fee rate for the Fund is reasonable in relation to the projected asset size of the Fund. The Trustees noted the Adviser’s and Sub-Adviser’s views on their expectations for growth, noting that, initially, the Adviser did not anticipate any material economies of scale. The Trustees concluded that the flat investment management fee was reasonable and appropriate.
The Trustees noted that the Adviser and Sub-Adviser had not identified any further benefits that it would derive from its relationship with the Fund, and had noted that they will not, initially, have any soft dollar arrangements.
Based on all of the information considered and the conclusions reached, the Board, including the Independent Trustees, have determined to approve the Agreements for the Fund.
109
Amplify ETF Trust
Review of Liquidity Risk Management Program
October 31, 2021 (Unaudited)
Consistent with Rule 22e-4 under the Investment Company Act of 1940, as amended, Amplify ETF Trust ( the “Trust”), on behalf of each of its series (each a “Fund” and, collectively, the “Funds”), has established a liquidity risk management program to govern the Funds’ approach to managing liquidity risk (the “Program”). The Program is overseen by the Trust’s Chief Compliance Officer (the “Liquidity Risk Manager”). The Trust’s Board of Trustees (the “Board”) has approved the designation of the Liquidity Risk Manager to administer the Program.
The Program’s principal objectives include supporting the Funds’ compliance with limits on investments in illiquid assets and mitigating the risk that a Fund will be unable to meet its redemption obligations in a timely manner. The Program also includes a number of elements that support the management and assessment of liquidity risk, including an annual assessment of factors that influence each Fund’s liquidity and the periodic classification and re-classification of certain Funds’ investments into groupings that reflect the Liquidity Risk Manager’s assessment of their relative liquidity under current market conditions.
At a meeting of the Board held on June 8, 2021, the Trustees received a written report from the Liquidity Risk Manager regarding the design and operational effectiveness of the Program since its implementation. The Liquidity Risk Manager determined, and reported to the Board, that the Program is reasonably designed to assess and manage the Funds’ liquidity risk and has operated adequately and effectively to manage the Funds’ liquidity risk since implementation. The Liquidity Risk Manager reported that during the period covered by the report, there were no liquidity events that impacted the Funds or their ability to timely meet redemptions without dilution to existing shareholders. The Liquidity Risk Manager also noted no Fund has filed a Form N-LIQUID with the SEC.
The Liquidity Risk Manager noted that, with the exception of the Amplify BlackSwan Growth & Treasury Core ETF (“SWAN”), Amplify Seymour Cannabis ETF (“CNBS”), and Amplify BlackSwan ISWN ETF (“ISWN”), the Funds continue to qualify as “in-kind” ETFs under Rule 22e-4 and, as such, are exempt from the requirement to set a highly liquid investment minimum. The Liquidity Risk Manager noted that SWAN, CNBS, and ISWN are invested in highly liquid securities and, accordingly, continue to be exempt from the requirement to determine a “highly liquid investment minimum” as defined in the Rule. Because of that continued qualification for the exemption, the Funds have not adopted any “highly liquid investment” minimum amounts. The Liquidity Risk Manager further noted that no material changes have been made to the Program since its implementation.
There can be no assurance that the Program will achieve its objectives in the future. Please refer to the Funds’ prospectus for more information regarding each Fund’s exposure to liquidity risk and other principal risks to which an investment in a Fund may be subject.
110
Amplify ETF Trust
Disclosure of Fund Expenses
October 31, 2021 (Unaudited)
All Exchange Traded Funds (“ETF”) have operating expenses. As a shareholder of an ETF, your investment is affected by these ongoing costs and transaction fees, which include costs for ETF management and other Fund expenses. It is important for you to understand the impact of these costs on your investment returns.
Operating expenses such as these are deducted from an ETF’s gross income and directly reduce its final investment return. These expenses are expressed as a percentage of the ETF’s average net assets; this percentage is known as the ETF’s expense ratio.
The following examples use the expense ratio and are intended to help you understand the ongoing costs (in dollars) of investing in your fund and to compare these costs with those of other funds. The examples are based on investment of $1,000 made at the beginning of the period shown and held for the periods shown below.
The table below illustrates your fund’s costs in two ways:
ACTUAL FUND RETURN
This section helps you to estimate the actual expenses after fee waivers that your fund incurred over the period shown. “Expenses Paid During Period” shows the actual dollar expense cost incurred by a $1,000 investment in the Fund, and the “Ending Account Value” number is derived from deducting that expense cost from the Fund’s gross investment return.
You can use this information, together with the actual amount you invested in the Fund, to estimate the expenses you paid during the period. Simply divide your actual account value by $1,000 to arrive at a ratio (for example, an $8,600 account value divided by $1,000 = 8.6), then multiply that ratio by the number shown for your fund under “Expenses Paid During Period.”
HYPOTHETICAL 5% RETURN
This section helps you compare your fund’s costs with those of other funds. It assumes that the Fund had an annual 5% return before expenses during the year, but that the “Annualized Expense Ratio” for the period is unchanged. This example is useful in making comparisons because the Commission requires all funds to make this 5% calculation. You can assess your fund’s comparative cost by comparing the hypothetical result of your fund under “Expenses Paid During Period” with those that appear in the same charts in the shareholder reports for other funds.
NOTE: Because the return is set at 5% for comparison purposes – NOT your fund’s actual return – the account values shown may not apply to your specific investment.
YYY | | Beginning
Account Value
5/1/2021 | | Ending
Account Value
10/31/2021 | | Annualized
Expense Ratios | | Expenses
Paid During
Period(a) |
Actual Fund Return | | $ | 1,000.00 | | $ | 1,039.80 | | 0.50% | | $ | 2.57 |
Hypothetical 5% Return | | $ | 1,000.00 | | $ | 1,022.68 | | 0.50% | | $ | 2.55 |
IBUY | | Beginning
Account Value
5/1/2021 | | Ending
Account Value
10/31/2021 | | Annualized
Expense Ratios | | Expenses
Paid During
Period(a) |
Actual Fund Return | | $ | 1,000.00 | | $ | 883.70 | | 0.65% | | $ | 3.09 |
Hypothetical 5% Return | | $ | 1,000.00 | | $ | 1,021.93 | | 0.65% | | $ | 3.31 |
DIVO | | Beginning
Account Value
5/1/2021 | | Ending
Account Value
10/31/2021 | | Annualized
Expense Ratios | | Expenses
Paid During
Period(a) |
Actual Fund Return | | $ | 1,000.00 | | $ | 1,082.20 | | 0.55% | | $ | 2.89 |
Hypothetical 5% Return | | $ | 1,000.00 | | $ | 1,022.43 | | 0.55% | | $ | 2.80 |
111
Amplify ETF Trust
Disclosure of Fund Expenses
October 31, 2021 (Unaudited) (Continued)
BLOK | | Beginning
Account Value
5/1/2021 | | Ending
Account Value
10/31/2021 | | Annualized
Expense Ratios | | Expenses
Paid During
Period(a) |
Actual Fund Return | | $ | 1,000.00 | | $ | 1,044.40 | | 0.70% | | $ | 3.61 |
Hypothetical 5% Return | | $ | 1,000.00 | | $ | 1,021.68 | | 0.70% | | $ | 3.57 |
BATT | | Beginning
Account Value
5/1/2021 | | Ending
Account Value
10/31/2021 | | Annualized
Expense Ratios | | Expenses
Paid During
Period(a) |
Actual Fund Return | | $ | 1,000.00 | | $ | 1,227.20 | | 0.59% | | $ | 3.31 |
Hypothetical 5% Return | | $ | 1,000.00 | | $ | 1,022.23 | | 0.59% | | $ | 3.01 |
SWAN | | Beginning
Account Value
5/1/2021 | | Ending
Account Value
10/31/2021 | | Annualized
Expense Ratios | | Expenses
Paid During
Period(a) |
Actual Fund Return | | $ | 1,000.00 | | $ | 1,073.60 | | 0.49% | | $ | 2.56 |
Hypothetical 5% Return | | $ | 1,000.00 | | $ | 1,022.74 | | 0.49% | | $ | 2.50 |
XBUY | | Beginning
Account Value
5/1/2021 | | Ending
Account Value
10/31/2021 | | Annualized
Expense Ratios | | Expenses
Paid During
Period(a) |
Actual Fund Return | | $ | 1,000.00 | | $ | 810.40 | | 0.69% | | $ | 3.15 |
Hypothetical 5% Return | | $ | 1,000.00 | | $ | 1,021.73 | | 0.69% | | $ | 3.52 |
CNBS | | Beginning
Account Value
5/1/2021 | | Ending
Account Value
10/31/2021 | | Annualized
Expense Ratios | | Expenses
Paid During
Period(a) |
Actual Fund Return | | $ | 1,000.00 | | $ | 651.40 | | 0.75% | | $ | 3.12 |
Hypothetical 5% Return | | $ | 1,000.00 | | $ | 1,021.42 | | 0.75% | | $ | 3.82 |
JGLD | | Beginning
Account Value
5/1/2021 | | Ending
Account Value
10/31/2021 | | Annualized
Expense Ratios | | Expenses
Paid During
Period(a) |
Actual Fund Return | | $ | 1,000.00 | | $ | 924.50 | | 0.49% | | $ | 2.38 |
Hypothetical 5% Return | | $ | 1,000.00 | | $ | 1,022.74 | | 0.49% | | $ | 2.50 |
ISWN | | Beginning
Account Value
5/1/2021 | | Ending
Account Value
10/31/2021 | | Annualized
Expense Ratios | | Expenses
Paid During
Period(a) |
Actual Fund Return | | $ | 1,000.00 | | $ | 1,034.50 | | 0.49% | | $ | 2.51 |
Hypothetical 5% Return | | $ | 1,000.00 | | $ | 1,022.74 | | 0.49% | | $ | 2.50 |
DTOX | | Beginning
Account Value
6/23/2021(b) | | Ending
Account Value
10/31/2021 | | Annualized
Expense Ratios | | Expenses
Paid During
Period |
Actual Fund Return | | $ | 1,000.00 | | $ | 964.60 | | 0.59% | | $ | 2.06 | (c) |
Hypothetical 5% Return | | $ | 1,000.00 | | $ | 1,021.87 | | 0.59% | | $ | 2.96 | (a) |
112
Amplify ETF Trust
Disclosure of Fund Expenses
October 31, 2021 (Unaudited) (Continued)
MVPS | | Beginning
Account Value
7/20/2021(b) | | Ending
Account Value
10/31/2021 | | Annualized
Expense Ratios | | Expenses
Paid During
Period |
Actual Fund Return | | $ | 1,000.00 | | $ | 1,128.50 | | 0.49% | | $ | 1.47 | (d) |
Hypothetical 5% Return | | $ | 1,000.00 | | $ | 1,022.36 | | 0.49% | | $ | 2.46 | (a) |
BIDS | | Beginning
Account Value
9/21/2021(b) | | Ending
Account Value
10/31/2021 | | Annualized
Expense Ratios | | Expenses
Paid During
Period |
Actual Fund Return | | $ | 1,000.00 | | $ | 1,059.70 | | 0.59% | | $ | 0.67 | (e) |
Hypothetical 5% Return | | $ | 1,000.00 | | $ | 1,021.87 | | 0.59% | | $ | 2.96 | (a) |
113
Amplify ETF Trust
Trustees and Officers of the Trust
October 31, 2021 (Unaudited)
The following chart lists Trustees and Officers as of October 31, 2021.
Set forth below are the names, ages, addresses, position with the Trust, term of office and length of time served, the principal occupations during the past five years, number of portfolios in fund complex overseen by the trustees, and other directorships outside the fund complex of each of the persons currently serving as Trustees and Officers of the Trust. The Funds’ Statement of Additional Information (“SAI”) includes additional information about the Trustees and Officers. The SAI may be obtained without charge by calling 1-855-267-3837. Furthermore, you can obtain the SAI by accessing the Commission’s website at www.sec.gov or by accessing the Funds’ website at www.amplifyetfs.com.
Name, Address, and Year of Birth | | Position and
Offices with
the Trust | | Term of Office
and Year First
Elected or
Appointed | | Principal Occupations
During Past 5 Years | | Number of
Portfolios in
Fund Complex
Overseen By
Trustee | | Other Directorships
held by Trustee
During Past 5 Years |
Interested Trustees | | | | | | | | | | |
Christian Magoon(1)
c/o Amplify Investments LLC
310 S. Hale Street
Wheaton, IL 60187
Y.O.B.: 1974 | | Chairman of
the Board of
Trustees; Chief
Executive
Officer and
President | | Indefinite term
Since inception | | Chief Executive Officer,
Magoon Capital (2010 –
present); Chief Executive
Officer, YieldShares, LLC
(2013 – present); Chief
Executive Officer, Amplify Invesments LLC
(2015 – present); President, Amplify Investments LLC (2015 – 2018) | | 13 | | None |
John Phillips(2)
c/o Amplify Investments LLC
310 S. Hale Street
Wheaton, IL 60187
Y.O.B.: 1958 | | Secretary | | Indefinite term
Since inception | | Chief Operating Officer and
Head of Product Development,
Amplify Investments LLC (2015 – present) | | 13 | | None |
Independent Trustees | | | | | | | | | | |
Michael DiSanto
c/o Amplify Investments LLC
310 S. Hale Street
Wheaton, IL 60187
Y.O.B.: 1979 | | Trustee | | Indefinite term
Since inception | | Attorney, City of Naperville, Illinois (2007 – present); member, Elder board of the Compass Church, (2013 – present); | | 13 | | None |
Rick Powers
c/o Amplify Investments LLC
310 S. Hale Street
Wheaton, IL 60187
Y.O.B.: 1957 | | Trustee | | Indefinite term
Since inception | | Director, Department of Public Works, City of Peoria, Illinois (2019 – Present); Deputy Commissioner, Transportation, State of Indiana (2014 – 2019); | | 13 | | None |
Mark Tucker
c/o Amplify Investments LLC
310 S. Hale Street
Wheaton, IL 60187
Y.O.B.: 1963 | | Trustee | | Indefinite term Since inception | | Sole member, Aspen Equity
Partners, LLC (2009 – present);
New Liberty Popcorn, LLC
(2015 – present) | | 13 | | None |
114
Amplify ETF Trust
Trustees and Officers of the Trust
October 31, 2021 (Unaudited) (Continued)
Name, Address, and Year of Birth | | Position and
Offices with
the Trust | | Term of Office
and Year First
Elected or
Appointed | | Principal Occupations
During Past 5 Years | | Other Directorships
Held |
Officers | | | | | | | | |
Ed Keiley
c/o Amplify Investments LLC
310 S. Hale Street
Wheaton, IL 60187
Y.O.B.: 1965 | | Chief Compliance Officer | | Indefinite term
Since inception | | Chief Compliance Officer, Amplify
Investments LLC (2016 – present); Trader
Compliance, Inc. (2003 – present) | | N/A |
Bradley H. Bailey
c/o Amplify Investments LLC
310 S. Hale Street
Wheaton, IL 60187
Y.O.B.: 1967 | | Chief Financial
Officer | | Indefinite term
2016 | | Chief Financial Officer, Amplify Investments LLC
(2016 – present) | | N/A |
William H. Belden
c/o Amplify Investments LLC
310 South Hale Street
Wheaton, IL 60187
Y.O.B.: 1965 | | Vice President | | Indefinite term
2020 | | President, Amplify Investments LLC
(2018 – present); Managing Director,
Guggenheim Investments (2009 – 2018) | | N/A |
115
Amplify ETF Trust
Additional Information
October 31, 2021 (Unaudited)
Qualified Dividend Income/Dividends Received Deduction
For the fiscal year/period ended October 31, 2021, certain dividends paid by the Funds may be subject to a maximum tax rate of 23.8%, as provided for by the Jobs and Growth Tax Relief Reconciliation Act of 2003.
The percentage of dividends declared from ordinary income designated as qualified dividend income was as follows:
| | | | |
YYY | | 6.81% | |
IBUY | | 100.00% | |
DIVO | | 40.00% | |
BLOK | | 18.86% | |
BATT | | 53.70% | |
SWAN | | 00.00% | |
XBUY | | 00.00% | |
CNBS | | 26.42% | |
JGLD | | 00.00% | |
ISWN | | 00.00% | |
DTOX | | 00.00% | |
MVPX | | 00.00% | |
BIDS | | 00.00% | |
For corporate shareholders, the percent of ordinary income distributions qualifying for the corporate dividends received deduction for the fiscal year/period ended October 31, 2021 was as follows:
| | | | |
YYY | | 0.26% | |
IBUY | | 100.00% | |
DIVO | | 39.37% | |
BLOK | | 5.85% | |
BATT | | 1.67% | |
SWAN | | 00.00% | |
XBUY | | 00.00% | |
CNBS | | 23.49% | |
JGLD | | 00.00% | |
ISWN | | 00.00% | |
DTOX | | 00.00% | |
MVPX | | 00.00% | |
BIDS | | 00.00% | |
116
Amplify ETF Trust
Additional Information
October 31, 2021 (Unaudited) (Continued)
Short Term Capital Gains
The percentage of taxable ordinary income distributions that are designated as short-term capital gain distributions under Internal Revenue Section 871(k)(2)(C) for each fund were as follows:
| | | | |
YYY | | 00.00% | |
IBUY | | 00.00% | |
DIVO | | 70.64% | |
BLOK | | 00.00% | |
BATT | | 00.00% | |
SWAN | | 80.48% | |
XBUY | | 00.00% | |
CNBS | | 00.00% | |
JGLD | | 00.00% | |
ISWN | | 00.00% | |
DTOX | | 00.00% | |
MVPX | | 00.00% | |
BIDS | | 00.00% | |
Foreign Tax Credit Pass Through
Pursuant to Section 853 of the Internal Revenue Code, the Fund designates the following amount as foreign taxes paid for the period ended October 31, 2020. Foreign taxes paid for purposes of Section 853 may be less than actual foreign taxes paid for financial statement purposes.
| | Credible Foreign
Taxes Paid | | Per Share
Amount | | Portion of Ordinary
Income Distribution
Derived from Foreign
Sourced Income |
BATT | | $ | 148,438 | | $ | 0.2056 | | 98.93% |
JGLD | | $ | 1,879 | | $ | 0.2142 | | 97.53% |
Foreign taxes paid or withheld should be included in taxable income with an offsetting deduction from gross income or as a credit for taxes paid to foreign governments.
Above figures may differ from those cited elsewhere in this report due to difference in the calculation of income and gains under GAAP purposes and Internal Revenue Service purposes.
Shareholders are strongly advised to consult their own tax advisers with respect to the tax consequences of their investments in the Funds.
117
Amplify ETF Trust
Supplemental Information
October 31, 2021 (Unaudited)
DISTRIBUTION OF PREMIUMS AND DISCOUNTS
NAV is the price per share at which the Fund issues and redeems shares. It is calculated in accordance with the standard formula for valuing mutual fund shares. The “Market Price” of the Fund generally is determined using the composite closing price each day. The Fund’s Market Price may be at, above or below its NAV. The NAV of the Fund will fluctuate with changes in the market value of the Fund’s holdings. The Market Price of the Fund will fluctuate in accordance with changes in its NAV, as well as market supply and demand.
Premiums or discounts are the differences (expressed as a percentage) between the NAV and Market Price of the Fund on a given day, generally at the time NAV is calculated. A premium is the amount that the Fund is trading above the reported NAV, expressed as a percentage of the NAV. A discount is the amount that the Fund is trading below the reported NAV, expressed as a percentage of the NAV.
Further information regarding premiums and discounts is available, without charge, on the Fund’s website at www.amplifyetfs.com.
INFORMATION ABOUT THE TRUSTEES
The Statement of Additional Information (“SAI”) includes additional information about the Fund’s Trustees and is available without charge, upon request, by calling 1-855-267-3837. Furthermore, you can obtain the SAI by accessing the Commission’s website at www. sec.gov or by accessing the Fund’s website at www.amplifyetfs.com.
DELIVERY OF SHAREHOLDER DOCUMENTS—HOUSEHOLDING
Householding is an option available to certain investors of the Fund. Householding is a method of delivery, based on the preference of the individual investor, in which a single copy of certain shareholder documents can be delivered to investors who share the same address, even if their accounts are registered under different names. Householding for the Fund is available through certain broker-dealers. If you are interested in enrolling in householding and receiving a single copy of the prospectus and other shareholder documents, please contact your broker-dealer. If you currently are enrolled in householding and wish to change your householding status, please contact your broker-dealer.
118
Amplify ETF Trust
Privacy Policy
October 31, 2021 (Unaudited)
AMPLIFY ETFS AND AMPLIFY AFFILIATES PRIVACY POLICY
Amplify recognizes the importance of protecting your personal and financial information when you visit our websites (each a “Website” and together “Websites”). This Policy is designed to help you understand the information collection practices on all Websites owned or operated by or on behalf of companies within the Amplify group of companies, including: Amplify Investments LLC, Amplify Development LLC, and Amplify Holding Company LLC. We are committed to:
(a) protecting the personal information you provide to us;
(b) telling you how we use the information we gather about you; and
(c) ensuring that you know why we intend to disclose your personal information.
CHANGES TO THIS PRIVACY POLICY
This Privacy Policy is dated January 1, 2016. Amplify reserves the right to amend this Privacy Policy at any time without notice, by updating this posting, in which case the date of the Policy will be revised. The current version of this Policy can be accessed from the link on the www.amplifyetfs.com homepage.
INFORMATION COLLECTION AND USE
Personally Identifiable Information: The personally identifiable information you submit to our Websites is used to service your interest and to improve our services to you and/or to provide you with information on Amplify products and services. The types of personal information that may be collected at our Websites include: name, address, email address and telephone number. We will not sell, share or rent your personally identifiable information to others in contravention of this Privacy Policy.
Additionally, if the Website is a password protected site, then (a) once you submit your password and enter, the Website will recognize who you are and will collect all information that you submit, including all electronic instructions (including all transaction information), and (b) any information collected about you from the Website may be associated with other identifying information that we have about you.
Aggregate Information: We generally record certain usage information, such as the number and frequency of visitors to our Websites. This information may include the websites that you access immediately before and after your visit to our Websites, the Internet browser you are using and your IP address. If we use such data at all it will be on an aggregate basis, and we will not disclose to third parties any information that could be used to identify you personally.
Service Providers: We may use internal or external service providers to operate our Websites and employ other persons to perform work on our behalf, such as sending postal mail and e-mail. These persons may have access to the personally identifiable information you submit through the Websites, but only for the purpose of performing their duties. These personnel may not use your personally identifiable information for any other purpose.
Compliance with Laws: We do not automatically collect personally identifiable information from visitors to our Websites, except to the extent we are required to do so pursuant to some statute or regulation applicable to us. We will not provide any personally identifiable information to any other persons, except if we are required to make disclosures by any law, any government or private parties in connection with a lawsuit, subpoena, investigation or similar proceeding.
E-mail and Marketing: Amplify does not sell its customers’ e-mail addresses, nor will we provide your personal information to third parties for their marketing purposes. Amplify will not send you e-mail messages without first receiving your permission, unless it relates to servicing your account or unless you have consented to receiving electronic delivery of fund documents as part of our E-Delivery service. It is our policy to include instructions for unsubscribing from these permission-based programs. We recommend that you do not send us any individual personal information via non secure methods of correspondence, including via public electronic communication channels, such as Internet e-mail, which are generally not secure.
119
Amplify ETF Trust
Privacy Policy
October 31, 2021 (Unaudited) (Continued)
Business Transfers: If the business, stock or assets of Amplify are acquired or merged with another business entity, we will share all or some of your information with this entity to continue to provide our service to you. You will receive notice of such an event and the new entity will inform you of any changes to the practices in this Privacy Policy. If the new entity wishes to make additional use of your information, you may decline such use at such time.
Disclosure to Third Parties: The personal information you provide to us will only be disclosed to third parties if we have your permission, or as set out in this Privacy Policy. We may disclose details about the general use of our Websites to third parties – for example, to demonstrate patterns of use to advertisers and other business partners. Information we pass on for this purpose will not include any personal information by which you may be identified. We endeavor to prevent unauthorized disclosures of your personal information by third parties but we are not responsible for any unauthorized disclosures or other breaches of security or for the actions of others if the information was passed to them with your authority or with the authority of anyone other than us or our group companies.
COOKIES
What are Cookies?
Cookies are small text files that are stored in your computer’s memory and hard drive when you visit certain web pages. They are used to enable websites to function or to provide information to the owners of a website.
Why Do We Use Cookies?
Cookies help us to provide customized services and information. We use cookies on all our Websites to tell us, in general terms, how and when pages in our Websites are visited, what our users’ technology preferences are – such as what type of video player they use – and whether our Websites are functioning properly.
If you are using one of our password-protected sites, then the website may use cookies or other technology to help us authenticate you, store and recognize your configuration and user attributes, facilitate your navigation of the website and customize its content so that the information made available is likely to be of more interest to you.
In broad terms, we use cookies on our Websites for the following purposes:
• Analytical purposes: Analytical cookies allow us to recognize measure and track visitors to our Websites. This helps us to improve and develop the way our Websites work, for example, by determining whether site visitors can find information easily, or by identifying the aspects of websites that are of the most interest to them.
• Usage preferences: Some of the cookies on our Websites are activated when visitors to our sites make a choice about their usage of the site. Our Websites then ‘remember’ the settings preferences of the user concerned. This allows us to tailor aspects of our sites to the individual user.
• Terms and conditions: We use cookies on our Websites to record when a site visitor has seen a policy, such as this one, or provided consent, such as consent to the terms and conditions on our Websites. This helps to improve the user’s experience of the site – for example, it avoids a user from repeatedly being asked to consent to the same terms.
• Session management: The software that runs our websites uses cookies for technical purposes needed by the internal workings of our servers. For instance, we use cookies to distribute requests among multiple servers, authenticate users and determine what features of the site they can access, verify the origin of requests, keep track of information about a user’s session and determine which options or pages to display in order for the site to function.
• Functional purposes: Functional purpose cookies store information that is needed by our applications to process and operate. For example, where transactions or requests within an application involve multiple workflow stages, cookies are used to store the information from each stage temporarily, in order to facilitate completion of the overall transaction or request.
120
Amplify ETF Trust
Privacy Policy
October 31, 2021 (Unaudited) (Continued)
Further Information About Cookies
If you would like to find out more about cookies in general and how to manage them, please visit www.allaboutcookies.org.
THIRD PARTY WEBSITES
Amplify disclaims responsibility for the privacy policies and customer information practices of third party internet websites hyperlinked from our Website or this Privacy Policy.
SECURITY
Amplify protects your personal information when you transact business on our Website by requiring the use of a browser software program that supports industry standard SSL encryption with 128-bit key lengths. The “128-bit” designation refers to the length of the key used to encrypt the data being transmitted, with a longer key representing a higher level of security.
CONTACT US
We welcome inquiries or comments about our Privacy Policy and any queries or concerns about Amplify ETFs at support@amplifyetfs.com or 1-855-267-3837.
121
Investment Adviser:
Amplify Investments LLC
310 S. Hale Street
Wheaton, IL 60187
Investment Sub-Advisers: |
Penserra Capital Management, LLC
4 Orinda Way, Suite 100-A
Orinda, CA 94563 | | | | Capital Wealth Planning
1016 Collier Center Way
Naples, FL 34110 |
Toroso Investments, LLC
623 5th Avenue, Suite 15
New York, NY 10019 | | | | ARGI Investments, LLC
2201 High Wickham Place
Louisville, KY 40245 |
Legal Counsel:
Chapman and Cutler LLP
111 West Monroe Street
Chicago, IL 60603
Independent Registered Public Accounting Firm:
Cohen & Company, Ltd.
342 North Water Street, Suite 830
Milwaukee, WI 53202
Distributor:
Foreside Fund Services, LLC
Three Canal Plaza, Suite 100
Portland, ME 04101
Administrator:
U.S. Bancorp Fund Services, LLC
777 East Wisconsin Avenue
Milwaukee, WI 53202
Transfer Agent:
U.S. Bancorp Fund Services, LLC
615 East Michigan Street
Milwaukee, WI 53202
Custodians: |
| | | U.S. Bank National Association
1555 North RiverCenter Drive, Suite 302
Milwaukee, WI 53212 | | Cowen Execution Services, LLC
599 Lexington Avenue, 21st Floor
New York, NY 10022 | | |
This information must be preceded or accompanied by a current prospectus for the Funds.
Item 2. Code of Ethics.
The registrant has adopted a code of ethics that applies to the registrant’s principal executive officer and principal financial officer. The registrant has not made any substantive amendments to its code of ethics during the period covered by this report. The registrant has not granted any waivers from any provisions of the code of ethics during the period covered by this report.
A copy of the registrant’s Code of Ethics is filed herewith.
Item 3. Audit Committee Financial Expert.
The registrant’s board of trustees has determined that there is at least one audit committee financial expert serving on its audit committee. Mark Tucker is the “audit committee financial expert” and is considered to be “independent” as each term is defined in Item 3 of Form N-CSR.
Item 4. Principal Accountant Fees and Services.
The registrant has engaged its principal accountant to perform audit services, audit-related services, tax services and other services during the past two fiscal years. “Audit services” refer to performing an audit of the registrant's annual financial statements or services that are normally provided by the accountant in connection with statutory and regulatory filings or engagements for those fiscal years. “Audit-related services” refer to the assurance and related services by the principal accountant that are reasonably related to the performance of the audit. “Tax services” refer to professional services rendered by the principal accountant for tax compliance, tax advice, and tax planning. There were no “other services” provided by the principal accountant. The following table details the aggregate fees billed or expected to be billed for each of the last two fiscal years for audit fees, audit-related fees, tax fees and other fees by the principal accountant.
| | FYE 10/31/2021 | FYE 10/31/2020 |
| Audit Fees | $145,000 | $132,500 |
| Audit-Related Fees | $0 | $0 |
| Tax Fees | $31,000 | $28,000 |
| All Other Fees | N/A | N/A |
(e)(1) The audit committee has adopted pre-approval policies and procedures that require the audit committee to pre-approve all audit and non-audit services of the registrant, including services provided to any entity affiliated with the registrant.
(e)(2) The percentage of fees billed by Cohen & Company, Ltd. applicable to non-audit services pursuant to waiver of pre-approval requirement were as follows:
| | FYE 10/31/2021 | FYE 10/31/2020 |
| Audit-Related Fees | 0% | 0% |
| Tax Fees | 0% | 0% |
| All Other Fees | 0% | 0% |
(f) All of the principal accountant’s hours spent on auditing the registrant’s financial statements were attributed to work performed by full-time permanent employees of the principal accountant.
(g) The following table indicates the non-audit fees billed or expected to be billed by the registrant’s accountant for services to the registrant and to the registrant’s investment adviser (and any other controlling entity, etc.—not sub-adviser) for the last two years.
| Non-Audit Related Fees | FYE 12/31/2021 | FYE 12/31/2020 |
| Registrant | $31,000 | $28,000 |
| Registrant’s Investment Adviser | $0 | $0 |
The registrant has not been identified by the U.S. Securities and Exchange Commission as having filed an annual report issued by a registered public accounting firm branch or office that is located in a foreign jurisdiction where the Public Company Accounting Oversight Board is unable to inspect or completely investigate because of a position taken by an authority in that jurisdiction.
The registrant is not a foreign issuer.
Item 5. Audit Committee of Listed Registrants.
The registrant is an issuer as defined in Rule 10A-3 under the Securities Exchange Act of 1934, (the “Act”) and has a separately-designated standing audit committee established in accordance with Section 3(a)(58)(A) of the Act. The independent members of the committee are as follows: Michael DiSanto, Rick Powers, and Mark Tucker
Item 6. Investments.
Schedule of Investments is included as part of the report to shareholders filed under Item 1 of this Form.
Item 7. Disclosure of Proxy Voting Policies and Procedures for Closed-End Management Investment Companies.
Not applicable to open-end investment companies.
Item 8. Portfolio Managers of Closed-End Management Investment Companies.
Not applicable to open-end investment companies.
Item 9. Purchases of Equity Securities by Closed-End Management Investment Company and Affiliated Purchasers.
Not applicable to open-end investment companies.
Item 10. Submission of Matters to a Vote of Security Holders.
There have been no material changes to the procedures by which shareholders may recommend nominees to the registrant’s board of trustees.
Item 11. Controls and Procedures.
| (a) | The Registrant’s President/Principal Executive Officer and Principal Financial Officer have reviewed the Registrant's disclosure controls and procedures (as defined in Rule 30a-3(c) under the Investment Company Act of 1940 (the “Act”)) as of a date within 90 days of the filing of this report, as required by Rule 30a-3(b) under the Act and Rules 13a-15(b) or 15d-15(b) under the Securities Exchange Act of 1934. Based on their review, such officers have concluded that the disclosure controls and procedures are effective in ensuring that information required to be disclosed in this report is appropriately recorded, processed, summarized and reported and made known to them by others within the Registrant and by the Registrant’s service provider. |
| (b) | There were no changes in the Registrant's internal control over financial reporting (as defined in Rule 30a-3(d) under the Act) that occurred during the period covered by this report that have materially affected, or are reasonably likely to materially affect, the Registrant's internal control over financial reporting. |
Item 12. Disclosure of Securities Lending Activities for Closed-End Management Investment Companies
Not applicable to open-end investment companies.
Item 13. Exhibits.
(2) A separate certification for each principal executive officer and principal financial officer pursuant to Section 302 of the Sarbanes-Oxley Act of 2002. Filed herewith.
(3) Any written solicitation to purchase securities under Rule 23c-1 under the Act sent or given during the period covered by the report by or on behalf of the registrant to 10 or more persons. Not applicable to open-end investment companies.
| (4) | Change in the registrant’s independent public accountant. There was no change in the registrant’s independent public accountant for the period covered by this report. |
SIGNATURES
Pursuant to the requirements of the Securities Exchange Act of 1934 and the Investment Company Act of 1940, the registrant has duly caused this report to be signed on its behalf by the undersigned, thereunto duly authorized.
| (Registrant) | Amplify ETF Trust | |
| By (Signature and Title) | /s/ Christian Magoon | |
| | Christian Magoon,
President and Chief Executive Officer | |
Pursuant to the requirements of the Securities Exchange Act of 1934 and the Investment Company Act of 1940, this report has been signed below by the following persons on behalf of the registrant and in the capacities and on the dates indicated.
| By (Signature and Title) | /s/ Christian Magoon | |
| | Christian Magoon,
President and Chief Executive Officer | |
| By (Signature and Title) | /s/ Bradley H. Bailey | |
| | Bradley H. Bailey,
Chief Financial Officer | |
* Print the name and title of each signing officer under his or her signature.