UNITED STATES
SECURITIES AND EXCHANGE COMMISSION
Washington, D.C. 20549
FORM N-CSR
CERTIFIED SHAREHOLDER REPORT OF REGISTERED
MANAGEMENT INVESTMENT COMPANIES
Investment Company Act file number 811-23108
Amplify ETF Trust
(Exact name of registrant as specified in charter)
310 South Hale Street
Wheaton, IL 60187
(Address of principal executive offices) (Zip code)
Christian Magoon
Amplify ETF Trust
310 South Hale Street
Wheaton, IL 60187
(Name and address of agent for service)
With copies to:
Morrison C. Warren, Esq.
Chapman and Cutler LLP
111 West Monroe Street
Chicago, IL 60603
(855)-267-3837
Registrant's telephone number, including area code
Date of fiscal year end: October 31
Date of reporting period: October 31, 2018
Item 1. Reports to Stockholders.

AMPLIFY ETF TRUST Amplify Online Retail ETF IBUY Amplify YieldShares CWP Dividend & Option Income ETF DIVO Amplify Transformational Data Sharing ETF BLOK Amplify Advanced Battery Metals and Materials ETF BATT Amplify EASI Tactical Growth ETF EASI |
ANNUAL REPORT
October 31, 2018
Amplify ETF Trust
Table of Contents
MARKET PERFORMANCE | 2 |
FUND PERFORMANCE | 4 |
SCHEDULES OF INVESTMENTS | 9 |
STATEMENTS OF ASSETS AND LIABILITIES | 16 |
STATEMENTS OF OPERATIONS | 17 |
STATEMENTS OF CHANGES IN NET ASSETS | 18 |
FINANCIAL HIGHLIGHTS | 23 |
NOTES TO THE FINANCIAL STATEMENTS | 28 |
REPORT OF INDEPENDENT REGISTERED PUBLIC ACCOUNTING FIRM | 42 |
BOARD CONSIDERATIONS REGARDING APPROVAL OF INVESTMENT MANAGEMENT AGREEMENT AND SUB-ADVISORY AGREEMENT | 43 |
DISCLOSURE OF FUND EXPENSES | 51 |
TRUSTEES AND OFFICERS OF THE TRUST | 53 |
ADDITIONAL INFORMATION | 55 |
SUPPLEMENTAL INFORMATION | 56 |
PRIVACY POLICY | 57 |
Amplify ETF Trust (the “Trust”) files its complete schedule of fund holdings with the Securities and Exchange Commission (the “Commission”) for the first and third quarters of each fiscal year on Form N-Q within sixty days after the end of the period. The Trust’s Form N-Qs are available on the Commission’s website at www.sec.gov, and may be reviewed and copied at the Commission’s Public Reference Room in Washington, DC. Information on the operation of the Public Reference Room may be obtained by calling 1-800-SEC-0330.
A description of the policies and procedures that Amplify Investments, LLC (the “Adviser”) uses to determine how to vote proxies relating to portfolio securities, as well as information relating to how a fund voted proxies relating to portfolio securities during the most recent 12-month period ended June 30, is available (i) without charge, upon request, by calling 1-855-267-3837 and (ii) on the Commission’s website at www.sec.gov.
1
Amplify ETF Trust
Market Performance
October 31, 2018 (Unaudited)
From the beginning of 2018 through the end of November 2018, U.S. stock investors have been on a roller coaster ride. The Dow Jones Industrial Average, the S&P 500 and the NASDAQ 100 posted returns of -.74%, -.83% and 2.56% respectively through the first 11 months of the year as of November 26th. These numbers are in stark contrast to most of the year, where index returns were double digits as recently as September. So, what happened? Fear and uncertainty began to creep into the market as two main concerns dominated: a potential trade war with China, and the Federal Reserve’s actions and guidance on raising interest rates. While these two issues are complex, they both could quickly be resolved, which could help continue the streak of positive yearly equity markets returns investors have enjoyed for nearly a decade.
The negative impact of a potential tariff-fueled trade war with China began to rattle markets in late Summer and into the Fall, as the Trump administration’s posture on trade became more aggressive with Canada and China. While a trade deal with Canada was made late in the summer, China trade rhetoric continued to heat up. This very public trade dispute – often done through Twitter via President Donald Trump – dominated headlines in the summer and fall. Investors began to presume the worst and markets began to sell off in fear that restrictive tariffs would hurt stocks and overall GDP. Near the end of November and just before the G20 Summit, President Trump again delivered a hardline statement indicating there was little chance that planned tariffs on China goods beginning on January 1st would be avoided. Markets reacted to this rhetoric by trading lower.
While the prospects of a trade war roiled markets, the U.S. Federal Reserve continued its policy of raising interest rates. Despite general market recognition that historic low interest rate levels needed to end, the fear that the Federal Reserve could overshoot in pace and scale began to grow throughout the year. The main risk in that scenario was that a still-recovering U.S. economy could stall if monetary supply was tightened too quickly. This concern was also echoed by none other than President Trump in the early Fall as markets began to drop from year-to-date highs through November end. Looking forward, the Federal Reserve’s guidance on interest rate policy will continue to have significant impact on equity market sentiment. More dovish tones – a slower pace and scale of interest rate hikes – will be bullish for stocks. Hawkish tones, however, should continue to be a weight on stock valuations as the market doesn’t fully trust the Fed’s judgement.
Despite several major market concerns weighing on the stock market averages, there were some more positive segments of the U.S. equity market in the form of sector returns. The Health Care sector, 2017’s second-best performing sector, was the best performing sector in 2018, delivering a 9.5% return. Consumer Discretionary stocks returned 5.7% as both consumer confidence, unemployment and wage growth fueled the U.S. consumer. The historically defensive Utility sector delivered a modest 3.3% return as well. 2017’s best-performing sector, Technology, was also positive with a 2.5% return despite significant late-year pressure on valuations and the threat of increased regulatory scrutiny. Five sectors finished in the red in 2018 with Materials and Energy stocks losing the most at -10.9% and -10.2% respectively.
Heading into 2019, the market will seek more certainty on policies surrounding trade and interest rates. Will these issues resolve quickly or continue to dictate market sentiment for months to come? This is a question investors need to consider and be prepared for as normal market behavior like corrections and increased volatility could follow. Time will tell.
Past performance does not guarantee future results.
Investing involves risk; Principal loss is possible.
Fund holdings are subject to change and should not be considered a recommendation to buy or sell any security. Please see the Schedule of Investments for a complete list of Fund holdings.
Dow Jones Industrial Average: It is a price-weighted average of 30 significant stocks traded on the New York Stock Exchange (NYSE) and the NASDAQ.
S&P 500 Index: The S&P 500 is a market value weighted index and one of the common benchmarks for the U.S. stock market.
Nasdaq 100: An index composed of the 100 largest, most actively traded U.S companies listed on the Nasdaq stock exchange.
Cboe S&P 500 BuyWrite Index: It is a benchmark index designed to track the performance of a hypothetical buy-write strategy on the S&P 500 Index.
2
Amplify ETF Trust
Market Performance
October 31, 2018 (Unaudited) (Continued)
MSCI AC World Index Metals & Mining Index: It is composed of large and mid cap stocks across 23 Developed Markets countries and 24 Emerging Markets countries. All securities in the index are classified in the Metals & Mining industry (within the Materials sector) according to the Global Industry Classification Standard (GICS®).
MSCI AC World Index Net: It captures large and mid cap representation across 23 Developed Markets and 24 Emerging Markets countries. With 2,784 constituents, the index covers approximately 85% of the global investable equity opportunity set.
One cannot directly invest in an index.
3
Amplify ETF Trust
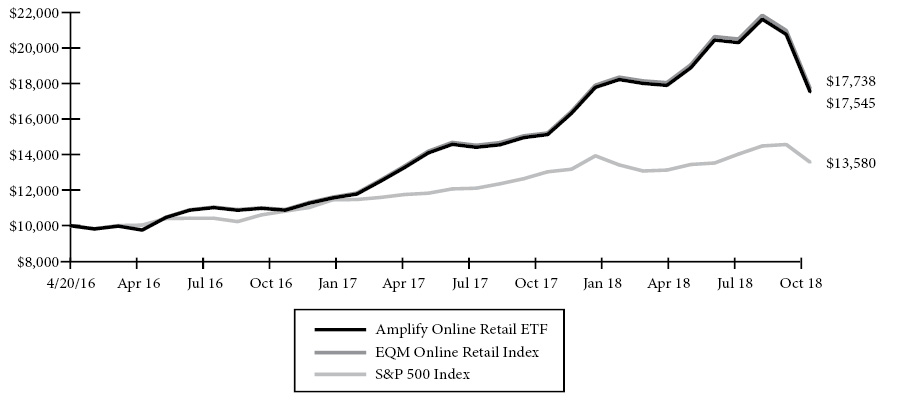
Amplify Online Retail ETF
Fund Performance
October 31, 2018 (Unaudited)
Growth of a $10,000 Investment
(at Net Asset Value)
| | ANNUALIZED RETURNS |
| | One Year | Inception to Date (a) |
| | Net Asset Value | Market Price | Net Asset Value | Market Price |
Amplify Online Retail ETF | 17.25% | 16.57% | 24.84% | 24.72% |
EQM Online Retail Index | 17.73% | 17.73% | 25.38% | 25.38% |
S&P 500 Index | 7.35% | 7.35% | 12.83% | 12.83% |
(a) | Fund commenced operations on April 19, 2016. |
The performance data quoted herein represents past performance and the return and value of an investment in the Fund will fluctuate so that shares, when redeemed or sold in the market, may be worth more or less than their original cost. Past performance is no guarantee of future performance and should not be considered as a representation of the future results of the Fund. The Fund’s performance assumes the reinvestment of all dividends and all capital gains. Index returns assume reinvestment of dividends and, unlike a Fund’s returns, do not reflect any fees or expenses. If such fees and expenses were included in the index returns, the performance would have been lower. Please note that one cannot invest directly in an unmanaged index.
There are no assurances that the Fund will meet its stated objectives.
The Fund’s holdings and allocations are subject to change and should not be considered recommendations to buy individual securities.
Returns shown do not reflect the deduction of taxes that a shareholder would pay on Fund distributions or the redemption of Fund shares.
4
Amplify ETF Trust
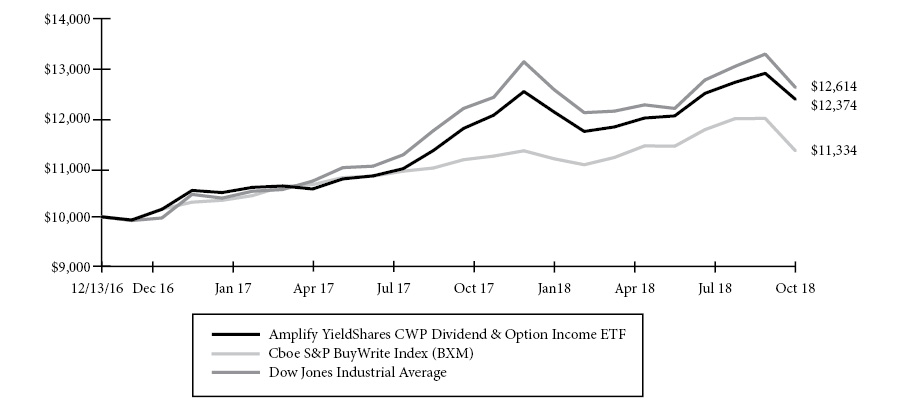
Amplify YieldShares CWP Dividend & Option Income ETF
Fund Performance
October 31, 2018 (Unaudited)
Growth of a $10,000 Investment
(at Net Asset Value)
| | ANNUALIZED RETURNS |
| | One Year | Inception to Date (a) |
| | Net Asset Value | Market Price | Net Asset Value | Market Price |
Amplify YieldShares CWP Dividend & Option Income ETF | 9.12% | 8.81% | 11.98% | 12.03% |
Cboe S&P 500 BuyWrite Index | 3.16% | 3.16% | 6.88% | 6.88% |
Dow Jones Industrial Average | 7.44% | 7.44% | 13.13% | 13.13% |
(a) | Fund commenced operations on December 13, 2016. |
The performance data quoted herein represents past performance and the return and value of an investment in the Fund will fluctuate so that shares, when redeemed or sold in the market, may be worth more or less than their original cost. Past performance is no guarantee of future performance and should not be considered as a representation of the future results of the Fund. The Fund’s performance assumes the reinvestment of all dividends and all capital gains. Index returns assume reinvestment of dividends and, unlike a Fund’s returns, do not reflect any fees or expenses. If such fees and expenses were included in the index returns, the performance would have been lower. Please note that one cannot invest directly in an unmanaged index.
There are no assurances that the Fund will meet its stated objectives.
The Fund’s holdings and allocations are subject to change and should not be considered recommendations to buy individual securities.
Returns shown do not reflect the deduction of taxes that a shareholder would pay on Fund distributions or the redemption of Fund shares.
5
Amplify ETF Trust
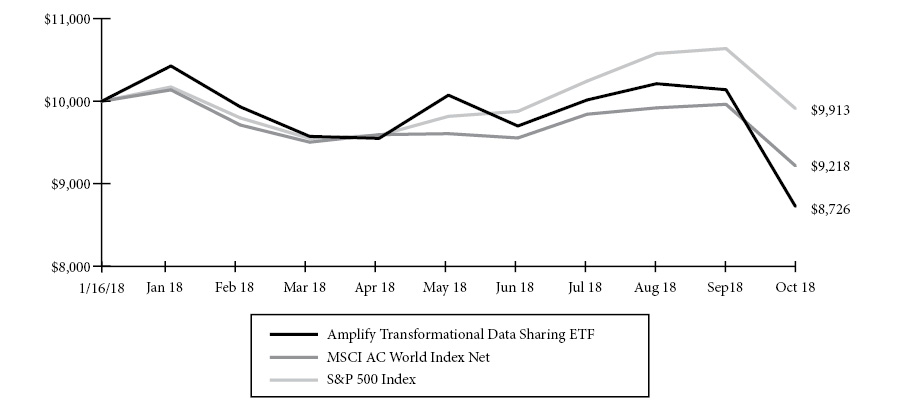
Amplify Transformational Data Sharing ETF
Fund Performance
October 31, 2018 (Unaudited)
Growth of a $10,000 Investment
(at Net Asset Value)
| | TOTAL RETURN FOR THE
PERIOD ENDED OCTOBER 31, 2018 |
| | Inception to Date (a) |
| | Net Asset Value | Market Price |
Amplify Transformational Data Sharing ETF | -12.74% | -12.75% |
MSCI AC World Index Net | -7.82% | -7.82% |
S&P 500 Index | -0.87% | -0.87% |
(a) | Fund commenced operations on January 16, 2018. |
The performance data quoted herein represents past performance and the return and value of an investment in the Fund will fluctuate so that shares, when redeemed or sold in the market, may be worth more or less than their original cost. Past performance is no guarantee of future performance and should not be considered as a representation of the future results of the Fund. The Fund’s performance assumes the reinvestment of all dividends and all capital gains. Index returns assume reinvestment of dividends and, unlike a Fund’s returns, do not reflect any fees or expenses. If such fees and expenses were included in the index returns, the performance would have been lower. Please note that one cannot invest directly in an unmanaged index.
There are no assurances that the Fund will meet its stated objectives.
The Fund’s holdings and allocations are subject to change and should not be considered recommendations to buy individual securities.
Returns shown do not reflect the deduction of taxes that a shareholder would pay on Fund distributions or the redemption of Fund shares.
6
Amplify ETF Trust
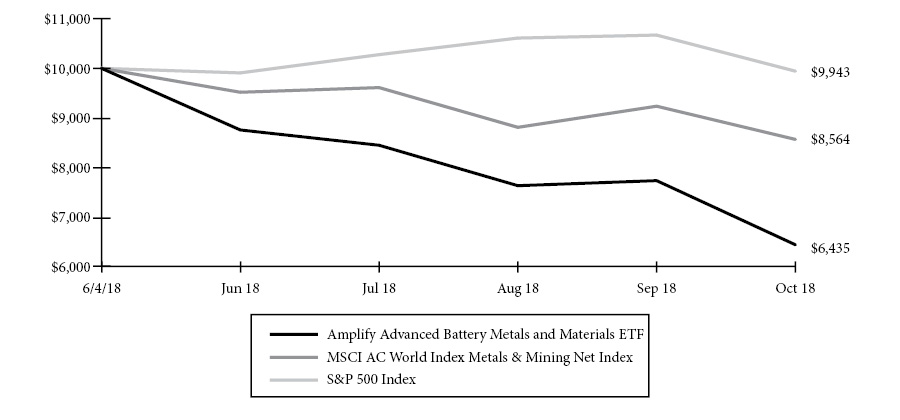
Amplify Advanced Battery Metals and Materials ETF
Fund Performance
October 31, 2018 (Unaudited)
Growth of a $10,000 Investment
(at Net Asset Value)
| | TOTAL RETURN FOR THE
PERIOD ENDED OCTOBER 31, 2018 |
| | Inception to Date (a) |
| | Net Asset Value | Market Price |
Amplify Advanced Battery Metals and Materials ETF | -35.65% | -35.56% |
MSCI AC World Index Metals & Mining Net Index | -14.36% | -14.36% |
S&P 500 Index | -0.57% | -0.57% |
(a) | Fund commenced operations on June 4, 2018. |
The performance data quoted herein represents past performance and the return and value of an investment in the Fund will fluctuate so that shares, when redeemed or sold in the market, may be worth more or less than their original cost. Past performance is no guarantee of future performance and should not be considered as a representation of the future results of the Fund. The Fund’s performance assumes the reinvestment of all dividends and all capital gains. Index returns assume reinvestment of dividends and, unlike a Fund’s returns, do not reflect any fees or expenses. If such fees and expenses were included in the index returns, the performance would have been lower. Please note that one cannot invest directly in an unmanaged index.
There are no assurances that the Fund will meet its stated objectives.
The Fund’s holdings and allocations are subject to change and should not be considered recommendations to buy individual securities.
Returns shown do not reflect the deduction of taxes that a shareholder would pay on Fund distributions or the redemption of Fund shares.
7
Amplify ETF Trust
Amplify EASI Tactical Growth ETF
Fund Performance
October 31, 2018 (Unaudited)
Growth of a $10,000 Investment
(at Net Asset Value)
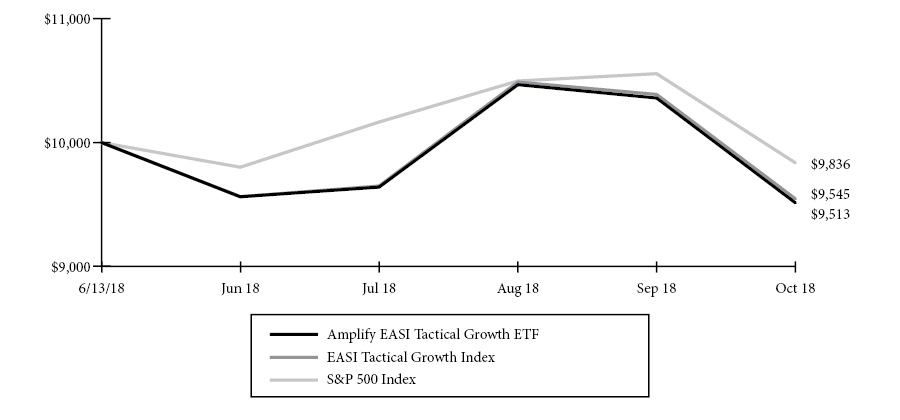
| | TOTAL RETURN FOR THE
PERIOD ENDED OCTOBER 31, 2018 |
| | Inception to Date (a) |
| | Net Asset Value | Market Price |
Amplify EASI Tactical Growth ETF | -4.87% | -4.87% |
EASI Tactical Growth Index | -4.55% | -4.55% |
S&P 500 Index | -1.64% | -1.64% |
(a) | Fund commenced operations on June 13, 2018 |
The performance data quoted herein represents past performance and the return and value of an investment in the Fund will fluctuate so that shares, when redeemed or sold in the market, may be worth more or less than their original cost. Past performance is no guarantee of future performance and should not be considered as a representation of the future results of the Fund. The Fund’s performance assumes the reinvestment of all dividends and all capital gains. Index returns assume reinvestment of dividends and, unlike a Fund’s returns, do not reflect any fees or expenses. If such fees and expenses were included in the index returns, the performance would have been lower. Please note that one cannot invest directly in an unmanaged index.
There are no assurances that the Fund will meet its stated objectives.
The Fund’s holdings and allocations are subject to change and should not be considered recommendations to buy individual securities.
Returns shown do not reflect the deduction of taxes that a shareholder would pay on Fund distributions or the redemption of Fund shares.
8
Amplify ETF Trust
Amplify Online Retail ETF
Schedule of Investments
October 31, 2018
Description | | Shares | | | Value | |
COMMON STOCKS — 99.9% | | | | | | | | |
Marketplace — 27.4% | | | | | | | | |
Alibaba Group Holding Ltd. - ADR (a) | | | 29,831 | | | $ | 4,244,355 | |
Copart, Inc. (a) | | | 247,438 | | | | 12,102,193 | |
Etsy, Inc. (a) | | | 427,250 | | | | 18,166,670 | |
GrubHub, Inc. (a) | | | 132,286 | | | | 12,268,204 | |
IAC/InterActiveCorp (a) | | | 98,698 | | | | 19,403,040 | |
Just Eat PLC (a) | | | 524,018 | | | | 4,069,704 | |
MercadoLibre, Inc. | | | 17,083 | | | | 5,543,433 | |
PayPal Holdings, Inc. (a) | | | 176,637 | | | | 14,871,069 | |
Rakuten, Inc. | | | 755,900 | | | | 5,118,160 | |
Shopify, Inc. (a) | | | 41,414 | | | | 5,721,344 | |
| | | | | | | | 101,508,172 | |
Traditional Retail — 57.5% | | | | | | | | |
1-800-Flowers.com, Inc. (a) | | | 1,075,692 | | | | 11,240,981 | |
Amazon.com, Inc. (a) | | | 8,241 | | | | 13,169,200 | |
ASKUL Corp. (b) | | | 176,800 | | | | 4,873,027 | |
ASOS PLC (a) | | | 69,929 | | | | 4,876,751 | |
Carvana Co. (a) (b) | | | 513,129 | | | | 19,883,749 | |
Cimpress NV (a) | | | 39,905 | | | | 4,987,726 | |
Ebay, Inc. (a) | | | 343,937 | | | | 9,984,491 | |
JD.com, Inc. - ADR (a) | | | 149,652 | | | | 3,519,815 | |
Lands' End, Inc. (a) | | | 661,734 | | | | 10,792,882 | |
Netflix, Inc. (a) | | | 40,814 | | | | 12,316,849 | |
Nutrisystem, Inc. | | | 390,695 | | | | 13,893,114 | |
Ocado Group PLC (a) | | | 746,684 | | | | 8,162,129 | |
Overstock.com, Inc. (a) (b) | | | 347,133 | | | | 6,984,316 | |
PetMed Express, Inc. | | | 383,433 | | | | 10,713,118 | |
Qurate Retail, Inc. (a) | | | 550,300 | | | | 12,073,582 | |
Shutterfly, Inc. (a) | | | 141,382 | | | | 7,069,100 | |
Stamps.com, Inc. (a) | | | 55,051 | | | | 11,129,661 | |
Stitch Fix, Inc. (a) (b) | | | 569,463 | | | | 15,011,045 | |
Vipshop Holdings Ltd. - ADR (a) | | | 357,961 | | | | 1,739,690 | |
Wayfair, Inc. (a) | | | 163,102 | | | | 17,988,520 | |
Zalando SE (a) (c) | | | 106,868 | | | | 4,139,684 | |
zooplus AG (a) | | | 26,153 | | | | 4,330,742 | |
ZOZO, Inc. | | | 175,800 | | | | 4,236,276 | |
| | | | | | | | 213,116,448 | |
Travel — 15.0% | | | | | | | | |
Booking Holdings, Inc. (a) | | | 5,991 | | | | 11,230,609 | |
Ctrip.com International Ltd. - ADR (a) | | | 136,907 | | | | 4,556,265 | |
Expedia Group, Inc. | | | 118,679 | | | | 14,885,907 | |
MakeMyTrip Ltd. (a) | | | 149,939 | | | | 3,716,988 | |
On the Beach Group PLC (c) | | | 691,843 | | | | 3,789,285 | |
TripAdvisor, Inc. (a) | | | 339,205 | | | | 17,686,148 | |
| | | | | | | | 55,865,202 | |
Total Common Stocks (Cost $400,378,181) | | | | | | | 370,489,822 | |
| | | | | | | | | |
MONEY MARKET FUNDS — 0.1% | | | | | | | | |
STIT-Government & Agency Portfolio - Institutional Class — 2.08% (d) | | | 353,823 | | | | 353,823 | |
Total Money Market Funds (Cost $353,823) | | | | | | | 353,823 | |
| | | | | | | | | |
INVESTMENTS PURCHASED WITH PROCEEDS FROM SECURITIES LENDING — 10.0% | | | | | | | | |
First American Government Obligations Fund, Class Y — 1.76%(d) | | | 37,029,545 | | | | 37,029,545 | |
Total Investments Purchased with Proceeds from Securities Lending (Cost $37,029,545) | | | | | | | 37,029,545 | |
| | | | | | | | | |
Total Investments — 110.0% | | | | | | | | |
(Cost $437,761,549) | | | | | | $ | 407,873,190 | |
Percentages are based on Net Assets of $370,631,895.
ADR - American Depositary Receipt
(a) | Non-income producing security. |
(b) | All or a portion of this security is out on loan as of October 31, 2018. Total value of securities out on loan is $36,962,401 or 10.0% of net assets. |
(c) | Security exempt from registration under Rule 144(a) and Regulation S of 1933. Such securities are treated as liquid securities, according to the Fund’s liqudity guidelines. At October 31, 2018 the value of these securities amounted to $7,928,969 or 2.1% of net assets. |
(d) | Seven-day yield as of October 31, 2018. |
For Fund compliance purposes, the Fund’s industry classifications refer to any one or more of the industry sub-classifications used by one or more widely recognized market indexes or ratings group indexes, and/or they may be defined Fund management. This definition may not apply for purposes of this report, which may combine sub-classifications for reporting ease. Industries are shown as a percentage of net assets.
The accompanying notes are an integral part of the financial statements.
9
Amplify ETF Trust
Amplify YieldShares CWP Dividend & Option Income ETF
Schedule of Investments
October 31, 2018
Description | | Shares | | | Value | |
COMMON STOCKS — 89.5% | | | | | | | | |
Communication Services — 2.9% | | | | | | | | |
Verizon Communications, Inc. | | | 8,100 | | | $ | 462,429 | |
| | | | | | | | | |
Consumer Discretionary — 8.5% | | | | | | | | |
McDonald's Corp. | | | 2,970 | | | | 525,393 | |
Walt Disney Co. | | | 7,000 | | | | 803,810 | |
| | | | | | | | 1,329,203 | |
Consumer Staples — 11.6% | | | | | | | | |
Philip Morris International, Inc. (a) | | | 6,165 | | | | 542,952 | |
Procter & Gamble Co. | | | 5,805 | | | | 514,787 | |
Walmart, Inc. | | | 7,610 | | | | 763,131 | |
| | | | | | | | 1,820,870 | |
Energy — 4.6% | | | | | | | | |
Chevron Corp. | | | 6,406 | | | | 715,230 | |
| | | | | | | | | |
Financials — 14.5% | | | | | | | | |
American Express Co. | | | 7,520 | | | | 772,530 | |
CME Group, Inc. | | | 2,975 | | | | 545,139 | |
Goldman Sachs Group, Inc. | | | 2,150 | | | | 484,545 | |
JPMorgan Chase & Co. | | | 4,400 | | | | 479,688 | |
| | | | | | | | 2,281,902 | |
Health Care — 13.6% | | | | | | | | |
Abbott Laboratories | | | 7,425 | | | | 511,879 | |
Johnson & Johnson | | | 5,750 | | | | 804,942 | |
UnitedHealth Group, Inc. | | | 3,105 | | | | 811,492 | |
| | | | | | | | 2,128,313 | |
Industrials — 11.7% | | | | | | | | |
Boeing Co. | | | 2,211 | | | | 784,595 | |
Caterpillar, Inc. | | | 4,800 | | | | 582,336 | |
CSX Corp. (a) | | | 6,725 | | | | 463,084 | |
| | | | | | | | 1,830,015 | |
Information Technology — 15.9% | | | | | | | | |
Cisco Systems, Inc. | | | 10,230 | | | | 468,023 | |
Microsoft Corp. | | | 7,200 | | | | 769,032 | |
QUALCOMM, Inc. | | | 7,160 | | | | 450,292 | |
Visa, Inc. (a) | | | 5,800 | | | | 799,530 | |
| | | | | | | | 2,486,877 | |
Materials — 3.0% | | | | | | | | |
Nucor Corp. | | | 8,065 | | | | 476,803 | |
| | | | | | | | | |
Utilities — 3.2% | | | | | | | | |
Duke Energy Corp. | | | 6,040 | | | | 499,085 | |
| | | | | | | | | |
Total Common Stocks (Cost $12,886,428) | | | | | | | 14,030,727 | |
| | | | | | | | | |
INVESTMENT COMPANIES — 7.3% | | | | | | | | |
SPDR Bloomberg Barclays 1-3 Month T-Bill ETF | | | 12,500 | | | | 1,144,875 | |
Total Investment Companies (Cost $1,144,250) | | | | | | | 1,144,875 | |
| | | | | | | | | |
MONEY MARKET FUNDS — 5.4% | | | | | | | | |
STIT-Government & Agency Portfolio - Institutional Class — 2.08% (b) | | | 843,454 | | | | 843,454 | |
Total Money Market Funds (Cost $843,454) | | | | | | | 843,454 | |
| | | | | | | | | |
Total Investments — 102.2% | | | | | | | | |
(Cost $14,874,132) | | | | | | $ | 16,019,056 | |
Percentages are based on Net Assets of $15,680,384.
(a) | All or part of this security is held as collateral for the options written. At October 31, 2018, the value of these securities amounted to $1,798,119 or 11.5% of net assets. |
(b) | Seven-day yield as of October 31, 2018. |
The Global Industry Classification Standard (GICS®) was developed by and/or is the exclusive property of MSCI, Inc. and Standard & Poor Financial Services LLC (“S&P”). GICS® is a service mark of MSCI, Inc. and S&P and has been licensed for use by the Fund’s Administrator, U.S. Bancorp Fund Services, LLC.
The accompanying notes are an integral part of the financial statements.
10
Amplify ETF Trust
Amplify YieldShares CWP Dividend & Option Income ETF
Schedule of Options Written
October 31, 2018
| | Contracts | | | Notional
Amount | | | Value | |
Call Options Written (a) — (0.1)% | | | | | | | | | | | | |
CSX Corp.,
Expires 11/16/2018, Strike Price $73.00 | | | 67 | | | $ | (466,253 | ) | | $ | (2,111 | ) |
Philip Morris International, Inc.,
Expires 11/16/2018, Strike Price $92.50 | | | 61 | | | | (538,935 | ) | | | (3,172 | ) |
Visa, Inc.,
Expires 11/23/2018, Strike Price $147.00 | | | 58 | | | | (816,814 | ) | | | (3,219 | ) |
Total Call Options Written | | | | | | | | | | | | |
(Premiums Received $9,424) | | | | | | | | | | $ | (8,502 | ) |
The accompanying notes are an integral part of the financial statements.
11
Amplify ETF Trust
Amplify Transformational Data Sharing ETF
Schedule of Investments
October 31, 2018
Description | | Shares | | | Value | |
COMMON STOCKS — 100.0% | | | | | | | | |
Banks — 5.8% | | | | | | | | |
Banco Santander SA - ADR | | | 183,012 | | | $ | 874,797 | |
BOC Hong Kong Holdings Ltd. | | | 296,246 | | | | 1,106,869 | |
JPMorgan Chase & Co. | | | 7,701 | | | | 839,563 | |
The Goldman Sachs Group, Inc. | | | 21,206 | | | | 4,779,196 | |
| | | | | | | | 7,600,425 | |
Commercial Services — 7.1% | | | | | | | | |
Hive Blockchain Technologies Ltd. (a) | | | 11,430,689 | | | | 4,211,238 | |
Square, Inc. (a) | | | 70,562 | | | | 5,182,779 | |
| | | | | | | | 9,394,017 | |
Computers — 6.4% | | | | | | | | |
Accenture PLC | | | 25,636 | | | | 4,040,747 | |
International Business Machines Corp. | | | 31,154 | | | | 3,596,106 | |
Seagate Technology PLC | | | 20,400 | | | | 820,692 | |
| | | | | | | | 8,457,545 | |
Diversified Financial Services — 17.7% | | | | | | | | |
American Express Co. | | | 8,013 | | | | 823,176 | |
Cboe Global Markets, Inc. | | | 6,644 | | | | 749,775 | |
CME Group, Inc. | | | 11,476 | | | | 2,102,862 | |
GAIN Capital Holdings, Inc. | | | 104,039 | | | | 794,858 | |
Galaxy Digital Holdings Ltd. (a) | | | 1,432,826 | | | | 2,176,803 | |
Hut 8 Mining Corp. (a) | | | 1,820,319 | | | | 4,037,625 | |
Intercontinental Exchange, Inc. | | | 10,122 | | | | 779,799 | |
Mastercard, Inc. | | | 2,657 | | | | 525,209 | |
Monex Group, Inc. | | | 649,704 | | | | 2,562,310 | |
Nasdaq, Inc. | | | 21,442 | | | | 1,859,236 | |
SBI Holdings, Inc. | | | 228,312 | | | | 5,991,331 | |
Visa, Inc. | | | 6,212 | | | | 856,324 | |
| | | | | | | | 23,259,308 | |
Internet — 29.8% | | | | | | | | |
Alibaba Group Holding Ltd. - ADR (a) | | | 8,299 | | | | 1,180,782 | |
Alphabet, Inc. (a) | | | 3,474 | | | | 3,788,675 | |
Baidu, Inc. - ADR (a) | | | 13,569 | | | | 2,578,924 | |
Digital Garage, Inc. | | | 256,350 | | | | 7,008,816 | |
Facebook, Inc. (a) | | | 4,422 | | | | 671,215 | |
GMO Internet, Inc. | | | 397,357 | | | | 5,676,780 | |
Kakao Corp. | | | 46,267 | | | | 3,719,062 | |
Overstock.com, Inc. (a) (b) | | | 290,310 | | | | 5,841,037 | |
Rakuten, Inc. | | | 261,428 | | | | 1,770,116 | |
Tencent Holdings Ltd. | | | 26,195 | | | | 891,878 | |
Xunlei Ltd. - ADR (a) | | | 335,936 | | | | 2,032,413 | |
Yahoo Japan Corp. | | | 1,307,848 | | | | 4,114,734 | |
| | | | | | | | 39,274,432 | |
Media — 1.4% | | | | | | | | |
Thomson Reuters Corp. | | | 40,166 | | | | 1,871,736 | |
| | | | | | | | | |
Semiconductors — 16.3% | | | | | | | | |
Advanced Micro Devices, Inc. (a) | | | 146,947 | | | | 2,675,905 | |
Global Unichip Corp. | | | 514,237 | | | | 3,489,958 | |
Intel Corp. | | | 67,953 | | | | 3,185,637 | |
NVIDIA Corp. | | | 13,958 | | | | 2,942,765 | |
QUALCOMM, Inc. | | | 13,439 | | | | 845,179 | |
Samsung Electronics Co. Ltd. | | | 57,992 | | | | 2,157,747 | |
Taiwan Semiconductor Manufacturing Co. Ltd. - ADR | | | 160,275 | | | | 6,106,477 | |
| | | | | | | | 21,403,668 | |
Software — 14.4% | | | | | | | | |
DocuSign, Inc. (a) | | | 19,809 | | | | 830,790 | |
Microsoft Corp. | | | 29,221 | | | | 3,121,095 | |
Nexon GT Co. Ltd. (a) | | | 338,957 | | | | 2,052,392 | |
Oracle Corp. | | | 78,780 | | | | 3,847,615 | |
Red Hat, Inc. (a) | | | 31,085 | | | | 5,335,429 | |
SAP SE - ADR | | | 35,486 | | | | 3,806,228 | |
| | | | | | | | 18,993,549 | |
Telecommunications — 1.1% | | | | | | | | |
Cisco Systems, Inc. | | | 31,525 | | | | 1,442,269 | |
| | | | | | | | | |
Total Common Stocks (Cost $161,338,894) | | | | | | | 131,696,949 | |
| | | | | | | | | |
MONEY MARKET FUNDS — 1.2% | | | | | | | | |
STIT-Government & Agency Portfolio - Institutional Class — 2.08% (c) | | | 1,607,129 | | | | 1,607,129 | |
Total Money Market Funds (Cost $1,607,129) | | | | | | | 1,607,129 | |
The accompanying notes are an integral part of the financial statements.
12
Amplify ETF Trust
Amplify Transformational Data Sharing ETF
Schedule of Investments
October 31, 2018 (Continued)
Description | | Shares | | | Value | |
INVESTMENTS PURCHASED WITH PROCEEDS FROM SECURITIES LENDING — 4.3% | | | | | | | | |
First American Government Obligations Fund, Class Y - 1.76%(c) | | | 5,713,289 | | | $ | 5,713,289 | |
Total Investments Purchased with Proceeds from Securities Lending (Cost $5,713,289) | | | | | | | 5,713,289 | |
| | | | | | | | | |
Total Investments — 105.5% | | | | | | | | |
(Cost $168,659,312) | | | | | | $ | 139,017,367 | |
Percentages are based on Net Assets of $131,762,147.
ADR - American Depositary Receipt
(a) | Non-income producing security. |
(b) | All or a portion of this security is out on loan as of October 31, 2018. Total value of securities out on loan is $5,607,384 or 4.3% of net assets. |
(c) | Seven-day yield as of October 31, 2018. |
For Fund compliance purposes, the Fund’s industry classifications refer to any one or more of the industry sub-classifications used by one or more widely recognized market indexes or ratings group indexes, and/or they may be defined Fund management. This definition may not apply for purposes of this report, which may combine sub-classifications for reporting ease. Industries are shown as a percentage of net assets.
The accompanying notes are an integral part of the financial statements.
13
Amplify ETF Trust
Amplify Advanced Battery Metals and Materials ETF
Schedule of Investments
October 31, 2018
Description | | Shares | | | Value | |
COMMON STOCKS — 98.1% | | | | | | | | |
Industrials — 5.8% | | | | | | | | |
AMG Advanced Metallurgical Group NV | | | 5,371 | | | $ | 257,208 | |
Clean TeQ Holdings Ltd. (a) (b) | | | 390,260 | | | | 116,072 | |
| | | | | | | | 373,280 | |
Materials — 92.3% | | | | | | | | |
African Rainbow Minerals Ltd. | | | 19,633 | | | | 166,207 | |
Albemarle Corp. | | | 1,416 | | | | 140,496 | |
Altura Mining Ltd. (a) | | | 625,891 | | | | 88,645 | |
Aneka Tambang Tbk | | | 3,522,881 | | | | 157,577 | |
Argosy Minerals Ltd. (a) | | | 999,421 | | | | 138,009 | |
Assore Ltd. | | | 7,540 | | | | 157,490 | |
AVZ Minerals Ltd. (a) | | | 1,271,871 | | | | 59,445 | |
China Molybdenum Co. Ltd. | | | 550,156 | | | | 204,153 | |
Cobalt 27 Capital Corp. (a) | | | 33,751 | | | | 133,317 | |
eCobalt Solutions, Inc. (a) | | | 264,011 | | | | 130,356 | |
Eramet | | | 1,290 | | | | 119,007 | |
First Quantum Minerals Ltd. | | | 14,561 | | | | 145,339 | |
FMC Corp. | | | 2,221 | | | | 173,416 | |
Freeport-McMoRan, Inc. | | | 14,690 | | | | 171,138 | |
Galaxy Resources Ltd. (a) (b) | | | 70,381 | | | | 109,150 | |
Glencore PLC | | | 56,901 | | | | 231,902 | |
Independence Group NL | | | 51,001 | | | | 145,910 | |
Jiangxi Ganfeng Lithium Co. Ltd. | | | 35,700 | | | | 120,807 | |
Jinchuan Group International Resources Co. Ltd. (a) | | | 1,064,530 | | | | 90,951 | |
Johnson Matthey PLC | �� | | 4,976 | | | | 189,092 | |
Katanga Mining Ltd. (a) | | | 394,807 | | | | 173,944 | |
Kidman Resources Ltd. (a) | | | 113,131 | | | | 80,114 | |
Lithium Americas Corp. (a) | | | 33,701 | | | | 115,200 | |
Lundin Mining Corp. | | | 50,990 | | | | 209,545 | |
Millennial Lithium Corp. (a) | | | 107,591 | | | | 130,765 | |
MMC Norilsk Nickel PJSC | | | 16,970 | | | | 281,363 | |
Nanjing Hanrui Cobalt Co Ltd. | | | 8,500 | | | | 91,129 | |
Nemaska Lithium, Inc. (a) | | | 170,001 | | | | 92,978 | |
Orocobre Ltd. (a) | | | 39,760 | | | | 93,760 | |
Pilbara Minerals Ltd. (a) | | | 248,831 | | | | 138,325 | |
Sherritt International Corp. (a) | | | 220,661 | | | | 93,866 | |
Sociedad Quimica y Minera de Chile SA - ADR | | | 4,705 | | | | 206,126 | |
South32 Ltd. | | | 101,081 | | | | 259,121 | |
Sumitomo Metal Mining Co. Ltd. | | | 6,661 | | | | 210,158 | |
Syrah Resources Ltd. (a) (b) | | | 102,760 | | | | 116,431 | |
Tawana Resources NL (a) | | | 496,045 | | | | 84,306 | |
Tawana Resources NL (a) (c) | | | 44,689 | | | | — | |
Tianqi Lithium Corp. | | | 27,100 | | | | 113,232 | |
Umicore SA | | | 4,420 | | | | 208,211 | |
Vale Indonesia Tbk PT (a) | | | 937,991 | | | | 180,163 | |
Western Areas Ltd. | | | 54,471 | | | | 86,791 | |
Zhejiang Huayou Cobalt Co. Ltd. | | | 21,400 | | | | 103,562 | |
| | | | | | | | 5,941,497 | |
Total Common Stocks (Cost $8,998,298) | | | | | | | 6,314,777 | |
| | | | | | | | | |
MONEY MARKET FUNDS — 1.9% | | | | | | | | |
STIT - Government & Agency Portfolio - Institutional Class — 2.08% (d) | | | 118,157 | | | | 118,157 | |
Total Money Market Funds (Cost $118,157) | | | | | | | 118,157 | |
| | | | | | | | | |
INVESTMENTS PURCHASED WITH PROCEEDS FROM SECURITIES LENDING — 8.7% | | | | | | | | |
First American Government Obligations Fund, Class Y - 1.76%(d) | | | 560,175 | | | | 560,175 | |
Total Investments Purchased with Proceeds from Securities Lending (Cost $560,175) | | | | | | | 560,175 | |
| | | | | | | | | |
Total Investments — 108.7% | | | | | | | | |
(Cost $9,676,630) | | | | | | $ | 6,993,109 | |
Percentages are based on Net Assets of $6,435,352.
ADR American Depositary Receipt
(a) | Non-income producing security. |
(b) | All or a portion of this security is out on loan as of October 31, 2018. Total value of securities out on loan is $298,411 or 4.6% of net assets. |
(c) | Illiquid security. At October 31, 2018, the value of this security amounted to $0.00 or 0.00% of net assets. |
(d) | Seven-day yield as of October 31, 2018. |
For Fund compliance purposes, the Fund’s industry classifications refer to any one or more of the industry sub-classifications used by one or more widely recognized market indexes or ratings group indexes, and/or they may be defined Fund management. This definition may not apply for purposes of this report, which may combine sub-classifications for reporting ease. Industries are shown as a percentage of net assets.
The accompanying notes are an integral part of the financial statements.
14
Amplify ETF Trust
Amplify EASI Tactical Growth ETF
Schedule of Investments
October 31, 2018
Description | | Shares | | | Value | |
INVESTMENT COMPANIES — 99.8% | | | | | | | | |
iShares Core U.S. Aggregate Bond ETF | | | 18,677 | | | $ | 1,953,427 | |
PIMCO Enhanced Short Maturity Active Exchange-Traded Fund (a) | | | 44,987 | | | | 4,569,779 | |
Vanguard Intermediate-Term Bond ETF | | | 24,503 | | | | 1,957,545 | |
Vanguard Short-Term Bond ETF (a) | | | 58,675 | | | | 4,573,130 | |
Total Investment Companies (Cost $13,034,284) | | | | | | | 13,053,881 | |
| | | | | | | | | |
MONEY MARKET FUNDS — 0.3% | | | | | | | | |
STIT-Government & Agency Portfolio - Institutional Class — 2.08% (b) | | | 34,742 | | | | 34,742 | |
Total Money Market Funds (Cost $34,742) | | | | | | | 34,742 | |
| | | | | | | | | |
Total Investments — 100.1% | | | | | | | | |
(Cost $13,069,026) | | | | | | $ | 13,088,623 | |
Percentages are based on Net Assets of $13,080,415.
(a) | Fair value of this security exceeds 25% of the Fund’s net assets. Additional information for this security, including the financial statements, is available from the SEC’s EDGAR database at www.sec.gov. |
(b) | Seven-day yield as of October 31, 2018. |
The accompanying notes are an integral part of the financial statements.
15
Amplify ETF Trust
Statements of Assets and Liabilities
October 31, 2018
| | | Amplify
Online
Retail ETF | | | Amplify
YieldShares
CWP Dividend
& Option
Income ETF | | | Amplify
Transformational
Data
Sharing ETF | | | Amplify
Advanced
Battery Metals
and Materials
ETF | | | Amplify
EASI Tactical
Growth ETF | |
Assets: | | | | | | | | | | | | | | | | | | | | |
Investments, at Cost | | $ | 437,761,549 | | | $ | 14,874,132 | | | $ | 168,659,312 | | | $ | 9,676,630 | | | $ | 13,069,026 | |
Foreign Currency, at Cost | | | 1,933 | | | | — | | | | — | | | | — | | | | — | |
Investments, at Fair Value | | $ | 407,873,190 | | | $ | 16,019,056 | | | $ | 139,017,367 | | | $ | 6,993,109 | | | $ | 13,088,623 | |
Foreign Currency, at Fair Value | | | 1,897 | | | | — | | | | — | | | | — | | | | — | |
Receivable for Investments Sold | | | 17,363,583 | | | | 679,804 | | | | 3,974,091 | | | | — | | | | — | |
Dividends and Interest Receivable | | | 27,722 | | | | 22,045 | | | | 177,463 | | | | 4,659 | | | | 424 | |
Securities Lending Income Receivable | | | 56,430 | | | | — | | | | 10,193 | | | | 1,995 | | | | 381 | |
Total Assets | | | 425,322,822 | | | | 16,720,905 | | | | 143,179,114 | | | | 6,999,763 | | | | 13,089,428 | |
| | | | | | | | | | | | | | | | | | | | | |
Liabilities: | | | | | | | | | | | | | | | | | | | | |
Options Written, at Value
(Premiums Received $0, $9,424, $0, $0, $0) | | | — | | | | 8,502 | | | | — | | | | — | | | | — | |
Payable for Investments Purchased | | | — | | | | 949,957 | | | | 1,256,923 | | | | — | | | | — | |
Payable for Distributions to Shareholders | | | — | | | | 71,138 | | | | — | | | | — | | | | — | |
Collateral Received for Securities Loaned (See Note 4) | | | 37,029,545 | | | | — | | | | 5,713,289 | | | | 560,175 | | | | — | |
Payable for Fund Shares Redeemed | | | 17,415,525 | | | | — | | | | 4,362,825 | | | | — | | | | — | |
Advisory Fees Payable, net of waiver, if any | | | 245,857 | | | | 10,924 | | | | 83,930 | | | | 4,236 | | | | 9,013 | |
Total Liabilities | | | 54,690,927 | | | | 1,040,521 | | | | 11,416,967 | | | | 564,411 | | | | 9,013 | |
| | | | | | | | | | | | | | | | | | | | | |
Net Assets | | $ | 370,631,895 | | | $ | 15,680,384 | | | $ | 131,762,147 | | | $ | 6,435,352 | | | $ | 13,080,415 | |
| | | | | | | | | | | | | | | | | | | | | |
Net Assets Consist of: | | | | | | | | | | | | | | | | | | | | |
Paid-in Capital ($0.01 par value) | | $ | 84,500 | | | $ | 5,500 | | | $ | 75,500 | | | $ | 5,000 | | | $ | 5,500 | |
Additional Paid-in Capital | | | 406,615,164 | | | | 14,553,100 | | | | 160,428,243 | | | | 9,289,158 | | | | 14,189,508 | |
Total distributable earnings/(accumulated deficit) | | | (36,067,769 | ) | | | 1,121,784 | | | | (28,741,596 | ) | | | (2,858,806 | ) | | | (1,114,593 | ) |
Net Assets | | $ | 370,631,895 | | | $ | 15,680,384 | | | $ | 131,762,147 | | | $ | 6,435,352 | | | $ | 13,080,415 | |
| | | | | | | | | | | | | | | | | | | | | |
Outstanding Shares of Beneficial Interest (unlimited authorized - $0.01 par value) | | | 8,450,000 | | | | 550,000 | | | | 7,550,000 | | | | 500,000 | | | | 550,000 | |
Net Asset Value, Offering and Redemption Price per Share | | $ | 43.86 | | | $ | 28.51 | | | $ | 17.45 | | | $ | 12.87 | | | $ | 23.78 | |
The accompanying notes are an integral part of the financial statements.
16
Amplify ETF Trust
Statements of Operations
For the Year/Period Ended October 31, 2018
| | | Amplify
Online
Retail ETF | | | Amplify
YieldShares
CWP Dividend
& Option
Income ETF | | | Amplify
Transformational
Data
Sharing ETF (a) | | | Amplify
Advanced
Battery Metals
and Materials
ETF (b) | | | Amplify EASI
Tactical Growth
ETF (c) | |
Investment Income: | | | | | | | | | | | | | | | | | | | | |
Dividend Income (Net of Foreign Withholding Tax of $9,235, $0, $150,758, $9,889 and $345, respectively) | | $ | 668,536 | | | $ | 336,889 | | | $ | 1,952,791 | | | $ | 64,293 | | | $ | 23,793 | |
Interest Income | | | 10,288 | | | | 11,421 | | | | 19,694 | | | | 600 | | | | 154 | |
Securities Lending Income | | | 337,324 | | | | — | | | | 96,873 | | | | 10,425 | | | | 2,101 | |
Total Investment Income | | | 1,016,148 | | | | 348,310 | | | | 2,069,358 | | | | 75,318 | | | | 26,048 | |
| | | | | | | | | | | | | | | | | | | | | |
Expenses: | | | | | | | | | | | | | | | | | | | | |
Advisory Fees | | | 2,184,858 | | | | 133,564 | | | | 1,182,388 | | | | 25,249 | | | | 29,315 | |
Total Expenses | | | 2,184,858 | | | | 133,564 | | | | 1,182,388 | | | | 25,249 | | | | 29,315 | |
Advisory Fees Waived (See Note 3) | | | — | | | | (1,975 | ) | | | (262,753 | ) | | | (5,489 | ) | | | — | |
Net Expenses | | | 2,184,858 | | | | 131,589 | | | | 919,635 | | | | 19,760 | | | | 29,315 | |
| | | | | | | | | | | | | | | | | | | | | |
Net Investment Income (Loss) | | | (1,168,710 | ) | | | 216,721 | | | | 1,149,723 | | | | 55,558 | | | | (3,267 | ) |
| | | | | | | | | | | | | | | | | | | | | |
Realized and Unrealized Gain (Loss): | | | | | | | | | | | | | | | | | | | | |
Net Realized Gain (Loss) on: | | | | | | | | | | | | | | | | | | | | |
Payment from Affiliate | | | — | | | | — | | | | 742 | | | | 385 | | | | — | |
Investments | | | 41,537,676 | | | | 318,589 | | | | 1,662,408 | | | | (226,519 | ) | | | (900,980 | ) |
Foreign Currency | | | (71,908 | ) | | | — | | | | (61,007 | ) | | | (4,685 | ) | | | — | |
Options Written | | | — | | | | 108,987 | | | | — | | | | — | | | | — | |
Net Change in Unrealized Appreciation (Depreciation) on: | | | | | | | | | | | | | | | | | | | | |
Investments | | | (40,918,136 | ) | | | 354,514 | | | | (29,641,945 | ) | | | (2,683,521 | ) | | | 19,597 | |
Foreign Currency | | | 6 | | | | — | | | | (1,349 | ) | | | (24 | ) | | | — | |
Options Written | | | — | | | | 18,817 | | | | — | | | | — | | | | — | |
Net Realized and Unrealized Gain (Loss) | | | 547,638 | | | | 800,907 | | | | (28,041,151 | ) | | | (2,914,364 | ) | | | (881,383 | ) |
| | | | | | | | | | | | | | | | | | | | | |
Net Increase (Decrease) in Net Assets Resulting from Operations | | $ | (621,072 | ) | | $ | 1,017,628 | | | $ | (26,891,428 | ) | | $ | (2,858,806 | ) | | $ | (884,650 | ) |
(a) | Fund commenced operations on January 16, 2018. |
(b) | Fund commenced operations on June 4, 2018. |
(c) | Fund commenced operations on June 13, 2018. |
The accompanying notes are an integral part of the financial statements.
17
Amplify ETF Trust
Statements of Changes in Net Assets
| | | Amplify Online Retail ETF | |
| | | Year Ended
October 31,
2018 | | | Year Ended
October 31,
2017 | |
Operations: | | | | | | | | |
Net Investment Loss | | $ | (1,168,710 | ) | | $ | (156,792 | ) |
Net Realized Gain (Loss) on Investments and Foreign Currency | | | 41,465,768 | | | | (592,179 | ) |
Net Change in Unrealized Appreciation (Depreciation) on Investments and Foreign Currency | | | (40,918,130 | ) | | | 10,806,983 | |
Net Increase (Decrease) in Net Assets Resulting from Operations | | | (621,072 | ) | | | 10,058,012 | |
| | | | | | | | | |
Capital Share Transactions: | | | | | | | | |
Subscriptions | | | 419,059,730 | | | | 94,347,495 | |
Redemptions | | | (156,288,880 | ) | | | — | |
Increase in Net Assets from Capital Share Transactions | | | 262,770,850 | | | | 94,347,495 | |
| | | | | | | | | |
Total Increase in Net Assets | | | 262,149,778 | | | | 104,405,507 | |
| | | | | | | | | |
Net Assets: | | | | | | | | |
Beginning of Year | | | 108,482,117 | | | | 4,076,610 | |
End of Year | | $ | 370,631,895 | | | $ | 108,482,117 | (a) |
| | | | | | | | | |
Share Transactions: | | | | | | | | |
Subscriptions | | | 9,050,000 | | | | 2,750,000 | |
Redemptions | | | (3,500,000 | ) | | | — | |
Net Increase (Decrease) in Shares Outstanding from Share Transactions | | | 5,550,000 | | | | 2,750,000 | |
(a) | Includes accumulated net investment loss of $(165,050). |
The accompanying notes are an integral part of the financial statements.
18
Amplify ETF Trust
Statements of Changes in Net Assets
| | | Amplify YieldShares CWP
Dividend & Option Income ETF | |
| | | Year Ended
October 31,
2018 | | | Period Ended
October 31,
2017(a) | |
Operations: | | | | | | | | |
Net Investment Income | | $ | 216,721 | | | $ | 112,725 | |
Net Realized Gain on Investments and Options Written | | | 427,576 | | | | 70,032 | |
Net Change in Unrealized Appreciation on Investments and Options Written | | | 373,331 | | | | 772,515 | |
Net Increase in Net Assets Resulting from Operations | | | 1,017,628 | | | | 955,272 | |
| | | | | | | | | |
Distributions to Shareholders: | | | | | | | | |
Dividends and Distributions | | | (646,297 | ) | | | (204,819 | )(b) |
Return of Capital | | | (107,770 | ) | | | (72,145 | ) |
Total Distributions | | | (754,067 | ) | | | (276,964 | ) |
| | | | | | | | | |
Capital Share Transactions: | | | | | | | | |
Subscriptions | | | 4,400,665 | | | | 10,337,850 | |
Increase in Net Assets from Capital Share Transactions | | | 4,400,665 | | | | 10,337,850 | |
| | | | | | | | | |
Total Increase in Net Assets | | | 4,664,226 | | | | 11,016,158 | |
| | | | | | | | | |
Net Assets: | | | | | | | | |
Beginning of Year/Period | | | 11,016,158 | | | | — | |
End of Year/Period | | $ | 15,680,384 | | | $ | 11,016,158 | (c) |
| | | | | | | | | |
Share Transactions: | | | | | | | | |
Subscriptions | | | 150,000 | | | | 400,000 | |
Net Increase in Shares Outstanding from Share Transactions | | | 150,000 | | | | 400,000 | |
(a) | The Fund commenced operations on December 13, 2016. |
(b) | This amount is comprised of only net investment income. |
(c) | There was no prior year undistributed net investment income. |
The accompanying notes are an integral part of the financial statements.
19
Amplify ETF Trust
Statement of Changes in Net Assets
| | | Amplify
Transformational
Data
Sharing ETF | |
| | | Period Ended
October 31,
2018(a) | |
Operations: | | | | |
Net Investment Income | | $ | 1,149,723 | |
Net Realized Gain on Investments | | | 1,602,143 | |
Net Change in Unrealized Depreciation on Investments | | | (29,643,294 | ) |
Net Decrease in Net Assets Resulting from Operations | | | (26,891,428 | ) |
| | | | | |
Capital Share Transactions: | | | | |
Subscriptions | | | 213,529,655 | |
Redemptions | | | (54,896,875 | ) |
Transaction Fees (Note 1) | | | 20,795 | |
Increase in Net Assets from Capital Share Transactions | | | 158,653,575 | |
| | | | | |
Total Increase in Net Assets | | | 131,762,147 | |
| | | | | |
Net Assets: | | | | |
Beginning of Period | | | — | |
End of Period | | $ | 131,762,147 | |
| | | | | |
Share Transactions: | | | | |
Subscriptions | | | 10,350,000 | |
Redemptions | | | (2,800,000 | ) |
Net Increase in Shares Outstanding from Share Transactions | | | 7,550,000 | |
(a) | The Fund commenced operations on January 16, 2018. |
The accompanying notes are an integral part of the financial statements.
20
Amplify ETF Trust
Statement of Changes in Net Assets
| | | Amplify
Advanced
Battery
Metals and
Materials ETF | |
| | | Period Ended
October 31,
2018 (a) | |
Operations: | | | | |
Net Investment Income | | $ | 55,558 | |
Net Realized Loss on Investments | | | (230,819 | ) |
Net Change in Unrealized Depreciation on Investments | | | (2,683,545 | ) |
Net Decrease in Net Assets Resulting from Operations | | | (2,858,806 | ) |
| | | | | |
Capital Share Transactions: | | | | |
Subscriptions | | | 9,290,765 | |
Transaction Fees (Note 1) | | | 3,393 | |
Increase in Net Assets from Capital Share Transactions | | | 9,294,158 | |
| | | | | |
Total Increase in Net Assets | | | 6,435,352 | |
| | | | | |
Net Assets: | | | | |
Beginning of Period | | | — | |
End of Period | | $ | 6,435,352 | |
| | | | | |
Share Transactions: | | | | |
Subscriptions | | | 500,000 | |
Net Increase in Shares Outstanding from Share Transactions | | | 500,000 | |
(a) | The Fund commenced operations on June 4, 2018. |
The accompanying notes are an integral part of the financial statements.
21
Amplify ETF Trust
Statement of Changes in Net Assets
| | | Amplify
EASI Tactical
Growth ETF | |
| | | Period Ended
October 31,
2018 (a) | |
Operations: | | | | |
Net Investment Income | | $ | (3,267 | ) |
Net Realized Loss on Investments | | | (900,980 | ) |
Net Change in Unrealized Appreciation on Investments | | | 19,597 | |
Net Decrease in Net Assets Resulting from Operations | | | (884,650 | ) |
| | | | | |
Capital Share Transactions: | | | | |
Subscriptions | | | 16,436,350 | |
Redemptions | | | (2,471,285 | ) |
Increase in Net Assets from Capital Share Transactions | | | 13,965,065 | |
| | | | | |
Total Increase in Net Assets | | | 13,080,415 | |
| | | | | |
Net Assets: | | | | |
Beginning of Period | | | — | |
End of Period | | $ | 13,080,415 | |
| | | | | |
Share Transactions: | | | | |
Subscriptions | | | 650,000 | |
Redemptions | | | (100,000 | ) |
Net Increase in Shares Outstanding from Share Transactions | | | 550,000 | |
(a) | The Fund commenced operations on June 13, 2018. |
The accompanying notes are an integral part of the financial statements.
22
Amplify ETF Trust
Amplify Online Retail ETF
Financial Highlights
| | | Year Ended
October 31,
2018 | | | Year Ended
October 31,
2017 | | | Period Ended
October 31,
2016(a) | |
Net Asset Value, Beginning of Year/Period | | $ | 37.41 | | | $ | 27.18 | | | $ | 25.00 | |
Income (Loss) from Investment Operations: | | | | | | | | | | | | |
Net Investment Loss (b) | | | (0.17 | ) | | | (0.13 | ) | | | (0.05 | ) |
Net Realized and Unrealized Gain | | | 6.62 | (c) | | | 10.36 | (d) | | | 2.23 | |
Total from Investment Operations | | | 6.45 | | | | 10.23 | | | | 2.18 | |
| | | | | | | | | | | | | |
Net Asset Value, End of Year/Period | | $ | 43.86 | | | $ | 37.41 | | | $ | 27.18 | |
| | | | | | | | | | | | | |
Total Return on Net Asset Value (e) | | | 17.25 | % | | | 37.64 | %(g) | | | 8.71 | %(f) |
| | | | | | | | | | | | | |
Supplemental Data: | | | | | | | | | | | | |
Net Assets, End of Year/Period (000's) | | $ | 370,632 | | | $ | 108,482 | | | $ | 4,077 | |
Ratio of Expenses to Average Net Assets | | | 0.65 | % | | | 0.65 | % | | | 0.65 | %(h) |
Ratio of Net Investment Loss to Average Net Assets | | | -0.35 | % | | | -0.38 | % | | | -0.34 | %(h) |
Portfolio Turnover (i) | | | 17 | % | | | 11 | % | | | 8 | %(f) |
(a) | The Fund commenced operations on April 19, 2016. |
(b) | Calculated based on average shares outstanding during the period. |
(c) | Realized and unrealized gains and losses per share in this caption are balancing amounts necessary to reconcile the change in net asset value per share for the period and may not reconcile with the aggregate gains and losses in the statement of operations due to share transactions for the year. |
(d) | Includes a $0.01 gain derived from a payment from affiliate. See Note 5. |
(e) | Total Return on Net Asset Value is based on the change in net asset value (“NAV”) of a share during the period and assumes reinvestment of dividends and distributions at NAV. Total Return on Net Asset Value is for the period indicated and has not been annualized. The return shown does not reflect the deduction of taxes that a shareholder would pay on fund distributions or redemption of fund shares. |
(g) | Before payment from affiliate for the loss resulting from a trade error, the total return for the period would have been 37.63%. See Note 5. |
(i) | Excludes the impact of in-kind transactions. |
The accompanying notes are an integral part of the financial statements.
23
Amplify ETF Trust
Amplify YieldShares CWP Dividend & Option Income ETF
Financial Highlights
| | | Year Ended
October 31,
2018 | | | Period Ended
October 31,
2017(a) | |
Net Asset Value, Beginning of Year/Period | | $ | 27.54 | | | $ | 25.00 | |
Income from Investment Operations: | | | | | | | | |
Net Investment Income (b) | | | 0.45 | | | | 0.39 | |
Net Realized and Unrealized Gain | | | 2.02 | | | | 2.92 | |
Total from Investment Operations | | | 2.47 | | | | 3.31 | |
| | | | | | | | | |
Distributions to Shareholders | | | | | | | | |
Net Investment Income | | | (1.29 | ) | | | (0.57 | ) |
Return of Capital | | | (0.21 | ) | | | (0.20 | ) |
Total from Distributions | | | (1.50 | ) | | | (0.77 | ) |
| | | | | | | | | |
Net Asset Value, End of Year/Period | | $ | 28.51 | | | $ | 27.54 | |
| | | | | | | | | |
Total Return on Net Asset Value (c) | | | 9.12 | % | | | 13.40 | %(d) |
| | | | | | | | | |
Supplemental Data: | | | | | | | | |
Net Assets, End of Year/Period (000's) | | $ | 15,680 | | | $ | 11,016 | |
Ratio of Expenses to Average Net Assets (Before Advisory Fees Waived) | | | 0.95 | % | | | N/A | |
Ratio of Expenses to Average Net Assets (After Advisory Fees Waived) | | | 0.94 | % | | | 0.95 | %(e) |
Ratio of Net Investment Income to Average Net Assets (Before Advisory Fees Waived) | | | 1.53 | % | | | N/A | |
Ratio of Net Investment Income to Average Net Assets (After Advisory Fees Waived) | | | 1.54 | % | | | 1.67 | %(e |
Portfolio Turnover (f) | | | 151 | % | | | 187 | %(d) |
(a) | The Fund commenced operations on December 13, 2016. |
(b) | Calculated based on average shares outstanding during the period. |
(c) | Total Return on Net Asset Value is based on the change in net asset value (“NAV”) of a share during the period and assumes reinvestment of dividends and distributions at NAV. Total Return on Net Asset Value is for the period indicated and has not been annualized. The return shown does not reflect the deduction of taxes that a shareholder would pay on fund distributions or redemption of fund shares. |
(f) | Excludes the impact of in-kind transactions. |
The accompanying notes are an integral part of the financial statements.
24
Amplify ETF Trust
Amplify Transformational Data Sharing ETF
Financial Highlights
| | | Period Ended
October 31,
2018(a) | |
Net Asset Value, Beginning of Period | | $ | 20.00 | |
Income (Loss) from Investment Operations: | | | | |
Net Investment Income (b) | | | 0.14 | |
Net Realized and Unrealized Loss | | | (2.69 | )(c) |
Total from Investment Operations | | | (2.55 | ) |
| | | | | |
Capital Share Transactions | | | | |
Transaction Fees | | | — | (d) |
| | | | | |
Net Asset Value, End of Period | | $ | 17.45 | |
| | | | | |
Total Return on Net Asset Value (e) | | | -12.74 | %(f)(g) |
| | | | | |
Supplemental Data: | | | | |
Net Assets, End of Period (000's) | | $ | 131,762 | |
Ratio of Expenses to Average Net Assets (Before Advisory Fees Waived) | | | 0.90 | %(h) |
Ratio of Expenses to Average Net Assets (After Advisory Fees Waived) | | | 0.70 | %(h) |
Ratio of Net Investment Income to Average Net Assets (Before Advisory Fees Waived) | | | 0.68 | %(h) |
Ratio of Net Investment Income to Average Net Assets (After Advisory Fees Waived) | | | 0.88 | %(h) |
Portfolio Turnover (i) | | | 44 | %(f) |
(a) | The Fund commenced operations on January 16, 2018. |
(b) | Calculated based on average shares outstanding during the period. |
(c) | Includes a less than $0.01 gain per share derived from payment from an affiliate. See Note 5. |
(e) | Total Return on Net Asset Value is based on the change in net asset value (“NAV”) of a share during the period and assumes reinvestment of dividends and distributions at NAV. Total Return on Net Asset Value is for the period indicated and has not been annualized. The return shown does not reflect the deduction of taxes that a shareholder would pay on fund distributions or redemption of fund shares. |
(g) | Before payment from affiliate for the loss resulting from trade error, the total return for the period would have been -12.74%. See Note 5. |
(i) | Excludes the impact of in-kind transactions. |
The accompanying notes are an integral part of the financial statements.
25
Amplify ETF Trust
Amplify Advanced Battery Metals and Materials ETF
Financial Highlights
| | | Period Ended
October 31,
2018(a) | |
Net Asset Value, Beginning of Period | | $ | 20.00 | |
Income (Loss) from Investment Operations: | | | | |
Net Investment Income (b) | | | 0.13 | |
Net Realized and Unrealized Loss | | | (7.27 | )(c) |
Total from Investment Operations | | | (7.14 | ) |
| | | | | |
Capital Share Transactions | | | | |
Transaction Fees | | | 0.01 | |
| | | | | |
Net Asset Value, End of Period | | $ | 12.87 | |
| | | | | |
Total Return on Net Asset Value (d) | | | -35.65 | %(e)(f) |
| | | | | |
Supplemental Data: | | | | |
Net Assets, End of Period (000's) | | $ | 6,435 | |
Ratio of Expenses to Average Net Assets (Before Advisory Fees Waived) | | | 0.92 | %(g) |
Ratio of Expenses to Average Net Assets (After Advisory Fees Waived) | | | 0.72 | %(g) |
Ratio of Net Investment Income to Average Net Assets (Before Advisory Fees Waived) | | | 1.82 | %(e) |
Ratio of Net Investment Income to Average Net Assets (After Advisory Fees Waived) | | | 2.02 | %(e) |
Portfolio Turnover (h) | | | 12 | %(e) |
(a) | The Fund commenced operations on June 4, 2018. |
(b) | Calculated based on average shares outstanding during the period. |
(c) | Includes a less than $0.01 gain per share derived from payment from affiliate. See Note 5. |
(d) | Total Return on Net Asset Value is based on the change in net asset value (“NAV”) of a share during the period and assumes reinvestment of dividends and distributions at NAV. Total Return on Net Asset Value is for the period indicated and has not been annualized. The return shown does not reflect the deduction of taxes that a shareholder would pay on fund distributions or redemption of fund shares. |
(f) | Before payment from affiliate for the loss resulting from trade error, the total return for the period would have been -35.65%. See Note 5. |
(h) | Excludes the impact of in-kind transactions. |
The accompanying notes are an integral part of the financial statements.
26
Amplify ETF Trust
Amplify EASI Tactical Growth ETF
Financial Highlights
| | | Period Ended
October 31,
2018(a) | |
Net Asset Value, Beginning of Period | | $ | 25.00 | |
Income (Loss) from Investment Operations: | | | | |
Net Investment Income (b) | | | — | (c) |
Net Realized and Unrealized Loss | | | (1.22 | ) |
Total from Investment Operations | | | (1.22 | ) |
| | | | | |
Net Asset Value, End of Period | | $ | 23.78 | |
| | | | | |
Total Return on Net Asset Value (d) | | | -4.87 | %(e) |
| | | | | |
Supplemental Data: | | | | |
Net Assets, End of Period (000's) | | $ | 13,080 | |
Ratio of Expenses to Average Net Assets | | | 0.75 | %(f) |
Ratio of Net Investment Income to Average Net Assets | | | 0.03 | %(f) |
Portfolio Turnover (g) | | | 289 | %(e) |
(a) | The Fund commenced operations on June 13, 2018. |
(b) | Calculated based on average shares outstanding during the period. |
(d) | Total Return on Net Asset Value is based on the change in net asset value (“NAV”) of a share during the period and assumes reinvestment of dividends and distributions at NAV. Total Return on Net Asset Value is for the period indicated and has not been annualized. The return shown does not reflect the deduction of taxes that a shareholder would pay on fund distributions or redemption of fund shares. |
(g) | Excludes the impact of in-kind transactions. |
The accompanying notes are an integral part of the financial statements.
27
Amplify ETF Trust
Notes to the Financial Statements
October 31, 2018
Amplify ETF Trust (the “Trust”) was organized as a Massachusetts business trust on January 6, 2015, and is authorized to issue an unlimited number of shares in one or more series of funds. The Trust is an open-end management investment company, registered under the Investment Company Act of 1940, as amended (the “1940 Act”). The Trust consists of five non-diversified funds, Amplify Online Retail ETF, Amplify YieldShares CWP Dividend & Option Income ETF, Amplify Transformational Data Sharing ETF, Amplify Advanced Battery Metals and Materials ETF and Amplify EASI Tactical Growth ETF (the “Funds”). Each Fund represents a beneficial interest in a separate portfolio of securities and other assets, with their own investment objectives and policies.
The investment objective of Amplify Online Retail ETF is to seek investment results that generally correspond (before fees and expenses) to the price and yield of the EQM Online Retail Index. Amplify Online Retail ETF commenced operations on April 19, 2016. The investment objective of Amplify YieldShares CWP Dividend & Option Income ETF is to seek to provide current income as its primary objective and capital appreciation as its secondary objective. Amplify YieldShares CWP Dividend & Option Income ETF commenced operations on December 13, 2016. The investment objective of Amplify Transformational Data Sharing ETF is to seek to provide investors with total return. Amplify Transformational Data Sharing ETF commenced operations on January 16, 2018. The investment objective of Amplify Advanced Battery Metals and Materials ETF is to seek to provide investors with total return. Amplify Advanced Battery Metals and Materials ETF commenced operations on June 4, 2018. The investment objective of Amplify EASI Tactical Growth ETF is to seek investment results that generally correspond (before fees and expenses) to the price and yield of the EASI Tactical Growth Index. Amplify EASI Tactical Growth ETF commenced operations on June 13, 2018.
Amplify Online Retail ETF lists and principally trade its shares on The Nasdaq Stock Market® LLC (“Nasdaq”), Amplify YieldShares CWP Dividend & Option Income ETF, Amplify Transformational Data Sharing ETF, Amplify Advanced Battery Metals and Materials ETF, and Amplify EASI Tactical Growth ETF list and principally trade their shares on the New York Stock Exchange (“NYSE”) (each an “Exchange” and collectively, the “Exchanges”). Shares of the Funds trade on the Exchanges at market prices that may be below, at, or above the Funds’ net asset value (“NAV”). The Funds will issue and redeem shares on a continuous basis at NAV only in large blocks of shares, typically 50,000 shares, called “Creation Units.” Creation Units will be issued and redeemed principally in-kind for securities included in a specified universe. Once created, shares generally will trade in the secondary market at market prices that change throughout the day in amounts less than a Creation Unit. Except when aggregated in Creation Units, shares are not redeemable securities of a Fund. Shares of a Fund may only be purchased or redeemed by certain financial institutions (“Authorized Participants”). An Authorized Participant is either (i) a broker-dealer or other participant in the clearing process through the Continuous Net Settlement System of the National Securities Clearing Corporation or (ii) a DTC participant and, in each case, must have executed a Participant Agreement with Quasar Distributors, LLC (“the Distributor”). Most retail investors will not qualify as Authorized Participants or have the resources to buy and sell whole Creation Units. Therefore, they will be unable to purchase or redeem the shares directly from the Funds. Rather, most retail investors will purchase shares in the secondary market with the assistance of a broker and will be subject to customary brokerage commissions or fees.
Each Fund currently offers one class of shares, which has no front end sales load, no deferred sales charge, and no redemption fee. A purchase or redemption (i.e. creation or redemption) transaction fee of $500 is imposed for the transfer and other transaction costs associated with the purchase or redemption of Creation Units for Amplify Online Retail ETF, Amplify YieldShares CWP Dividend & Option Income ETF, and Amplify Transformational Data Sharing ETF. A purchase or redemption transaction fee of $250 is imposed for Amplify Advanced Battery Metals and Materials ETF and Amplify EASI Tactical Growth ETF. The Funds may issue an unlimited number of shares of beneficial interest, with par value of $0.01 per share. All shares of the Funds have equal rights and privileges.
2. | SIGNIFICANT ACCOUNTING POLICIES |
The Funds are investment companies and accordingly follow the investment company accounting and reporting guidance of the Financial Accounting Standards Board (“FASB”) Accounting Standards Codification (“ASC”) Topic 946 Financial Services – Investment Companies.
28
Amplify ETF Trust
Notes to the Financial Statements
October 31, 2018 (Continued)
The following is a summary of significant accounting policies consistently followed by the Funds in the preparation of their financial statements. These policies are in conformity with accounting principles generally accepted in the United States of America (“U.S. GAAP”).
SECURITY VALUATION
In accordance with the authoritative guidance on fair value measurements and disclosure under U.S. GAAP, the Funds disclose fair value of their investments in a hierarchy that prioritizes the inputs to valuation techniques used to measure fair value. The objective of a fair value measurement is to determine the price that would be received to sell an asset or paid to transfer a liability in an orderly transaction between market participants at the measurement date (an exit price). Accordingly, the fair value hierarchy gives the highest priority to quoted prices (unadjusted) in active markets for identical assets or liabilities (Level 1) and the lowest priority to unobservable inputs (Level 3). The following describes the levels of the fair value hierarchy:
Level 1 – Unadjusted quoted prices in active markets for identical, unrestricted assets or liabilities that the Funds have the ability to access at the measurement date;
Level 2 – Quoted prices which are not active, or inputs that are observable (either directly or indirectly) for substantially the full term of the asset or liability; and
Level 3 – Prices, inputs or exotic modeling techniques which are both significant to the fair value measurement and unobservable (supported by little or no market activity)
The valuation techniques used by the Funds to measure fair value for the year/period ended October 31, 2018 maximized the use of observable inputs and minimized the use of unobservable inputs.
For the year/period ended October 31, 2018, there have been no significant changes to the Funds’ fair valuation methodologies.
Common stocks, preferred stock, and other equity securities listed on any national or foreign exchange (excluding Nasdaq) and the London Stock Exchange Alternative Investment Market (“AIM”) will be valued at the last price on the exchange on which they are principally traded or, for Nasdaq and AIM securities, the official closing price. Securities traded on more than one securities exchange are valued at the last sale price or official closing price, as applicable, at the close of the exchange representing the principal market for such securities. Redeemable securities issued by open-end investment companies shall be valued at the investment company’s applicable NAV, with the exception of exchange-traded open-end investment companies which are priced as equity securities. Exchange-traded options will be valued at the current mean price where such contracts are principally traded. Futures contracts will be valued at the settlement price. Securities traded in the over-the-counter market are valued at the mean of the bid and the asked price, if available, and otherwise at their closing bid price.
If no quotation is available from either a pricing service, or one or more brokers or if the pricing committee has reason to question the reliability or accuracy of a quotation supplied, securities are valued at fair value as determined in good faith by the pricing committee, pursuant to procedures established under the general supervision and responsibility of the Fund’s Board of Trustees (the “Board”).
The following is a summary of the fair valuations according to the inputs used to value the Funds’ investments as of October 31, 2018:
Category | | Amplify
Online
Retail ETF | | | Amplify
YieldShares
CWP Dividend
& Option
Income ETF | | | Amplify
Transformational
Data
Sharing ETF | | | Amplify
Advanced
Battery Metals
and Materials
ETF | | | Amplify
EASI Tactical
Growth ETF | |
Investments in Securities | | | | | | | | | | | | | | | | | | | | |
Assets | | | | | | | | | | | | | | | | | | | | |
Level 1 | | | | | | | | | | | | | | | | | | | | |
Common Stocks | | $ | 370,489,822 | | | $ | 14,030,727 | | | $ | 131,696,949 | | | $ | 6,314,777 | | | $ | — | |
Investment Companies | | | — | | | | 1,144,875 | | | | — | | | | — | | | | 13,053,881 | |
Money Market Funds | | | 353,823 | | | | 843,454 | | | | 1,607,129 | | | | 118,157 | | | | 34,742 | |
29
Amplify ETF Trust
Notes to the Financial Statements
October 31, 2018 (Continued)
Category | | Amplify
Online
Retail ETF | | | Amplify
YieldShares
CWP Dividend
& Option
Income ETF | | | Amplify
Transformational
Data
Sharing ETF | | | Amplify
Advanced
Battery Metals
and Materials
ETF | | | Amplify
EASI Tactical
Growth ETF | |
Investments Purchased with Proceeds from Securities Lending | | $ | 37,029,545 | | | | — | | | $ | 5,713,289 | | | $ | 560,175 | | | $ | — | |
Total Level 1 | | | 407,873,190 | | | | 16,019,056 | | | | 139,017,367 | | | | 6,993,109 | | | | 13,088,623 | |
Level 2 | | | — | | | | — | | | | — | | | | — | | | | — | |
Total Level 2 | | | — | | | | — | | | | — | | | | — | | | | — | |
Level 3 | | | — | | | | — | | | | — | | | | — | | | | — | |
Total Level 3 | | | — | | | | — | | | | — | | | | — | | | | — | |
Total | | $ | 407,873,190 | | | $ | 16,019,056 | | | $ | 139,017,367 | | | $ | 6,993,109 | | | $ | 13,088,623 | |
| | | | | | | | | | | | | | | | | | | | | |
Other Financial Instruments (a) | | | | | | | | | | | | | | | | | | | | |
Liabilities | | | | | | | | | | | | | | | | | | | | |
Level 1 | | | | | | | | | | | | | | | | | | | | |
Options Written | | $ | — | | | $ | — | | | $ | — | | | $ | — | | | $ | — | |
Total Level 1 | | | — | | | | — | | | | — | | | | — | | | | — | |
Level 2 | | | — | | | | 8,502 | | | | — | | | | — | | | | — | |
Total Level 2 | | | — | | | | 8,502 | | | | — | | | | — | | | | — | |
Level 3 | | | — | | | | — | | | | — | | | | — | | | | — | |
Total Level 3 | | | — | | | | — | | | | — | | | | — | | | | — | |
Total | | $ | — | | | $ | 8,502 | | | $ | — | | | $ | — | | | $ | — | |
See the Schedules of Investments for further disaggregation of investment categories.
(a) | Other Financial Instruments are derivative instruments not reflected in the Schedule of Investments, such as options written, which are reflected at value. |
For the year/period ended October 31, 2018, there were no transfers into or out of Level 3 for the Funds. Below is a reconciliation of securities in Level 3 for the Fund.
Amplify Advanced
Battery Metals and
Materials ETF | | Balance as of
06/04/2018 | | | Net Realized
Gain (Loss) | | | Change in Net
Unrealized
Appreciation
(Depreciation) | | | Purchases/
Acquisition | | | Sales | | | Transfers In/
Out of Level 3 | | | Net Change
in Unrealized
Appreciation
(Depreciation)
on securities
held at
10/31/2018 | |
Common Stocks | | $ | — | | | $ | — | | | $ | — | | | $ | — | | | $ | — | | | $ | — | | | $ | — | |
The following is a summary of quantitative information about Level 3 Fair Value Measurements:
Amplify Advanced Battery
Metals and Materials ETF | | Fair Value as
of 10/31/2018 | | | Valuation
Techniques | | | Unobservable
Input | | | Input Values | | | Impact to Valuation from
an Increase to Input | |
Common Stocks | | $ | — | | | | Proration of Share Price | | | | Corporate Action Details | | | | 0.00-0.09 AUD | | | | Significant changes in the information surrounding the company would result in direct and proportional changes in the fair value of the security. | |
30
Amplify ETF Trust
Notes to the Financial Statements
October 31, 2018 (Continued)
OPTION WRITING
The Amplify YieldShares CWP Dividend & Option Income ETF will employ an option strategy in which it will write U.S. exchange-traded covered call options on equity securities in the portfolio in order to seek additional income (in the form of premiums on the options) and selective repurchase of such options. A call option written (sold) by the Fund will give the holder (buyer) the right to buy a certain equity security at a predetermined strike price from the Fund. A premium is the income received by an investor who sells or writes an option contract to another party. The Fund seeks to lower risk and enhance total return by tactically selling short-term call options on some, or all, of the equity securities in the portfolio. Specifically, the Fund seeks to provide gross income of approximately 2-3% from dividend income and 2-4% from option premium, plus the potential for capital appreciation. Unlike a systematic covered call program, the Fund is not obligated to continuously cover each individual equity position. When one of the underlying stocks demonstrates strength or an increase in implied volatility, the Fund identifies that opportunity and sells call options tactically, rather than keeping all positions covered and limiting potential upside.
When the Fund writes an option, an amount equal to the premium received by the Fund is recorded as a liability and is subsequently adjusted to the current fair value of the option written. Premiums received from writing options that expire unexercised are treated by the Fund on the expiration date as realized gains from options written. The difference between the premium and the amount paid on effecting a closing purchase transaction, including brokerage commissions, is also treated as a realized gain, or, if the premium is less than the amount paid for the closing purchase transaction, as a realized loss. If a call option is exercised, the premium is added to the proceeds from the sale of the underlying security in determining whether the Fund has realized a gain or loss. The Fund, as a writer of an option, bears the market risk of an unfavorable change in the price of the security underlying the written option.
The value of derivative instruments on the Statements of Assets and Liabilities for Amplify YieldShares CWP Dividend & Option Income ETF as of October 31, 2018 is as follows:
Statement of Assets and Liabilities - Values of Derivative Instruments as of October 31, 2018
Amplify YieldShares CWP Dividend & Option Income ETF
| | | Liability Derivatives | |
Derivatives | | Location | | | Value | |
Equity Contracts -
Options | | | Options written,
at value | | | $ | 8,502 | |
The effect of Derivative Instruments on the Statement of Operations for the year ended October 31, 2018 is as follows:
Amount of Realized Gain on
Derivatives Recognized in Income | | Change in Unrealized Depreciation on
Derivatives Recognized in Income |
Derivatives | | Options Written | | Derivatives | | Options Written |
Equity Contracts | | $ | 108,987 | | Equity Contracts | | $ | 18,817 |
The average monthly value of options written during the year ended October 31, 2018 was $(13,470).
OFFSETTING ASSETS AND LIABILITIES
The Amplify YieldShares CWP Dividend & Option Income ETF is subject to various Master Netting Arrangements, which govern the terms of certain transactions with select counterparties. The Master Netting Arrangements allow the Funds to close out and net their total exposure to a counterparty in the event of a default with respect to all the transactions governed under a single agreement with a counterparty. The Master Netting Arrangements also specify collateral posting arrangements at pre-arranged exposure levels. Under the Master Netting Arrangements, collateral is routinely transferred if the total net exposure to certain transactions (net of existing collateral already in place) governed under the relevant Master Netting Arrangement with a counterparty in a given account exceeds a specified threshold depending on the counterparty and type of Master Netting Arrangement.
31
Amplify ETF Trust
Notes to the Financial Statements
October 31, 2018 (Continued)
The following is a summary of the Assets and Liabilities subject to offsetting in the Amplify YieldShares CWP Dividend & Option Income as of October 31, 2018:
Liabilities | | | | | | | | | | | | | | Gross Amounts not offset in the
Statement of Assets and Liabilities | | | | | |
Description / Counterparty | | Gross Amounts
of Recognized
Liabilities | | | Gross Amounts
Offset in the
Statement of
Assets and
Liabilities | | | Net Amounts
Presented in
the Statement
of Assets and
Liabilities | | | Financial
Instruments | | | Collateral
Pledged | | | Net Amount | |
Amplify YieldShares CWP Dividend & Option Income ETF |
Options Written | | | | | | | | | | | | | | | | | | | | | | | | |
Susquehanna Financial Group | | $ | 8,502 | | | $ | — | | | $ | 8,502 | | | $ | 8,502 | | | $ | — | | | $ | — | |
In some instances, the collateral amounts disclosed in the tables were adjusted due to the requirement to limit the collateral amounts to avoid the effect of overcollateralization. Actual collateral received/pledged may be more than the amounts disclosed herein.
SHARE VALUATION
The NAV per share of the Funds is calculated by dividing the sum of the value of the securities held by the Funds, plus cash and other assets, minus all liabilities (including estimated accrued expenses) by the total number of shares outstanding for each Fund, rounded to the nearest cent. The Funds’ shares will not be priced on the days on which the NYSE is closed for trading. The offering and redemption price per share for the Funds is equal to the Funds’ NAV.
USE OF ESTIMATES
The preparation of financial statements in conformity with U.S. GAAP requires management to make estimates and assumptions that affect the reported assets and liabilities and disclosure of contingent assets and liabilities at the date of the financial statements, as well as the reported amounts of revenues and expenses during the period. Actual results could differ from those estimates.
FOREIGN CURRENCY TRANSLATION
The books and records of the Funds are maintained in U.S. dollars. Investment securities and other assets and liabilities denominated in a foreign currency are translated into U.S. dollars on the date of valuation. Purchases and sales of investment securities, income and expenses are translated into U.S. dollars at the relevant rates of exchange prevailing on the respective dates of such transactions. The Funds do not isolate that portion of realized or unrealized gains and losses resulting from changes in the foreign exchange rates on investments and currency gains or losses realized between the trade and settlement dates on securities transactions from fluctuations arising from changes in the market prices of the securities. These gains and losses are included in net realized and unrealized gains (loss) on investments on the Statements of Operations. Net realized and unrealized gains and losses on foreign currency transactions represent net foreign exchange gains or losses from foreign currency exchange contracts, disposition of foreign currencies, currency gains or losses realized between trade and settlement dates on foreign currency transactions and the difference between the amount of the investment income and foreign withholding taxes recorded on the Funds’ books and the U.S. dollar equivalent amounts actually received or paid.
SECURITY TRANSACTIONS AND INVESTMENT INCOME
Security transactions are accounted for on trade date. Costs used in determining realized gains and losses on the sale of investment securities are based on specific identification. Dividend income is recorded on the ex-dividend date. Interest income is recognized on the accrual basis. Withholding taxes on foreign dividends have been provided for in accordance with the Funds’ understanding of the applicable country’s tax rules and rates.
32
Amplify ETF Trust
Notes to the Financial Statements
October 31, 2018 (Continued)
Distributions received from the investments in closed-end funds (“CEFs”) are recorded as ordinary income, net realized capital gain or return of capital based on information reported by CEFs and management’s estimates of such amounts based on historical information. These estimates are adjusted with the tax returns after the actual source of distributions has been disclosed by the CEF and may differ from the estimated amounts.
DIVIDENDS AND DISTRIBUTIONS TO SHAREHOLDERS
Dividends from net investment income, if any, will be declared and paid at least annually by the Funds. The Funds distribute their net realized capital gains, if any, to shareholders annually. All distributions are recorded on the ex-dividend date.
The amount and character of income and capital gain distributions to be paid, if any, are determined in accordance with income tax regulations, which may differ from U.S. GAAP. As a result, net investment income (loss) and net realized gain (loss) on investments and foreign currency for a reporting period may differ significantly from distributions during such period. These book/tax differences may be temporary or permanent. To the extent these differences are permanent in nature, they are charged or credited to distributable earnings/(accumulated deficit) and paid-in capital, as appropriate, in the period that the differences arise.
GUARANTEES AND INDEMNIFICATIONS
In the normal course of business, the Funds enter into contracts with service providers that contain general indemnification clauses. The Funds’ maximum exposure under these arrangements is unknown, as this would involve future claims that may be made against the Funds that have not yet occurred. However, based on experience, the Funds expect risk of loss to be remote.
ORGANIZATIONAL AND OFFERING COSTS
All organizational costs incurred to establish the Funds were paid by Amplify Investments LLC (the “Adviser”) and are not subject to reimbursement.
Amplify Investments LLC (the “Adviser”) serves as investment adviser to the Funds. Pursuant to an Investment Management Agreement (the “Management Agreement”) between the Trust, on behalf of the Funds, and the Adviser, the Adviser provides investment advice to the Funds and oversees the day-to-day operations of the Funds, subject to the direction and control of the Board and the officers of the Trust. Under the Management Agreement, the Funds will pay the following investment advisory fees to the Adviser as compensation for the services rendered, facilities furnished, and expenses paid by it, including the cost of transfer agency, custody, fund administration, legal, audit and other service and license fees, but excluding interest, taxes, brokerage commissions, and other expenses connected with the execution of portfolio transactions, distribution and service fees payable pursuant to a Rule 12b-1 Plan, if any, and extraordinary expenses.
Fund | Annual Rate of
Average Daily
Net Assets |
Amplify Online Retail ETF | 0.65% |
Amplify YieldShares CWP Dividend & Option Income ETF | 0.95% |
Amplify Transformational Data Sharing ETF | 0.90% |
Amplify Advanced Battery Metals and Materials ETF | 0.92% |
Amplify EASI Tactical Growth ETF | 0.75% |
Pursuant to a contractual agreement between the Trust, effective January 16, 2018, October 22, 2018 and May 21, 2018, respectively, on behalf of Amplify Transformational Data Sharing ETF, Amplify YieldShares CWP Dividend and Option Income ETF and Amplify Advanced Battery Metals and Materials ETF, the management fees paid to the Adviser were reduced by 0.20%, 0.47% and 0.20%,
33
Amplify ETF Trust
Notes to the Financial Statements
October 31, 2018 (Continued)
respectively. For the year/period ended October 31, 2018, the Advisers management fee was reduced by $262,753, $1,975 and $5,489 in Amplify Transformational Data Sharing ETF, Amplify YieldShares CWP Dividend & Option Income ETF and Amplify Advanced Battery Metals and Materials ETF, respectively. This contractual agreement will continue until January 16, 2019 for Amplify Transformational Data Sharing ETF, until October 22, 2019 for Amplify YieldShares CWP Dividend and Option Income ETF and until May 21, 2019 for Amplify Advanced Battery Metals and Materials ETF. The Adviser is not eligible to recoup these amounts.
The Adviser has overall responsibility for overseeing the investment of the Funds’ assets, managing the Funds’ business affairs and providing certain clerical, bookkeeping and other administrative services for the Trust. Penserra Capital Management, LLC serves as the Sub-Adviser (“Penserra”) to Amplify Online Retail ETF and Amplify EASI Tactical Growth ETF. Toroso Investments, LLC (“Toroso”) and Exponential ETFs (“Exponential”) serve as the Sub-Advisers to Amplify Transformational Data Sharing ETF and Amplify Advanced Battery Metals and Materials ETF. Penserra and Capital Wealth Planning, LLC (“CWP”) serve as the Sub-Advisers to the Amplify YieldShares CWP Dividend & Option Income ETF (Penserra, together with CWP, Toroso, and Exponential the “Sub-Advisers,” and each, a “Sub-Adviser”). Each Sub-Adviser has responsibility for selecting and continuously monitoring the Fund’s investments. Sub-Advisory fees earned by Penserra, CWP, Toroso and Exponential are paid by the Adviser. For the year/period ended October 31, 2018, the Funds paid Penserra Securities, LLC, an affiliate of Penserra, $21,671 for brokerage commissions.
U.S. Bancorp Fund Services, LLC (“Fund Services” or “Administrator”), doing business as U.S. Bank Global Fund Services, acts as the Funds’ Administrator and, in that capacity, performs various administrative and accounting services for the Funds. The Administrator prepares various federal and state regulatory filings, reports and returns for the Funds, including regulatory compliance monitoring and financial reporting; prepares reports and materials to be supplied to the Board; monitors the activities of the Funds’ custodian, transfer agent and accountant. Fund Services also serves as the transfer agent and fund accountant to the Funds.
U.S. Bank N.A., an affiliate of Fund Services, serves as the Funds’ Custodian.
The Distributor acts as the Funds’ principal underwriter in a continuous public offering of the Funds’ shares. The Distributor is an affiliate of the Administrator.
Certain officers and two Trustees of the Trust are also officers or employees of the Adviser or its affiliates. They receive no fees for serving as officers or Trustees of the Trust.
The Funds may lend up to 33 1/3% of the value of the securities in their portfolios to brokers, dealers and financial institutions (but not individuals) under terms of participation in a securities lending programs administered by the Funds’ Custodian (the “Securities Lending Agent”). The securities lending agreement requires that loans are collateralized at all times in an amount equal to at least 102% of the value of any domestic loaned securities at the time of the loan, plus accrued interest. The use of loans of foreign securities, which are denominated and payable in U.S. dollars, shall be collateralized in an amount equal to 105% of the value of any loaned securities at the time of the loan plus accrued interest. The Funds receive compensation in the form of fees and earn interest on the non-cash and cash collateral. The amount of fees depends on a number of factors including the type of security and length of the loan. The Funds continue to receive interest payments or dividends on the securities loaned during the borrowing period. Gain or loss in the value of securities loaned that may occur during the term of the loan will be for the account of the Funds. The Funds have the right under the terms of the securities lending agreements to recall the securities from the borrower on demand.
As of October 31, 2018, Amplify Online Retail ETF, Amplify Transformational Data Sharing ETF, and Amplify Advanced Battery Metals and Materials ETF had loaned securities and received cash collateral for the loans. The cash collateral is invested by the Securities Lending Agent in accordance with approved investment guidelines. Those guidelines require the cash collateral to be invested in readily marketable, high quality, short-term obligations; however, such investments are subject to risk of payment delays or default on the part of the issuer or counterparty or otherwise may not generate sufficient interest to support the costs associated with securities lending. The Funds could also experience delays in recovering its securities and possible loss of income or value if the borrower fails to return the borrowed securities, although the Funds are indemnified from this risk by contract with the Securities Lending Agent.
34
Amplify ETF Trust
Notes to the Financial Statements
October 31, 2018 (Continued)
As of October 31, 2018, the values of the securities on loan and payable for collateral due to brokers were as follows:
Fund | | Value of Securities
on Loan | | | Payable for
Collateral
Received | |
Amplify Online Retail ETF | | $ | 36,962,401 | | | $ | 37,029,545 | |
Amplify Transformational Data Sharing ETF | | $ | 5,607,384 | | | $ | 5,713,289 | |
Amplify Advanced Battery Metals and Materials ETF | | $ | 298,411 | | | $ | 560,175 | |
The interest income earned by the Funds on investments of cash collateral received from borrowers for the securities loaned to them (“Securities Lending Income”) is reflected in the Funds’ Statements of Operations. Fees and interest income earned on collateral investments and recognized by the Funds during the year/period ended October 31, 2018, were as follows:
Fund | | Fees and
Interest Earned | |
Amplify Online Retail ETF | | $ | 337,324 | |
Amplify Transformational Data Sharing ETF | | $ | 96,873 | |
Amplify Advanced Battery Metals and Materials ETF | | $ | 10,425 | |
Amplify EASI Tactical Growth ETF | | $ | 2,101 | |
SECURED BORROWINGS
The following represents gross obligations for secured borrowings by the type of collateral pledged and remaining time to maturity.
Amplify Online Retail ETF
| | | Remaining Contractual Maturity of the Agreements | |
Securities Lending Transactions | | Overnight and
Continuous | | | Up to
30 Days | | | 30-90
Days | | | Greater than
90 Days | | | Total | |
Money Market Funds | | $ | 37,029,545 | | | $ | — | | | $ | — | | | $ | — | | | $ | 37,029,545 | |
Total Borrowings | | $ | 37,029,545 | | | $ | — | | | $ | — | | | $ | — | | | $ | 37,029,545 | |
Amplify Transformational Data Sharing ETF
| | | Remaining Contractual Maturity of the Agreements | |
Securities Lending Transactions | | Overnight and
Continuous | | | Up to
30 Days | | | 30-90
Days | | | Greater than
90 Days | | | Total | |
Money Market Funds | | $ | 5,713,289 | | | $ | — | | | $ | — | | | $ | — | | | $ | 5,713,289 | |
Total Borrowings | | $ | 5,713,289 | | | $ | — | | | $ | — | | | $ | — | | | $ | 5,713,289 | |
Amplify Advanced Battery Metals and Materials ETF
| | | Remaining Contractual Maturity of the Agreements | |
Securities Lending Transactions | | Overnight and
Continuous | | | Up to
30 Days | | | 30-90
Days | | | Greater than
90 Days | | | Total | |
Money Market Funds | | $ | 560,175 | | | $ | — | | | $ | — | | | $ | — | | | $ | 560,175 | |
Total Borrowings | | $ | 560,175 | | | $ | — | | | $ | — | | | $ | — | | | $ | 560,175 | |
35
Amplify ETF Trust
Notes to the Financial Statements
October 31, 2018 (Continued)
Due to the absence of a master netting agreement related to the Funds’ participation in securities lending, no additional offsetting disclosures have been made on behalf of the Funds for the total borrowings listed above.
5. | INVESTMENT TRANSACTIONS |
For the year/period ended October 31, 2018, the purchases and sales of investments in securities, excluding in-kind transactions and short-term securities, were:
Fund | | Purchases | | | Sales | |
Amplify Online Retail ETF | | $ | 76,838,194 | | | $ | 55,908,848 | |
Amplify YieldShares CWP Dividend & Option Income ETF | | | 20,584,774 | | | | 19,947,620 | |
Amplify Transformational Data Sharing ETF | | | 78,514,011 | | | | 73,511,831 | |
Amplify Advanced Battery Metals and Materials ETF | | | 3,288,988 | | | | 877,729 | |
Amplify EASI Tactical Growth ETF | | | 31,593,317 | | | | 31,587,812 | |
For the year/period ended October 31, 2018, in-kind transactions associated with creations and redemptions were:
Fund | | Purchases | | | Sales | |
Amplify Online Retail ETF | | $ | 395,764,825 | | | $ | 155,233,848 | |
Amplify YieldShares CWP Dividend & Option Income ETF | | | 4,130,842 | | | | — | |
Amplify Transformational Data Sharing ETF | | | 207,444,724 | | | | 52,769,422 | |
Amplify Advanced Battery Metals and Materials ETF | | | 6,814,519 | | | | — | |
Amplify EASI Tactical Growth ETF | | | 16,369,887 | | | | 2,428,544 | |
There were no purchases or sales of long-term U.S. Government securities by the Funds.
During the year ended October 31, 2017, Amplify Online Retail ETF had a trade error where a foreign exchange transaction was placed using the incorrect currency. This resulted in a loss to the Fund of $5,163, which was subsequently reimbursed to the Fund, a portion of which was made by an affiliate.
During the period ended October 31, 2018, Amplify Transformational Data Sharing ETF paid commissions on affiliated transactions in error in the amount of $742, which was reimbursed to the Fund by an affiliate.
During the period ended October 31, 2018, Amplify Advanced Battery Metals and Materials ETF had a trade error occur where the wrong security was purchased. This resulted in a loss to the fund of $385, which was reimbursed to the Fund by an affiliate.
6. FEDERAL INCOME TAXES
As of and during the year/period ended October 31, 2018, the Funds did not have any tax positions that did not meet the “more-likely-than-not” threshold of being sustained by the applicable tax authority. As of and during the year/period ended October 31, 2018, the Funds did not have liabilities for any unrecognized tax benefits. The Funds recognize interest and penalties, if any, related to unrecognized tax benefits on uncertain tax positions as income tax expense in the Statements of Operations. During the year/period ended October 31, 2018, the Funds did not incur any interest or penalties.
36
Amplify ETF Trust
Notes to the Financial Statements
October 31, 2018 (Continued)
The tax composition of distributions paid during the year/period ended October 31, 2018 for the Funds was as follows:
| | | Ordinary Income | | | Capital Gains | | | Return of Capital | |
Amplify Online Retail ETF | | $ | — | | | $ | — | | | $ | — | |
Amplify YieldShares CWP Dividend & Option Income ETF | | | 536,201 | | | | 110,096 | | | | 107,770 | |
Amplify Transformational Data Sharing ETF | | | — | | | | — | | | | — | |
Amplify Advanced Battery Metals and Materials ETF | | | — | | | | — | | | | — | |
Amplify EASI Tactical Growth ETF | | | — | | | | — | | | | — | |
The tax composition of distributions paid during the year/period ended October 31, 2017 for the Funds was as follows:
| | | Ordinary Income | | | Capital Gains | | | Return of Capital | |
Amplify Online Retail ETF | | $ | — | | | $ | — | | | $ | — | |
Amplify YieldShares CWP Dividend & Option Income ETF | | | 204,819 | | | | — | | | | 72,145 | |
Amplify Transformational Data Sharing ETF | | | N/A | | | | N/A | | | | N/A | |
Amplify Advanced Battery Metals and Materials ETF | | | N/A | | | | N/A | | | | N/A | |
Amplify EASI Tactical Growth ETF | | | N/A | | | | N/A | | | | N/A | |
The Funds intend to meet the requirements of Subchapter M of the Internal Revenue Code applicable to regulated investment companies and will distribute substantially all taxable income and capital gains to shareholders. Therefore, no federal income or excise tax provision has been made.
The cost basis of investments and distributable earnings/(accumulated deficit) for federal income tax purposes as of October 31, 2018 was as follows:
| | | Amplify
Online
Retail ETF | | | Amplify
YieldShares
CWP Dividend
& Option
Income ETF | | | Amplify
Transformational
Data
Sharing ETF | | | Amplify
Advanced
Battery Metals
and Materials
ETF | | | Amplify
EASI Tactical
Growth ETF | |
| | | Investments | | | Investments | | | Investments | | | Investments | | | Investments | |
Tax cost of investments | | $ | 439,558,747 | | | $ | 14,898,194 | | | $ | 168,947,548 | | | $ | 9,698,506 | | | $ | 13,069,026 | |
Gross tax unrealized appreciation | | | 32,222,725 | | | | 1,288,201 | | | | 6,399,064 | | | | 12,578 | | | | 19,597 | |
Gross tax unrealized depreciation | | | (63,906,385 | ) | | | (167,339 | ) | | | (36,329,245 | ) | | | (2,717,975 | ) | | | — | |
Net tax unrealized appreciation (depreciation) | | | (31,683,660 | ) | | | 1,120,862 | | | | (29,930,181 | ) | | | (2,705,397 | ) | | | 19,597 | |
Undistributed ordinary income | | | — | | | | — | | | | 1,189,934 | | | | 46,593 | | | | — | |
Total accumulated gain | | | — | | | | — | | | | 1,189,934 | | | | 46,593 | | | | — | |
Other accumulated gain (loss) | | | (4,384,109 | ) | | | 922 | | | | (1,349 | ) | | | (200,002 | ) | | | (1,134,190 | ) |
Distributable earnings/(accumulated deficit) | | $ | (36,067,769 | ) | | $ | 1,121,784 | | | $ | (28,741,596 | ) | | $ | (2,858,806 | ) | | $ | (1,114,593 | ) |
The difference between book and tax-basis cost is attributable to the deferral on wash sales.
37
Amplify ETF Trust
Notes to the Financial Statements
October 31, 2018 (Continued)
At October 31, 2018, the Funds deferred, on a tax basis, late year ordinary losses of:
| | | Late Year Ordinary
Loss Deferral | |
Amplify Online Retail ETF | | $ | 1,018,191 | |
Amplify YieldShares CWP Dividend & Option Income ETF | | | — | |
Amplify Transformational Data Sharing ETF | | | — | |
Amplify Advanced Battery Metals and Materials ETF | | | — | |
Amplify EASI Tactical Growth ETF | | | 3,267 | |
At October 31, 2018, the Funds had the following capital loss carryforwards:
| | | Short-Term | | | Long-Term | | | Expires | |
Amplify Online Retail ETF | | $ | (3,250,695 | ) | | $ | (115,152 | ) | | | Unlimited | |
Amplify YieldShares CWP Dividend & Option Income ETF | | | — | | | | — | | | | — | |
Amplify Transformational Data Sharing ETF | | | — | | | | — | | | | — | |
Amplify Advanced Battery Metals and Materials ETF | | | (199,978 | ) | | | — | | | | Unlimited | |
Amplify EASI Tactical Growth ETF | | | (1,130,923 | ) | | | — | | | | Unlimited | |
Additionally, U.S. GAAP require that certain components of net assets relating to permanent differences be reclassified between financial and tax reporting. These reclassifications have no effect on net assets or NAV per share. The permanent differences primarily relate to redemption-in-kind transactions and net operating losses. For the year/period ended October 31, 2018, the following table shows the reclassifications made:
| | | Distributable
Earnings/
(Accumulated
Deficit) | | | Paid-In
Capital | |
Amplify Online Retail ETF | | $ | (45,725,955 | ) | | $ | 45,725,955 | |
Amplify YieldShares CWP Dividend & Option Income ETF | | | — | | | | — | |
Amplify Transformational Data Sharing ETF | | | (1,850,168 | ) | | | 1,850,168 | |
Amplify Advanced Battery Metals and Materials ETF | | | — | | | | — | |
Amplify EASI Tactical Growth ETF | | | (229,943 | ) | | | 229,943 | |
During the year/period ended October 31, 2018, the Funds realized the following net capital gains resulting from in-kind redemptions, in which shareholders exchanged Fund shares for securities held by the Fund rather than for cash. Because such gains are not taxable to the Funds, and are not distributed to shareholders, they have been reclassified from accumulated net realized gains/ (losses) to paid-in capital.
Amplify Online Retail ETF | | $ | 45,981,164 | |
Amplify YieldShares CWP Dividend & Option Income ETF | | | — | |
Amplify Transformational Data Sharing ETF | | | 1,850,168 | |
Amplify Advanced Battery Metals and Materials ETF | | | — | |
Amplify EASI Tactical Growth ETF | | | 229,943 | |
38
Amplify ETF Trust
Notes to the Financial Statements
October 31, 2018 (Continued)
7. | RECENT ACCOUNTING PRONOUNCEMENTS |
In August 2018, FASB issued ASU 2018-13, Fair Value Measurement (Topic 820): Disclosure Framework—Changes to the Disclosure Requirements for Fair Value Measurement (“ASU 2018-13”). The primary focus of ASU 2018-13 is to improve the effectiveness of the disclosure requirements for fair value measurements. The changes affect all companies that are required to include fair value measurement disclosures. In general, the amendments in ASU 2018-13 are effective for all entities for fiscal years and interim periods within those fiscal years, beginning after December 15, 2019. An entity is permitted to early adopt the removed or modified disclosures upon the issuance of ASU 2018-13 and may delay adoption of the additional disclosures, which are required for public companies only, until their effective date. Management has evaluated the impact these changes and has decided to accept the disclosure framework.
BLOCKCHAIN INVESTMENTS RISK (Amplify Transformational Data Sharing ETF only)
An investment in companies actively engaged in blockchain technology may be subject to the following risks:
The technology is new and many of its uses may be untested. The mechanics of using distributed ledger technology to transact in other types of assets, such as securities or derivatives, is less clear. There is no assurance that widespread adoption will occur. A lack of expansion in the usage of blockchain technology could adversely affect an investment in the Fund.
Theft, loss or destruction. Transacting on a blockchain depends in part specifically on the use of cryptographic keys that are required to access a user’s account (or “wallet”). The theft, loss or destruction of these keys impairs the value of ownership claims users have over the relevant assets being represented by the ledger (whether “smart contracts,” securities, currency or other digital assets). The theft, loss or destruction of private or public keys needed to transact on a blockchain could also adversely affect a company’s business or operations if it were dependent on the ledger.
Competing platforms and technologies. The development and acceptance of competing platforms or technologies may cause consumers or investors to use an alternative to blockchains.
Cyber security incidents. Cyber security incidents may compromise an issuer, its operations or its business. Cyber security incidents may also specifically target user’s transaction history, digital assets, or identity, thereby leading to privacy concerns. In addition, certain features of blockchain technology, such as decentralization, open source protocol, and reliance on peer-to-peer connectivity, may increase the risk of fraud or cyber-attack by potentially reducing the likelihood of a coordinated response.
Developmental risk. Blockchain technology may never develop optimized transactional processes that lead to realized economic returns for any company in which the Fund invests. Companies that are developing applications of blockchain technology applications may not in fact do so or may not be able to capitalize on those blockchain technologies. The development of new or competing platforms may cause consumers and investors to use alternatives to blockchains.
Intellectual property claims. A proliferation of recent startups attempting to apply blockchain technology in different contexts means the possibility of conflicting intellectual property claims could be a risk to an issuer, its operations or its business. This could also pose a risk to blockchain platforms that permit transactions in digital securities. Regardless of the merit of any intellectual property or other legal action, any threatened action that reduces confidence in the viability of blockchain may adversely affect an investment in the Fund.
Lack of liquid markets, and possible manipulation of blockchain-based assets. Digital assets that are represented and trade on a blockchain may not necessarily benefit from viable trading markets. Stock exchanges have listing requirements and vet issuers, and perhaps users. These conditions may not necessarily be replicated on a blockchain, depending on the platform’s controls and other policies. The more lenient a blockchain is about vetting issuers of digital assets or users that transact on the platform, the higher the potential risk for fraud or the manipulation of digital assets. These factors may decrease liquidity or volume, or increase volatility of digital securities or other assets trading on a blockchain.
39
Amplify ETF Trust
Notes to the Financial Statements
October 31, 2018 (Continued)
Lack of regulation. Digital commodities and their associated platforms are largely unregulated, and the regulatory environment is rapidly evolving. Because blockchain works by having every transaction build on every other transaction, participants can self-police any corruption, which can mitigate the need to depend on the current level of legal or government safeguards to monitor and control the flow of business transactions. As a result, companies engaged in such blockchain activities may be exposed to adverse regulatory action, fraudulent activity or even failure.
Third party product defects or vulnerabilities. Where blockchain systems are built using third party products, those products may contain technical defects or vulnerabilities beyond a company’s control. Open-source technologies that are used to build a blockchain application, may also introduce defects and vulnerabilities.
Reliance on the Internet. Blockchain functionality relies on the Internet. A significant disruption of Internet connectivity affecting large numbers of users or geographic areas could impede the functionality of blockchain technologies and adversely affect the Fund. In addition, certain features of blockchain technology, such as decentralization, open source protocol, and reliance on peer-to-peer connectivity, may increase the risk of fraud or cyber-attack by potentially reducing the likelihood of a coordinated response.
CONCENTRATION RISK (Ampify Online Retail ETF and Amplify EASI Tactical Growth ETF only)
To the extent that the Index concentrates in the securities of issuers in a particular industry or sector, the Fund will also concentrate its investments to approximately the same extent. The Fund may be susceptible to loss due to adverse occurrences to the extent that the Fund’s investments are concentrated in a particular issuer or issuers, region, market, industry, group of industries, sector or asset class.
COVERED CALL RISK (Amplify YieldShares CWP Dividend & Option Income ETF only)
Covered call risk is the risk that the Fund will forgo, during the option’s life, the opportunity to profit from increases in the market value of the security covering the call option above the sum of the premium and the strike price of the call, but has retained the risk of loss should the price of the underlying security decline. In addition, as the Fund writes covered calls over more of its portfolio, its ability to benefit from capital appreciation becomes more limited. The writer of an option has no control over the time when it may be required to fulfill its obligation as a writer of the option. Once an option writer has received an exercise notice, it cannot effect a closing purchase transaction in order to terminate its obligation under the option and must deliver the underlying security at the exercise price.
METALS AND MINING COMPANIES RISK (Amplify Advanced Battery Metals and Materials ETF only)
The Fund will invest in securities that are issued by and/or have exposure to, companies primarily involved in the metals and mining industry. Investments in metals and mining companies may be speculative and subject to greater price volatility than investments in other types of companies. The profitability of companies in the metals and mining industry is related to, among other things, worldwide metal prices and extraction and production costs. Worldwide metal prices may fluctuate substantially over short periods of time, and as a result, the Fund’s Share price may be more volatile than other types of investments. In addition, metals and mining companies may be significantly affected by changes in global demand for certain metals, economic developments, energy conservation, the success of exploration projects, changes in exchange rates, interest rates, economic conditions, tax treatment, trade treaties, and government regulation and intervention, and events in the regions that the companies to which the Fund has exposure operate (e.g., expropriation, nationalization, confiscation of assets and property, the imposition of restrictions on foreign investments or repatriation of capital, military coups, social or political unrest, violence and labor unrest). Metals and mining companies may also be subject to the effects of competitive pressures in the metals and mining industry.
MOMENTUM INVESTING RISK (Amplify EASI Tactical Growth ETF only)
The EASI Tactical Growth Index employs a “momentum” style methodology that emphasizes selecting stocks that have had higher recent price performance compared to other stocks. The Fund may be subject to more risk because stocks in which the Fund invests may be more volatile than a broad cross-section of stocks or the returns on stocks that have previously exhibited price momentum are less
40
Amplify ETF Trust
Notes to the Financial Statements
October 31, 2018 (Continued)
than returns on other styles of investing or the overall stock market. Additionally, during periods of positive stock market performance, the returns of the Fund may be lower when a significant portion of the Fund’s net assets are allocated to the fixed-income allocation. Momentum can turn quickly and cause significant variation from other types of investments.
ONLINE RETAIL RISK (Amplify Online Retail ETF only)
Companies that operate in the online marketplace, retail and travel segments are subject to fluctuating consumer demand. Unlike traditional brick and mortar retailers, online marketplaces and retailers must assume shipping costs or pass such costs to consumers. Consumer access to price information for the same or similar products may cause companies that operate in the online marketplace, retail and travel segments to reduce profit margins in order to compete. Profit margins in the travel industry are particularly sensitive to seasonal demand, fuel costs and consumer perception of various risks associated with travel to various destinations. Due to the nature of their business models, companies that operate in the online marketplace, retail and travel segments may also be subject to heightened cybersecurity risk, including the risk of theft or damage to vital hardware, software and information systems. The loss or public dissemination of sensitive customer information or other proprietary data may negatively affect the financial performance of such companies to a greater extent than traditional brick and mortar retailers. As a result of such companies being web-based and the fact that they process, store, and transmit large amounts of data, including personal information, for their customers, failure to prevent or mitigate data loss or other security breaches, including breaches of vendors’ technology and systems, could expose companies that operate in the online marketplace, retail and travel segments or their customers to a risk of loss or misuse of such information, adversely affect their operating results, result in litigation or potential liability, and otherwise harm their businesses.
RARE EARTH METAL COMPANIES RISK (Amplify Advanced Battery Metals and Materials ETF only)
Rare earth metals have more specialized uses and are often more difficult to extract. The use of strategic metals in modern technology has increased dramatically over the past years. Consequently, the demand for these metals has strained supply, which has the potential to result in a shortage of such materials which could adversely affect the companies in the Fund’s portfolio. Companies involved in the various activities that are related to the mining, refining and/or manufacturing of rare earth metals tend to be small-, medium- and micro-capitalization companies with volatile share prices, are highly dependent on the price of rare earth metals, which may fluctuate substantially over short periods of time. The value of such companies may be significantly affected by events relating to international, national and local political and economic developments, energy conservation efforts, the success of exploration projects, commodity prices, tax and other government regulations, depletion of resources, and mandated expenditures for safety and pollution control devices. The mining, refining and/or manufacturing of rare earth metals can be capital intensive and, if companies involved in such activities are not managed well, the share prices of such companies could decline even as prices for the underlying rare earth metals are rising. In addition, companies involved in the various activities that are related to the mining, refining and/or manufacturing of rare earth metals may be at risk for environmental damage claims.
The Funds have evaluated the need for additional disclosures and/or adjustments resulting from subsequent events through the date the financial statements were issued. The evaluation did not result in any subsequent events that necessitated disclosure and/or adjustments.
41
Amplify ETF Trust
Report of Independent Registered Public Accounting Firm
To the Shareholders of Amplify Online Retail ETF, Amplify YieldShares CWP Dividend & Option Income ETF, Amplify Transformational Data Sharing ETF, Amplify Advanced Battery Metals and Materials ETF, and Amplify EASI Tactical Growth ETF and Board of Trustees of Amplify ETF Trust
Opinion on the Financial Statements
We have audited the accompanying statements of assets and liabilities, including the schedules of investments and options written (as applicable), of Amplify ETF Trust comprising Amplify Online Retail ETF, Amplify YieldShares CWP Dividend & Option Income ETF, Amplify Transformational Data Sharing ETF, Amplify Advanced Battery Metals and Materials ETF, and Amplify EASI Tactical Growth ETF (the “Funds”) as of October 31, 2018, and the related statements of operations and changes in net assets and financial highlights for each of the periods indicated in the period then ended, including the related notes (collectively referred to as the “financial statements”). In our opinion, the financial statements present fairly, in all material respects, the financial position of the each of the Funds as of October 31, 2018, the results of their operations, changes in their net assets and financial highlights for each of the periods indicated in the period then ended, in conformity with accounting principles generally accepted in the United States of America.
Basis for Opinion
These financial statements are the responsibility of the Funds’ management. Our responsibility is to express an opinion on the Funds’ financial statements based on our audits. We are a public accounting firm registered with the Public Company Accounting Oversight Board (United States) (“PCAOB”) and are required to be independent with respect to the Funds in accordance with the U.S. federal securities laws and the applicable rules and regulations of the Securities and Exchange Commission and the PCAOB.
We conducted our audits in accordance with the standards of the PCAOB. Those standards require that we plan and perform the audit to obtain reasonable assurance about whether the financial statements are free of material misstatement, whether due to error or fraud.
Our audits included performing procedures to assess the risks of material misstatement of the financial statements, whether due to error or fraud, and performing procedures that respond to those risks. Such procedures included examining, on a test basis, evidence regarding the amounts and disclosures in the financial statements. Our procedures included confirmation of securities owned as of October 31, 2018, by correspondence with the custodian and brokers or by other appropriate auditing procedures where replies from brokers or counterparties were not received. Our audits also included evaluating the accounting principles used and significant estimates made by management, as well as evaluating the overall presentation of the financial statements. We believe that our audits provide a reasonable basis for our opinion.
We have served as the Funds’ auditor since 2015.
COHEN & COMPANY, LTD.
Cleveland, Ohio
December 21, 2018

42
Amplify ETF Trust
Board Considerations Regarding Approval of
Investment Management Agreement and Sub-Advisory Agreement
October 31, 2018 (Unaudited)
FOR AMPLIFY ONLINE RETAIL ETF (“IBUY”)
Pursuant to Section 15(c) of the Investment Company Act of 1940 (the “1940 Act”), at a meeting held on November 5, 2015, the Board of Trustees (the “Board”) of Amplify ETF Trust (the “Trust”) considered the approval of, and approved, the following agreements (collectively, the “Agreements”): 1) an Investment Management Agreement between Amplify Investments LLC (the “Adviser”) and the Trust, on behalf of the Amplify Online Retail ETF (the “Fund”) and 2) an Investment Sub-Advisory Agreement between the Adviser and Penserra Capital Management LLC (the “Sub-Adviser”), on behalf of the Fund (collectively, the “Agreements”).
After their initial two-year terms, the Agreements must be approved: (i) by the vote of the Trustees or by a vote of the shareholders of the Fund; and (ii) by the vote of a majority of the Trustees who are not parties to the Agreements or “interested persons” of any party thereto, as defined in the 1940 Act (the “Independent Trustees”), cast in person at a meeting called for the purpose of voting on such approval. Thus, a meeting was held on September 12, 2017 to discuss and review the Agreements with respect to the Fund. At the September 12, 2017 meeting, the Board, including the Independent Trustees, approved the retention of the Adviser and the Sub-Adviser and the Agreements for an additional one year term.
Each year after the initial two-year term, the Board will call and hold a meeting to decide whether to renew the Agreements for an additional one-year term. Accordingly, a meeting was held on September 18, 2018 to discuss and review the Agreements with respect to the Fund. Prior to the meeting held on September 18, 2018, the Board, including the Independent Trustees, reviewed written materials from the Adviser and the Sub-Adviser regarding, among other things: (i) the nature, extent and quality of the services to be provided to fund shareholders by the Adviser and the Sub-Adviser; (ii) the Adviser and the Sub-Adviser’s costs and profits expected to be realized in providing their services, including any fall-out benefits expected to be enjoyed by the Adviser and the Sub-Adviser; and (iii) the existence, or anticipated existence, of economies of scale.
Prior to and at the meeting held on September 18, 2018, representatives from the Adviser and the Sub-Adviser, along with other service providers of the Fund, presented additional oral and written information to help the Board evaluate the Adviser and the Sub-Adviser’s fees and other aspects of the Agreements. Among other things, representatives from the Adviser and the Sub-Adviser provided overviews of their advisory businesses, including investment personnel and investment processes. The representatives also discussed the rationale for launching the Fund, the Fund’s fees and fee structures of comparable investment companies. The Board then discussed the written materials that it received before the meeting and the Adviser and Sub-Adviser’s oral presentations and any other information that the Board received at the meeting, and deliberated on the approval of the Agreements in light of this information. In its deliberations, the Board did not identify any single piece of information discussed below that was all-important, controlling or determinative of its decision.
Nature, Extent and Quality of Services. In evaluating the nature, extent and quality of the Adviser’s services, the Trustees considered information concerning the functions to be performed by the Adviser and the Sub-Adviser and the personnel and resources of the Adviser and Sub-Adviser, including the investment management team that will be responsible for the day-to-day management of the Fund and the portfolio manager responsible for investing the portfolio of the Fund. The Trustees considered statements by the Adviser and Sub-Adviser regarding its respective financial condition, that each was financially stable and could support its performance of the services under its Agreement. The Trustees also considered the services to be provided by the Adviser in its oversight of the Fund’s service providers.
Based on their review, the Trustees concluded that the nature, extent and quality of the services to be provided by the Adviser and Sub-Adviser to the Fund under the respective Agreement were expected to be appropriate and reasonable.
Fees, Expenses and Profitability. The Trustees discussed the information provided by the Adviser on the Fund’s proposed investment management fee of 0.65% as compared to information provided by the Adviser on other similar products. The Trustees also considered that the Adviser and Sub-Adviser had managed this account to the Board’s satisfaction over the course of the previous three years. The Trustees noted that the proposed annual investment management fee to be charged to the Fund was a unitary fee, and that the Adviser has agreed to pay all other expenses of the Fund, including fees payable to the Sub-Adviser, except brokerage commissions and other expenses connected with the execution of portfolio transactions, taxes, interest, distribution and service fees payable pursuant to a 12b-1 Plan, if any, and extraordinary expenses. The Board concluded that the unitary investment management fee to be charged to the Fund is reasonable and appropriate in light of the services expected to be provided by the Adviser and Sub-Adviser. In conjunction with their
43
Amplify ETF Trust
Board Considerations Regarding Approval of
Investment Management Agreement and Sub-Advisory Agreement
October 31, 2018 (Unaudited) (Continued)
review of the unitary investment management fee, the Trustees considered information provided by the Adviser and Sub-Adviser on their costs to be incurred in connection with the proposed Agreement and their estimated profitability and that any profitability would not be excessive. The Trustees concluded that the estimated profits to be realized by the Adviser and Sub-Adviser with respect to the Fund appeared to be reasonable.
Economies of Scale and Whether the Fee Level Reflects These Economies of Scale. The Trustees considered the information provided by the Adviser and the Sub-Adviser as to the extent to which economies of scale may be realized as the Fund grows and whether the fee level reflects economies of scale for the benefit of shareholders. The Trustees noted that any reduction in fixed costs associated with the management of the Fund would be enjoyed by the Adviser and Sub-Adviser, but that a unitary fee provides a level of certainty in expenses for the Fund. The Trustees considered whether the proposed advisory fee rate for the Fund is reasonable in relation to the projected asset size of the Fund. The Trustees noted the Adviser’s and Sub-Adviser’s views on their expectations for growth, noting that, initially, the Adviser did not anticipate any material economies of scale. The Trustees concluded that the flat investment management fee was reasonable and appropriate.
The Trustees noted that the Adviser and Sub-Adviser had not identified any further benefits that it would derive from its relationship with the Fund, and had noted that it will not, initially, have any soft dollar arrangements.
Based on all of the information considered and the conclusions reached, the Board, including the Independent Trustees, determined to approve the Agreements for the Fund.
44
Amplify ETF Trust
Board Considerations Regarding Approval of
Investment Management Agreement and Sub-Advisory Agreement
October 31, 2018 (Unaudited) (Continued)
FOR AMPLIFY CWP DIVIDEND & OPTIONS INCOME ETF (“DIVO”)
Pursuant to Section 15(c) of the Investment Company Act of 1940 (the “1940 Act”), at a meeting held on June 22, 2016, the Board of Trustees (the “Board”) of Amplify ETF Trust (the “Trust”) considered the approval of the following agreements (collectively, the “Agreements”): 1) an Investment Management Agreement between Amplify Investments LLC (the “Adviser”) and the Trust, on behalf of the Amplify CWP Dividend & Options Income ETF (the “Fund”) and 2) an Investment Sub-Advisory Agreement between the Adviser and Penserra Capital Management LLC (“Penserra”), and 3) an Investment Sub-Advisory Agreement between the Adviser and Capital Wealth Planning, LLC (Penserra and Capital Wealth Planning, LLC referred to together as the “Sub-Advisers”) on behalf of the Fund.
After their initial two-year terms, the Agreements must be approved: (i) by the vote of the Trustees or by a vote of the shareholders of the Fund; and (ii) by the vote of a majority of the Trustees who are not parties to the Agreements or “interested persons” of any party thereto, as defined in the 1940 Act (the “Independent Trustees”), cast in person at a meeting called for the purpose of voting on such approval. Each year after the initial two-year term, the Board will call and hold a meeting to decide whether to renew the Agreements for an additional one-year term. In preparation for such meetings, the Board requests and reviews a wide variety of information from the Adviser and the Sub-Advisers. Thus, a meeting was held on June 12, 2018 to discuss and review the Agreements with respect to the Fund.
Prior to the meeting held on June 12, 2018, the Board, including the Independent Trustees, reviewed written materials from the Adviser and the Sub-Advisers regarding, among other things: (i) the nature, extent and quality of the services to be provided to fund shareholders by the Adviser and the Sub-Advisers; (ii) the Adviser and the Sub-Advisers’ costs and profits expected to be realized in providing their services, including any fall-out benefits expected to be enjoyed by the Adviser and the Sub-Advisers; and (iii) the existence, or anticipated existence, of economies of scale.
Prior to and at the meeting held on June 12, 2018, representatives from the Adviser and the Sub-Advisers, along with other service providers of the Fund, presented additional oral and written information to help the Board evaluate the Adviser and the Sub-Advisers’ fees and other aspects of the Agreements. Among other things, representatives from the Adviser and the Sub-Advisers provided overviews of their advisory businesses, including investment personnel and investment processes. The representatives also discussed the rationale for launching the Fund, the Fund’s fees and fee structures of comparable investment companies. The Board then discussed the written materials that it received before the meeting and the Adviser and Sub-Advisers’ oral presentations and any other information that the Board received at the meeting, and deliberated on the approval of the Agreements in light of this information. In its deliberations, the Board did not identify any single piece of information discussed below that was all-important, controlling or determinative of its decision.
Nature, Extent and Quality of Services. In evaluating the nature, extent and quality of the Adviser’s services, the Trustees considered information concerning the functions to be performed by the Adviser and the Sub-Advisers and the personnel and resources of the Adviser and Sub-Advisers, including the investment management team that will be responsible for the day-to-day management of the Fund and the portfolio manager responsible for investing the portfolio of the Fund. The Trustees considered statements by the Adviser and Sub-Advisers regarding its respective financial condition, that each was financially stable and could support its performance of the services under its Agreement. The Trustees also considered the services to be provided by the Adviser in its oversight of the Fund’s service providers.
Based on their review, the Trustees concluded that the nature, extent and quality of the services to be provided by the Adviser and Sub-Advisers to the Fund under the respective Agreement were expected to be appropriate and reasonable.
Fees, Expenses and Profitability. The Trustees discussed the information provided by the Adviser on the Fund’s proposed investment management fee of 0.95%, as compared to information provided by the Adviser on other similar products. The Trustees also considered that the Adviser and Sub-Advisers did not manage any similar accounts. The Trustees noted that the proposed annual investment management fee to be charged to the Fund was a unitary fee, and that the Adviser has agreed to pay all other expenses of the Fund, including fees payable to the Sub-Advisers, except brokerage commissions and other expenses connected with the execution of portfolio transactions, taxes, interest, distribution and service fees payable pursuant to a 12b-1 Plan, if any, and extraordinary expenses. The Board concluded that the unitary investment management fee to be charged to the Fund is reasonable and appropriate in light of the services expected to be provided by the Adviser and Sub-Advisers. In conjunction with their review of the unitary investment management fee, the Trustees considered information provided by the Adviser on its costs to be incurred in connection with the proposed Agreement and
45
Amplify ETF Trust
Board Considerations Regarding Approval of
Investment Management Agreement and Sub-Advisory Agreement
October 31, 2018 (Unaudited) (Continued)
its estimated profitability, and noted the Adviser’s statement that it would not likely be profitable in its first year of operating the Fund and that any profitability would not be excessive. The Trustees concluded that the estimated profits to be realized by the Adviser with respect to the Fund appeared to be reasonable.
Economies of Scale and Whether the Fee Level Reflects These Economies of Scale. The Trustees considered the information provided by the Adviser as to the extent to which economies of scale may be realized as the Fund grows and whether the fee level reflects economies of scale for the benefit of shareholders. The Trustees noted that any reduction in fixed costs associated with the management of the Fund would be enjoyed by the Adviser and Sub-Advisers, but that a unitary fee provides a level of certainty in expenses for the Fund. The Trustees considered whether the proposed advisory fee rate for the Fund is reasonable in relation to the projected asset size of the Fund. The Trustees noted the Adviser’s views on its expectations for growth, noting that, initially, the Adviser did not anticipate any material economies of scale. The Trustees concluded that the flat investment management fee was reasonable and appropriate.
The Trustees noted that the Adviser and Sub-Advisers had not identified any further benefits that it would derive from its relationship with the Fund, and had noted that it will not, initially, have any soft dollar arrangements.
Based on all of the information considered and the conclusions reached, the Board, including the Independent Trustees, determined to approve the Agreement for the Fund.
46
Amplify ETF Trust
Board Considerations Regarding Approval of
Investment Management Agreement and Sub-Advisory Agreement
October 31, 2018 (Unaudited) (Continued)
FOR AMPLIFY ADVANCED BATTERIES METALS & MATERIALS ETF (“BATT”)
Pursuant to Section 15(c) of the Investment Company Act of 1940 (the “1940 Act”), at a meeting held on March 13, 2018, the Board of Trustees (the “Board”) of Amplify ETF Trust (the “Trust”) considered the approval of the following agreements (collectively, the “Agreements”): 1) an Investment Management Agreement between Amplify Investments LLC (the “Adviser”) and the Trust, on behalf of the Amplify Advanced Batteries Metals & Materials ETF (the “Fund”) and 2) an Investment Co-Sub-Advisory Agreements between the Adviser and (i) Toroso Investments, LLC (“Toroso”) and (ii) CSat Investment Advisory, L.P., doing business as Exponential ETF,(“Exponential ETF”), on behalf of the Fund. Toroso and Exponential ETF will collectively hereinafter as “Sub-Adviser”).
After their initial two-year terms, the Agreements must be approved: (i) by the vote of the Trustees or by a vote of the shareholders of the Fund; and (ii) by the vote of a majority of the Trustees who are not parties to the Agreements or “interested persons” of any party thereto, as defined in the 1940 Act (the “Independent Trustees”), cast in person at a meeting called for the purpose of voting on such approval. Each year after the initial two-year term, the Board will call and hold a meeting to decide whether to renew the Agreements for an additional one-year term. In preparation for such meetings, the Board requests and reviews a wide variety of information from the Adviser and the Sub-Adviser.
Prior to the meeting held on March 13, 2018, the Board, including the Independent Trustees, reviewed written materials from the Adviser and the Sub-Adviser regarding, among other things:(i) the nature, extent and quality of the services to be provided to fund shareholders by the Adviser and the Sub-Adviser; (ii) the Adviser and the Sub-Adviser’s costs and profits expected to be realized in providing their services, including any fall-out benefits expected to be enjoyed by the Adviser and the Sub-Adviser; and (iii) the existence, or anticipated existence, of economies of scale.
Prior to and at the meeting held on March 13, 2018, representatives from the Adviser and the Sub-Adviser, along with other service providers of the Fund, presented additional oral and written information to help the Board evaluate the Adviser and the Sub-Adviser’s fees and other aspects of the Agreements. Among other things, representatives from the Adviser and the Sub-Adviser provided overviews of their advisory businesses, including investment personnel and investment processes. The representatives also discussed the rationale for launching the Fund, the Fund’s fees and fee structures of comparable investment companies. The Board then discussed the written materials that it received before the meeting and the Adviser and Sub-Adviser’s oral presentations and any other information that the Board received at the meeting, and deliberated on the approval of the Agreements in light of this information. In its deliberations, the Board did not identify any single piece of information discussed below that was all-important, controlling or determinative of its decision.
Nature, Extent and Quality of Services. In evaluating the nature, extent and quality of the Adviser’s services, the Trustees considered information concerning the functions to be performed by the Adviser and the Sub-Adviser and the personnel and resources of the Adviser and Sub-Adviser, including the investment management team that will be responsible for the day-to-day management of the Fund and the portfolio manager responsible for investing the portfolio of the Fund. The Trustees also considered statements by the Adviser and Sub-Adviser regarding their respective financial conditions, that each was financially stable and could support its performance of the services under its Agreement. The Trustees also considered the services to be provided by the Adviser in its oversight of the Fund’s service providers.
Based on their review, the Trustees concluded that the nature, extent and quality of the services to be provided by the Adviser and Sub-Adviser to the Fund under the respective Agreement were expected to be appropriate and reasonable.
Fees, Expenses and Profitability. The Trustees discussed the information provided by the Adviser on the Fund’s proposed an initial investment management fee of 0.70%,1 as compared to information provided by the Adviser on other similar products. The Trustees also considered that the Adviser and Sub-Adviser did not manage any similar accounts. The Trustees noted that the proposed annual investment management fee to be charged to the Fund was a unitary fee, and that the Adviser has agreed to pay all other expenses of the Fund, including fees payable to the Sub-Adviser, except brokerage commissions and other expenses connected with the execution of portfolio transactions, taxes, interest, distribution and service fees payable pursuant to a 12b-1 Plan, if any, and extraordinary expenses.
1 | The Adviser proposed, and the Board approved, that the Adviser fee initially be set at 70 basis points, in the form of one year fee waiver, with a 90 basis point overall expense ratio. |
47
Amplify ETF Trust
Board Considerations Regarding Approval of
Investment Management Agreement and Sub-Advisory Agreement
October 31, 2018 (Unaudited) (Continued)
The Board concluded that the unitary investment management fee to be charged to the Fund is reasonable and appropriate in light of the services expected to be provided by the Adviser and Sub-Adviser. In conjunction with their review of the unitary investment management fee, the Trustees considered information provided by the Adviser on its costs to be incurred in connection with the proposed Agreement and its estimated profitability, and noted the Adviser’s statement that it would not likely be profitable in its first year of operating the Fund and that any profitability would not be excessive. The Trustees concluded that the estimated profits to be realized by the Adviser with respect to the Fund appeared to be reasonable.
Economies of Scale and Whether the Fee Level Reflects These Economies of Scale. The Trustees considered the information provided by the Adviser as to the extent to which economies of scale may be realized as the Fund grows and whether the fee level reflects economies of scale for the benefit of shareholders. The Trustees noted that any reduction in fixed costs associated with the management of the Fund would be enjoyed by the Adviser and Sub-Adviser, but that a unitary fee provides a level of certainty in expenses for the Fund. The Trustees considered whether the proposed advisory fee rate for the Fund is reasonable in relation to the projected asset size of the Fund. The Trustees noted the Adviser’s views on its expectations for growth, noting that, initially, the Adviser did not anticipate any material economies of scale. The Trustees concluded that the flat investment management fee was reasonable and appropriate.
The Trustees noted that the Adviser and Sub-Adviser had not identified any further benefits that it would derive from its relationship with the Fund, and had noted that it will not, initially, have any soft dollar arrangements.
Based on all of the information considered and the conclusions reached, the Board, including the Independent Trustees, determined to approve the Agreement for the Fund.
48
Amplify ETF Trust
Board Considerations Regarding Approval of
Investment Management Agreement and Sub-Advisory Agreement
October 31, 2018 (Unaudited) (Continued)
FOR AMPLIFY EASI TACTICAL GROWTH INDEX ETF (“EASI”)
Pursuant to Section 15(c) of the Investment Company Act of 1940 (the “1940 Act”), at a meeting held on March 13, 2018, the Board of Trustees (the “Board”) of Amplify ETF Trust (the “Trust”) considered the approval of the following agreements (collectively, the “Agreements”): 1) an Investment Management Agreement between Amplify Investments LLC (the “Adviser”) and the Trust, on behalf of the Amplify EASI Tactical Growth Index ETF (the “Fund”) and 2) an Investment Sub-Advisory Agreement between the Adviser and Penserra Capital Management LLC (the “Sub-Adviser”), on behalf of the Fund.
After their initial two-year terms, the Agreements must be approved: (i) by the vote of the Trustees or by a vote of the shareholders of the Fund; and (ii) by the vote of a majority of the Trustees who are not parties to the Agreements or “interested persons” of any party thereto, as defined in the 1940 Act (the “Independent Trustees”), cast in person at a meeting called for the purpose of voting on such approval. Each year after the initial two-year term, the Board will call and hold a meeting to decide whether to renew the Agreements for an additional one-year term. In preparation for such meetings, the Board requests and reviews a wide variety of information from the Adviser and the Sub-Adviser.
Prior to the meeting held on March 13, 2018, the Board, including the Independent Trustees, reviewed written materials from the Adviser and the Sub-Adviser regarding, among other things:(i) the nature, extent and quality of the services to be provided to fund shareholders by the Adviser and the Sub-Adviser; (ii) the Adviser and the Sub-Adviser’s costs and profits expected to be realized in providing their services, including any fall-out benefits expected to be enjoyed by the Adviser and the Sub-Adviser; and (iii) the existence, or anticipated existence, of economies of scale.
Prior to and at the meeting held on March 13, 2018, representatives from the Adviser and the Sub-Adviser, along with other service providers of the Fund, presented additional oral and written information to help the Board evaluate the Adviser and the Sub-Adviser’s fees and other aspects of the Agreements. Among other things, representatives from the Adviser and the Sub-Adviser provided overviews of their advisory businesses, including investment personnel and investment processes. The representatives also discussed the rationale for launching the Fund, the Fund’s fees and fee structures of comparable investment companies. The Board then discussed the written materials that it received before the meeting and the Adviser and Sub-Adviser’s oral presentations and any other information that the Board received at the meeting, and deliberated on the approval of the Agreements in light of this information. In its deliberations, the Board did not identify any single piece of information discussed below that was all-important, controlling or determinative of its decision.
Nature, Extent and Quality of Services. In evaluating the nature, extent and quality of the Adviser’s services, the Trustees considered information concerning the functions to be performed by the Adviser and the Sub-Adviser and the personnel and resources of the Adviser and Sub-Adviser, including the investment management team that will be responsible for the day-to-day management of the Fund and the portfolio manager responsible for investing the portfolio of the Fund. The Trustees also considered statements by the Adviser and Sub-Adviser regarding their respective financial conditions, that each was financially stable and could support its performance of the services under its Agreement. The Trustees also considered the services to be provided by the Adviser in its oversight of the Fund’s service providers.
Based on their review, the Trustees concluded that the nature, extent and quality of the services to be provided by the Adviser and Sub-Adviser to the Fund under the respective Agreement were expected to be appropriate and reasonable.
Fees, Expenses and Profitability. The Trustees discussed the information provided by the Adviser on the Fund’s proposed an initial investment management fee of 0.75%, as compared to information provided by the Adviser on other similar products. The Trustees also considered that the Adviser and Sub-Adviser did not manage any similar accounts. The Trustees noted that the proposed annual investment management fee to be charged to the Fund was a unitary fee, and that the Adviser has agreed to pay all other expenses of the Fund, including fees payable to the Sub-Adviser, except brokerage commissions and other expenses connected with the execution of portfolio transactions, taxes, interest, distribution and service fees payable pursuant to a 12b-1 Plan, if any, and extraordinary expenses. The Board concluded that the unitary investment management fee to be charged to the Fund is reasonable and appropriate in light of the services expected to be provided by the Adviser and Sub-Adviser. In conjunction with their review of the unitary investment management fee, the Trustees considered information provided by the Adviser on its costs to be incurred in connection with the proposed Agreement
49
Amplify ETF Trust
Board Considerations Regarding Approval of
Investment Management Agreement and Sub-Advisory Agreement
October 31, 2018 (Unaudited) (Continued)
and its estimated profitability, and noted the Adviser’s statement that it would not likely be profitable in its first year of operating the Fund and that any profitability would not be excessive. The Trustees concluded that the estimated profits to be realized by the Adviser with respect to the Fund appeared to be reasonable.
Economies of Scale and Whether the Fee Level Reflects These Economies of Scale. The Trustees considered the information provided by the Adviser as to the extent to which economies of scale may be realized as the Fund grows and whether the fee level reflects economies of scale for the benefit of shareholders. The Trustees noted that any reduction in fixed costs associated with the management of the Fund would be enjoyed by the Adviser and Sub-Adviser, but that a unitary fee provides a level of certainty in expenses for the Fund. The Trustees considered whether the proposed advisory fee rate for the Fund is reasonable in relation to the projected asset size of the Fund. The Trustees noted the Adviser’s views on its expectations for growth, noting that, initially, the Adviser did not anticipate any material economies of scale. The Trustees concluded that the flat investment management fee was reasonable and appropriate.
The Trustees noted that the Adviser and Sub-Adviser had not identified any further benefits that it would derive from its relationship with the Fund, and had noted that it will not, initially, have any soft dollar arrangements.
Based on all of the information considered and the conclusions reached, the Board, including the Independent Trustees, determined to approve the Agreement for the Fund.
50
Amplify ETF Trust
Disclosure of Fund Expenses
October 31, 2018 (Unaudited)
All Exchange Traded Funds (“ETF”) have operating expenses. As a shareholder of an ETF, your investment is affected by these ongoing costs, which include (among others) costs for ETF management, administrative services, brokerage fees and shareholder reports like this one. It is important for you to understand the impact of these costs on your investment returns.
Operating expenses such as these are deducted from an ETF’s gross income and directly reduce its final investment return. These expenses are expressed as a percentage of the ETF’s average net assets; this percentage is known as the ETF’s expense ratio.
The following examples use the expense ratio and are intended to help you understand the ongoing costs (in dollars) of investing in your fund and to compare these costs with those of other funds. The examples are based on investment of $1,000 made at the beginning of the period shown and held for the periods shown below.
The table below illustrates your fund’s costs in two ways:
ACTUAL FUND RETURN
This section helps you to estimate the actual expenses after fee waivers that your fund incurred over the period shown. “Expenses Paid During Period” shows the actual dollar expense cost incurred by a $1,000 investment in the Fund, and the “Ending Account Value” number is derived from deducting that expense cost from the Fund’s gross investment return.
You can use this information, together with the actual amount you invested in the Fund, to estimate the expenses you paid during the period. Simply divide your actual account value by $1,000 to arrive at a ratio (for example, an $8,600 account value divided by $1,000 = 8.6), then multiply that ratio by the number shown for your fund under “Expenses Paid During Period.”
HYPOTHETICAL 5% RETURN
This section helps you compare your fund’s costs with those of other funds. It assumes that the Fund had an annual 5% return before expenses during the year, but that the “Annualized Expense Ratio” for the period is unchanged. This example is useful in making comparisons because the Commission requires all funds to make this 5% calculation. You can assess your fund’s comparative cost by comparing the hypothetical result of your fund under “Expenses Paid During Period” with those that appear in the same charts in the shareholder reports for other funds.
NOTE: Because the return is set at 5% for comparison purposes – NOT your fund’s actual return – the account values shown may not apply to your specific investment.
Amplify Online Retail ETF | Beginning
Account Value
5/01/18 | Ending
Account Value
10/31/18 | Annualized
Expense Ratios | Expenses Paid
During Period(a) |
Actual Fund Return | $ 1,000.00 | $ 979.90 | 0.65% | $3.24 |
Hypothetical 5% Return | $ 1,000.00 | $ 1,021.93 | 0.65% | $3.31 |
Amplify YieldShares CWP Dividend & Option Income ETF | Beginning
Account Value
5/01/18 | Ending
Account Value
10/31/18 | Annualized
Expense Ratios | Expenses Paid
During Period(a) |
Actual Fund Return | $ 1,000.00 | $ 1,047.20 | 0.92% | $4.75 |
Hypothetical 5% Return | $ 1,000.00 | $ 1,020.57 | 0.92% | $4.65 |
51
Amplify ETF Trust
Disclosure of Fund Expenses
October 31, 2018 (Unaudited) (Continued)
Amplify Transformational Data Sharing ETF | Beginning
Account Value
5/01/18 | Ending
Account Value
10/31/18 | Annualized
Expense Ratios | Expenses Paid
During Period(a) |
Actual Fund Return | $ 1,000.00 | $ 913.60 | 0.70% | $3.38 |
Hypothetical 5% Return | $ 1,000.00 | $ 1,021.68 | 0.70% | $3.57 |
Amplify Advanced Battery Metals and Materials ETF | Beginning
Account Value
6/04/18(b) | Ending
Account Value
10/31/18 | Annualized
Expense Ratios | Expenses Paid
During Period |
Actual Fund Return | $ 1,000.00 | $ 643.50 | 0.72% | $2.42(c) |
Hypothetical 5% Return | $ 1,000.00 | $ 1,021.58 | 0.72% | $3.67(a) |
Amplify EASI Tactical Growth ETF | Beginning
Account Value
6/13/18(b) | Ending
Account Value
10/31/18 | Annualized
Expense Ratios | Expenses Paid
During Period |
Actual Fund Return | $ 1,000.00 | $ 951.30 | 0.75% | $2.81(d) |
Hypothetical 5% Return | $ 1,000.00 | $ 1,021.42 | 0.75% | $3.82(a) |
(a) | The dollar amounts shown as expenses paid during the period are equal to the Fund’s annualized expense ratio multiplied by the average account value during the period, multiplied by 184/365 (to reflect the one-half year period). |
(c) | The dollar amount shown as expenses paid during the period for the Amplify Advanced Battery Metals and Materials ETF is multiplied by 150/365, which is the number of days since inception divided by the number of days in the year. |
(d) | The dollar amount shown as expenses paid during the period for the Amplify EASI Tactical Growth ETF is multiplied by 141/365, which is the number of days since inception divided by the number of days in the year. |
52
Amplify ETF Trust
Trustees and Officers of the Trust
October 31, 2018 (Unaudited)
The following chart lists Trustees and Officers as of October 31, 2018.
Set forth below are the names, ages, addresses, position with the Trust, term of office and length of time served, the principal occupations during the past five years, number of portfolios in fund complex overseen by the trustees, and other directorships outside the fund complex of each of the persons currently serving as Trustees and Officers of the Trust. The Funds’ Statement of Additional Information (“SAI”) includes additional information about the Trustees and Officers. The SAI may be obtained without charge by calling 1-855-267-3837. Furthermore, you can obtain the SAI by accessing the Commission’s website at www.sec.gov or by accessing the Funds’ website at www.amplifyetfs.com.
Name, Address, and Year of Birth | Position and
Offices with
the Trust | Term of Office
and Year First
Elected or
Appointed | Principal Occupations
During Past 5 Years | Number of
Portfolios in
Fund Complex
Overseen By
Trustee | Other Directorships
held by Trustee
During Past 5 Years |
Interested Trustees | | | | | |
Christian Magoon (1) c/o Amplify Investments LLC 310 S. Hale Street Wheaton, IL 60187 Y.O.B.: 1974 | Chairman of the Board of Trustees; Chief Executive Officer and President | Indefinite term Since inception | Chief Executive Officer, Magoon Capital (2010 – present); Chief Executive Officer, YieldShares, LLC (2013 – present); Chief Executive Officer, President of Amplify Invesments (2015 – 2018) | 6 | None |
John Phillips (2) c/o Amplify Investments LLC 310 S. Hale Street Wheaton, IL 60187 Y.O.B.: 1958 | Secretary | Indefinite term Since inception | Chief Operation Officer and Head of Product Development, Amplify Investments (2015 – present); Managing Director, White, Weld & Co. (2007 – 2015) | 6 | N/A |
Independent Trustees | | | | | |
Michael DiSanto c/o Amplify Investments LLC 310 S. Hale Street Wheaton, IL 60187 Y.O.B.: 1979 | Trustee | Indefinite term Since inception | Attorney, City of Naperville, Illinois (2007 – present); member, Elder board of the Compass Church, (2013 – present); Adjuct Professor, Aurora University (2012) | 6 | None |
Rick Powers c/o Amplify Investments LLC 310 S. Hale Street Wheaton, IL 60187 Y.O.B.: 1957 | Trustee | Indefinite term Since inception | Deputy Commissioner, Transportation, State of Indiana (2014 – present); Director, Code Enforcement, City of Indianapolis, Indiana (2001 – 2014) | 6 | None |
Mark Tucker c/o Amplify Investments LLC 310 S. Hale Street Wheaton, IL 60187 Y.O.B.: 1963 | Trustee | Indefinite term Since inception | Sole member, Aspen Equity Partners, LLC (2009 – present); New Liberty Popcorn, LLC (2015 – present) | 6 | None |
53
Amplify ETF Trust
Trustees and Officers of the Trust
October 31, 2018 (Unaudited) (Continued)
Name, Address, and Year of Birth | Position and
Offices with
the Trust | Term of Office
and Year First
Elected or
Appointed | Principal Occupations During Past 5 Years | Other Directorships
Held |
Officers | | | | |
Ed Keiley c/o Amplify Investments LLC 310 S. Hale Street Wheaton, IL 60187 Y.O.B.: 1965 | Chief Compliance Officer | Indefinite term Since inception | Chief Compliance Officer, Amplify Investments (2016 – present); Trader Compliance, Inc. (2003 – present) | N/A |
Bradley H. Bailey c/o Amplify Investments LLC 310 S. Hale Street Wheaton, IL 60187 Y.O.B.: 1967 | Chief Financial Officer | Indefinite term 2016 | Chief Financial Officer, Amplify Investments (2016 – present); Chief Financial Officer, Copia Capital LLC (2014 – 2016); Chief Financial Officer, Central Square Management LLC (2011 – 2014) | N/A |
(1) | Mr. Magoon is deemed an “interested person” of the Trust due to his position as Chief Executive Officer and President of Amplify Investments and the Trust. |
(2) | Mr. Phillips is deemed an “interested person” of the Trust due to his position as Chief Operating Officer of Amplify Investments and Secretary of the Trust. |
54
Amplify ETF Trust
Additional Information
October 31, 2018 (Unaudited)
Qualified Dividend Income/Dividends Received Deduction
For the fiscal year/period ended October 31, 2018, certain dividends paid by the Funds may be subject to a maximum tax rate of 23.8%, as provided for by the Jobs and Growth Tax Relief Reconciliation Act of 2003.
The percentage of dividends declared from ordinary income designated as qualified dividend income was as follows:
Amplify Online Retail ETF | 0.00% |
Amplify YieldShares CWP Dividend & Option Income ETF | 58.77% |
Amplify Transformational Data Sharing ETF | 0.00% |
Amplify Advanced Battery Metals and Materials ETF | 0.00% |
Amplify EASI Tactical Growth ETF | 0.00% |
For corporate shareholders, the percent of ordinary income distributions qualifying for the corporate dividends received deduction for the fiscal year/period ended October 31, 2018 was as follows:
Amplify Online Retail ETF | 0.00% |
Amplify YieldShares CWP Dividend & Option Income ETF | 59.68% |
Amplify Transformational Data Sharing ETF | 0.00% |
Amplify Advanced Battery Metals and Materials ETF | 0.00% |
Amplify EASI Tactical Growth ETF | 0.00% |
Short Term Capital Gains
The percentage of taxable ordinary income distributions that are designated as short-term capital gain distributions under Internal Revenue Section 871(k)(2)(C) for each fund were as follows:
Amplify Online Retail ETF | 0.00% |
Amplify YieldShares CWP Dividend & Option Income ETF | 59.58% |
Amplify Transformational Data Sharing ETF | 0.00% |
Amplify Advanced Battery Metals and Materials ETF | 0.00% |
Amplify EASI Tactical Growth ETF | 0.00% |
Foreign Tax Credit Pass Through
Pursuant to Section 853 of the Internal Revenue Code, the Fund designates the following amount as foreign taxes paid for the period ended October 31, 2018. Foreign taxes paid for purposes of Section 853 may be less than actual foreign taxes paid for financial statement purposes.
| | Credible Foreign
Taxes Paid | Per Share
Amount | Portion of
Ordinary Income
Distribution Derived
from Foreign
Sourced Income |
Amplify Transformational Data Sharing ETF | $ 150,758 | $ 0.0200 | 62.54% |
Amplify Advanced Battery Metals and Materials ETF | $ 9,889 | $ 0.0200 | 95.86% |
Foreign taxes paid or withheld should be included in taxable income with an offsetting deduction from gross income or as a credit for taxes paid to foreign governments.
Above figures may differ from those cited elsewhere in this report due to difference in the calculation of income and gains under GAAP purposes and Internal Revenue Service purposes.
Shareholders are strongly advised to consult their own tax advisers with respect to the tax consequences of their investments in the Funds.
55
Amplify ETF Trust
Supplemental Information
October 31, 2018 (Unaudited)
DISTRIBUTION OF PREMIUMS AND DISCOUNTS
NAV is the price per share at which the Fund issues and redeems shares. It is calculated in accordance with the standard formula for valuing mutual fund shares. The “Market Price” of the Fund generally is determined using the composite closing price each day. The Fund’s Market Price may be at, above or below its NAV. The NAV of the Fund will fluctuate with changes in the market value of the Fund’s holdings. The Market Price of the Fund will fluctuate in accordance with changes in its NAV, as well as market supply and demand.
Premiums or discounts are the differences (expressed as a percentage) between the NAV and Market Price of the Fund on a given day, generally at the time NAV is calculated. A premium is the amount that the Fund is trading above the reported NAV, expressed as a percentage of the NAV. A discount is the amount that the Fund is trading below the reported NAV, expressed as a percentage of the NAV.
Further information regarding premiums and discounts is available, without charge, on the Fund’s website at www.amplifyetfs.com.
INFORMATION ABOUT THE TRUSTEES
The Statement of Additional Information (“SAI”) includes additional information about the Fund’s Trustees and is available without charge, upon request, by calling 1-855-267-3837. Furthermore, you can obtain the SAI by accessing the Commission’s website at www.sec.gov or by accessing the Fund’s website at www.amplifyetfs.com.
DELIVERY OF SHAREHOLDER DOCUMENTS—HOUSEHOLDING
Householding is an option available to certain investors of the Fund. Householding is a method of delivery, based on the preference of the individual investor, in which a single copy of certain shareholder documents can be delivered to investors who share the same address, even if their accounts are registered under different names. Householding for the Fund is available through certain broker-dealers. If you are interested in enrolling in householding and receiving a single copy of the prospectus and other shareholder documents, please contact your broker-dealer. If you currently are enrolled in householding and wish to change your householding status, please contact your broker-dealer.
56
Amplify ETF Trust
Privacy Policy
October 31, 2018 (Unaudited)
AMPLIFY ETFS AND AMPLIFY AFFILIATES PRIVACY POLICY
Amplify recognizes the importance of protecting your personal and financial information when you visit our websites (each a “Website” and together “Websites”). This Policy is designed to help you understand the information collection practices on all Websites owned or operated by or on behalf of companies within the Amplify group of companies, including: Amplify Investments LLC, Amplify Development LLC, and Amplify Holding Company LLC. We are committed to:
(a) protecting the personal information you provide to us;
(b) telling you how we use the information we gather about you; and
(c) ensuring that you know why we intend to disclose your personal information.
CHANGES TO THIS PRIVACY POLICY
This Privacy Policy is dated January 1, 2016. Amplify reserves the right to amend this Privacy Policy at any time without notice, by updating this posting, in which case the date of the Policy will be revised. The current version of this Policy can be accessed from the link on the www.amplifyetfs.com homepage.
INFORMATION COLLECTION AND USE
Personally Identifiable Information: The personally identifiable information you submit to our Websites is used to service your interest and to improve our services to you and/or to provide you with information on Amplify products and services. The types of personal information that may be collected at our Websites include: name, address, email address and telephone number. We will not sell, share or rent your personally identifiable information to others in contravention of this Privacy Policy.
Additionally, if the Website is a password protected site, then (a) once you submit your password and enter, the Website will recognize who you are and will collect all information that you submit, including all electronic instructions (including all transaction information), and (b) any information collected about you from the Website may be associated with other identifying information that we have about you.
Aggregate Information: We generally record certain usage information, such as the number and frequency of visitors to our Websites. This information may include the websites that you access immediately before and after your visit to our Websites, the Internet browser you are using and your IP address. If we use such data at all it will be on an aggregate basis, and we will not disclose to third parties any information that could be used to identify you personally.
Service Providers: We may use internal or external service providers to operate our Websites and employ other persons to perform work on our behalf, such as sending postal mail and e-mail. These persons may have access to the personally identifiable information you submit through the Websites, but only for the purpose of performing their duties. These personnel may not use your personally identifiable information for any other purpose.
Compliance with Laws: We do not automatically collect personally identifiable information from visitors to our Websites, except to the extent we are required to do so pursuant to some statute or regulation applicable to us. We will not provide any personally identifiable information to any other persons, except if we are required to make disclosures by any law, any government or private parties in connection with a lawsuit, subpoena, investigation or similar proceeding.
E-mail and Marketing: Amplify does not sell its customers’ e-mail addresses, nor will we provide your personal information to third parties for their marketing purposes. Amplify will not send you e-mail messages without first receiving your permission, unless it relates to servicing your account or unless you have consented to receiving electronic delivery of fund documents as part of our E-Delivery service. It is our policy to include instructions for unsubscribing from these permission-based programs. We recommend that you do not send us any individual personal information via non secure methods of correspondence, including via public electronic communication channels, such as Internet e-mail, which are generally not secure.
57
Amplify ETF Trust
Privacy Policy
October 31, 2018 (Unaudited) (Continued)
Business Transfers: If the business, stock or assets of Amplify are acquired or merged with another business entity, we will share all or some of your information with this entity to continue to provide our service to you. You will receive notice of such an event and the new entity will inform you of any changes to the practices in this Privacy Policy. If the new entity wishes to make additional use of your information, you may decline such use at such time.
Disclosure to Third Parties: The personal information you provide to us will only be disclosed to third parties if we have your permission, or as set out in this Privacy Policy. We may disclose details about the general use of our Websites to third parties – for example, to demonstrate patterns of use to advertisers and other business partners. Information we pass on for this purpose will not include any personal information by which you may be identified. We endeavor to prevent unauthorized disclosures of your personal information by third parties but we are not responsible for any unauthorized disclosures or other breaches of security or for the actions of others if the information was passed to them with your authority or with the authority of anyone other than us or our group companies.
COOKIES
What are Cookies?
Cookies are small text files that are stored in your computer’s memory and hard drive when you visit certain web pages. They are used to enable websites to function or to provide information to the owners of a website.
Why Do We Use Cookies?
Cookies help us to provide customized services and information. We use cookies on all our Websites to tell us, in general terms, how and when pages in our Websites are visited, what our users’ technology preferences are – such as what type of video player they use – and whether our Websites are functioning properly.
If you are using one of our password-protected sites, then the website may use cookies or other technology to help us authenticate you, store and recognize your configuration and user attributes, facilitate your navigation of the website and customize its content so that the information made available is likely to be of more interest to you.
In broad terms, we use cookies on our Websites for the following purposes:
● | Analytical purposes: Analytical cookies allow us to recognize measure and track visitors to our Websites. This helps us to improve and develop the way our Websites work, for example, by determining whether site visitors can find information easily, or by identifying the aspects of websites that are of the most interest to them. |
● | Usage preferences: Some of the cookies on our Websites are activated when visitors to our sites make a choice about their usage of the site. Our Websites then ‘remember’ the settings preferences of the user concerned. This allows us to tailor aspects of our sites to the individual user. |
● | Terms and conditions: We use cookies on our Websites to record when a site visitor has seen a policy, such as this one, or provided consent, such as consent to the terms and conditions on our Websites. This helps to improve the user’s experience of the site – for example, it avoids a user from repeatedly being asked to consent to the same terms. |
● | Session management: The software that runs our websites uses cookies for technical purposes needed by the internal workings of our servers. For instance, we use cookies to distribute requests among multiple servers, authenticate users and determine what features of the site they can access, verify the origin of requests, keep track of information about a user’s session and determine which options or pages to display in order for the site to function. |
● | Functional purposes: Functional purpose cookies store information that is needed by our applications to process and operate. For example, where transactions or requests within an application involve multiple workflow stages, cookies are used to store the information from each stage temporarily, in order to facilitate completion of the overall transaction or request. |
58
Amplify ETF Trust
Privacy Policy
October 31, 2018 (Unaudited) (Continued)
Further Information About Cookies
If you would like to find out more about cookies in general and how to manage them, please visit www.allaboutcookies.org.
THIRD PARTY WEBSITES
Amplify disclaims responsibility for the privacy policies and customer information practices of third party internet websites hyperlinked from our Website or this Privacy Policy.
SECURITY
Amplify protects your personal information when you transact business on our Website by requiring the use of a browser software program that supports industry standard SSL encryption with 128-bit key lengths. The “128-bit” designation refers to the length of the key used to encrypt the data being transmitted, with a longer key representing a higher level of security.
CONTACT US
We welcome inquiries or comments about our Privacy Policy and any queries or concerns about Amplify ETFs at support@amplifyetfs.com or 1-855-267-3837.
59
THIS PAGE INTENTIONALLY LEFT BLANK
THIS PAGE INTENTIONALLY LEFT BLANK
Investment Adviser:
Amplify Investments, LLC
310 South Hale Street
Wheaton, IL 60187
Investment Sub-Advisers:
Penserra Capital Management, LLC
4 Orinda Way, Suite 100-A
Orinda, CA 94563 | Capital Wealth Planning, LLC
1016 Collier Center Way
Naples, FL 34110 |
Exponential ETFs
625 Avis Drive
Ann Arbor, MI 48108 | Toroso Investments, LLC
623 5th Avenue, Suite 15
New York, NY 10019 |
Legal Counsel:
Chapman and Cutler LLP
111 West Monroe Street
Chicago, IL 60603 |
Independent Registered Public Accounting Firm:
Cohen & Company, Ltd.
1350 Euclid Avenue, Suite 800
Cleveland, OH 44115
Distributor:
Quasar Distributors, LLC
777 East Wisconsin Avenue, 6th Floor
Milwaukee, WI 53202
Administrator:
U.S. Bancorp Fund Services, LLC
777 East Wisconsin Avenue
Milwaukee, WI 53202
Transfer Agent:
U.S. Bancorp Fund Services, LLC
615 East Michigan Street
Milwaukee, WI 53202
Custodian:
U.S. Bank National Association
1555 North RiverCenter Drive, Suite 302
Milwaukee, WI 53212
This information must be preceded or accompanied by a current prospectus for the Funds.
Item 2. Code of Ethics.
The registrant has adopted a code of ethics that applies to the registrant’s principal executive officer and principal financial officer. The registrant has not made any substantive amendments to its code of ethics during the period covered by this report. The registrant has not granted any waivers from any provisions of the code of ethics during the period covered by this report.
A copy of the registrant’s Code of Ethics is filed herewith.
Item 3. Audit Committee Financial Expert.
The registrant’s board of trustees has determined that there is at least one audit committee financial expert serving on its audit committee. Mark Tucker is the “audit committee financial expert” and is considered to be “independent” as each term is defined in Item 3 of Form N-CSR
Item 4. Principal Accountant Fees and Services.
The registrant has engaged its principal accountant to perform audit services, audit-related services, tax services and other services during the past two fiscal years. “Audit services” refer to performing an audit of the registrant's annual financial statements or services that are normally provided by the accountant in connection with statutory and regulatory filings or engagements for those fiscal years. “Audit-related services” refer to the assurance and related services by the principal accountant that are reasonably related to the performance of the audit. “Tax services” refer to professional services rendered by the principal accountant for tax compliance, tax advice, and tax planning. There were no “Other services” provided by the principal accountant. The following table details the aggregate fees billed or expected to be billed for each of the last two fiscal years for audit fees, audit-related fees, tax fees and other fees by the principal accountant.
| | FYE 10/31/2018 | FYE 10/31/2017 |
| Audit Fees | $71,500 | $72,500 |
| Audit-Related Fees | $0 | $0 |
| Tax Fees | $15,000 | $21,500 |
| All Other Fees | N/A | N/A |
The audit committee has adopted pre-approval policies and procedures that require the audit committee to pre-approve all audit and non-audit services of the registrant, including services provided to any entity affiliated with the registrant.
The percentage of fees billed by Cohen & Company, Ltd. applicable to non-audit services pursuant to waiver of pre-approval requirement were as follows:
| | FYE 10/31/2018 | FYE 10/31/2017 |
| Audit-Related Fees | 0% | 0% |
| Tax Fees | 0% | 0% |
| All Other Fees | 0% | 0% |
All of the principal accountant’s hours spent on auditing the registrant’s financial statements were attributed to work performed by full-time permanent employees of the principal accountant. (If more than 50 percent of the accountant’s hours were spent to audit the registrant's financial statements for the most recent fiscal year, state how many hours were attributed to work performed by persons other than the principal accountant's full-time, permanent employees.)
The following table indicates the non-audit fees billed or expected to be billed by the registrant’s accountant for services to the registrant and to the registrant’s investment adviser (and any other controlling entity, etc.—not sub-adviser) for the last two years. The audit committee of the board of trustees/directors has considered whether the provision of non-audit services that were rendered to the registrant's investment adviser is compatible with maintaining the principal accountant's independence and has concluded that the provision of such non-audit services by the accountant has not compromised the accountant’s independence.
| Non-Audit Related Fees | FYE 10/31/2018 | FYE 10/31/2017 |
| Registrant | $15,000 | $21,500 |
| Registrant’s Investment Adviser | $0 | $0 |
Item 5. Audit Committee of Listed Registrants.
The registrant is an issuer as defined in Rule 10A-3 under the Securities Exchange Act of 1934, (the “Act”) and has a separately-designated standing audit committee established in accordance with Section 3(a)(58)(A) of the Act. The independent members of the committee are as follows: Michael DiSanto, Rick Powers, and Mark Tucker.
Item 6. Investments.
| (a) | Schedule of Investments is included as part of the report to shareholders filed under Item 1 of this Form. |
Item 7. Disclosure of Proxy Voting Policies and Procedures for Closed-End Management Investment Companies.
Not applicable to open-end investment companies.
Item 8. Portfolio Managers of Closed-End Management Investment Companies.
Not applicable to open-end investment companies.
Item 9. Purchases of Equity Securities by Closed-End Management Investment Company and Affiliated Purchasers.
Not applicable to open-end investment companies.
Item 10. Submission of Matters to a Vote of Security Holders.
There have been no material changes to the procedures by which shareholders may recommend nominees to the registrant’s board of trustees
Item 11. Controls and Procedures.
| (a) | The Registrant’s [President/Principal Executive Officer] and [Treasurer/Principal Financial Officer] have reviewed the Registrant's disclosure controls and procedures (as defined in Rule 30a-3(c) under the Investment Company Act of 1940 (the “Act”)) as of a date within 90 days of the filing of this report, as required by Rule 30a-3(b) under the Act and Rules 13a-15(b) or 15d-15(b) under the Securities Exchange Act of 1934. Based on their review, such officers have concluded that the disclosure controls and procedures are effective in ensuring that information required to be disclosed in this report is appropriately recorded, processed, summarized and reported and made known to them by others within the Registrant and by the Registrant’s service provider. |
| (b) | There were no changes in the Registrant's internal control over financial reporting (as defined in Rule 30a-3(d) under the Act) that occurred during the second fiscal quarter of the period covered by this report that have materially affected, or are reasonably likely to materially affect, the Registrant's internal control over financial reporting. |
Item 12. Disclosure of Securities Lending Activities for Closed-End Management Investment Companies
Not applicable to open-end investment companies.
Item 13. Exhibits.
| (a) | (1) Any code of ethics or amendment thereto, that is the subject of the disclosure required by Item 2, to the extent that the registrant intends to satisfy Item 2 requirements through filing an exhibit. Filed herewith |
(2) A separate certification for each principal executive officer and principal financial officer pursuant to Section 302 of the Sarbanes-Oxley Act of 2002. Filed herewith.
(3) Any written solicitation to purchase securities under Rule 23c-1 under the Act sent or given during the period covered by the report by or on behalf of the registrant to 10 or more persons. Not applicable to open-end investment companies.
| (1) | Change in the registrant’s independent public accountant. There was no change in the registrant’s independent public accountant for the period covered by this report. |
| (b) | Certifications pursuant to Section 906 of the Sarbanes-Oxley Act of 2002. Furnished herewith. |
SIGNATURES
Pursuant to the requirements of the Securities Exchange Act of 1934 and the Investment Company Act of 1940, the registrant has duly caused this report to be signed on its behalf by the undersigned, thereunto duly authorized.
| (Registrant) | Amplify ETF Trust | | |
| | | | |
| By (Signature and Title) | /s/Christian Magoon | |
| | | Christian Magoon, | |
| | | President and Chief Executive Officer | |
| | | | |
| Date | 12/28/2018 | | |
Pursuant to the requirements of the Securities Exchange Act of 1934 and the Investment Company Act of 1940, this report has been signed below by the following persons on behalf of the registrant and in the capacities and on the dates indicated.
| By (Signature and Title) | /s/Christian Magoon | |
| | Christian Magoon, | |
| | President and Chief Executive Officer | |
| | | |
| Date | 12/28/2018 | | |
| By (Signature and Title) | /s/Bradley H. Bailey | |
| | Bradley H. Bailey, | |
| | Chief Financial Officer | |
| | | |
| Date | 12/28/2018 | | |
| * | Print the name and title of each signing officer under his or her signature. |