Strategic Acquisition of First Eagle Alternative Capital BDC, Inc. Supplemental Information March 2023 Exhibit 99.2
This presentation (the “Presentation”) has been prepared by Crescent Capital BDC, Inc. (together with its consolidated subsidiaries, “CCAP,” “Crescent BDC” or the “Company”) and may be used for informational purposes only. This Presentation contains summaries of certain financial and statistical information about the Company and should be viewed in conjunction with the Company’s most recent Quarterly Report on Form 10-Q and Annual Report on Form 10-K. The information contained herein may not be used, reproduced, referenced, quoted, linked by website, or distributed to others, in whole or in part, except as agreed in writing by the Company. This presentation may contain forward-looking statements that involve substantial risks and uncertainties. You can identify these statements by the use of forward-looking terminology such as “anticipates,” “believes,” “expects,” “intends,” “will,” “should,” “may,” “plans,” “continue,” “believes,” “seeks,” “estimates,” “would,” “could,” “targets,” “projects,” “outlook,” “strategy,” “potential,” “predicts” and variations of these words and similar expressions to identify forward-looking statements, although not all forward-looking statements include these words. You should read statements that contain these words carefully because they discuss plans, strategies, prospects and expectations concerning CCAP’s business, operating results, financial condition and other similar matters. We believe that it is important to communicate our future expectations to our investors. There may be events in the future, however, that we are not able to predict accurately or control. You should not place undue reliance on these forward-looking statements, which speak only as of the date on which we make them. These statements may not be relied upon as investment advice. Factors or events that could cause our actual results to differ, possibly materially from our expectations, include, but are not limited to, the risks, uncertainties and other factors we identify in the sections entitled “Risk Factors” and “Cautionary Statement Regarding Forward-Looking Statements” in filings we make with the Securities and Exchange Commission (the “SEC”), and it is not possible for us to predict or identify all of them. We undertake no obligation to update or revise publicly any forward-looking statements, whether as a result of new information, future events or otherwise, except as required by law. Other Important Information Any forecasts in this investor presentation are based upon CCAP’s opinion of the market at the date of preparation and are subject to change without notice and dependent upon many factors. Any prediction, projection or forecast, including any pro forma projection or forecast for the combined company following the closing of the Transaction, is not necessarily indicative of the future or likely performance. Investment involves risk. The value of any investments and any income generated may go down as well as up and is not guaranteed. Past performance is no indication of current or future performance. PAST PERFORMANCE IS NOT NECESSARILY INDICATIVE OF FUTURE RESULTS. Any investment results, portfolio compositions and/or examples set forth in this document are provided for illustrative purposes only and are not indicative of any future investment results, future portfolio composition or investments. The composition, size of, and risks associated with an investment may differ substantially from any examples set forth in this document. No representation is made that an investment will be profitable or will not incur losses. Where appropriate, changes in the currency exchange rates may affect the value of investments. Prospective investors should read the relevant offering documents for the details and specific risk factors of any investment vehicle discussed in this investor presentation. Disclaimer and Note Regarding Forward-Looking Statements
CCAP’s Acquisition of FCRD Crescent Capital BDC, Inc. (“CCAP”) announced on March 9 that it had completed its acquisition of First Eagle Alternative Credit BDC, Inc. (“FCRD”) CCAP has worked closely with the FCRD team since the summer of 2022 to evaluate the benefits of the acquisition, perform a bottoms-up review of the FCRD portfolio and develop a rotation strategy post-closing CCAP continues to believe that the increased size and scale of the combined company will create numerous strategic and financial benefits to stockholders The expected benefits of the combination include: NII Accretion: Expect immediate adjusted net investment income accretion from improved economies of scale and elimination of duplicative public company and administrative expenses; Greater Market Presence and Capacity: Increased visibility to financial sponsors, management teams and intermediaries and ability to make larger commitments; Improved Portfolio Positioning: Increase in portfolio diversification with 200 portfolio companies on a combined basis while maintaining first lien senior secured focus with a predominately financial sponsor-backed portfolio; Financial Flexibility: Expect enhanced access to debt capital markets; and CCAP Share Liquidity: Post-closing trading liquidity profile expected to meaningfully increase CCAP’s average daily trading volume.
Pro Forma Combined Highlights
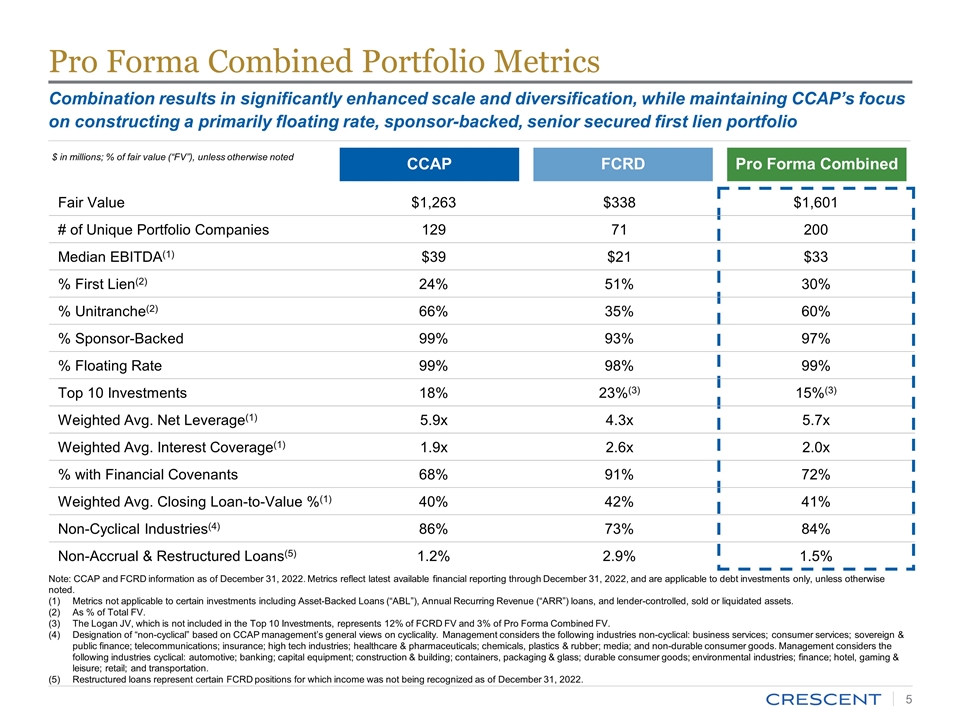
Pro Forma Combined Portfolio Metrics Fair Value $1,263 $338 $1,601 # of Unique Portfolio Companies 129 71 200 Median EBITDA(1) $39 $21 $33 % First Lien(2) 24% 51% 30% % Unitranche(2) 66% 35% 60% % Sponsor-Backed 99% 93% 97% % Floating Rate 99% 98% 99% Top 10 Investments 18% 23%(3) 15%(3) Weighted Avg. Net Leverage(1) 5.9x 4.3x 5.7x Weighted Avg. Interest Coverage(1) 1.9x 2.6x 2.0x % with Financial Covenants 68% 91% 72% Weighted Avg. Closing Loan-to-Value %(1) 40% 42% 41% Non-Cyclical Industries(4) 86% 73% 84% Non-Accrual & Restructured Loans(5) 1.2% 2.9% 1.5% CCAP FCRD Pro Forma Combined Combination results in significantly enhanced scale and diversification, while maintaining CCAP’s focus on constructing a primarily floating rate, sponsor-backed, senior secured first lien portfolio $ in millions; % of fair value (“FV”), unless otherwise noted Note: CCAP and FCRD information as of December 31, 2022. Metrics reflect latest available financial reporting through December 31, 2022, and are applicable to debt investments only, unless otherwise noted. Metrics not applicable to certain investments including Asset-Backed Loans (“ABL”), Annual Recurring Revenue (“ARR”) loans, and lender-controlled, sold or liquidated assets. As % of Total FV. The Logan JV, which is not included in the Top 10 Investments, represents 12% of FCRD FV and 3% of Pro Forma Combined FV. Designation of “non-cyclical” based on CCAP management’s general views on cyclicality. Management considers the following industries non-cyclical: business services; consumer services; sovereign & public finance; telecommunications; insurance; high tech industries; healthcare & pharmaceuticals; chemicals, plastics & rubber; media; and non-durable consumer goods. Management considers the following industries cyclical: automotive; banking; capital equipment; construction & building; containers, packaging & glass; durable consumer goods; environmental industries; finance; hotel, gaming & leisure; retail; and transportation. Restructured loans represent certain FCRD positions for which income was not being recognized as of December 31, 2022.
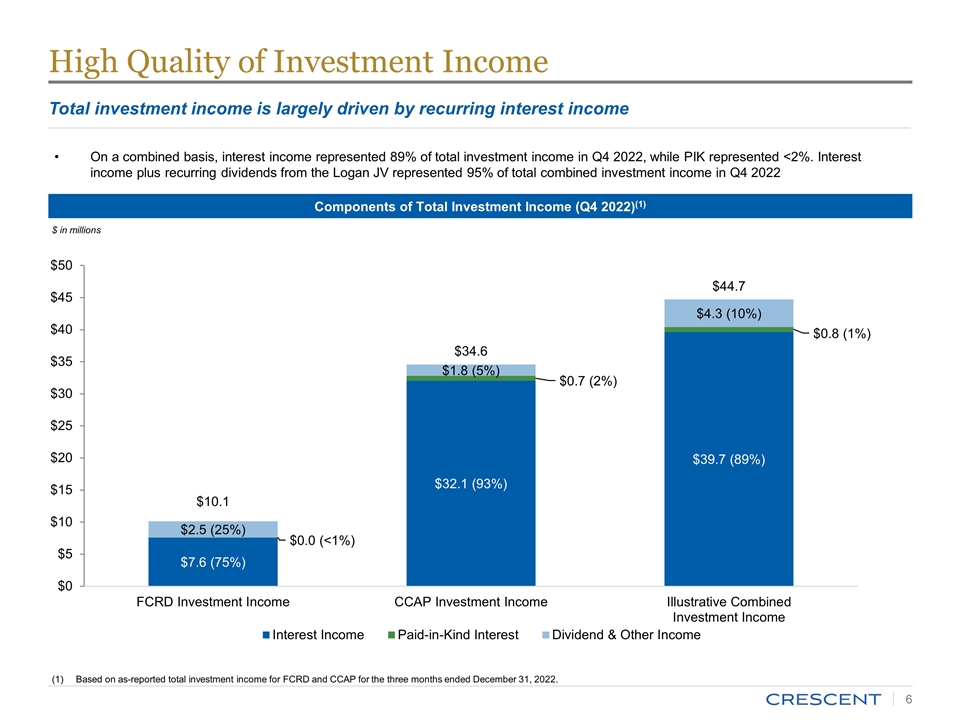
High Quality of Investment Income Total investment income is largely driven by recurring interest income Components of Total Investment Income (Q4 2022)(1) Based on as-reported total investment income for FCRD and CCAP for the three months ended December 31, 2022. $ in millions On a combined basis, interest income represented 89% of total investment income in Q4 2022, while PIK represented <2%. Interest income plus recurring dividends from the Logan JV represented 95% of total combined investment income in Q4 2022
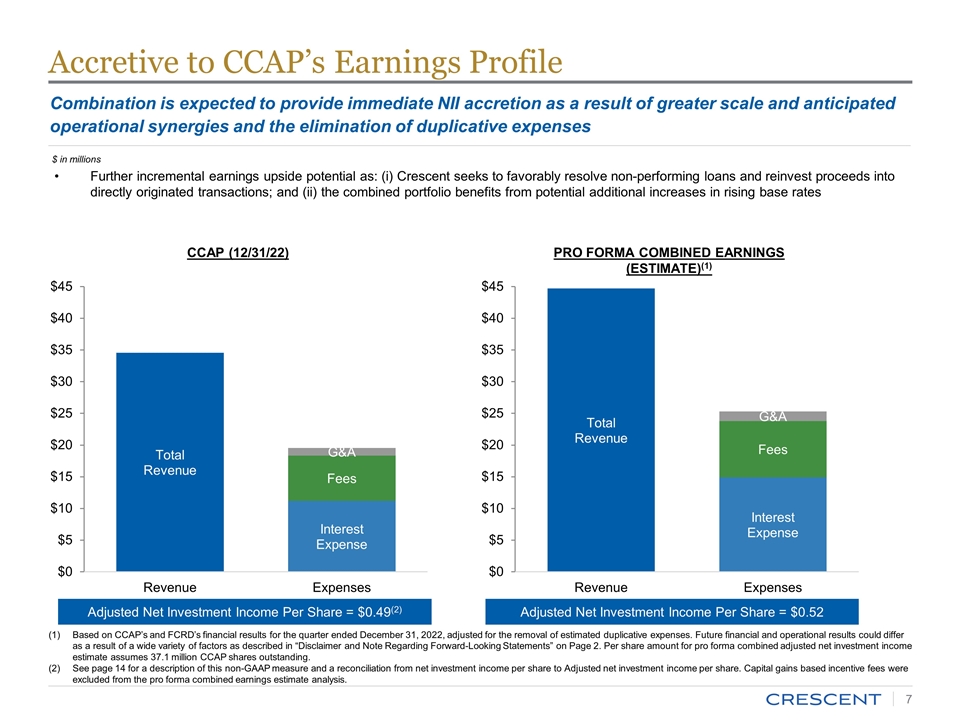
Combination is expected to provide immediate NII accretion as a result of greater scale and anticipated operational synergies and the elimination of duplicative expenses Further incremental earnings upside potential as: (i) Crescent seeks to favorably resolve non-performing loans and reinvest proceeds into directly originated transactions; and (ii) the combined portfolio benefits from potential additional increases in rising base rates CCAP (12/31/22) PRO FORMA COMBINED EARNINGS (ESTIMATE)(1) Adjusted Net Investment Income Per Share = $0.49(2) Adjusted Net Investment Income Per Share = $0.52 $ in millions Accretive to CCAP’s Earnings Profile Based on CCAP’s and FCRD’s financial results for the quarter ended December 31, 2022, adjusted for the removal of estimated duplicative expenses. Future financial and operational results could differ as a result of a wide variety of factors as described in “Disclaimer and Note Regarding Forward-Looking Statements” on Page 2. Per share amount for pro forma combined adjusted net investment income estimate assumes 37.1 million CCAP shares outstanding. See page 14 for a description of this non-GAAP measure and a reconciliation from net investment income per share to Adjusted net investment income per share. Capital gains based incentive fees were excluded from the pro forma combined earnings estimate analysis.
M&A Track Record and Portfolio Rotation Strategy
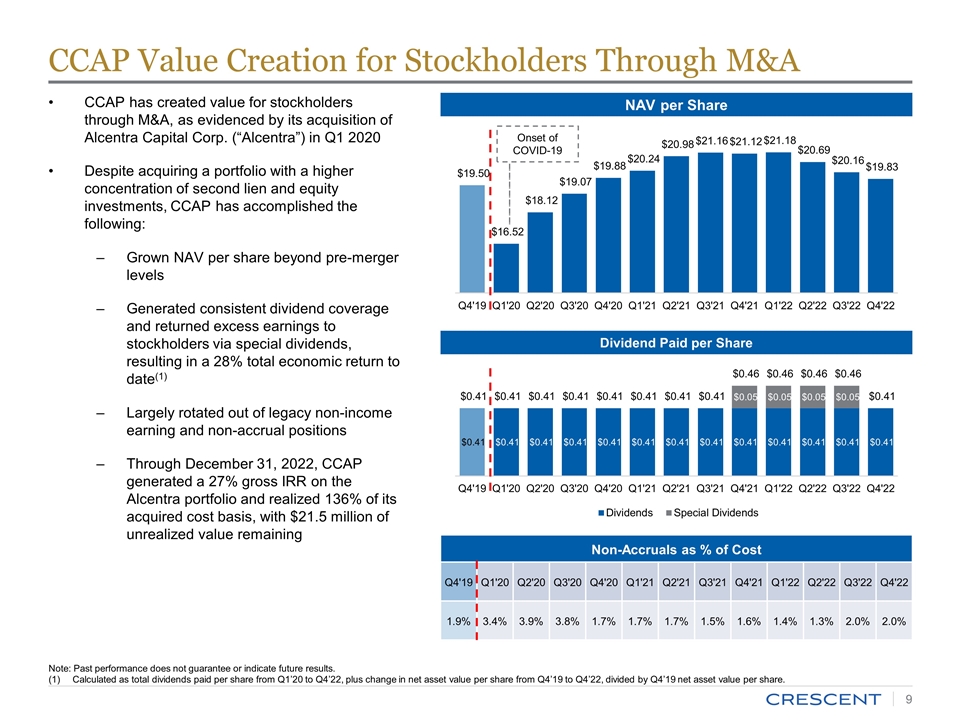
CCAP has created value for stockholders through M&A, as evidenced by its acquisition of Alcentra Capital Corp. (“Alcentra”) in Q1 2020 Despite acquiring a portfolio with a higher concentration of second lien and equity investments, CCAP has accomplished the following: Grown NAV per share beyond pre-merger levels Generated consistent dividend coverage and returned excess earnings to stockholders via special dividends, resulting in a 28% total economic return to date(1) Largely rotated out of legacy non-income earning and non-accrual positions Through December 31, 2022, CCAP generated a 27% gross IRR on the Alcentra portfolio and realized 136% of its acquired cost basis, with $21.5 million of unrealized value remaining Non-Accruals as % of Cost Q4'19 Q1'20 Q2'20 Q3'20 Q4'20 Q1'21 Q2'21 Q3'21 Q4'21 Q1'22 Q2'22 Q3'22 Q4'22 1.9% 3.4% 3.9% 3.8% 1.7% 1.7% 1.7% 1.5% 1.6% 1.4% 1.3% 2.0% 2.0% NAV per Share Dividend Paid per Share CCAP Value Creation for Stockholders Through M&A Onset of COVID-19 Note: Past performance does not guarantee or indicate future results. Calculated as total dividends paid per share from Q1’20 to Q4’22, plus change in net asset value per share from Q4’19 to Q4’22, divided by Q4’19 net asset value per share.
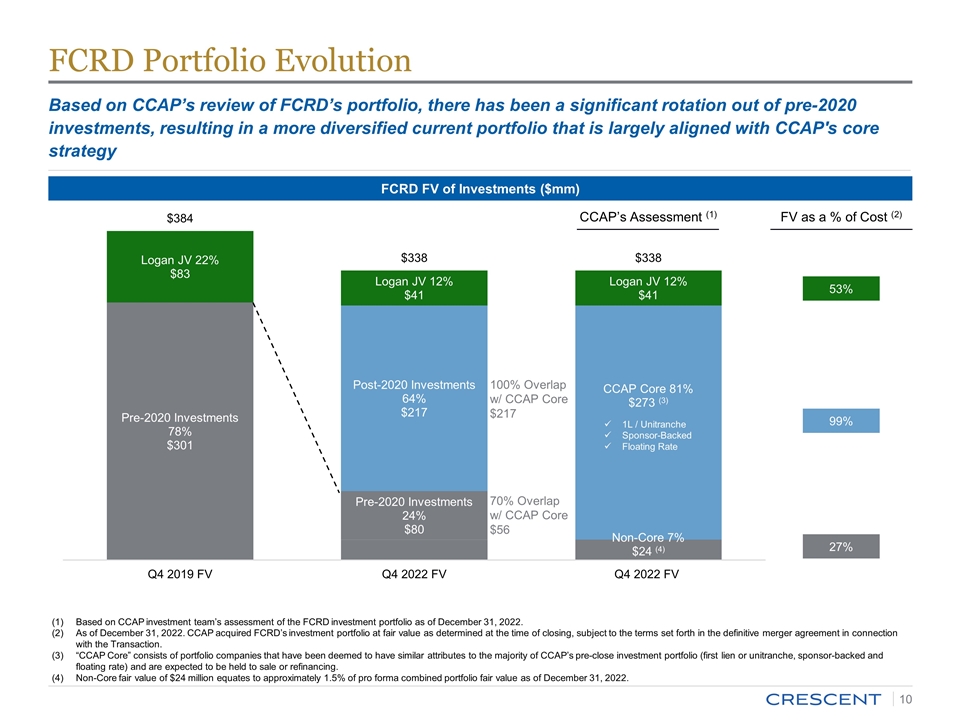
FCRD Portfolio Evolution Based on CCAP investment team’s assessment of the FCRD investment portfolio as of December 31, 2022. As of December 31, 2022. CCAP acquired FCRD’s investment portfolio at fair value as determined at the time of closing, subject to the terms set forth in the definitive merger agreement in connection with the Transaction. “CCAP Core” consists of portfolio companies that have been deemed to have similar attributes to the majority of CCAP’s pre-close investment portfolio (first lien or unitranche, sponsor-backed and floating rate) and are expected to be held to sale or refinancing. Non-Core fair value of $24 million equates to approximately 1.5% of pro forma combined portfolio fair value as of December 31, 2022. FCRD FV of Investments ($mm) 100% Overlap w/ CCAP Core $217 FV as a % of Cost (2) 27% 99% 53% 70% Overlap w/ CCAP Core $56 Based on CCAP’s review of FCRD’s portfolio, there has been a significant rotation out of pre-2020 investments, resulting in a more diversified current portfolio that is largely aligned with CCAP's core strategy 1L / Unitranche Sponsor-Backed Floating Rate CCAP’s Assessment (1)
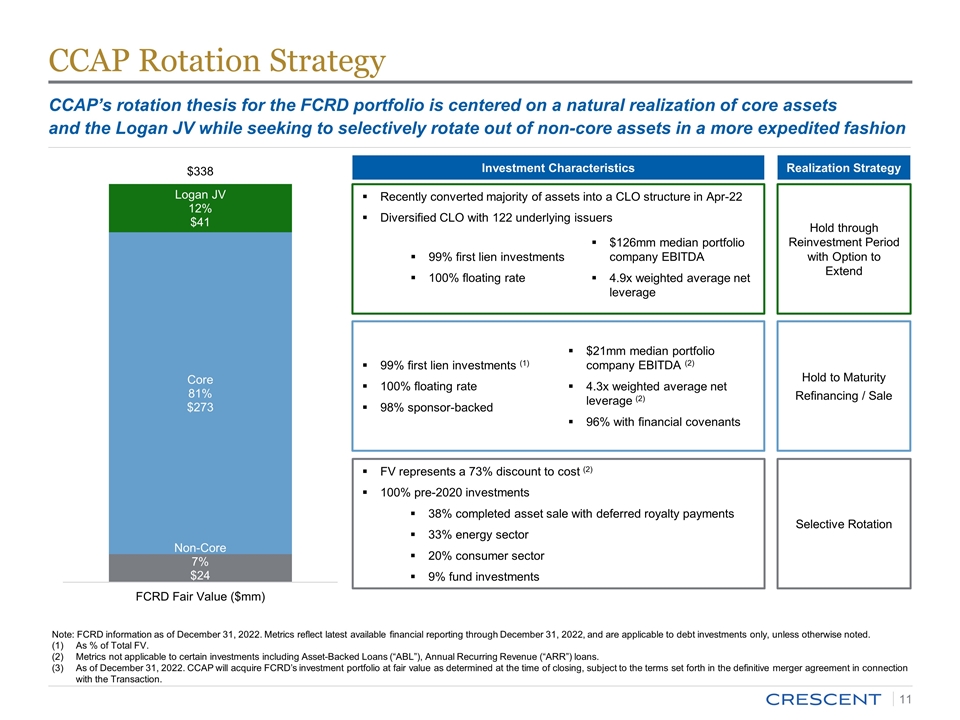
FV represents a 73% discount to cost (2) 100% pre-2020 investments 38% completed asset sale with deferred royalty payments 33% energy sector 20% consumer sector 9% fund investments 99% first lien investments (1) 100% floating rate 98% sponsor-backed $21mm median portfolio company EBITDA (2) 4.3x weighted average net leverage (2) 96% with financial covenants CCAP Rotation Strategy Hold to Maturity Refinancing / Sale Selective Rotation Investment Characteristics Realization Strategy Note: FCRD information as of December 31, 2022. Metrics reflect latest available financial reporting through December 31, 2022, and are applicable to debt investments only, unless otherwise noted. As % of Total FV. Metrics not applicable to certain investments including Asset-Backed Loans (“ABL”), Annual Recurring Revenue (“ARR”) loans. As of December 31, 2022. CCAP will acquire FCRD’s investment portfolio at fair value as determined at the time of closing, subject to the terms set forth in the definitive merger agreement in connection with the Transaction. Hold through Reinvestment Period with Option to Extend Recently converted majority of assets into a CLO structure in Apr-22 Diversified CLO with 122 underlying issuers CCAP’s rotation thesis for the FCRD portfolio is centered on a natural realization of core assets and the Logan JV while seeking to selectively rotate out of non-core assets in a more expedited fashion 99% first lien investments 100% floating rate $126mm median portfolio company EBITDA 4.9x weighted average net leverage
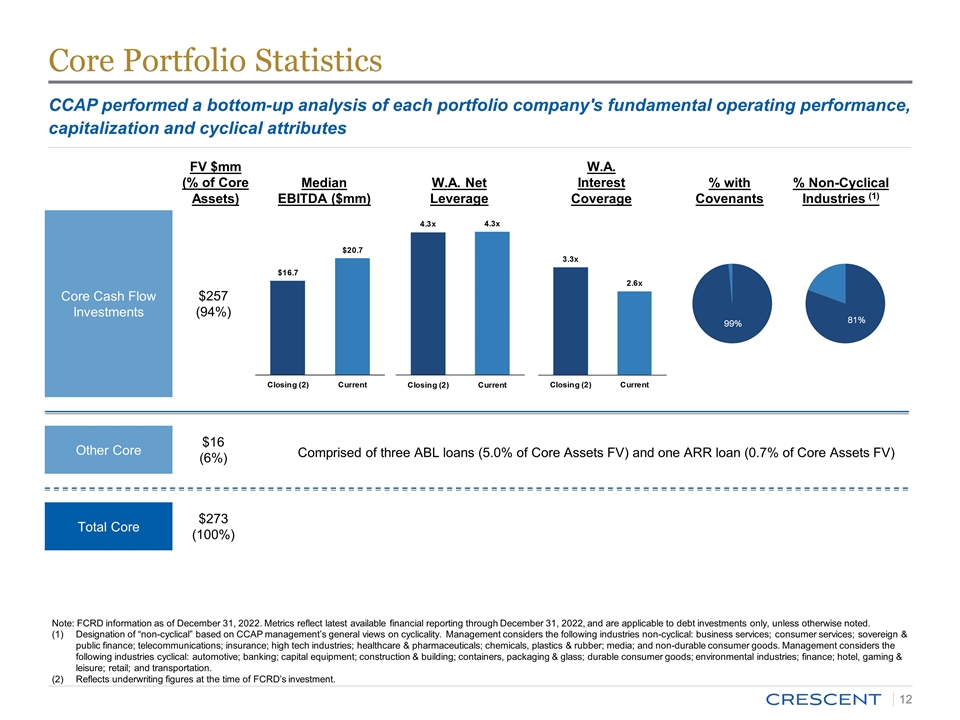
Core Portfolio Statistics Core Cash Flow Investments Other Core $257 (94%) $16 (6%) FV $mm (% of Core Assets) Median EBITDA ($mm) W.A. Net Leverage W.A. Interest Coverage % with Covenants % Non-Cyclical Industries (1) Comprised of three ABL loans (5.0% of Core Assets FV) and one ARR loan (0.7% of Core Assets FV) Note: FCRD information as of December 31, 2022. Metrics reflect latest available financial reporting through December 31, 2022, and are applicable to debt investments only, unless otherwise noted. Designation of “non-cyclical” based on CCAP management’s general views on cyclicality. Management considers the following industries non-cyclical: business services; consumer services; sovereign & public finance; telecommunications; insurance; high tech industries; healthcare & pharmaceuticals; chemicals, plastics & rubber; media; and non-durable consumer goods. Management considers the following industries cyclical: automotive; banking; capital equipment; construction & building; containers, packaging & glass; durable consumer goods; environmental industries; finance; hotel, gaming & leisure; retail; and transportation. Reflects underwriting figures at the time of FCRD’s investment. Total Core $273 (100%) CCAP performed a bottom-up analysis of each portfolio company's fundamental operating performance, capitalization and cyclical attributes
Appendix
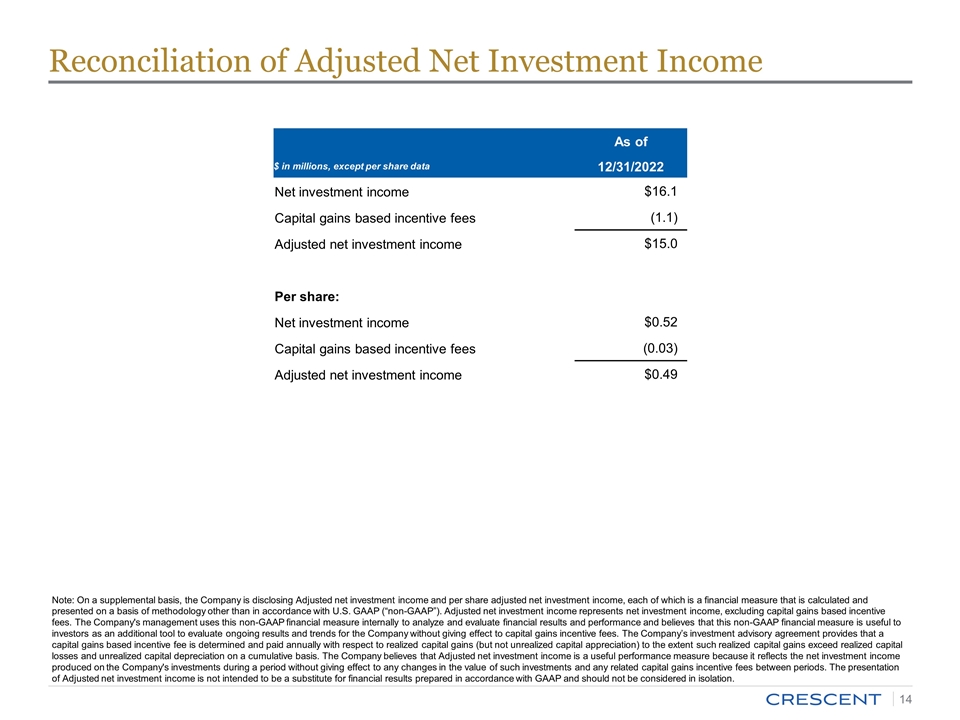
Reconciliation of Adjusted Net Investment Income As of $ in millions, except per share data 12/31/2022 Net investment income $16.1 Capital gains based incentive fees (1.1) Adjusted net investment income $15.0 Per share: Net investment income $0.52 Capital gains based incentive fees (0.03) Adjusted net investment income $0.49 Note: On a supplemental basis, the Company is disclosing Adjusted net investment income and per share adjusted net investment income, each of which is a financial measure that is calculated and presented on a basis of methodology other than in accordance with U.S. GAAP (“non-GAAP”). Adjusted net investment income represents net investment income, excluding capital gains based incentive fees. The Company's management uses this non-GAAP financial measure internally to analyze and evaluate financial results and performance and believes that this non-GAAP financial measure is useful to investors as an additional tool to evaluate ongoing results and trends for the Company without giving effect to capital gains incentive fees. The Company’s investment advisory agreement provides that a capital gains based incentive fee is determined and paid annually with respect to realized capital gains (but not unrealized capital appreciation) to the extent such realized capital gains exceed realized capital losses and unrealized capital depreciation on a cumulative basis. The Company believes that Adjusted net investment income is a useful performance measure because it reflects the net investment income produced on the Company's investments during a period without giving effect to any changes in the value of such investments and any related capital gains incentive fees between periods. The presentation of Adjusted net investment income is not intended to be a substitute for financial results prepared in accordance with GAAP and should not be considered in isolation.


