Wells Fargo Commercial Mortgage Trust 2015-C27
Filed: 25 Feb 15, 12:00am
| FREE WRITING PROSPECTUS | ||
| FILED PURSUANT TO RULE 433 | ||
| REGISTRATION FILE NO.: 333-195164-05 | ||

| WELLS FARGO SECURITIES | ||
Lead Manager and Sole Bookrunner | ||
Barclays Co-Manager |
| Wells Fargo Commercial Mortgage Trust 2015-C27 | Certificate Structure |
Expected Ratings (DBRS/KBRA/Moody’s)(1) | Approximate Initial Certificate Principal Balance or Notional Amount(2) | Approx. Initial Credit Support(3) | Pass-Through Rate Description | Weighted Average Life (Years)(4) | Expected Principal Window(4) | Certificate Principal to Value Ratio(5) | Certificate Principal U/W NOI Debt Yield(6) | |||||||||||
| Offered Certificates | ||||||||||||||||||
| A-1 | AAA(sf)/AAA(sf)/Aaa(sf) | $50,293,000 | 30.000% | (7) | 2.99 | 04/15 - 02/20 | 47.1% | 14.9% | ||||||||||
| A-2 | AAA(sf)/AAA(sf)/Aaa(sf) | $7,934,000 | 30.000% | (7) | 4.93 | 02/20 - 02/20 | 47.1% | 14.9% | ||||||||||
| A-3 | AAA(sf)/AAA(sf)/Aaa(sf) | $36,418,000 | 30.000% | (7) | 6.92 | 01/22 - 02/22 | 47.1% | 14.9% | ||||||||||
| A-4 | AAA(sf)/AAA(sf)/Aaa(sf) | $240,000,000 | 30.000% | (7) | 9.78 | 12/24 - 01/25 | 47.1% | 14.9% | ||||||||||
| A-5 | AAA(sf)/AAA(sf)/Aaa(sf) | $309,207,000 | 30.000% | (7) | 9.92 | 01/25 - 02/25 | 47.1% | 14.9% | ||||||||||
| A-SB | AAA(sf)/AAA(sf)/Aaa(sf) | $89,627,000 | 30.000% | (7) | 7.40 | 02/20 - 12/24 | 47.1% | 14.9% | ||||||||||
A-S(8) | AAA(sf)/AAA(sf)/Aa2(sf) | $79,897,000 | 22.375% | (7) | 9.98 | 02/25 - 03/25 | 52.2% | 13.5% | ||||||||||
| X-A | AAA(sf)/AAA(sf)/NR | $813,376,000(9) | N/A | Variable(10) | N/A | N/A | N/A | N/A | ||||||||||
| X-B | AAA(sf)/AAA(sf)/NR | $158,484,000(11) | N/A | Variable(12) | N/A | N/A | N/A | N/A | ||||||||||
B(8) | AA(sf)/AA(sf)/A1(sf) | $45,842,000 | 18.000% | (7) | 10.01 | 03/25 - 03/25 | 55.2% | 12.8% | ||||||||||
C(8) | A(low)(sf)/A-(sf)/NR | $68,109,000 | 11.500% | (7) | 10.01 | 03/25 - 03/25 | 59.6% | 11.8% | ||||||||||
PEX(8) | A(low)(sf)/A-(sf)/NR | $193,848,000 | 11.500% | (7) | 9.99 | 02/25 - 03/25 | 59.6% | 11.8% | ||||||||||
| Non-Offered Certificates | ||||||||||||||||||
| X-E | AAA(sf)/BB-(sf)/NR | $26,196,000(13) | N/A | Variable(14) | N/A | N/A | N/A | N/A | ||||||||||
| X-F | AAA(sf)/B-(sf)/NR | $17,027,000(15) | N/A | Variable(16) | N/A | N/A | N/A | N/A | ||||||||||
| X-G | AAA(sf)/NR/NR | $32,745,035(17) | N/A | Variable(18) | N/A | N/A | N/A | N/A | ||||||||||
| D | BBB(low)(sf)/BBB-(sf)/NR | $44,533,000 | 7.250% | (7) | 10.01 | 03/25 - 03/25 | 62.4% | 11.3% | ||||||||||
| E | BB(low)(sf)/BB-(sf)/NR | $26,196,000 | 4.750% | (7) | 10.01 | 03/25 - 03/25 | 64.1% | 11.0% | ||||||||||
| F | B(low)(sf)/B-(sf)/NR | $17,027,000 | 3.125% | (7) | 10.01 | 03/25 - 03/25 | 65.2% | 10.8% | ||||||||||
| G | NR/NR/NR | $32,745,035 | 0.000% | (7) | 10.01 | 03/25 - 03/25 | 67.3% | 10.5% | ||||||||||
| Notes: | |
| (1) | The expected ratings presented are those of DBRS, Inc. (“DBRS”), Kroll Bond Rating Agency, Inc. (“KBRA”) and Moody’s Investors Service, Inc. (“Moody’s”) which the depositor hired to rate the offered certificates. One or more other nationally recognized statistical rating organizations that were not hired by the depositor may use information they receive pursuant to Rule 17g-5 under the Securities Exchange Act of 1934, as amended (the “Exchange Act“) or otherwise, to rate or provide market reports and/or published commentary related to the offered certificates. We cannot assure you as to what ratings a non-hired nationally recognized statistical rating organization would assign or that its reports will not express differing, possibly negative, views of the mortgage loans and/or the offered certificates. The ratings of each class of offered certificates address the likelihood of the timely distribution of interest and, except in the case of the Class X-A and Class X-B certificates, the ultimate distribution of principal due on those classes on or before the Rated Final Distribution Date. See “Risk Factors—Risks Related to the Offered Certificates—Ratings of the Certificates Have Substantial Limitations” and “Ratings” in the free writing prospectus, dated February 24, 2015 (the “Free Writing Prospectus”). DBRS, KBRA and Moody’s have informed us that the “sf“ designation in their ratings represents an identifier for structured finance product ratings. |
| (2) | The principal balances and notional amounts set forth in the table are approximate. The actual initial principal balances and notional amounts may be larger or smaller depending on the aggregate cut-off date principal balance of the mortgage loans definitively included in the pool of mortgage loans, which aggregate cut-off date principal balance may be as much as 5% larger or smaller than the amount presented in the Free Writing Prospectus. |
| (3) | The approximate initial credit support with respect to the Class A-1, A-2, A-3, A-4, A-5 and A-SB Certificates represents the approximate credit enhancement for the Class A-1, A-2, A-3, A-4, A-5 and A-SB Certificates in the aggregate. The percentage indicated under the column “Approx. Initial Credit Support” with respect to the Class C Certificates and the Class PEX Certificates represents the approximate credit support for the Class C regular interest, which will have an initial outstanding principal balance on the closing date of $68,109,000. |
| (4) | Weighted Average Lives and Expected Principal Windows are calculated based on an assumed prepayment rate of 0% CPR and the “Structuring Assumptions“ described on Annex B to the Free Writing Prospectus. |
| (5) | The Certificate Principal to Value Ratio for each Class of Certificates (other than the Class A-1, A-2, A-3, A-4, A-5 and A-SB Certificates and other than the Exchangeable Certificates) is calculated as the product of (a) the weighted average Cut-off Date LTV Ratio for the mortgage loans and (b) a fraction, the numerator of which is the total initial Certificate Balance of such Class of Certificates and all Classes of Principal Balance Certificates senior to such Class of Certificates and the denominator of which is the total initial Certificate Balance of all of the Principal Balance Certificates. The Certificate Principal to Value Ratios for each of the Class A-1, A-2, A-3, A-4, A-5 and A-SB Certificates are calculated in the aggregate for those Classes as if they were a single Class and is calculated as the product of (a) the weighted average Cut-off Date LTV Ratio for the mortgage loans and (b) a fraction, the numerator of which is the total initial aggregate Certificate Balances of such Classes of Certificates and the denominator of which is the total initial Certificate Balance of all of the Principal Balance Certificates. The Certificate Principal to Value Ratio of the Class PEX Certificates is equal to the Certificate Principal to Value Ratio of the Class C Certificates. In any event, however, excess mortgaged property value associated with a mortgage loan will not be available to offset losses on any other mortgage loan. |
| (6) | The Certificate Principal U/W NOI Debt Yield for each Class of Certificates (other than the Class A-1, A-2, A-3, A-4, A-5 and A-SB Certificates and other than the Exchangeable Certificates) is calculated as the product of (a) the weighted average UW NOI Debt Yield for the mortgage loans and (b) a fraction, the numerator of which is the total initial Certificate Balance of all of the Classes of Principal Balance Certificates and the denominator of which is the total initial Certificate Balance for such Class of Certificates and all Classes of Principal Balance Certificates senior to such Class of Certificates. The Certificate Principal U/W NOI Debt Yield for each of the Class A-1, A-2, A-3, A-4, A-5 and A-SB Certificates is calculated in the aggregate for those Classes as if they were a single Class and is calculated as the product of (a) the weighted average UW NOI Debt Yield for the mortgage loans and (b) a fraction, the numerator of which is the total initial Certificate Balance of all of the Classes of Principal Balance Certificates and the denominator of which is the total aggregate initial Certificate Balances for such Classes of Certificates. The Certificate Principal U/W NOI Debt Yield of the Class PEX Certificates is equal to the Certificate Principal U/W NOI Debt Yield for the Class C Certificates. In any event, however, cash flow from each mortgaged property supports only the related mortgage loan and will not be available to support any other mortgage loan. |
| Wells Fargo Commercial Mortgage Trust 2015-C27 | Certificate Structure |
| (7) | The pass-through rates for the Class A-1, A-2, A-3, A-4, A-5, A-SB, A-S, B, C, D, E, F and G Certificates in each case will be one of the following: (i) a fixed rate per annum, (ii) the weighted average of the net mortgage interest rates on the mortgage loans for the related distribution date, (iii) a variable rate per annum equal to the lesser of (a) a fixed rate and (b) the weighted average of the net mortgage interest rates on the mortgage loans for the related distribution date or (iv) a variable rate per annum equal to the weighted average of the net mortgage interest rates on the mortgage loans for the related distribution date minus a specified percentage. For purposes of the calculation of the weighted average of the net mortgage interest rates on the mortgage loans for each distribution date, the mortgage interest rates will be adjusted as necessary to a 30/360 basis. The Class PEX Certificates will not have a pass-through rate, but will be entitled to receive the sum of the interest distributable on the Class PEX Components. The pass-through rate for the Class A-S Certificates, the Class A-S regular interest and the Class PEX Component A-S will, at all times, be the same. The pass-through rate for the Class B Certificates, the Class B regular interest and the Class PEX Component B will, at all times, be the same. The pass-through rate for the Class C Certificates, the Class C regular interest and the Class PEX Component C will, at all times, be the same. |
| (8) | The Class A-S, B, C and PEX Certificates are “Exchangeable Certificates”. On the closing date, the upper-tier REMIC of the issuing entity will issue the Class A-S, B and C regular interests (each a “regular interest”) which will have outstanding principal balances on the closing date of $79,897,000 $45,842,000 and $68,109,000, respectively. The regular interests will be held in a grantor trust for the benefit of the holders of the Class A-S, B, C and PEX Certificates. The Class A-S, B, C and PEX Certificates will, at all times, represent undivided beneficial ownership interests in a grantor trust that will hold those regular interests. Each class of the Class A-S, B and C Certificates will, at all times, represent an undivided beneficial ownership interest in a percentage of the outstanding certificate principal balance of the regular interest with the same alphabetical class designation. The Class PEX Certificates will, at all times, represent an undivided beneficial ownership interest in the remaining percentages of the outstanding certificate principal balances of the Class A-S, B and C regular interests and which portions of those regular interests are referred to in this Term Sheet as the Class PEX Component A-S, Class PEX Component B and Class PEX Component C (collectively, the “Class PEX Components”). Following any exchange of Class A-S, B and C Certificates for Class PEX Certificates or any exchange of Class PEX Certificates for Class A-S, B and C Certificates as described in the Free Writing Prospectus, the percentage interest of the outstanding certificate principal balances of the Class A-S, B and C regular interest that is represented by the Class A-S, B, C and PEX Certificates will be increased or decreased accordingly. The initial certificate principal balance of each of the Class A-S, B and C Certificates shown in the table represents the maximum certificate principal balance of such class without giving effect to any exchange. The initial certificate principal balance of the Class PEX Certificates is equal to the aggregate of the initial certificate principal balance of the Class A-S, B and C Certificates and represents the maximum certificate principal balance of the Class PEX Certificates that could be issued in an exchange. The certificate principal balances of the Class A-S, B and C Certificates to be issued on the closing date will be reduced, in required proportions, by an amount equal to the certificate principal balance of the Class PEX Certificates issued on the closing date. Distributions and allocations of payments and losses with respect to the Exchangeable Certificates are described in this Term Sheet under “Allocations and Distributions on the Class A-S, B, C and PEX Certificates” and under “Description of the Offered Certificates—Distributions” in the Free Writing Prospectus. The maximum certificate principal balance of the Class PEX Certificates is set forth in the table but is not included in the certificate principal balance of the certificates set forth on the cover page of this Term Sheet or on the top of the cover page of the Free Writing Prospectus. |
| (9) | The Class X-A Certificates are notional amount certificates. The Notional Amount of the Class X-A Certificates will be equal to the aggregate principal balance of the Class A-1, A-2, A-3, A-4, A-5 and A-SB Certificates and the Class A-S regular interest outstanding from time to time (without regard to any exchange of Class A-S, B and C Certificates for Class PEX Certificates). The Class X-A Certificates will not be entitled to distributions of principal. |
| (10) | The pass-through rate for the Class X-A Certificates for any distribution date will be a per annum rate equal to the excess, if any, of (a) the weighted average of the net mortgage interest rates on the mortgage loans for the related distribution date, over (b) the weighted average of the pass-through rates on the Class A-1, A-2, A-3, A-4, A-5 and A-SB Certificates and the Class A-S regular interest for the related distribution date, weighted on the basis of their respective aggregate principal balances outstanding immediately prior to that distribution date. For purposes of the calculation of the weighted average of the net mortgage interest rates on the mortgage loans for each distribution date, the mortgage interest rates will be adjusted as necessary to a 30/360 basis. |
| (11) | The Class X-B Certificates are notional amount certificates. The Notional Amount of the Class X-B Certificates will be equal to the aggregate principal balance of the Class B and C regular interests and the Class D Certificates outstanding from time to time. The Class X-B Certificates will not be entitled to distributions of principal. |
| (12) | The pass-through rate for the Class X-B Certificates for any distribution date will be a per annum rate equal to the excess, if any, of (a) the weighted average of the net mortgage interest rates on the mortgage loans for the related distribution date, over (b) the weighted average of the pass-through rates on the Class B and C regular interests and the Class D Certificates for the related distribution date, weighted on the basis of their respective aggregate principal balances outstanding immediately prior to that distribution date. For purposes of the calculation of the weighted average of the net mortgage interest rates on the mortgage loans for each distribution date, the mortgage interest rates will be adjusted as necessary to a 30/360 basis. |
| (13) | The Class X-E Certificates are notional amount certificates. The Notional Amount of the Class X-E Certificates will be equal to the principal balance of the Class E Certificates outstanding from time to time. The Class X-E Certificates will not be entitled to distributions of principal. |
| (14) | The pass-through rate for the Class X-E Certificates for any distribution date will be a per annum rate equal to the excess, if any, of (a) the weighted average of the net mortgage interest rates on the mortgage loans for the related distribution date, over (b) the pass-through rate on the Class E Certificates for the related distribution date. For purposes of the calculation of the weighted average of the net mortgage interest rates on the mortgage loans for each distribution date, the mortgage interest rates will be adjusted as necessary to a 30/360 basis. |
| (15) | The Class X-F Certificates are notional amount certificates. The Notional Amount of the Class X-F Certificates will be equal to the principal balance of the Class F Certificates outstanding from time to time. The Class X-F Certificates will not be entitled to distributions of principal. |
| (16) | The pass-through rate for the Class X-F Certificates for any distribution date will be a per annum rate equal to the excess, if any, of (a) the weighted average of the net mortgage interest rates on the mortgage loans for the related distribution date, over (b) the pass-through rate on the Class F Certificates for the related distribution date. For purposes of the calculation of the weighted average of the net mortgage interest rates on the mortgage loans for each distribution date, the mortgage interest rates will be adjusted as necessary to a 30/360 basis. |
| (17) | The Class X-G Certificates are notional amount certificates. The Notional Amount of the Class X-G Certificates will be equal to the principal balance of the Class G Certificates outstanding from time to time. The Class X-G Certificates will not be entitled to distributions of principal. |
| (18) | The pass-through rate for the Class X-G Certificates for any distribution date will be a per annum rate equal to the excess, if any, of (a) the weighted average of the net mortgage interest rates on the mortgage loans for the related distribution date, over (b) the pass-through rate on the Class G Certificates for the related distribution date. For purposes of the calculation of the weighted average of the net mortgage interest rates on the mortgage loans for each distribution date, the mortgage interest rates will be adjusted as necessary to a 30/360 basis. |
Wells Fargo Commercial Mortgage Trust 2015-C27 | Issue Characteristics |
Mortgage Loan Seller | Number of Mortgage Loans | Number of Mortgaged Properties | Aggregate Cut-off Date Balance | % of Cut-off Date Pool Balance | ||||||||
| Wells Fargo Bank, National Association | 29 | 40 | $387,422,468 | 37.0 | % | |||||||
| Rialto Mortgage Finance, LLC | 20 | 34 | 292,101,933 | 27.9 | ||||||||
Principal Commercial Capital(1) | 9 | 9 | 153,204,518 | 14.6 | ||||||||
| Liberty Island Group I LLC | 12 | 12 | 118,064,001 | 11.3 | ||||||||
| C-III Commercial Mortgage LLC | 23 | 26 | 84,535,116 | 8.1 | ||||||||
| Basis Real Estate Capital II, LLC | 2 | 3 | 12,500,000 | 1.2 | ||||||||
Total | 95 | 124 | $1,047,828,035 | 100.0 | % | |||||||
| (1) | Principal Commercial Capital is the lending platform jointly formed by Macquarie US Trading LLC and Principal Real Estate Investors, LLC to originate and securitize commercial mortgage loans. The mortgage loans to be sold by Macquarie US Trading LLC d/b/a Principal Commercial Capital were initially originated by Macquarie Investments US Inc. d/b/a Principal Commercial Capital, which will transfer such mortgage loans to Macquarie US Trading LLC d/b/a Principal Commercial Capital on or prior to the Closing Date. |
| Cut-off Date Balance: | $1,047,828,035 | |
| Number of Mortgage Loans: | 95 | |
| Average Cut-off Date Balance per Mortgage Loan: | $11,029,769 | |
| Number of Mortgaged Properties: | 124 | |
Average Cut-off Date Balance per Mortgaged Property(1): | $8,450,226 | |
| Weighted Average Mortgage Interest Rate: | 4.321% | |
| Ten Largest Mortgage Loans as % of Cut-off Date Pool Balance: | 37.0% | |
| Weighted Average Original Term to Maturity (months): | 118 | |
| Weighted Average Remaining Term to Maturity (months): | 117 | |
Weighted Average Original Amortization Term (months)(2): | 355 | |
Weighted Average Remaining Amortization Term (months)(2): | 355 | |
| Weighted Average Seasoning (months): | 1 |
| (1) | Information regarding mortgage loans secured by multiple properties is based on an allocation according to relative appraised values or the allocated loan amounts or property-specific release prices set forth in the related loan documents or such other allocation as the related mortgage loan seller deemed appropriate. |
| (2) | Excludes any mortgage loan that does not amortize. |
Weighted Average U/W Net Cash Flow DSCR(1): | 1.67x | |
Weighted Average U/W Net Operating Income Debt Yield(1): | 10.5% | |
Weighted Average Cut-off Date Loan-to-Value Ratio(1): | 67.3% | |
Weighted Average Balloon Loan-to-Value Ratio(1): | 57.8% | |
% of Mortgage Loans with Additional Subordinate Debt(2): | 3.6% | |
% of Mortgage Loans with Single Tenants(3): | 6.4% |
| (1) | With respect to the Westfield Palm Desert mortgage loan, the Depot Park mortgage loan and the Boca Hamptons Plaza Portfolio mortgage loan, each of which is part of a pari passu loan combination, loan-to-value ratio, debt service coverage ratio and debt yield calculations include the related pari passu companion loan(s) (unless otherwise stated). Debt service coverage ratio, debt yield and loan-to-value ratio information takes no account of subordinate debt (whether or not secured by the related mortgaged property), if any, that is allowed under the terms of any mortgage loan. See Annex A-1 and Annex B to the Free Writing Prospectus. |
| (2) | The percentage figure expressed as “% of Mortgage Loans with Additional Subordinate Debt” is determined as a percentage of cut-off date principal balance and does not take into account future subordinate debt (whether or not secured by the mortgaged property), if any, that may be permitted under the terms of any mortgage loan or the Pooling and Servicing Agreement. See “Description of the Mortgage Pool—Subordinate and/or Other Financing” in the Free Writing Prospectus. |
| (3) | Excludes mortgage loans that are secured by multiple single tenant properties and includes mortgage loans secured by multiple single tenant properties where each property is occupied by the same tenant or tenants that are affiliates of one another. |
Wells Fargo Commercial Mortgage Trust 2015-C27 | Issue Characteristics |
| Real Estate Taxes: | 84.8% of the pool | |
| Insurance: | 47.0% of the pool | |
| Capital Replacements: | 86.4% of the pool | |
| TI/LC: | 75.2% of the pool(1) | |
(1) The percentage of Cut-off Date Balance for mortgage loans with TI/LC reserves is based on the aggregate principal balance allocable to loans that include retail, office, industrial and mixed use properties. | ||
Wells Fargo Commercial Mortgage Trust 2015-C27 | Issue Characteristics |
Securities Offered: | $927,327,000 approximate monthly pay, multi-class, commercial mortgage REMIC pass-through certificates consisting of twelve classes (Classes A-1, A-2, A-3, A-4, A-5, A-SB, A-S, B, C, PEX, X-A and X-B), which are offered pursuant to a registration statement filed with the SEC. | ||
| Mortgage Loan Sellers: | Wells Fargo Bank, National Association (“WFB“); Rialto Mortgage Finance, LLC (“RMF“); Principal Commercial Capital (“PCC“); Liberty Island Group I LLC (“LIG I“); C-III Commercial Mortgage LLC (“C-III“); and Basis Real Estate Capital II, LLC (“Basis“). | ||
| Sole Lead Bookrunning Manager: | Wells Fargo Securities, LLC | ||
| Co-Manager: | Barclays Capital Inc. | ||
| Rating Agencies: | DBRS, Inc., Kroll Bond Rating Agency, Inc. and Moody’s Investors Service, Inc. | ||
| Master Servicer: | Wells Fargo Bank, National Association | ||
| Special Servicer: | Rialto Capital Advisors, LLC | ||
| Additional Primary Servicers: | Prudential Asset Resources, Inc. and Principal Global Investors, LLC | ||
| Certificate Administrator: | Wells Fargo Bank, National Association | ||
| Trustee: | Wilmington Trust, National Association | ||
| Trust Advisor: | Trimont Real Estate Advisors, Inc. | ||
| Initial Majority Subordinate Certificateholder: | Rialto CMBS V, LLC or another affiliate of Rialto Capital Advisors, LLC | ||
| Cut-off Date: | The Cut-off Date with respect to each mortgage loan is the due date for the monthly debt service payment that is due in March 2015 (or, in the case of any mortgage loan that has its first due date in April 2015, the date that would have been its due date in March 2015 under the terms of that mortgage loan if a monthly debt service payment were scheduled to be due in that month). | ||
| Expected Closing Date: | On or about March 12, 2015. | ||
| Determination Dates: | The 11th day of each month (or if that day is not a business day, the next succeeding business day), commencing in April 2015. | ||
| Distribution Dates: | The fourth business day following the Determination Date in each month, commencing in April 2015. | ||
| Rated Final Distribution Date: | The Distribution Date in February 2048. | ||
| Interest Accrual Period: | With respect to any Distribution Date, the calendar month immediately preceding the month in which such Distribution Date occurs. | ||
| Day Count: | The Offered Certificates will accrue interest on a 30/360 basis. | ||
| Minimum Denominations: | $10,000 for each Class of Offered Certificates (other than the Class X-A and X-B Certificates) and $1,000,000 for the Class X-A and X-B Certificates. Investments may also be made in any whole dollar denomination in excess of the applicable minimum denomination. | ||
| Clean-up Call: | 1% | ||
| Delivery: | DTC, Euroclear and Clearstream Banking | ||
| ERISA/SMMEA Status: | Each Class of Offered Certificates is expected to be eligible for exemptive relief under ERISA. No Class of Offered Certificates will be SMMEA eligible. | ||
| Risk Factors: | THE CERTIFICATES INVOLVE CERTAIN RISKS AND MAY NOT BE SUITABLE FOR ALL INVESTORS. SEE THE “RISK FACTORS” SECTION OF THE FREE WRITING PROSPECTUS. | ||
| Bond Analytics Information: | The Certificate Administrator will be authorized to make distribution date settlements, CREFC® reports and certain supplemental reports (other than confidential information) available to certain financial modeling and data provision services, including Bloomberg, L.P., Trepp, LLC, Intex Solutions, Inc., Markit Group Limited, Interactive Data Corp., BlackRock Financial Management, Inc and CMBS.com, Inc. |
Wells Fargo Commercial Mortgage Trust 2015-C27 | Characteristics of the Mortgage Pool |
Mortgage Loan Seller | Mortgage Loan Name | City | State | Number of Mortgage Loans / Mortgaged Properties | Mortgage Loan Cut-off Date Balance ($) | % of Cut- off Date Pool Balance (%) | Property Type | Number of SF or Rooms | Cut-off Date Balance Per SF or Room ($) | Cut-off Date LTV Ratio (%) | Balloon LTV Ratio (%) | U/W NCF DSCR (x) | U/W NOI Debt Yield (%) | ||||||||||||||||||
| RMF | Westfield Palm Desert | Palm Desert | CA | 1 / 1 | $62,500,000 | 6.0 | % | Retail | 572,724 | $218 | 59.0 | % | 59.0 | % | 2.61x | 10.8 | % | ||||||||||||||
| WFB | WP Carey Self Storage Portfolio VI | Various | Various | 1 / 9 | 48,139,000 | 4.6 | Self Storage | 750,194 | 64 | 64.4 | 58.7 | 1.44 | 8.7 | ||||||||||||||||||
| PCC | 312 Elm | Cincinnati | OH | 1 / 1 | 46,121,000 | 4.4 | Office | 379,379 | 122 | 68.8 | 60.0 | 1.80 | 12.0 | ||||||||||||||||||
| RMF | Marriott Greensboro | Greensboro | NC | 1 / 1 | 43,833,356 | 4.2 | Hospitality | 281 | 155,991 | 68.7 | 56.2 | 1.66 | 11.5 | ||||||||||||||||||
| RMF | Capital Penn Self Storage Portfolio | Various | PA | 1 / 9 | 37,606,397 | 3.6 | Self Storage | 592,854 | 63 | 69.5 | 61.0 | 1.72 | 10.8 | ||||||||||||||||||
| WFB | Albuquerque Plaza | Albuquerque | NM | 1 / 1 | 34,925,241 | 3.3 | Office | 358,196 | 98 | 61.3 | 44.4 | 1.65 | 11.9 | ||||||||||||||||||
| WFB | South Shore Place | Braintree | MA | 1 / 1 | 29,600,000 | 2.8 | Retail | 45,407 | 652 | 71.2 | 58.4 | 1.30 | 7.9 | ||||||||||||||||||
| LIG I | Maxwell Hotel | Seattle | WA | 1 / 1 | 29,550,000 | 2.8 | Hospitality | 139 | 212,590 | 67.0 | 58.5 | 1.75 | 11.4 | ||||||||||||||||||
| WFB | 300 East Lombard | Baltimore | MD | 1 / 1 | 28,692,492 | 2.7 | Office | 225,485 | 127 | 74.5 | 59.4 | 1.38 | 8.9 | ||||||||||||||||||
| WFB | Amargosa Portfolio | Various | Various | 1 / 4 | 26,600,000 | 2.5 | Retail | 225,906 | 118 | 71.5 | 60.6 | 1.52 | 9.7 | ||||||||||||||||||
| Top Three Total/Weighted Average | 3 / 11 | $156,760,000 | 15.0 | % | 63.5 | % | 59.2 | % | 2.01x | 10.5 | % | ||||||||||||||||||||
| Top Five Total/Weighted Average | 5 / 21 | $238,199,753 | 22.7 | % | 65.4 | % | 58.9 | % | 1.90x | 10.7 | % | ||||||||||||||||||||
| Top Ten Total/Weighted Average | 10 / 29 | $387,567,486 | 37.0 | % | 66.7 | % | 57.7 | % | 1.76x | 10.5 | % | ||||||||||||||||||||
| Non-Top Ten Total/Weighted Average | 85 / 95 | $660,260,549 | 63.0 | % | 67.6 | % | 57.8 | % | 1.62x | 10.5 | % | ||||||||||||||||||||
| (1) | With respect to the Westfield Palm Desert mortgage loan, the Depot Park mortgage loan and the Boca Hamptons Plaza Portfolio mortgage loan, each of which is part of a pari passu loan combination, Cut-off Date Balance per square foot, loan-to-value ratio, debt service coverage ratio and debt yield calculations include the related pari passu companion loan(s) (unless otherwise stated). With respect to each Mortgage Loan, debt service coverage ratio, debt yield and loan-to-value ratio information takes no account of subordinate debt (whether or not secured by the related mortgaged property), if any, that is allowed under the terms of any mortgage loan. |
Wells Fargo Commercial Mortgage Trust 2015-C27 | Characteristics of the Mortgage Pool |
| Property Name | Mortgage Loan Seller | Related Notes in Loan Group (Original Balance) | Holder of Note | Whether Note is Lead Servicing for the Entire Loan Combination | Current Master Servicer Under Related Securitization Servicing Agreement | Current Special Servicer Under Related Securitization Servicing Agreement | ||||||||
| Westfield Palm Desert | RMF | $62,500,000 | MSBAM 2015-C21(1) | Yes | KeyBank National Association | LNR Partners, LLC | ||||||||
| RMF | $62,500,000 | WFCM 2015-C27 | No | Wells Fargo Bank, National Association | Rialto Capital Advisors, LLC | |||||||||
| Depot Park | LIG I | $24,000,000 | WFCM 2014-LC18 | Yes | Wells Fargo Bank, National Association | Rialto Capital Advisors, LLC | ||||||||
| LIG I | $21,600,000 | WFCM 2015-C27 | No | Wells Fargo Bank, National Association | Rialto Capital Advisors, LLC | |||||||||
| Boca Hamptons Plaza Portfolio | RMF | $18,000,000 | WFCM 2015-C27 | No | Wells Fargo Bank, National Association | Rialto Capital Advisors, LLC | ||||||||
| RMF | $8,000,000 | CGCMT 2015-GC27 | Yes | Wells Fargo Bank, National Association | Midland Loan Services | |||||||||
| (1) | The MSBAM 2015-C21 transaction is scheduled to close on February 26, 2015. |
| Loan No. | Mortgage Loan Seller | Mortgage Loan Name | Mortgage Loan Cut-off Date Balance ($) | % of Cut-off Date Balance (%) | Sub Debt Cut-off Date Balance ($) | Mezzanine Debt Cut-off Date Balance ($) | Total Debt Interest Rate (%)(1) | Mortgage Loan U/W NCF DSCR (x) | Total Debt U/W NCF DSCR (x) | Mortgage Loan Cut- off Date U/W NOI Debt Yield (%) | Total Debt Cut-off Date U/W NOI Debt Yield (%) | Mortgage Loan Cut-off Date LTV Ratio (%) | Total Debt Cut-off Date LTV Ratio (%) | ||||||||||||||
| 5 | RMF | Capital Penn Self Storage Portfolio | $37,606,397 | 3.6% | $0 | $4,179,047 | 5.354% | 1.72x | 1.37x | 10.8% | 9.7% | 69.5% | 77.2% | ||||||||||||||
| Total/Weighted Average | $37,606,397 | 3.6% | $0 | $4,179,047 | 5.354% | 1.72x | 1.37x | 10.8% | 9.7% | 69.5% | 77.2% | ||||||||||||||||
| (1) | Total Debt Interest Rate for any specified mortgage loan reflects the weighted average of the interest rates on the respective components of the total debt. |
Wells Fargo Commercial Mortgage Trust 2015-C27 | Characteristics of the Mortgage Pool |
| Loan No. | Mortgage Loan Seller | Mortgage Loan or Mortgaged Property Name | City | State | Property Type | Mortgage Loan or Mortgaged Property Cut- off Date Balance ($) | % of Cut- off Date Pool Balance (%) | Previous Securitization | |||||||||
| 3 | PCC | 312 Elm | Cincinnati | OH | Office | $46,121,000 | 4.4 | % | WFRBS 2011-C3 | ||||||||
| 4 | RMF | Marriott Greensboro | Greensboro | NC | Hospitality | 43,833,356 | 4.2 | GECMC 2005-C4 | |||||||||
| 5 | RMF | Capital Penn Self Storage Portfolio | Various | PA | Self Storage | 37,606,397 | 3.6 | LBUBS 2006-C3 | |||||||||
| 5.01 | RMF | Capital Self Storage - Mechanicsburg | Mechanicsburg | PA | Self Storage | 6,989,109 | 0.7 | LBUBS 2006-C3 | |||||||||
| 5.02 | RMF | Capital Self Storage - Enola | Enola | PA | Self Storage | 4,867,415 | 0.5 | LBUBS 2006-C3 | |||||||||
| 5.06 | RMF | Capital Self Storage - Harrisburg North | Harrisburg | PA | Self Storage | 3,993,776 | 0.4 | MSC 2005-HQ7 | |||||||||
| 5.07 | RMF | Capital Self Storage - Hanover | Hanover | PA | Self Storage | 3,244,943 | 0.3 | LBUBS 2006-C3 | |||||||||
| 5.08 | RMF | Capital Self Storage - Dover | Dover | PA | Self Storage | 3,145,099 | 0.3 | LBUBS 2006-C3 | |||||||||
| 6 | WFB | Albuquerque Plaza | Albuquerque | NM | Office | 34,925,241 | 3.3 | GSMS 2005-GG4 | |||||||||
| 13 | LIG I | Depot Park | Sacramento | CA | Industrial | 21,600,000 | 2.1 | BSCMS 2005-T20 | |||||||||
| 17 | PCC | 312 Plum | Cincinnati | OH | Office | 18,379,000 | 1.8 | WFRBS 2011-C3 | |||||||||
| 18 | RMF | Maple Leaf Apartments | University Park | IL | Multifamily | 18,150,000 | 1.7 | BACM 2006-3 | |||||||||
| 19.01 | RMF | Boca Hamptons Plaza | Boca Raton | FL | Mixed Use | 13,153,846 | 1.3 | JPMCC 2005-CB11 | |||||||||
| 19.03 | RMF | One Industrial Plaza | South Valley Stream | NY | Industrial | 2,284,615 | 0.2 | JPMCC 2005-CB11 | |||||||||
| 20 | PCC | Palms Plaza | Boca Raton | FL | Retail | 17,500,000 | 1.7 | WBCMT 2005-C20 | |||||||||
| 22 | PCC | Plaza Mayor Shopping Center | Torrance | CA | Retail | 15,952,821 | 1.5 | CSFB 2005-C2 | |||||||||
| 24 | RMF | Long Island Retail Portfolio | Various | NY | Various | 15,500,000 | 1.5 | GECMC 2005-C1 | |||||||||
| 28 | WFB | Casa Bandera Apartments | Las Cruces | NM | Multifamily | 13,100,000 | 1.3 | WBCMT 2005-C16 | |||||||||
| 31 | WFB | Breckenridge Apartments | Phoenix | AZ | Multifamily | 10,500,000 | 1.0 | COMM 2012-CR1 | |||||||||
| 39 | WFB | Crestline Manufactured Home Community | Colorado Springs | CO | Manufactured Housing Community | 8,385,756 | 0.8 | BSC 2005-PWR8 | |||||||||
| 46 | CIIICM | Planet Self Storage - Southampton | Boston | MA | Self Storage | 6,250,000 | 0.6 | BSCMS 2006-T22 | |||||||||
| 48 | RMF | Village Crossing | Whitpain Township | PA | Mixed Use | 5,784,260 | 0.6 | GSMS 2005-GG4 | |||||||||
| 51 | RMF | Chesapeake Mills | Columbus | OH | Multifamily | 5,478,902 | 0.5 | LBUBS 2004-C6 | |||||||||
| 52 | WFB | Comfort Suites Chesapeake | Chesapeake | VA | Hospitality | 5,438,782 | 0.5 | MSC 2007-T27 | |||||||||
| 53 | RMF | Country Club Apartments | Shreveport | LA | Multifamily | 5,331,419 | 0.5 | BACM 2005-1 | |||||||||
| 55 | CIIICM | Planet Self Storage - Newington | Newington | CT | Self Storage | 5,225,000 | 0.5 | MSC 2007-IQ15 | |||||||||
| 63 | CIIICM | Planet Self Storage - Washington | Washington Township | NJ | Self Storage | 4,450,000 | 0.4 | BSCMS 2006-PW11 | |||||||||
| 65 | LIG I | Arctic Gardens | Anchorage | AK | Multifamily | 4,000,000 | 0.4 | BSCMS 2005-PWR8 | |||||||||
| 68 | CIIICM | Planet Self Storage - Quakertown | Quakertown | PA | Self Storage | 3,850,000 | 0.4 | BSCMS 2005-PW10 | |||||||||
| 70 | WFB | Eureka Village | Denton | TX | Multifamily | 3,793,831 | 0.4 | JPMCC 2005-LDP4 | |||||||||
| 74 | CIIICM | Southland Plaza | Adrian | MI | Retail | 3,344,812 | 0.3 | CSFB 2005-C1 | |||||||||
| 76 | CIIICM | Planet Self Storage - South Boston | Boston | MA | Self Storage | 3,200,000 | 0.3 | BSCMS 2005-PW10 | |||||||||
| 77 | CIIICM | Planet Self Storage - Brookfield | Brookfield | CT | Self Storage | 3,150,000 | 0.3 | BSCMS 2005-PW10 | |||||||||
| 80 | WFB | Jamul Shopping Village | Jamul | CA | Retail | 2,993,572 | 0.3 | MSC 2005-HQ6 | |||||||||
| 83 | LIG I | Coulter Forum | Amarillo | TX | Retail | 2,885,000 | 0.3 | MSC 2006-HQ9 | |||||||||
Wells Fargo Commercial Mortgage Trust 2015-C27 | Characteristics of the Mortgage Pool |
| 84 | CIIICM | Out O‘Space Storage | Cantonment | FL | Self Storage | 2,450,000 | 0.2 | BACM 2006-5 | |||||||||
| 87 | CIIICM | Lambertson Lakes | Thornton | CO | Retail | 2,100,000 | 0.2 | CSFB 2005-C2 | |||||||||
| 94 | CIIICM | Cookson MHP | Brookshire | TX | Manufactured Housing Community | 1,500,000 | 0.1 | CSFB 2005-C1 | |||||||||
| Total | $410,457,953 | 39.2 | % |
| (1) | The table above represents the most recent securitization with respect to the mortgaged property securing the related mortgage loan, based on information provided by the related borrower or obtained through searches of a third-party database. While the above mortgage loans may have been securitized multiple times in prior transactions, mortgage loans are only listed in the above chart if the mortgage loan in this securitization paid off a mortgage loan in another securitization. The information has not otherwise been confirmed by the mortgage loan sellers. |
Wells Fargo Commercial Mortgage Trust 2015-C27 | Characteristics of the Mortgage Pool |
Class A-2(1) | |||||||||||||||||||||||||||||||||||||||
| Loan No. | Mortgage Loan Seller | Mortgage Loan Name | State | Property Type | Mortgage Loan Cut-off Date Balance ($) | % of Cut- off Date Pool Balance (%) | Mortgage Loan Balance at Maturity ($) | % of Class A- 2 Certificate Principal Balance (%)(2) | SF | Loan per SF ($) | U/W NCF DSCR (x) | U/W NOI Debt Yield (%) | Cut-off Date LTV Ratio (%) | Balloon LTV Ratio (%) | Rem. IO Period (mos.) | Rem. Term to Maturity (mos.) | |||||||||||||||||||||||
| 45 | Basis | FedEx Portfolio Oxford, AL & El Dorado, AR | Various | Industrial | $7,000,000 | 0.7 | % | $6,658,891 | 83.9 | % | 96,112 | $73 | 1.36x | 8.8 | % | 70.7 | % | 67.3 | % | 23 | 59 | ||||||||||||||||||
| Total/Weighted Average | $7,000,000 | 0.7 | % | $6,658,891 | 83.9 | % | 1.36x | 8.8 | % | 70.7 | % | 67.3 | % | 23 | 59 | ||||||||||||||||||||||||
| (1) | The table above presents the mortgage loan(s) whose balloon payments would be applied to pay down the principal balance of the Class A-2 Certificates, assuming a 0% CPR and applying the “Structuring Assumptions“ described in the Free Writing Prospectus, including the assumptions that (i) none of the mortgage loans in the pool experience prepayments prior to maturity, defaults or losses; (ii) there are no extensions of maturity dates of any mortgage loans in the pool; and (iii) each mortgage loan in the pool is paid in full on its stated maturity date. Each Class of Certificates, including the Class A-2 Certificates, evidences undivided ownership interests in the entire pool of mortgage loans. Debt service coverage ratio, debt yield and loan-to-value ratio information takes no account of subordinate debt (whether or not secured by the mortgaged property), if any, that is allowed under the terms of any mortgage loan. See Annex A-1 to the Free Writing Prospectus. |
| (2) | Reflects the percentage equal to the Mortgage Loan Balance at Maturity divided by the initial Class A-2 Certificate Principal Balance. |
Class A-3(1) | |||||||||||||||||||||||||||||||||||||||
| Loan No. | Mortgage Loan Seller | Mortgage Loan Name | State | Property Type | Mortgage Loan Cut-off Date Balance ($) | % of Cut- off Date Pool Balance (%) | Mortgage Loan Balance at Maturity ($) | % of Class A- 3 Certificate Principal Balance (%)(2) | SF | Loan per SF ($) | U/W NCF DSCR (x) | U/W NOI Debt Yield (%) | Cut-off Date LTV Ratio (%) | Balloon LTV Ratio (%) | Rem. IO Period (mos.) | Rem. Term to Maturity (mos.) | |||||||||||||||||||||||
| 5 | RMF | Capital Penn Self Storage Portfolio | PA | Self Storage | $37,606,397 | 3.6 | % | $33,014,110 | 90.7 | % | 592,854 | $63 | 1.72x | 10.8 | % | 69.5 | % | 61.0 | % | 0 | 83 | ||||||||||||||||||
| 71 | WFB | Watson & Taylor Self Storage | TX | Self Storage | 3,646,000 | 0.3 | 3,404,056 | 9.3 | 56,275 | $65 | 1.33 | 8.3 | 67.5 | 63.0 | 34 | 82 | |||||||||||||||||||||||
| Total/Weighted Average | $41,252,397 | 3.9 | % | $36,418,166 | 100.0 | % | 1.69x | 10.6 | % | 69.3 | % | 61.2 | % | 3 | 83 | ||||||||||||||||||||||||
| (1) | The table above presents the mortgage loan(s) whose balloon payments would be applied to pay down the principal balance of the Class A-3 Certificates, assuming a 0% CPR and applying the “Structuring Assumptions” described in the Free Writing Prospectus, including the assumptions that (i) none of the mortgage loans in the pool experience prepayments prior to maturity, defaults or losses; (ii) there are no extensions of maturity dates of any mortgage loans in the pool; and (iii) each mortgage loan in the pool is paid in full on its stated maturity date. Each Class of Certificates, including the Class A-3 Certificates, evidences undivided ownership interests in the entire pool of mortgage loans. Debt service coverage ratio, debt yield and loan-to-value ratio information takes no account of subordinate debt (whether or not secured by the mortgaged property), if any, that is allowed under the terms of any mortgage loan. See Annex A-1 to the Free Writing Prospectus. |
| (2) | Reflects the percentage equal to the Mortgage Loan Balance at Maturity divided by the initial Class A-3 Certificate Principal Balance. |
Wells Fargo Commercial Mortgage Trust 2015-C27 | Characteristics of the Mortgage Pool |
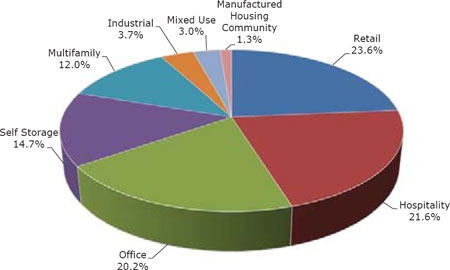
| Property Type | Number of Mortgaged Properties | Aggregate Cut-off Date Balance ($) | % of Cut-off Date Balance (%) | Weighted Average Cut-off Date LTV Ratio (%) | Weighted Average Balloon LTV Ratio (%) | Weighted Average U/W NCF DSCR (x) | Weighted Average U/W NOI Debt Yield (%) | Weighted Average U/W NCF Debt Yield (%) | Weighted Average Mortgage Rate (%) | ||||||||||||||||
| Retail | 25 | $247,391,262 | 23.6 | % | 66.1 | % | 58.2 | % | 1.78x | 9.7 | % | 9.1 | % | 4.182 | % | ||||||||||
| Anchored | 9 | 78,653,026 | 7.5 | 70.1 | 59.6 | 1.47 | 9.4 | 8.7 | 4.291 | ||||||||||||||||
| Regional Mall | 1 | 62,500,000 | 6.0 | 59.0 | 59.0 | 2.61 | 10.8 | 10.2 | 3.853 | ||||||||||||||||
| Shadow Anchored | 3 | 41,263,400 | 3.9 | 70.6 | 57.9 | 1.32 | 8.3 | 7.8 | 4.291 | ||||||||||||||||
| Single Tenant | 5 | 40,486,264 | 3.9 | 61.8 | 54.0 | 1.68 | 9.5 | 9.1 | 4.205 | ||||||||||||||||
| Unanchored | 7 | 24,488,572 | 2.3 | 70.6 | 59.2 | 1.60 | 10.6 | 9.8 | 4.448 | ||||||||||||||||
| Hospitality | 15 | 225,902,753 | 21.6 | 66.7 | 56.2 | 1.77 | 12.0 | 10.8 | 4.468 | ||||||||||||||||
| Limited Service | 12 | 133,044,397 | 12.7 | 65.6 | 55.4 | 1.82 | 12.3 | 11.1 | 4.422 | ||||||||||||||||
| Full Service | 3 | 92,858,356 | 8.9 | 68.2 | 57.4 | 1.69 | 11.5 | 10.3 | 4.534 | ||||||||||||||||
| Office | 12 | 211,198,396 | 20.2 | 67.9 | 56.7 | 1.58 | 10.7 | 9.5 | 4.244 | ||||||||||||||||
| CBD | 5 | 147,890,733 | 14.1 | 68.4 | 56.7 | 1.61 | 11.0 | 9.7 | 4.197 | ||||||||||||||||
| Suburban | 6 | 49,307,663 | 4.7 | 66.6 | 56.5 | 1.52 | 10.2 | 9.2 | 4.435 | ||||||||||||||||
| Single Tenant | 1 | 14,000,000 | 1.3 | 67.7 | 57.1 | 1.56 | 9.9 | 9.0 | 4.070 | ||||||||||||||||
| Self Storage | 35 | 154,250,129 | 14.7 | 67.4 | 58.8 | 1.56 | 9.5 | 9.3 | 4.318 | ||||||||||||||||
| Self Storage | 35 | 154,250,129 | 14.7 | 67.4 | 58.8 | 1.56 | 9.5 | 9.3 | 4.318 | ||||||||||||||||
| Multifamily | 20 | 126,063,730 | 12.0 | 70.4 | 59.5 | 1.49 | 9.8 | 9.0 | 4.388 | ||||||||||||||||
| Garden | 18 | 103,963,730 | 9.9 | 70.7 | 59.8 | 1.49 | 10.0 | 9.0 | 4.444 | ||||||||||||||||
| Student Housing | 1 | 13,100,000 | 1.3 | 69.3 | 58.6 | 1.53 | 9.5 | 8.9 | 4.150 | ||||||||||||||||
| High Rise | 1 | 9,000,000 | 0.9 | 68.7 | 58.0 | 1.48 | 8.8 | 8.6 | 4.080 | ||||||||||||||||
| Industrial | 7 | 38,446,154 | 3.7 | 64.5 | 61.7 | 2.02 | 11.4 | 10.0 | 4.445 | ||||||||||||||||
| Warehouse | 2 | 24,161,538 | 2.3 | 60.9 | 60.0 | 2.37 | 12.5 | 10.7 | 4.371 | ||||||||||||||||
| Industrial | 2 | 7,000,000 | 0.7 | 70.7 | 67.3 | 1.36 | 8.8 | 8.3 | 4.500 | ||||||||||||||||
| Light Industrial | 2 | 5,000,000 | 0.5 | 71.4 | 62.7 | 1.55 | 11.2 | 9.6 | 4.600 | ||||||||||||||||
| Flex | 1 | 2,284,615 | 0.2 | 68.2 | 60.0 | 1.40 | 9.5 | 8.7 | 4.720 | ||||||||||||||||
| Mixed Use | 6 | 31,297,137 | 3.0 | 68.1 | 57.9 | 1.44 | 9.6 | 8.8 | 4.542 | ||||||||||||||||
| Retail/Office | 4 | 24,778,639 | 2.4 | 69.0 | 58.4 | 1.44 | 9.7 | 8.8 | 4.578 | ||||||||||||||||
| Office/Retail | 2 | 6,518,498 | 0.6 | 64.4 | 56.3 | 1.43 | 9.5 | 8.6 | 4.406 | ||||||||||||||||
| Manufactured Housing Community | 4 | 13,278,474 | 1.3 | 66.5 | 52.7 | 1.64 | 10.0 | 9.8 | 4.177 | ||||||||||||||||
| Manufactured Housing Community | 4 | 13,278,474 | 1.3 | 66.5 | 52.7 | 1.64 | 10.0 | 9.8 | 4.177 | ||||||||||||||||
| Total/Weighted Average | 124 | $1,047,828,035 | 100.0 | % | 67.3 | % | 57.8 | % | 1.67 | x | 10.5 | % | 9.6 | % | 4.321 | % | |||||||||
| (1) | Because this table presents information relating to the mortgaged properties and not the mortgage loans, the information for mortgage loans secured by more than one mortgaged property is based on allocated amounts (allocating the mortgage loan principal balance to each of those properties according to the relative appraised values of the mortgaged properties or the allocated loan amounts or property-specific release prices set forth in the related mortgage loan documents or such other allocation as the related mortgage loan seller deemed appropriate). With respect to the Westfield Palm Desert mortgage loan, the Depot Park mortgage loan and the Boca Hamptons Plaza Portfolio mortgage loan, each of which is part of a pari passu loan combination, loan-to-value ratio, debt service coverage ratio and debt yield calculations include the related pari passu companion loan(s) (unless otherwise stated). Debt service coverage ratio, debt yield and loan-to-value ratio information takes no account of subordinate debt (whether or not secured by the related mortgaged property) that is allowed under the terms of any mortgage loan. See Annex A-1 to the Free Writing Prospectus. |
Wells Fargo Commercial Mortgage Trust 2015-C27 | Characteristics of the Mortgage Pool |
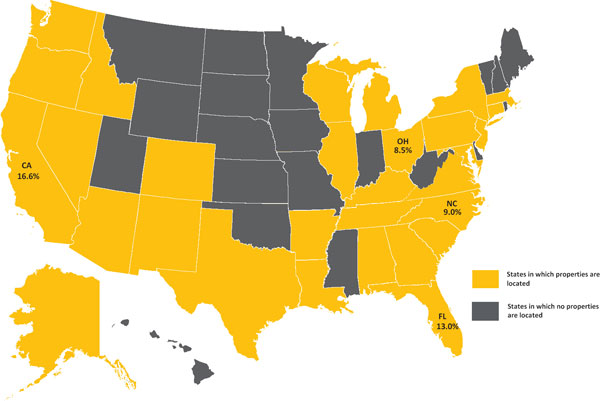
Location(3) | Number of Mortgaged Properties | Aggregate Cut- off Date Balance ($) | % of Cut- off Date Balance (%) | Weighted Average Cut-off Date LTV Ratio (%) | Weighted Average Balloon LTV Ratio (%) | Weighted Average U/W NCF DSCR (x) | Weighted Average U/W NOI Debt Yield (%) | Weighted Average U/W NCF Debt Yield (%) | Weighted Average Mortgage Rate (%) | |||||||||||||||||
| California | 10 | $174,288,088 | 16.6 | % | 61.0 | % | 56.1 | % | 2.06 | x | 10.4 | % | 9.6 | % | 4.097 | % | ||||||||||
| Southern | 7 | 126,688,088 | 12.1 | 60.5 | 56.2 | 2.11 | 10.1 | 9.6 | 4.051 | |||||||||||||||||
| Northern | 3 | 47,600,000 | 4.5 | 62.2 | 55.9 | 1.94 | 11.1 | 9.9 | 4.218 | |||||||||||||||||
| Florida | 17 | 136,444,441 | 13.0 | 66.2 | 58.3 | 1.65 | 10.7 | 9.9 | 4.385 | |||||||||||||||||
| North Carolina | 4 | 94,166,356 | 9.0 | 68.1 | 58.2 | 1.63 | 11.0 | 9.9 | 4.490 | |||||||||||||||||
| Ohio | 7 | 88,545,642 | 8.5 | 69.8 | 59.6 | 1.71 | 11.7 | 10.2 | 4.356 | |||||||||||||||||
Other(4) | 86 | 554,383,508 | 52.9 | 69.0 | 57.8 | 1.55 | 10.1 | 9.4 | 4.342 | |||||||||||||||||
| Total/Weighted Average | 124 | $1,047,828,035 | 100.0 | % | 67.3 | % | 57.8 | % | 1.67 | x | 10.5 | % | 9.6 | % | 4.321 | % | ||||||||||
| (1) | The Mortgaged Properties are located in 30 states. |
| (2) | Because this table presents information relating to the mortgaged properties and not the mortgage loans, the information for mortgage loans secured by more than one mortgaged property is based on allocated amounts (allocating the mortgage loan principal balance to each of those properties according to the relative appraised values of the mortgaged properties or the allocated loan amounts or property-specific release prices set forth in the related mortgage loan documents or such other allocation as the related mortgage loan seller deemed appropriate). With respect to the Westfield Palm Desert mortgage loan, the Depot Park mortgage loan and the Boca Hamptons Plaza Portfolio mortgage loan, each of which is part of a pari passu loan combination, loan-to-value ratio, debt service coverage ratio and debt yield calculations include the related pari passu companion loan(s) (unless otherwise stated). Debt service coverage ratio, debt yield and loan-to-value ratio information takes no account of subordinate debt (whether or not secured by the related mortgaged property), if any, that is allowed under the terms of any mortgage loan. See Annex A-1 to the Free Writing Prospectus. |
| (3) | For purposes of determining whether a mortgaged property is in Northern California or Southern California, Northern California includes areas with zip codes above 93600 and Southern California includes areas with zip codes of 93600 and below. |
| (4) | Includes 26 other states. |
| Wells Fargo Commercial Mortgage Trust 2015-C27 | Characteristics of the Mortgage Pool |
| CUT-OFF DATE BALANCE | ||||
Range of Cut-off Date Balances ($) | Number of Mortgage Loans | Aggregate Cut- off Date Balance | % of Cut-off Date Balance | |
| 1,092,718 - 2,000,000 | 7 | $12,071,545 | 1.2 | % |
| 2,000,001 - 3,000,000 | 11 | 28,942,563 | 2.8 | |
| 3,000,001 - 4,000,000 | 13 | 47,023,467 | 4.5 | |
| 4,000,001 - 5,000,000 | 8 | 37,910,390 | 3.6 | |
| 5,000,001 - 6,000,000 | 10 | 54,831,030 | 5.2 | |
| 6,000,001 - 7,000,000 | 2 | 13,250,000 | 1.3 | |
| 7,000,001 - 8,000,000 | 3 | 22,477,172 | 2.1 | |
| 8,000,001 - 9,000,000 | 5 | 42,725,006 | 4.1 | |
| 9,000,001 - 10,000,000 | 5 | 48,607,555 | 4.6 | |
| 10,000,001 - 15,000,000 | 7 | 90,184,000 | 8.6 | |
| 15,000,001 - 20,000,000 | 10 | 174,508,821 | 16.7 | |
| 20,000,001 - 30,000,000 | 8 | 202,171,492 | 19.3 | |
| 30,000,001 - 50,000,000 | 5 | 210,624,994 | 20.1 | |
| 50,000,001 - 62,500,000 | 1 | 62,500,000 | 6.0 | |
| Total: | 95 | $1,047,828,035 | 100.0 | % |
| Average: | $11,029,769 | |||
| UNDERWRITTEN NOI DEBT SERVICE COVERAGE RATIO | ||||
Range of U/W NOI DSCRs (x) | Number of Mortgage Loans | Aggregate Cut- off Date Balance | % of Cut-off Date Balance | |
| 1.34 - 1.40 | 6 | $59,391,031 | 5.7 | % |
| 1.41 - 1.50 | 15 | 126,568,281 | 12.1 | |
| 1.51 - 1.60 | 15 | 142,040,666 | 13.6 | |
| 1.61 - 1.70 | 16 | 136,162,248 | 13.0 | |
| 1.71 - 1.80 | 15 | 131,579,484 | 12.6 | |
| 1.81 - 1.90 | 10 | 126,900,707 | 12.1 | |
| 1.91 - 2.00 | 6 | 81,389,572 | 7.8 | |
| 2.01 - 2.25 | 9 | 154,405,000 | 14.7 | |
| 2.26 - 2.50 | 1 | 5,291,046 | 0.5 | |
| 2.51 - 2.91 | 2 | 84,100,000 | 8.0 | |
| Total: | 95 | $1,047,828,035 | 100.0 | % |
| Weighted Average: | 1.82x | |||
| UNDERWRITTEN NCF DEBT SERVICE COVERAGE RATIO | ||||
Range of U/W NCF DSCRs (x) | Number of Mortgage Loans | Aggregate Cut- off Date Balance | % of Cut-off Date Balance | |
| 1.26 - 1.30 | 4 | $54,884,240 | 5.2 | % |
| 1.31 - 1.40 | 16 | 135,235,049 | 12.9 | |
| 1.41 - 1.50 | 20 | 162,263,818 | 15.5 | |
| 1.51 - 1.60 | 21 | 177,812,606 | 17.0 | |
| 1.61 - 1.70 | 16 | 183,694,308 | 17.5 | |
| 1.71 - 1.80 | 7 | 151,648,397 | 14.5 | |
| 1.81 - 1.90 | 3 | 47,122,572 | 4.5 | |
| 1.91 - 2.25 | 5 | 45,776,000 | 4.4 | |
| 2.26 - 2.50 | 2 | 26,891,046 | 2.6 | |
| 2.51 - 2.61 | 1 | 62,500,000 | 6.0 | |
| Total: | 95 | $1,047,828,035 | 100.0 | % |
| Weighted Average: | 1.67x | |||
| LOAN PURPOSE | ||||
| Loan Purpose | Number of Mortgage Loans | Aggregate Cut- off Date Balance | % of Cut-off Date Balance | |
| Refinance | 66 | $605,531,450 | 57.8 | % |
| Acquisition | 29 | 442,296,585 | 42.2 | |
| Total: | 95 | $1,047,828,035 | 100.0 | % |
| MORTGAGE RATE | ||||
Range of Mortgage Rates (%) | Number of Mortgage Loans | Aggregate Cut- off Date Balance | % of Cut-off Date Balance | |
| 3.840 - 4.000 | 3 | $76,176,802 | 7.3 | % |
| 4.001 - 4.250 | 36 | 396,353,516 | 37.8 | |
| 4.251 - 4.500 | 28 | 350,447,671 | 33.4 | |
| 4.501 - 4.750 | 21 | 192,471,478 | 18.4 | |
| 4.751 - 5.000 | 6 | 27,047,149 | 2.6 | |
| 5.001 - 5.220 | 1 | 5,331,419 | 0.5 | |
| Total: | 95 | $1,047,828,035 | 100.0 | % |
| Weighted Average: | 4.321% | |||
| UNDERWRITTEN NOI DEBT YIELD | ||||
Range of U/W NOI Debt Yields (%) | Number of Mortgage Loans | Aggregate Cut- off Date Balance | % of Cut-off Date Balance | |
| 7.8 - 8.0 | 2 | $45,552,821 | 4.3 | % |
| 8.1 - 9.0 | 18 | 168,877,164 | 16.1 | |
| 9.1 - 10.0 | 29 | 236,487,554 | 22.6 | |
| 10.1 - 11.0 | 18 | 218,281,453 | 20.8 | |
| 11.1 - 12.0 | 16 | 255,050,643 | 24.3 | |
| 12.1 - 13.0 | 7 | 84,261,354 | 8.0 | |
| 13.1 - 13.5 | 5 | 39,317,046 | 3.8 | |
| Total: | 95 | $1,047,828,035 | 100.0 | % |
| Weighted Average: | 10.5% | |||
| UNDERWRITTEN NCF DEBT YIELD | ||||
Range of U/W NCF Debt Yields (%) | Number of Mortgage Loans | Aggregate Cut- off Date Balance | % of Cut-off Date Balance | |
| 7.4 - 8.0 | 6 | $101,218,313 | 9.7 | % |
| 8.1 - 9.0 | 36 | 293,381,367 | 28.0 | |
| 9.1 - 10.0 | 28 | 226,191,727 | 21.6 | |
| 10.1 - 11.0 | 14 | 329,404,292 | 31.4 | |
| 11.1 - 12.0 | 6 | 71,100,718 | 6.8 | |
| 12.1 - 13.0 | 2 | 17,440,572 | 1.7 | |
| 13.1 - 13.4 | 3 | 9,091,046 | 0.9 | |
| Total: | 95 | $1,047,828,035 | 100.0 | % |
| Weighted Average: | 9.6% | |||
(1) | With respect to the Westfield Palm Desert mortgage loan, the Depot Park mortgage loan and the Boca Hamptons Plaza Portfolio mortgage loan, each of which is part of a pari passu loan combination, loan-to-value ratio, debt service coverage ratio and debt yield calculations include the related pari passu companion loan(s) (unless otherwise stated). Debt service coverage ratio, debt yield and loan-to-value ratio information takes no account of subordinate debt (whether or not secured by the related mortgaged property), if any, that is allowed under the terms of any mortgage loan. See Annex A-1 to the Free Writing Prospectus. |
| Wells Fargo Commercial Mortgage Trust 2015-C27 | Characteristics of the Mortgage Pool |
| ORIGINAL TERM TO MATURITY | ||||
Range of Original Terms to Maturity (months) | Number of Mortgage Loans | Aggregate Cut- off Date Balance | % of Cut-off Date Balance | |
| 60 | 1 | $7,000,000 | 0.7 | % |
| 61 - 84 | 2 | 41,252,397 | 3.9 | |
| 85 - 120 | 92 | 999,575,638 | 95.4 | |
| Total: | 95 | $1,047,828,035 | 100.0 | % |
| Weighted Average: | 118 months | |||
| REMAINING TERM TO MATURITY | ||||
Range of Remaining Terms to Maturity (months) | Number of Mortgage Loans | Aggregate Cut- off Date Balance | % of Cut-off Date Balance | |
| 59 - 60 | 1 | $7,000,000 | 0.7 | % |
| 61 - 84 | 2 | 41,252,397 | 3.9 | |
| 85 - 120 | 92 | 999,575,638 | 95.4 | |
| Total: | 95 | $1,047,828,035 | 100.0 | % |
| Weighted Average: | 117 months | |||
ORIGINAL AMORTIZATION TERM(2) | ||||
Range of Original Amortization Terms (months) | Number of Mortgage Loans | Aggregate Cut- off Date Balance | % of Cut-off Date Balance | |
| Interest-Only | 3 | $95,850,000 | 9.1 | % |
| 264 - 300 | 8 | 69,550,313 | 6.6 | |
| 301 - 360 | 84 | 882,427,722 | 84.2 | |
| Total: | 95 | $1,047,828,035 | 100.0 | % |
Weighted Average(3): | 355 months | |||
| (2) | The original amortization term shown for any mortgage loan that is interest-only for part of its term does not include the number of months in its interest-only period and reflects only the number of months as of the commencement of amortization remaining from the end of such interest-only period. |
| (3) | Excludes the non-amortizing mortgage loans. |
REMAINING AMORTIZATION TERM(4) | ||||
Range of Remaining Amortization Terms (months) | Number of Mortgage Loans | Aggregate Cut- off Date Balance | % of Cut-off Date Balance | |
| Interest-Only | 3 | $95,850,000 | 9.1 | % |
| 264 - 300 | 8 | 69,550,313 | 6.6 | |
| 301 - 360 | 84 | 882,427,722 | 84.2 | |
| Total: | 95 | $1,047,828,035 | 100.0 | % |
Weighted Average(5): | 355 months | |||
| (4) | The remaining amortization term shown for any mortgage loan that is interest-only for part of its term does not include the number of months in its interest-only period and reflects only the number of months as of the commencement of amortization remaining from the end of such interest-only period. |
| (5) | Excludes the non-amortizing mortgage loans. |
| LOCKBOXES | ||||
| Type of Lockbox | Number of Mortgage Loans | Aggregate Cut- off Date Balance | % of Cut-off Date Balance | |
| Springing (Without Established Account) | 60 | $632,314,577 | 60.3 | % |
| Hard/Springing Cash Management | 14 | 284,304,691 | 27.1 | |
| None | 19 | 89,283,526 | 8.5 | |
| Hard/Upfront Cash Management | 2 | 41,925,241 | 4.0 | |
| Total: | 95 | $1,047,828,035 | 100.0 | % |
| PREPAYMENT PROVISION SUMMARY | ||||
| Prepayment Provision | Number of Mortgage Loans | Aggregate Cut- off Date Balance | % of Cut-off Date Balance | |
| Lockout/Defeasance/Open | 67 | $740,067,880 | 70.6 | % |
| Lockout/GTR YM or 1%/Open | 25 | 219,260,155 | 20.9 | |
| Lockout/Defeasance or GTR YM or 1%/Open | 3 | 88,500,000 | 8.4 | |
| Total: | 95 | $1,047,828,035 | 100.0 | % |
| CUT-OFF DATE LOAN-TO-VALUE RATIO | ||||
Range of Cut-off Date LTV Ratios (%) | Number of Mortgage Loans | Aggregate Cut- off Date Balance | % of Cut-off Date Balance | |
| 43.7 - 50.0 | 2 | $7,591,046 | 0.7 | % |
| 50.1 - 55.0 | 1 | 11,750,000 | 1.1 | |
| 55.1 - 60.0 | 9 | 160,359,494 | 15.3 | |
| 60.1 - 65.0 | 9 | 155,657,513 | 14.9 | |
| 65.1 - 70.0 | 28 | 365,643,657 | 34.9 | |
| 70.1 - 75.0 | 45 | 339,515,925 | 32.4 | |
| 75.1 - 75.4 | 1 | 7,310,400 | 0.7 | |
| Total: | 95 | $1,047,828,035 | 100.0 | % |
| Weighted Average: | 67.3% | |||
| BALLOON LOAN-TO-VALUE RATIO | ||||
| Range of Balloon LTV Ratios (%) | Number of Mortgage Loans | Aggregate Cut- off Date Balance | % of Cut-off Date Balance | |
| 34.6 - 40.0 | 1 | $5,291,046 | 0.5 | % |
| 40.1 - 50.0 | 11 | 78,737,235 | 7.5 | |
| 50.1 - 55.0 | 11 | 126,812,477 | 12.1 | |
| 55.1 - 60.0 | 38 | 535,752,390 | 51.1 | |
| 60.1 - 65.0 | 31 | 283,014,487 | 27.0 | |
| 65.1 - 68.8 | 3 | 18,220,400 | 1.7 | |
| Total: | 95 | $1,047,828,035 | 100.0 | % |
| Weighted Average: | 57.8% | |||
| AMORTIZATION TYPE | ||||
| Type of Amortization | Number of Mortgage Loans | Aggregate Cut- off Date Balance | % of Cut-off Date Balance | |
| Interest-only, Amortizing Balloon | 49 | $626,965,650 | 59.8 | % |
| Amortizing Balloon | 43 | 325,012,385 | 31.0 | |
| Interest-only, Balloon | 3 | 95,850,000 | 9.1 | |
| Total: | 95 | $1,047,828,035 | 100.0 | % |
| ORIGINAL TERM OF INTEREST-ONLY PERIOD FOR PARTIAL IO LOANS | ||||
| IO Term (months) | Number of Mortgage Loans | Aggregate Cut- off Date Balance | % of Cut-off Date Balance | |
| 12 - 24 | 20 | $197,847,000 | 18.9 | % |
| 25 - 36 | 22 | 314,486,250 | 30.0 | |
| 37 - 48 | 1 | 10,500,000 | 1.0 | |
| 49 - 60 | 6 | 104,132,400 | 9.9 | |
| Total: | 49 | $626,965,650 | 59.8 | % |
| Weighted Average: | 35 months | |||
| SEASONING | ||||
| Seasoning (months) | Number of Mortgage Loans | Aggregate Cut- off Date Balance | % of Cut-off Date Balance | |
| 0 | 24 | $315,715,800 | 30.1 | % |
| 1 | 48 | 428,674,604 | 40.9 | |
| 2 | 11 | 94,567,954 | 9.0 | |
| 3 | 12 | 208,869,676 | 19.9 | |
| Total: | 95 | $1,047,828,035 | 100.0 | % |
| Weighted Average: | 1 month | |||
| Wells Fargo Commercial Mortgage Trust 2015-C27 | Certain Terms and Conditions |
| Interest Entitlements: | The interest entitlement of each Class of Offered Certificates on each Distribution Date generally will be the interest accrued during the related Interest Accrual Period on the related Certificate Principal Balance or Notional Amount at the related pass-through rate, net of any prepayment interest shortfalls allocated to that Class for such Distribution Date as described below. If prepayment interest shortfalls arise from voluntary prepayments (without Special Servicer consent) on particular non-specially serviced mortgage loans during any collection period, the Master Servicer is required to make a compensating interest payment to offset those shortfalls, generally up to an amount equal to the portion of its master servicing fees that accrue at one basis point per annum. The remaining amount of prepayment interest shortfalls will be allocated to reduce the interest entitlement on all Classes of Certificates (other than the Class X-A, X-B, X-E, X-F and X-G Certificates), pro rata, based on their respective amounts of accrued interest for the related Distribution Date (except with respect to the allocation among the Class A-S, B, C and PEX Certificates as described below under “Allocations and Distributions on the Class A-S, B, C and PEX Certificates”). If a Class receives less than the entirety of its interest entitlement on any Distribution Date, then the shortfall, excluding any shortfall due to prepayment interest shortfalls, will be added to its interest entitlement for the next succeeding Distribution Date. Interest entitlements on the Class E and D Certificates and the Class C and B regular interests, in that order, may be reduced by certain Trust Advisor expenses (subject to the discussion below under “Allocations and Distributions on the Class A-S, B, C and PEX Certificates”). | |
| Principal Distribution Amount: | The Principal Distribution Amount for each Distribution Date generally will be the aggregate amount of principal received or advanced in respect of the mortgage loans, net of any non-recoverable advances and interest thereon that are reimbursed to the Master Servicer, the Special Servicer or the Trustee during the related collection period. Non-recoverable advances and interest thereon are reimbursable from principal collections and advances before reimbursement from other amounts. The Principal Distribution Amount may also be reduced, with a corresponding loss, to the Class E and D Certificates and the Class C, B and A-S regular interests, then to the Class A-1, A-2, A-3, A-4, A-5 and A-SB Certificates (with any losses on the Class A-1, A-2, A-3, A-4, A-5 and A-SB Certificates allocated pro rata according to their respective Certificate Principal Balances immediately prior to that Distribution Date), in that order, in connection with certain Trust Advisor expenses to the extent that interest entitlements on the Class B and C regular interests and the Class D and E Certificates are insufficient to absorb the effect of the expense on any particular Distribution Date. For a discussion on the allocation of amounts distributable in respect of the Class A-S, B and C regular interests, see “Allocations and Distributions on the Class A-S, B, C and PEX Certificates” below. | |
| Distributions: | On each Distribution Date, funds available for distribution from the mortgage loans, net of specified trust fees, expenses and reimbursements will generally be distributed in the following amounts and order of priority (in each case to the extent of remaining available funds): | |
1. Class A-1, A-2, A-3, A-4, A-5, A-SB, X-A, X-B, X-E, X-F and X-G Certificates: To interest on the Class A-1, A-2, A-3, A-4, A-5, A-SB, X-A, X-B, X-E, X-F and X-G Certificates, pro rata, according to their respective interest entitlements. | ||
| 2. Class A-1, A-2, A-3, A-4, A-5 and A-SB Certificates: To principal on the Class A-1, A-2, A-3, A-4, A-5 and A-SB Certificates in the following amounts and order of priority: (i) first, to principal on the Class A-SB Certificates, in an amount up to the Principal Distribution Amount for such Distribution Date until their Certificate Principal Balance is reduced to the Class A-SB Planned Principal Balance for such Distribution Date; (ii) second, to principal on the Class A-1 Certificates until their Certificate Principal Balance is reduced to zero, up to the remainder of the Principal Distribution Amount for such Distribution Date; (iii) third, to principal on the Class A-2 Certificates until their Certificate Principal Balance is reduced to zero, up to the remainder of the Principal Distribution Amount for such Distribution Date; (iv) fourth, to principal on the Class A-3 Certificates until their Certificate Principal Balance is reduced to zero, up to the remainder of the Principal Distribution Amount for such Distribution Date; (v) fifth, to principal on the Class A-4 Certificates until their Certificate Principal Balance is reduced to zero, up to the remainder of the Principal Distribution Amount for such Distribution Date; (vi) sixth, to principal on the Class A-5 Certificates until their Certificate Principal Balance is reduced to zero, up to the remainder of the Principal Distribution Amount for such Distribution Date; and (vii) seventh, to principal on the Class A-SB Certificates until their Certificate Principal Balance is reduced to zero, up to the remainder of the Principal Distribution Amount for such Distribution Date. However, if the Certificate Principal Balance of each and every Class of Principal Balance Certificates, other than the Class A-1, A-2, A-3, A-4, A-5 and A-SB Certificates, has been reduced to zero as a result of the allocation of Mortgage Loan losses and expenses and any of the Class A-1, A-2, A-3, A-4, A-5 and A-SB Certificates |
| Wells Fargo Commercial Mortgage Trust 2015-C27 | Certain Terms and Conditions |
remains outstanding, then the Principal Distribution Amount will be distributed on the Class A-1, A-2, A-3, A-4, A-5 and A-SB Certificates, pro rata, based on their respective outstanding Certificate Principal Balances, until their Certificate Principal Balances have been reduced to zero. | ||
3. Class A-1, A-2, A-3, A-4, A-5 and A-SB Certificates: To reimburse the holders of the Class A-1, A-2, A-3, A-4, A-5 and A-SB Certificates, pro rata, for any previously unreimbursed losses (other than certain Trust Advisor expenses) on the mortgage loans that were previously allocated in reduction of the Certificate Principal Balances of such Classes. | ||
4. Class A-S regular interest: To make distributions on the Class A-S regular interest as follows: (a) first, to interest on Class A-S regular interest in the amount of the interest entitlement for that Class; (b) next, to the extent of the portion of the Principal Distribution Amount remaining after distributions in respect of principal to each Class with a higher distribution priority (in this case, the Class A-1, A-2, A-3, A-4, A-5 and A-SB Certificates), to principal on the Class A-S regular interest until its principal balance is reduced to zero; and (c) next, to reimburse the holders of the Class A-S regular interest for any previously unreimbursed losses (other than certain Trust Advisor expenses) on the mortgage loans that were previously allocated to that Class in reduction of its principal balance. 5. Class B regular interest: To make distributions on the Class B regular interest as follows: (a) first, to interest on Class B regular interest in the amount of the interest entitlement for that Class; (b) next, to the extent of the portion of the Principal Distribution Amount remaining after distributions in respect of principal to each Class with a higher distribution priority (in this case, the Class A-1, A-2, A-3, A-4, A-5 and A-SB Certificates and the Class A-S regular interest), to principal on the Class B regular interest until its principal balance is reduced to zero; and (c) next, to reimburse the holders of the Class B regular interest for any previously unreimbursed losses (other than certain Trust Advisor expenses) on the mortgage loans that were previously allocated to that Class in reduction of its principal balance. 6. Class C regular interest: To make distributions on the Class C regular interest as follows: (a) first, to interest on Class C regular interest in the amount of the interest entitlement for that Class; (b) next, to the extent of the portion of the Principal Distribution Amount remaining after distributions in respect of principal to each Class with a higher distribution priority (in this case, the Class A-1, A-2, A-3, A-4, A-5 and A-SB Certificates and the Class A-S and B regular interests), to principal on the Class C regular interest until its principal balance is reduced to zero; and (c) next, to reimburse the holders of the Class C regular interest for any previously unreimbursed losses (other than certain Trust Advisor expenses) on the mortgage loans that were previously allocated to that Class in reduction of its principal balance. | ||
7. Class D Certificates: To make distributions on the Class D Certificates as follows: (a) first, to interest on Class D Certificates in the amount of the interest entitlement for that Class; (b) next, to the extent of the portion of the Principal Distribution Amount remaining after distributions in respect of principal to each Class with a higher distribution priority (in this case, the Class A-1, A-2, A-3, A-4, A-5 and A-SB Certificates and the Class A-S, B and C regular interests), to principal on the Class D Certificates until its principal balance is reduced to zero; and (c) next, to reimburse the holders of the Class D Certificates for any previously unreimbursed losses (other than certain Trust Advisor expenses) on the mortgage loans that were previously allocated to that Class in reduction of its principal balance. | ||
8. After the Class A-1, A-2, A-3, A-4, A-5 and A-SB Certificates, the Class A-S, B and C regular interests and the Class D Certificates are paid all amounts to which they are entitled, the remaining funds available for distribution will be used to pay interest, principal and loss reimbursement amounts (other than certain Trust Advisor expenses) on the Class E, F and G Certificates sequentially in that order in a manner analogous to the Class D Certificates. | ||
| Allocations and Distributions on the Class A-S, B, C and PEX Certificates: | On the closing date, the upper-tier REMIC of the issuing entity will issue the Class A-S, Class B and Class C regular interests (each a “regular interest”) which will have outstanding principal balances on the closing date of $79,897,000 $45,842,000 and $68,109,000, respectively. The regular interests will be held in a grantor trust for the benefit of the holders of the Class A-S, B, C and PEX Certificates. The Class A-S, B, C and PEX Certificates will, at all times, represent |
| Wells Fargo Commercial Mortgage Trust 2015-C27 | Certain Terms and Conditions |
undivided beneficial ownership interests in a grantor trust that will hold those regular interests. Each class of the Class A-S, B and C Certificates will, at all times, represent an undivided beneficial ownership interest in a percentage of the outstanding principal balance of the regular interest with the same alphabetical class designation. The Class PEX Certificates will, at all times, represent an undivided beneficial ownership interest in the remaining percentages of the outstanding principal balances of the Class A-S, B and C regular interests and which percentage interests are referred to in this Term Sheet as the “Class PEX Component A-S, Class PEX Component B and Class PEX Component C” (collectively, the “Class PEX Components”). Interest, principal, prepayment premiums, yield maintenance charges and voting rights that are allocated to the Class A-S, B or C regular interest will be distributed or allocated, as applicable, as between the Class A-S, B or C Certificates, as applicable, on the one hand, and Class PEX Component A-S, Class PEX Component B or Class PEX Component C, as applicable (and correspondingly, the Class PEX Certificates), on the other hand, pro rata, based on their respective percentage interests in the Class A-S, Class B or Class C regular interest, as applicable. In addition, any losses (including, without limitation, as a result of Trust Advisor expenses) that are allocated to the Class A-S, Class B or Class C regular interest will correspondingly be allocated as between the Class A-S, B or C Certificates, as applicable, on the one hand, and Class PEX Component A-S, Class PEX Component B or Class PEX Component C, as applicable (and correspondingly, the Class PEX Certificates), on the other hand, pro rata, based on their respective percentage interests in the Class A-S, Class B or Class C regular interest, as applicable. For a complete description of the allocations and distributions with respect to the Class A-S regular interest, the Class B regular interest and the Class C regular interest (and correspondingly the Class A-S, B, C and PEX Certificates and the Class PEX Component A-S, Class PEX Component B and Class PEX Component C), see “Description of the Offered Certificates” in the Free Writing Prospectus. See “Material Federal Income Tax Consequences” in the Free Writing Prospectus for a discussion of the tax treatment of the Exchangeable Certificates. | ||
Exchanging Certificates through Combination and Recombination: | If you own Class A-S, B and C Certificates, you will be able to exchange them for a proportionate interest in the Class PEX Certificates, and vice versa, as described in the Free Writing Prospectus. You can exchange your Exchangeable Certificates by notifying the Certificate Administrator. If Exchangeable Certificates are outstanding and held by certificateholders, those certificates will receive principal and interest that would otherwise have been payable on the same proportion of certificates exchanged therefor if those certificates were outstanding and held by certificateholders. Any such allocations of principal and interest between classes of Exchangeable Certificates will have no effect on the principal or interest entitlements of any other class of certificates. The Free Writing Prospectus describes the available combinations of Exchangeable Certificates eligible for exchange. | |
| Allocation of Yield Maintenance and Prepayment Premiums: | If any yield maintenance charge or prepayment premium is collected during any particular collection period with respect to any mortgage loan, then on the distribution date corresponding to that collection period, the certificate administrator will pay that yield maintenance charge or prepayment premium (net of liquidation fees payable therefrom) in the following manner: (1) to each of the Class A-1, A-2, A-3, A-4, A-5, A-SB and D Certificates and Class A-S, B and C regular interests, the product of (a) such yield maintenance charge or prepayment premium, (b) the related Base Interest Fraction (as defined in the Free Writing Prospectus) for such class or regular interest, and (c) a fraction, the numerator of which is equal to the amount of principal distributed to such class or regular interest for that distribution date, and the denominator of which is the total amount of principal distributed to all Principal Balance Certificates (other than the Exchangeable Certificates) and the Class A-S, B and C regular interests for that distribution date, and (2) to the Class X-A Certificates, the excess, if any, of (a) the product of (i) such yield maintenance charge or prepayment premium and (ii) a fraction, the numerator of which is equal to the amount of principal distributed to the Class A-1, A-2, A-3, A-4, A-5, A-SB Certificates and Class A-S regular interest for that distribution date, and the denominator of which is the total amount of principal distributed to all Principal Balance Certificates (other than the Exchangeable Certificates) and the Class A-S, B and C regular interests for that distribution date, over (b) the amount of such yield maintenance charge or prepayment premium distributed to the Class A-1, A-2, A-3, A-4, A-5, A-SB Certificates and Class A-S regular interest as described above, and (3) to the Class X-B Certificates, any remaining such yield maintenance charge or prepayment premium not distributed as described above. No prepayment premiums or yield maintenance charges will be distributed to the holders of the Class X-E, X-F, X-G, E, F, G, V or R Certificates. For a description of when prepayment premiums and yield maintenance charges are generally required on the mortgage loans, see Annex A-1 to the Free Writing Prospectus. See also “Risk Factors—Prepayments and Repurchases of the Mortgage Assets Will Affect the Timing of Your Cash Flow and May Affect Your Yield” in the prospectus attached to the Free Writing Prospectus. Prepayment premiums and yield maintenance charges will be distributed on each Distribution Date only to the extent they are actually received on the mortgage loans as of the related Determination Date. |
| Wells Fargo Commercial Mortgage Trust 2015-C27 | Certain Terms and Conditions |
| Realized Losses: | The Certificate Principal Balances of the Class A-1, A-2, A-3, A-4, A-5, A-SB, D, E, F and G Certificates, and the Class A-S, B and C regular interests will be reduced without distribution on any Distribution Date as a write-off to the extent of any losses realized on the mortgage loans allocated to such Class or regular interest on such Distribution Date. Such losses (other than certain Trust Advisor expenses) will be applied in the following order, in each case until the related Certificate Principal Balance is reduced to zero: first, to Class G; second, to Class F; third, to Class E; fourth, to Class D; fifth, to the Class C regular interest; sixth, to the Class B regular interest; seventh, to the Class A-S regular interest; and, finally, pro rata, to Classes A-1, A-2, A-3, A-4, A-5 and A-SB based on their outstanding Certificate Principal Balances. Certain Trust Advisor expenses (if not absorbed by reductions of interest entitlements on the Class E and D Certificates and the Class C and B regular interests) will be applied as write-offs in a similar manner, except that such write-offs will be applied only to the Class E and D Certificates, the Class C, B and A-S regular interests, and the Class A-1, A-2, A-3, A-4, A-5 and A-SB Certificates (with any write-offs on the Class A-1, A-2, A-3, A-4, A-5 and A-SB Certificates to be allocated pro rata according to their respective Certificate Principal Balances immediately prior to that Distribution Date), in that order. Any realized losses allocated to the Class A-S, B and C regular interests will, in turn, be allocated to the Class A-S, B, C and PEX Certificates as described above in “Allocations and Distributions on the Class A-S, B, C and PEX Certificates”. The notional amount of the Class X-A Certificates will be reduced by the amount of all losses that are allocated to the Class A-1, A-2, A-3, A-4, A-5 or A-SB Certificates or the Class A-S regular interest as write-offs in reduction of their Certificate Principal Balances. The notional amount of the Class X-B Certificates will be reduced by the amount of all losses that are allocated to the Class B and C regular interests and the Class D Certificates as write-offs in reduction of their Certificate Principal Balances. The notional amount of the Class X-E Certificates will be reduced by the amount of all losses that are allocated to the Class E Certificates as write-offs in reduction of its Certificate Principal Balance. The notional amount of the Class X-F Certificates will be reduced by the amount of all losses that are allocated to the Class F Certificates as write-offs in reduction of its Certificate Principal Balance. The notional amount of the Class X-G Certificates will be reduced by the amount of all losses that are allocated to the Class G Certificates as write-offs in reduction of its Certificate Principal Balance. | |
| Debt Service Advances: | The Master Servicer or, if the Master Servicer fails to do so, the Trustee, will be obligated to advance delinquent debt service payments (other than balloon payments and default interest) and assumed debt service payments on the mortgage loans (including each pari passu mortgage loan but not its related pari passu companion loans), except to the extent any such advance is deemed non-recoverable from collections on the related mortgage loan. In addition, if an Appraisal Reduction Amount exists for a given mortgage loan, the interest portion of any debt service advance for such mortgage loan will be reduced, which will have the effect of reducing the amount of interest available for distribution to the Certificates in reverse alphabetical order of their Class designations (except that interest payments on the Class A-1, A-2, A-3, A-4, A-5, A-SB, X-A, X-B, X-E, X-F and X-G Certificates would be affected on a pari passu basis). | |
| Servicing Advances: | The Master Servicer or, if the Master Servicer fails to do so, the Trustee, will be obligated to make servicing advances with respect to each mortgage loan it services, including the payment of delinquent property taxes, insurance premiums and ground rent, except to the extent that those advances are deemed non-recoverable from collections on the related mortgage loan. The master servicer under the MSBAM 2015-C21 securitization is expected to have the primary obligation to make any servicing advances with respect to the Westfield Palm Desert loan combination. The master servicer under the WFCM 2014-LC18 securitization will have the primary obligation to make any servicing advances with respect to the Depot Park loan combination. The master servicer of the CGCMT 2015-GC27 securitization will have the primary obligation to make any servicing advances with respect to the Boca Hamptons Plaza Portfolio loan combination. | |
| Appraisal Reduction Amounts: | An Appraisal Reduction Amount generally will be created in the amount, if any, by which the principal balance of a required appraisal loan (which is a mortgage loan with respect to which certain defaults, modifications or insolvency events have occurred as further described in the Free Writing Prospectus) plus other amounts overdue or advanced in connection with such mortgage loan exceeds 90% of the appraised value of the related mortgaged property plus certain escrows and reserves (including letters of credit) held with respect to the mortgage loan. A mortgage loan will cease to be a required appraisal loan when the same has ceased to be a specially serviced mortgage loan (if applicable), has been brought current for at least three consecutive months and no other circumstances exist that would cause such mortgage loan to be a required appraisal loan. Appraisal Reduction Amounts will affect the amount of debt service advances on the related mortgage loan. Appraisal Reduction Amounts will also be taken into account in the determination |
| Wells Fargo Commercial Mortgage Trust 2015-C27 | Certain Terms and Conditions |
| of the identity of the Class whose majority constitutes the “majority subordinate certificateholder” and is entitled to appoint the subordinate class representative. | ||
Clean-Up Call and Exchange Termination: | On each Distribution Date occurring after the aggregate unpaid principal balance of the mortgage loans is reduced below 1% of the initial aggregate principal balance of the mortgage loans as of the Cut-off Date, certain specified persons will have the option to purchase all of the remaining mortgage loans (and the trust’s interest in all property acquired through exercise of remedies in respect of any mortgage loan) at the price specified in the Free Writing Prospectus. Exercise of the option will terminate the trust and retire the then-outstanding certificates. If the aggregate Certificate Principal Balances of each of the Class A-1, A-2, A-3, A-4, A-5, A-SB, PEX and D Certificates and the Class A-S, B and C regular interests have been reduced to zero, the trust may also be terminated in connection with an exchange of all the then-outstanding certificates, for the mortgage loans and REO properties then remaining in the issuing entity, but all of the holders of those Classes of outstanding certificates would have to voluntarily participate in the exchange. | |
| Liquidation Loan Waterfall: | Following the liquidation of any loan or property, the net liquidation proceeds generally will be applied (after reimbursement of advances and certain trust fund expenses), first, as a recovery of accrued interest, other than delinquent interest that was not advanced as a result of Appraisal Reduction Amounts, second, as a recovery of principal until all principal has been recovered, and then as a recovery of delinquent interest that was not advanced as a result of Appraisal Reduction Amounts. Please see “Description of the Offered Certificates—Distributions—Application of Mortgage Loan Collections” in the Free Writing Prospectus. | |
| Majority Subordinate Certificateholder and Subordinate Class Representative: | A subordinate class representative may be appointed by the “majority subordinate certificate-holder”, which will be the holder(s) of a majority of: (a) during a “subordinate control period”, the most subordinate class among the Class F and G Certificates that has a Certificate Principal Balance, as notionally reduced by any Appraisal Reduction Amounts allocable to that class, that is at least equal to 25% of its total initial principal balance and (b) during a “collective consultation period”, the most subordinate class among the Class F and G Certificates that has a total principal balance, without regard to Appraisal Reduction Amounts, that is at least equal to 25% of its initial Certificate Principal Balance. The majority subordinate certificateholder will have a continuing right to appoint, remove or replace the subordinate class representative in its sole discretion. This right may be exercised at any time and from time to time. See “Servicing of the Mortgage Loans and Administration of the Trust Fund—The Majority Subordinate Certificateholder and the Subordinate Class Representative” in the Free Writing Prospectus. | |
| Control and Consultation: | The rights of various parties to replace the Special Servicer and approve or consult with respect to major actions of the Special Servicer will vary according to defined periods. A “subordinate control period” will exist as long as the Class F Certificates have a Certificate Principal Balance, net of any Appraisal Reduction Amounts allocable to that class, that is not less than 25% of the initial principal balance of that class (unless a senior consultation period is deemed to occur generally or with respect to a particular mortgage loan, pursuant to clause (ii) of the definition of “senior consultation period”). In general, during a subordinate control period, (i) the subordinate class representative will be entitled to grant or withhold approval of asset status reports prepared, and material servicing actions proposed, by the Special Servicer, and (ii) the majority subordinate certificateholder, or the subordinate class representative on its behalf, will be entitled to terminate and replace the Special Servicer with or without cause, and appoint itself or another person as the successor special servicer (other than with respect to the Westfield Palm Desert and Depot Park and loan combinations). It will be a condition to such appointment that DBRS, KBRA and Moody’s confirm that the appointment would not result in a qualification, downgrade or withdrawal of any of their then-current ratings of certificates. With respect to the Boca Hamptons Plaza Portfolio Mortgage Loan, serviced pursuant to the CGCMT 2015-GC27 pooling and servicing agreement, the majority subordinate certificateholder, or the subordinate class representative on its behalf, has the right to terminate the CGCMT 2015-GC27 special servicer solely with respect to the Boca Hamptons Plaza Portfolio Loan Combination, under terms substantially similar in all material respects to or materially consistent with the rights described above. A “collective consultation period” will exist as long as the Class F Certificates have a Certificate Principal Balance that both (i) as notionally reduced by any Appraisal Reduction Amounts allocable to that class, is less than 25% of its initial principal balance and (ii) without regard to any Appraisal Reduction Amounts allocable to that class, is 25% or more of its initial Certificate Principal Balance (unless a senior consultation period is deemed to occur generally or with respect to a particular mortgage loan, pursuant to clause (ii) of the definition of “senior consultation period”). In general, during a collective consultation period, the Special Servicer will be required to consult with the Trust Advisor (in addition to the subordinate class representative, during a collective consultation period) in connection with asset status reports and material special servicing actions. With respect to the Boca Hampton Plaza Portfolio Mortgage Loan, the subordinate class representative |
| Wells Fargo Commercial Mortgage Trust 2015-C27 | Certain Terms and Conditions |
will have the right to consent to, and consult with respect to, the actions of the CGCMT 2015-GC27 special servicer in accordance with the related Intercreditor Agreement and the CGCMT 2015-GC27 pooling and servicing agreement in the same manner as the subordinate class representative under the CGCMT 2015-GC27 pooling and servicing agreement does with respect to the other mortgage loans in that securitization. A “senior consultation period” will exist as long as either (i) the Class F certificates have an aggregate principal balance, without regard to any Appraisal Reduction Amounts allocable to that class, that is less than 25% of its initial principal balance or (ii) during such time as the Class F certificates are the most subordinate class of control-eligible certificates that have a then outstanding principal balance, net of Appraisal Reduction Amounts, at least equal to 25% of its initial principal balance, the then-majority subordinate certificateholder has irrevocably waived its right to appoint a subordinate class representative and to exercise any of the rights of the majority subordinate certificateholder or cause the exercise of the rights of the subordinate class representative and such rights have not been reinstated to a successor majority subordinate certificateholder as set forth in the pooling and servicing agreement. In general, during a senior consultation period, the Special Servicer must seek to consult with the Trust Advisor in connection with asset status reports and material special servicing actions, and, in general, no subordinate class representative will be recognized or have any right to terminate the Special Servicer or approve, direct or consult with respect to servicing matters. With respect to the Boca Hamptons Plaza Portfolio loan combination, the rights of the subordinate class representative described above will be subject to the consultation rights of the holder of a related pari passu companion loan described under “Loan Combinations” below. Notwithstanding any contrary description set forth above, with respect to the Boca Hamptons Plaza Portfolio mortgage loan, (a) the holder of the pari passu companion loan in the related loan combination (including any subordinate class representative or special servicer under the CGCMT 2015-GC27 securitization) will have consultation rights with respect to asset status reports and material special servicing actions involving the related loan combination, as provided for in the related intercreditor agreement and as described in the Free Writing Prospectus, and those rights will be in addition to the rights of the subordinate class representative in this transaction with respect to the Boca Hamptons Plaza Portfolio loan combination described above; and (b) the existence of a subordinate control period, collective consultation period or senior consultation period under the WFCM 2015-C27 pooling and servicing agreement will not limit the consultation rights of the holders of the related pari passu companion loan. Also, notwithstanding any contrary description set forth above, with respect to the Westfield Palm Desert mortgage loan and the Depot Park mortgage loan, in general the related loan combination will be serviced under the MSBAM 2015-C21 pooling and servicing agreement and WFCM 2014-LC18 pooling and servicing agreement, respectively, which grant to the related subordinate class representative control rights that include the right to approve or disapprove various material servicing actions involving the related loan combination but the subordinate class representative for this securitization will nonetheless have the right to be consulted on a non-binding basis with respect to such actions. For purposes of the servicing of the Westfield Palm Desert loan combination and the Depot Park loan combination, the occurrence and continuance of a collective consultation period or senior consultation period with respect to the subordinate class representative under this securitization will not limit the control or other rights of the subordinate class representative under the MSBAM 2015-C21 or WFCM 2014-LC18 securitization, respectively, and any collective consultation period or senior consultation period or similar period under the MSBAM 2015-C21 or WFCM 2014-LC18 securitization, respectively, will not limit the consultation rights of the subordinate class representative under this securitization. In general, loan combination control rights also include the right, in certain circumstances, to direct the replacement of the special servicer for the related loan combination only. | ||
| Replacement of Special Servicer by General Vote of Certificateholders: | During any “collective consultation period” or “senior consultation period”, the Special Servicer may be terminated and replaced upon the affirmative direction of certificate owners holding not less than 75% of the appraisal-reduced voting rights of all certificates, following a proposal from certificate owners holding not less than 25% of the appraisal-reduced voting rights of all certificates. The certificateholders who initiate a vote on a termination and replacement of the Special Servicer without cause must cause DBRS, KBRA and Moody’s to confirm the then-current ratings of the certificates (or decline to review the matter) and cause the payment of the fees and expenses incurred in the replacement. | |
| Appraisal Remedy: | Solely for purposes of determining whether a “subordinate control period” is in effect, whenever the Special Servicer obtains an appraisal or updated appraisal under the pooling and servicing agreement, the subordinate class representative, with respect to the mortgage loans serviced by the Special Servicer will have the right (at its or their expense) to direct the Special Servicer to hire a qualified appraiser to prepare a second appraisal of the mortgaged property. The Special Servicer must thereafter determine whether, based on its assessment of such second appraisal, any recalculation of the Appraisal Reduction Amount is warranted. The Appraisal Reduction |
| Wells Fargo Commercial Mortgage Trust 2015-C27 | Certain Terms and Conditions |
| Amount, whether based on the first or the second appraisal, will become effective following the second appraisal, except that the Appraisal Reduction Amount based on the first appraisal shall become effective if the subordinate class representative declines to demand a second appraisal within a specified number of business days, or if a second appraisal is not received within 90 days after the direction of the subordinate class representative. In addition, for the same purposes, if there is a material change in the mortgaged property securing any mortgage loan for which an Appraisal Reduction Amount has been calculated, the majority certificateholder of the Class F or G Certificates or other designated certificateholders will be entitled (at its expense) to present an additional appraisal to the Special Servicer, which will generally be required to recalculate the Appraisal Reduction Amount based upon such additional appraisal. This latter right may not be exercised more frequently than once in any 12-month period for each mortgage loan for which an Appraisal Reduction Amount was calculated and can only be exercised during a subordinate control period or a collective consultation period as further described in the Free Writing Prospectus. | ||
| Sale of Defaulted Assets: | There will be no “fair value” purchase option. Instead, the pooling and servicing agreement will authorize the Special Servicer to sell defaulted mortgage loans serviced by the Special Servicer to the highest bidder in a manner generally similar to sales of REO properties. The sale of a defaulted loan (other than the Westfield Palm Desert mortgage loan and the Depot Park mortgage loan) for less than par plus accrued interest and certain other fees and expenses owed on the loan will be subject to consent or consultation rights of the subordinate class representative and/or Trust Advisor. In the case of the Westfield Palm Desert mortgage loan, pursuant to the related intercreditor agreement and the MSBAM 2015-C21 pooling and servicing agreement, the MSBAM 2015-C21 special servicer may offer to sell to any person (or may offer to purchase) for cash the related loan combination during such time as the related pari passu companion loan constitutes a defaulted mortgage loan under the MSBAM 2015-C21 pooling and servicing agreement, and, in connection with any such sale, the MSBAM 2015-C21 special servicer is required to sell both the applicable mortgage loan and the related pari passu companion loan as a whole loan. The subordinate class representative for this securitization will have consultation rights as the holder of an interest in the related pari passu mortgage loan, as described in the Free Writing Prospectus. In the case of the Depot Park mortgage loan, pursuant to the related intercreditor agreement and the WFCM 2014-LC18 pooling and servicing agreement, the WFCM 2014-LC18 special servicer may offer to sell to any person (or may offer to purchase) for cash the related loan combination during such time as the related pari passu companion loan constitutes a defaulted mortgage loan under the WFCM 2014-LC18 pooling and servicing agreement, and, in connection with any such sale, the WFCM 2014-LC18 special servicer is required to sell both the applicable mortgage loan and the related pari passu companion loan as a whole loan. The subordinate class representative for this securitization will have consultation rights as the holder of an interest in the related pari passu mortgage loan, as described in the Free Writing Prospectus. In the case of the Boca Hamptons Plaza Portfolio mortgage loan, pursuant to the related intercreditor agreement and the CGCMT 2015-GC27 pooling and servicing agreement, the CGCMT 2015-GC27 special servicer may offer to sell to any person (or may offer to purchase) for cash the related loan combination during such time as the related pari passu companion loan constitutes a defaulted mortgage loan under the CGCMT 2015-GC27 pooling and servicing agreement, and, in connection with any such sale, the CGCMT 2015-GC27 special servicer is required to sell both the applicable mortgage loan and the related pari passu companion loan as a whole loan. The subordinate class representative for this securitization will have consent or consultation rights with respect to such sale, as described in the Free Writing Prospectus. | |
| “As-Is” Appraisals: | Appraisals must be conducted on an “as-is” basis, and must be no more than 9 months old, for purposes of determining Appraisal Reduction Amounts, market value in connection with REO sales, etc. Required appraisals may consist of updates of prior appraisals. Internal valuations by the Special Servicer are permitted if the principal balance of a mortgage loan is less than $2,000,000. | |
| Trust Advisor: | The Trust Advisor will perform certain review duties that will generally include a limited annual review of and report regarding the Special Servicer to the Certificate Administrator. The review and report generally will be based on: (a) during a collective consultation period or senior consultation period, any asset status reports and additional information delivered to the Trust Advisor by the Special Servicer with respect to any mortgage loan serviced by the Special Servicer, and/or (b) during a senior consultation period, in addition to the applicable information described above, a meeting with the Special Servicer to conduct a limited review of the Special Servicer’s operational practices on a platform basis in light of the servicing standard. In addition, during any collective consultation period or senior consultation period, the Special Servicer must |
| Wells Fargo Commercial Mortgage Trust 2015-C27 | Certain Terms and Conditions |
seek to consult with the Trust Advisor (in addition to the subordinate class representative during a collective consultation period) in connection with material special servicing actions with respect to specially serviced mortgage loans serviced by the Special Servicer. Furthermore, under certain circumstances, but only during a senior consultation period, the Trust Advisor may recommend the replacement of the Special Servicer, in which case the Certificate Administrator will deliver notice of such recommendation to the certificateholders, and certificateholders with specified percentages of the voting rights may direct the replacement of the Special Servicer at their expense. The Trust Advisor may be removed and replaced without cause upon the affirmative direction of certificates owners holding not less than 75% of the appraisal-reduced voting rights of all certificates, following a proposal from certificate owners holding not less than 25% of the appraisal-reduced voting rights of all certificates. The certificateholders who initiate a vote on a termination and replacement of the Trust Advisor without cause must cause DBRS, KBRA and Moody’s to confirm the then-current ratings of the certificates (or decline to review the matter) and cause the payment of the fees and expenses incurred in the replacement. During any “subordinate control period”, the proposed replacement trust advisor will be subject to the subordinate class representative’s consent (such consent not to be unreasonably withheld). If a proposed termination and replacement of the Trust Advisor is not consummated within 180 days following the initial request of the certificateholders who requested a vote, the proposed termination and replacement shall have no further force or effect. The Trust Advisor generally may be discharged from its duties if and when the Class A-1, A-2, A-3, A-4, A-5, A-SB, A-S, B, C, PEX, D and E Certificates are retired. | ||
| Certain Fee Offsets: | If a workout fee is earned by the Special Servicer following a loan default with respect to any mortgage loan that it services, then certain limitations will apply to the collection and retention of a modification fee from the borrower. The modification fee generally must not exceed 1% of the principal balance of the loan as modified. In addition, if the loan re-defaults within a specified period of months and other conditions are satisfied, any subsequent workout or liquidation fee on that loan must be reduced by a portion of the previously-collected modification fee. Furthermore, workout fees, liquidation fees and modification fees collected with respect to any workout, liquidation and/or partial liquidation of a mortgage loan or loan combination that is serviced by the Special Servicer will be subject to an aggregate cap equal to the greater of (i) $1,000,000 and (ii) 1.00% of the stated principal balance of the subject mortgage loan or loan combination. | |
| Deal Website: | The Certificate Administrator will be required to maintain a deal website which will include, among other items: (a) summaries of asset status reports prepared by the Special Servicer, (b) inspection reports, (c) appraisals, (d) various “special notices” described in the Free Writing Prospectus, (e) the “Investor Q&A Forum” and (f) a voluntary “Investor Registry”. Investors may access the deal website following execution of a certification and confidentiality agreement. | |
| Initial Majority Subordinate Certificateholder: | It is expected that Rialto CMBS V, LLC or another affiliate of Rialto Capital Advisors, LLC will be the initial majority subordinate certificateholder. | |
| Loan Combinations: | Each of the mortgaged properties identified on Annex A-1 to the Free Writing Prospectus as Westfield Palm Desert, Depot Park and Boca Hamptons Plaza Portfolio secure both a mortgage loan to be included in the trust fund and one or more other mortgage loans that will not be included in the trust fund, which will be pari passu in right of payment with the trust mortgage loan. The Westfield Desert Palm loan combination is expected to be serviced under the pooling and servicing agreement for the MSBAM 2015-C21 securitization. The Depot Park loan combination will be serviced under the pooling and servicing agreement for the WFCM 2014-LC18 securitization. The Boca Hamptons Plaza Portfolio loan combination will be serviced under the pooling and servicing agreement for the CGCMT 2015-GC27 securitization. As of the closing date, the pari passu companion loans in such loan combinations will be held by the parties identified above under “IV. Characteristics of the Mortgage Pool—B. Summary of Pari Passu Split Loan Structures”. |
| WESTFIELD PALM DESERT |
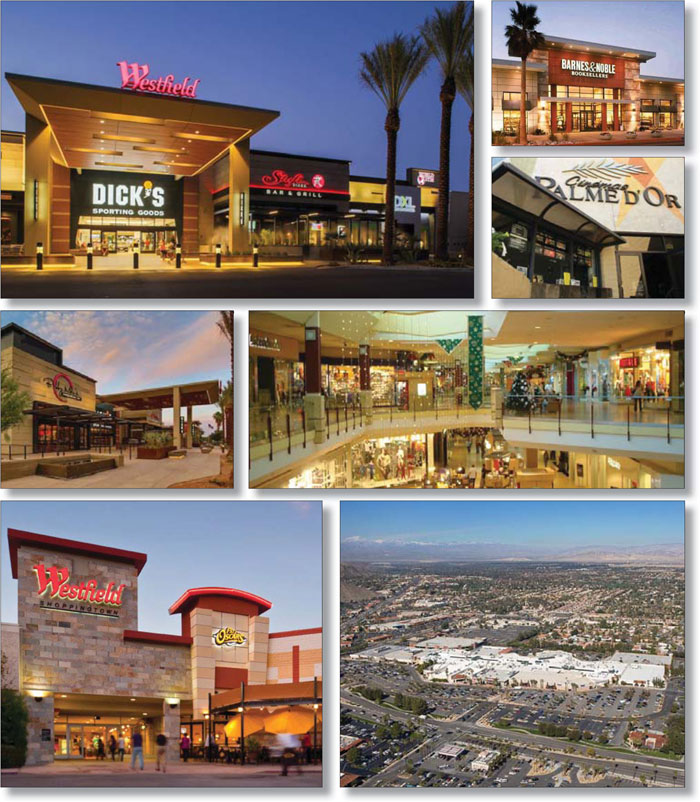
| WESTFIELD PALM DESERT |
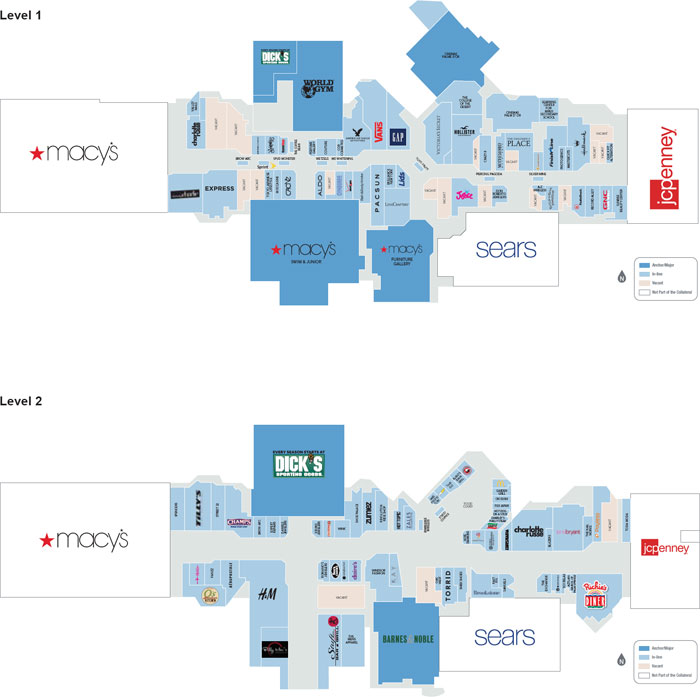
| WESTFIELD PALM DESERT |
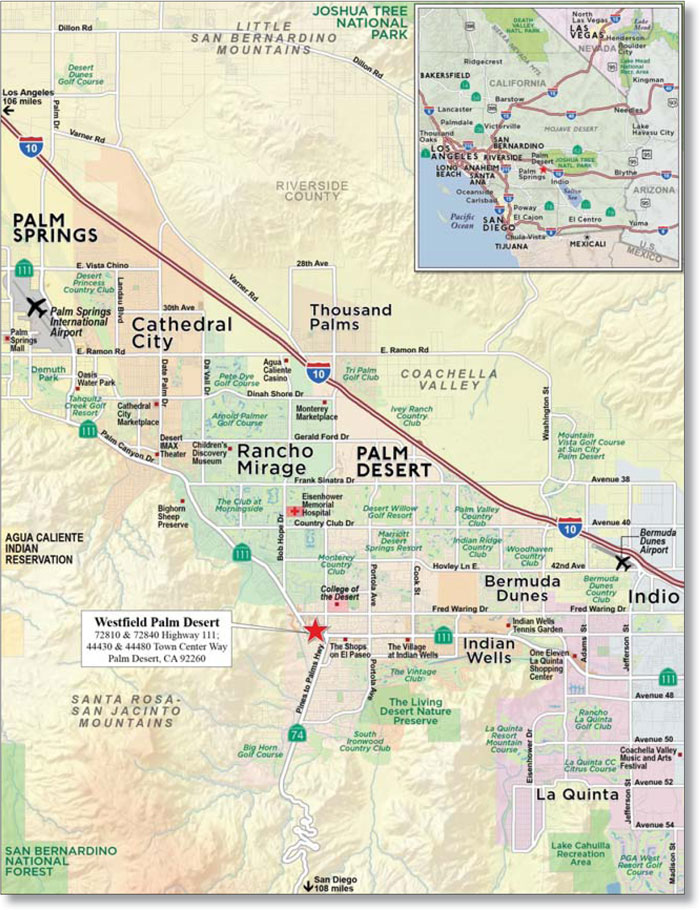
| Loan Information | Property Information | ||||||
| Mortgage Loan Seller: | Rialto Mortgage Finance, LLC | Single Asset/Portfolio: | Single Asset | ||||
| Credit Assessment (DBRS/KBRA/Moody’s): | NR/NR/NR | Property Type: | Retail | ||||
Original Principal Balance(1): | Specific Property Type: | ||||||
Cut-off Date Principal Balance(1): | Location: | ||||||
| % of Initial Pool Balance: | 6.0% | Size: | 572,724 SF | ||||
Loan Purpose(2): | Cut-off Date Principal Balance Per SF(1): | $218.26 | |||||
| Borrower Name: | Year Built/Renovated: | ||||||
| Sponsor: | Title Vesting: | ||||||
| Mortgage Rate: | Property Manager: | Self-managed | |||||
| Note Date: | 3rd Most Recent Occupancy (As of)(4): | ||||||
| Anticipated Repayment Date: | 2nd Most Recent Occupancy (As of)(4): | ||||||
| Maturity Date: | Most Recent Occupancy (As of): | ||||||
| IO Period: | Current Occupancy (As of): | 95.6% (2/2/2015) | |||||
| Loan Term (Original): | |||||||
| Seasoning: | Underwriting and Financial Information: | ||||||
| Amortization Term (Original): | NAP | ||||||
| Loan Amortization Type: | 3rd Most Recent NOI (As of): | ||||||
| Interest Accrual Method: | 2nd Most Recent NOI (As of): | ||||||
| Call Protection: | L(24),GRTR YM or 1% or D(89),O(7) | Most Recent NOI (As of): | $13,165,354 (12/31/2014) | ||||
| Lockbox Type: | |||||||
Additional Debt(1): | Yes | U/W Revenues: | |||||
Additional Debt Type(1): | Pari Passu | U/W Expenses: | |||||
| U/W NOI: | $13,533,661 | ||||||
| U/W NCF: | |||||||
Escrows and Reserves(3): | U/W NOI DSCR(1): | ||||||
U/W NCF DSCR(1): | 2.61x | ||||||
| Type: | Initial | Monthly | Cap (If Any) | U/W NOI Debt Yield(1): | |||
| Taxes | NAP | U/W NCF Debt Yield(1): | |||||
| Insurance | NAP | As-Is Appraised Value: | |||||
| Replacement Reserves | $310,923 | As-Is Appraisal Valuation Date: | |||||
| TI/LC Reserve | $462,941 | Cut-off Date LTV Ratio(1): | |||||
LTV Ratio at Maturity or ARD(1): | |||||||
| (1) | The Westfield Palm Desert Loan Combination, totaling $125,000,000, is comprised of eight pari passu notes (Notes A-1-1, A-1-2, A-2-1, A-2-2, B-1-1, B-1-2, B-2-1 and B-2-2). Notes A-2-1, A-2-2, B-2-1 and B-2-2 had an original principal balance of $62,500,000, have an outstanding principal balance of $62,500,000 as of the Cut-Off Date and will be contributed to the WFCM 2015-C27 Trust. Notes A-1-1, A-1-2, B-1-1 and B-1-2 had an original principal balance of $62,500,000 and are expected to be contributed to the MSBAM 2015-C21 securitization trust. All statistical financial information related to balances per square foot, loan-to-value ratios, debt service coverage ratios and debt yield are based on the Westfield Palm Desert Loan Combination. See Description of the Mortgage Pool – Split Loan Structures – Westfield Palm Desert Loan Combination” in the Free Writing Prospectus. |
| (2) | The Westfield Palm Desert Loan Combination recapitalized Westfield America Limited Partnership’s equity in the Westfield Palm Desert Property (it was previously unencumbered) and partially financed O’Connor Retail Investors II, L.P.’s acquisition of an equity interest in three properties including the Westfield Palm Desert Property. The allocated purchase price for the Westfield Palm Desert Property was $207,207,000. |
| (3) | See “Escrows” section. |
| (4) | Occupancy as shown is exclusive of temporary tenants. |
| WESTFIELD PALM DESERT |
| Sources | Uses | |||||||
| Original loan contribution amount | ||||||||
| Sponsors new cash contribution | 83,005,110 | 39.9 | Closing Costs | 798,110 | 0.4 | |||
| Total Sources | 100.0% | Total Uses | 100.0% |
| WESTFIELD PALM DESERT |
| Tenant Name | Credit Rating (Fitch/S&P/ Moody’s)(1) | Tenant NRSF | % of NRSF | Annual U/W Base Rent PSF(2) | Annual U/W Base Rent(2) | % of Total Annual U/W Base Rent | Sales PSF(3) | Occupancy Cost(3) | Lease Expiration Date | ||||||||||
| Anchor Tenants – Not Part of Collateral | |||||||||||||||||||
| Macy’s | BBB/BBB+/Baa2 | 196,285 | ANCHOR-OWNED – NOT PART OF THE COLLATERAL | ||||||||||||||||
| Sears | CC/CCC+/Caa1 | 123,946 | ANCHOR-OWNED – NOT PART OF THE COLLATERAL | ||||||||||||||||
| JC Penney | CCC/CCC+/Caa1 | 84,933 | ANCHOR-OWNED – NOT PART OF THE COLLATERAL | ||||||||||||||||
| Major Tenants | |||||||||||||||||||
| BBB/BBB+/Baa2 | 57,469 | 10.0% | $0(4) | $0 | 0.0% | 12/31/2105 | |||||||||||||
| NR/NR/NR | 46,718 | 8.2% | $16.00 | $747,488 | 7.2% | NAP | NAP | ||||||||||||
| Barnes & Noble | NR/NR/NR | 24,868 | 4.3% | $20.51 | $510,000 | 4.9% | $286 | 7.2% | 6/30/2018 | ||||||||||
| H&M | NR/NR/NR | 21,303 | 3.7% | $19.63 | $418,236 | 4.0% | NAP | NAP | 1/31/2025 | ||||||||||
| World Gym | NR/NR/NR | 22,009 | 3.8% | $15.28 | $336,231 | 3.2% | NAP | NAP | 1/31/2024 | ||||||||||
| Palme D’or Cinema | NR/NR/NR | 32,457 | 5.7% | $10.35 | $336,000 | 3.2% | $299,900(5) | 11.2% | 6/30/2016 | ||||||||||
| Total Major Tenants – Collateral | 226,694 | 39.6% | $11.75 | $2,663,936 | 25.5% | ||||||||||||||
| Non-Major Tenants – Collateral | 320,548 | 56.0% | $24.30 | $7,789,306 | 74.5% | ||||||||||||||
| Occupied Collateral Total | 547,242 | 95.6% | $19.10 | $10,453,242 | 100.0% | ||||||||||||||
| Vacant Space | 25,482 | 4.4% | |||||||||||||||||
| Collateral Total | 572,724 | 100.0% | |||||||||||||||||
| (1) | Certain ratings are those of the parent company whether or not the parent guarantees the lease. |
| (2) | Unless otherwise noted, Annual U/W Base Rent PSF and Annual U/W Base Rent include contractual rent escalations through February 1, 2016. |
| (3) | Sales PSF and Occupancy Cost are for the trailing 12-month period ending November 30, 2014. Occupancy Cost include recoveries. |
| (4) | In 2006, Westfield purchased two anchor spaces previously owned by Macy’s and leased back to Macy’s a 57,469 square foot portion of the anchor space now occupied by Macy’s Swim and Junior at a rental rate of $1.00 per year, which was prepaid for the entire term. Macy’s Swim and Junior does not pay percentage rent. |
| (5) | Palme D’or Cinema has 10 screens; the Sales PSF represent sales per screen. |
| Tenant Name | 2012 | 2013 | 2014 |
| NAV | NAV | NAV | |
| NAV | NAV | NAV | |
Palme D’or Cinema(3) | $303,100 | $300,400 | $299,900 |
| NAV | NAV | NAV | |
| NAV | NAV | NAV | |
| NAV | NAV | NAV | |
| Total In-line (<10,000 square feet) | |||
| Occupancy Costs |
| (1) | Historical Sales PSF are based on historical statements provided by the borrower. Macy’s Swim and Junior and Macy’s Home Store do not report sales. | |
| (2) | Dick’s Sporting Goods opened for business in November 2013. World Gym and H&M opened for business in 2014. | |
| (3) | Palme D’or Cinema has 10 screens; the Historical Sales shown represent sales per screen. |
| WESTFIELD PALM DESERT |
Year Ending December 31, | No. of Leases Expiring | Expiring NRSF | % of Total NRSF | Cumulative Expiring NRSF | Cumulative % of Total NRSF | Total U/W Base Rent(3) | Annual U/W Base Rent PSF(3) | ||||||||||
| MTM | 3 | 10,331 | 1.8% | 10,331 | 1.8% | $107,272 | $10.38 | ||||||||||
| 29 | 44,363 | 54,694 | 9.5% | $19.77 | |||||||||||||
| 27 | 147,769 | 25.8% | $18.30 | ||||||||||||||
| 15 | 169,648 | 29.6% | $34.23 | ||||||||||||||
| 11 | 38,359 | 208,007 | 36.3% | $26.08 | |||||||||||||
| 10 | 22,231 | 230,238 | 40.2% | $31.23 | |||||||||||||
| 12 | 50,433 | 280,671 | 49.0% | $26.14 | |||||||||||||
| 8 | 297,616 | 52.0% | $29.30 | ||||||||||||||
| 2 | 305,775 | 53.4% | $35.72 | ||||||||||||||
| 317,169 | 55.4% | $41.22 | |||||||||||||||
| 411,421 | 71.8% | $15.99 | |||||||||||||||
| 6 | 44,687 | 456,108 | 79.6% | $19.51 | |||||||||||||
| Thereafter | 8 | 91,134 | 15.9% | 547,242 | 95.6% | $367,445 | $4.03 | ||||||||||
| Vacant | 0 | 25,482 | 572,724 | 100.0% | $0 | $0.00 | |||||||||||
| Total/Weighted Average | 143 | 572,724 | 100.0% | $10,453,242 | $19.10 | ||||||||||||
| (1) | Information obtained from the underwritten rent roll. |
| (2) | Certain tenants may have lease termination options that are exercisable prior to the originally stated expiration date of the subject lease and that are not considered in the Lease Expiration Schedule. |
| (3) | Total underwritten base rent and annual underwritten base rent PSF are based on the underwritten occupied base rent and underwritten occupied square feet, and exclude any gross up of vacant space. |
| (1) | Information obtained from the borrower. |
| (2) | Occupancy as shown excludes temporary tenants. |
| (3) | Information obtained from the underwritten rent roll. |
| U/W | % of U/W Effective Gross Income | U/W $ per SF | ||||||||||||||||
| Base Rent | (1) | 47.4 | % | |||||||||||||||
| Grossed Up Vacant Space | 801,417 | 3.6 | 1.40 | |||||||||||||||
| Percentage Rent | 296,013 | 242,619 | 285,932 | 290,199 | 1.3 | 0.51 | ||||||||||||
| Total Reimbursables | 10,583,465 | 48.0 | 18.48 | |||||||||||||||
Other Income(2) | 1,445,972 | 1,610,574 | 1,534,330 | 1,534,330 | 7.0 | |||||||||||||
| Less Vacancy & Credit Loss | ) | ) | (1,622,922 | )(3) | (7.4 | ) | ||||||||||||
| Effective Gross Income | $22,039,731 | 100.0 | % | |||||||||||||||
| Total Operating Expenses | $8,506,070 | 38.6 | % | $14.85 | ||||||||||||||
| Net Operating Income | $13,533,661 | 61.4 | % | |||||||||||||||
| TI/LC | 484,217 | 2.2 | ||||||||||||||||
| Capital Expenditures | 310,923 | 1.4 | ||||||||||||||||
| Net Cash Flow | $12,738,521 | 57.8 | % | $22.24 | ||||||||||||||
NOI DSCR(4) | x | x | x | x | ||||||||||||||
NCF DSCR(4) | x | x | x | x | ||||||||||||||
NOI DY(4) | % | % | % | % | ||||||||||||||
NCF DY(4) | % | % | % | % | ||||||||||||||
| (1) | U/W Base Rent includes contractual rent escalations through February 1, 2016. |
| (2) | Other Income includes rental income from temporary tenants. |
| (3) | The underwritten economic vacancy is 7.3%. The Westfield Palm Desert Mortgaged Property was 95.6% occupied as of February 2, 2015. |
| (4) | DSCRs and debt yields are based on the Westfield Palm Desert Mortgage Loan Combination. |
| WESTFIELD PALM DESERT |
Westfield Palm Desert (Subject) | Gardens on El Paseo | Desert Hills Premium Outlets | Moreno Valley Mall | |
| Location | Palm Desert, CA | Palm Desert, CA | Cabazon, CA | Moreno Valley, CA |
| Distance from Subject | -- | 1.0 miles | 33.0 miles | 62.0 miles |
| Property Type | Super Regional Mall | Lifestyle Center | Outlet Mall | Super Regional Mall |
| Year Built/Renovated | 1983/2014 | 1998/NAP | 1990/2002 | 1992/2006 |
| Anchors | Macy’s, Sears, JC Penney | Saks Fifth Avenue | Saks Off Fifth, Neiman Marcus Last Call | Macy’s, JC Penney, Sears |
| Total GLA | 977,888 SF(2) | 251,173 SF | 652,317 SF | 1,095,186 SF |
| Total Occupancy | 96% | 99% | 100% | 83% |
| (1) | Information obtained from the appraisal as of November 13, 2014. |
| (2) | Total GLA and Total Occupancy are inclusive of non-collateral anchors. |
| WESTFIELD PALM DESERT |
| WP CAREY SELF STORAGE PORTFOLIO VI |
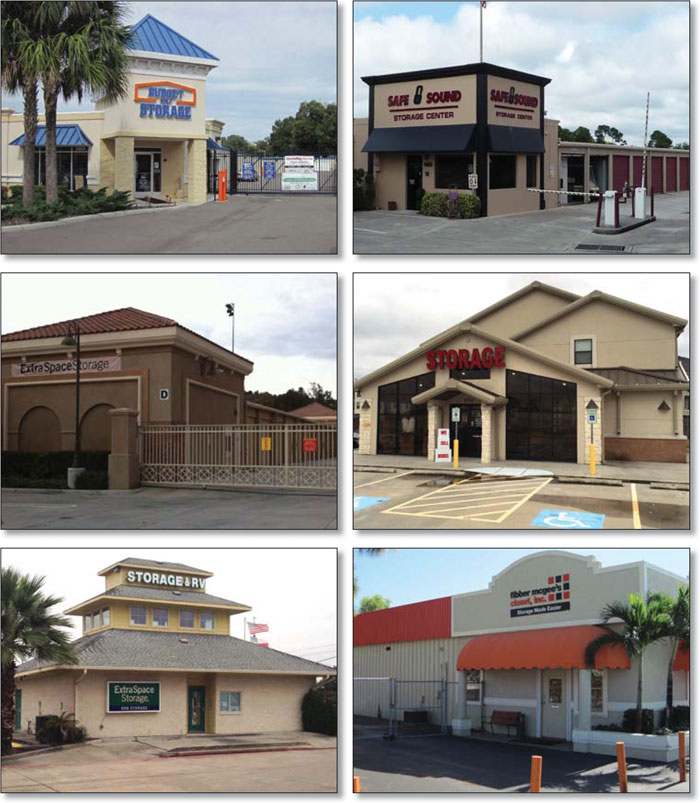
| WP CAREY SELF STORAGE PORTFOLIO VI |

| No. 2 – WP Carey Self Storage Portfolio VI | ||||||
| Loan Information | Property Information | |||||
| Mortgage Loan Seller: | Wells Fargo Bank, National Association | Single Asset/Portfolio: | Portfolio | |||
| Credit Assessment (DBRS/KBRA/Moody’s): | NR/NR/NR | Property Type: | Self Storage | |||
| Original Principal Balance: | $48,139,000 | Specific Property Type: | Self Storage | |||
| Cut-off Date Principal Balance: | $48,139,000 | Location: | Various – See Table | |||
| % of Initial Pool Balance: | 4.6% | Size: | 750,194 SF | |||
| Loan Purpose: | Acquisition | Cut-off Date Principal Balance Per SF: | $64.17 | |||
Borrower Names(1): | Various | Year Built/Renovated: | Various – See Table | |||
| Sponsor: | Corporate Property Associates 18 – Global Incorporated | Title Vesting: | Fee | |||
| Mortgage Rate: | 4.250% | Property Manager(3): | Various | |||
| Note Date: | February 18, 2015 | 3rd Most Recent Occupancy (As of): | 75.8% (12/31/2012) | |||
| Anticipated Repayment Date: | NAP | 2nd Most Recent Occupancy (As of): | 79.3% (12/31/2013) | |||
| Maturity Date: | March 11, 2025 | Most Recent Occupancy (As of): | 84.6% (12/31/2014) | |||
| IO Period: | 60 months | Current Occupancy (As of)(4): | 85.8% (Various) | |||
| Loan Term (Original): | 120 months | |||||
| Seasoning: | 0 months | Underwriting and Financial Information: | ||||
| Amortization Term (Original): | 360 months | |||||
| Loan Amortization Type: | Interest-only, Amortizing balloon | 3rd Most Recent NOI (As of): | $3,461,440 (12/31/2012) | |||
| Interest Accrual Method: | Actual/360 | 2nd Most Recent NOI (As of): | $3,597,762 (12/31/2013) | |||
| Call Protection: | L(24),D(92),O(4) | Most Recent NOI (As of)(5): | $4,262,544 (Various) | |||
| Lockbox Type: | Springing (Without Established Account) | |||||
| Additional Debt: | None | U/W Revenues: | $7,431,565 | |||
| Additional Debt Type: | NAP | U/W Expenses: | $3,227,301 | |||
| U/W NOI: | $4,204,265 | |||||
| U/W NCF: | $4,091,735 | |||||
| U/W NOI DSCR: | 1.48x | |||||
| U/W NCF DSCR: | 1.44x | |||||
Escrows and Reserves(2): | U/W NOI Debt Yield: | 8.7% | ||||
| U/W NCF Debt Yield: | 8.5% | |||||
| Type: | Initial | Monthly | Cap (If Any) | As-Is Appraised Value: | $74,750,000 | |
| Taxes | $0 | Springing | NAP | As-Is Appraisal Valuation Date(6): | Various | |
| Insurance | $0 | Springing | NAP | Cut-off Date LTV Ratio: | 64.4% | |
| Replacement Reserves | $0 | Springing | NAP | LTV Ratio at Maturity or ARD: | 58.7% | |
| (1) | See “The Borrowers” section. |
| (2) | See “Escrows” section. |
| (3) | See “Property Management” section. |
| (4) | See “Historical Occupancy” section. |
| (5) | See “Cash Flow Analysis” section. |
| (6) | See “Appraisal” section. |
| WP CAREY SELF STORAGE PORTFOLIO VI |
| Sources | Uses | |||||||
| Original loan amount | $48,139,000 | 64.4% | Purchase price | $74,060,000 | 99.1% | |||
| Sponsor’s new cash contribution | 26,572,773 | 35.6% | Closing costs | 651,773 | 0.9 | |||
| Total Sources | $74,711,773 | 100.0% | Total Uses | $74,711,773 | 100.0% |
| Property Name – Location | Allocated Cut- off Date Principal Balance | % of Portfolio Cut-off Date Principal Balance | Occupancy | Year Built/ Renovated | Net Rentable Area (SF) | Appraised Value | Allocated Cut-off Date LTV | ||||||||
| Fibber McGee’s Closet – Naples, FL | $10,725,000 | 22.3% | 86.9% | 1974/2014 | 184,951 | $17,100,000 | 62.7% | ||||||||
| Rancho Pueblo Self Storage – Temecula, CA | $6,500,000 | 13.5% | 87.0% | 2006/NAP | 91,243 | $10,000,000 | 65.0% | ||||||||
| Extra Space Storage & Bay Colony RV Park – Dickinson, TX | $6,435,000 | 13.4% | 90.4% | 2001/NAP | 77,050 | $8,500,000 | 75.7% | ||||||||
| Valrico Self Storage – Valrico, FL | $6,012,500 | 12.5% | 92.1% | 2009/NAP | 68,634 | $9,250,000 | 65.0% | ||||||||
| Safe and Sound Storage – Jensen Beach, FL | $5,590,000 | 11.6% | 95.2% | 1989/NAP | 63,682 | $8,600,000 | 65.0% | ||||||||
| Big Tex Self Storage – Humble, TX | $5,037,500 | 10.5% | 87.5% | 2009/2013 | 59,829 | $7,800,000 | 64.6% | ||||||||
| Central Storage – Pompano Beach, FL | $3,029,000 | 6.3% | 62.5% | 1981/NAP | 74,969 | $6,100,000 | 49.7% | ||||||||
| Storage Xxtra – Cumming, GA | $2,860,000 | 5.9% | 81.4% | 1994/2003 | 74,849 | $4,400,000 | 65.0% | ||||||||
| US 1 Self Storage – Sebastian, FL | $1,950,000 | 4.1% | 90.6% | 1991/1996 | 54,987 | $3,000,000 | 65.0% | ||||||||
| Total/Weighted Average | $48,139,000 | 100.0% | 85.8% | 750,194 | $74,750,000 | 64.4% |
12/31/2012(1) | 12/31/2013(1) | 12/31/2014(1) | Various(2) | |||
| 75.8% | 79.3% | 84.6% | 85.8% |
| (1) | Information obtained from the borrower. |
| (2) | Information obtained from the underwritten rent roll. Occupancy shown is as of dates ranging from November 30, 2014, to January 8, 2015. |
| WP CAREY SELF STORAGE PORTFOLIO VI |
2012 | 2013 | Various(1) | U/W | % of U/W Effective Gross Income | U/W $ per SF | ||||||||
| Base Rent | $5,483,132 | $5,932,770 | $6,531,720 | $6,906,676 | 92.9% | $9.21 | |||||||
| Grossed Up Vacant Space | 0 | 0 | 0 | 1,198,498 | 16.1 | 1.60 | |||||||
| Less Concessions | 0 | 0 | 0 | 0 | 0.0 | 0.00 | |||||||
| Other Income | 656,409 | 702,708 | 776,290 | 899,845 | 12.1 | 1.20 | |||||||
| Less Vacancy & Credit Loss | 0 | 0 | 0 | (1,573,453)(2) | (21.2) | (2.10) | |||||||
| Effective Gross Income | $6,139,541 | $6,635,477 | $7,308,010 | $7,431,565 | 100.0% | $9.91 | |||||||
| Total Operating Expenses | 2,678,101 | 3,037,715 | 3,045,466 | 3,227,301 | 43.4 | 4.30 | |||||||
| Net Operating Income | $3,461,440 | $3,597,762 | $4,262,544 | $4,204,265 | 56.6% | $5.60 | |||||||
| Capital Expenditures | 0 | 0 | 0 | 112,529 | 1.5 | 0.15 | |||||||
| Net Cash Flow | $3,461,440 | $3,597,762 | $4,262,544 | $4,091,735 | 55.1% | $5.45 | |||||||
| NOI DSCR | 1.22x | 1.27x | 1.50x | 1.48x | |||||||||
| NCF DSCR | 1.22x | 1.27x | 1.50x | 1.44x | |||||||||
| NOI DY | 7.2% | 7.5% | 8.9% | 8.7% | |||||||||
| NCF DY | 7.2% | 7.5% | 8.9% | 8.5% |
| (1) | The most recent financials represent the trailing 12-month period ending September 30, 2014 for two of the WP Carey Self Storage Portfolio VI Properties, November 30, 2014 for five of the WP Carey Self Storage Portfolio VI Properties and December 31, 2014 for two of the WP Carey Self Storage Portfolio VI Properties. |
| (2) | The underwritten economic vacancy is 19.4%. As of dates ranging from November 30, 2014 to January 8, 2015, the WP Carey Self Storage Portfolio VI Properties were 85.8% physically occupied. |
| WP CAREY SELF STORAGE PORTFOLIO VI |
| 312 ELM |
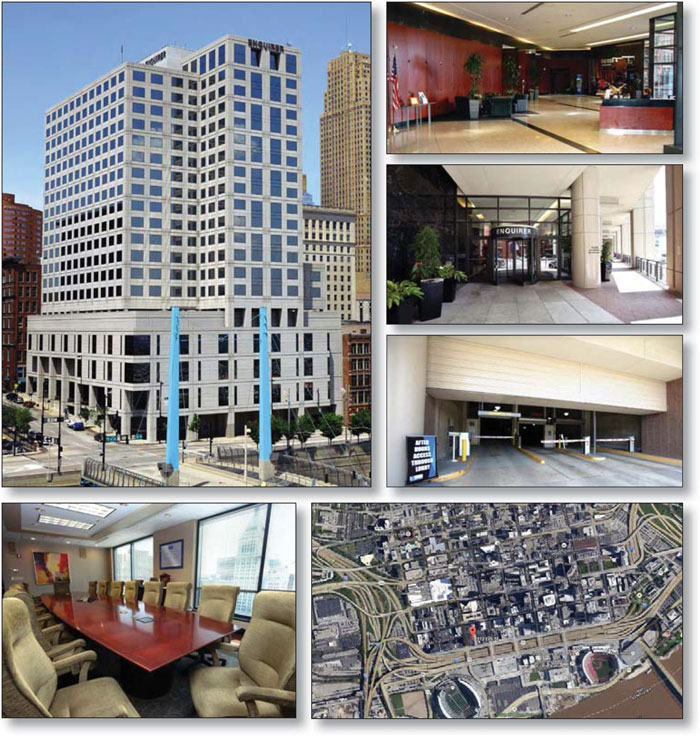
| 312 ELM |
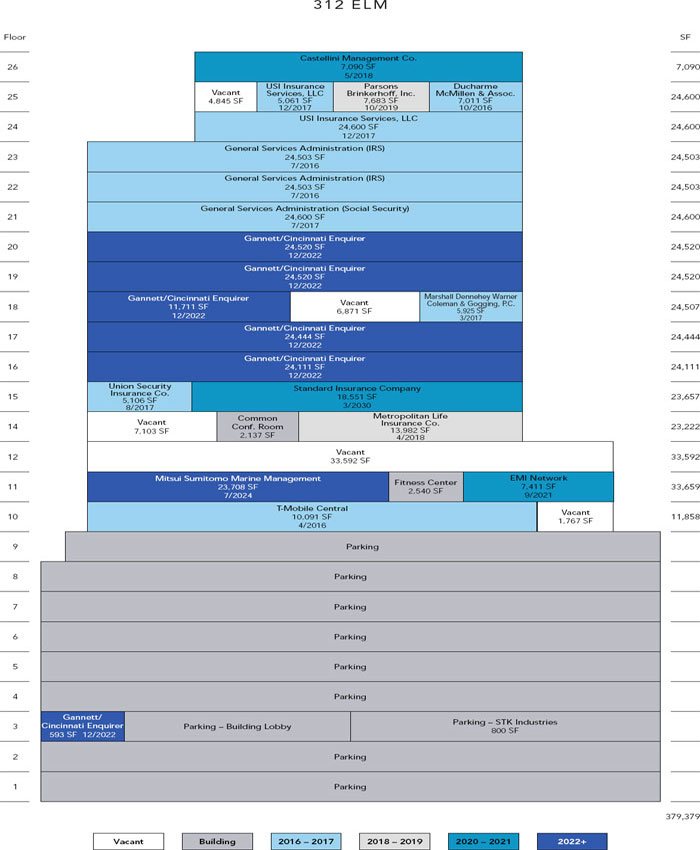
| 312 ELM |

| No. 3 – 312 Elm | ||||||||
| Loan Information | Property Information | |||||||
| Mortgage Loan Seller: | Principal Commercial Capital | Single Asset/Portfolio: | Single Asset | |||||
Credit Assessment: (DBRS/KBRA/Moody’s) | NR/NR/NR | Property Type: | Office | |||||
| Original Principal Balance: | $46,121,000 | Specific Property Type: | CBD | |||||
| Cut-off Date Principal Balance: | $46,121,000 | Location: | Cincinnati, OH | |||||
| % of Initial Pool Balance: | 4.4% | Size: | 379,379 SF | |||||
| Loan Purpose: | Acquisition | Cut-off Date Principal Balance Per SF: | $121.57 | |||||
| Borrower Name: | 312 Elm Street Owner, LLC | Year Built/Renovated: | 1992/NAP | |||||
| Sponsor: | Rubenstein Properties Fund II, L.P. | Title Vesting: | Fee | |||||
| Mortgage Rate: | 4.280% | Property Manager: | Self-managed | |||||
| Note Date: | February 11, 2015 | 3rd Most Recent Occupancy (As of): | 86.3% (12/31/2012) | |||||
| Anticipated Repayment Date: | NAP | 2nd Most Recent Occupancy (As of): | 85.7% (12/31/2013) | |||||
| Maturity Date: | March 1, 2025 | Most Recent Occupancy (As of): | 86.0% (12/31/2014) | |||||
| IO Period: | 36 months | Current Occupancy (As of): | 85.2% (2/11/2015) | |||||
| Loan Term (Original): | 120 months | |||||||
| Seasoning: | 0 months | Underwriting and Financial Information: | ||||||
| Amortization Term (Original): | 360 months | |||||||
| Loan Amortization Type: | Interest-only, Amortizing Balloon | 3rd Most Recent NOI (As of): | $4,770,161 (12/31/2012) | |||||
| Interest Accrual Method: | Actual/360 | 2nd Most Recent NOI (As of): | $5,010,897 (12/31/2013) | |||||
| Call Protection: | L(24),D(92),O(4) | Most Recent NOI (As of): | $5,383,935 (12/31/2014) | |||||
| Lockbox Type: | Hard/Springing Cash Management | |||||||
| Additional Debt: | None | |||||||
| Additional Debt Type: | NAP | U/W Revenues: | $9,391,092 | |||||
| U/W Expenses: | $3,878,210 | |||||||
| U/W NOI: | $5,512,882 | |||||||
| U/W NCF: | $4,905,875 | |||||||
Escrows and Reserves(1): | U/W NOI DSCR: | 2.02x | ||||||
| U/W NCF DSCR: | 1.80x | |||||||
Type: | Initial | Monthly | Cap (If Any) | U/W NOI Debt Yield: | 12.0% | |||
| Taxes | $421,472 | $140,491 | NAP | U/W NCF Debt Yield: | 10.6% | |||
| Insurance | $0 | Springing | NAP | As-Is Appraised Value: | $67,000,000 | |||
| Replacement Reserves | $0 | $12,646 | NAP | As-Is Appraisal Valuation Date: | January 20, 2015 | |||
| TI/LC Reserve | $0 | $31,615 | $758,760 | Cut-off Date LTV Ratio: | 68.8% | |||
| Gannett Tenant Refurbishment Allowance | $758,721 | $0 | NAP | LTV Ratio at Maturity or ARD: | 60.0% | |||
| (1) | See “Escrows” section. |
| Sources | Uses | ||||||||
| Original loan amount | $46,121,000 | 70.6% | Purchase price(1) | $63,093,728 | 96.6 | % | |||
| Sponsor’s new cash contribution | $19,166,566 | 29.4 | Reserves | 1,180,193 | 1.8 | ||||
| Closing costs | 1,013,645 | 1.6 | |||||||
| Total Sources | $65,287,566 | 100.0% | Total Uses | $65,287,566 | 100.0 | % |
| (1) | The 312 Elm Property was securitized in WFRBS 2011-C3. |
| 312 ELM |
| Tenant Name | Credit Rating (Fitch/Moody’s/ S&P)(1) | Tenant NRSF | % of NRSF | Annual U/W Base Rent PSF(2) | Annual U/W Base Rent(2) | % of Total Annual U/W Base Rent | Lease Expiration Date | ||||||||
| Major Tenants | |||||||||||||||
| Gannett - Cincinnati Enquirer | NR/Ba1/BB+ | 109,899 | 29.0% | $16.66 | $1,830,876 | 34.1% | 12/31/2022 | ||||||||
GSA - IRS | AAA/Aaa/AA+ | 49,006 | 12.9% | $26.79 | $1,312,962 | 24.5% | 7/31/2016(3) | ||||||||
GSA - Social Security | AAA/Aaa/AA+ | 24,600 | 6.5% | $24.03 | $591,138 | 11.0% | 7/29/2017(4) | ||||||||
| USI Midwest | NR/NR/NR | 29,661 | 7.8% | $12.12 | $359,491 | 6.7% | 12/31/2017 | ||||||||
| Mitsui Sumitomo Marine | A+/A1/A+ | 23,708 | 6.2% | $11.22 | $266,004 | 5.0% | 7/31/2024(5) | ||||||||
| Total Major Tenants | 236,874 | 62.4% | $18.41 | $4,360,471 | 81.3% | ||||||||||
| Non-Major Tenants | 86,190 | 22.7% | $11.63 | $1,001,982 | 18.7% | ||||||||||
| Occupied Collateral Total | 323,064 | 85.2% | $16.60 | $5,362,453 | 100.0% | ||||||||||
| Vacant Space | 56,315 | 14.8% | |||||||||||||
| Collateral Total | 379,379 | 100.0% | |||||||||||||
| (1) | Certain ratings are those of the parent company (or in the case of the GSA – IRS and GSA – Social Security, the United States Government) whether or not the parent guarantees the lease. |
| (2) | Annual U/W Base Rent PSF and Annual U/W Base Rent include contractual rent steps through September 2015. |
| (3) | The GSA – IRS tenant may terminate its lease at any time during the lease term with 180 days’ notice. |
| (4) | The GSA – Social Security tenant may terminate its lease at any time after July 29, 2016 with 120 days’ notice. |
| (5) | Mitsui Sumitomo Marine may terminate its lease after August 1, 2018 with 12 months’ notice with a termination payment of unamortized tenant improvements, leasing commissions and value of rent abatement, amortized at 8.0%. |
| 312 ELM |
Year Ending December 31, | No. of Leases Expiring | Expiring NRSF | % of Total NRSF | Cumulative Expiring NRSF | Cumulative % of Total NRSF | Annual U/W Base Rent | Annual U/W Base Rent PSF(3) | ||||||||
| MTM | 0 | 0 | 0.0% | 0 | 0.0% | $0 | $0.00 | ||||||||
| 2015 | 0 | 0 | 0.0% | 0 | 0% | $0 | $0.00 | ||||||||
| 2016 | 3 | 66,108 | 17.4% | 66,108 | 17.4% | $1,495,560 | $22.62 | ||||||||
| 2017 | 4 | 65,292 | 17.2% | 131,400 | 34.6% | $1,087,158 | $16.65 | ||||||||
| 2018 | 2 | 21,072 | 5.6% | 152,472 | 40.2% | $251,190 | $11.92 | ||||||||
| 2019 | 2 | 8,483 | 2.2% | 160,955 | 42.4% | $107,701 | $12.70 | ||||||||
| 2020 | 1 | 18,551 | 4.9% | 179,506 | 47.3% | $203,794 | $10.99 | ||||||||
| 2021 | 1 | 7,411 | 2.0% | 186,917 | 49.3% | $120,169 | $16.21 | ||||||||
| 2022 | 1 | 109,899 | 29.0% | 296,816 | 78.2% | $1,830,876 | $16.66 | ||||||||
| 2023 | 0 | 0 | 0.0% | 296,816 | 78.2% | $0 | $0.00 | ||||||||
| 2024 | 1 | 23,708 | 6.2% | 320,524 | 84.5% | $266,005 | $11.22 | ||||||||
| 2025 | 1 | 2,540 | 0.7% | 323,064 | 85.2% | $0 | $0.00 | ||||||||
| Thereafter | 0 | 0 | 0.0% | 323,064 | 85.2% | $0 | $0.00 | ||||||||
| Vacant | 0 | 56,315 | 14.8% | 379,379 | 100.0% | $0 | $0.00 | ||||||||
| Total/Weighted Average | 16 | 379,379 | 100.0% | $5,362,453 | $16.60 |
| (1) | Information obtained from the underwritten rent roll. |
| (2) | Certain tenants may have lease termination options that are exercisable prior to the originally stated expiration date of the subject lease and that are not considered in the Lease Expiration Schedule. |
| (3) | Weighted Average Annual U/W Base Rent PSF excludes vacant space. |
12/31/2012(1) | 12/31/2013(1) | 12/31/2014(1) | 2/11/2015(2) | |||
| 86.3% | 85.7% | 86.0% | 85.2% |
| (1) | Information obtained from the borrower. |
| (2) | Information obtained from the underwritten rent roll. |
| 312 ELM |
| 2012 | 2013 | 2014 | U/W | % of U/W Effective Gross Income | U/W $ per SF | |||||||||||
| Base Rent | $4,306,030 | $4,421,703 | $4,434,202 | $5,362,453(1) | 57.1 | % | $14.13 | |||||||||
| Grossed Up Vacant Space | 0 | 0 | 0 | 703,941 | 7.5 | 1.86 | ||||||||||
| Total Reimbursables | 3,017,874 | 2,985,638 | 3,014,295 | 2,884,805 | 30.7 | 7.60 | ||||||||||
| Parking Income | 1,514,479 | 1,701,392 | 1,759,836 | 1,753,647 | 18.7 | 4.62 | ||||||||||
Other Income(2) | 14,992 | 13,009 | 12,015 | 14,604 | 0.2 | 0.04 | ||||||||||
| Less Vacancy & Credit Loss | 0 | 0 | 0 | (1,328,358)(3) | (14.1) | (3.50) | ||||||||||
| Effective Gross Income | $8,853,375 | $9,121,742 | $9,220,348 | $9,391,092 | 100.0% | $24.75 | ||||||||||
| Total Operating Expenses | $4,083,214 | $4,110,845 | $3,836,413 | $3,878,210 | 41.3% | $10.22 | ||||||||||
| Net Operating Income | $4,770,161 | $5,010,897 | $5,383,935 | $5,512,882 | 58.7% | $14.53 | ||||||||||
| TI/LC | 0 | 0 | 0 | 455,255 | 4.8 | 1.20 | ||||||||||
| Capital Expenditures | 0 | 0 | 0 | 151,752 | 1.6 | 0.40 | ||||||||||
| Net Cash Flow | $4,770,161 | $5,010,897 | $5,383,935 | $4,905,875 | 52.2% | $12.93 | ||||||||||
| NOI DSCR | 1.75x | 1.83x | 1.97x | 2.02x | ||||||||||||
| NCF DSCR | 1.75x | 1.83x | 1.97x | 1.80x | ||||||||||||
| NOI DY | 10.3% | 10.9% | 11.7% | 12.0% | ||||||||||||
| NCF DY | 10.3% | 10.9% | 11.7% | 10.6% | ||||||||||||
| (1) | Historical presentation of rents from the GSA – IRS and GSA – Social Security tenants were divided between rents and reimbursables, resulting in lower base rents and higher reimbursables than shown in U/W Base Rent and Total Reimbursable (which are presented in conformance with the respective GSA leases and estoppels). U/W Base Rent includes contractual rent bumps through September 2015 of $65,613. |
| (2) | Other income consists of ancillary antennae income and ATM revenue. |
| (3) | The underwritten economic vacancy is 14.8% (excludes Parking Income and Other Income). The 312 Elm Property was 85.2% physically occupied as of February 11, 2015. |
| 312 ELM |
312 Elm (Subject) | Broadway at Queen City Square | Atrium Two | Chiquita Center | First Financial Center | Omnicare Center | Scripps Center | |
| Location | Cincinnati, OH | Cincinnati, OH | Cincinnati, OH | Cincinnati, OH | Cincinnati, OH | Cincinnati, OH | Cincinnati, OH |
| Distance from Subject | -- | 0.5 miles | 0.5 miles | 0.5 miles | 0.5 miles | 0.5 miles | 0.2 miles |
| Property Type | Office | Office | Office | Office | Office | Office | Office |
| Year Built/Renovated | 1992/NAP | 2006/NAP | 1984/2012 | 1984/NAP | 1991/NAP | 1981/NAP | 1990/NAP |
| Stories | 26 | 17 | 30 | 29 | 32 | 20 | 36 |
| Total GLA | 379,379 SF | 188,500 SF | 653,604 SF | 537,400 SF | 525,036 SF | 571,561 SF | 538,607 SF |
| Total Occupancy | 85% | 100% | 92% | 67% | 98% | 80% | 89% |
| (1) | Information obtained from the appraisal. |
| 312 ELM |
| MARRIOTT GREENSBORO |
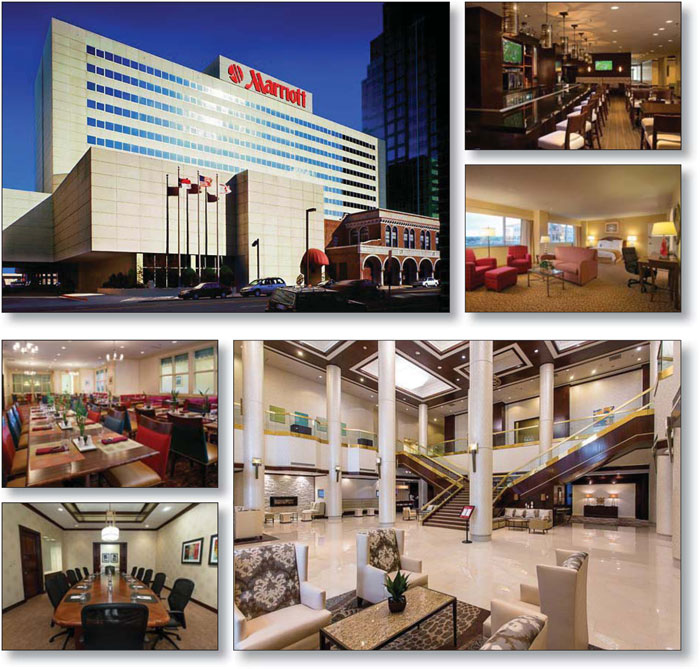
| MARRIOTT GREENSBORO |

| No. 4 – Marriott Greensboro | |||||||
| Loan Information | Property Information | ||||||
| Mortgage Loan Seller: | Rialto Mortgage Finance, LLC | Single Asset/Portfolio: | Single Asset | ||||
| Credit Assessment (DBRS/KBRA/Moody’s): | NR/NR/NR | Property Type: | Hospitality | ||||
| Original Principal Balance: | $44,000,000 | Specific Property Type: | Full Service | ||||
| Cut-off Date Principal Balance: | $43,833,356 | Location: | Greensboro, NC | ||||
| % of Initial Pool Balance: | 4.2% | Size: | |||||
| Loan Purpose: | Refinance | Cut-off Date Principal Balance Per Room: | |||||
| Borrower Name: | Columbia Properties Greensboro, Ltd. | Year Built/Renovated: | 1983/2013 | ||||
| Sponsor: | Columbia Sussex Corporation; CSC Holdings, LLC | Title Vesting: | Fee | ||||
| Mortgage Rate: | 4.750% | Property Manager: | Self-managed | ||||
| Note Date: | December 2, 2014 | 3rd Most Recent Occupancy (As of): | 63.3% (12/31/2011) | ||||
| Anticipated Repayment Date: | NAP | 2nd Most Recent Occupancy (As of): | 65.7% (12/31/2012) | ||||
| Maturity Date: | December 6, 2024 | Most Recent Occupancy (As of)(2): | |||||
| IO Period: | None | Current Occupancy (As of): | |||||
| Loan Term (Original): | 120 months | ||||||
| Seasoning: | 3 months | Underwriting and Financial Information: | |||||
| Amortization Term (Original): | |||||||
| Loan Amortization Type: | Amortizing Balloon | 3rd Most Recent NOI (As of): | |||||
| Interest Accrual Method: | Actual/360 | 2nd Most Recent NOI (As of)(2): | |||||
| Call Protection: | L(27),D(89),O(4) | Most Recent NOI (As of): | |||||
| Lockbox Type: | Hard/Springing Cash Management | ||||||
| Additional Debt: | None | U/W Revenues: | $11,723,328 | ||||
| Additional Debt Type: | NAP | U/W Expenses: | $6,686,952 | ||||
| U/W NOI: | $5,036,376 | ||||||
| U/W NCF: | $4,567,443 | ||||||
| U/W NOI DSCR: | 1.83x | ||||||
Escrows and Reserves(1): | U/W NCF DSCR: | ||||||
| U/W NOI Debt Yield: | 11.5% | ||||||
Type: | Initial | Monthly | Cap (If Any) | U/W NCF Debt Yield: | 10.4% | ||
| Taxes | $26,603 | $25,336 | NAP | As-Is Appraised Value: | $63,800,000 | ||
| Insurance | $32,728 | $7,792 | NAP | As-Is Appraisal Valuation Date: | October 16, 2014 | ||
| FF&E | $0 | $38,919 | NAP | Cut-off Date LTV Ratio: | 68.7% | ||
| Renovation Reserve | NAP | LTV Ratio at Maturity or ARD: | 56.2% | ||||
| (1) | See “Escrows” section. |
| (2) | Marriott Greensboro underwent significant lobby and common area renovations in 2013, resulting in slight disruption in 2013 performance. |
| Sources | Uses | ||||||||
| Original loan amount | $44,000,000 | 100.0% | Loan payoff(1) | $25,290,110 | 57.5 | % | |||
| 0.5 | |||||||||
| 0.1 | |||||||||
| 41.9 | |||||||||
| Total Sources | $44,000,000 | 100.0% | Total Uses | $44,000,000 | 100.0 | % |
| (1) | The Marriott Greensboro Property was previously securitized in GECMC 2005-C4. |
| MARRIOTT GREENSBORO |
| 2012 | 2013(1) | TTM 11/30/2014 | U/W | % of U/W Total Revenue | U/W $ per Room | |||||||
| Occupancy | ||||||||||||
| ADR | ||||||||||||
| RevPAR | $84.05 | |||||||||||
| Total Revenue | 100.0% | |||||||||||
| Total Department Expenses | 3,296,101 | 3,296,101 | 28.1 | 11,730 | ||||||||
| Gross Operating Profit | $8,427,227 | $8,427,227 | 71.9% | |||||||||
| Total Undistributed Expenses | 2,872,156 | 2,993,309 | 25.5 | |||||||||
| Profit Before Fixed Charges | $5,555,071 | $5,433,918 | 46.4% | |||||||||
| Total Fixed Charges | 441,981 | 3.4 | ||||||||||
| Net Operating Income | $4,480,509 | $4,078,552 | $5,113,090 | $5,036,376 | 43.0% | $17,923 | ||||||
| FF&E | 444,239 | 420,085 | 467,029 | 4.0 | 1,669 | |||||||
| Net Cash Flow | $4,036,270 | $3,658,467 | $4,646,061 | 39.0% | ||||||||
| NOI DSCR | 1.63x | 1.48x | 1.86x | 1.83x | ||||||||
| NCF DSCR | 1.47x | 1.33x | 1.69x | 1.66x | ||||||||
| NOI DY | 10.2% | 9.3% | 11.7% | 11.4% | ||||||||
| NCF DY | 9.2% | 8.3% | 10.6% | 10.4% | ||||||||
| (1) | Marriott Greensboro underwent significant lobby and common area renovations in 2013, resulting in slight disruption in 2013 performance. |
| MARRIOTT GREENSBORO |
Competitive Set | Marriott Greensboro | Penetration Factor | ||||||||||||||||
Year | Occupancy | ADR | RevPAR | Occupancy | ADR | RevPAR | Occupancy | ADR | RevPAR | |||||||||
| 9/30/2014 TTM | 59.4% | $124.12 | $73.73 | 61.9% | $134.48 | $83.18 | 104.1% | 108.3% | 112.8% | |||||||||
| 9/30/2013 TTM | 57.1% | $120.93 | $69.10 | 61.3% | $126.58 | $77.54 | 107.2% | 104.7% | 112.2% | |||||||||
| 9/30/2012 TTM | 59.5% | $112.38 | $66.83 | 65.4% | $125.90 | $82.31 | 109.9% | 112.0% | 123.2% | |||||||||
| (1) | Information obtained from a third party hospitality research report dated October 17, 2014. The competitive set includes: Marriott Greensboro High Point Airport, Clarion Hotel Greensboro Airport, Embassy Suites Greensboro Airport and O Henry Hotel. |
| MARRIOTT GREENSBORO |
| CAPITAL PENN SELF STORAGE PORTFOLIO |
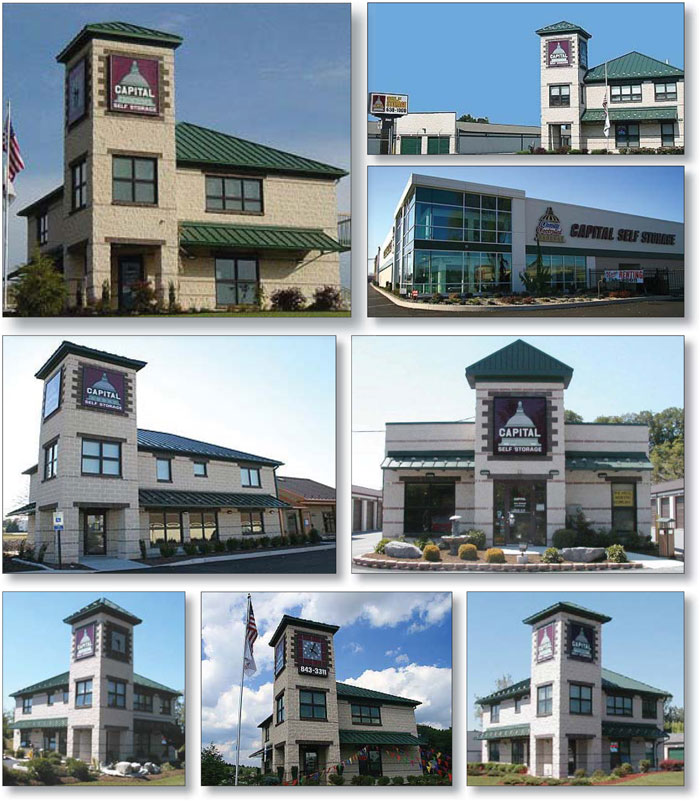
| CAPITAL PENN SELF STORAGE PORTFOLIO |
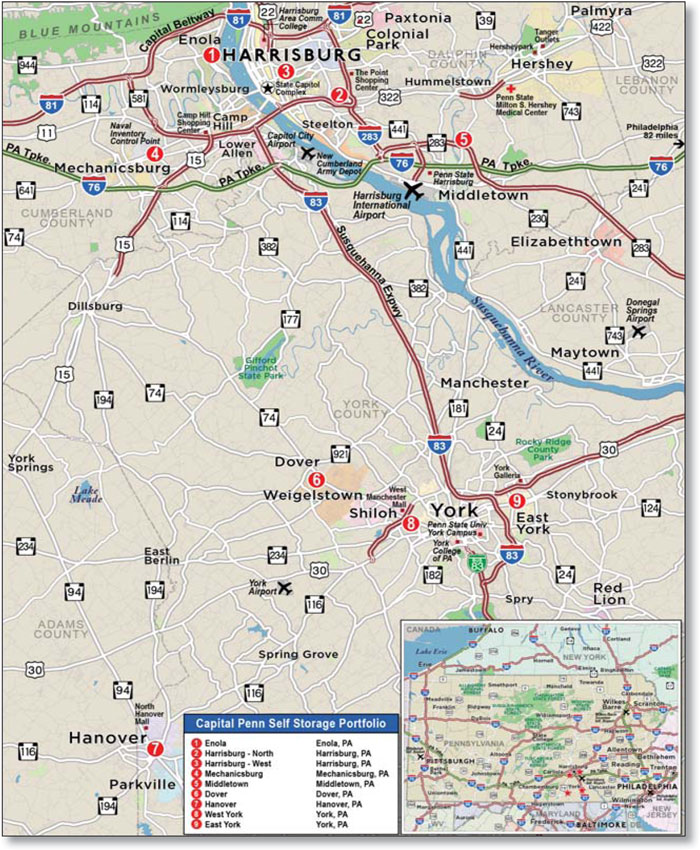
| No. 5 – Capital Penn Self Storage Portfolio | ||||||||
| Loan Information | Property Information | |||||||
| Mortgage Loan Seller: | Rialto Mortgage Finance, LLC | Single Asset/Portfolio: | Portfolio | |||||
| Credit Assessment (DBRS/KBRA/Moody’s): | NR/NR/NR | Property Type: | Self Storage | |||||
| Original Principal Balance: | $37,665,000 | Specific Property Type: | Self Storage | |||||
| Cut-off Date Principal Balance: | $37,606,397 | Location: | Various – See Table | |||||
| % of Initial Pool Balance: | 3.6% | Size: | 592,854 SF | |||||
| Loan Purpose: | Acquistion | Cut-off Date Principal Balance Per SF: | $63.43 | |||||
Borrower Names(1): | Various | Year Built/Renovated: | Various – See Table | |||||
| Sponsors: | Robert Moser; Robert Morgan | Title Vesting: | Fee | |||||
| Mortgage Rate: | 4.560% | Property Manager: | Self-managed | |||||
| Note Date: | February 10, 2015 | 3rd Most Recent Occupancy (As of): | NAV | |||||
| Anticipated Repayment Date: | NAP | 2nd Most Recent Occupancy (As of): | 60.8% (12/31/2012) | |||||
| Maturity Date: | February 6, 2022 | Most Recent Occupancy (As of): | 63.6% (12/31/2013) | |||||
| IO Period: | None | Current Occupancy (As of)(4): | 67.9% (Various) | |||||
| Loan Term (Original): | 84 months | |||||||
| Seasoning: | 1 month | Underwriting and Financial Information: | ||||||
| Amortization Term (Original): | 360 months | |||||||
| Loan Amortization Type: | Amortizing Balloon | 3rd Most Recent NOI (As of): | $4,026,411 (12/31/2012) | |||||
| Interest Accrual Method: | Actual/360 | 2nd Most Recent NOI (As of): | $4,078,027 (12/31/2013) | |||||
| Call Protection: | L(25),D(55),O(4) | Most Recent NOI (As of): | $4,240,851 (12/31/2014) | |||||
| Lockbox Type: | Springing (Without Established Account) | |||||||
Additional Debt(2): | Yes | |||||||
Additional Debt Type(2): | Mezzanine | U/W Revenues: | $5,646,596 | |||||
| U/W Expenses: | ||||||||
| U/W NOI: | $4,055,746 | |||||||
| U/W NCF: | $3,966,876 | |||||||
Escrows and Reserves(3): | U/W NOI DSCR: | 1.76x | ||||||
| U/W NCF DSCR: | 1.72x | |||||||
Type: | Initial | Monthly | Cap (If Any) | U/W NOI Debt Yield: | 10.8% | |||
| Taxes | $356,590 | $42,451 | NAP | U/W NCF Debt Yield: | 10.5% | |||
| Insurance | $47,023 | $4,478 | NAP | As-Is Appraised Value: | $54,100,000 | |||
| Replacement Reserves | $0 | $7,406 | NAP | As-Is Appraisal Valuation Date(5): | Various | |||
| Deferred Maintenance | $80,275 | $0 | NAP | Cut-off Date LTV Ratio: | 69.5% | |||
| Free Rent Reserve | $5,400 | $0 | NAP | LTV Ratio at Maturity or ARD: | 61.0% | |||
| (1) | See “Borrowers” section. |
| (2) | See “Subordinate and Mezzanine Indebtedness” section. |
| (3) | See “Escrows” section. |
| (4) | See “Historical Occupancy” section. |
| (5) | See “Appraisals” section |
| CAPITAL PENN SELF STORAGE PORTFOLIO |
| Sources | Uses | |||||||||
| Original loan amount | $37,665,000 | 78.4 | % | Purchase price | $45,950,000 | 95.6 | % | |||
Mezzanine financing(1) | Reserves | 489,288 | 1.0 | |||||||
Sponsor’s new cash contribution | 6,208,674 | 12.9 | Closing costs | 1,619,386 | 3.4 | |||||
| Total Sources | $48,058,674 | 100.0 | % | Total Uses | $48,058,674 | 100.0 | % |
| (1) | The mezzanine loan is held by RMezz Capital SS, LLC. |
Property Name – Location | Allocated Cut- off Date Principal Balance | % of Portfolio Cut-off Date Principal Balance | Occupancy | Year Built/ Renovated | Net Rentable Area (SF) | Appraised Value | Allocated Cut-off Date LTV | ||||||
| Mechanicsburg – Mechanicsburg, PA | $6,989,109 | 18.6% | 80.2% | 1999/NAP | 78,150 | $9,670,000 | 72.3% | ||||||
| Enola – Enola, PA | $4,867,415 | 12.9% | 80.9% | 1997/NAP | 58,959 | $6,650,000 | 73.2% | ||||||
| East York – York, PA | $4,742,609 | 12.6% | 74.1% | 1942, 2008, 2012/NAP | 64,055 | $6,450,000 | 73.5% | ||||||
| Middletown – Middletown, PA | $4,358,209 | 11.6% | 62.4% | 2004/NAP | 73,125 | $6,040,000 | 72.2% | ||||||
| Harrisburg West – Harrisburg, PA | $4,168,504 | 11.1% | 78.7% | 2006/NAP | 58,265 | $5,700,000 | 73.1% | ||||||
| Harrisburg North – Harrisburg, PA | $3,993,776 | 10.6% | 72.4% | 1998-2002/NAP | 54,025 | $5,450,000 | 73.3% | ||||||
| Hanover – Hanover, PA | $3,244,943 | 8.6% | 76.5% | 2002/NAP | 59,100 | $4,550,000 | 71.3% | ||||||
| Dover – Dover, PA | $3,145,099 | 8.4% | 51.2% | 1986/NAP | 76,625 | $4,520,000 | 69.6% | ||||||
| West York - York, PA | $2,096,733 | 5.6% | 42.4% | 2009-2014/NAP | 70,550 | $5,070,000 | 41.4% | ||||||
| Total/Weighted Average | $37,606,397 | 100.0% | 67.9% | 592,854 | $54,100,000 | 69.5% | |||||||
12/31/2012(1) | 12/31/2013(1) | 12/19/2014(2) | ||
| 60.8% | 63.6% | 67.9% |
| (1) | Information obtained from the borrower. |
| (2) | Information obtained from the underwritten rent roll. The Harrisburg North, Harrisburg, PA property has an occupancy date of December 5, 2014. December 19, 2014 is the occupancy date for the remaining eight Capital Penn Self Storage Portfolio Properties. |
| CAPITAL PENN SELF STORAGE PORTFOLIO |
| 2012 | 2013 | 2014 | U/W | % of U/W Effective Gross Income | U/W $ per SF | ||||||||||||
| Base Rent | $4,818,375 | $4,909,674 | $5,048,796 | $5,048,796 | 89.4% | $8.52 | |||||||||||
| Grossed Up Vacant Space | 0 | 0 | 0 | 0.0 | |||||||||||||
Other Income(1) | 10.6 | 1.01 | |||||||||||||||
| Less Vacancy & Credit Loss | 0 | 0 | 0 | 0.0 | 0.00 | ||||||||||||
| Effective Gross Income | $5,339,626 | $5,449,368 | $5,646,596 | $5,646,596 | 100.0% | $9.52 | |||||||||||
| Total Operating Expenses | $1,313,215 | $1,371,341 | $1,405,745 | 28.2% | |||||||||||||
| Net Operating Income | $4,026,411 | $4,078,027 | $4,240,851 | 71.8% | $6.84 | ||||||||||||
| Capital Expenditures | 0 | 0 | 0 | 88,871 | 1.6 | 0.15 | |||||||||||
| Net Cash Flow | $4,026,411 | $4,078,027 | $4,240,851 | $3,966,876 | 70.3% | $6.69 | |||||||||||
| NOI DSCR | 1.75 | x | 1.77 | x | 1.84 | x | 1.76 | x | |||||||||
| NCF DSCR | 1.75 | x | 1.77 | x | 1.84 | x | 1.72 | x | |||||||||
| NOI DY | 10.7 | % | 10.8 | % | 11.3 | % | 10.8 | % | |||||||||
| NCF DY | 10.7 | % | 10.8 | % | 11.3 | % | 10.5 | % | |||||||||
| (1) | Other income includes administrative fees, points of sale, insurance premiums, late fees, auction proceeds, transfer fees and miscellaneous income. |
| CAPITAL PENN SELF STORAGE PORTFOLIO |
| ALBUQUERQUE PLAZA |
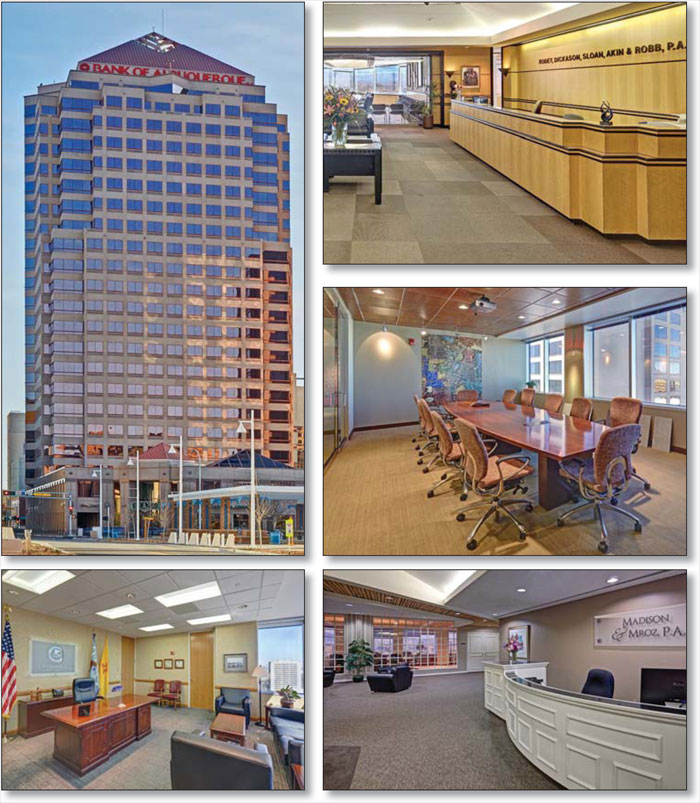
| ALBUQUERQUE PLAZA |
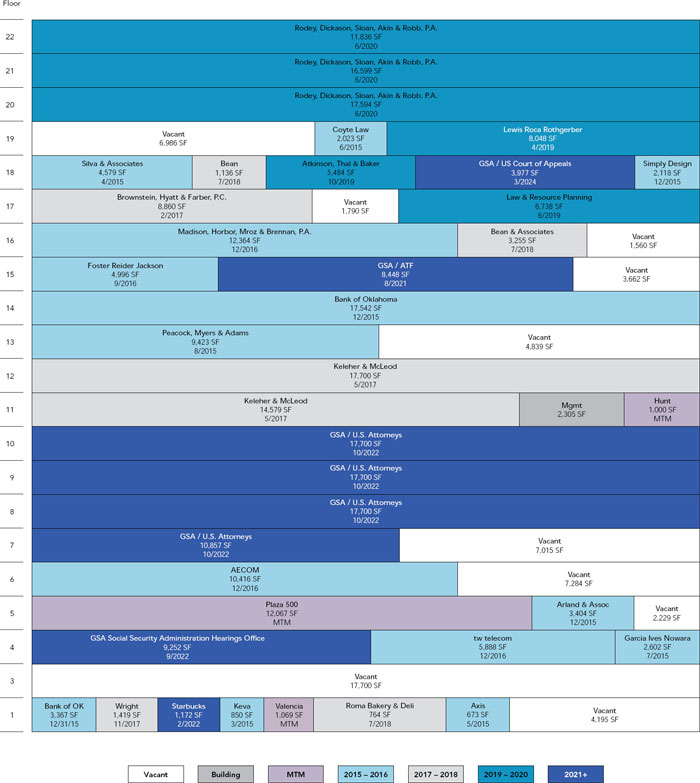
| ALBUQUERQUE PLAZA |
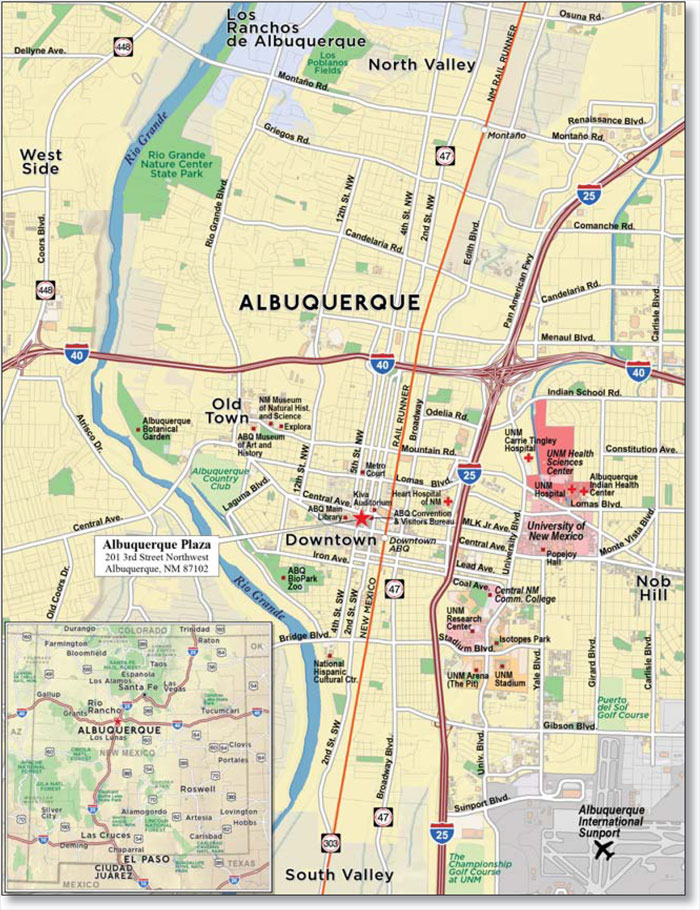
| No. 6 – Albuquerque Plaza |
| Loan Information | Property Information | ||||||
| Mortgage Loan Seller: | Wells Fargo Bank, National Association | Single Asset/Portfolio: | Single Asset | ||||
Credit Assessment (DBRS/KBRA/Moody's): | NR/NR/NR | Property Type: | Office | ||||
| Original Principal Balance: | $35,000,000 | Specific Property Type: | CBD | ||||
| Cut-off Date Principal Balance: | $34,925,241 | Location: | Albuquerque, NM | ||||
| % of Initial Pool Balance: | 3.3% | Size: | 358,196 SF | ||||
| Loan Purpose: | Refinance | Cut-off Date Principal Balance Per SF: | $97.50 | ||||
| Borrower Name: | Albuquerque Plaza Office Investment, LLC | Year Built/Renovated: | 1989/2011 | ||||
| Sponsors: | Christopher R. Smith; James M. Long | Title Vesting(2): | Various | ||||
| Mortgage Rate: | 4.140% | Property Manager: | Self-managed | ||||
| Note Date: | February 5, 2015 | 3rd Most Recent Occupancy (As of): | 83.3% (12/31/2011) | ||||
| Anticipated Repayment Date: | NAP | 2nd Most Recent Occupancy (As of): | 84.8% (12/31/2012) | ||||
| Maturity Date: | February 11, 2025 | Most Recent Occupancy (As of): | 87.1% (12/31/2013) | ||||
| IO Period: | None | Current Occupancy (As of): | 83.1% (1/1/2015) | ||||
| Loan Term (Original): | 120 months | ||||||
| Seasoning: | 1 month | Underwriting and Financial Information: | |||||
| Amortization Term (Original): | 300 months | ||||||
| Loan Amortization Type: | Amortizing Balloon | 3rd Most Recent NOI (As of): | $4,197,594 (12/31/2012) | ||||
| Interest Accrual Method: | Actual/360 | 2nd Most Recent NOI (As of): | $4,597,027 (12/31/2013) | ||||
| Call Protection: | L(25),D(91),O(4) | Most Recent NOI (As of): | $4,301,720 (TTM 11/30/2014) | ||||
| Lockbox Type: | Hard/Upfront Cash Management | ||||||
| Additional Debt: | None | ||||||
| Additional Debt Type: | NAP | ||||||
| U/W Revenues: | $8,103,523 | ||||||
| U/W Expenses: | $3,939,897 | ||||||
Escrows and Reserves(1): | U/W NOI: | $4,163,626 | |||||
| U/W NCF: | $3,701,434 | ||||||
Type: | Initial | Monthly | Cap (If Any) | U/W NOI DSCR: | 1.85x | ||
| Taxes | $189,240 | $47,310 | NAP | U/W NCF DSCR: | 1.65x | ||
| Insurance | $22,470 | $7,490 | NAP | U/W NOI Debt Yield: | 11.9% | ||
| Replacement Reserves | $0 | $7,462 | $268,647 | U/W NCF Debt Yield: | 10.6% | ||
| TI/LC Reserve | $66,000 | $36,715 | $1,321,743 | As-Is Appraised Value: | $57,000,000 | ||
| Tenant Specific TI/LC Reserve | $403,379 | $0 | NAP | As-Is Appraisal Valuation Date: | December 2, 2014 | ||
| Ground Rent Reserve | $9,042 | $0 | NAP | Cut-off Date LTV Ratio: | 61.3% | ||
| Business Improvement District Tax | $0 | Springing | NAP | LTV Ratio at Maturity or ARD: | 44.4% | ||
| (1) | See “Escrows” section. |
| (2) | See “Ground Leases” section. |
| ALBUQUERQUE PLAZA |
| Sources | Uses | |||||||
| Original loan amount | $35,000,000 | 100.0% | Loan payoff(1) | $27,214,830 | 77.8% | |||
| Reserves | 690,131 | 2.0 | ||||||
| Closing costs | 375,008 | 1.1 | ||||||
| Return of equity | 6,720,031 | 19.2 | ||||||
| Total Sources | $35,000,000 | 100.0% | Total Uses | $35,000,000 | 100.0% |
| (1) | The Albuquerque Plaza Property was previously securitized in GSMS 2005–GG4. |
| Tenant Name | Credit Rating (Fitch/Moody’s/S&P)(1) | Tenant NRSF | % of NRSF | Annual U/W Base Rent PSF(2) | Annual U/W Base Rent(2) | % of Total Annual U/W Base Rent | Lease Expiration Date | |||||||
| Major Tenants | ||||||||||||||
| GSA - US Attorney General | AAA/Aaa/AA+ | 63,957 | 17.9% | $25.00 | $1,598,925 | 22.9% | 10/31/2022(3) | |||||||
| Rodey, Dickason, Sloan, Akin & Robb, P.A. | NR/NR/NR | 46,029 | 12.9% | $23.50 | $1,081,682 | 15.5% | 6/30/2020 | |||||||
| Keleher & McLeod | NR/NR/NR | 32,279 | 9.0% | $24.50 | $790,835 | 11.3% | 5/31/2017 | |||||||
| Bank of Albuquerque | NR/NR/NR | 20,909 | 5.8% | $26.37 | $551,346 | 7.9% | 12/31/2015 | |||||||
| Madison & Mroz, P.A. | NR/NR/NR | 12,364 | 3.5% | $23.15 | $286,172 | 4.1% | 12/31/2016 | |||||||
| Total Major Tenants | 175,538 | 49.0% | $24.55 | $4,308,959 | 61.6% | |||||||||
| Non-Major Tenants | 121,966 | 34.1% | $21.99 | $2,681,813 | 38.4% | |||||||||
| Occupied Collateral Total | 297,504 | 83.1% | $23.50 | $6,990,772 | 100.0% | |||||||||
| Vacant Space | 60,692 | 16.9% | ||||||||||||
| Collateral Total | 358,196 | 100.0% | ||||||||||||
| (1) | Certain ratings are those of the parent company (or in the case of the GSA – US Attorney General, the United States Government) whether or not the parent company guarantees the lease. |
| (2) | Annual U/W Base Rent PSF and Annual U/W Base Rent include contractual rent steps through October 31, 2015. |
| (3) | GSA – US Attorney General has the right to terminate on or after October 31, 2017 with 60 days’ prior written notice. |
| ALBUQUERQUE PLAZA |
Year Ending December 31, | No. of Leases Expiring | Expiring NRSF | % of Total NRSF | Cumulative Expiring NRSF | Cumulative % of Total NRSF | Annual U/W Base Rent | Annual U/W Base Rent PSF(3) | ||||||||||||||
| MTM | 4 | 15,441 | 4.3% | 15,441 | 4.3% | $244,536 | $15.84 | ||||||||||||||
| 2015 | 11 | 47,581 | 13.3% | 63,022 | 17.6% | $1,141,752 | $24.00 | ||||||||||||||
| 2016 | 4 | 33,664 | 9.4% | 96,686 | 27.0% | $755,597 | $22.45 | ||||||||||||||
| 2017 | 7 | 42,558 | 11.9% | 139,244 | 38.9% | $1,025,825 | $24.10 | ||||||||||||||
| 2018 | 2 | 5,155 | 1.4% | 144,399 | 40.3% | $113,981 | $22.11 | ||||||||||||||
| 2019 | 3 | 20,270 | 5.7% | 164,669 | 46.0% | $487,790 | $24.06 | ||||||||||||||
| 2020 | 1 | 46,029 | 12.9% | 210,698 | 58.8% | $1,081,682 | $23.50 | ||||||||||||||
| 2021 | 1 | 8,448 | 2.4% | 219,146 | 61.2% | $211,200 | $25.00 | ||||||||||||||
| 2022 | 3 | 74,381 | 20.8% | 293,527 | 81.9% | $1,846,881 | $24.83 | ||||||||||||||
| 2023 | 0 | 0 | 0.0% | 293,527 | 81.9% | $0 | $0.00 | ||||||||||||||
| 2024 | 1 | 3,977 | 1.1% | 297,504 | 83.1% | $81,529 | $20.50 | ||||||||||||||
| 2025 | 0 | 0 | 0.0% | 297,504 | 83.1% | $0 | $0.00 | ||||||||||||||
| Thereafter | 0 | 0 | 0.0% | 297,504 | 83.1% | $0 | $0.00 | ||||||||||||||
| Vacant | 0 | 60,692 | 16.9% | 358,196 | 100.0% | $0 | $0.00 | ||||||||||||||
| Total/Weighted Average | 37(4) | 358,196 | 100.0% | $6,990,772 | $23.50 | ||||||||||||||||
| (1) | Information obtained from the underwritten rent roll. |
| (2) | Certain tenants may have lease termination options that are exercisable prior to the originally stated expiration date of the subject lease and that are not considered in the Lease Expiration Schedule. |
| (3) | Weighted Average Annual U/W Base Rent PSF excludes vacant space. |
| (4) | Keleher & McLeod and Bank of Albuquerque operate under more than one lease. There are 33 tenants subject to 37 leases. |
12/31/2011(1) | 12/31/2012(1) | 12/31/2013(1) | 1/1/2015(2) | |||
| 83.3% | 84.8% | 87.1% | 83.1% |
| (1) | Information obtained from the borrower. |
| (2) | Information obtained from the underwritten rent roll. |
| 2012 | 2013 | TTM 11/30/2014 | U/W | % of U/W Effective Gross Income | U/W $ per SF | |||||||||
| Base Rent | $6,606,560 | $7,084,930 | $7,004,546 | $6,990,772 | 86.3 | % | $19.52 | |||||||
| Grossed Up Vacant Space | 0 | 0 | 0 | 1,429,314 | 17.6 | 3.99 | ||||||||
| Percentage Rent | 2,130 | 2,695 | 2,427 | 0 | 0.0 | 0.00 | ||||||||
| Total Reimbursables | 608,220 | 810,526 | 717,377 | 666,751 | 8.2 | 1.86 | ||||||||
| Other Income | 87,467 | 30,198 | 35,608 | 35,608 | 0.4 | 0.10 | ||||||||
| Parking Income | 440,554 | 405,447 | 410,392 | 410,392 | 5.1 | 1.15 | ||||||||
| Less Vacancy & Free Rent | (93,061) | (23,355) | (113,685) | (1,429,314)(1) | (17.6 | ) | (3.99) | |||||||
| Effective Gross Income | $7,651,870 | $8,310,441 | $8,056,665 | $8,103,523 | 100.0 | % | $22.62 | |||||||
| Total Operating Expenses | $3,454,276 | $3,713,413 | $3,754,945 | $3,939,897 | 48.6 | % | $11.00 | |||||||
| Net Operating Income | $4,197,594 | $4,597,027 | $4,301,720 | $4,163,626 | 51.4 | % | $11.62 | |||||||
| TI/LC | 0 | 0 | 0 | 372,642 | 4.6 | 1.04 | ||||||||
| Capital Expenditures | 0 | 0 | 0 | 89,549 | 1.1 | 0.25 | ||||||||
| Net Cash Flow | $4,197,594 | $4,597,027 | $4,301,720 | $3,701,434 | 45.7 | % | $10.33 | |||||||
| NOI DSCR | 1.87x | 2.04x | 1.91x | 1.85x | ||||||||||
| NCF DSCR | 1.87x | 2.04x | 1.91x | 1.65x | ||||||||||
| NOI DY | 12.0% | 13.2% | 12.3% | 11.9% | ||||||||||
| NCF DY | 12.0% | 13.2% | 12.3% | 10.6% | ||||||||||
| (1) | The underwritten economic vacancy is 17.0%. The Albuquerque Plaza Property was 83.1% physically occupied as of January 1, 2015. |
| ALBUQUERQUE PLAZA |
Albuquerque Plaza (Subject) | Bank of America Center | 500 Marquette | |
| Location | Albuquerque, NM | Albuquerque, NM | Albuquerque, NM |
| Distance from Subject | -- | 0.3 miles | 0.3 miles |
| Property Type | Office | Office | Office |
| Year Built/Renovated | 1989/2011 | 1974/NAV | 1985/NAV |
| Stories | 22 | 10 | 15 |
| Total GLA | 358,196 SF | 299,123 SF | 231,135 SF |
| Total Occupancy | 83% | 76% | 66% |
| (1) | Information obtained from a third party market research report. |
| ALBUQUERQUE PLAZA |
| SOUTH SHORE PLACE |
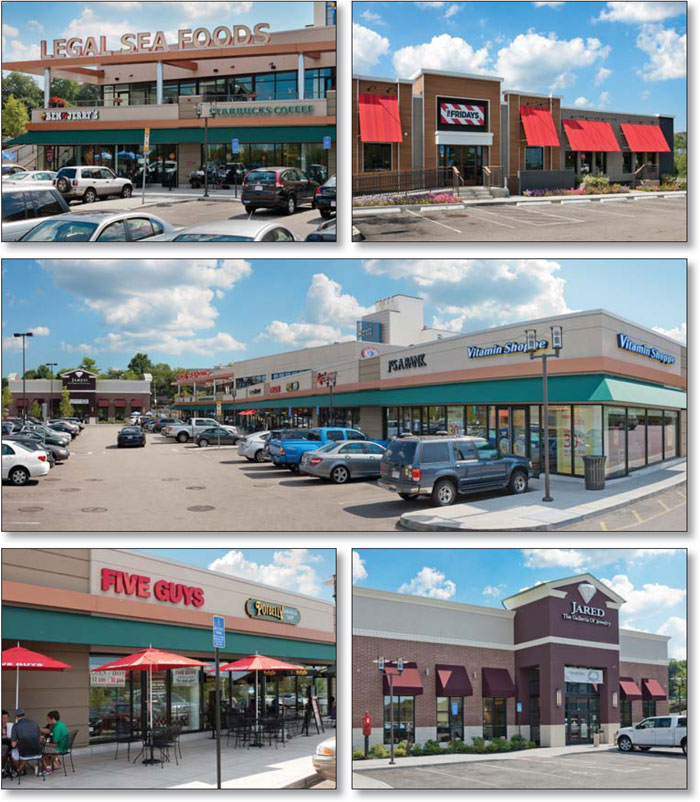
| SOUTH SHORE PLACE |
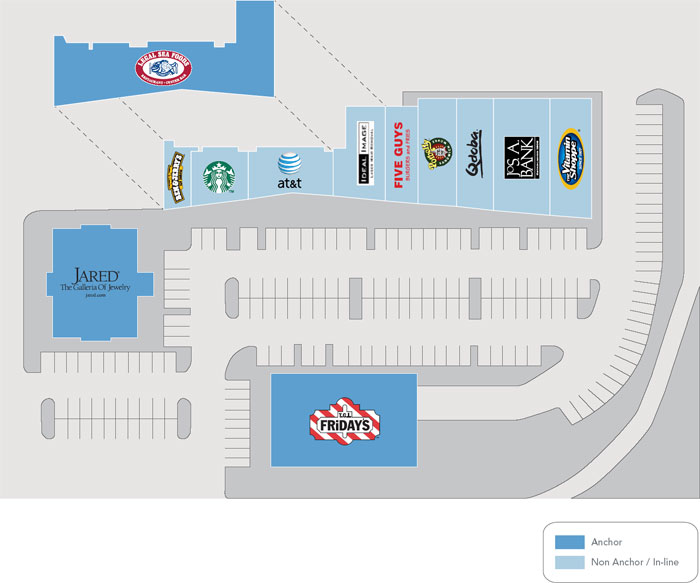
| SOUTH SHORE PLACE |

| No. 7 – South Shore Place | |||||||
| Loan Information | Property Information | ||||||
| Mortgage Loan Seller: | Wells Fargo Bank, National Association | Single Asset/Portfolio: | Single Asset | ||||
Credit Assessment (DBRS/KBRA/Moody’s): | NR/NR/NR | Property Type: | Retail | ||||
| Original Principal Balance: | $29,600,000 | Specific Property Type: | Shadow Anchored | ||||
| Cut-off Date Principal Balance: | $29,600,000 | Location: | Braintree, MA | ||||
| % of Initial Pool Balance: | 2.8% | Size: | 45,407 SF | ||||
| Loan Purpose: | Acquisition | Cut-off Date Principal Balance Per SF: | $651.88 | ||||
Borrower Name(1): | Bierbrier QI South Shore Place Braintree LLC | Year Built/Renovated: | 2012/NAP | ||||
| Sponsor: | Leonard Bierbrier | Title Vesting: | Fee | ||||
| Mortgage Rate: | 4.070% | Property Manager: | Self-managed | ||||
| Note Date: | February 5, 2015 | 3rd Most Recent Occupancy(4): | NAP | ||||
| Anticipated Repayment Date: | NAP | 2nd Most Recent Occupancy (As of): | 86.3% (12/31/2012) | ||||
| Maturity Date: | February 11, 2025 | Most Recent Occupancy (As of): | 94.5% (12/31/2013) | ||||
| IO Period: | 12 months | Current Occupancy (As of): | 100.0% (12/12/2014) | ||||
| Loan Term (Original): | 120 months | ||||||
| Seasoning: | 1 month | Underwriting and Financial Information: | |||||
| Amortization Term (Original): | 360 months | ||||||
| Loan Amortization Type: | Interest-only, Amortizing Balloon | 3rd Most Recent NOI (As of)(4): | $287,002 (12/31/2012) | ||||
| Interest Accrual Method: | Actual/360 | 2nd Most Recent NOI (As of)(4): | $1,562,239 (12/31/2013) | ||||
| Call Protection: | L(25),D(91),O(4) | Most Recent NOI (As of): | $2,322,913 (TTM 11/30/2014) | ||||
| Lockbox Type: | Springing (Without Established Account) | ||||||
| Additional Debt: | (2) | ||||||
| Additional Debt Type: | (2) | ||||||
| U/W Revenues: | $3,077,707 | ||||||
| U/W Expenses: | $753,171 | ||||||
| U/W NOI: | $2,324,536 | ||||||
| U/W NCF: | $2,229,823 | ||||||
| U/W NOI DSCR: | 1.36x | ||||||
Escrows and Reserves(3): | U/W NCF DSCR: | 1.30x | |||||
| U/W NOI Debt Yield: | 7.9% | ||||||
Type: | Initial | Monthly | Cap (If Any) | U/W NCF Debt Yield: | 7.5% | ||
| Taxes | $48,907 | $47,358 | NAP | As-Is Appraised Value: | $41,600,000 | ||
| Insurance | $0 | Springing | NAP | As-Is Appraisal Valuation Date: | 12/31/2014 | ||
| Replacement Reserves | $0 | $757 | NAP | Cut-off Date LTV Ratio: | 71.2% | ||
| TI/LC Reserve | $0 | (3) | (3) | LTV Ratio at Maturity or ARD: | 58.4% | ||
| (1) | In connection with a reverse 1031 exchange transacation, the current borrower is a qualified intermediary and, not later than 180 days from closing, will be merged into Bierbrier South Shore Place Braintree LLC (currently the master tenant and the ultimate borrower). See “Reverse Exchange Transaction” section. |
| (2) | See “Reverse Exchange Transaction” and “Subordinate and Mezzanine Indebtedness” section. |
| (3) | See “Escrows” section. |
| (4) | The South Shore Place Property was built in 2012 and was undergoing lease-up in 2012 and 2013. |
| SOUTH SHORE PLACE |
| Sources | Uses | |||||||||
| Original loan amount | $29,600,000 | 70.9 | % | Purchase price | $41,500,000 | 99.5 | % | |||
| Sponsor’s new cash contribution | 12,125,415 | 29.1 | Reserves | 48,907 | 0.1 | |||||
| Closing costs | 176,508 | 0.4 | ||||||||
| Total Sources | $41,725,415 | 100.0 | % | Total Uses | $41,725,415 | 100.0 | % |
| Tenant Name | Credit Rating (Fitch/ Moody’s/ S&P)(1) | Tenant NRSF | % of NRSF | Annual U/W Base Rent PSF | Annual U/W Base Rent | % of Total Annual U/W Base Rent | Sales PSF(2) | Occupancy Cost(2) | Lease Expiration Date | ||||||||
| Major Tenants | |||||||||||||||||
| Legal Seafood | NR/NR/NR | 8,807 | 19.4% | $70.97 | $625,000 | 25.2% | $1,006 | 8.7% | 9/30/2028 | ||||||||
| TGI Friday’s | NR/NR/NR | 8,200 | 18.1% | $52.50 | $430,500 | 17.3% | $537 | 12.9% | 8/31/2027 | ||||||||
Jared – The Galleria of Jewelry(3) | NR/NR/BBB- | 6,064 | 13.4% | $49.47 | $300,000 | 12.1% | NAV | NAV | 1/31/2033 | ||||||||
| Vitamin Shoppe | NR/NR/NR | 3,176 | 7.0% | $60.00 | $190,560 | 7.7% | NAV | NAV | 10/31/2022 | ||||||||
| Ideal Image | NR/NR/NR | 2,620 | 5.8% | $57.31 | $150,150 | 6.0% | $1,010 | 7.4% | 10/31/2023 | ||||||||
| Total Major Tenants | 28,867 | 63.6% | $58.76 | $1,696,210 | 68.3% | ||||||||||||
Non-Major Tenants(4) | 16,540 | 36.4% | $47.58 | $786,903 | 31.7% | ||||||||||||
| Occupied Collateral Total | 45,407 | 100.0% | $54.69 | $2,483,113 | 100.0% | ||||||||||||
| Vacant Space | 0 | 0.0% | |||||||||||||||
| Collateral Total | 45,407 | 100.0% | |||||||||||||||
| (1) | Certain ratings are those of the parent company whether or not the parent company guarantees the lease. |
| (2) | Sales and Occupancy Costs are based on the trailing 12-month period ending December 31, 2014. Occupancy costs include reimbursements. |
| (3) | Jared – The Galleria of Jewelry is a leased fee tenant and owns its improvements. |
| (4) | Other tenants at the South Shore Place Property include Jos. A. Bank, Five Guys, Qdoba, Potbelly, Starbucks, AT&T and Ben & Jerry’s. |
| SOUTH SHORE PLACE |
Year Ending December 31, | No. of Leases Expiring | Expiring NRSF | % of Total NRSF | Cumulative Expiring NRSF | Cumulative % of Total NRSF | Annual U/W Base Rent | Annual U/W Base Rent PSF | ||||||||
| MTM | 0 | 0 | 0.0% | 0 | 0.0% | $0 | $0.00 | ||||||||
| 2015 | 0 | 0 | 0.0% | 0 | 0.0% | $0 | $0.00 | ||||||||
| 2016 | 0 | 0 | 0.0% | 0 | 0.0% | $0 | $0.00 | ||||||||
| 2017 | 0 | 0 | 0.0% | 0 | 0.0% | $0 | $0.00 | ||||||||
| 2018 | 0 | 0 | 0.0% | 0 | 0.0% | $0 | $0.00 | ||||||||
| 2019 | 0 | 0 | 0.0% | 0 | 0.0% | $0 | $0.00 | ||||||||
| 2020 | 0 | 0 | 0.0% | 0 | 0.0% | $0 | $0.00 | ||||||||
| 2021 | 1 | 2,496 | 5.5% | 2,496 | 5.5% | $124,800 | $50.00 | ||||||||
| 2022 | 3 | 7,760 | 17.1% | 10,256 | 22.6% | $419,760 | $54.09 | ||||||||
| 2023 | 5 | 12,080 | 26.6% | 22,336 | 49.2% | $583,053 | $48.27 | ||||||||
| 2024 | 0 | 0 | 0.0% | 22,336 | 49.2% | $0 | $0.00 | ||||||||
| 2025 | 0 | 0 | 0.0% | 22,336 | 49.2% | $0 | $0.00 | ||||||||
| Thereafter | 3 | 23,071 | 50.8% | 45,407 | 100.0% | $1,355,500 | $58.75 | ||||||||
| Vacant | 0 | 0 | 0.0% | 45,407 | 100.0% | $0 | $0.00 | ||||||||
| Total/Weighted Average | 12 | 45,407 | 100.0% | $2,483,113 | $54.69 |
| (1) | Information obtained from the underwritten rent roll. |
| (2) | Certain tenants may have lease termination options that are exercisable prior to the originally stated expiration date of the subject lease and that are not considered in the Lease Expiration Schedule. |
12/31/2011(1) | 12/31/2012(2) | 12/31/2013(2) | 12/12/2014(3) | |||
| NAP | 86.3% | 94.5% | 100.0% |
| (1) | The South Shore Place Property was built in 2012. |
| (2) | Information obtained from the borrower. |
| (3) | Information obtained from the underwritten rent roll. |
2012(1) | 2013(1) | TTM 11/30/2014 | U/W(1) | % of U/W Effective Gross Income | U/W $ per SF | ||||||||
| Base Rent | $270,559 | $1,735,084 | $2,352,803 | $2,483,113 | 80.7% | $54.69 | |||||||
| Grossed Up Vacant Space | 0 | 0 | 0 | 0 | 0.0 | 0.00 | |||||||
| Percentage Rent | 0 | 0 | 9,813 | 30,000 | 1.0 | 0.66 | |||||||
| Total Reimbursables | 40,847 | 244,920 | 551,133 | 688,750 | 22.4 | 15.17 | |||||||
| Other Income | 0 | 158 | 158 | 0 | 0.0 | 0.00 | |||||||
| Less Vacancy & Credit Loss | 0 | 0 | 0 | (124,156)(2) | (4.0) | (2.73) | |||||||
| Effective Gross Income | $311,406 | $1,980,162 | $2,913,907 | $3,077,707 | 100.0% | $67.78 | |||||||
| Total Operating Expenses | 24,404 | 417,924 | 590,994 | 753,171 | 24.5 | 16.59 | |||||||
| Net Operating Income | $287,002 | $1,562,239 | $2,322,913 | $2,324,536 | 75.5% | $51.19 | |||||||
| TI/LC | 0 | 0 | 0 | 87,902 | 2.9 | 1.94 | |||||||
| Capital Expenditures | 0 | 0 | 0 | 6,811 | 0.2 | 0.15 | |||||||
| Net Cash Flow | $287,002 | $1,562,239 | $2,322,913 | $2,229,823 | 72.5% | $49.11 | |||||||
| NOI DSCR | 0.17x | 0.91x | 1.36x | 1.36x | |||||||||
| NCF DSCR | 0.17x | 0.91x | 1.36x | 1.30x | |||||||||
| NOI DY | 1.0% | 5.3% | 7.8% | 7.9% | |||||||||
| NCF DY | 1.0% | 5.3% | 7.8% | 7.5% |
| (1) | The South Shore Place Property was built in 2012 with the first lease commencing on August 1, 2012. The South Shore Place Property was undergoing lease-up in 2012-2013. The U/W Base Rent is based on in-place rents at the South Shore Place Property as of December 12, 2014. |
| (2) | The underwritten economic vacancy is 5.0%. The South Shore Place Property was 100.0% physically occupied as of December 12, 2014. |
| SOUTH SHORE PLACE |
| SOUTH SHORE PLACE |
MAXWELL HOTEL |

MAXWELL HOTEL |
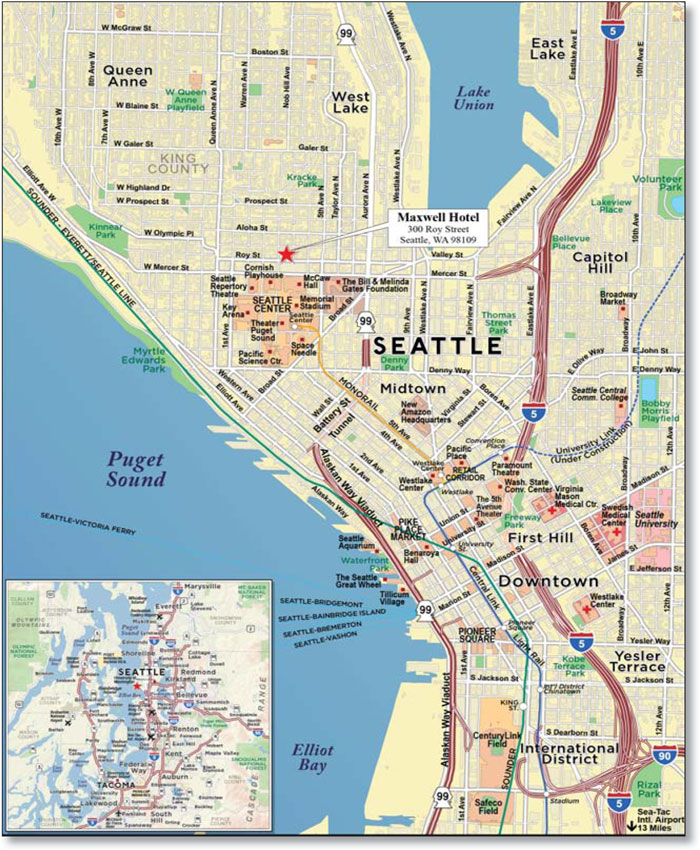
| No. 8 – Maxwell Hotel | |||||||
| Loan Information | Property Information | ||||||
| Mortgage Loan Seller: | Liberty Island Group I LLC | Single Asset/Portfolio: | Single Asset | ||||
Credit Assessment (DBRS/KBRA/Moody’s): | NR/NR/NR | Property Type: | Hospitality | ||||
| Original Principal Balance: | $29,550,000 | Specific Property Type: | Full Service | ||||
| Cut-off Date Principal Balance: | $29,550,000 | Location: | Seattle, WA | ||||
| % of Initial Pool Balance: | 2.8% | Size: | 139 Rooms | ||||
| Loan Purpose: | Refinance | Cut-off Date Principal Balance Per Room: | $212,590 | ||||
| Borrower Names: | Maxwell Pineapple LLC and PHC Maxwell LLC | Year Built/Renovated: | 2010/NAP | ||||
| Sponsor: | Michelle Foreman Barnet | Title Vesting: | Fee | ||||
| Mortgage Rate: | 4.360% | Property Manager: | Self-managed | ||||
| Note Date: | February 10, 2015 | 3rd Most Recent Occupancy (As of): | 67.9% (12/31/2011) | ||||
| Anticipated Repayment Date: | NAP | 2nd Most Recent Occupancy (As of): | 76.5% (12/31/2012) | ||||
| Maturity Date: | March 1, 2025 | Most Recent Occupancy (As of): | 84.6% (12/31/2013) | ||||
| IO Period: | 36 months | Current Occupancy (As of): | 86.7% (12/31/2014) | ||||
| Loan Term (Original): | 120 months | ||||||
| Seasoning: | 0 months | Underwriting and Financial Information: | |||||
| Amortization Term (Original): | 360 months | ||||||
| Loan Amortization Type: | Interest-only, Amortizing Balloon | 3rd Most Recent NOI (As of)(2): | $2,336,768 (12/31/2012) | ||||
| Interest Accrual Method: | Actual/360 | 2nd Most Recent NOI (As of)(2): | $3,062,230 (12/31/2013) | ||||
| Call Protection: | L(24),D(92),O(4) | Most Recent NOI (As of)(2): | $3,782,831 (12/31/2014) | ||||
| Lockbox Type: | Springing (Without Established Account) | ||||||
| Additional Debt: | None | ||||||
| Additional Debt Type: | NAP | ||||||
| U/W Revenues: | $7,053,641 | ||||||
| U/W Expenses: | $3,679,757 | ||||||
| U/W NOI: | $3,373,884 | ||||||
| U/W NCF: | $3,091,738 | ||||||
Escrows and Reserves(1): | U/W NOI DSCR: | 1.91x | |||||
| U/W NCF DSCR: | 1.75x | ||||||
| U/W NOI Debt Yield: | 11.4% | ||||||
Type: | Initial | Monthly | Cap (If Any) | U/W NCF Debt Yield: | 10.5% | ||
| Taxes | $0 | $0 | NAP | As-Is Appraised Value: | $44,100,000 | ||
| Insurance | $0 | $0 | NAP | As-Is Appraisal Valuation Date: | November 25, 2014 | ||
| FF&E Reserve | $23,350 | $23,350 | $1,370,000 | Cut-off Date LTV Ratio: | 67.0% | ||
| Seasonality Reserve | $300,000 | $37,500 | $300,000 | LTV Ratio at Maturity or ARD: | 58.5% | ||
| (1) | See “Escrows” section. |
| (2) | See “Cash Flow Analysis” section. |
MAXWELL HOTEL |
| Sources | Uses | ||||||||
| Original loan amount | $29,550,000 | 100.0% | Loan payoff | $22,612,294 | 76.5 | % | |||
| Reserves | 323,350 | 1.1 | |||||||
| Closing costs | 583,905 | 2.0 | |||||||
| Return of equity | 6,030,451 | 20.4 | |||||||
| Total Sources | $29,550,000 | 100.0% | Total Uses | $29,550,000 | 100.0 | % |
2012 | 2013 | 2014 | U/W | % of U/W Total Revenue | U/W $ per Room | |||||||||
| Occupancy | 76.5% | 84.6% | 86.7% | 86.7% | ||||||||||
| ADR | $134.75 | $144.67 | $155.46 | $155.46 | ||||||||||
| RevPAR | $103.06 | $122.39 | $134.84 | $134.84 | ||||||||||
| �� | ||||||||||||||
| Total Revenue | $5,213,556 | $6,293,129 | $7,046,090 | $7,053,641 | 100.0 | % | $50,746 | |||||||
| Total Department Expenses | 1,546,903 | 1,591,088 | 1,691,383 | 1,693,077 | 24.0 | 12,180 | ||||||||
| Gross Operating Profit | $3,666,653 | $4,702,041 | $5,354,707 | $5,360,564 | 76.0 | % | $38,565 | |||||||
| Total Undistributed Expenses | 1,078,583 | 1,359,956 | 1,289,600 | 1,597,165 | 22.6 | % | $11,490 | |||||||
| Profit Before Fixed Charges | $2,588,070 | $3,342,085 | $4,065,107 | $3,763,399 | 53.4 | % | $27,075 | |||||||
| Total Fixed Charges | 251,303 | 279,854 | 282,276 | 389,515 | 5.5 | % | $2,802 | |||||||
| Net Operating Income | $2,336,768(1) | $3,062,230(1) | $3,782,831(1) | $3,373,884 | 47.8 | % | $24,273 | |||||||
| FF&E | 0 | 0 | 0 | 282,146 | 4.0 | 2,030 | ||||||||
| Net Cash Flow | $2,336,768 | $3,062,230 | $3,782,831 | $3,091,738 | 43.8 | % | $22,243 | |||||||
| NOI DSCR | 1.32x | 1.73x | 2.14x | 1.91x | ||||||||||
| NCF DSCR | 1.32x | 1.73x | 2.14x | 1.75x | ||||||||||
| NOI DY | 7.9% | 10.4% | 12.8% | 11.4% | ||||||||||
| NCF DY | 7.9% | 10.4% | 12.8% | 10.5% | ||||||||||
| (1) | The increase in net operating income is primarily due to increases in Occupancy and RevPAR experienced at the Maxwell Hotel Property. The Maxwell Hotel Property opened in 2010 and operations have continued to stabilize. |
MAXWELL HOTEL |
Competitive Set | Maxwell Hotel | Penetration Factor | |||||||||||||||||
Year | Occupancy | ADR | RevPAR | Occupancy | ADR | RevPAR | Occupancy | ADR | RevPAR | ||||||||||
| 10/31/2014 TTM | 81.0% | $167.93 | $136.03 | 86.1% | $154.73 | $133.21 | 106.3% | 92.1% | 97.9% | ||||||||||
| 12/31/2013 TTM | 78.5% | $153.23 | $120.34 | 83.7% | $144.91 | $121.22 | 106.5% | 94.6% | 100.7% | ||||||||||
| 12/31/2012 TTM | 74.5% | $142.85 | $106.37 | 73.9% | $135.04 | $99.73 | 99.2% | 94.5% | 93.8% | ||||||||||
| (1) | Information obtained from a third party hospitality research report. The competitive set includes: Mayflower Park Hotel, Hotel Max, Hampton Inn Suites Seattle Downtown, Hotel Andra, Courtyard Seattle Downtown Lake Union, Silver Cloud Inn Seattle Lake Union, Marqueen Hotel and Hyatt Place Seattle Downtown. |
MAXWELL HOTEL |
| 300 EAST LOMBARD |
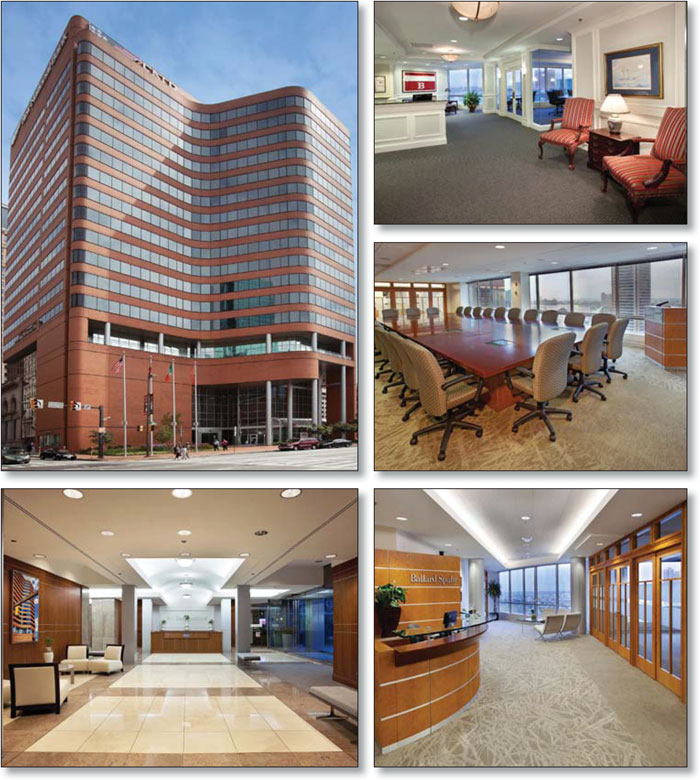
| 300 EAST LOMBARD |
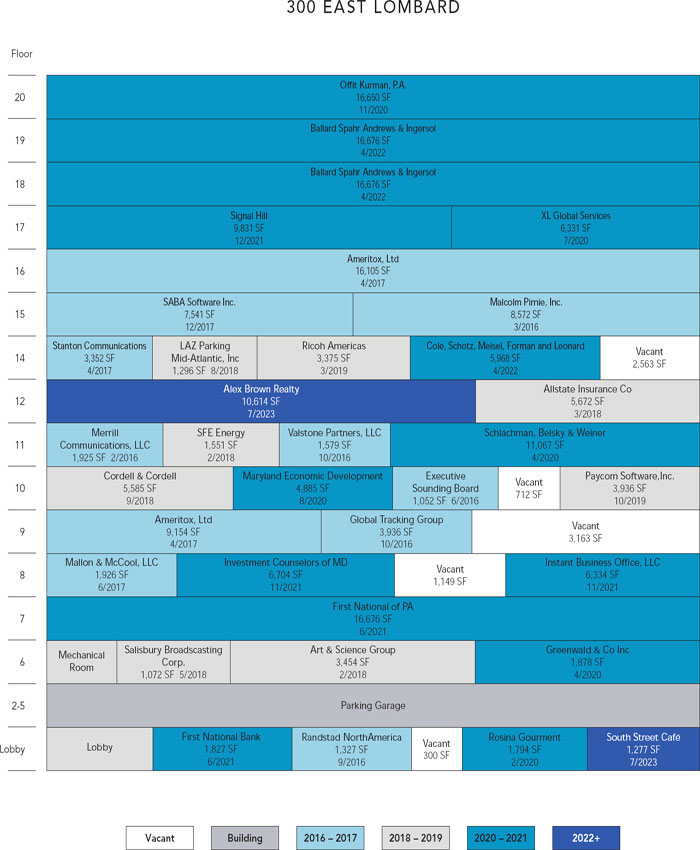
| 300 EAST LOMBARD |
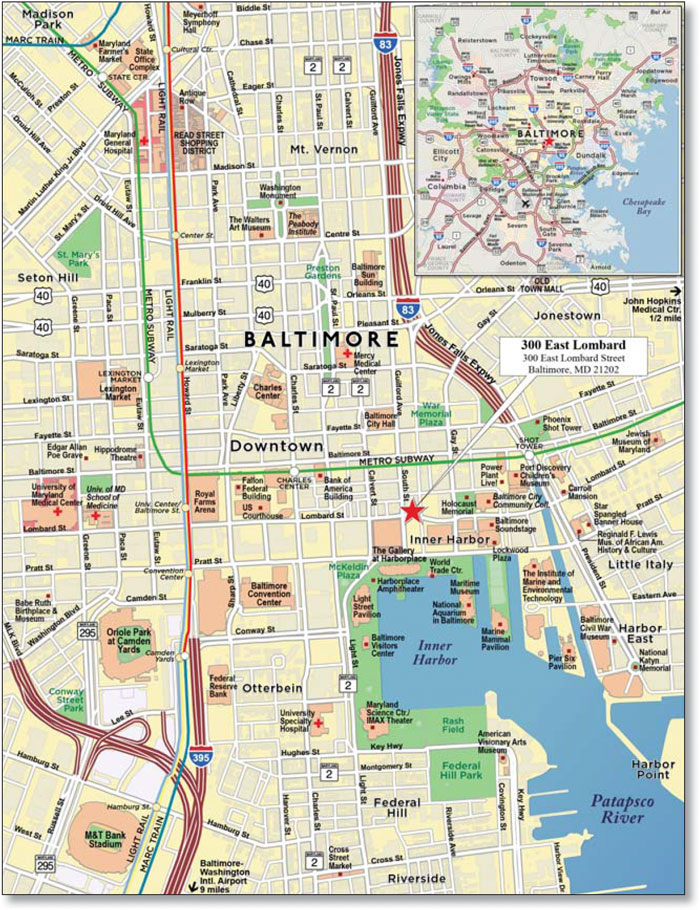
| No. 9 – 300 East Lombard | ||||||||
| Loan Information | Property Information | |||||||
| Mortgage Loan Seller: | Wells Fargo Bank, National Association | Single Asset/Portfolio: | Single Asset | |||||
| Credit Assessment (DBRS/KBRA/Moody’s): | NR/NR/NR | Property Type: | Office | |||||
| Original Principal Balance: | $28,740,000 | Specific Property Type: | CBD | |||||
| Cut-off Date Principal Balance: | $28,692,492 | Location: | Baltimore, MD | |||||
| % of Initial Pool Balance: | 2.7% | Size: | 225,485 SF | |||||
| Loan Purpose: | Acquisition | Cut-off Date Principal Balance Per SF: | $127.25 | |||||
| Borrower Name: | PWA 300 East Lombard, L.P. | Year Built/Renovated: | 1984/2000 | |||||
| Sponsor: | John M. Schneider | Title Vesting: | Fee | |||||
| Mortgage Rate: | 4.050% | Property Manager: | Self-managed | |||||
| Note Date: | February 2, 2015 | 3rd Most Recent Occupancy (As of): | 67.8% (12/31/2011) | |||||
| Anticipated Repayment Date: | NAP | 2nd Most Recent Occupancy (As of): | 74.3% (12/31/2012) | |||||
| Maturity Date: | February 11, 2025 | Most Recent Occupancy (As of): | 79.7% (12/31/2013) | |||||
| IO Period: | None | Current Occupancy (As of)(2): | 96.5% (11/8/2014) | |||||
| Loan Term (Original): | 120 months | |||||||
| Seasoning: | 1 month | Underwriting and Financial Information: | ||||||
| Amortization Term (Original): | 360 months | |||||||
| Loan Amortization Type: | Amortizing Balloon | 3rd Most Recent NOI (As of): | $1,927,407 (12/31/2012) | |||||
| Interest Accrual Method: | Actual/360 | 2nd Most Recent NOI (As of): | $2,238,859 (12/31/2013) | |||||
| Call Protection: | L(25),D(91),O(4) | Most Recent NOI (As of) (3): | $2,125,551 (12/31/2014) | |||||
| Lockbox Type: | Hard/Springing Cash Management | |||||||
| Additional Debt: | None | |||||||
| Additional Debt Type: | NAP | U/W Revenues: | $5,403,983 | |||||
| U/W Expenses: | $2,839,900 | |||||||
U/W NOI(3): | $2,564,082 | |||||||
| U/W NCF: | $2,293,500 | |||||||
Escrows and Reserves(1): | U/W NOI DSCR: | 1.55x | ||||||
| U/W NCF DSCR: | 1.38x | |||||||
Type: | Initial | Monthly | Cap (If Any) | U/W NOI Debt Yield: | 8.9% | |||
| Taxes | $238,078 | $47,615 | NAP | U/W NCF Debt Yield: | 8.0% | |||
| Insurance | $0 | Springing | NAP | As-Is Appraised Value: | $38,500,000 | |||
| Replacement Reserves | $0 | $3,759 | NAP | As-Is Appraisal Valuation Date: | December 17, 2014 | |||
| TI/LC Reserve | $902,886 | $33,823 | $1,420,000 | Cut-off Date LTV Ratio: | 74.5% | |||
| Rent Concession Reserve | $438,196 | Springing | NAP | LTV Ratio at Maturity or ARD: | 59.4% | |||
| (1) | See “Escrows” section. |
| (2) | See “Historical Occupancy” section. |
| (3) | See “Cash Flow Analysis” section. |
| 300 EAST LOMBARD |
| Sources | Uses | ||||||||
| Original loan amount | $28,740,000 | 70.5% | Purchase price | $38,320,000 | 94.1 | % | |||
| Sponsor’s new cash contribution | $12,002,998 | 29.5 | Reserves | 1,579,160 | 3.9 | ||||
| Closing costs | 843,838 | 2.1 | |||||||
| Total Sources | $40,742,998 | 100.0% | Total Uses | $40,742,998 | 100.0 | % |
| Tenant Name | Credit Rating (Fitch/Moody’s/ S&P) | Tenant NRSF | % of NRSF | Annual U/W Base Rent PSF(1) | Annual U/W Base Rent(1) | % of Total Annual U/W Base Rent | Lease Expiration Date | ||||||||
| Major Tenants | |||||||||||||||
| Ballard Spahr LLP | NR/NR/NR | 33,352 | 14.8% | $27.80(2) | $927,186(2) | 17.7% | 4/30/2022(3) | ||||||||
| Ameritox, Ltd | NR/NR/NR | 25,259 | 11.2% | $21.06 | $531,955 | 10.2% | 4/30/2017 | ||||||||
| Offit Kurman | NR/NR/NR | 16,650(4) | 7.4% | $26.50(5) | $441,225(5) | 8.4% | 11/30/2020 | ||||||||
| First National Bank | NR/NR/NR | 18,503 | 8.2% | $22.32 | $412,903 | 7.9% | 6/30/2021(6) | ||||||||
| Alex Brown Realty | NR/NR/NR | 10,614 | 4.7% | $23.69 | $251,446 | 4.8% | 7/31/2023(7) | ||||||||
| Total Major Tenants | 104,378 | 46.3% | $24.57 | $2,564,715 | 49.1% | ||||||||||
| Non-Major Tenants | 113,220 | 50.2% | $23.50 | $2,660,216 | 50.9% | ||||||||||
| Occupied Collateral Total | 217,598 | 96.5% | $24.01 | $5,224,931 | 100.0% | ||||||||||
| Vacant Space | 7,887 | 3.5% | |||||||||||||
| Collateral Total | 225,485 | 100.0% | |||||||||||||
| (1) | Annual U/W Base Rent PSF and Annual U/W Base Rent include contractual rent increases through November 2015. |
| (2) | Ballard Spahr LLP lease includes free rent for the periods of October 2015 through January 2016 and November 2021 through April 2022. The rent concession was reserved in a combination of upfront and required monthly escrows (see “Escrows” section). |
| (3) | Ballard Spahr LLP has the right to terminate its lease on April 30, 2017 with 12 month’ notice and the payment of a termination fee equal to $1,383,631. |
| (4) | Offit Kurman’s Tenant NRSF includes 7,233 square feet of expansion space that the tenant does not yet occupy. Offit Kurman is expected to take occupancy of the expansion space in October 2015. |
| (5) | Offit Kurman’s lease includes free rent for the first two months of the expansion space lease term (expect to begin October 2015). The rent concession was reserved upfront by lender (see “Escrows” section). |
| (6) | First National Bank has the right to terminate its lease at any time after January 31, 2019 if a building that is in excess of 20 floors has been built by November 2018 on a site adjacent to the 300 East Lombard Property. The tenant must provide 12 months’ notice and payment of a termination fee equal to the unamortized landlord costs. |
| (7) | Alex Brown Realty has the right to terminate its lease for all or a portion of its space on July 31, 2018 with 12 months’ notice and payment of a termination fee equal to unamortized landlord costs. |
| 300 EAST LOMBARD |
Year Ending December 31, | No. of Leases Expiring | Expiring NRSF | % of Total NRSF | Cumulative Expiring NRSF | Cumulative % of Total NRSF | Annual U/W Base Rent | Annual U/W Base Rent PSF(3) | ||||||||
| MTM | 0 | 0 | 0.0% | 0 | 0.0% | $0 | $0.00 | ||||||||
| 2015 | 0 | 0 | 0.0% | 0 | 0.0% | $0 | $0.00 | ||||||||
| 2016 | 6 | 18,391 | 8.2% | 18,391 | 8.2% | $471,907 | $25.66 | ||||||||
| 2017 | 4 | 38,078 | 16.9% | 56,469 | 25.0% | $832,054 | $21.85 | ||||||||
| 2018 | 6 | 18,630 | 8.3% | 75,099 | 33.3% | $431,384 | $23.16 | ||||||||
| 2019 | 2 | 7,311 | 3.2% | 82,410 | 36.5% | $152,653 | $20.88 | ||||||||
| 2020 | 6 | 42,605 | 18.9% | 125,015 | 55.4% | $1,045,570 | $24.54 | ||||||||
| 2021 | 4 | 41,372 | 18.3% | 166,387 | 73.8% | $932,455 | $22.54 | ||||||||
| 2022 | 2 | 39,320 | 17.4% | 205,707 | 91.2% | $1,079,370 | $27.45 | ||||||||
| 2023 | 2 | 11,891 | 5.3% | 217,598 | 96.5% | $279,540 | $23.51 | ||||||||
| 2024 | 0 | 0 | 0.0% | 217,598 | 96.5% | $0 | $0.00 | ||||||||
| 2025 | 0 | 0 | 0.0% | 217,598 | 96.5% | $0 | $0.00 | ||||||||
| Thereafter | 0 | 0 | 0.0% | 217,598 | 96.5% | $0 | $0.00 | ||||||||
| Vacant | 0 | 7,887 | 3.5% | 225,485 | 100.0% | $0 | $0.00 | ||||||||
| Total/Weighted Average | 32 | 225,485 | 100.0% | $5,224,931 | $24.01 |
| (1) | Information obtained from the underwritten rent roll. |
| (2) | Certain tenants may have lease termination options that are exercisable prior to the originally stated expiration date of the subject lease and that are not considered in the Lease Expiration Schedule. |
| (3) | Weighted Average Annual U/W Base Rent PSF excludes vacant space. |
12/31/2011(1) | 12/31/2012(1) | 12/31/2013(1) | 11/8/2014(2)(3) | |||
| 67.8% | 74.3% | 79.7% | 96.5% |
| (1) | Information obtained from the borrower. |
| (2) | Information obtained from the underwritten rent roll. |
| (3) | The increase in occupancy from 2013 to November 2014 was due to eight new tenants taking occupancy in 2014. The majority of the increase is attributed to leases executed by First National Bank (8.2% of net rentable square feet) and Investment Counselors of MD (3.0% of net rentable square feet). |
| 300 EAST LOMBARD |
| 2012 | 2013 | 2014 | U/W | % of U/W Effective Gross Income | U/W $ per SF | ||||||||||
| Base Rent | $4,300,740 | $4,470,567 | $4,909,099 | $5,224,931(2) | 96.7% | $23.17 | |||||||||
| Grossed Up Vacant Space | 0 | 0 | 0 | 186,278 | 3.4 | 0.83 | |||||||||
| Total Reimbursables | 191,818 | 97,596 | 112,774 | 70,500 | 1.3 | 0.31 | |||||||||
| Parking Income | 272,627 | 293,936 | 351,624 | 351,624 | 6.5 | 1.56 | |||||||||
| Other Income | 47,054 | 112,767 | 111,770 | 111,770 | 2.1 | 0.50 | |||||||||
| Less Free Rent | (157,734) | (270,525) | (566,204) | 0(3) | 0.0 | 0.00 | |||||||||
| Less Vacancy | 0 | 0 | 0 | (541,121)(4) | (10.0) | (2.40) | |||||||||
| Effective Gross Income | $4,654,505 | $4,704,341 | $4,919,063 | $5,403,983 | 100.0% | $23.97 | |||||||||
| Total Operating Expenses | $2,727,098 | $2,465,482(1) | $2,793,512 | $2,839,900 | 52.6 | $12.59 | |||||||||
| Net Operating Income | $1,927,407 | $2,238,859(1) | $2,125,551 | $2,564,082 | 47.4% | $11.37 | |||||||||
| TI/LC | 0 | 0 | 0 | 225,485 | 4.2 | 1.00 | |||||||||
| Capital Expenditures | 0 | 0 | 0 | 45,097 | 0.8 | 0.20 | |||||||||
| Net Cash Flow | $1,927,407 | $2,238,859 | $2,125,551 | $2,293,500 | 42.4% | $10.17 | |||||||||
| NOI DSCR | 1.16x | 1.35x | 1.28x | 1.55x | |||||||||||
| NCF DSCR | 1.16x | 1.35x | 1.28x | 1.38x | |||||||||||
| NOI DY | 6.7% | 7.8% | 7.4% | 8.9% | |||||||||||
| NCF DY | 6.7% | 7.8% | 7.4% | 8.0% | |||||||||||
| (1) | The increase in the 2013 Net Operating Income from 2012 is attributed to tenants representing 4.3% of the U/W Base Rent taking occupancy and real estate taxes being successfully contested and decreasing approximately $300,000. |
| (2) | The increase in the U/W Base Rent from 2014 is attributed to Offit Kurman expansion ($191,675 U/W Base Rent) occupancy commencing in October 2015 and contractual rent increases through November 2015 totaling approximately $87,000. |
| (3) | The remaining free rent ($539,532) expires in April 2022. A rent concession reserve was established and funded at closing for all outstanding concessions. |
| (4) | The underwritten economic vacancy is 10.0%. The 300 East Lombard Property was 96.5% physically occupied as of November 8, 2014. |
| 300 EAST LOMBARD |
300 East Lombard (Subject) | 100 East Pratt Street | Pandora Building | The Alex Brown Building | St. Paul Plaza | SunTrust Building | Harborplace Tower | |
| Location | Baltimore, MD | Baltimore, MD | Baltimore, MD | Baltimore, MD | Baltimore, MD | Baltimore, MD | Baltimore, MD |
| Distance from Subject | -- | 0.2 miles | 0.5 miles | 0.1 miles | 0.4 miles | 0.2 miles | 0.1 miles |
| Property Type | Office | Office | Office | Office | Office | Office | Office |
| Year Built/Renovated | 1984/2000 | 1991/NAP | 1986/NAP | 1992/NAP | 1989/NAP | 1989/NAP | 1998/NAP |
| Stories | 19 | 28 | 24 | 30 | 28 | 25 | 28 |
| Total GLA | 225,485 SF | 635,323 SF | 360,833 SF | 478,528 SF | 264,895 SF | 327,660 SF | 392,222 SF |
| Total Occupancy | 97% | 99% | 97% | 83% | 97% | 83% | 89% |
| (1) | Information obtained from the appraisal. |
| 300 EAST LOMBARD |
| AMARGOSA PORTFOLIO |
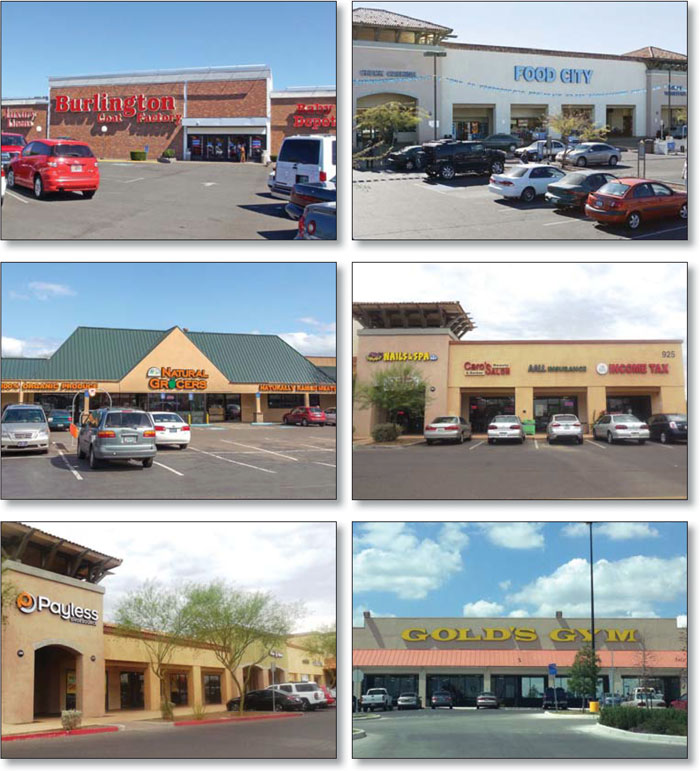
| AMARGOSA PORTFOLIO |
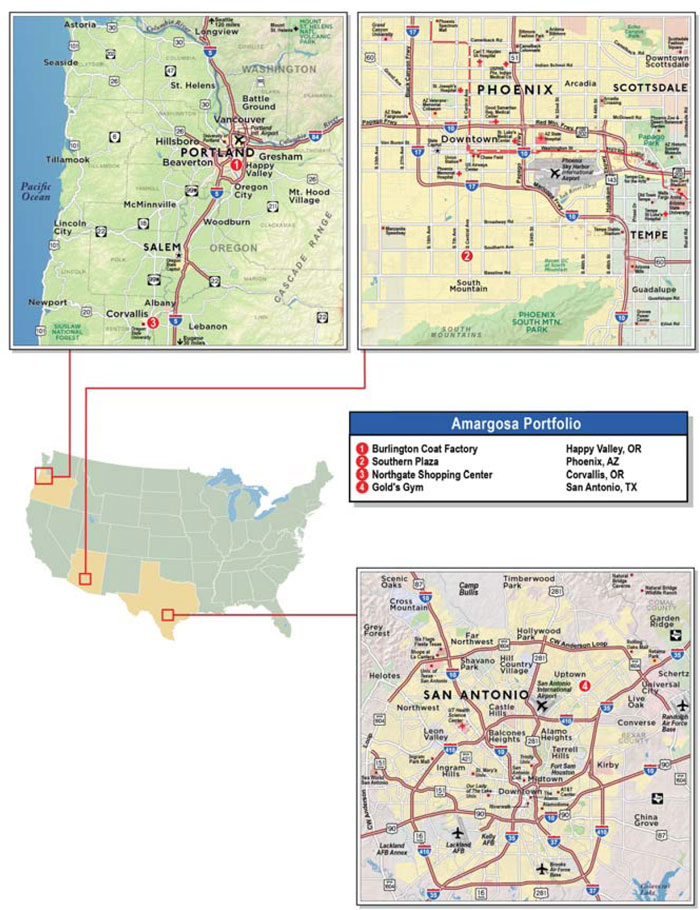
| No. 10 – Amargosa Portfolio | ||||||
| Loan Information | Property Information | |||||
| Mortgage Loan Seller: | Wells Fargo Bank, National Association | Single Asset/Portfolio: | Portfolio | |||
| Credit Assessment (DBRS/KBRA/Moody’s): | NR/NR/NR | Property Type: | Retail | |||
| Original Principal Balance: | $26,600,000 | Specific Property Type: | Various – See Table | |||
| Cut-off Date Principal Balance: | $26,600,000 | Location: | Various – See Table | |||
| % of Initial Pool Balance: | 2.5% | Size: | 225,906 SF | |||
| Loan Purpose: | Acquisition | Cut-off Date Principal Balance Per SF: | $117.75 | |||
| Borrower Name: | Amargosa Palmdale Investments, LLC | Year Built/Renovated: | Various – See Table | |||
| Sponsor: | Dorian Bilak | Title Vesting: | Fee | |||
| Mortgage Rate: | 4.230% | Property Manager: | Self-managed | |||
| Note Date: | February 4, 2015 | 3rd Most Recent Occupancy(2): | NAV | |||
| Anticipated Repayment Date: | NAP | 2nd Most Recent Occupancy(2): | NAV | |||
| Maturity Date: | February 11, 2025 | Most Recent Occupancy(2): | NAV | |||
| IO Period: | 24 months | Current Occupancy (As of): | 98.9% (12/1/2014) | |||
| Loan Term (Original): | 120 months | |||||
| Seasoning: | 1 month | Underwriting and Financial Information: | ||||
| Amortization Term (Original): | 360 months | |||||
| Loan Amortization Type: | Interest-only, Amortizing Balloon | 3rd Most Recent NOI(As of)(3): | $2,212,202 (Various) | |||
| Interest Accrual Method: | Actual/360 | 2nd Most Recent NOI(As of)(3): | $1,827,817 (12/31/2013) | |||
| Call Protection: | L(25),D(91),O(4) | Most Recent NOI(As of)(3): | $2,128,542 (Annualized T4 12/31/2014) | |||
| Lockbox Type: | Springing (Without Established Account) | |||||
| Additional Debt: | None | |||||
| Additional Debt Type: | NAP | U/W Revenues: | $3,692,452 | |||
| U/W Expenses: | $1,123,034 | |||||
| U/W NOI: | $2,569,418 | |||||
| U/W NCF: | $2,387,834 | |||||
Escrows and Reserves(1): | U/W NOI DSCR: | 1.64x | ||||
| U/W NCF DSCR: | 1.52x | |||||
| Type: | Initial | Monthly | Cap (If Any) | U/W NOI Debt Yield: | 9.7% | |
| Taxes | $73,109 | $29,677 | NAP | U/W NCF Debt Yield: | 9.0% | |
| Insurance | $0 | Springing | NAP | As-Is Appraised Value: | $37,180,000 | |
| Replacement Reserves | $0 | $2,824 | NAP | As-Is Appraisal Valuation Date(4): | Various | |
| TI/LC Reserve | $0 | $12,500 | NAP | Cut-off Date LTV Ratio: | 71.5% | |
| Environmental Reserve | $307,500 | $0 | NAP | LTV Ratio at Maturity or ARD: | 60.6% | |
| (1) | See “Escrows” section. |
| (2) | The four Amargosa Portfolio Properties were acquired between May 2014 and July 2014. Historical occupancies were not available. |
| (3) | See “Cash Flow Analysis” section. |
| (4) | See “Appraisals” section. |
| AMARGOSA PORTFOLIO |
| Sources | Uses | |||||||
| Original loan amount | $26,600,000 | 70.1% | Purchase price(1) | $37,060,000 | 97.6% | |||
| Sponsor’s new cash contribution | 11,365,702 | 29.9% | Reserves | 380,609 | 1.0% | |||
| Closing costs | 525,093 | 1.4 | ||||||
| Total Sources | $37,965,702 | 100.0% | Total Uses | $37,965,702 | 100.0% |
| (1) | The borrower acquired the Amargosa Portfolio Properties between May 2014 and July 2014. |
| Property Name – Location | Property Sub-Type | Allocated Cut-off Date Principal Balance | % of Portfolio Cut-off Date Principal Balance | Occupancy | Year Built/ Renovated | Net Rentable Area (SF) | Appraised Value | Allocated LTV | |||||||||
| Burlington Coat Factory – Happy Valley, OR | Single Tenant | $9,600,000 | 36.1% | 100.0% | 1969/2014 | 83,260 | $13,200,000 | 72.7% | |||||||||
| Southern Plaza – Phoenix, AZ | Anchored | $8,300,000 | 31.2% | 96.6% | 2007/NAP | 75,233 | $12,000,000 | 69.2% | |||||||||
| Northgate Shopping Center – Corvallis, OR | Anchored | $4,800,000 | 18.0% | 100.0% | 1957/2013 | 34,413 | $6,480,000 | 74.1% | |||||||||
| Gold’s Gym – San Antonio, TX | Single Tenant | $3,900,000 | 14.7% | 100.0% | 1975/NAP | 33,000 | $5,500,000 | 70.9% | |||||||||
| Total/Weighted Average | $26,600,000 | 100.0% | 98.9% | 225,906 | $37,180,000 | 71.5% |
| (1) | The Burlington Coat Factory property is subject to a pending condemnation for widening of the ingress/egress lanes of the property’s entrance; however, the taking involves approximately 426 square feet and does not affect the tenant’s continued access to the property or the available parking. See “Description of the Mortgage Pool—Other Matters” in the Free Writing Prospectus. |
Tenant Name | Credit Rating (Fitch/ Moody’s/ S&P)(1) | Tenant NRSF | % of NRSF | Annual U/W Base Rent PSF(2) | Annual U/W Base Rent(2) | % of Total Annual U/W Base Rent | Sales PSF(3) | Occupancy Cost(3) | Lease Expiration Date | ||||||||
| Major Tenants | |||||||||||||||||
Burlington Coat Factory(4) | NR/NR/B | 83,260 | 36.9% | $12.00 | $999,120 | 35.9% | NAV | NAV | 1/31/2024 | ||||||||
Food City(5) | NR/NR/NR | 55,014 | 24.4% | $10.00 | $550,140 | 19.8% | $417 | 4.3% | 1/31/2026 | ||||||||
Gold’s Gym(6) | NR/NR/NR | 33,000 | 14.6% | $12.00(8) | $396,000(8) | 14.2% | NAV | NAV | 6/30/2025 | ||||||||
Natural Grocers(7) | NR/NR/NR | 18,080 | 8.0% | $19.32 | $349,380 | 12.6% | NAV | NAV | 12/31/2028 | ||||||||
Campbell’s Cleaners(7) | NR/NR/NR | 6,342(9) | 2.8% | $14.30(9) | $90,660(9) | 3.3% | NAV | NAV | Various(9) | ||||||||
| Total Major Tenants | 195,696 | 86.6% | $12.19 | $2,385,300 | 85.8% | ||||||||||||
| Non-Major Tenant | 27,680 | 12.3% | $14.27 | 394,864 | 14.2% | ||||||||||||
| Occupied Collateral Total | 223,376 | 98.9% | $12.45 | $2,780,164 | 100.0% | ||||||||||||
| Vacant Space | 2,530 | 1.1% | |||||||||||||||
| Collateral Total | 225,906 | 100.0% | |||||||||||||||
| (1) | Certain ratings are those of the parent company whether or not the parent guarantees the lease. |
| (2) | Annual U/W Base Rent PSF and Annual U/W Base Rent include contractual rent increases through July 2015. |
| (3) | Sales PSF and Occupancy Cost are based on the trailing 12-month period ending December 31, 2013. |
| (4) | Located at the Burlington Coat Factory property. |
| (5) | Located at the Southern Plaza property. |
| (6) | Located at the Gold’s Gym property. |
| (7) | Located at the Northgate Shopping Center property. |
| (8) | Gold’s Gym is paying an abated monthly rent of $12,513 ($150,150 annual rent) through June 2015. In July 2015, Gold’s Gym will commence paying an annual rent of $396,000. |
| (9) | Campbell’s Cleaners leases a 3,192 square foot outparcel with an Annual U/W Base Rent of $49,800 ($15.60 per square foot) on a lease that expires December 31, 2016 and 3,150 square feet of in-line space with an Annual U/W Base Rent of $40,860 ($12.97 per square foot) on a lease that expires May 31, 2019. |
| AMARGOSA PORTFOLIO |
Year Ending December 31, | No. of Leases Expiring | Expiring NRSF | % of Total NRSF | Cumulative Expiring NRSF | Cumulative % of Total NRSF | Annual U/W Base Rent | Annual U/W Base Rent PSF(3) | ||||||||
| MTM | 1 | 1,200 | 0.5% | 1,200 | 0.5% | $24,000 | $20.00 | ||||||||
| 2015 | 3 | 5,839 | 2.6% | 7,039 | 3.1% | $101,805 | $17.44 | ||||||||
| 2016 | 2 | 4,192 | 1.9% | 11,231 | 5.0% | $70,800 | $16.89 | ||||||||
| 2017 | 3 | 3,150 | 1.4% | 14,381 | 6.4% | $66,231 | $21.03 | ||||||||
| 2018 | 2 | 15,491 | 6.9% | 29,872 | 13.2% | $154,228 | $9.96 | ||||||||
| 2019 | 2 | 4,150 | 1.8% | 34,022 | 15.1% | $68,460 | $16.50 | ||||||||
| 2020 | 0 | 0 | 0.0% | 34,022 | 15.1% | $0 | $0.00 | ||||||||
| 2021 | 0 | 0 | 0.0% | 34,022 | 15.1% | $0 | $0.00 | ||||||||
| 2022 | 0 | 0 | 0.0% | 34,022 | 15.1% | $0 | $0.00 | ||||||||
| 2023 | 0 | 0 | 0.0% | 34,022 | 15.1% | $0 | $0.00 | ||||||||
| 2024 | 1 | 83,260 | 36.9% | 117,282 | 51.9% | $999,120 | $12.00 | ||||||||
| 2025 | 1 | 33,000 | 14.6% | 150,282 | 66.5% | $396,000 | $12.00 | ||||||||
| Thereafter | 2 | 73,094 | 32.4% | 223,376 | 98.9% | $899,520 | $12.31 | ||||||||
| Vacant | 0 | 2,530 | 1.1% | 225,906 | 100.0% | $0 | $0.00 | ||||||||
| Total/Weighted Average | 17 | 225,906 | 100.0% | $2,780,164 | $12.45 |
| (1) | Information obtained from the underwritten rent roll. |
| (2) | Certain tenants may have lease termination options that are exercisable prior to the originally stated expiration date of the subject lease and that are not considered in the Lease Expiration Table. |
| (3) | Weighted Average Annual U/W Base Rent PSF excludes vacant space. |
12/31/2011(1) | 12/31/2012(1) | 12/31/2013(1) | 12/1/2014(2) | |||
| NAV | NAV | NAV | 98.9% |
| (1) | The four Amargosa Portfolio Properties were acquired between May 2014 and July 2014. Historical occupancy is not available. |
| (2) | Information obtained from the underwritten rent roll. |
2012(1) | 2013(2) | Annualized T4 12/31/2014(3) | U/W | % of U/W Effective Gross Income | U/W $ per SF | ||||||||
| Base Rent | $2,304,922 | $1,888,380 | $2,912,022(4) | $2,780,164(5) | 75.3% | $12.31 | |||||||
| Grossed Up Vacant Space | 0 | 0 | 0 | 53,130 | 1.4 | 0.24 | |||||||
| Total Reimbursables | 525,036 | 547,193 | 410,496 | 971,626 | 26.3 | 4.30 | |||||||
| Other Income | 38,496 | 37,414 | 35,733 | 35,732 | 1.0 | 0.16 | |||||||
| Less Vacancy & Credit Loss | 0 | 0 | 0 | (148,199)(6) | (4.0) | (0.66) | |||||||
| Effective Gross Income | $2,868,454 | $2,472,987 | $3,358,251 | $3,692,452 | 100.0% | $16.35 | |||||||
| Total Operating Expenses | $656,252 | $645,171 | $1,229,709 | $1,123,034 | 30.4% | $4.97 | |||||||
| Net Operating Income | $2,212,202 | $1,827,817 | $2,128,542 | $2,569,418 | 69.6% | $11.37 | |||||||
| TI/LC | 0 | 0 | 0 | 147,698 | 4.0 | 0.65 | |||||||
| Capital Expenditures | 0 | 0 | 0 | 33,886 | 0.9 | 0.15 | |||||||
| Net Cash Flow | $2,212,202 | $1,827,817 | $2,128,542 | $2,387,834 | 64.7% | $10.57 | |||||||
| NOI DSCR | 1.41x | 1.17x | 1.36x | 1.64x | |||||||||
| NCF DSCR | 1.41x | 1.17x | 1.36x | 1.52x | |||||||||
| NOI DY | 8.3% | 6.9% | 8.0% | 9.7% | |||||||||
| NCF DY | 8.3% | 6.9% | 8.0% | 9.0% |
| (1) | The 2012 cash flows for the Gold’s Gym property represents the annualized six-month period ending December 31, 2012. |
| (2) | The 2013 cash flows for the Northgate Shopping Center property were not provided by seller and are not included in the aggregate 2013 cash flows. |
| (3) | Represents the trailing 4-month period ending December 31, 2014 on an annualized basis. |
| (4) | The increase in Base Rent from 2013 to the Annualized trailing 4-month period ending December 31, 2014 is due to Natural Grocers taking occupancy at the Northgate Shopping Center property and a contractual rent increase for Burlington Coat Factory. |
| (5) | The U/W Base Rent includes contractual rent increases through July 2015 totaling approximately $50,187. The decrease in Base Rent from the Annualized trailing 4-month period ending December 31, 2014 to the U/W Base Rent is due to mark-to-market adjustments for three tenants totaling approximately $127,519. |
| (6) | The underwritten economic vacancy is 5.2%. The Amargosa Portfolio Properties were 98.9% physically occupied as of December 1, 2014. |
| AMARGOSA PORTFOLIO |
| AMARGOSA PORTFOLIO |
| No. 11 – Residence Inn Tampa Westshore Airport | ||||||||
| Loan Information | Property Information | |||||||
| Mortgage Loan Seller: | Wells Fargo Bank, National Association | Single Asset/Portfolio: | Single Asset | |||||
Credit Assessment (DBRS/KBRA/Moody’s): | NR/NR/NR | Property Type: | Hospitality | |||||
| Original Principal Balance: | $23,569,000 | Specific Property Type: | Limited Service | |||||
| Cut-off Date Principal Balance: | $23,569,000 | Location: | Tampa, FL | |||||
| % of Initial Pool Balance: | 2.2% | Size: | 160 Rooms | |||||
| Loan Purpose: | Acquisition | Cut-off Date Principal Balance Per Room: | $147,306 | |||||
| Borrower Name: | NF II/CI Tampa Airport, LLC | Year Built/Renovated: | 2001/NAP | |||||
| Sponsor: | Noble Hospitality Fund II, L.P. | Title Vesting: | Fee | |||||
| Mortgage Rate: | 4.350% | Property Manager: | McKibbon Hotel Management, Inc. | |||||
| Note Date: | December 4, 2014 | 3rd Most Recent Occupancy (As of)(4): | 81.0% (12/31/2011) | |||||
| Anticipated Repayment Date: | NAP | 2nd Most Recent Occupancy (As of)(4): | 82.3% (12/31/2012) | |||||
| Maturity Date: | December 11, 2024 | Most Recent Occupancy (As of)(4): | 79.5% (12/31/2013) | |||||
| IO Period: | 36 months | Current Occupancy (As of)(4): | 86.1% (10/31/2014) | |||||
| Loan Term (Original): | 120 months | |||||||
| Seasoning: | 3 months | Underwriting and Financial Information: | ||||||
| Amortization Term (Original): | 360 months | |||||||
| Loan Amortization Type: | Interest-only, Amortizing Balloon | 3rd Most Recent NOI (As of)(4): | $2,741,534 (12/31/2012) | |||||
| Interest Accrual Method: | Actual/360 | 2nd Most Recent NOI (As of)(4): | $2,626,703 (12/31/2013) | |||||
| Call Protection: | L(23), GRTR 1% or YM(93),O(4) | Most Recent NOI (As of)(4): | $3,112,930 (10/31/2014) | |||||
| Lockbox Type: | Springing (Without Established Account) | |||||||
| Additional Debt: | None | |||||||
| Additional Debt Type: | NAP | U/W Revenues: | $6,179,167 | |||||
| U/W Expenses: | $3,278,148 | |||||||
| U/W NOI: | $2,901,019 | |||||||
| U/W NCF: | $2,653,852 | |||||||
| U/W NOI DSCR: | 2.06x | |||||||
Escrows and Reserves: | U/W NCF DSCR: | 1.88x | ||||||
| U/W NOI Debt Yield: | 12.3% | |||||||
Type: | Initial | Monthly | Cap (If Any) | U/W NCF Debt Yield: | 11.3% | |||
| Taxes | $40,929 | $20,465 | NAP | As-Stabilized Value(5): | $37,600,000 | |||
Insurance(1) | $0 | Springing | NAP | As-Stabilized Appraisal Valuation Date(5): | November 1, 2015 | |||
FF&E Reserve(2) | $0 | $21,279 | NAP | Cut-off Date LTV Ratio(5): | 62.7% | |||
PIP Reserve(3) | $2,836,000 | Springing | NAP | LTV Ratio at Maturity or ARD(5): | 54.7% | |||
| (1) | Ongoing monthly reserves for insurance are not required as long as (i) no event of default has occurred and is continuing; (ii) the Residence Inn Tampa Westshore Airport Property is covered by an acceptable blanket insurance policy; and (iii) the borrower provides the lender with evidence of renewal of the insurance policies and timely proof of payment of insurance premiums. |
| (2) | Lender may adjust the monthly FF&E deposit, upon no less than 10 days’ notice, in an amount equal to the greater of (i) $21,279 or (ii) one twelfth of 4.0% of operating income for the prior fiscal year. |
| (3) | An upfront PIP Reserve of $2,836,000 for the Residence Inn Tampa Westshore Airport Property was collected at closing for the proposed capital improvements required by the franchisor (“PIP Work”). In addition to this initial deposit, should any additional PIP Work be required by the franchisor, the borrower must deposit (within 15 days of receipt of notice from the franchisor) an amount equal to 110% of the estimated costs to complete such additional PIP Work, as reasonably determined by lender. |
| (4) | See “Cash Flow Analysis” section. |
| (5) | The appraiser concluded to an “as-is” appraised value of $34,500,000 as of November 1, 2014. The Cut-off Date LTV Ratio based on the “as-is” value is 68.3% and the LTV Ratio at Maturity is 59.6%. |
| RESIDENCE INN TAMPA WESTSHORE AIRPORT |
| Sources | Uses | |||||||||
| Original loan amount | $23,569,000 | 70.0 | % | Purchase price(1) | $30,197,000 | 89.7 | % | |||
| Sponsor’s new cash contribution | 10,099,593 | 30.0 | Reserves | 2,876,929 | 8.5 | |||||
| Closing costs | 594,664 | 1.8 | ||||||||
| Total Sources | $33,668,593 | 100.0 | % | Total Uses | $33,668,593 | 100.0 | % |
| (1) | The Residence Inn Tampa Westshore Airport Property was acquired by Noble Investment Group in conjunction with eight other hotel properties, of which five are expected to be securitized in the WFCM 2015-C27 Trust: Residence Inn Charlotte Southpark ($20,560,000), Courtyard Fort Myers ($15,779,000), Residence Inn Little Rock Downtown ($14,447,000), Courtyard Tampa Downtown ($14,387,000), and Hampton Inn & Suites Knoxville ($9,884,000). The other three hotels were included in the WFCM 2015-C26 Trust. |
Competitive Set | Residence Inn Tampa Westshore Airport | Penetration Factor | |||||||||||||||||
Year | Occupancy | ADR | RevPAR | Occupancy | ADR | RevPAR | Occupancy | ADR | RevPAR | ||||||||||
| 09/30/2014 TTM | 79.5% | $114.64 | $91.09 | 84.8% | $121.17 | $102.70 | 106.7% | 105.7% | 112.7% | ||||||||||
| 09/30/2013 TTM | 74.0% | $110.01 | $81.46 | 81.0% | $116.42 | $94.31 | 109.4% | 105.8% | 115.8% | ||||||||||
| 09/30/2012 TTM | 75.3% | $112.48 | $84.75 | 82.4% | $116.26 | $95.83 | 109.4% | 103.4% | 113.1% | ||||||||||
| (1) | Information obtained from a third party hospitality report dated October 18, 2014. The competitive set includes: Courtyard Tampa Westhsore Airport, Hilton Tampa Airport Westshore, Embassy Suites Tampa Airport Westshore, Hyatt Place Tampa Airport Westshore, and Springhill Suites Tampa Westshore Airport. |
| 2012 | 2013 | TTM 10/31/2014(1) | U/W | % of U/W Total Revenue | U/W $ per Room | |||||||||
| Occupancy | 82.3% | 79.5% | 86.1% | 86.1% | ||||||||||
| ADR | $116.56 | $117.31 | $120.75 | $120.75 | ||||||||||
| RevPAR | $95.87 | $93.23 | $104.02 | $104.02 | ||||||||||
| Total Revenue | $5,727,708 | $5,563,770 | $6,179,167 | $6,179,167 | 100.0% | $38,620 | ||||||||
| Total Department Expenses | 913,093 | 918,507 | 965,506 | 965,506 | 15.6% | $6,034 | ||||||||
| Gross Operating Profit | $4,814,615 | $4,645,263 | $5,213,661 | $5,213,661 | 84.4% | $32,585 | ||||||||
| Total Undistributed Expenses | 1,757,756 | 1,696,013 | 1,776,270 | 1,836,236 | 29.7% | $11,476 | ||||||||
| Profit Before Fixed Charges | $3,056,859 | $2,949,250 | $3,437,391 | $3,377,425 | 54.7% | $21,109 | ||||||||
| Total Fixed Charges | 315,325 | 322,547 | 324,461 | 476,406 | 7.7% | $2,978 | ||||||||
| Net Operating Income | $2,741,534 | $2,626,703 | $3,112,930 | $2,901,019 | 46.9% | $18,131 | ||||||||
| FF&E | 0 | 0 | 0 | 247,167 | 4.0% | $1,545 | ||||||||
| Net Cash Flow | $2,741,534 | $2,626,703 | $3,112,930 | $2,653,852 | 42.9% | $16,587 | ||||||||
| NOI DSCR | 1.95x | 1.87x | 2.21x | 2.06x | ||||||||||
| NCF DSCR | 1.95x | 1.87x | 2.21x | 1.88x | ||||||||||
| NOI DY | 11.6% | 11.1% | 13.2% | 12.3% | ||||||||||
| NCF DY | 11.6% | 11.1% | 13.2% | 11.3% | ||||||||||
| (1) | The increase in Net Operating Income from 12/31/2013 to the trailing twelve months ending 10/31/2014 is due to the Residence Inn Tampa Westshore Airport Property’s occupancy increasing from 79.5% to 86.1% and ADR increasing from $117.31 to $120.75 for the trailing 12 months ending 10/31/2014. |
| No. 12 – Orbital ATK Office | ||||||||
| Loan Information | Property Information | |||||||
| Mortgage Loan Seller: | Rialto Mortgage Finance, LLC | Single Asset/Portfolio: | Single Asset | |||||
| Credit Assessment (DBRS/KBRA/Moody’s): | NR/NR/NR | Property Type: | Office | |||||
| Original Principal Balance: | $22,000,000 | Specific Property Type: | Suburban | |||||
| Cut-off Date Principal Balance: | $22,000,000 | Location: | Los Angeles, CA | |||||
| % of Initial Pool Balance: | 2.1% | Size: | 120,200 SF | |||||
| Loan Purpose: | Refinance | Cut-off Date Principal Balance Per SF: | $183.03 | |||||
| Borrower Name: | 94 IS THE 1, LLC | Year Built/Renovated: | 1981/2014 | |||||
| Sponsor: | Bob Safai | Title Vesting: | Fee Simple | |||||
| Mortgage Rate: | 4.500% | Property Manager: | ||||||
| Note Date: | January 29, 2015 | 3rd Most Recent Occupancy(1): | ||||||
| Anticipated Repayment Date: | NAP | 2nd Most Recent Occupancy(1): | NAV | |||||
| Maturity Date: | February 6, 2025 | Most Recent Occupancy (As of): | ||||||
| IO Period: | 36 months | |||||||
| Loan Term (Original): | 120 months | |||||||
| Seasoning: | 1 month | Underwriting and Financial Information: | ||||||
| Amortization Term (Original): | 360 months | |||||||
| Loan Amortization Type: | Interest-only, Amortizing Balloon | 3rd Most Recent NOI(1) : | ||||||
| Interest Accrual Method: | Actual/360 | 2nd Most Recent NOI(1) : | ||||||
| Call Protection: | L(25),D(88),O(7) | Most Recent NOI (As of)(1): | ||||||
| Lockbox Type: | Hard/Springing Cash Management | |||||||
| Additional Debt: | None | U/W Revenues: | $2,815,365 | |||||
| Additional Debt Type: | NAP | U/W Expenses: | $572,307 | |||||
| U/W NOI: | $2,243,057 | |||||||
| U/W NCF: | $2,096,951 | |||||||
Escrows and Reserves: | U/W NOI DSCR: | 1.68x | ||||||
| U/W NCF DSCR: | 1.57x | |||||||
| Type: | Initial | Monthly | Cap (If Any) | U/W NOI Debt Yield: | 10.2% | |||
| Taxes | $86,250 | $17,250 | NAP | U/W NCF Debt Yield: | 9.5% | |||
| Insurance | $34,115 | $2,708 | NAP | As-Is Appraised Value: | $37,950,000 | |||
| Replacement Reserves | $0 | $1,503 | NAP | As-Is Appraisal Valuation Date: | November 25, 2014 | |||
| TI/LC Reserve | $0 | $4,007 | NAP | Cut-off Date LTV Ratio: | 58.0% | |||
| LTV Ratio at Maturity or ARD: | 50.7% | |||||||
| (1) | Alliant Techsystems, Inc. lease commenced on January 1, 2014. |
| Sources | Uses | |||||||||
| Original loan amount | $22,000,000 | 100.0 | % | Loan payoff | $10,067,317 | 45.8 | % | |||
| Closing costs | 75,814 | 0.3 | ||||||||
| Reserves | 120,365 | 0.5 | ||||||||
| Return of equity | 11,736,504 | 53.3 | ||||||||
| Total Sources | $22,000,000 | 100.0 | % | Total Uses | $22,000,000 | 100.0 | % |
ORBITAL ATK OFFICE |
| Tenant Name | Credit Rating (Fitch/Moody’s/ S&P) | Tenant NRSF | % of NRSF | Annual U/W Base Rent PSF(1) | Annual U/W Base Rent(1) | % of Total Annual U/W Base Rent | Lease Expiration Date | |||||||
| Major Tenants | ||||||||||||||
| Occupied Collateral Total | 120,200 | 100.0% | ||||||||||||
| (1) | Annual U/W Base Rent PSF and Annual U/W Base Rent include contractual rent steps through February 1, 2016; current rental rate is $24.27 per square foot. |
| (2) | Alliant Techsystems, Inc. has a one-time option to terminate its lease as of December 31, 2020 with a minimum of 12-months advance notice and a termination payment of $5,091,655 ($42.36 per square foot). Alliant Techsystems, Inc. has two, five-year renewal options. |
Year Ending December 31, | No. of Leases Expiring | Expiring NRSF | % of Total NRSF | Cumulative Expiring NRSF | Cumulative % of Total NRSF | Annual U/W Base Rent | Annual U/W Base Rent PSF | ||||||||||||||
| MTM | |||||||||||||||||||||
| 2015 | 0.0% | $0 | |||||||||||||||||||
| 2016 | 0 | 0.0% | $0 | ||||||||||||||||||
| 2017 | 0 | 0.0% | $0 | ||||||||||||||||||
| 2018 | 0.0% | $0 | |||||||||||||||||||
| 2019 | 0.0% | $0 | |||||||||||||||||||
| 2020 | 0.0% | $0 | |||||||||||||||||||
| 2021 | 0 | 0.0% | $0 | ||||||||||||||||||
| 2022 | 0 | 0.0% | $0 | ||||||||||||||||||
| 2023 | 0 | 0 | 0.0% | $0 | |||||||||||||||||
| 2024 | 1 | 120,200 | 100.0% | $3,029,880 | |||||||||||||||||
| 2025 | 0.0% | $0 | |||||||||||||||||||
| Thereafter | |||||||||||||||||||||
| Vacant | 0 | 0.0% | $0 | $0.00 | |||||||||||||||||
| Total/Weighted Average | 100.0% | ||||||||||||||||||||
| (1) | Information obtained from the underwritten rent roll. |
| (2) | The sole tenant has a lease termination option that is exercisable prior to the stated expiration date of the subject lease (as described above in footnote (2) to the Major Tenants table) and that is not considered in the Lease Expiration Schedule. |
12/31/2012 | 12/31/2013 | 12/31/2014(1)(2) | 3/1/2015(3) | |||
| NAV | NAV | 100.0% | 100.0% |
| (1) | Information obtained from the borrower. |
| (2) | Alliant Techsystems, Inc., lease started on January 1, 2014. |
| (3) | Information obtained from underwritten rent roll. |
ORBITAL ATK OFFICE |
Annualized T-11 11/30/2014 | U/W | % of U/W Effective Gross Income | U/W $ per SF | |||||||
| Base Rent | $2,855,952 | $3,029,880 | 107.6 | % | $25.21 | |||||
| Grossed Up Vacant Space | 0 | 0 | 0.0 | 0.00 | ||||||
| Total Reimbursables | 0 | 1.1 | ||||||||
| Other Income | 0 | 0 | 0.0 | 0.00 | ||||||
| Less Vacancy & Credit Loss | 0 | (244,814)(1) | (8.7 | ) | (2.04) | |||||
| Effective Gross Income | $2,855,952 | $2,815,365 | 100.0 | % | $23.42 | |||||
| Total Operating Expenses | $188,450 | $572,307 | 20.3 | % | $4.76 | |||||
| Net Operating Income | $2,667,502 | $2,243,057 | 79.7 | % | $18.66 | |||||
| TI/LC | 0 | 4.5 | 1.07 | |||||||
| Capital Expenditures | 0 | 18,030 | 0.6 | 0.15 | ||||||
| Net Cash Flow | $2,667,502 | $2,096,951 | 74.5 | % | $17.45 | |||||
| NOI DSCR | 1.99x | 1.68x | ||||||||
| NCF DSCR | 1.99x | 1.57x | ||||||||
| NOI DY | 12.1% | 10.2% | ||||||||
| NCF DY | 12.1% | 9.5% | ||||||||
| (1) | The underwritten economic vacancy is 8.1%. The Orbital ATK Office Property was 100.0% physically occupied as of March 1, 2015. |
| No. 13 – Depot Park | |||||||
| Loan Information | Property Information | ||||||
| Mortgage Loan Seller: | Liberty Island Group I LLC | Single Asset/Portfolio: | Single Asset | ||||
Credit Assessment (DBRS/KBRA/Moody’s): | NR/NR/NR | Property Type: | Industrial | ||||
Original Principal Balance(1): | $21,600,000 | Specific Property Type: | Warehouse | ||||
Cut-off Date Principal Balance(1): | $21,600,000 | Location: | Sacramento, CA | ||||
| % of Initial Pool Balance: | 2.1% | Size: | 2,112,089 SF | ||||
| Loan Purpose: | Refinance | Cut-off Date Principal Balance Per SF(1): | $21.59 | ||||
| Borrower Name: | U.S. National Leasing LLC | Year Built/Renovated: | 1940/2000 | ||||
| Sponsor: | Richard W. Fischer | Title Vesting: | Fee | ||||
| Mortgage Rate: | 4.330% | Property Manager: | Self-managed | ||||
| Note Date: | November 24, 2014 | 3rd Most Recent Occupancy (As of): | 65.0% (12/31/2011) | ||||
| Anticipated Repayment Date: | NAP | 2nd Most Recent Occupancy (As of): | 61.5% (12/31/2012) | ||||
| Maturity Date: | December 1, 2024 | Most Recent Occupancy (As of): | 65.8% (12/31/2013) | ||||
| IO Period: | 120 months | Current Occupancy (As of): | 67.7% (10/21/2014) | ||||
| Loan Term (Original): | 120 months | ||||||
| Seasoning: | 3 months | Underwriting and Financial Information: | |||||
| Amortization Term (Original): | None | ||||||
| Loan Amortization Type: | Interest-only, Balloon | 3rd Most Recent NOI (As of): | $5,379,102 (12/31/2012) | ||||
| Interest Accrual Method: | Actual/360 | 2nd Most Recent NOI (As of)(3): | $5,659,563 (12/31/2013) | ||||
| Call Protection: | L(28),GRTR 1% or YM(88),O(4) | Most Recent NOI (As of)(3): | $6,485,650 (TTM 6/30/2014) | ||||
| Lockbox Type: | Springing (Without Established Account) | ||||||
Additional Debt(1): | Yes | ||||||
Additional Debt Type(1): | Pari Passu | U/W Revenues: | $10,943,007 | ||||
| U/W Expenses: | $5,122,652 | ||||||
U/W NOI(3): | $5,820,354 | ||||||
| U/W NCF: | $4,989,050 | ||||||
Escrows and Reserves: | U/W NOI DSCR(1): | 2.91x | |||||
U/W NCF DSCR(1): | 2.49x | ||||||
Type: | Initial | Monthly | Cap (If Any) | U/W NOI Debt Yield(1): | 12.8% | ||
| Taxes | $31,132 | $31,132 | NAP | U/W NCF Debt Yield(1): | 10.9% | ||
| Insurance | $148,294 | $18,537 | NAP | As-Is Appraised Value: | $76,000,000 | ||
| Replacement Reserves | $17,610 | $17,610 | $900,000 | As-Is Appraisal Valuation Date: | July 14, 2014 | ||
TI/LC Reserve(2) | $0 | Springing | $1,568,000 | Cut-off Date LTV Ratio(1): | 60.0% | ||
LTV Ratio at Maturity or ARD(1): | 60.0% | ||||||
| (1) | The Depot Park Loan Combination, totaling $45,600,000, is comprised of two pari passu notes (Notes A-1 and A-2). The non-controlling Note A-2 had an original principal balance of $21,600,000, has an outstanding principal balance of $21,600,000 as of the Cut-off Date and will be contributed to the WFCM 2015-C27 Trust. The controlling Note A-1 had an original principal balance of $24,000,000 and was contributed to the WFCM 2015-LC18 Trust. All statistical information related to balances per square foot, loan-to-value, debt service coverage ratios and debt yield are based on the Depot Park Loan Combination. |
| (2) | TI/LC reserves in the amount of $58,000 per month with a cap of $1,568,000 will commence if the debt service coverage ratio falls below 1.62x for the two prior consecutive quarters. |
| (3) | See “Cash Flow Analysis” section. |
DEPOT PARK |
| Sources | Uses | |||||||||
| Original loan amount | $45,600,000 | 100.0 | % | Loan payoff | $35,489,566 | 77.8 | % | |||
| Reserves | 197,036 | 0.4 | ||||||||
Other uses(1) | 9,069,237 | 19.9 | ||||||||
| Closing costs | 700,376 | 1.5 | ||||||||
| Return of equity | 143,785 | 0.3 | ||||||||
| Total Sources | $45,600,000 | 100.0 | % | Total Uses | $45,600,000 | 100.0 | % |
| (1) | Prior to the origination of the Depot Park Loan Combination, the Depot Park Property operated on a ground lease. At loan closing, the borrower purchased the land and collapsed the ground lease for approximately $7.2 million and additional fees. |
| Tenant Name | Credit Rating (Fitch/Moody’s/ S&P)(1) | Tenant NRSF | % of NRSF | Annual U/W Base Rent PSF | Annual U/W Base Rent | % of Total Annual U/W Base Rent | Lease Expiration Date | |||||||||
| Major Tenants | ||||||||||||||||
| Department of Corrections | NR/NR/NR | 196,020 | 9.3% | $7.21(2) | $1,412,415(2) | 16.6 | % | Various(3) | ||||||||
| DMV – State of California | A/Aa3/A+ | 54,450 | 2.6% | $17.46 | $950,892 | 11.2 | % | 3/31/2017(4) | ||||||||
| Swinerton Builders | NR/NR/NR | 25,019 | 1.2% | $16.49 | $412,563 | 4.9 | % | 11/30/2022(5) | ||||||||
| Ferguson Enterprises | NR/NR/NR | 87,120 | 4.1% | $4.49 | $390,912 | 4.6 | % | 7/31/2020 | ||||||||
| Big Bear Fireworks Inc. | NR/NR/NR | 97,620 | 4.6% | $3.69 | $360,216 | 4.2 | % | 9/30/2015(6) | ||||||||
| Airco Mechanical Inc. | NR/NR/NR | 86,944 | 4.1% | $3.50 | $303,936 | 3.6 | % | 5/31/2027 | ||||||||
| Total Services Logistics | NR/NR/NR | 81,675 | 3.9% | $3.39 | $276,948 | 3.3 | % | 1/31/2015 | ||||||||
| Total Major Tenants | 628,848 | 29.8% | $6.53 | $4,107,881 | 48.3 | % | ||||||||||
| Non-Major Tenants | 801,539 | 37.9% | $5.48 | 4,392,285 | 51.7 | % | ||||||||||
| Occupied Collateral Total | 1,430,387 | 67.7% | $5.94 | $8,500,166 | 100.0 | % | ||||||||||
| Vacant Space | 681,702 | 32.3% | ||||||||||||||
| �� | ||||||||||||||||
| Collateral Total | 2,112,089 | 100.0% | ||||||||||||||
| (1) | Certain ratings are those of the parent company whether or not the parent company guarantees the lease. |
| (2) | Department of Corrections pays $7.54 per square foot gross on 152,460 square feet (7.2% of net rentable area) under one lease and $6.02 per square foot gross on 43,560 square feet (2.1% of net rentable area) under a second lease. |
| (3) | Department of Corrections may terminate its leases at any time on or after January 31, 2016 and March 31, 2016, respectively, with written notice to the landlord at least 30 days prior to the termination date. Department of Corrections leases expire on January 31, 2020 (152,460 square feet) and March 31, 2020 (43,560 square feet). |
| (4) | DMV – State of California may terminate its lease at any time after March 31, 2013 with written notice to the landlord at least 30 days prior to the termination date. |
| (5) | Swinerton Builders may terminate its lease on December 1, 2017 with written notice to the landlord at least 120 days prior to the termination date. |
| (6) | If the City of Sacramento prohibits the use of the premises for general office, storage, warehousing, sales and distribution of Class C 1.4G consumer fireworks and other legal and related uses, Big Bear Fireworks Inc. may terminate its lease with 90 days prior written notice to the landlord. |
DEPOT PARK |
Year Ending December 31, | No. of Leases Expiring | Expiring NRSF | % of Total NRSF | Cumulative Expiring NRSF | Cumulative % of Total NRSF | Annual U/W Base Rent | Annual U/W Base Rent PSF(3) | ||||||||
| MTM | 19 | 149,302 | 7.1% | 149,302 | 7.1% | $691,308 | $4.63 | ||||||||
| 2015 | 31 | 326,717 | 15.5% | 476,019 | 22.5% | $1,373,964 | $4.21 | ||||||||
| 2016 | 12 | 159,984 | 7.6% | 636,003 | 30.1% | $1,323,012 | $8.27 | ||||||||
| 2017 | 9 | 189,628 | 9.0% | 825,631 | 39.1% | $1,640,000 | $8.65 | ||||||||
| 2018 | 1 | 43,560 | 2.1% | 869,191 | 41.2% | $123,000 | $2.82 | ||||||||
| 2019 | 4 | 17,295 | 0.8% | 886,486 | 42.0% | $177,126 | $10.24 | ||||||||
| 2020 | 4 | 370,260 | 17.5% | 1,256,746 | 59.5% | $2,025,879 | $5.47 | ||||||||
| 2021 | 1 | 8,000 | 0.4% | 1,264,746 | 59.9% | $119,708 | $14.96 | ||||||||
| 2022 | 2 | 46,017 | 2.2% | 1,310,763 | 62.1% | $584,857 | $12.71 | ||||||||
| 2023 | 0 | 0 | 0.0% | 1,310,763 | 62.1% | $0 | $0.00 | ||||||||
| 2024 | 1 | 21,780 | 1.0% | 1,332,543 | 63.1% | $137,376 | $6.31 | ||||||||
| 2025 | 0 | 0 | 0.0% | 1,332,543 | 63.1% | $0 | $0.00 | ||||||||
| Thereafter | 2 | 97,844 | 4.6% | 1,430,387 | 67.7% | $303,936 | $3.11 | ||||||||
| Vacant | 0 | 681,702 | 32.3% | 2,112,089 | 100.0% | $0 | $0.00 | ||||||||
| Total/Weighted Average | 86 | 2,112,089 | 100.0% | $8,500,166 | $5.94 |
| (1) | Information obtained from the underwritten rent roll. |
(2) | Certain tenants may have lease termination options that are exercisable prior to the originally stated expiration date of the subject lease and that are not considered in the Lease Expiration Schedule. |
| (3) | Weighted Average Annual U/W Base Rent PSF excludes vacant space. |
12/31/2011(1) | 12/31/2012(1) | 12/31/2013(1) | 10/21/2014(2) | |||
| 65.0% | 61.5% | 65.8% | 67.7% |
| (1) | Information obtained from the borrower. |
| (2) | Information obtained from the underwritten rent roll. |
| 2012 | 2013 | TTM 6/30/2014 | U/W | % of U/W Effective Gross Income | U/W $ per SF | |||||||||
| Base Rent | $8,551,524 | $8,797,466 | $9,274,528 | $8,500,166 | 77.7 | % | $4.02 | |||||||
| Grossed Up Vacant Space | 0 | 0 | 0 | 3,344,581 | 30.6 | 1.58 | ||||||||
| Total Reimbursables | 1,808,943 | 1,753,651 | 1,914,221 | 1,913,589 | 17.5 | 0.91 | ||||||||
| Other Income | 0 | 0 | 0 | 529,251(3) | 4.8 | 0.25 | ||||||||
| Less Vacancy & Credit Loss | 0 | 0 | 0 | (3,344,581)(4) | 30.6 | (1.58) | ||||||||
| Effective Gross Income | $10,360,467 | $10,551,117 | $11,188,749 | $10,943,007 | 100.0 | % | $5.18 | |||||||
| Total Operating Expenses | $4,981,365 | $4,891,554 | $4,703,099 | $5,122,652 | 46.8 | % | $2.43 | |||||||
| Net Operating Income | $5,379,102 | $5,659,563(2) | $6,485,650(2) | $5,820,354(2) | 53.2 | % | $2.76 | |||||||
| TI/LC | 0 | 0 | 0 | 620,095 | 5.7 | 0.29 | ||||||||
| Reserves for Replacements | 0 | 0 | 0 | 211,209 | 1.9 | 0.10 | ||||||||
| Net Cash Flow | $5,379,102 | $5,659,563 | $6,485,650 | $4,989,050 | 45.6 | % | $2.36 | |||||||
NOI DSCR(1) | 2.69x | 2.83x | 3.24x | 2.91x | ||||||||||
NCF DSCR(1) | 2.69x | 2.83x | 3.24x | 2.49x | ||||||||||
NOI DY(1) | 11.8% | 12.4% | 14.2% | 12.8% | ||||||||||
NCF DY(1) | 11.8% | 12.4% | 14.2% | 10.9% | ||||||||||
| (1) | The debt service coverage ratios and debt yields are based on the Depot Park Loan Combination. |
| (2) | The increase of 2013 NOI to TTM 6/30/2014 NOI is primarily due to leasing activity. Tenants occupying approximately 52,072 square feet of newly leased space commenced rent payments during the first six months of 2014. Additionally, the decrease in U/W NOI from the TTM 6/30/2014 NOI is due primarily to expiring tenant leases in 2014 and the rent associated with those expiring leases being excluded from the underwriting. |
| (3) | Other Income is comprised of yard rental income. Historically yard rental income in included in the base rent on the borrower’s operating statement. |
| (4) | The underwritten economic vacancy is 23.4%. The Depot Park Property was 67.7% physically occupied as of October 21, 2014. |
| No. 14 – Residence Inn Charlotte Southpark |
| Loan Information | Property Information | ||||||
| Mortgage Loan Seller: | Wells Fargo Bank, National Association | Single Asset/Portfolio: | Single Asset | ||||
Credit Assessment (DBRS/KBRA/Moody’s): | NR/NR/NR | Property Type: | Hospitality | ||||
| Original Principal Balance: | $20,560,000 | Specific Property Type: | Limited Service | ||||
| Cut-off Date Principal Balance: | $20,560,000 | Location: | Charlotte, NC | ||||
| % of Initial Pool Balance: | 2.0% | Size: | 152 Rooms | ||||
| Loan Purpose: | Acquisition | Cut-off Date Principal Balance Per Room: | $135,263 | ||||
| Borrower Name: | NF II/CI Charlotte, LLC | Year Built/Renovated: | 2001/NAP | ||||
| Sponsor: | Noble Hospitality Fund II, L.P. | Title Vesting: | Fee | ||||
| Mortgage Rate: | 4.350% | Property Manager: | McKibbon Hotel Management, Inc. | ||||
| Note Date: | December 4, 2014 | 3rd Most Recent Occupancy (As of)(4): | 82.5% (12/31/2011) | ||||
| Anticipated Repayment Date: | NAP | 2nd Most Recent Occupancy (As of)(4): | 86.0% (12/31/2012) | ||||
| Maturity Date: | December 11, 2024 | Most Recent Occupancy (As of)(4): | 77.3% (12/31/2013) | ||||
| IO Period: | 36 months | Current Occupancy (As of)(4): | 74.3% (TTM 10/31/2014) | ||||
| Loan Term (Original): | 120 months | ||||||
| Seasoning: | 3 months | Underwriting and Financial Information: | |||||
| Amortization Term (Original): | 360 months | ||||||
| Loan Amortization Type: | Interest-only, Amortizing Balloon | 3rd Most Recent NOI (As of)(4): | $2,588,055 (12/31/2012) | ||||
| Interest Accrual Method: | Actual/360 | 2nd Most Recent NOI (As of)(4): | $2,596,588 (12/31/2013) | ||||
| Call Protection: | L(23), GRTR 1% or YM(93),O(4) | Most Recent NOI (As of)(4): | $2,572,095 (10/31/2014) | ||||
| Lockbox Type: | Springing (Without Established Account) | ||||||
| Additional Debt: | None | ||||||
| Additional Debt Type: | NAP | U/W Revenues: | $5,219,545 | ||||
| U/W Expenses: | $2,718,291 | ||||||
| U/W NOI: | $2,501,254 | ||||||
| U/W NCF: | $2,292,472 | ||||||
| U/W NOI DSCR: | 2.04x | ||||||
Escrows and Reserves: | U/W NCF DSCR: | 1.87x | |||||
| U/W NOI Debt Yield: | 12.2% | ||||||
Type: | Initial | Monthly | Cap (If Any) | U/W NCF Debt Yield: | 11.2% | ||
| Taxes | $49,020 | $12,256 | NAP | As-Stabilized Value(5): | $32,600,000 | ||
Insurance(1) | $0 | Springing | NAP | As-Stabilized Appraisal Valuation Date(5): | November 1, 2015 | ||
FF&E Reserve(2) | $0 | $18,076 | NAP | Cut-off Date LTV Ratio(5): | 63.1% | ||
PIP Reserve(3) | $907,000 | Springing | NAP | LTV Ratio at Maturity or ARD(5): | 55.0% | ||
| (1) | Ongoing monthly reserves for insurance are not required as long as (i) no event of default has occurred and is continuing; (ii) the Residence Inn Charlotte Southpark Property is covered by an acceptable blanket insurance policy; and (iii) the borrower provides the lender with evidence of renewal of the insurance policies and timely proof of payment of insurance premiums. |
| (2) | Lender may adjust the monthly FF&E deposit, upon no less than 10 days’ notice, to an amount equal to the greater of (i) $18,076 or (ii) one twelfth of 4.0% of operating income for the prior fiscal year. |
| (3) | An upfront PIP Reserve of $907,000 for the Residence Inn Charlotte Southpark Property was collected at closing for the remainder of the capital improvements required by the franchisor (“PIP Work”). In addition to this initial deposit, should any additional PIP Work be required by the franchisor, the borrower must deposit (within 15 days of receipt of notice from the franchisor) an amount equal to 110% of the estimated costs to complete such additional PIP Work, as reasonably determined by lender. |
| (4) | See “Cash Flow Analysis” section. |
| (5) | The appraiser concluded to an “as-is” appraised value of $29,900,000 as of November 1, 2014. The Cut-off Date LTV Ratio based on the “as-is” value is 68.8% and the LTV Ratio at Maturity is 60.0%. |
| RESIDENCE INN CHARLOTTE SOUTHPARK |
| Sources | Uses | ||||||||
| Original loan amount | $20,560,000 | 70.2% | Purchase price(1) | $26,469,000 | 90.3% | ||||
| Sponsor’s new cash contribution | 8,738,772 | 29.8 | Reserves | 956,020 | 3.3 | ||||
| Closing costs | 1,873,752 | 6.4 | |||||||
| Total Sources | $29,298,772 | 100.0% | Total Uses | $29,298,772 | 100.0% |
| (1) | The Residence Inn Charlotte Southpark Property was acquired by Noble Investment Group in conjunction with eight other hotel properties, of which five are expected to be securitized in the WFCM 2015-C27 Trust: Residence Inn Charlotte Southpark ($20,560,000), Courtyard Fort Myers ($15,779,000), Residence Inn Little Rock Downtown ($14,447,000), Courtyard Tampa Downtown ($14,387,000), and Hampton Inn & Suites Knoxville ($9,884,000). The other three hotels were included in the WFCM 2015-C26 Trust. |
Competitive Set | Residence Inn Charlotte Southpark | Penetration Factor | ||||||||||||||||
Year | Occupancy | ADR | RevPAR | Occupancy | ADR | RevPAR | Occupancy | ADR | RevPAR | |||||||||
| 09/30/2014 TTM | 78.4% | $132.88 | $104.12 | 74.3% | $123.18 | $91.57 | 94.9% | 92.7% | 87.9% | |||||||||
| 09/30/2013 TTM | 75.4% | $126.83 | $95.64 | 80.0% | $114.66 | $91.69 | 106.0% | 90.4% | 95.9% | |||||||||
| 09/30/2012 TTM | 76.0% | $118.61 | $90.20 | 87.1% | $105.82 | $92.16 | 114.5% | 89.2% | 102.2% | |||||||||
| (1) | Information obtained from a third party hospitality report dated October 18, 2014. The competitive set includes: Residence Inn Charlotte South I77 at Tyvola Road, Doubletree Guest Suites Charlotte Southpark, Courtyard Charlotte South Park, and Hampton Inn Suites Charlotte South Park at Phillips Place. |
| 2012 | 2013 | TTM 10/31/2014 | U/W | % of U/W Total Revenue | U/W $ per Room | ||||||||
| Occupancy | 86.0% | 77.3% | 74.3% | 74.3% | |||||||||
| ADR | $107.52 | $118.46 | $123.27 | $123.27 | |||||||||
| RevPAR | $92.47 | $91.53 | $91.54 | $91.54 | |||||||||
| Total Revenue | $5,259,437 | $5,204,374 | $5,219,545 | $5,219,545 | 100.0% | $34,339 | |||||||
| Total Department Expenses | 967,337 | 928,935 | 957,038 | 957,038 | 18.3% | $6,296 | |||||||
| Gross Operating Profit | $4,292,100 | $4,275,439 | $4,262,507 | $4,262,507 | 81.7% | $28,043 | |||||||
| Total Undistributed Expenses | 1,508,865 | 1,479,292 | 1,493,626 | 1,564,467 | 30.0% | $10,293 | |||||||
| Profit Before Fixed Charges | $2,783,235 | $2,796,147 | $2,768,881 | $2,698,040 | 51.7% | $17,750 | |||||||
| Total Fixed Charges | 195,180 | 199,559 | 196,786 | 196,786 | 3.8% | $1,295 | |||||||
| Net Operating Income | $2,588,055 | $2,596,588 | $2,572,095 | $2,501,254 | 47.9% | $16,456 | |||||||
| FF&E | 0 | 0 | 0 | 208,782 | 4.0% | $1,374 | |||||||
| Net Cash Flow | $2,588,055 | $2,596,588 | $2,572,095 | $2,292,472 | 43.9% | $15,082 | |||||||
| NOI DSCR | 2.11x | 2.11x | 2.09x | 2.04x | |||||||||
| NCF DSCR | 2.11x | 2.11x | 2.09x | 1.87x | |||||||||
| NOI DY | 12.6% | 12.6% | 12.5% | 12.2% | |||||||||
| NCF DY | 12.6% | 12.6% | 12.5% | 11.2% | |||||||||
| No. 15 – 212 South Tryon |
| Loan Information | Property Information | ||||||
| Mortgage Loan Seller: | Principal Commercial Capital | Single Asset/Portfolio: | Single Asset | ||||
Credit Assessment (DBRS/KBRA/Moody’s): | NR/NR/NR | Property Type: | Office | ||||
| Original Principal Balance: | $19,773,000 | Specific Property Type: | CBD | ||||
| Cut-off Date Principal Balance: | $19,773,000 | Location: | Charlotte, NC | ||||
| % of Initial Pool Balance: | 1.9% | Size: | 172,382 SF | ||||
| Loan Purpose: | Acquisition | Cut-off Date Principal Balance Per SF: | $114.70 | ||||
| Borrower Name: | TDC Johnston, LLC | Year Built/Renovated: | 1924/2004 | ||||
| Sponsor: | Anthony H. Dilweg | Title Vesting: | Fee | ||||
| Mortgage Rate: | 4.240% | Property Manager: | Trinity Partners, LLC | ||||
| Note Date: | February 2, 2015 | 3rd Most Recent Occupancy (As of): | 86.0% (12/31/2012) | ||||
| Anticipated Repayment Date: | NAP | 2nd Most Recent Occupancy (As of): | 82.8% (12/31/2013) | ||||
| Maturity Date: | March 1, 2025 | Most Recent Occupancy (As of): | 83.5% (12/30/2014) | ||||
| IO Period: | 60 months | Current Occupancy (As of): | 84.3% (2/2/2015) | ||||
| Loan Term (Original): | 120 months | ||||||
| Seasoning: | 0 months | Underwriting and Financial Information: | |||||
| Amortization Term (Original): | 360 months | ||||||
| Loan Amortization Type: | Interest-only, Amortizing Balloon | 3rd Most Recent NOI (As of): | $1,577,910 (12/31/2012) | ||||
| Interest Accrual Method: | Actual/360 | 2nd Most Recent NOI (As of): | $1,519,613 (12/31/2013) | ||||
| Call Protection: | L(24),D(92),O(4) | Most Recent NOI (As of): | $1,487,676 (12/31/2014) | ||||
| Lockbox Type: | Springing(Without Established Account) | ||||||
| Additional Debt: | None | ||||||
| Additional Debt Type: | NAP | U/W Revenues: | $3,049,679 | ||||
| U/W Expenses: | $1,283,504 | ||||||
U/W NOI(2): | $1,766,175 | ||||||
| U/W NCF: | $1,554,145 | ||||||
Escrows and Reserves: | U/W NOI DSCR: | 1.51x | |||||
| U/W NCF DSCR: | 1.33x | ||||||
| Type: | Initial | Monthly | Cap (If Any) | U/W NOI Debt Yield: | 8.9% | ||
| Taxes | $51,375 | $17,125 | NAP | U/W NCF Debt Yield: | 7.9% | ||
Insurance(1) | $0 | Springing | NAP | As-Is Appraised Value: | $28,270,000 | ||
| Replacement Reserves | $0 | $3,304 | NAP | As-Is Appraisal Valuation Date: | December 23, 2014 | ||
| TI/LC Reserve | $15,000 | $14,385 | $517,863 | Cut-Off Date LTV Ratio: | 69.9% | ||
| Rent Abatement Reserve | $48,019 | $0 | NAP | LTV Ratio at Maturity or ARD: | 63.7% | ||
| (1) | Ongoing monthly reserves for insurance are not required as long as (i) no event of default has occurred and is continuing; (ii) the 212 South Tryon Office Property is covered by an acceptable blanket insurance policy; and (iii) the borrower provides the lender with evidence of renewal of insurance policies and timely proof of payment of insurance premiums. |
| (2) | See “Cash Flow Analysis” section. |
| Sources | Uses | |||||||
| Original loan amount | $19,773,000 | 74.4% | Purchase price | $25,300,000 | 95.2% | |||
| Sponsor’s new cash contribution | $6,816,495 | 25.6% | Reserves | $114,393 | 0.4 | |||
Closing costs(1) | $1,175,102 | 4.4 | ||||||
| Total Sources | $26,589,495 | 100.0% | Total Uses | $26,589,495 | 100.0% |
| (1) | $904,738 of closing costs were paid to affiliates of the borrower. |
212 SOUTH TRYON |
| Tenant Name | Credit Rating (Fitch/ Moody’s/ S&P)(1) | Tenant NRSF | % of NRSF | Annual U/W Base Rent PSF(2) | Annual U/W Base Rent(2) | % of Total Annual U/W Base Rent | Lease Expiration Date | |||||||
| Major Tenants | ||||||||||||||
| Office of the Comptroller | AAA/Aaa/AA+ | 29,470 | 17.1% | $26.14 | $770,385 | 26.2% | Various(3) | |||||||
| Carlisle & Gallagher Consulting | NR/NR/NR | 20,130 | 11.7% | $19.56(4) | $393,711 | 13.4% | 10/31/2021 | |||||||
| Montreat College | NR/NR/NR | 14,692 | 8.5% | $17.23 | $253,143 | 8.6% | 7/31/2023 | |||||||
| Fifth Third Bank | NR/NR/NR | 6,764 | 3.9% | $24.00 | $162,336 | 5.5% | 3/30/2022 | |||||||
| Rudisil, White & Kaplan | NR/NR/NR | 6,322 | 3.7% | $19.32 | $122,141 | 4.1% | 2/28/2017 | |||||||
| Total Major Tenants | 77,378 | 44.9% | $21.99 | $1,701,716 | 57.8% | |||||||||
| Non-Major Tenants | 67,993 | 39.4% | $18.28 | $1,243,150 | 42.2% | |||||||||
| Occupied Collateral Total | 145,371 | 84.3% | $20.26 | $2,944,866 | 100.0% | |||||||||
| Vacant Space | 27,011 | 15.7% | ||||||||||||
| Collateral Total | 172,382 | 100.0% | ||||||||||||
| (1) | Certain ratings are those of the parent company (or in the case of the Office of the Comptroller, the United States Government) whether or not the parent guarantees the lease. |
| (2) | Annual U/W Base Rent PSF and Annual U/W Base Rent include contractual rent steps through October 2015. |
| (3) | 19,668 square feet expires on September 30, 2018 and 9,802 square feet expires on February 28, 2020. |
| (4) | Carlisle & Gallagher Consulting leases two spaces totaling 19,734 square feet at the subject property. Both leases have contract rents of $19.67 PSF and expire on October 31, 2021. In addition, Carlisle & Gallagher Consulting leases storage space on a month-to-month lease totaling 396 square feet with contract rents of $14.00 PSF. |
212 SOUTH TRYON |
Year Ending December 31, | No. of Leases Expiring | Expiring NRSF | % of Total NRSF | Cumulative Expiring NRSF | Cumulative % of Total NRSF | Annual U/W Base Rent | Annual U/W Base Rent PSF(3) | ||||||||
| MTM | 5 | 1,335 | 0.8% | 1,335 | 0.8% | $16,498 | $12.36 | ||||||||
| 2015 | 10 | 9,965 | 5.8% | 11,300 | 6.6% | $191,659 | $19.23 | ||||||||
| 2016 | 6 | 10,386 | 6.0% | 21,686 | 12.6% | $192,772 | $18.56 | ||||||||
| 2017 | 8 | 13,369 | 7.8% | 35,055 | 20.3% | $256,933 | $19.22 | ||||||||
| 2018 | 9 | 40,436 | 23.5% | 75,491 | 43.8% | $913,305 | $22.59 | ||||||||
| 2019 | 3 | 3,459 | 2.0% | 78,950 | 45.8% | $64,544 | $18.66 | ||||||||
| 2020 | 4 | 18,202 | 10.6% | 97,152 | 56.4% | $383,048 | $21.04 | ||||||||
| 2021 | 2 | 19,734 | 11.4% | 116,886 | 67.8% | $388,167 | $19.67 | ||||||||
| 2022 | 3 | 13,150 | 7.6% | 130,036 | 75.4% | $284,797 | $21.66 | ||||||||
| 2023 | 1 | 14,692 | 8.5% | 144,728 | 84.0% | $253,143 | $17.23 | ||||||||
| 2024 | 0 | 0 | 0.0% | 144,728 | 84.0% | $0 | $0.00 | ||||||||
| 2025 | 0 | 0 | 0.0% | 144,728 | 84.0% | $0 | $0.00 | ||||||||
| Thereafter | 1 | 643 | 0.4% | 145,371 | 84.3% | $0 | $0.00 | ||||||||
| Vacant | 0 | 27,011 | 15.7% | 172,382 | 100.00% | $0 | $0.00 | ||||||||
| Total/Weighted Average | 52 | 172,382 | 100.0% | $2,944,866 | $20.26 |
| (1) | Information was obtained from the underwritten rent roll. |
| (2) | Certain tenants may have lease termination options that are exercisable prior to the originally stated expiration date of the subject lease and that are not considered in the Lease Expiration Schedule. |
| (3) | Weighted Average Annual U/W Base Rent PSF excludes vacant space. |
12/31/2012(1) | 12/31/2013(1) | 12/31/2014(1) | 02/02/2015(2) | |||
| 86.0% | 82.8% | 83.5% | 84.3% |
| (1) | Information obtained from the borrower. |
| (2) | Information obtained from the underwritten rent roll. |
| 2012 | 2013 | 2014 | U/W | % of U/W Effective Gross Income | U/W $ per SF | |||||||||
| Base Rent | $2,636,283 | $2,796,989 | $2,722,639 | $2,944,866 | 96.6 | % | $17.08 | |||||||
| Grossed Up Vacant Space | 0 | 0 | 0 | 491,827 | 16.1 | 2.85 | ||||||||
| Total Reimbursables | 7,645 | 15,214 | 32,879 | 4,104 | 0.1 | 0.02 | ||||||||
| Other Income | 125,816 | 14,766 | 13,845 | 40,014 | 1.3 | 0.23 | ||||||||
| Less Vacancy & Credit Loss | 0 | 0 | 0 | (431,132)(1) | (14.1 | ) | (2.50) | |||||||
| Effective Gross Income | $2,769,744 | $2,826,969 | $2,769,363 | $3,049,679 | 100.0 | % | $17.69 | |||||||
| Total Operating Expenses | $1,191,834 | $1,307,356 | $1,281,687 | $1,283,504 | 42.1 | % | $7.45 | |||||||
| Net Operating Income | $1,577,910 | $1,519,613 | $1,487,676 | $1,766,175(2) | 57.9 | % | $10.25 | |||||||
| TI/LC | 0 | 0 | 0 | 172,382 | 5.7 | 1.00 | ||||||||
| Capital Expenditures | 0 | 0 | 0 | 39,648 | 1.3 | 0.23 | ||||||||
| Net Cash Flow | $1,577,910 | $1,519,613 | $1,487,676 | $1,554,145 | 51.0 | % | $9.02 | |||||||
| NOI DSCR | 1.35x | 1.30x | 1.28x | 1.51x | ||||||||||
| NCF DSCR | 1.35x | 1.30x | 1.28x | 1.33x | ||||||||||
| NOI DY | 8.0% | 7.7% | 7.5% | 8.9% | ||||||||||
| NCF DY | 8.0% | 7.7% | 7.5% | 7.9% | ||||||||||
| (1) | The underwritten economic vacancy is 12.5%. The 212 South Tryon Property was 84.3% physically occupied as of February 2, 2015. |
| (2) | The increase in U/W Net Operating Income from 2014 is primarily due to recent lease executions and inclusion of contractual tenant rent increases and expansion from 19 tenants totalng $46,096 through October 2015. |
Wells Fargo Commercial Mortgage Trust 2015-C27 | Transaction Contact Information |
| Wells Fargo Securities, LLC | |
| Brigid Mattingly | Tel. (312) 269-3062 |
| Fax (312) 658-0140 | |
| A.J. Sfarra | Tel. (212) 214-5613 |
| Fax (212) 214-8970 | |
| Alex Wong | Tel. (212) 214-5615 |
| Fax (212) 214-8970 |